1. Introduction
Waste management is an environmental, social and economic problem. Increasing consumption and the development of economic activities continue to generate large amounts of waste that require greater effort to reduce and prevent. In the past, waste was considered disposable and was disposed of in landfills. The current trends in waste management systems to replace removal with recycling and valorisation reflect the potential of waste as a resource rather than a problem. In 2012, the total amount of waste generated in the European Union (EU) by household activities amounted to 2514 million tons, of which 33% (821 million tons) was construction and demolition waste (CDW), which is the largest waste stream generated in the EU. During that same year, Spain generated a total waste of 119 million tons, of which 22% (26 million tons) was CDW [
1].
The construction sector contributes significantly to environmental degradation, and it must move towards sustainability. Construction in developed countries accounts for 40% of global energy consumption over the use-life of materials (raw materials, construction, operations and dismantling) [
2]. This results in a large contribution to greenhouse gas emissions, which contribute considerably to climate change [
3]. In addition, the construction industry is responsible for 50% of the depletion of natural resources [
4]. Therefore, reusing, recycling and revalorising CDW can conserve natural resources and reduce the volume of waste disposal in landfills.
The best practices for creating conditions that increase CDW recycling and improve the quality of recycling and recovery are being identified to present a set of recommendations to member states of the EU. It is necessary to address the potential barriers that maximise the generation of recycled aggregates (RA) from CDW. RA can be used in various civil engineering applications, such as in soil improvement projects and in the bases and subbases of roads. Additionally, CDW is used as a pipe bedding, backfilling and aggregate material for concrete and mortar.
Thus, RA are an excellent substitute for natural aggregate (NA) in civil engineering as unbound materials [
5,
6]. As many authors have shown [
7,
8,
9,
10,
11], the mechanical properties of RA do not limit their use as unbound materials in roads. They can be used as base, subbase or embankment material. To allow a higher load distribution capacity in pavements, the use of RA in cement-treated granular materials (CTGM) provides excellent performance compared to using traditional unbound materials [
12,
13,
14]. Additionally, RA can be used in recycled concrete [
15,
16,
17] and mortar [
18,
19].
Although RA research has considerably progressed, the Spanish structural concrete code [
20] only allows natural gravel to be replaced by recycled gravel, and RA can only be used in concrete (RCA). The code does not allow the use of mixed recycled aggregates (MRA) or ceramic recycled aggregates. Furthermore, recycled materials must meet the specifications of NA for the manufacturing of structural concrete. Not allowing the use of RA is a significant problem for CDW processing plants because most RA in Spain are MRA, representing over 80% of all CDW [
21].
The Spanish General Technical Specification for Road and Bridge Works (PG-3) [
22] using basic materials for pavements allows the use of RA, both MRA and RCA, as unbound materials, and CTGM can be used in structural layers and embankments. The use of MRA is vital in reducing landfill deposits. Experiments must be conducted to verify the performance of RA in the field. Jiménez et al. [
8] performed an experiment with non-selected MRA (surface and base layers) on NA (subbase) and a subgrade classified as A-6 in accordance with the American Association of State Highway and Transportation Officials (AASHTO) [
23]. Jiménez et al. [
9] also conducted experiments using selected MRA (surface and base layers) on NA (subbase) and a subgrade classified as A-1-B in accordance with AASHTO. In both cases, the behaviour of the RA was similar to the behaviour of NA, and they found no significant differences between them.
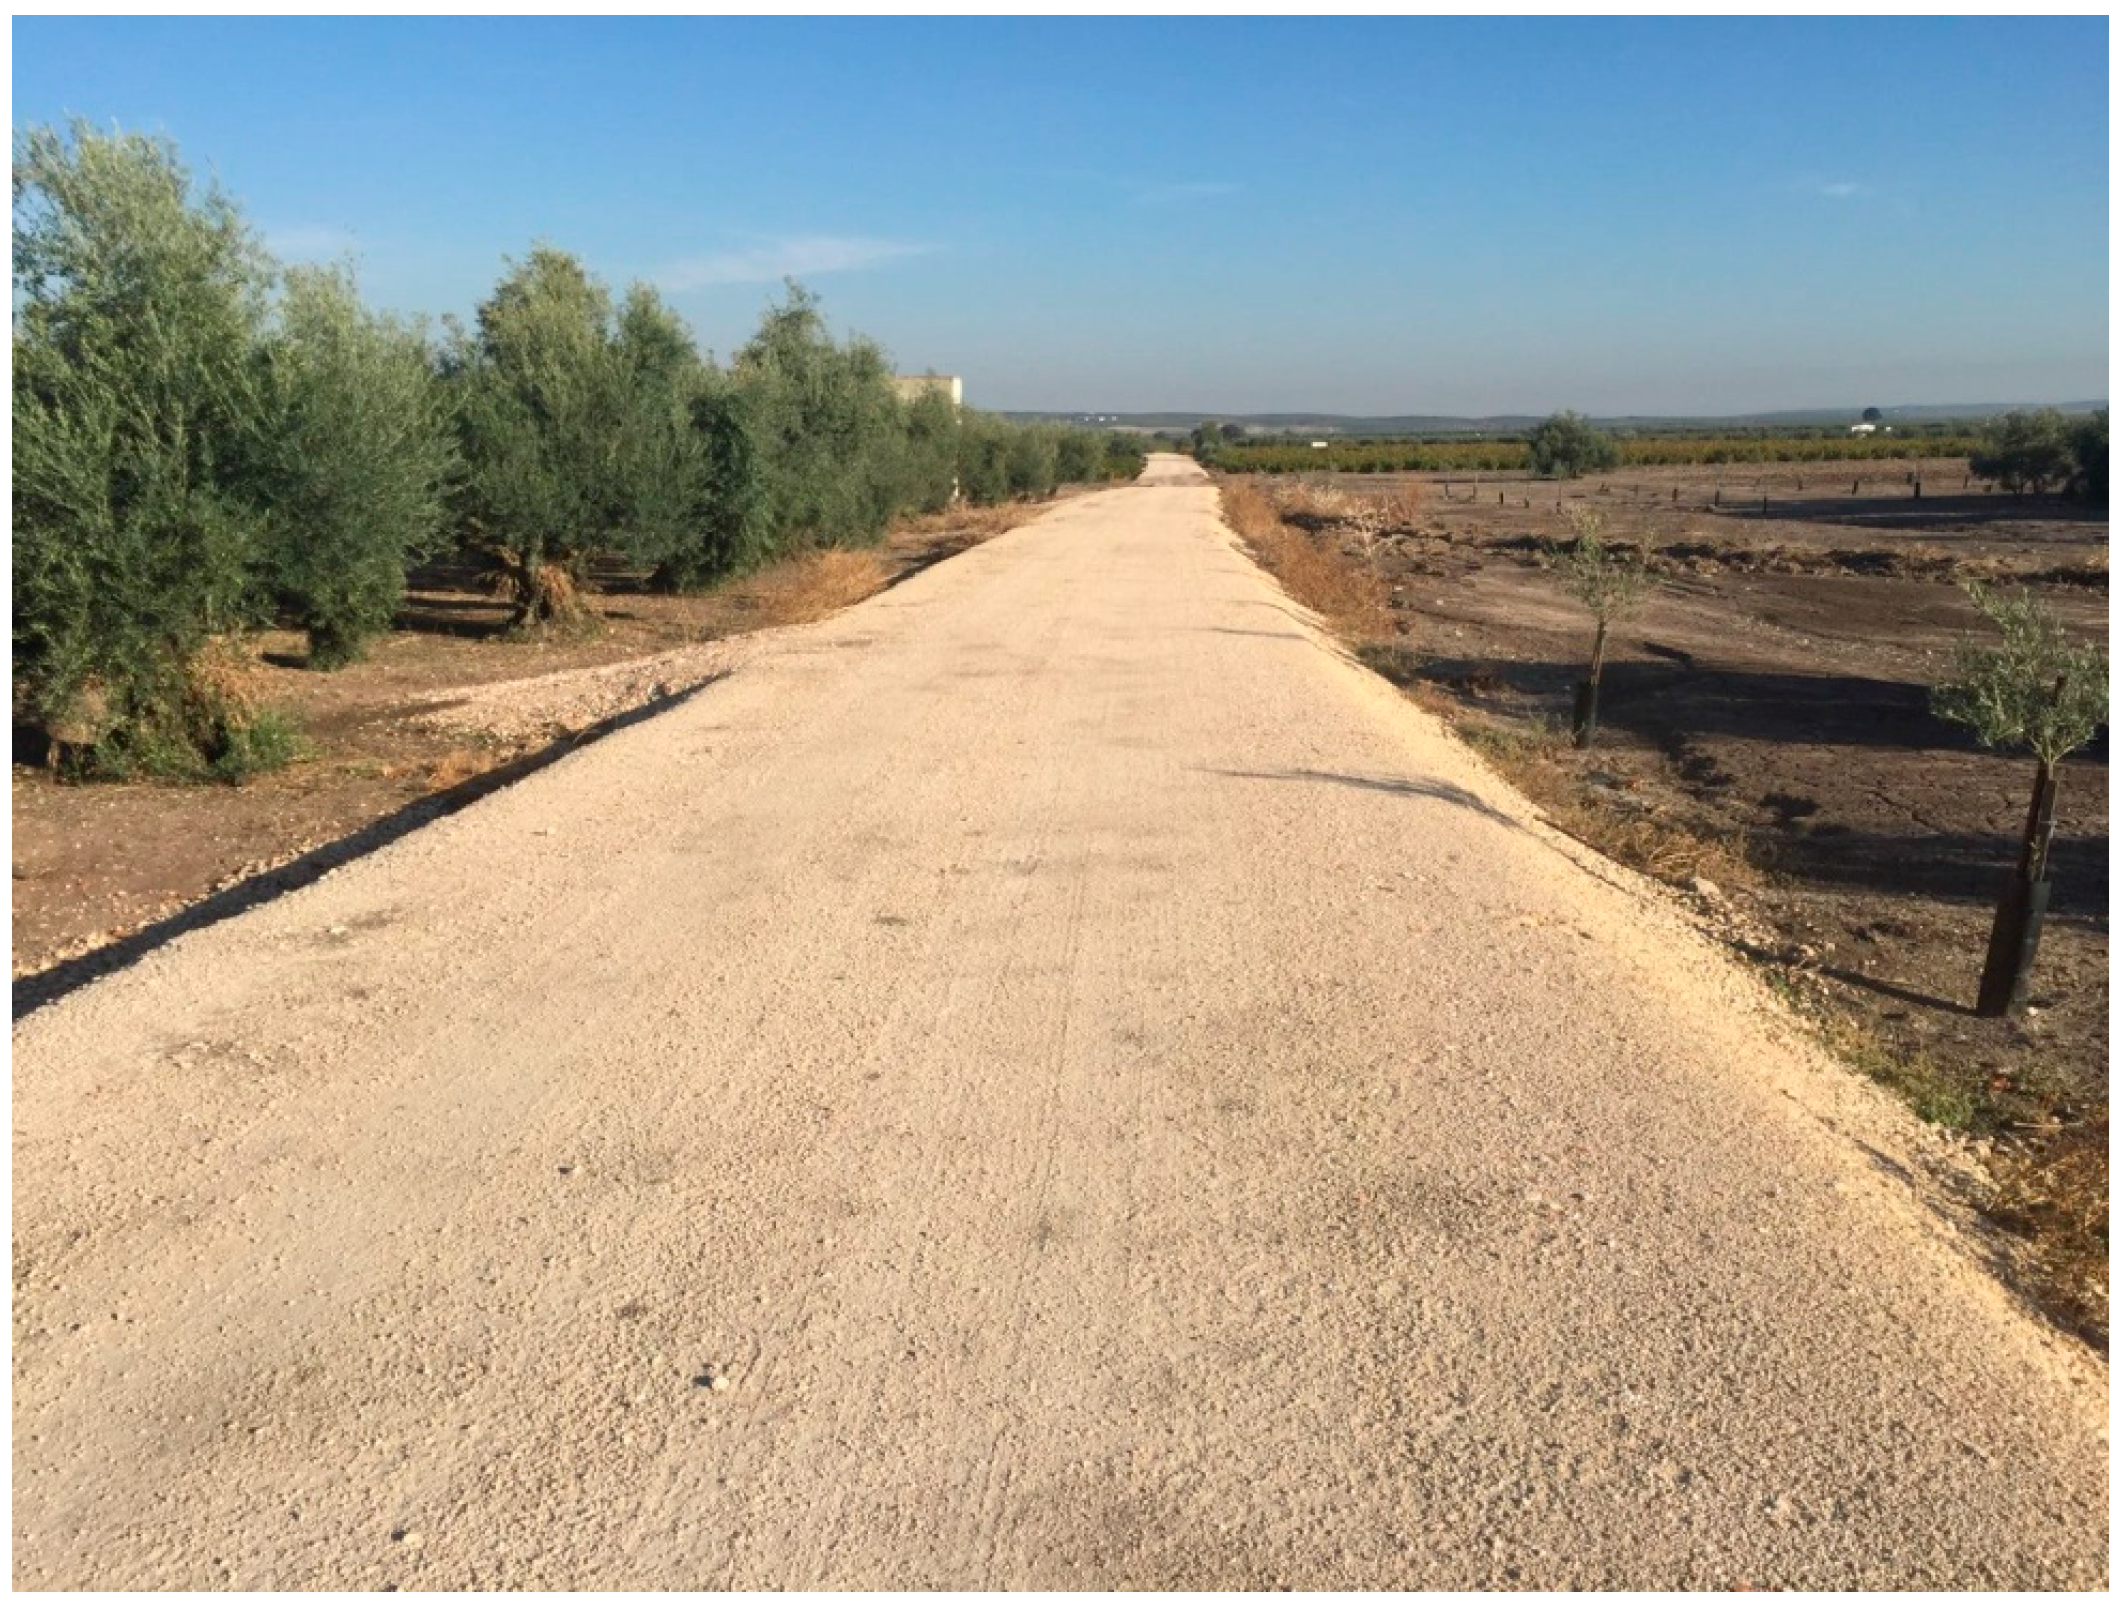
The experimental road used in these studies is located in southern Spain (Andalusia). This rural area has abundant clay soils with high water-holding capacity, making them suitable for agriculture. Nevertheless, these clays are expansive and cause numerous structural failures in pavements [
24].
Studies of the behaviour of recycled materials on expansive clay subgrades (inappropriate soil) have not been performed. Therefore, the response of RA over subgrades with high swelling capacity and low bearing capacity must be investigated.
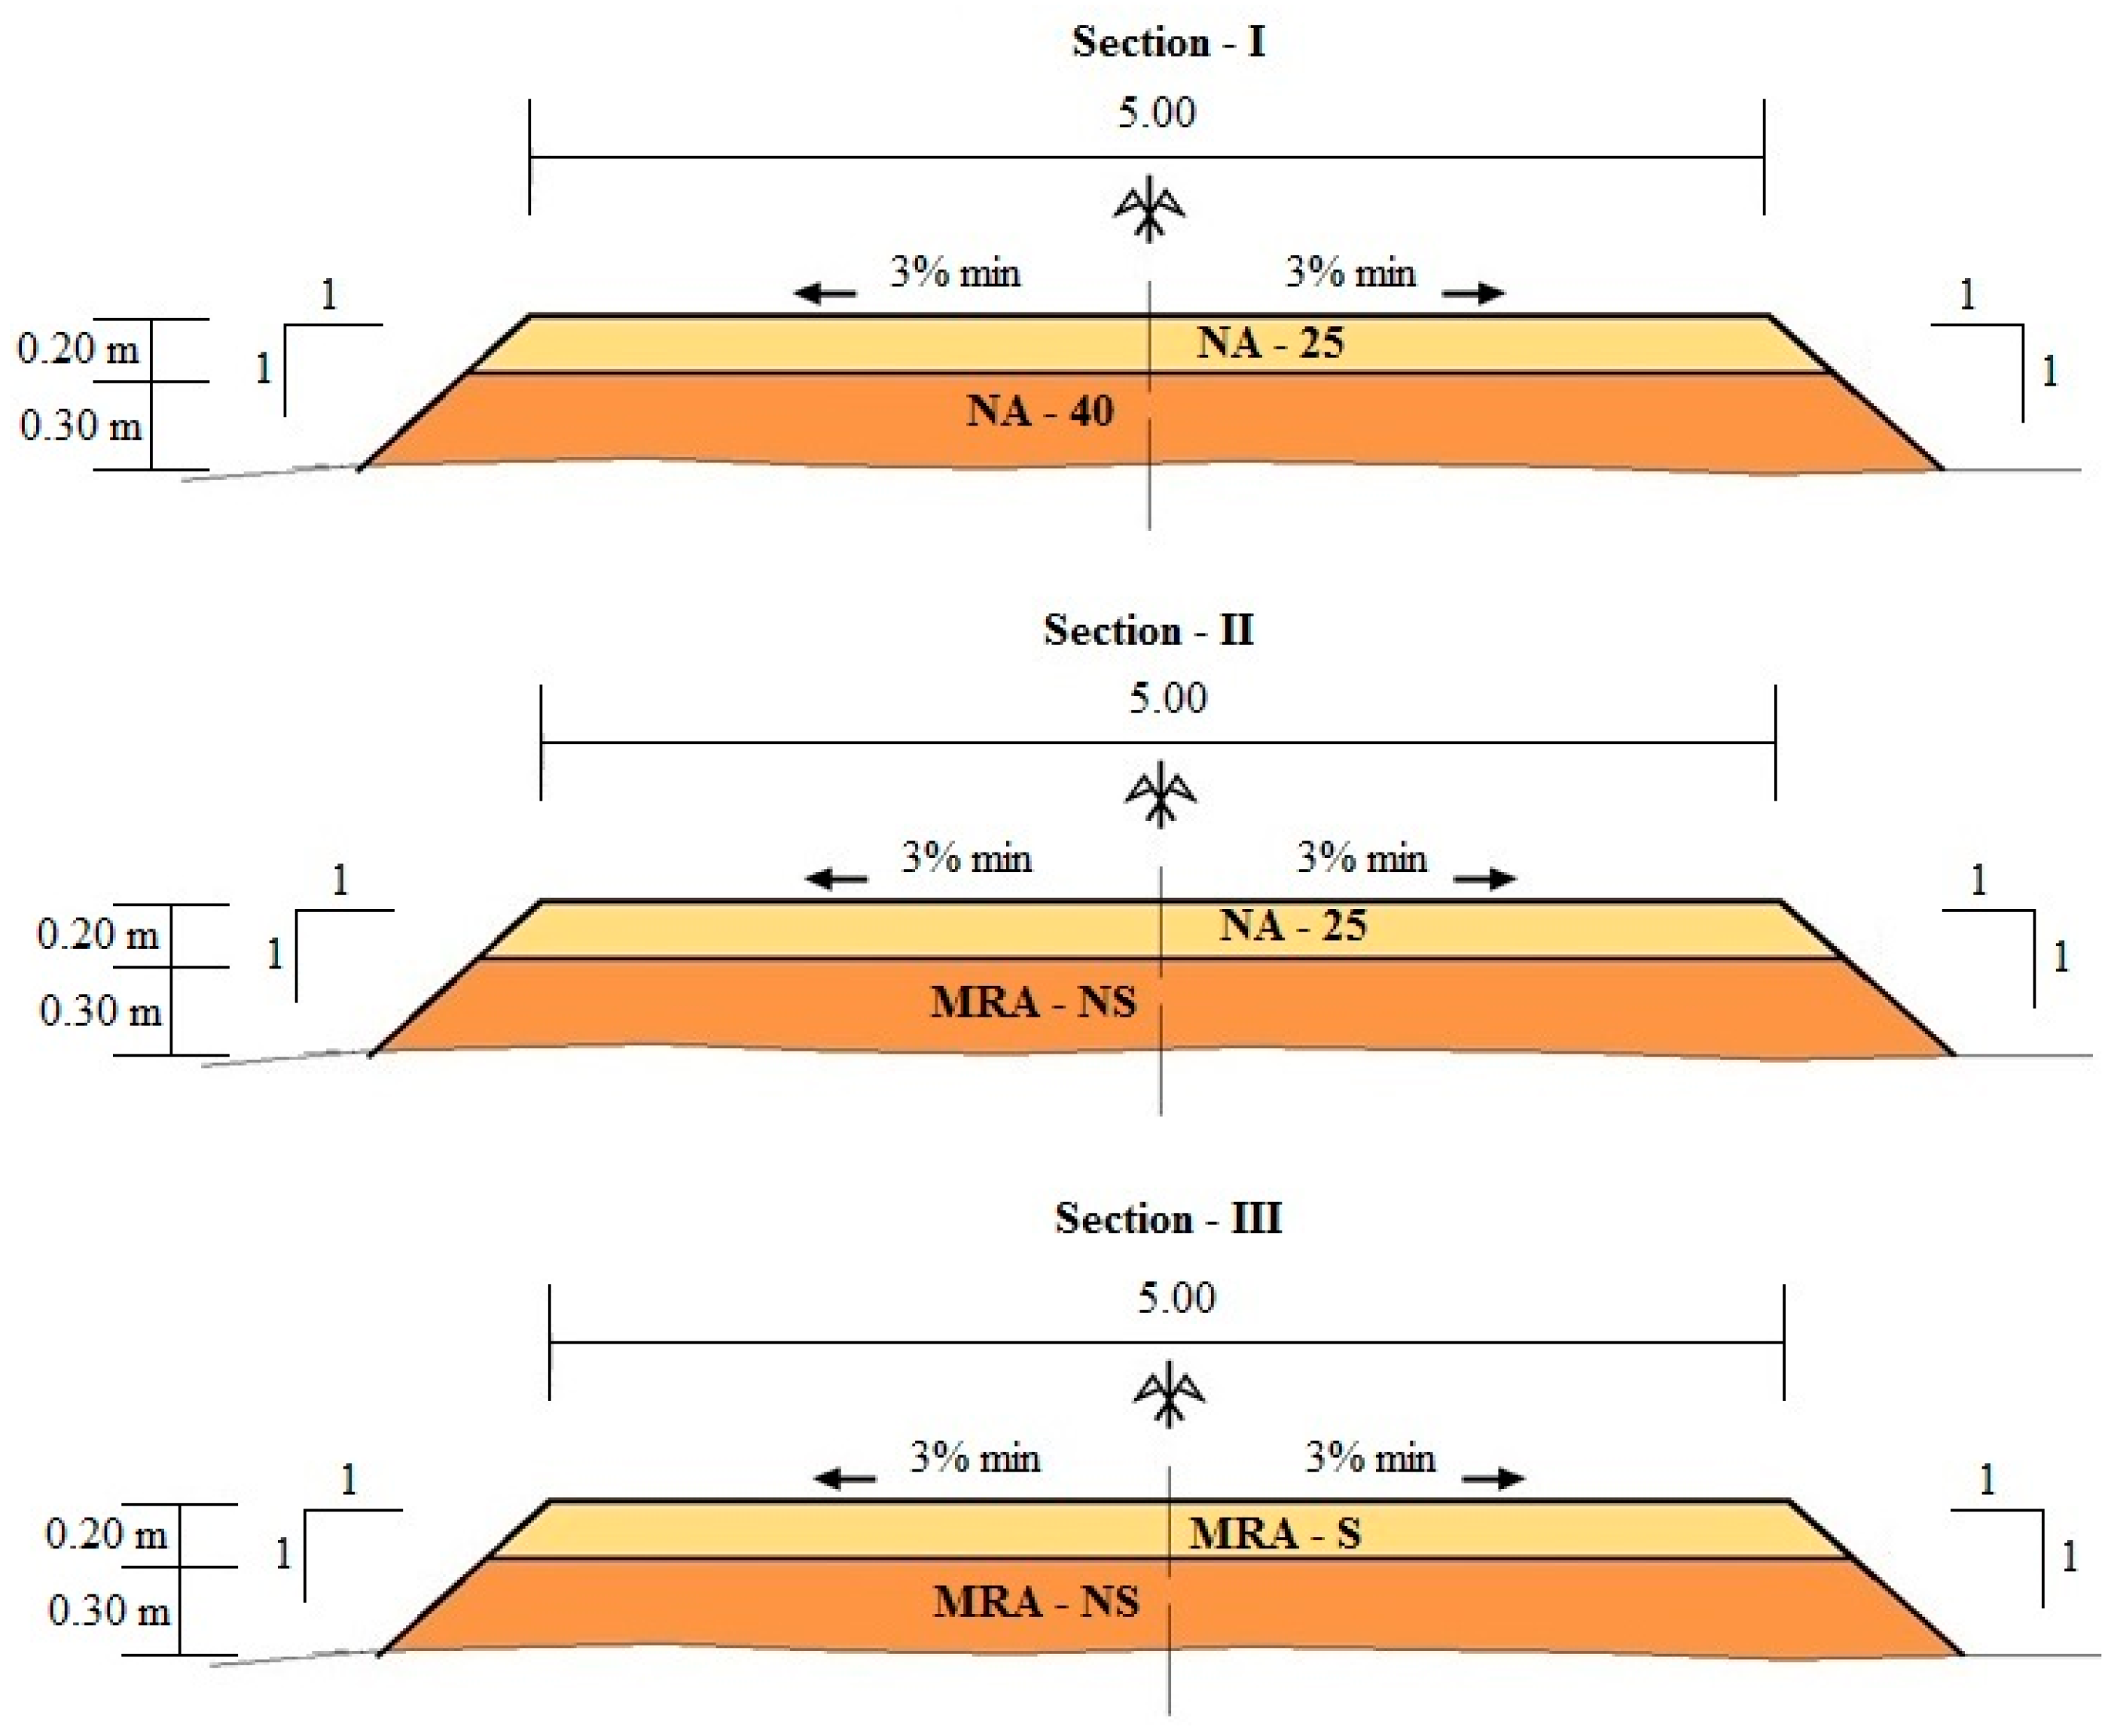
The aim of this research is to study the behaviours of two MRA in the structural layers of an unpaved rural road with low traffic (category T43), i.e., less than 11 heavy vehicles per day, over a subgrade of expansive clays. The results are then compared to those when NA are used. To carry out this experiment, an 825 m experimental road was constructed with three different sections: one made with NA, another with MRA and a third section with both NA and MRA.
3. Execution Quality Control and Experimental Behaviour
3.1. Field Quality Control of the Execution
In each section, quality control tests were carried out to assess the application of the materials in the subgrade, subbase, and base layers. Three “in situ” tests were conducted: dry density and moisture content tests using a Troxler nuclear gauge (manufactured by Troxler Electronics Lab., Durham, NC, USA), a bearing capacity test using a PLT, and deflection measurements using a FWD.
3.1.1. Field Control of the Compaction
The degree of compaction is the most influential factor in the mechanical characteristics of the unbound material [
55]. Therefore, the compaction process was controlled in the field. “In situ” moisture and density values were measured in the subgrade, subbase, and base. The degree of compaction was defined in accordance with the reference Proctor test. MPT was used for the pavement layers, and the SPT was used for the subgrade. SPT was used in the subgrade due to its advantage in expansive soils. PG-3 [
22] indicates that the degree of compaction in the subgrade should meet SPT and MPT values of 95% and 98%, respectively, in pavement layers. The density and moisture values after compaction are shown in
Table 3.
The compaction degree generally complied with PG-3 [
22]. Hence, the experimental section was designed correctly. The average values in the subgrade sections were 97.7%, 96.4%, and 98.3% for sections I, II, and III, respectively. These results were higher than the 95% threshold required by PG-3 [
22]. In the subbase sections, the average values were 99.8% in Section I, which used NA-40, and 100.2% and 99.9% in sections II and III, respectively, which used MRA-NS. In the base sections, the average values were 99.3% and 99.1% in sections I and II, respectively, which used NA-25, and 100.9% in Section III, which used MRA-S. In all the subbase and base layers, the results were higher than the 98% threshold required by PG-3 [
22].
3.1.2. Field Control of the Plate Load Test (PLT)
Based on the data obtained by the PLT, the elastic modulus was calculated for each load cycle.
Table 4 shows the elastic modulus values in the second load cycle in each of the test sections according to NLT 357/98 standard [
52].
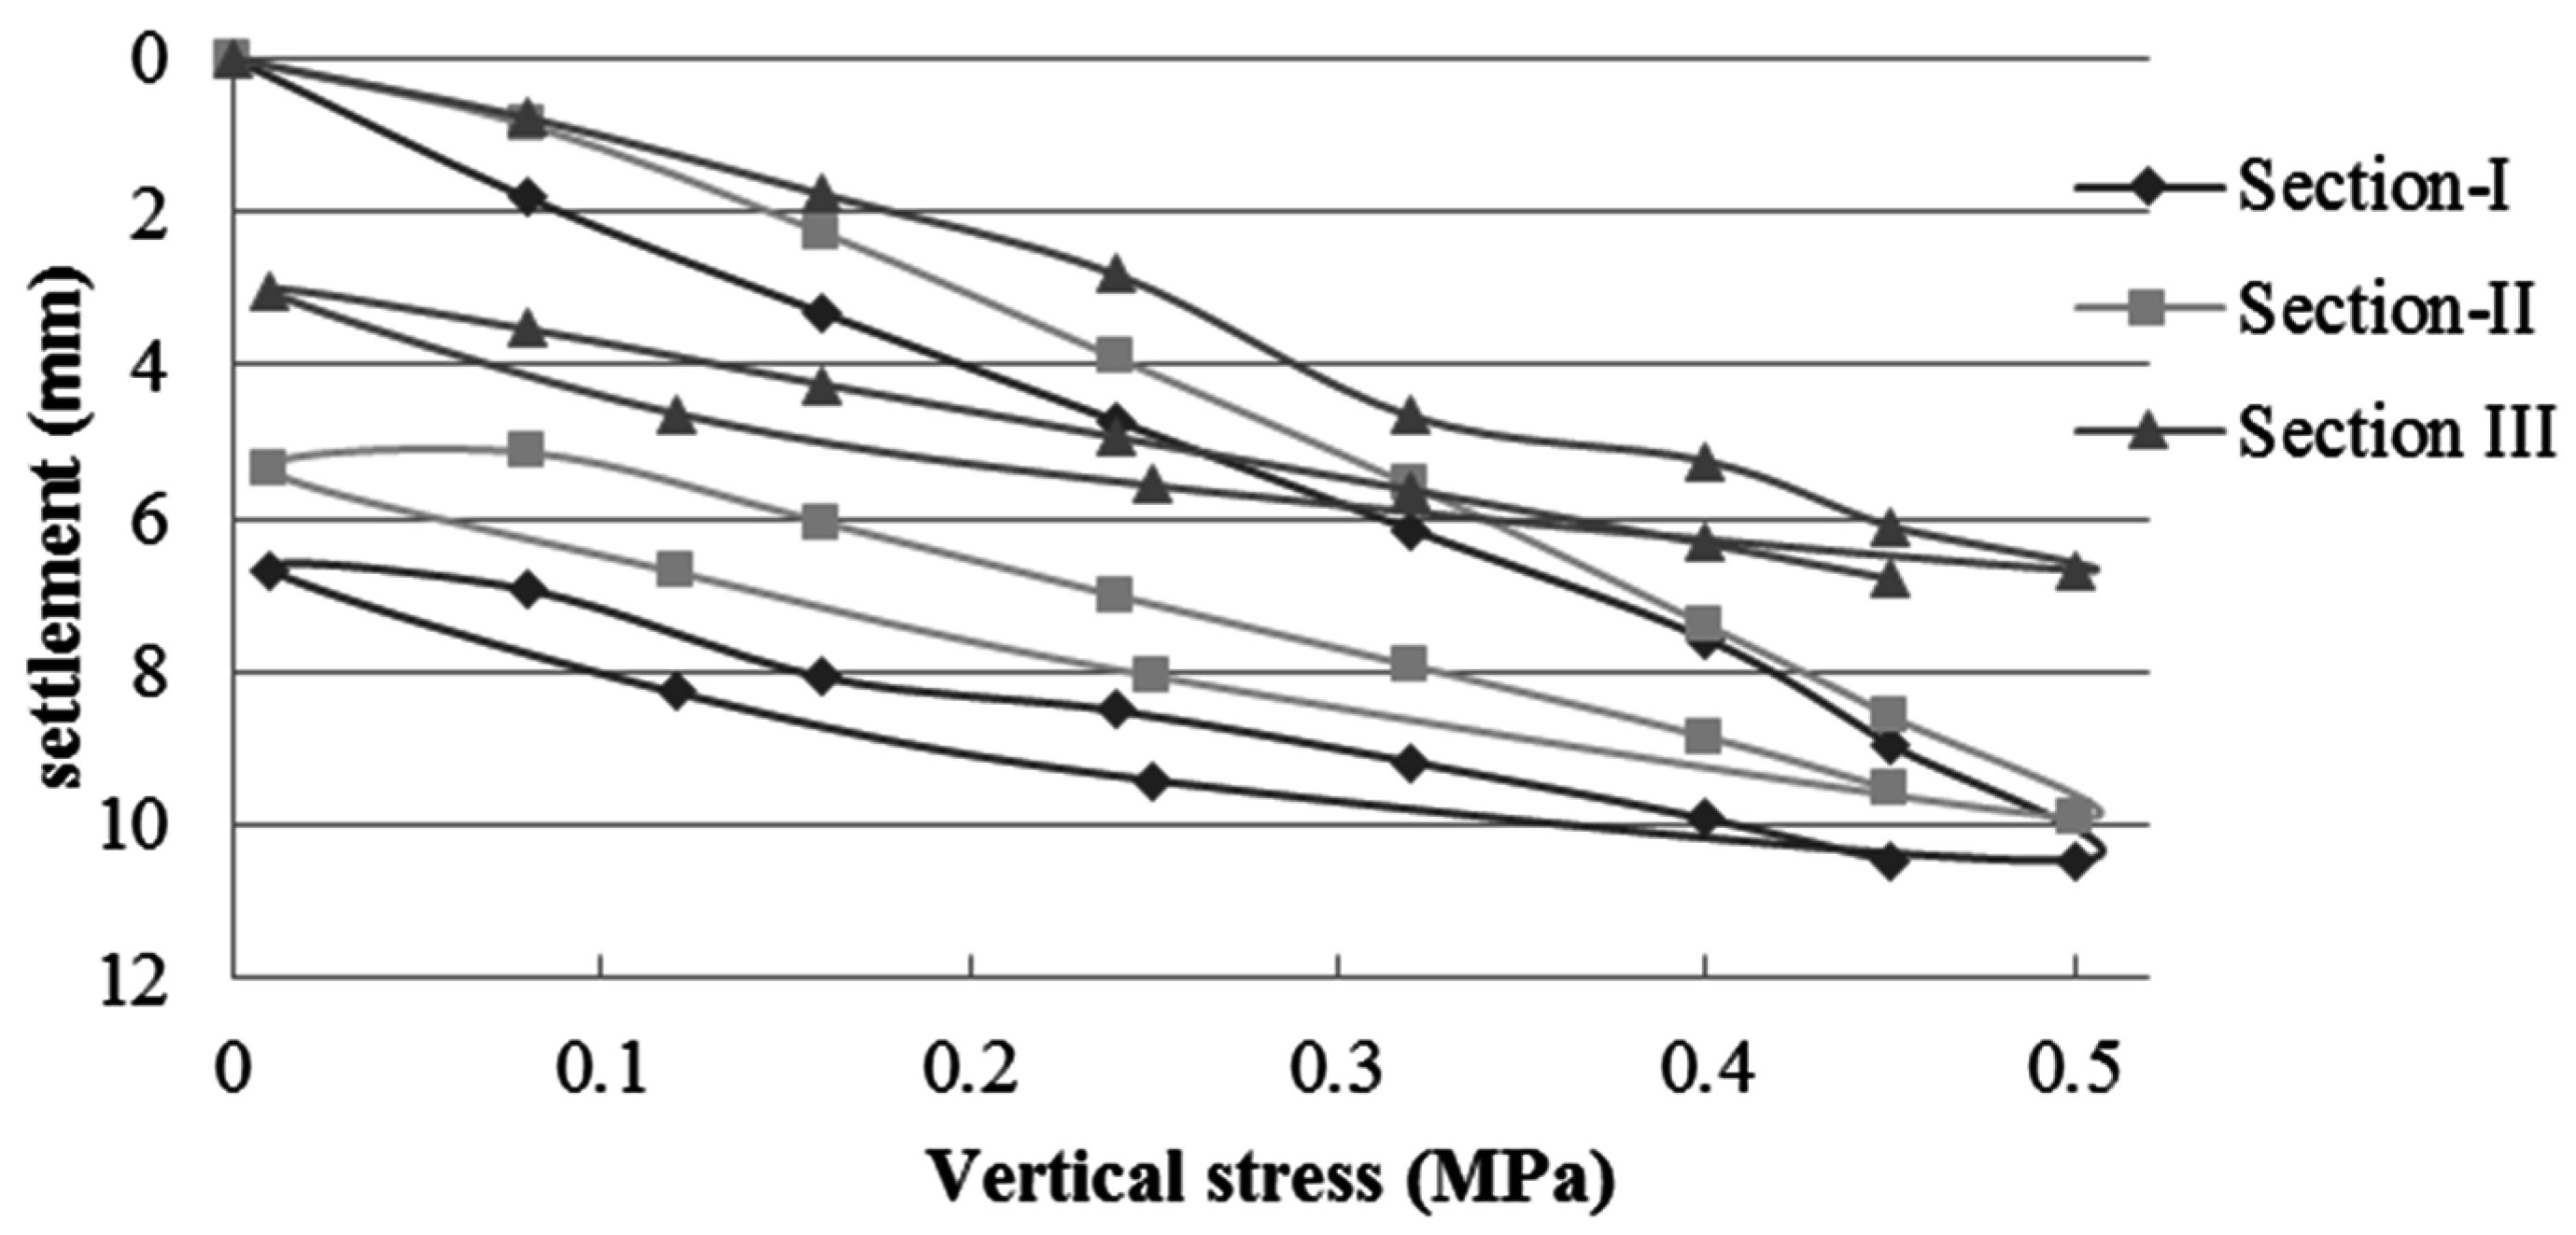
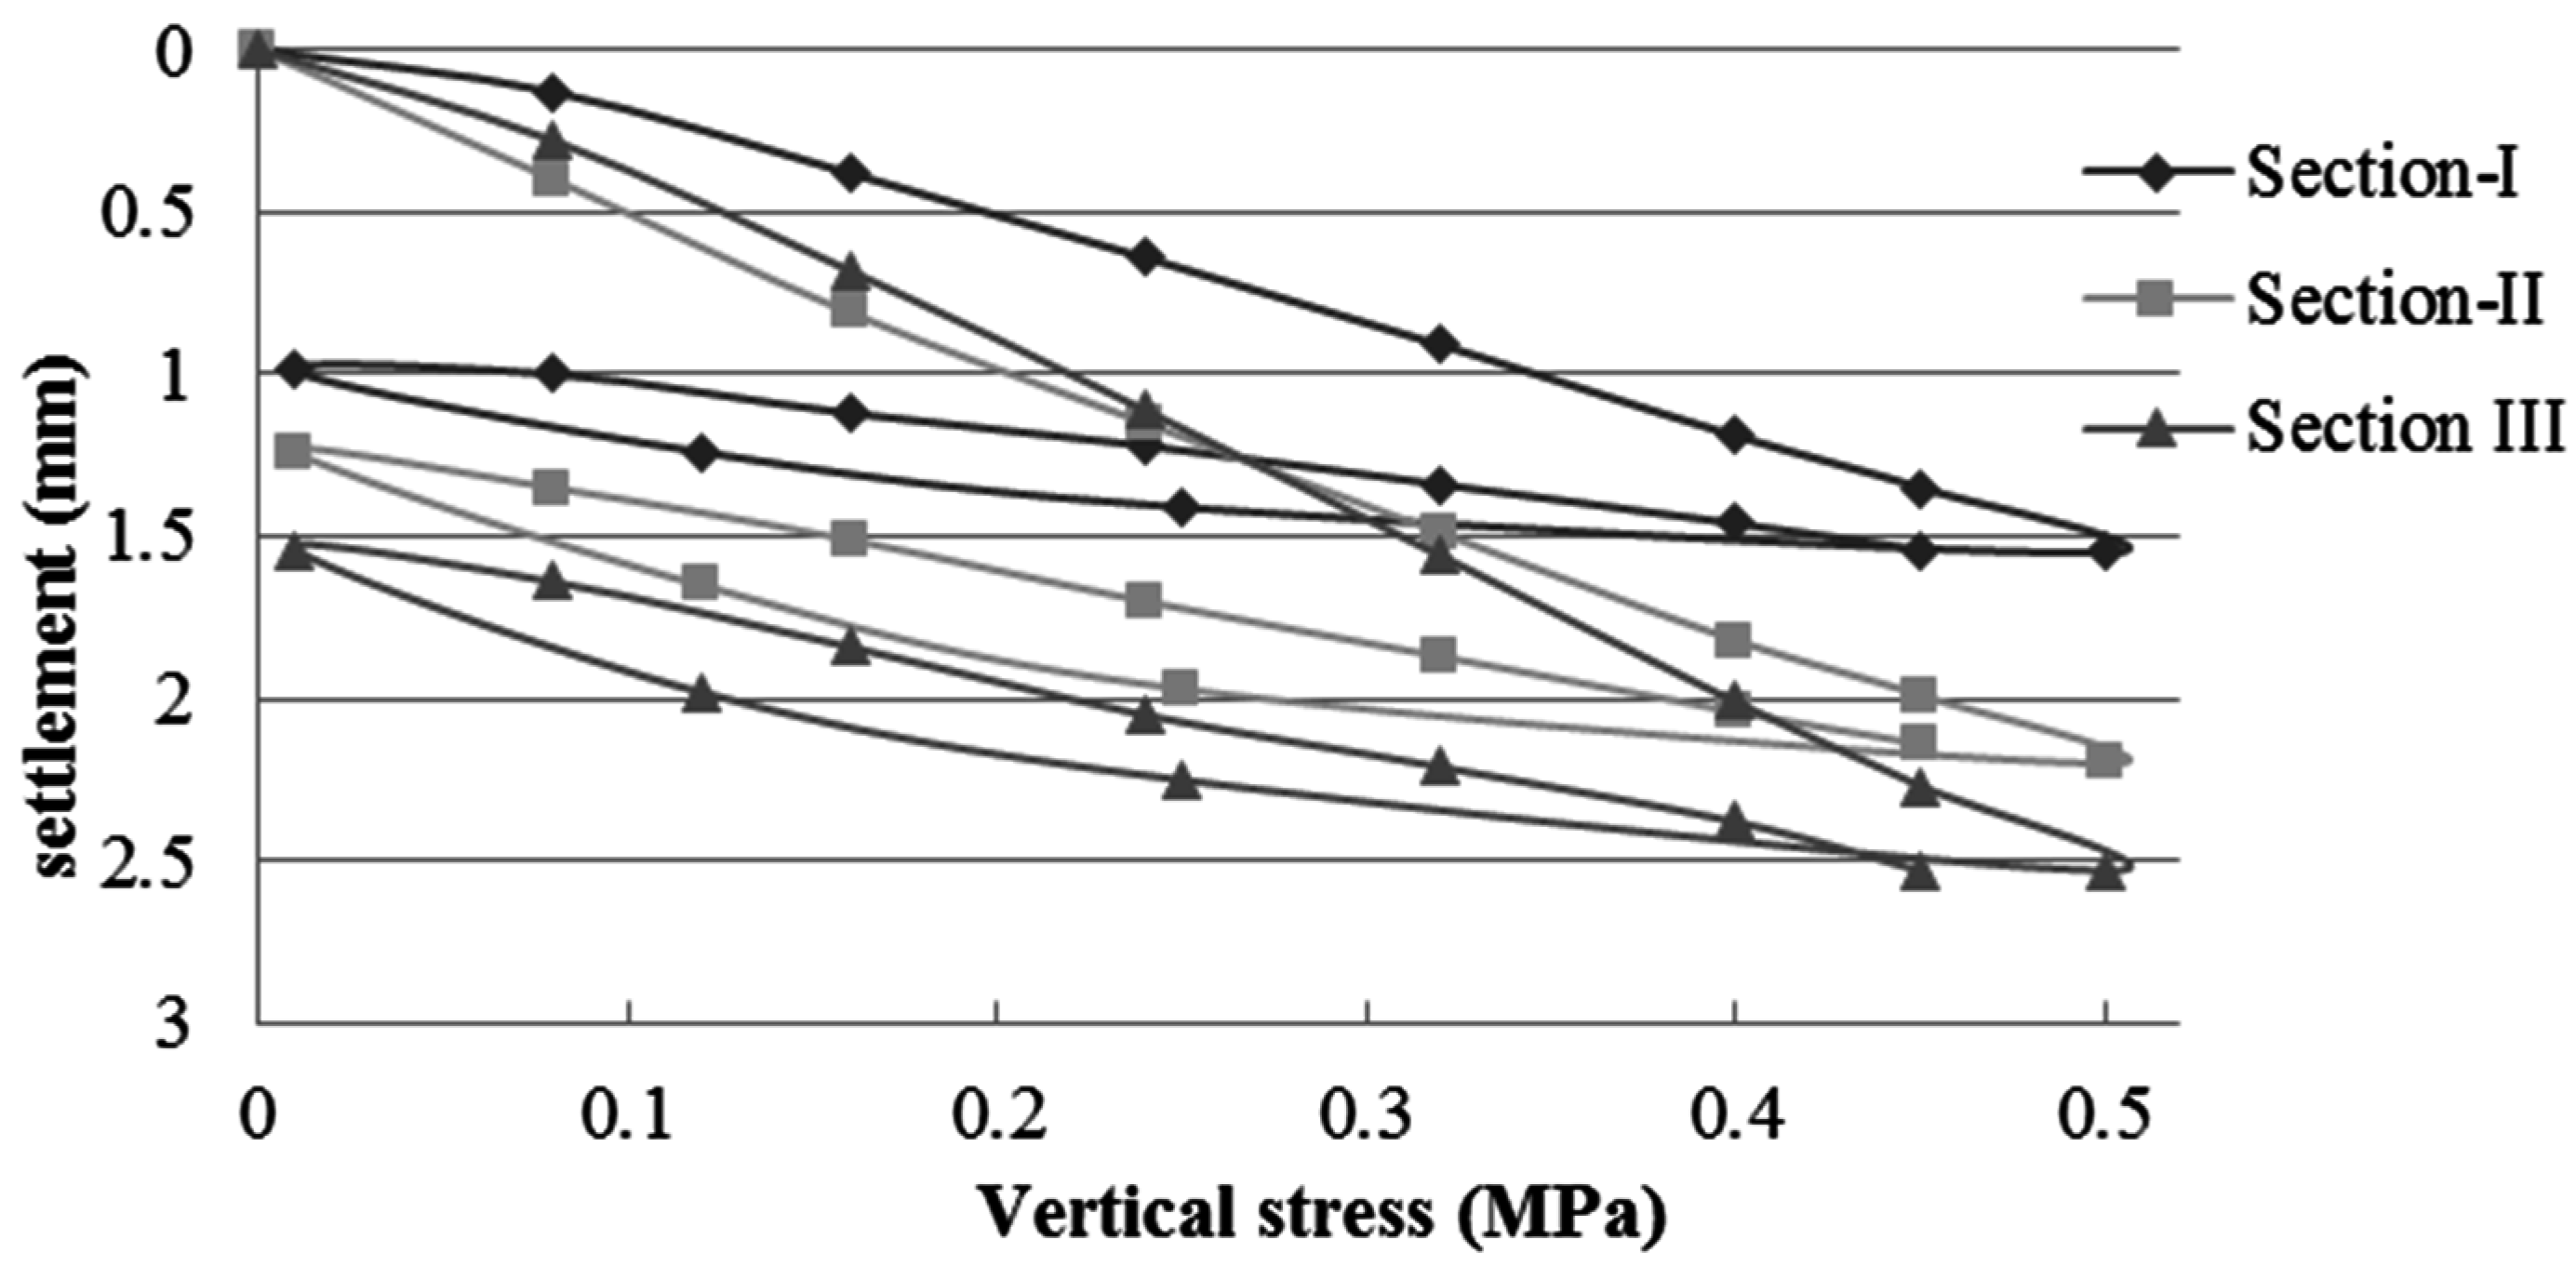
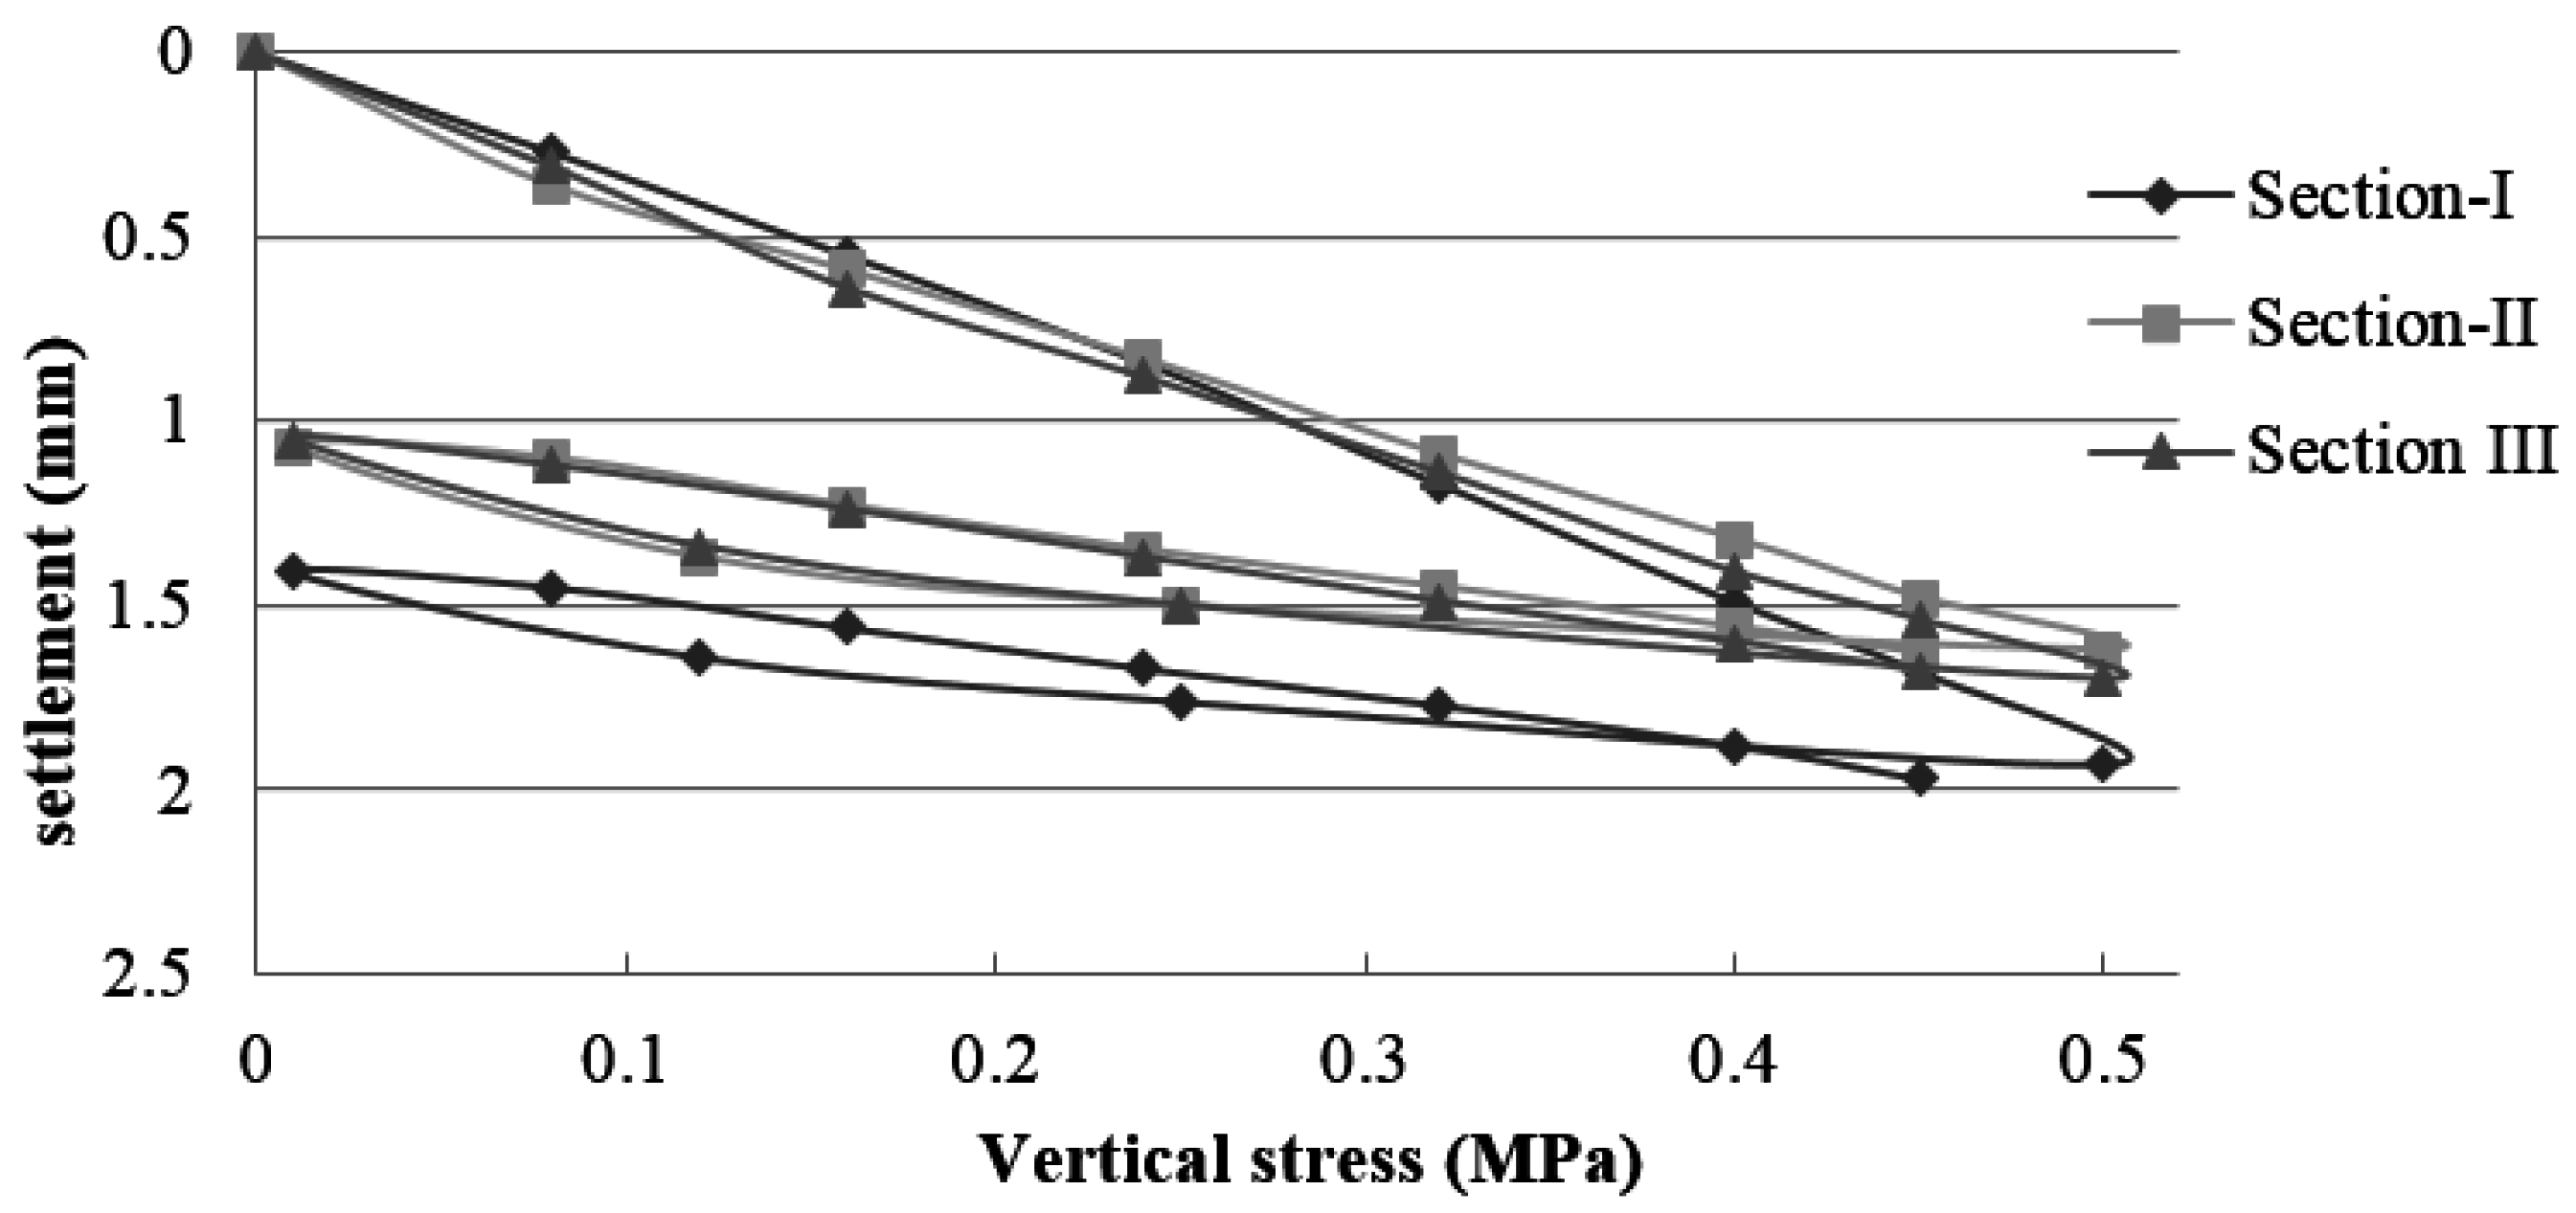
Figure 6,
Figure 7 and
Figure 8 show the vertical stress-settlement diagrams of the subgrade, subbase, and base layers in each experimental section. The results are the average of two measurements per section.
The subgrade had an extremely low bearing capacity of less than 30 MPa, which is well below that required by the PG-3 [
22] (≥100 MPa for selected soils and ≥60 for other soils). These values are consistent with a CBR that is less than 3 (
Table 1). The bearing capacity was well below values obtained in previous studies that used soils with bearing capacity 10 times larger than those of the soils used in this study [
8,
9].
The elastic modulus values of the pavement are influenced by the subgrade properties. The low bearing capacity of the subgrade decreased the load capacity of the upper layers. The elastic modulus values of the subgrade ranged from 19.3 to 28.4 MPa. Compared to the subbase, the average value of Section I (162.0 MPa), which used NA, was 60% and 69% higher in relation to those of sections II (101.4 MPa) and III (95.9 MPa) respectively, which used MRA. In the base layer, the average value of Section I (170.1 MPa) was 6% greater than that of Section II (159.2) and 18% higher than that of Section III (144.7). The modulus of elasticity values of both NA and MRA were above the 80 MPa minimum, and the ratio of Ev2/Ev1 was less than the value of 2.2 required by PG-3 [
22] for traffic category T43.
Jiménez et al. [
8] constructed experiments using a subgrade with a modulus of elasticity greater than 300 MPa. Thus, the upper layers exhibited higher elastic modulus. The elastic modulus values of the subbase layers, which used MRA, were between 270 and 405 MPa, and those of the base layer varied between 370 MPa in the layer with RCA and 421 MPa in the layer with NA. As expected, the elastic moduli are higher than those obtained in similar experimental sections (I and II) in this study because they used an appropriate soil in the subgrade layer.
3.1.3. Field Control of the Falling Weight Deflectometer
The main FWD contribution is the analysis of the bearing capacity by reverse calculation of the modulus of elasticity values of the road layers based on the registered deflections. The deflections were measured with a Dynatest HWD 8081 deflectometer (manufactured by Dynatest, Soborg, Denmark).
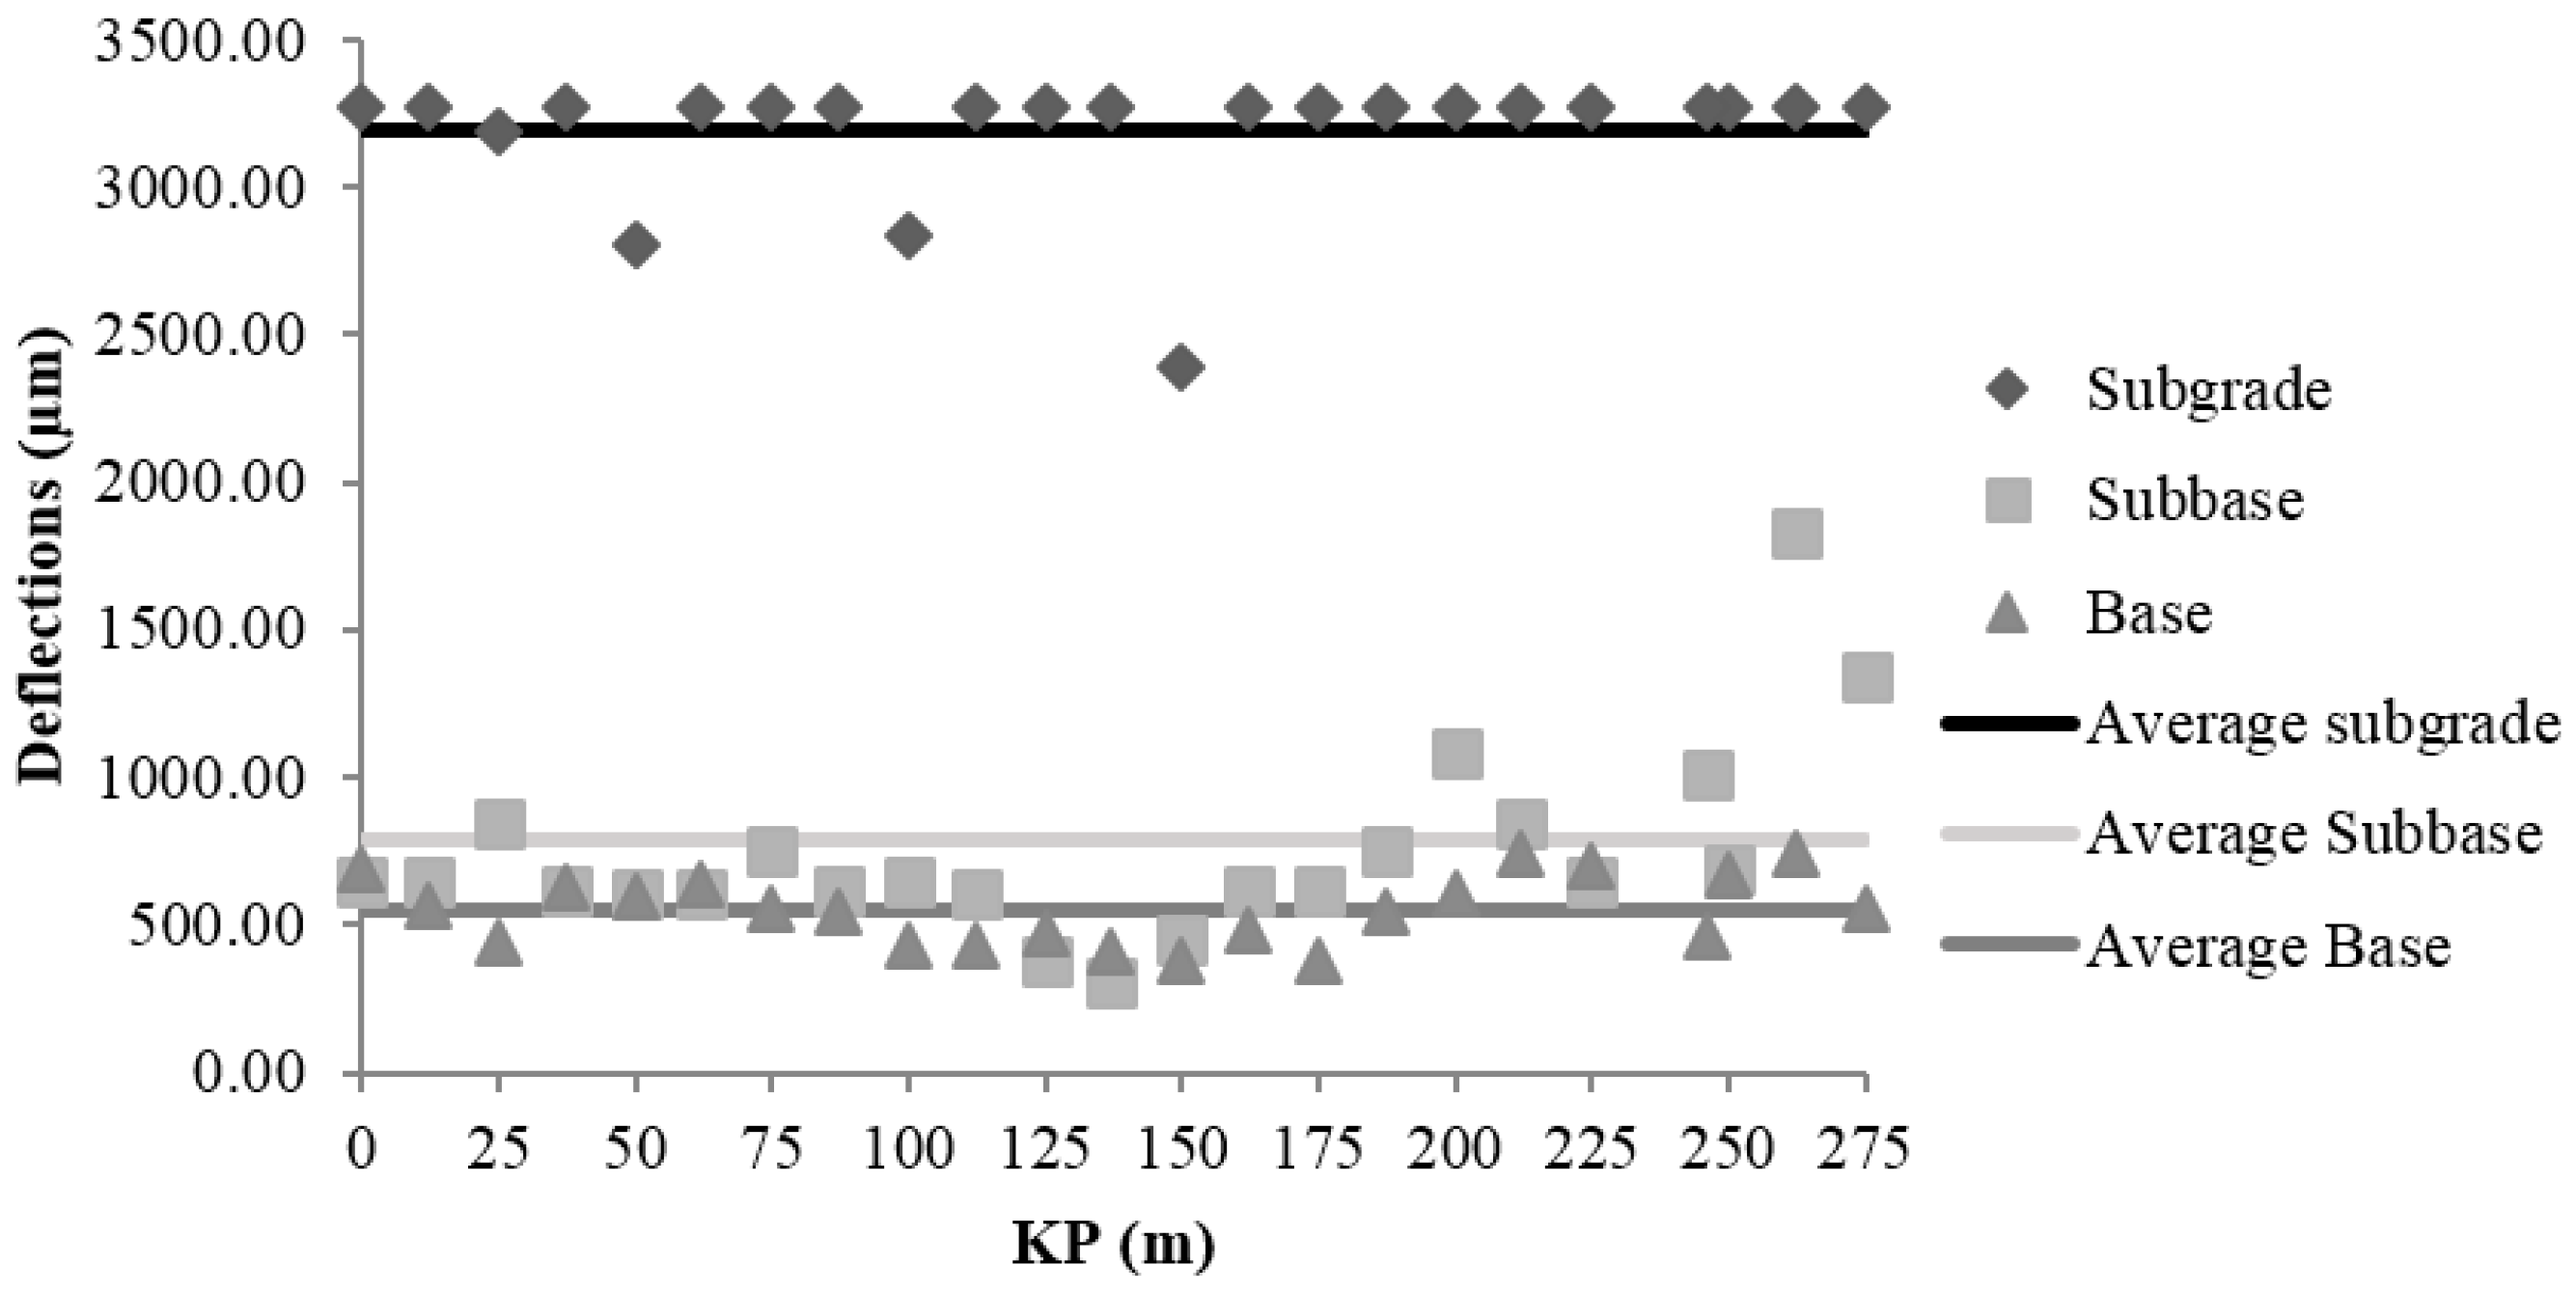
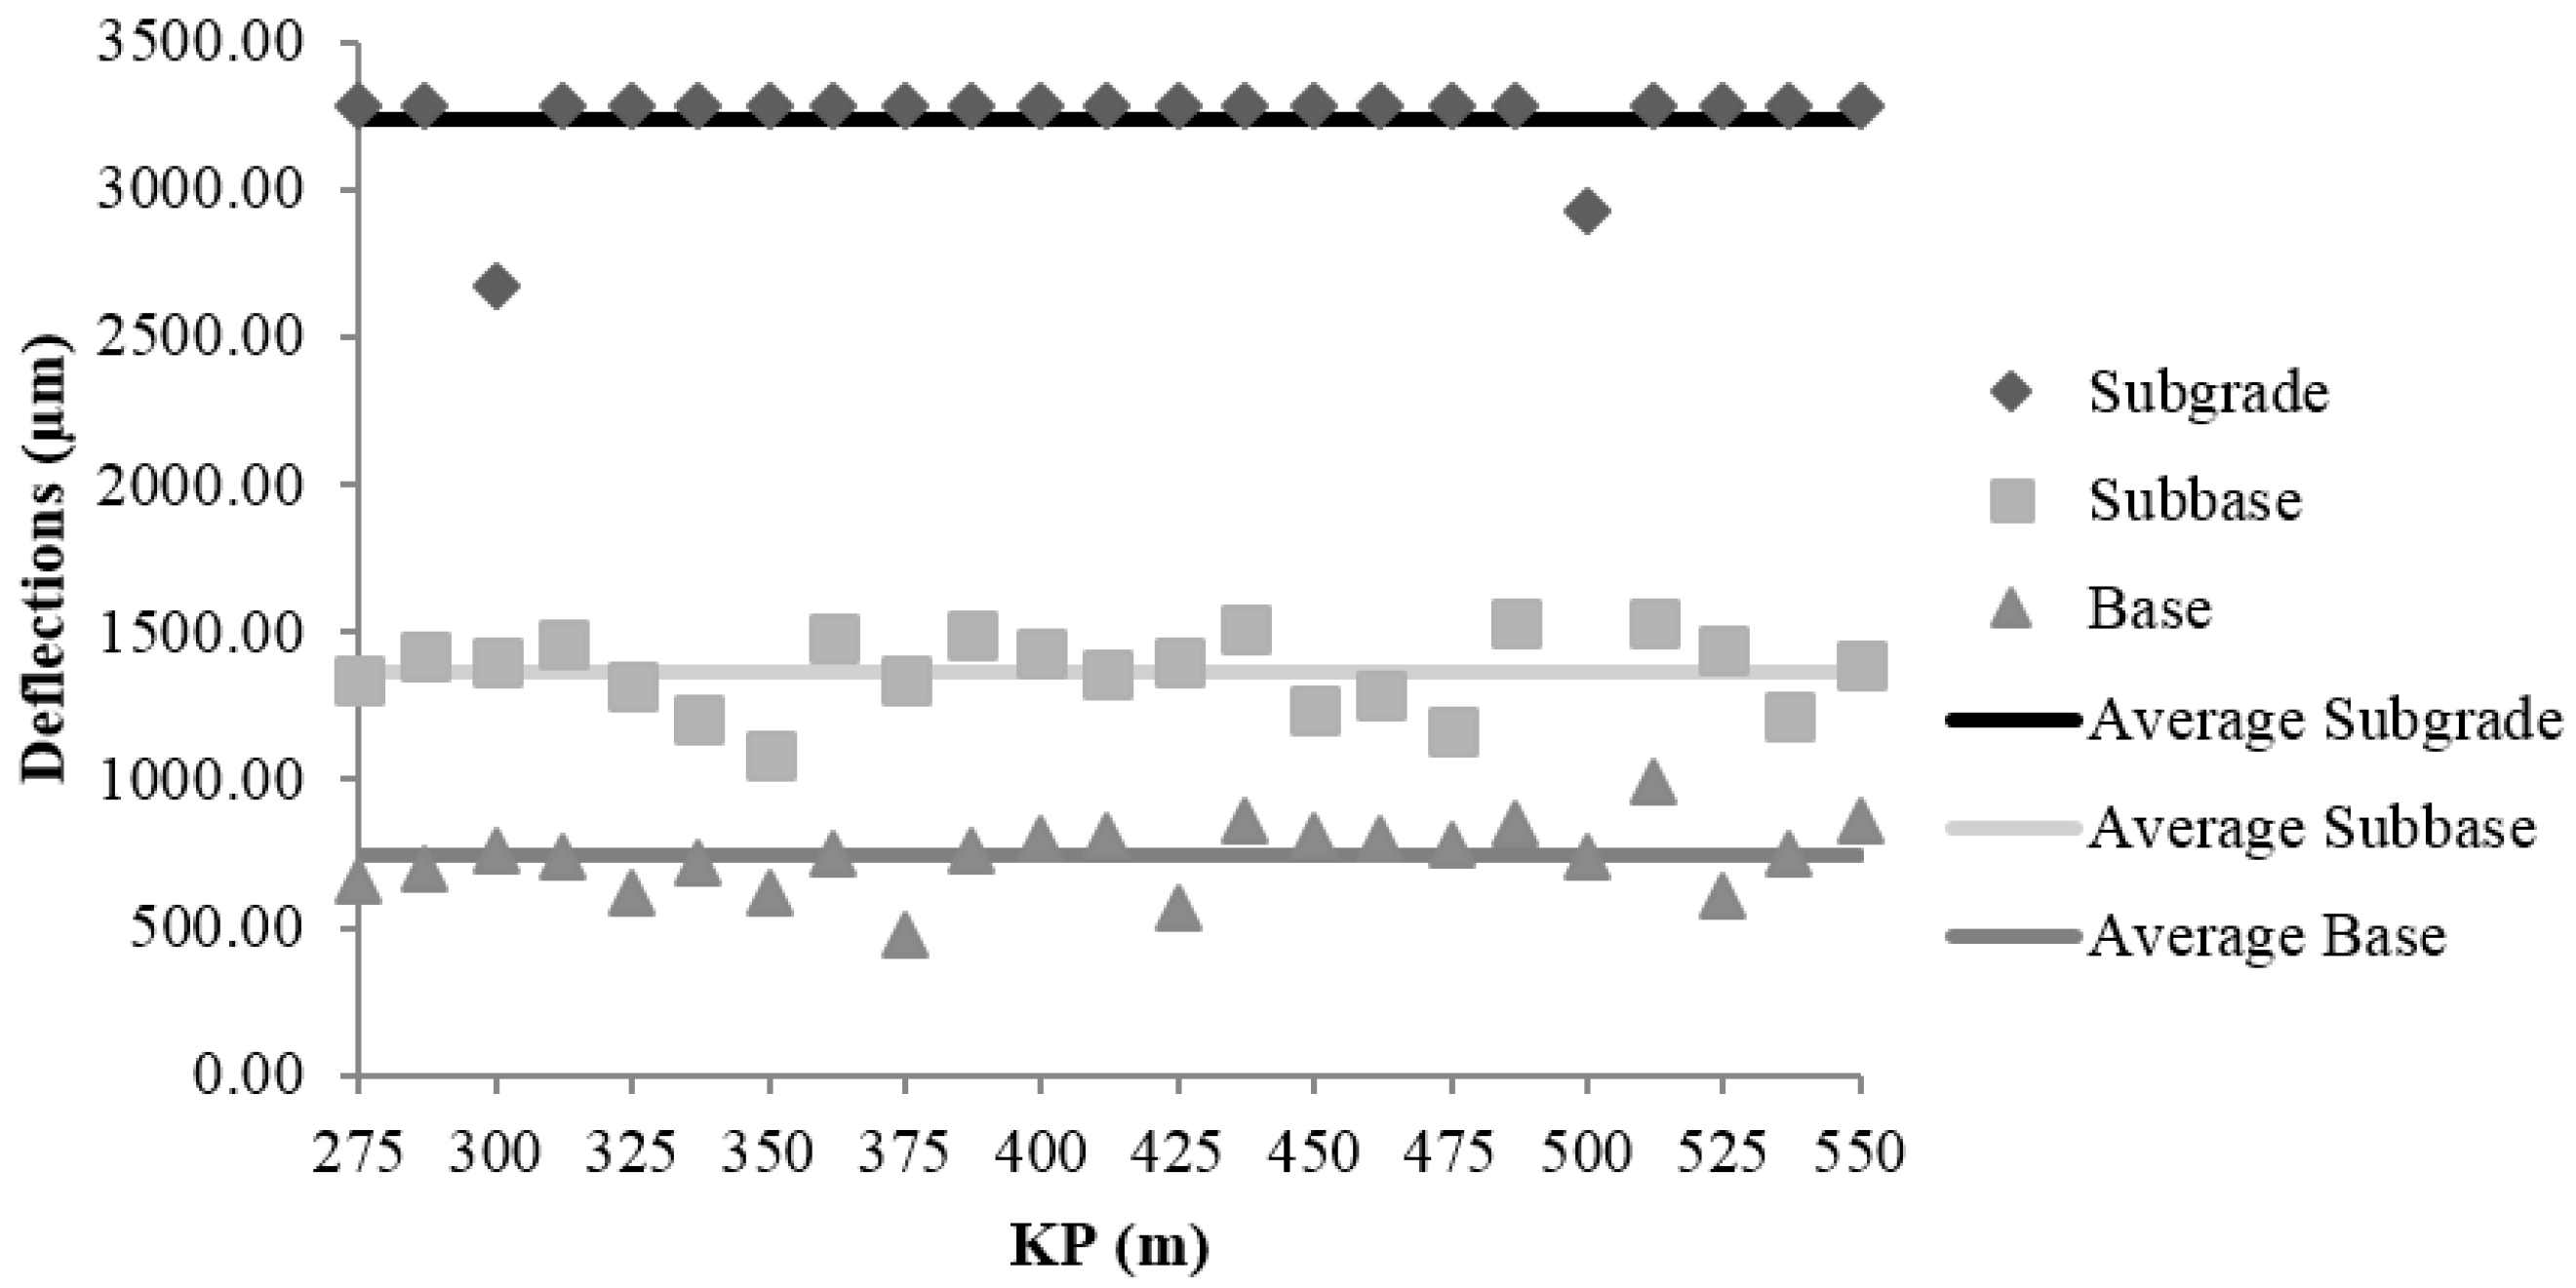
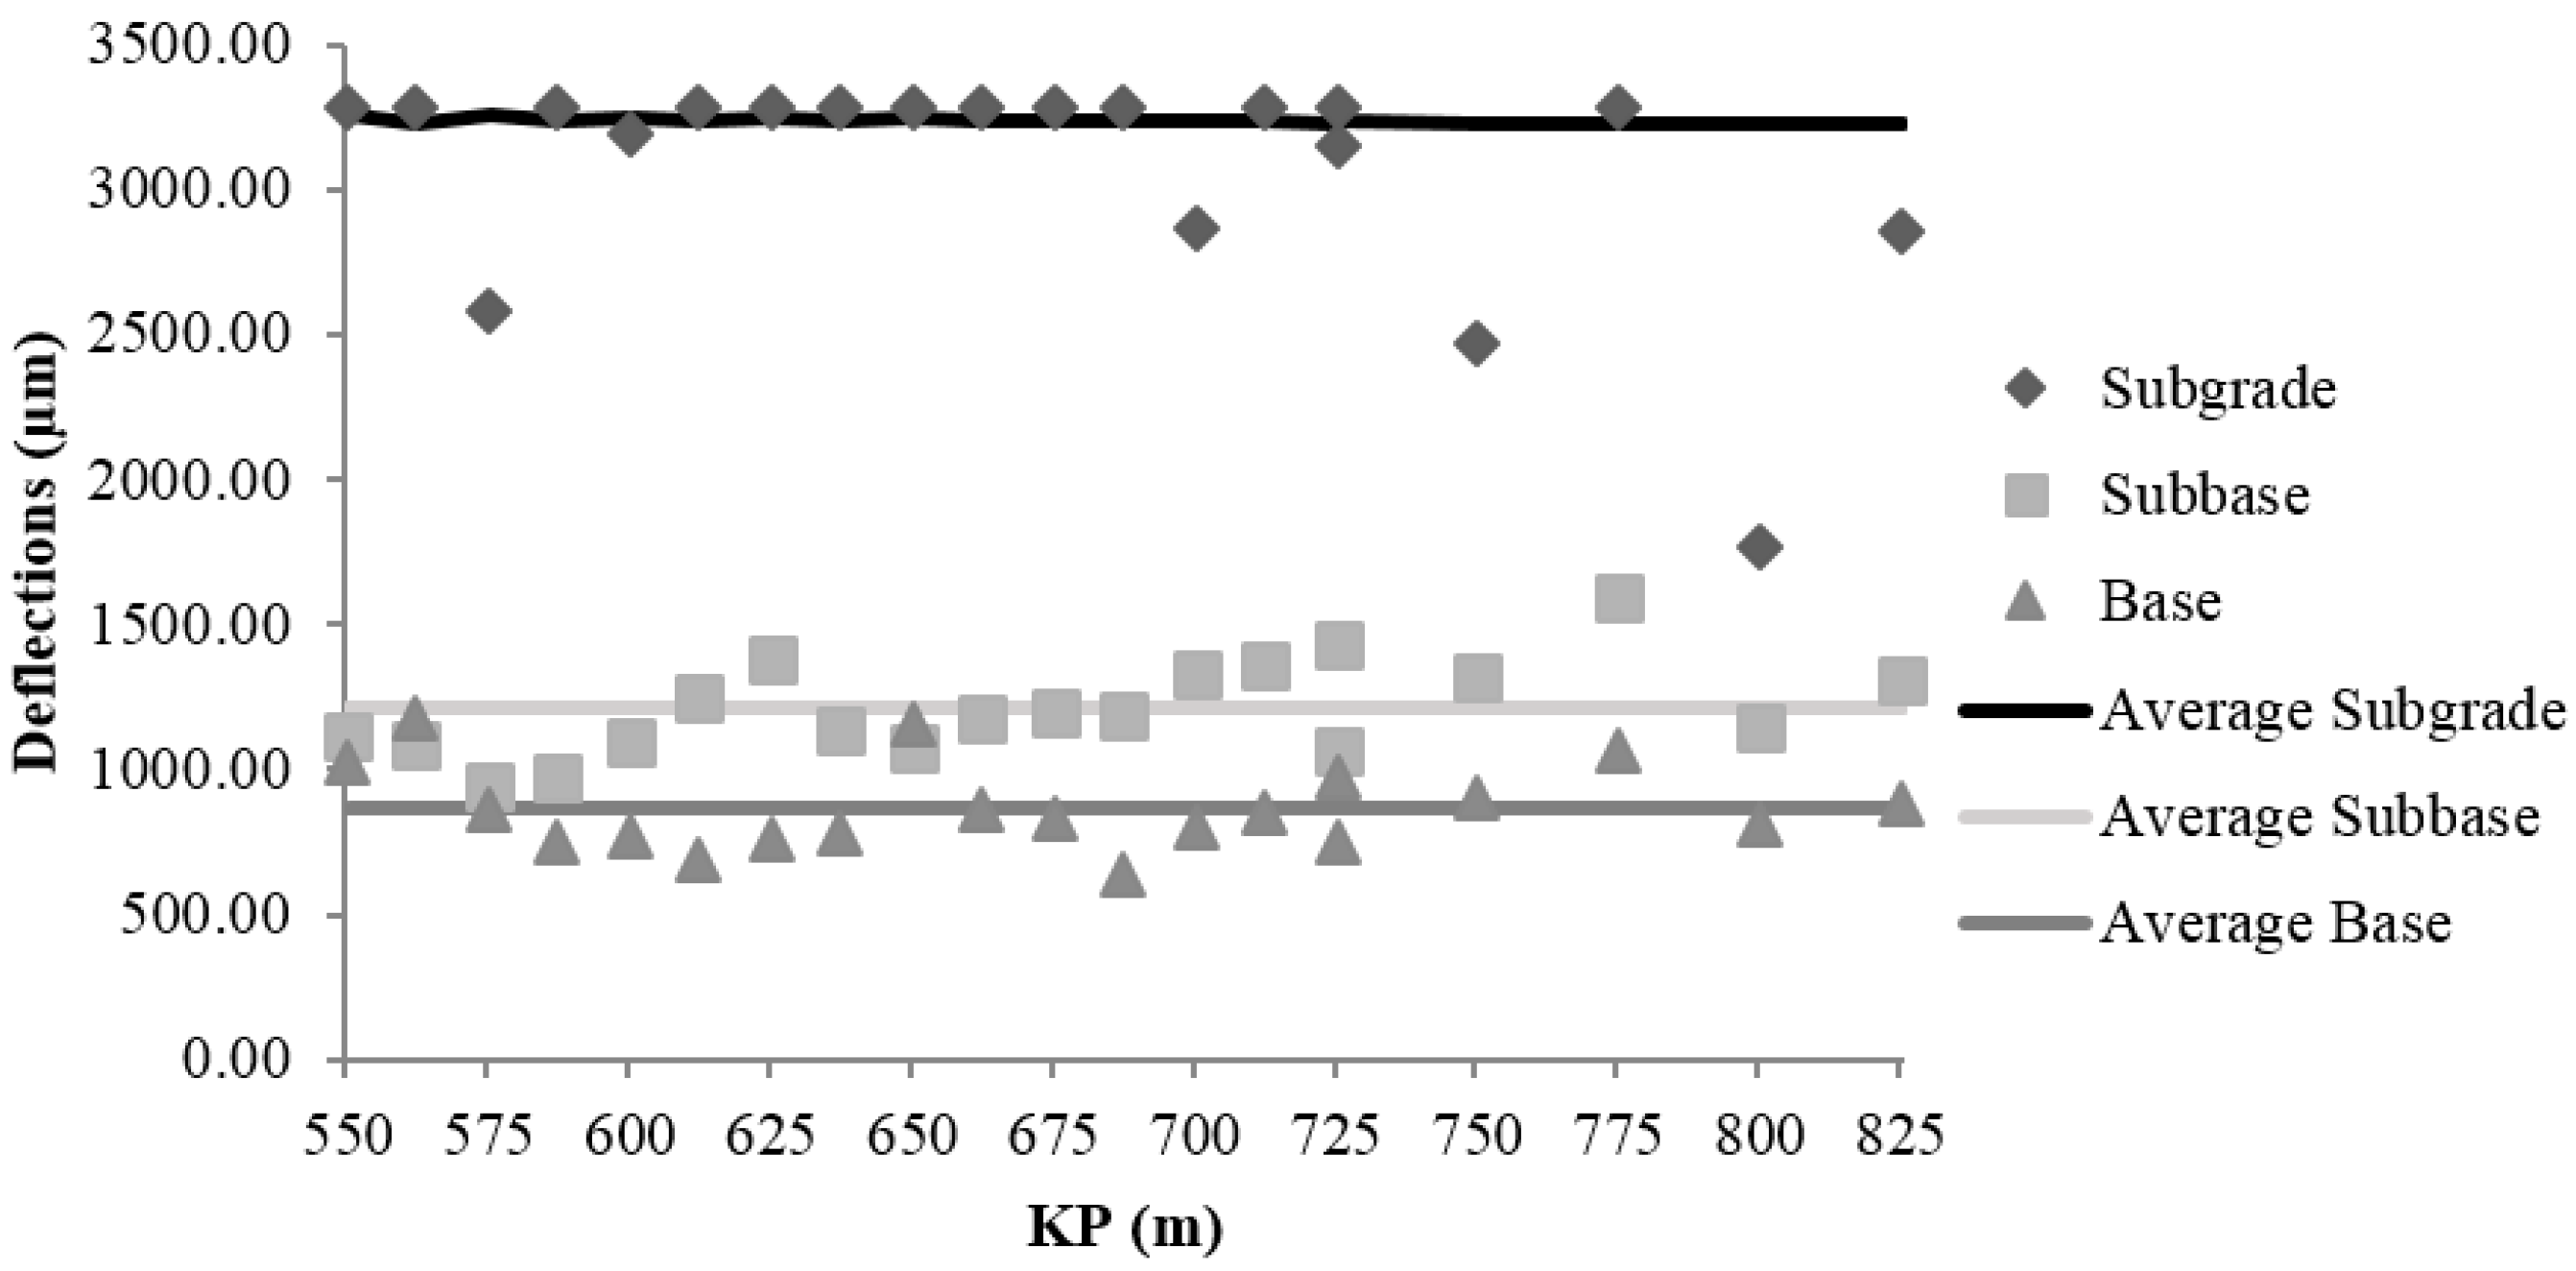
Figure 9,
Figure 10 and
Figure 11 show the values of deflection and the average deflection in the subgrade, subbase, and base in each of the sections.
The low bearing capacity of the subgrade is reflected by the high deflection values registered at the central geophone, which generally exceed 3000 µm. The average deflections in the subgrade were 3198 ± 37, 3219 ± 23, and 3073 ± 19 µm in sections I, II, and III, respectively.
The average deflections in the subbase layer were smaller relative to those in the subgrade: 74% in Section I (826 µm); 58% in Section II (1348 µm); and 61% in Section III (1209 µm). The values obtained in Sections II and III, which were constructed using MRA, are 63% and 46% higher than that in Section I respectively, which was made with NA. Nonetheless, the results in Sections II and III were admissible for unbound rural roads with low traffic and design speed, not compromising the structural stability of the road.
The decrease in the average deflections in the base layer, relative to those in the subbase, were 33% in Section I (552 µm), 45% in Section II (741 µm), and 32% in Section III (827 µm). In connection with the subgrade decrease were 82% in Section I, 77% smaller in Section II and 73% smaller in Section III. This result suggests that the behaviour of Section I, which was constructed with NA, is similar to the behaviour of Section III, which was constructed with MRA, and it demonstrates that the use of MRA does not compromise the load bearing capacity of the section.
Below the load application point, the equivalent elastic modulus (E) of the pavement structure at the centre of the plate (r = 0 mm) was calculated in each of the sections by applying the function proposed by Brown [
56]:
where υ is the Poisson ratio of the material (0.35 for unbound granular materials in roads), σ is the stress applied below the plate, r is the plate radius (225 mm), and δ is the deflection at the centre of the plate measured in µm. The results of the elastic modulus are included in
Table 5. These results were calculated using the average deflection in each section.
A decrease in the elastic modulus was observed in the section constructed with MRA, which may be related to the low resistance of the material to fragmentation [
10,
43,
44,
45,
46]. In the subbase layer, sections II and III exhibited elastic modulus values that were 50.49% and 44.52% lower than those in Section I, which was constructed with NA. In the base layer, the modulus of elasticity in Section I was 15.68% higher than that in Section II and 27.09% higher than that in Section III. Although MRA undergo more deformation and have lower elastic modulus values than do NA, the MRA used in this study exhibited satisfactory performance.
3.2. Field Control of the Experimental Section Behaviour
An evaluation of MRA materials in an expansive clay subgrade under low-traffic conditions was conducted from July 2014 to January 2016. The main factors that affect the upper layers of unpaved roads with bases consisting of unbound granular materials are traffic density and weather conditions.
Table 6 shows the average monthly maximum and minimum temperatures and monthly total precipitation from execution until the completion of the performance tests. This information was collected from the nearest weather station, which is located in Cabra (Cordoba), with UTM coordinates of (373,516, 4,151,100). The elevation of the station is 547 m.
The temperatures were not extreme. Notably, 2015 was a particularly dry year. Precipitation was concentrated during the months of October to February.
As a service road to an agricultural area, the annual critical period is between September and February. During those months, increased vehicle traffic occurs, as this is the period of greatest agricultural activity. This period also coincides with the transition from a dry spell (summer) at the end of the period to maximum precipitation (winter). Therefore, the beginning of July 2015 and late January 2016 were chosen to perform “in situ” measurements of density, moisture, and falling weight deflection. These tests were carried out to observe the evolutional trends in the deformation, bearing capacity, and elastic modulus values.
3.2.1. Field Control of Compaction Evolution
To evaluate the behaviour of compaction over time, three “in situ” moisture and density measurements were taken in each section: after execution, at 12 months and at 18 months. Each measurement was the average of 11 tests, and the results in each test section are included in
Table 7.
A small decrease in the dry density over time was observed in sections I and II, whose bases were made with NA. Decreased dry density causes a decrease in the degree of compaction. The dry density in Section I decreased by 1.33% and 3.10% in July 2015 and January 2016, respectively. In Section II, the dry density decreased by 1.80% in July 2015 and 2.21% in January 2016. In Section III, a small increase in the dry density (0.53%) was observed in July 2015, and the dry density decreased by 1.07% in January 2016. As in previous investigations, the degree of compaction remained constant in the base layers constructed with recycled aggregates [
8], although minimal loss of compaction was observed in the sections constructed with NAs in these studies.
As expected, RA exhibited a higher moisture content than did NA. The high porosity and absorption of MRA increased the moisture content (
Table 1). This difference was largest after a large precipitation event in January 2016 (88.1 mm).
To assess the significance of the effect of the two factors (composition of each section and date) have on dry density, an analysis of variance (ANOVA) was conducted with the statistical software Statgraphics Centurion XVI (Version 16.1.18, Statgraphics, Madrid, Spain). The F-test in the ANOVA analysis was used to evaluate whether one factor had statistically significant effects on dry density, with a 95% confidence level. If the p-value was lower than 0.05, the factor showed a significant effect on the property studied. To check whether there was a significant difference between the levels for each factor, Fisher’s Least Significant Difference (LSD) test was conducted. In this method there are statistically significant differences at a 95% confidence level when there are non-overlapping bars.
Table 8 shows the results obtained with the ANOVA. The results indicate that the composition of sections has a statistically significant influence on dry density (
p < 0.05). In relation to date, the results show that this factor has statistically significant influence (
p < 0.05) on Section I and Section II. However, there is no influence in Section III.
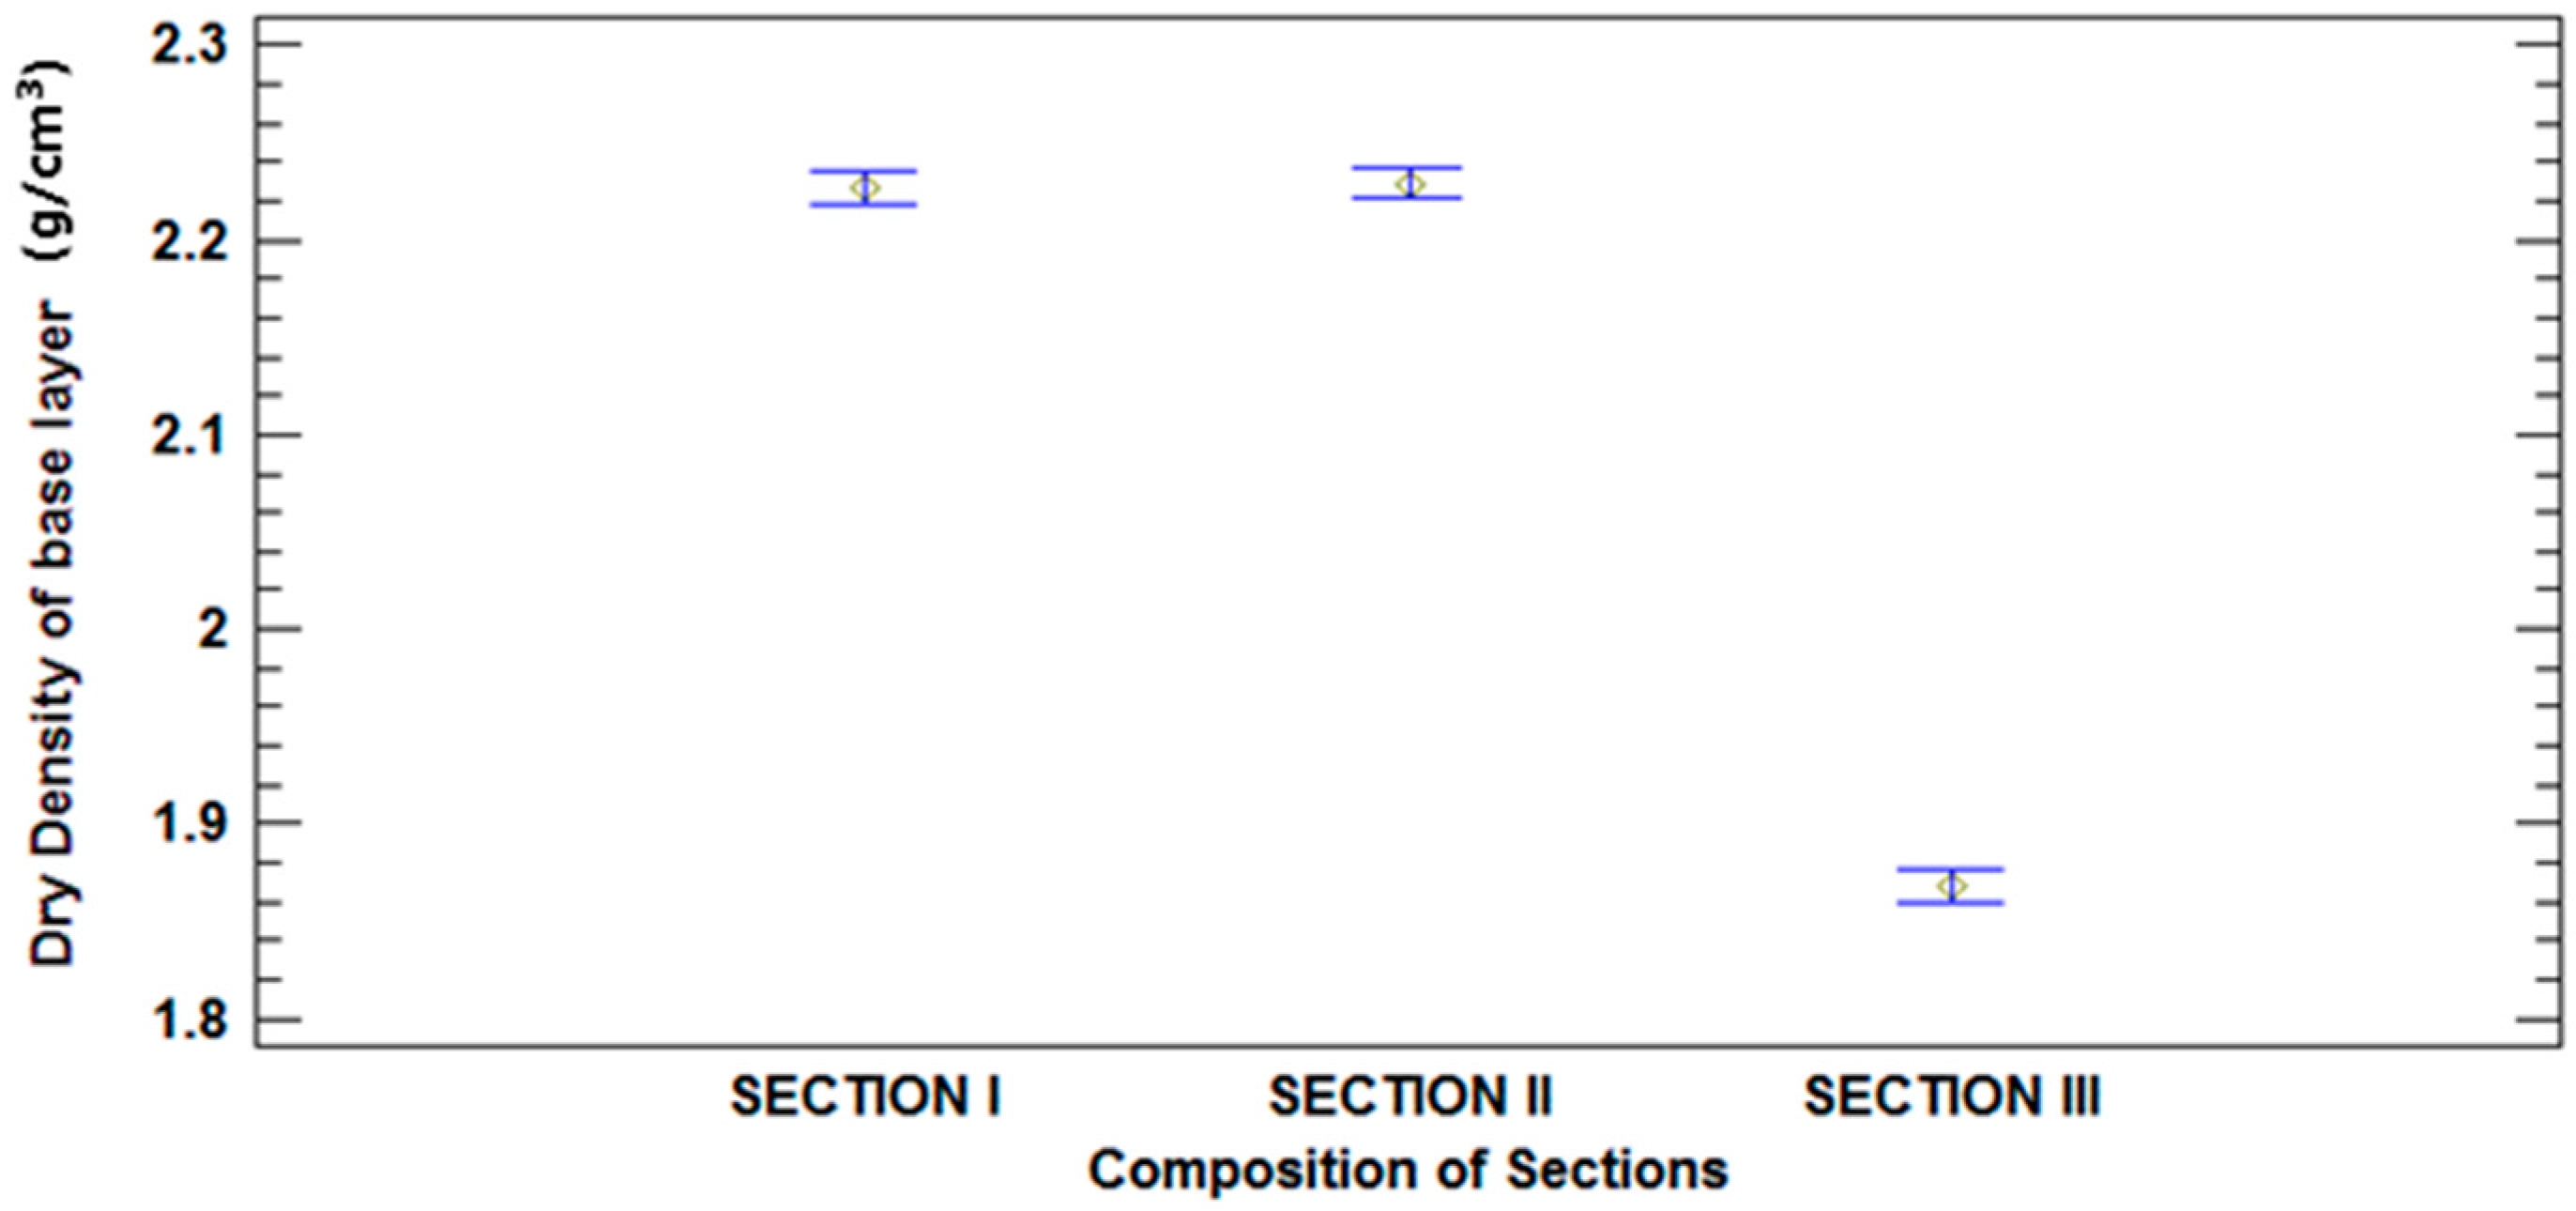
Figure 12 and
Figure 13 illustrate the average and 95% LSD Interval. No statistically significant differences were found between those levels that share overlapping bars. The least significant difference (LSD) method was used for this analysis. In this method, 5% is associated with saying that every pair of means is significantly different when the actual difference is equal to 0.
As expected, the mean values of Section III, the base layer was performed with MRA, were lower than the mean values of Section I and II, constructed with NA. There were statistically significant differences at a 95% confidence level between Section I and II compared to Section III, as is indicated by the non-overlapping bars in
Figure 10.
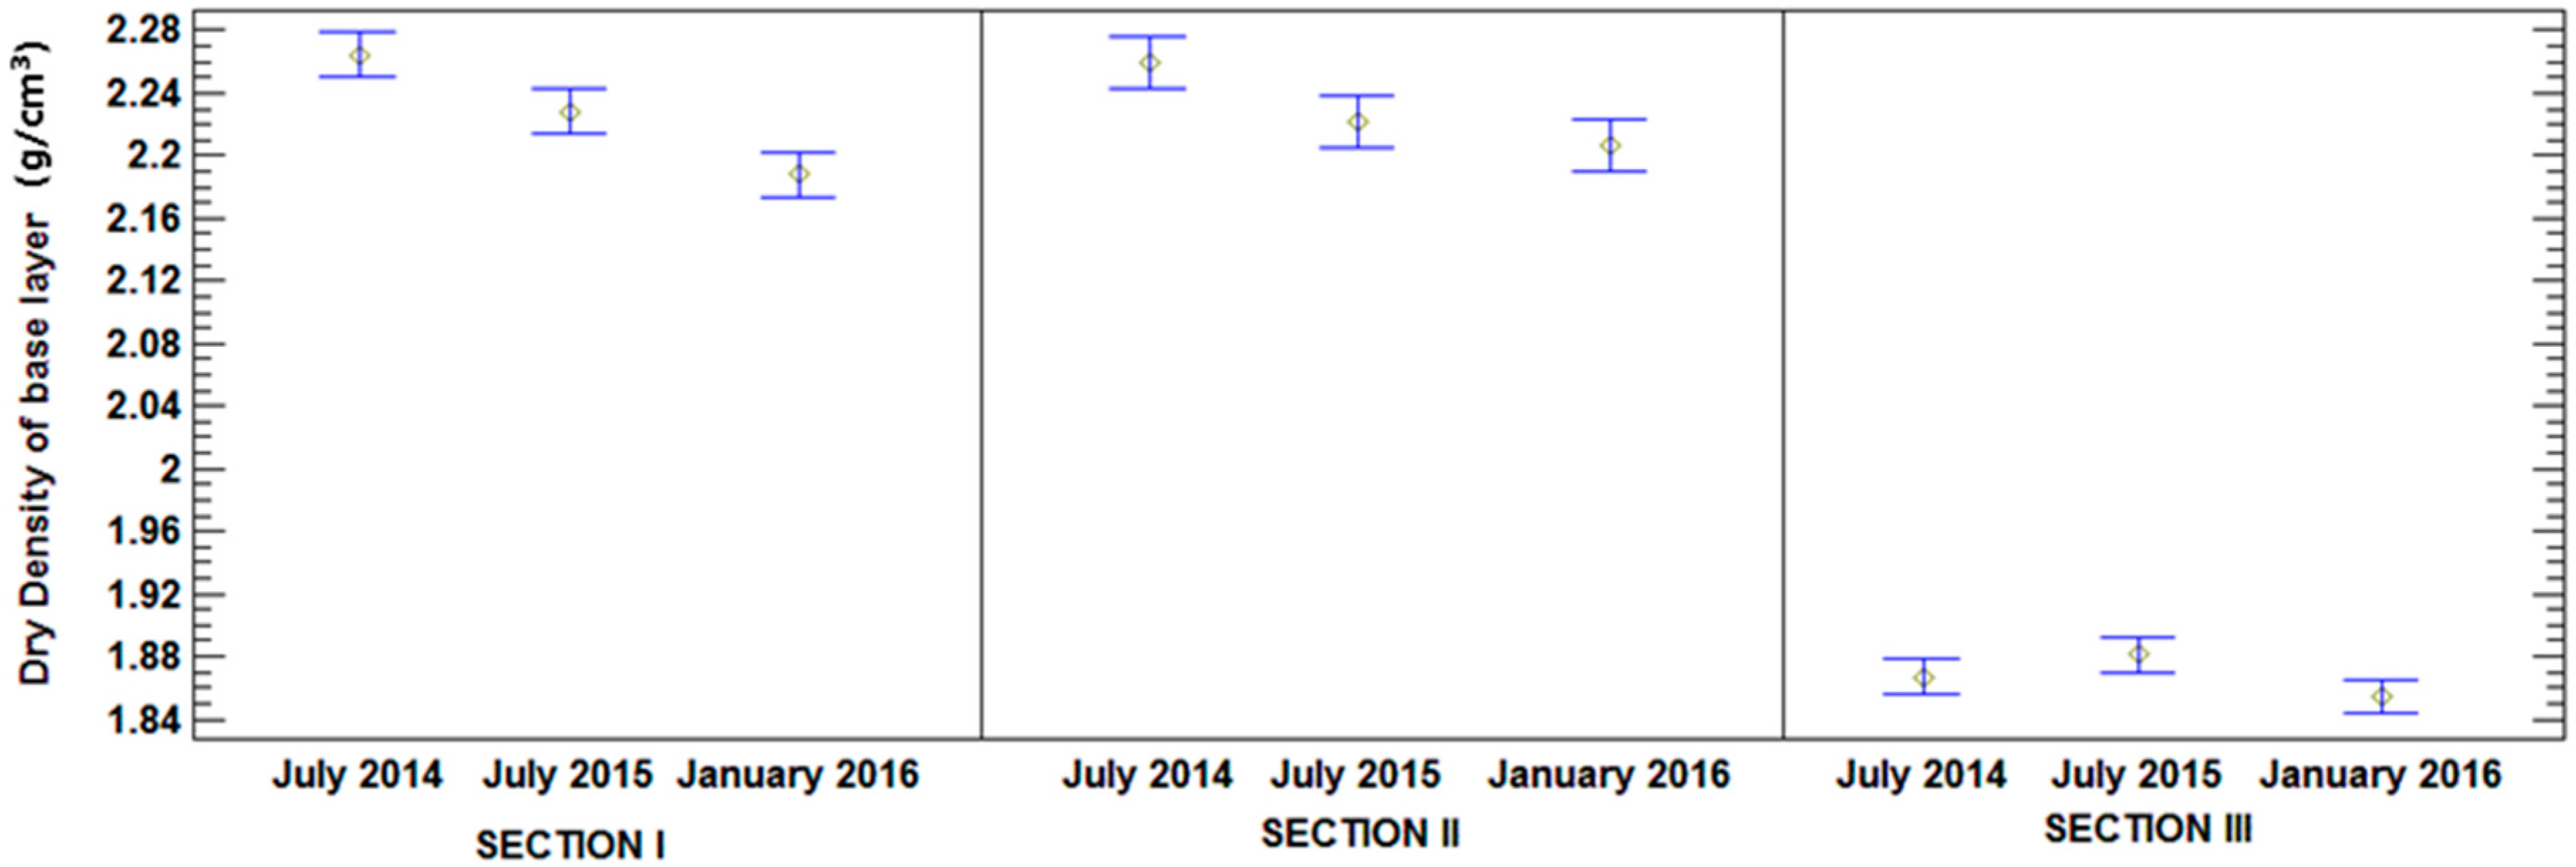
As can be seen in
Figure 13, according to overlapping of bars, Section III did not exhibit a decrease in dry density, there were no statistically significant differences in densities measured over time. However, sections I and II displayed statistically significant differences in their dry density values, which decreased over time. Density loss was mainly due to the base material. Both sections were made with NAs and were differentiated by the subbase materials. Thus, no significant difference was observed between the behaviours of sections I and II. Section I was made completely with NA, while the subbase of Section II was made with MRA. These results could be due to the higher absorption capacity of MRA (
Table 1), which alleviates the effects of precipitation and humidity.
Similar results were obtained by other authors. In sections with RA base layers, Jiménez et al. [
8] found no statistically significant differences over the first two years; however, heavy traffic produced a dry density increase of 4% during the third year. The same results were obtained by Jiménez et al. [
9] in sections made with an NA base layer. Although they observed no statistically significant differences, a small decrease in the dry density, approximately 2%, was observed. A similar decrease in the degree of compaction was observed in this study. Based on these results, the degree of compaction of the base layer made with RA exhibited a minor decrease compared to that of the base layer made with NA.
3.2.2. Field Control of the Evolution of the Deflection and Bearing Capacity
The behaviour of the base layer was analysed based on measurements collected using the FWD. The bearing capacity was analysed using reverse calculations of the modulus of rigidity of the road layers based on the registered deflections.
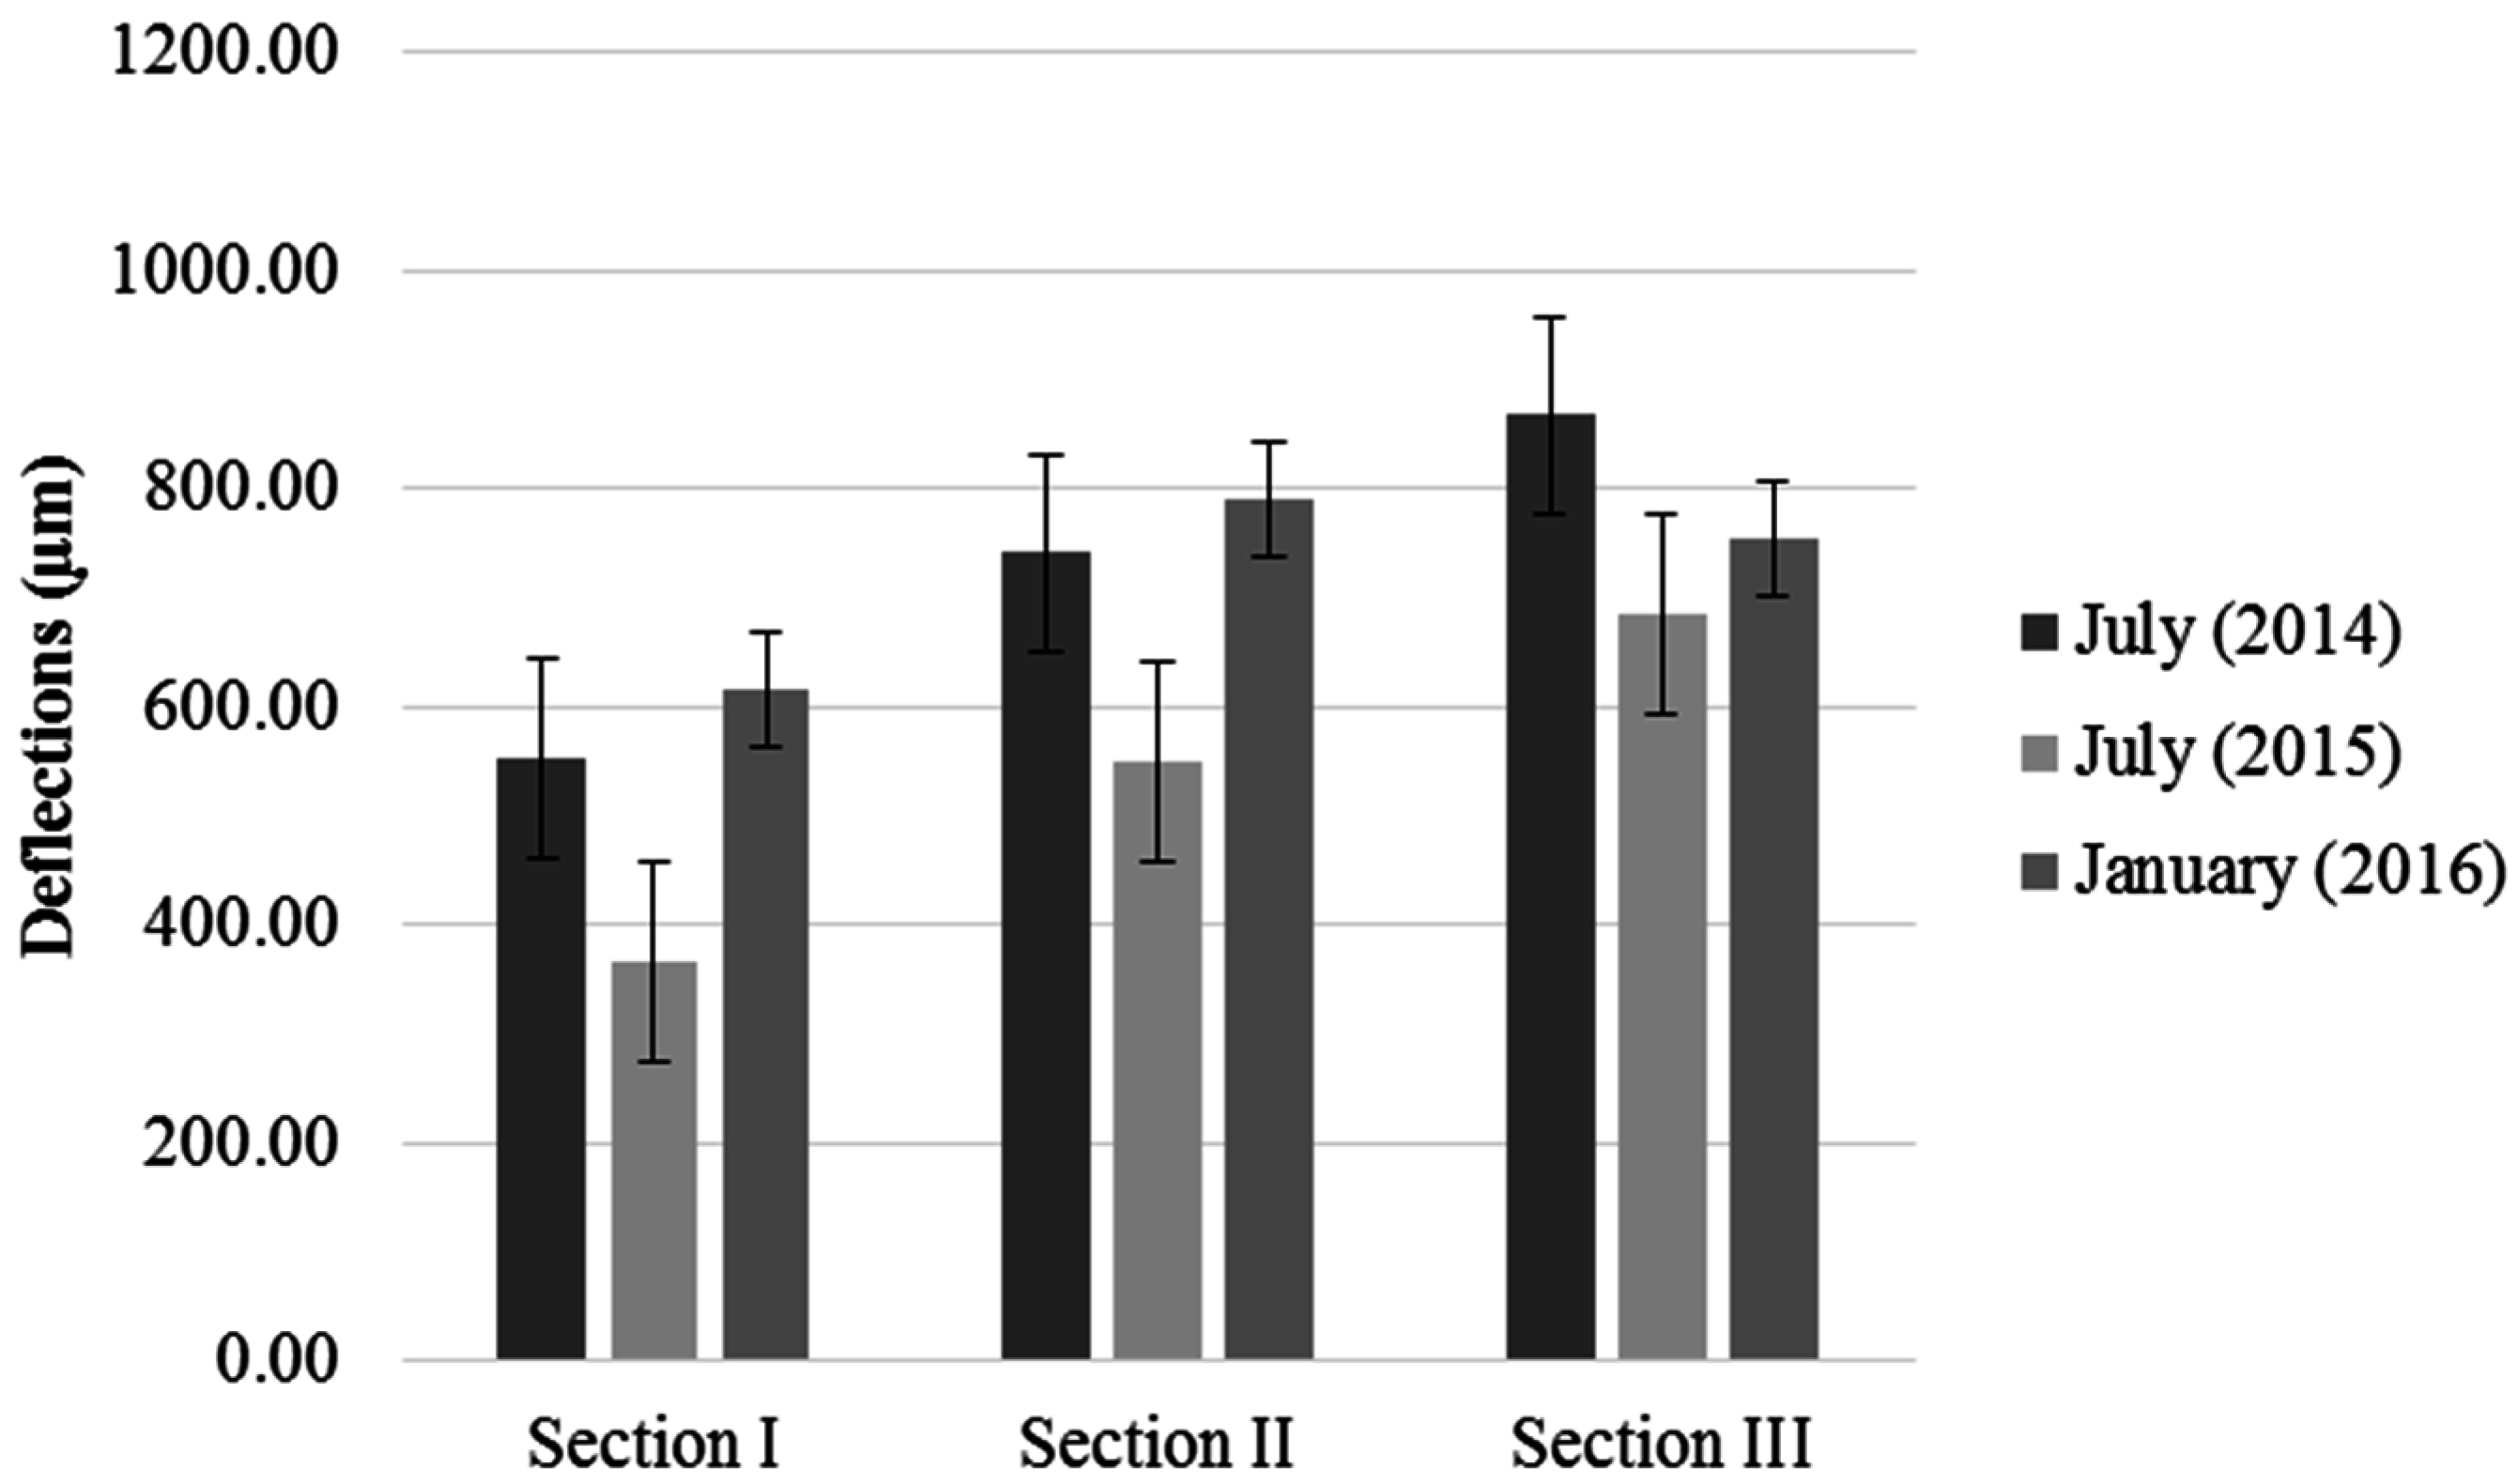
Figure 14 shows the evolution of deflection over time. The values are the average of 22 measurements per section.
The evolution of deflection was similar in Section I and Section II, the deflection decreases in July 2015 and increases in January 2016, the deflections in January 2016 were higher than in July 2014. In Section III, the deflection decreases in July 2015 and increases in January 2016, but does not outnumber January 2016. The deflections were lower in July 2015 than in July 2014, which had dry conditions and low soil moisture. The average deflections observed in sections I (336.51 µm) and II (549.81 µm) were lower than those observed in Section III (685.41 µm). Reductions of 33.65%, 25.81%, and 20.98% compared to July 2014 were observed in sections I, II, and III, respectively. After a large precipitation event in January 2016, high deflection was observed in all the sections. The average deflections were 616.13, 789.59, and 753.41 µm in sections I, II and III, respectively. In sections with base layers made of NA (Section I and II), the deflection at 18 months was greater than that obtained after completion of the section, as it increased by 11.61% in Section I and 6.54% in Section II. Although an increase in deflection was observed in Section III compared to previous measurements, the deflection at 18 months (January 2016) was 13.14% lower than that observed after completion of the section (July 2014).
To assess the effect of composition of section and date on deflections a similar ANOVA was performed.
Table 9 presents a summary of the results. No statistically significant differences were found between those levels that share overlapping bars.
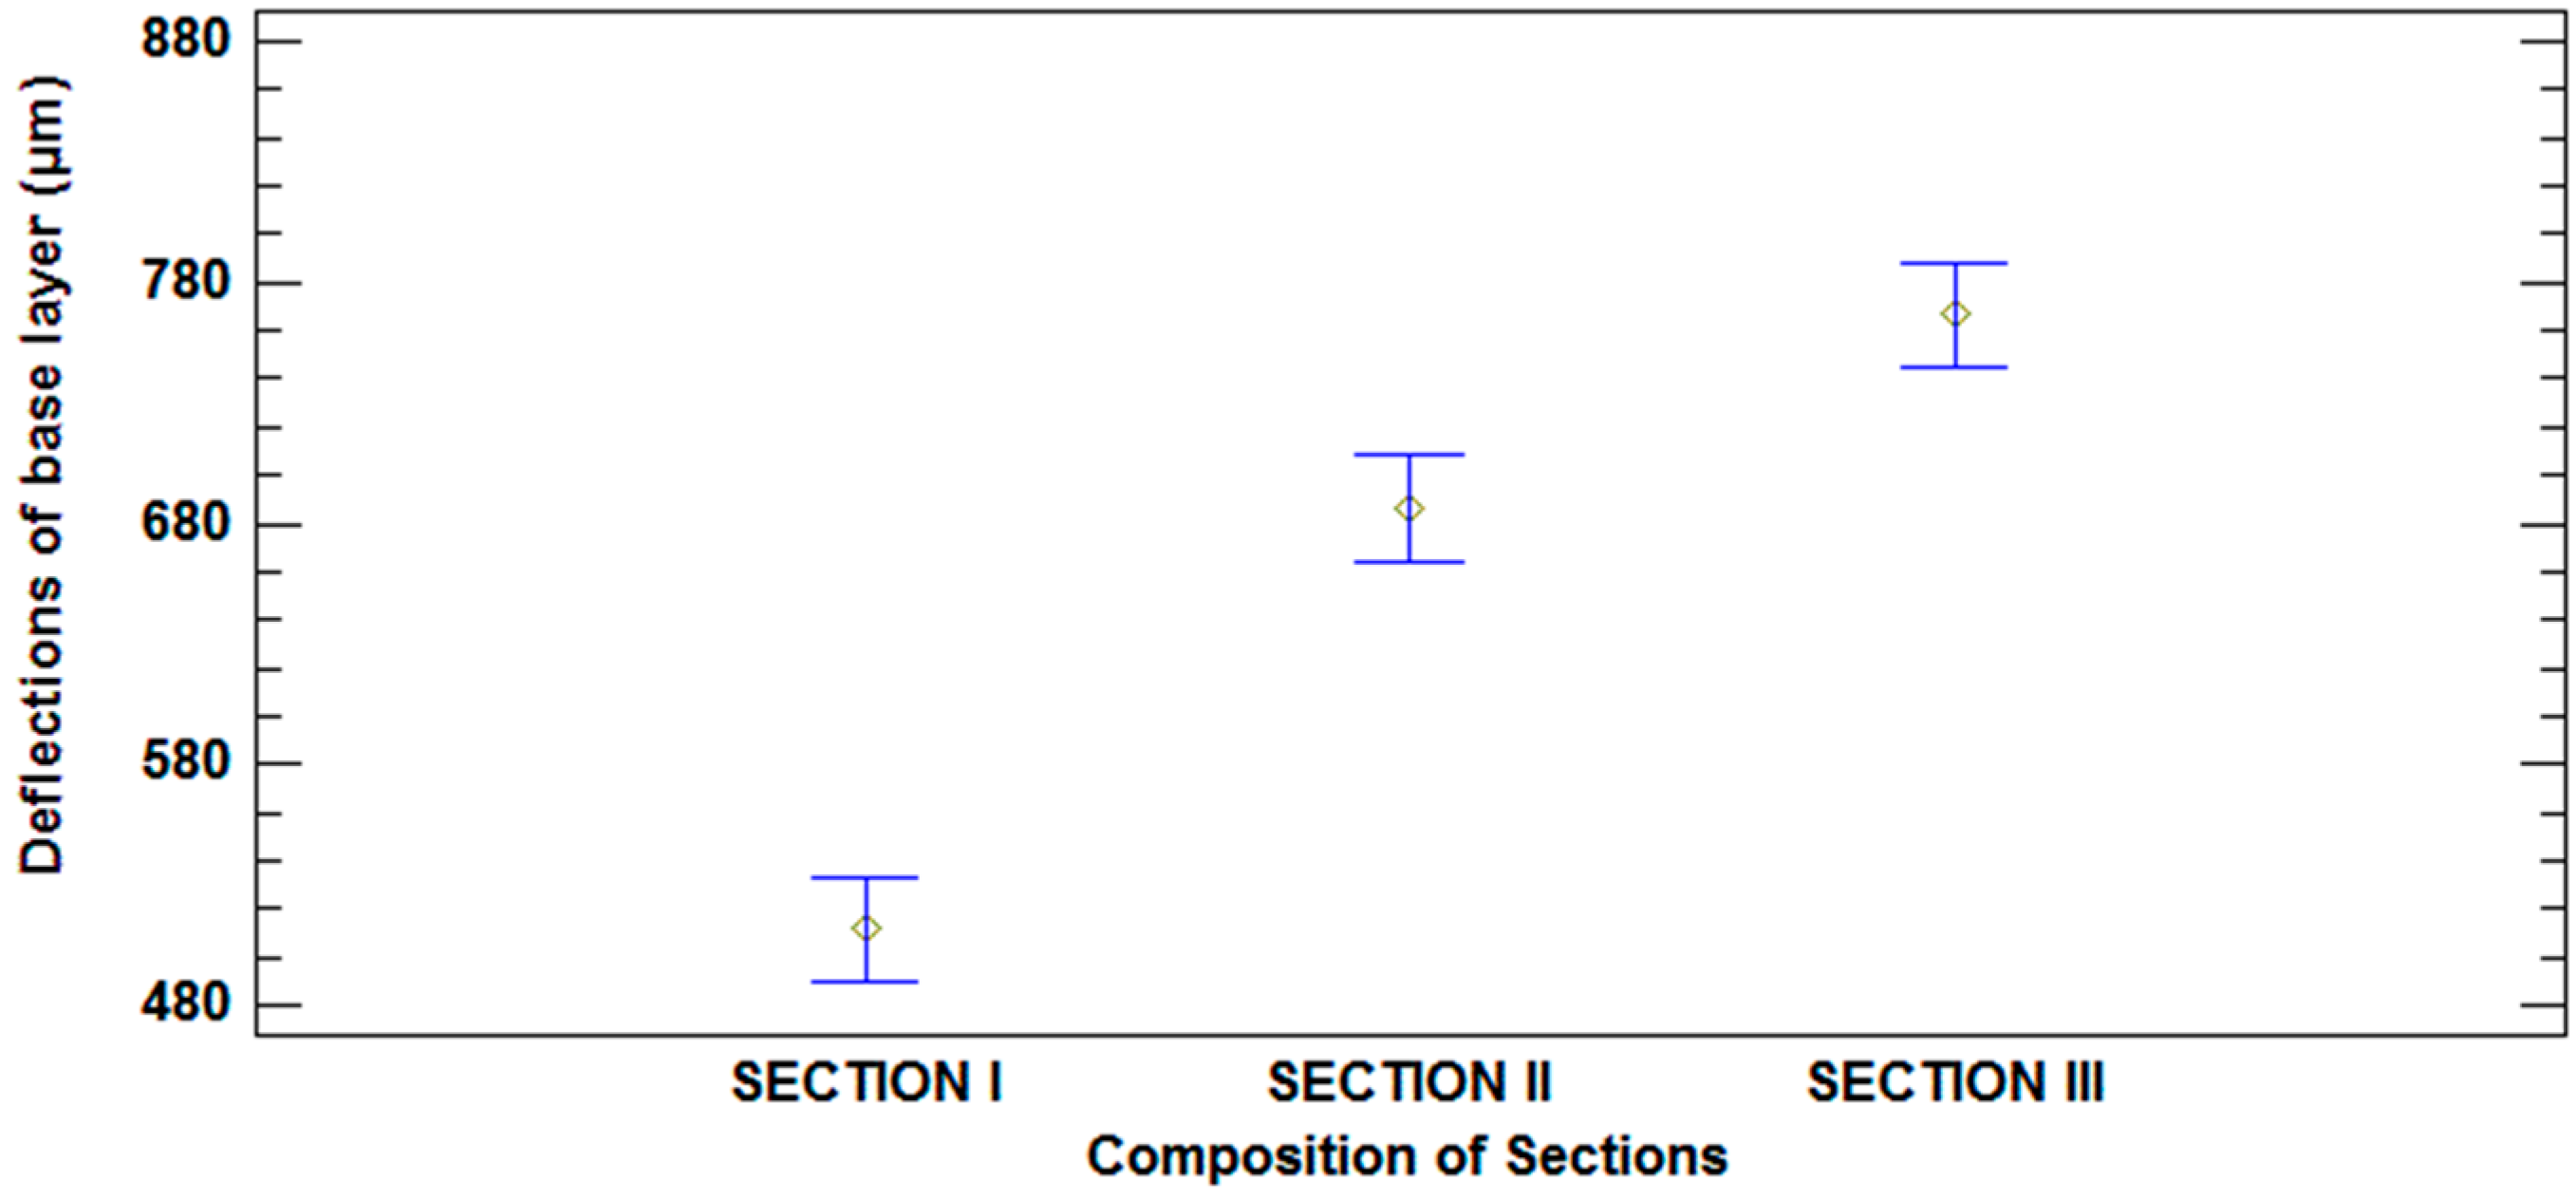
There were statistically significant differences at a 95% confidence level, as can be seen in
Figure 15.
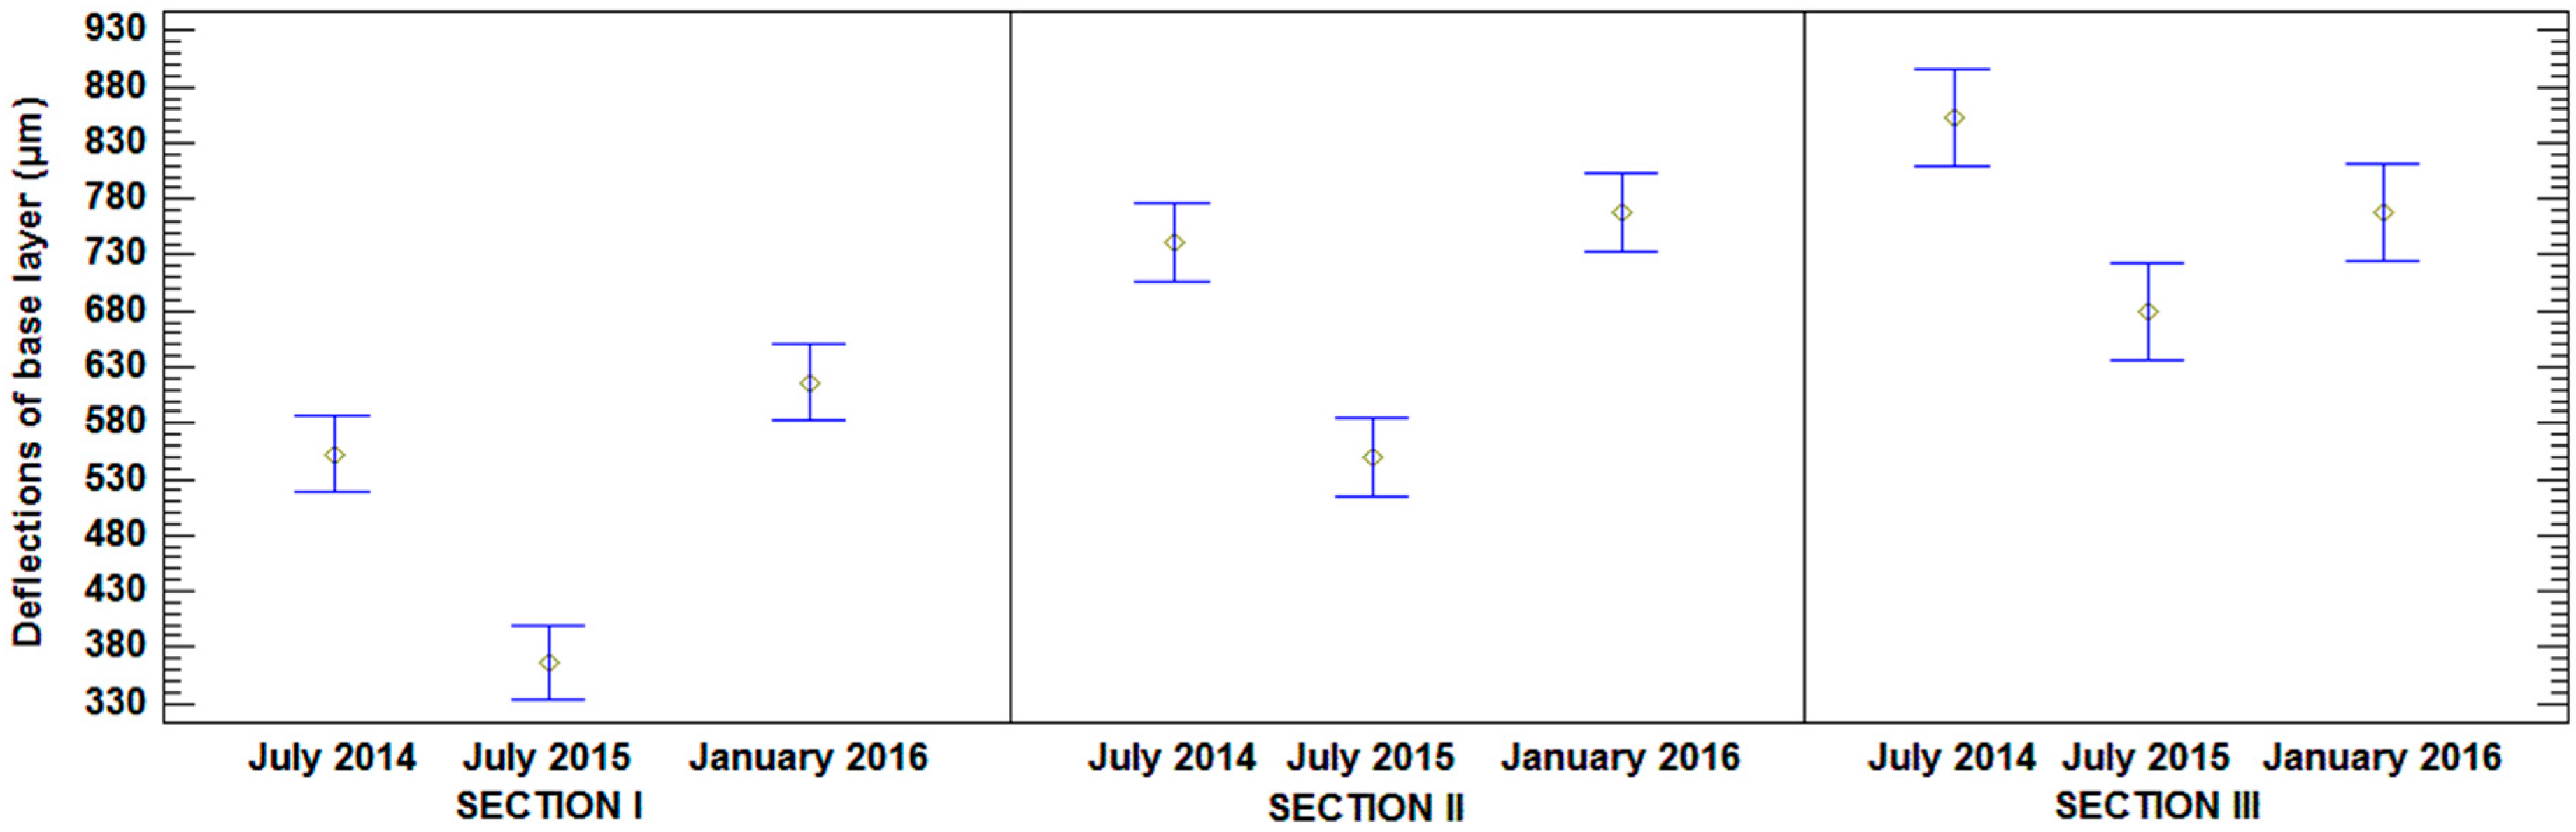
According to overlapping of bars in
Figure 16, there were significant differences in deflections measured over time in all sections, although it is appreciated that the tendency of deflections was different between them. Section I and II showed an increase of deflections with the onset of rains and, therefore, increased humidity. Deflections in January 2016 were higher than deflections in July 2014, after the execution of the road. However, this did not happen in Section III, in which the deflections increased in January 2016 compared to July 2015, but did not reach the deflections of July 2014. As in dry density, these results are due to the higher absorption capacity of MRA (
Table 1), which alleviates the effects of precipitation and humidity.
The elastic modulus was calculated from the deflections [
56].
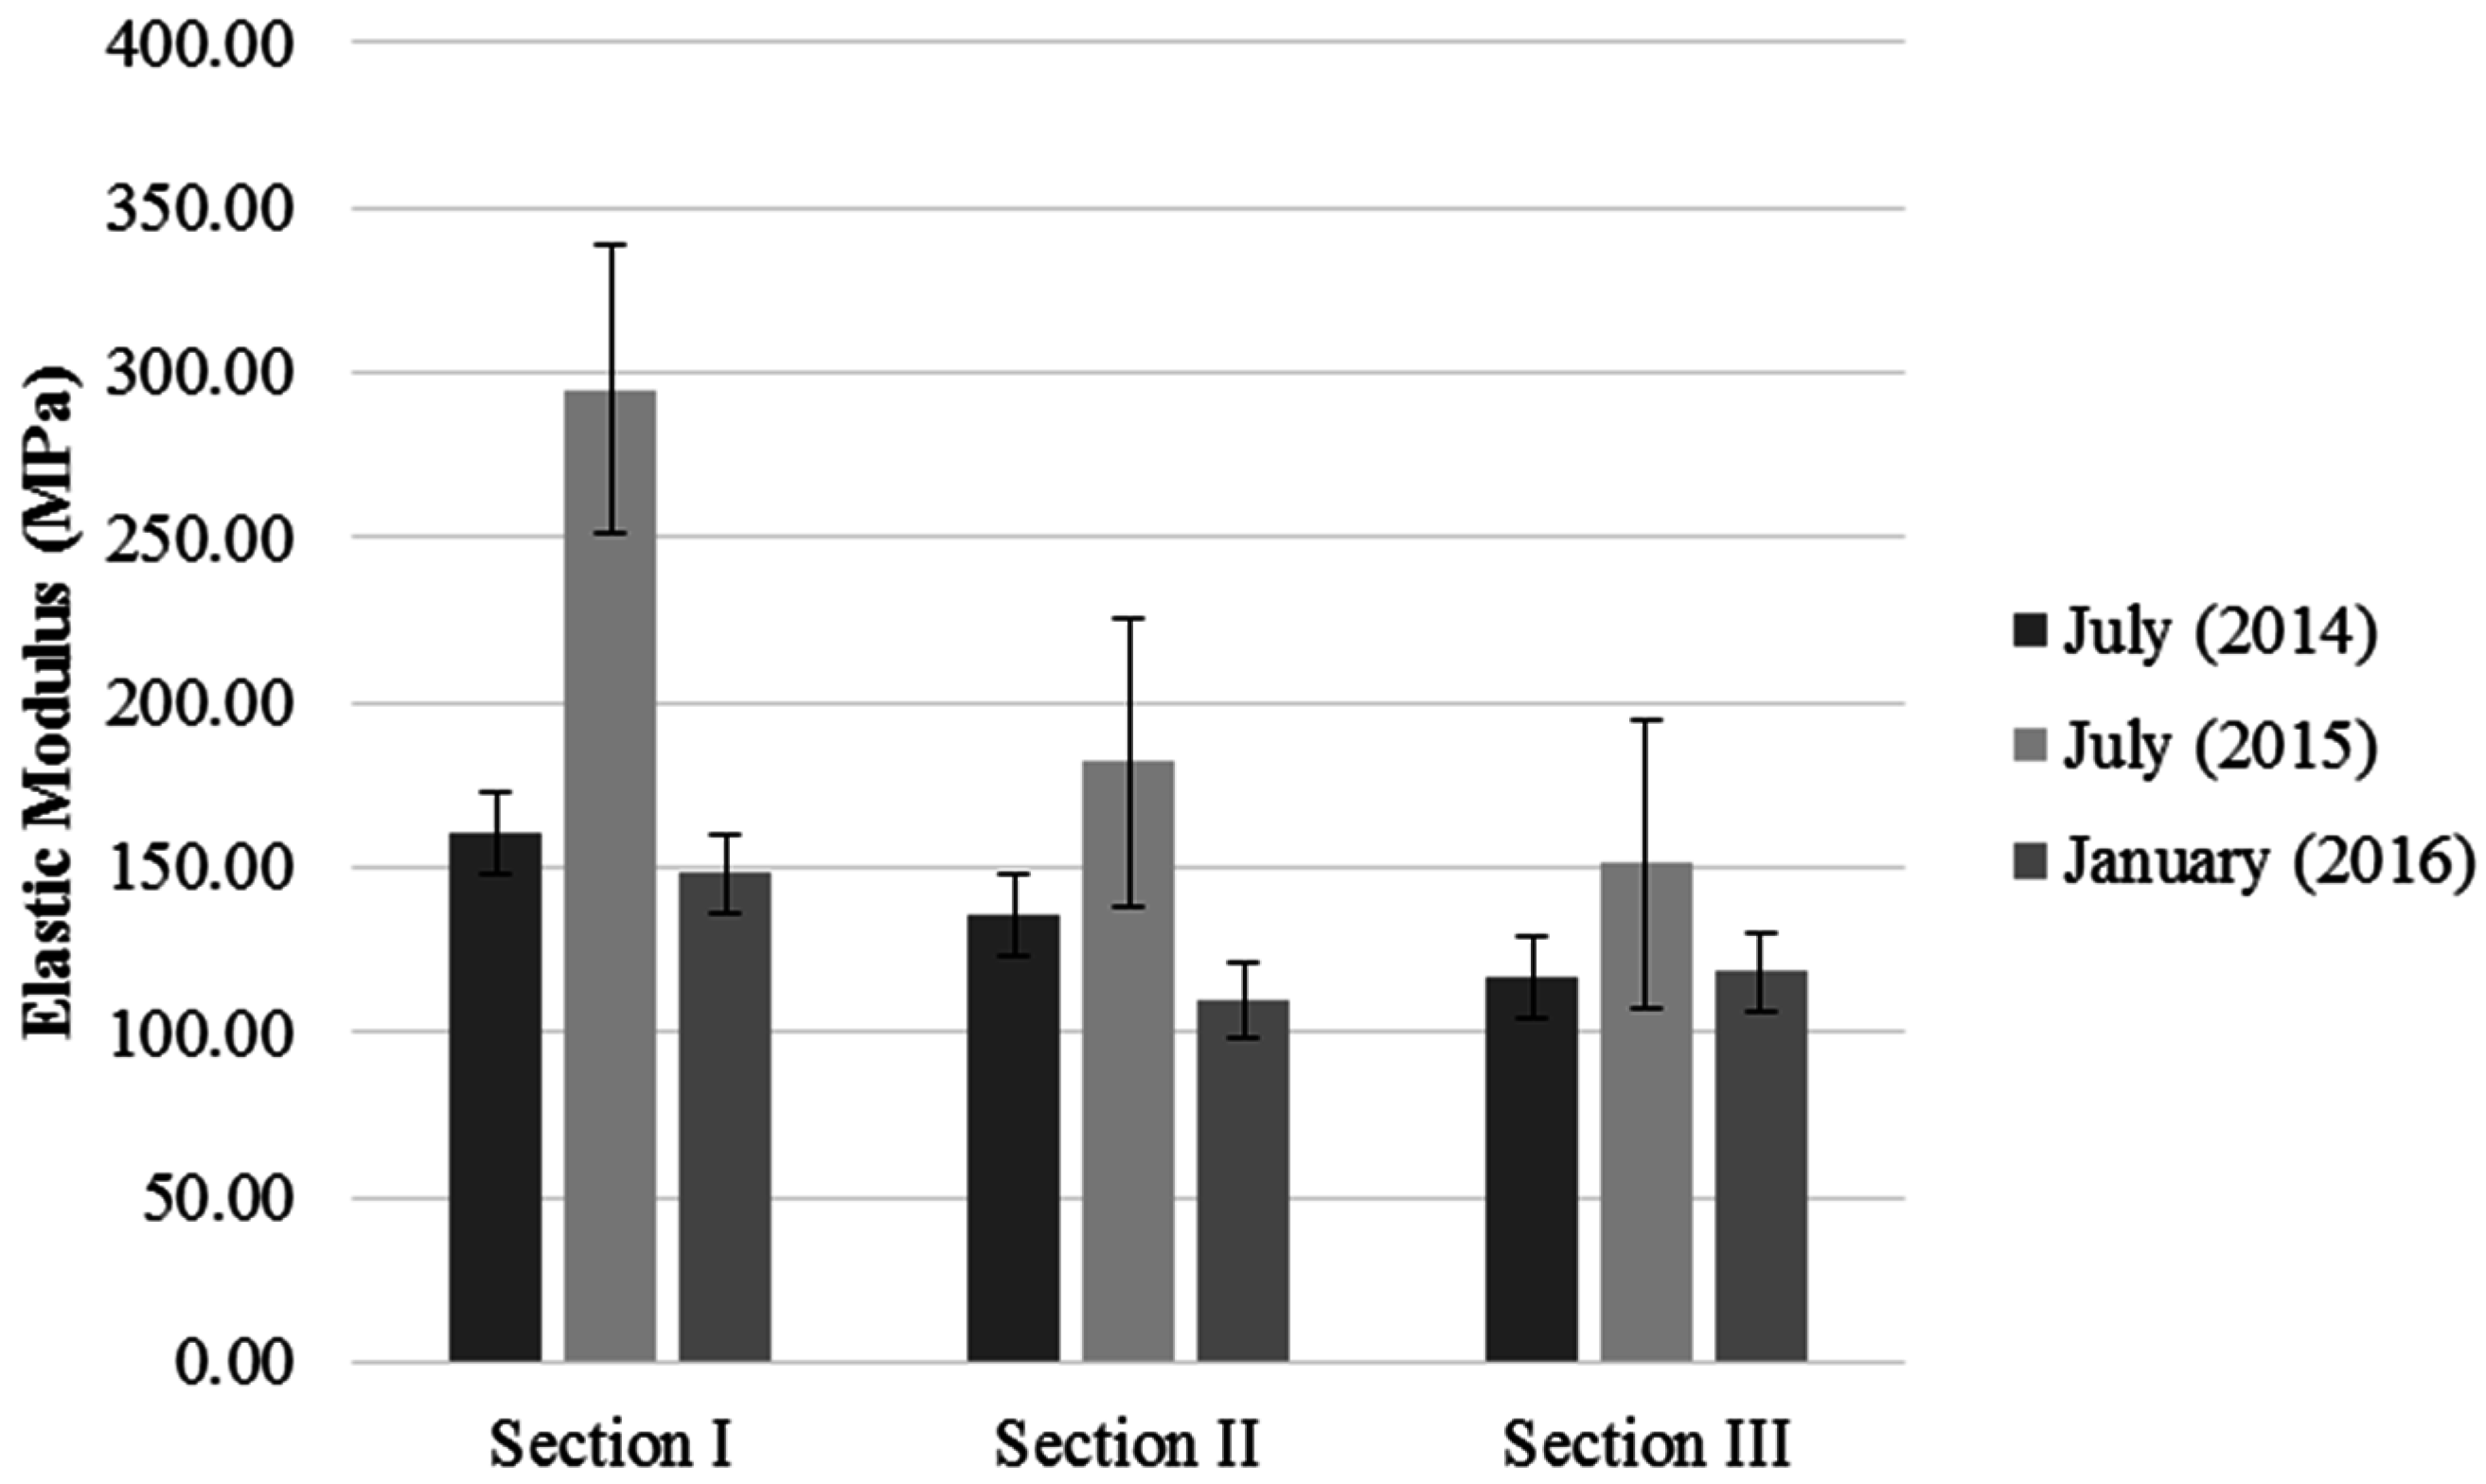
Figure 17 shows the evolution of the modulus of elasticity over time.
All of the elastic modulus values complied with the requirements of PG-3 [
22] (>80 MPa). In Section I, the elastic modulus decreased to 148.2 MPa in January 2016, a reduction of 7.62% from July 2014. In Section II, the elastic modulus was 109.9 MPa in January 2016, a decrease of 18.72% from July 2014. In Section III, the elastic modulus was 118.2 MPa in January 2016, a decrease of 1.04% compared to July 2014. The increase in the elastic modulus in Section III is due to the pozzolanic activity or hydraulic properties of the RA cement [
10,
57,
58].
These results are consistent with the moisture data shown in
Table 7. In July 2015, the soil moisture content was low, and deflections were small; therefore, the material behaved more rigidly. However, deflection increased and the modulus of elasticity decreased when the moisture content increased in January 2016.
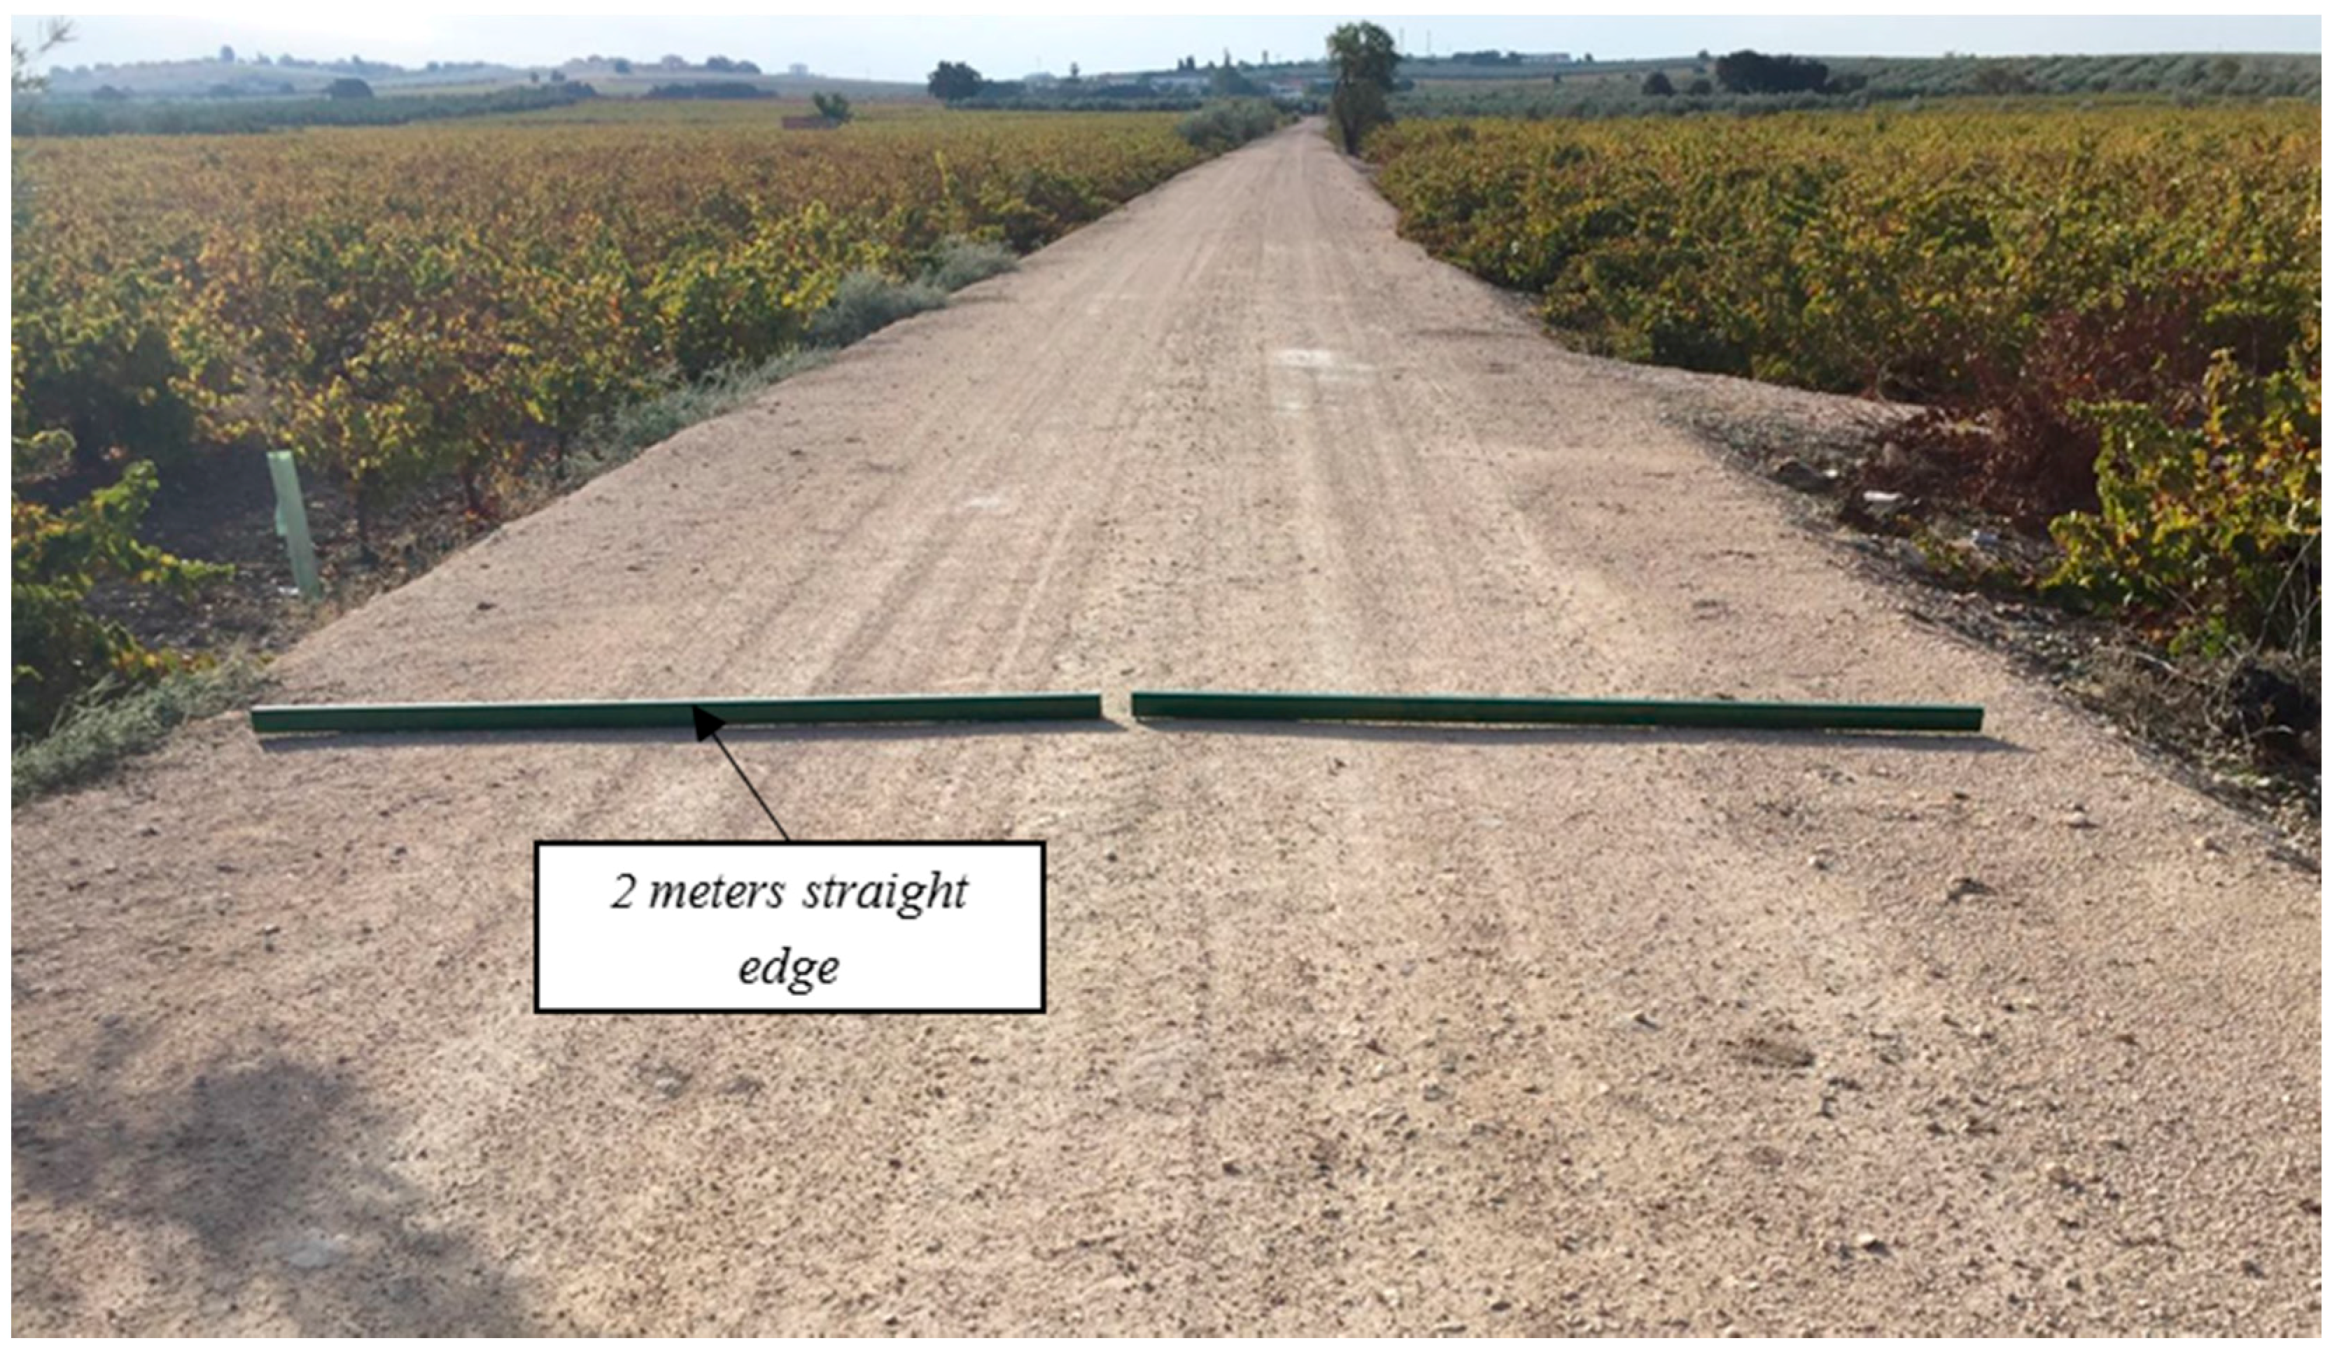
3.3. Field Control of the Rut Depth
The permanent vertical deformation of the road surface is the main failure mechanism for unpaved roads. Rutting is due to permanent deformations in any of a pavement’s layers or subgrade usually caused by consolidation or lateral movement of the materials due to traffic loading. The combination of these actions, coupled with wet weather conditions, increase the vertical deformations of the road surface resulting in severe rut depth and potholes [
59,
60]. Once the wheel path is too deep, driving can be dangerous due to the instability of the surface layer and its rutting will ultimately leave the road with permanent deterioration, which leads to the requirement to reshape the entire cross section [
59].
Table 10 shows the measurement of the rut depth to the left and right wheel path for each section.
The AASHTO Guide for Design of Pavement Structures [
61] suggests that the allowable rut depth for unpaved roads is between 25.4 mm and 50.8 mm (1 and 2 inches). As seen in
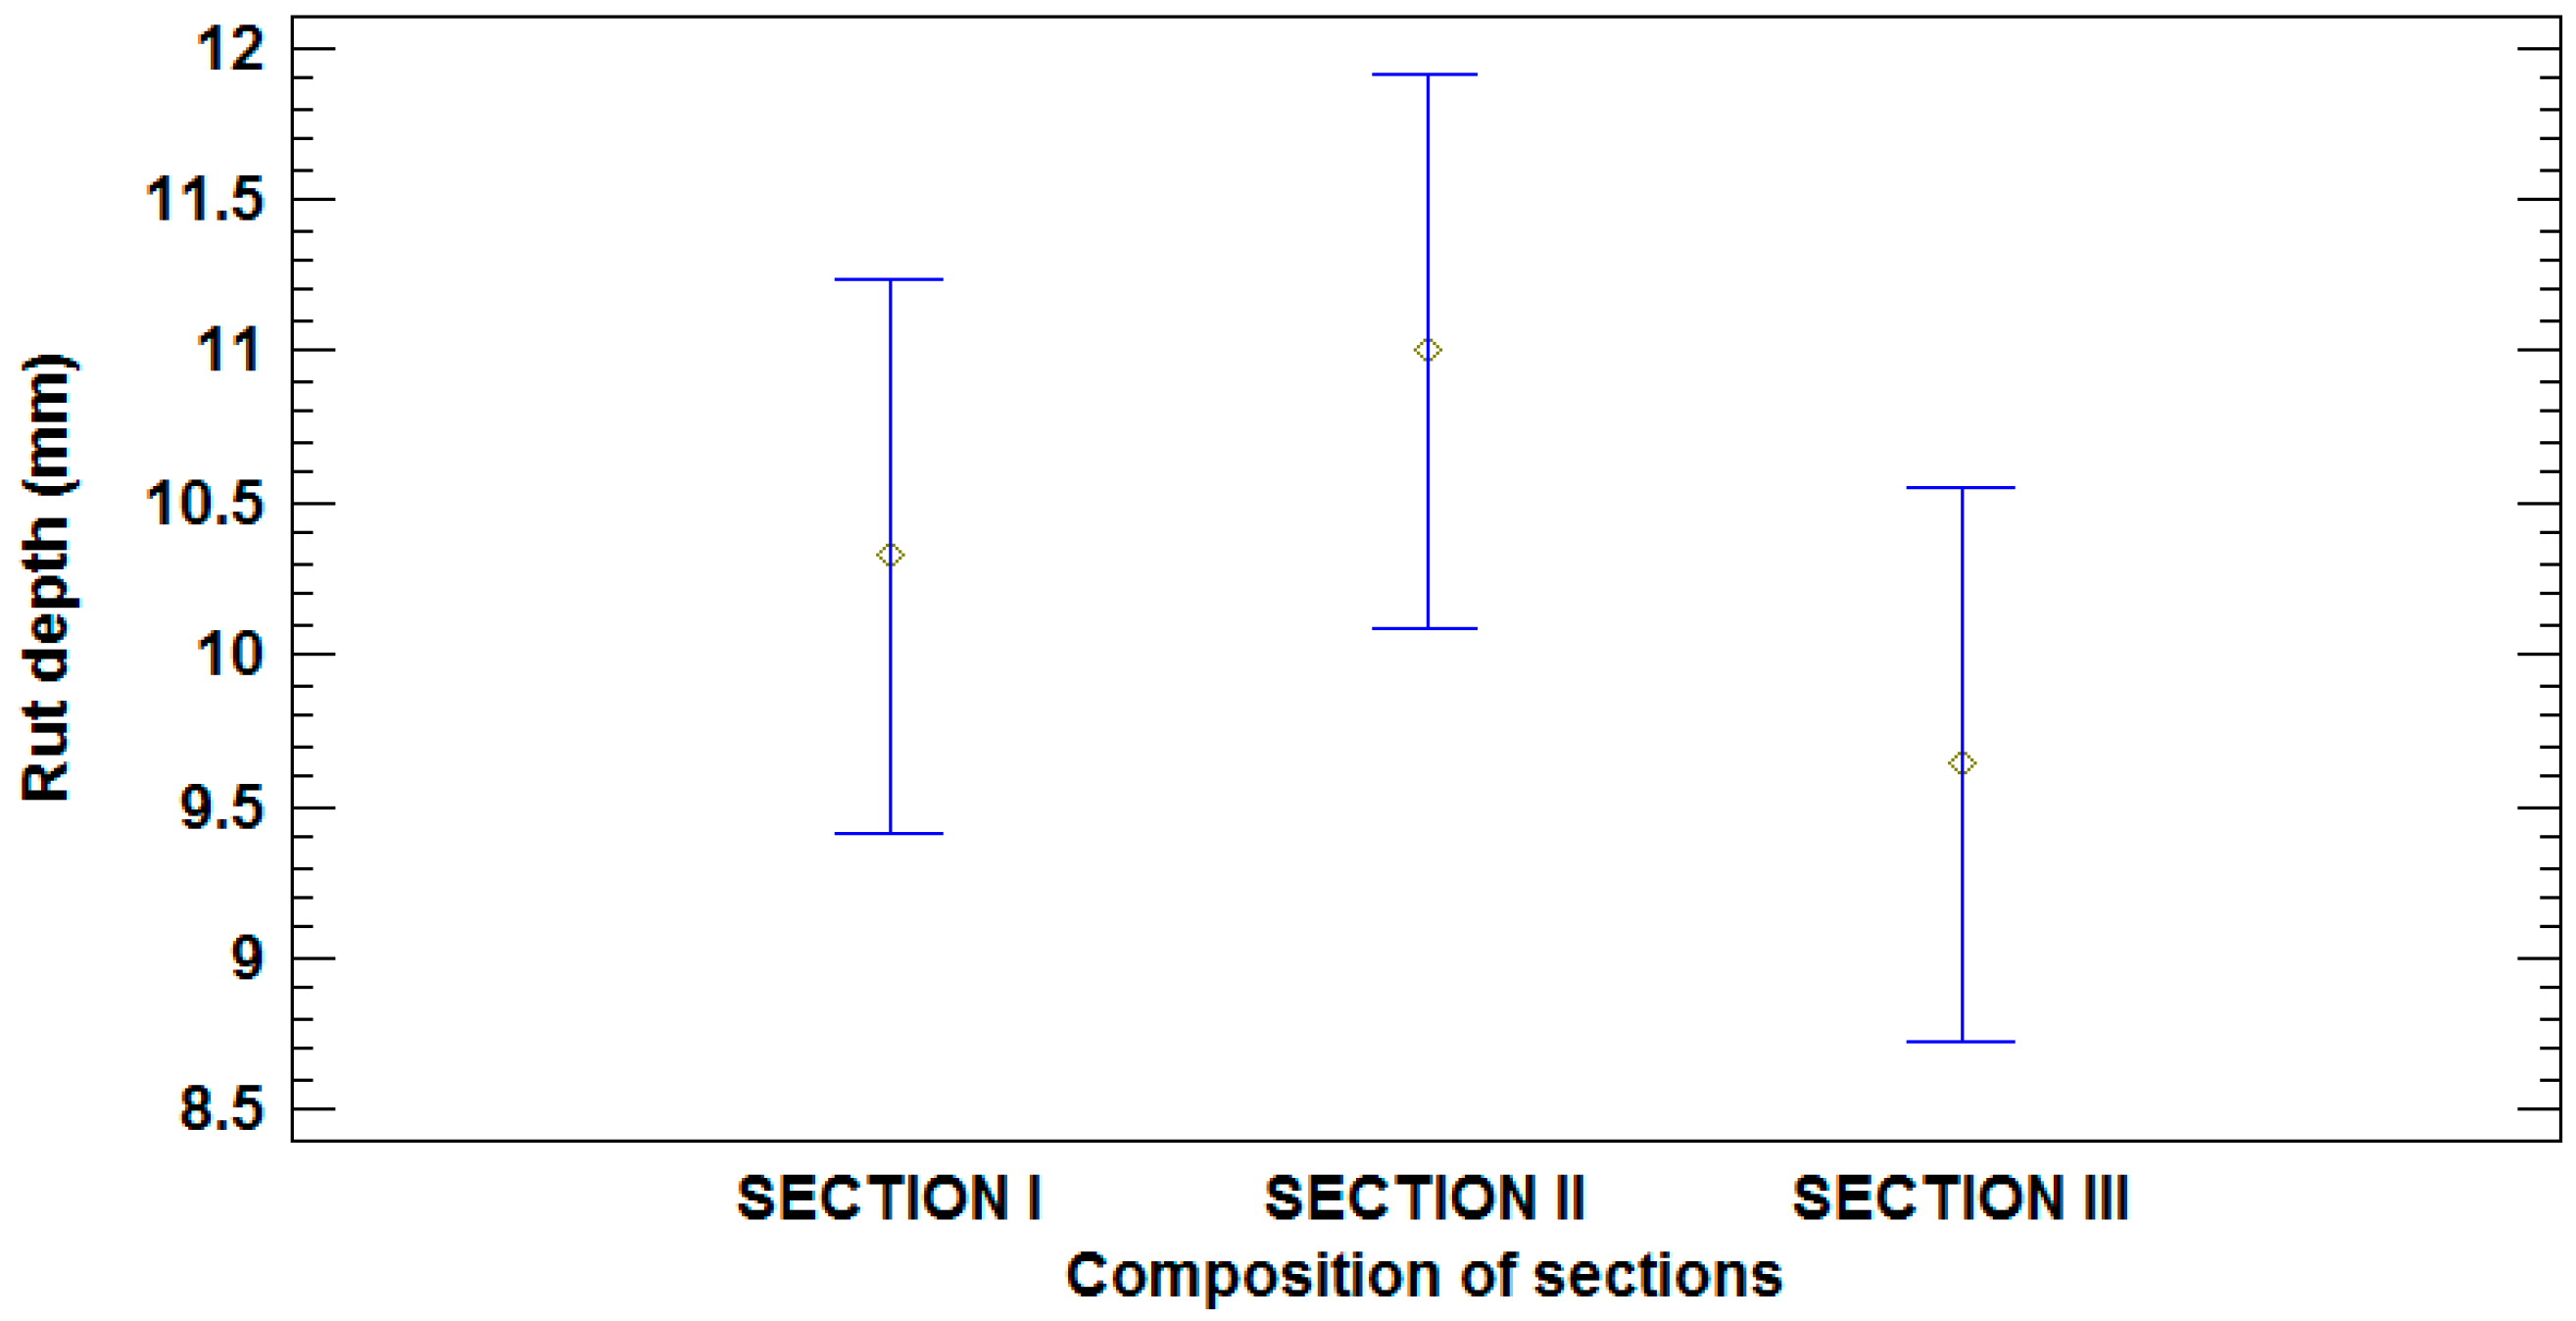
Table 10, in any of the positions tested these values have not been exceeded. All values are less than 20 mm, with the average close to 10 mm. With regard to Section I, with an average of 10.3 mm, the rut depth in Section II increased by 6.5% and Section III decreased by 6.6%.
The Guideline of Pavement Surface Condition Rating Manual [
62] suggests that there is a low level of severity for a rut depth of less than 10 mm, a medium level of severity for rut depth between 10-20 mm, and high severity level for rut depth greater than 20 mm. Considering that these values are for paved roads, the unpaved road has performed correctly, since Section III was below 10 mm of rut depth and Sections I and II presented rutting close to 10 mm.
To assess the composition effect of sections on rut depth, a similar ANOVA was performed.
Table 11 presents a summary of these results, finding statistically non-significant differences between those levels that share overlapping bars (
Figure 18).


