
Evaluation of the Supporting Mounts of a Three-in-One Electric Drive Unit Using a Hybrid Simulation Model


1
Fundamental NVH Technology Cell, Hyundai Mobis, Seoul 06141, Republic of Korea
2
Department of Mechanical Engineering, Seoul National University, Seoul 08826, Republic of Korea
3
School of Mechanical Design Engineering, Pukyong National University, Busan 48513, Republic of Korea
*
Authors to whom correspondence should be addressed.
Machines 2023, 11(11), 1026; https://0-doi-org.brum.beds.ac.uk/10.3390/machines11111026
Submission received: 8 October 2023
/
Revised: 3 November 2023
/
Accepted: 14 November 2023
/
Published: 16 November 2023
(This article belongs to the Special Issue 10th Anniversary of Machines—Feature Papers in Electrical Machines and Drives)
Abstract
:The 3-in-1 electric drive unit (EDU) has the advantage of increasing the motor size for a larger output, and the reducer can be a compact layout designed to incorporate three key components—the drive motor, inverter, and reducer—into a single main body. This paper explores a hybrid simulation model for a 3-in-1 electromechanical drive unit (EDU) and its supporting components, consisting of the gear drive unit (GDU) mount, the motor mount, and the roll rod mounts. The synthesis of these sub-components, including the 3-in-1 EDU itself, the three supporting mount modules, and a rigid-body finite element model, is presented. The dynamics of the 3-in-1 EDU were determined through an experimental modal test. Meanwhile, the dynamic stiffness and damping coefficients of the three supporting mounts were measured using an elastomer tester across a frequency range from 10 Hz to 1000 Hz. To evaluate the sensitivity of each mount, the total spectral responses of the 3-in-1 EDU were compared under a torque input, considering rigid connections for each mount in contrast to their original dynamic stiffness. Through installing a rollrod mount, the optimal rigid connection was identified to control the dynamic response of the 3-in-1 EDU hybrid model. Furthermore, simulation results for the rigid connections in each mount were validated against experimental findings, confirming that the rigid rollrod mount configuration provided the best results.
1. Introduction
The mechanical component referred to as a ‘vibration isolator’ or ‘mount module’ fulfills the role of maintaining the supporting system at a desired height while simultaneously preventing the transmission of vibrational energy generated during operation [1,2,3,4,5,6,7,8,9,10,11]. Within the operational processes of each subcomponent, the mount module tries to mitigate the interference among adjacent subcomponents to the greatest possible extent and minimizes the reactive forces generated during operation, thereby favorably securing the desired dynamic characteristics. Mount modules can be categorized into ‘passive’ [12,13,14,15,16], ‘semi-active’ [17,18,19,20], and ‘active’ [21,22,23,24,25] types based on their operational modes. Passive mounts can encompass a diverse range of forms, such as those utilizing the elasticity of rubber or polyurethane or incorporating geometrically structured coil springs or air springs. To create decoupled modes of the supporting system, a vibration isolation device was proposed for microlevel excitation via the implementation of different directional coil spring stiffnesses [12] or their installation [13]. A non-linear six-degrees-of-freedom (DOFs) vibration isolator was applied to the Stewart platform configuration [14], and novel vibration isolators were proposed with viscoelastic materials for rotating machinery [15] or a tuned mass-damper-inerter for the five-DOFs model of the statue [16]. However, owing to the requirement for separate actuators or controllers, “semi-active” or “active” mount modules may incur increased costs. Recently, in the context of transportation vehicles, “magnetorheological (MR)-type” mount modules have exhibited excellent operational performance. However, this is accompanied by the potential drawback of increased weight.
The 3-in-1 electric drive unit (EDU) is a product which simplifies the drive motor, inverter, and reducer into a single unit. Compared to the conventional setup of three individual components, this product is a vital component for electric vehicle propulsion, with advantages such as enhanced spatial efficiency and heightened efficiency in power transmission. However, addressing the challenges related to heat dissipation from the drive motor and minimizing vibrations during operation presents a burden that necessitates the application of diverse engineering techniques. To enhance NVH (noise, vibration, and harshness) performance, the 3-in-1 EDU was supported by three mounts, each corresponding to the gear drive unit (GDU) mount, motor mount, and rollrod mount, depending on the area of support.
The dynamics of a mechanical system can be identified through examining the frequency response function (FRF) between the input and output locations in the frequency domain, assuming that the system adheres to linearity [26,27]. In cases where the target system displays a high degree of complexity or where obtaining data from certain parts of the structure proves challenging, amalgamating FRFs from different subcomponents can aptly portray the collective FRFs of the entire system. The FRF-centered substructuring technique offers the capacity to predict the linear conduction of the system of interest through utilizing multiple FRFs from distinct subcomponent locations [28,29,30,31]. FRFs can be acquired either via modal testing or through computing them using a finite-element model (FEM), affording flexibility in the selective synthesis of FRFs through experimental testing or modal analysis. The hybrid model demonstrated its effectiveness in segmenting the total system into discrete subparts: one procured experimentally and the other fashioned through the FEM. Through employing the FRF-based substructuring method, this strategy proficiently predicts the overall system dynamics [32,33,34,35].
This study investigated the simulation of operational states using a hybrid simulation model that combines experimental data and a finite element model, aiming to achieve an optimized mount design for the three-point supported electric vehicle powertrain. The dynamic stiffness values of the three mounts were experimentally measured for the frequency range of interest, which spanned from 10 Hz to 1000 Hz, using elastomer test equipment. The frequency range of the mounted devices was based on the noise, vibration, and harshness (NVH) performance of the 3-in-1 EDU system from the supplier. The modal parameters of the supported entity, the 3-in-1 EDU, were measured using separate experimental modal analyses. The hybrid simulation model of the 3-in-1 EDU utilizes the measured model parameters, dynamic stiffness values of the three mount modules, and rigid finite element models for the mounting portions of the three mounts in the form of arbitrary rectangular shapes. The dynamic response values for the established hybrid simulation model of the 3-in-1 EDU were obtained and validated through comparing them with experimental data measured on a powertrain dynamometer (AVL/Germany). Both results confirmed that the rigid rollrod mount was the best choice of supporting condition over the original one by means of minimizing the spectral response range between 10 and 1000 Hz. Therefore, the proposed hybrid simulation model is the optimal solution for selecting the dynamic stiffness of the supporting mounts to enhance NVH performance.
2. Theoretical Background
It is possible to predict the FRF in an assembled complex system using the combination of FRFs of sub-components according to the FRF-based sub-structuring technique as follows: If an assembled system comprises n substructures and all assembled locations are certain locations , the displacement () and force () applied to the assembly can be expressed in Equations (1) and (2) [28].
where subscripts and are the coordinates of the assembled system and substructures, respectively. Equations (1) and (2) can be defined as the compatibility and equilibrium, respectively, and are formulated as follows:
where refers to the coordinates of the substructures, and both and denote the receptance matrices of the assembly and substructure, respectively. If the receptance matrices of two substructures and exist, both matrices can be expressed as follows:
The receptance of the assembled system can be formulated below.
where scripts and denote the master and internal coordinates, respectively, and scripts and represent the joint and nonjoint coordinates, respectively. This concept is called the receptance coupling (RC) method [28], and several disadvantages can be overcome through introducing a generalized receptance coupling (GRC) method [29]. If subscripts and denote the internal coordinates of the substructure and assembly, and subscripts , and represent the joint coordinates, the receptance matrix formula can be expressed as Equations (8) and (9), respectively.
For the substructure, the joint coordinates and can be formulated for the conditions of compatibility and equilibrium, as follows:
For non-joint coordinates, the coupling relationship should be acceptable.
Under the coupling relationship between the assembly and substructure, the receptance matrix formulation can be expressed in a simple form in Equation (14).
The GRC method was used for the hybrid simulation model of the 3-in-1 EDU system with a supporting mount module.
3. Dynamic Mechanical Property Test of Support Mounts
Owing to the 3-point support setup of the 3-in-1 EDU, its dynamics may be influenced by the dynamic characteristics of the mounting modules, and the effective orientation of each mount may vary depending on the mounting position. The roll mount provides roll control in the lateral direction (X-direction), while the remaining two mounts, namely the gear drive unit (EDU) mount and the motor mount, each play a role in supporting the structure along the three axes. The configuration of the three mounts on a 3-in-1 EDU is shown below (Figure 1).
The test equipment, an Elastomer Test System (Model 831, MTS Systems Corporation, Eden Prairie, MN, USA), was employed to perform elastomer tests across a frequency range of 10 Hz to 1000 Hz, which represents the maximum available frequency band. The assessment was divided into two or three frequency intervals, to improve the efficiency of the elastomer tests. The test specifications of the three mounts are listed in Table 1. Considering the operational conditions, the rollrod mount required testing only in the X-direction, whereas the other two mounts required testing in all three directions. The test specifications are summarized in Table 1, and the measured dynamic stiffness results are shown in Figure 2. The real and imaginary values represent the dynamic stiffness and viscous damping coefficient of the tested mount, respectively. Several peak values were found at frequencies greater than 500 Hz because of the resonance frequency of the mount structure at the excitation frequency point.
4. Hybrid Simulation Model of 3-in-1 Electric Drive Unit
4.1. Experimental Modal Test of 3-in-1 EDU
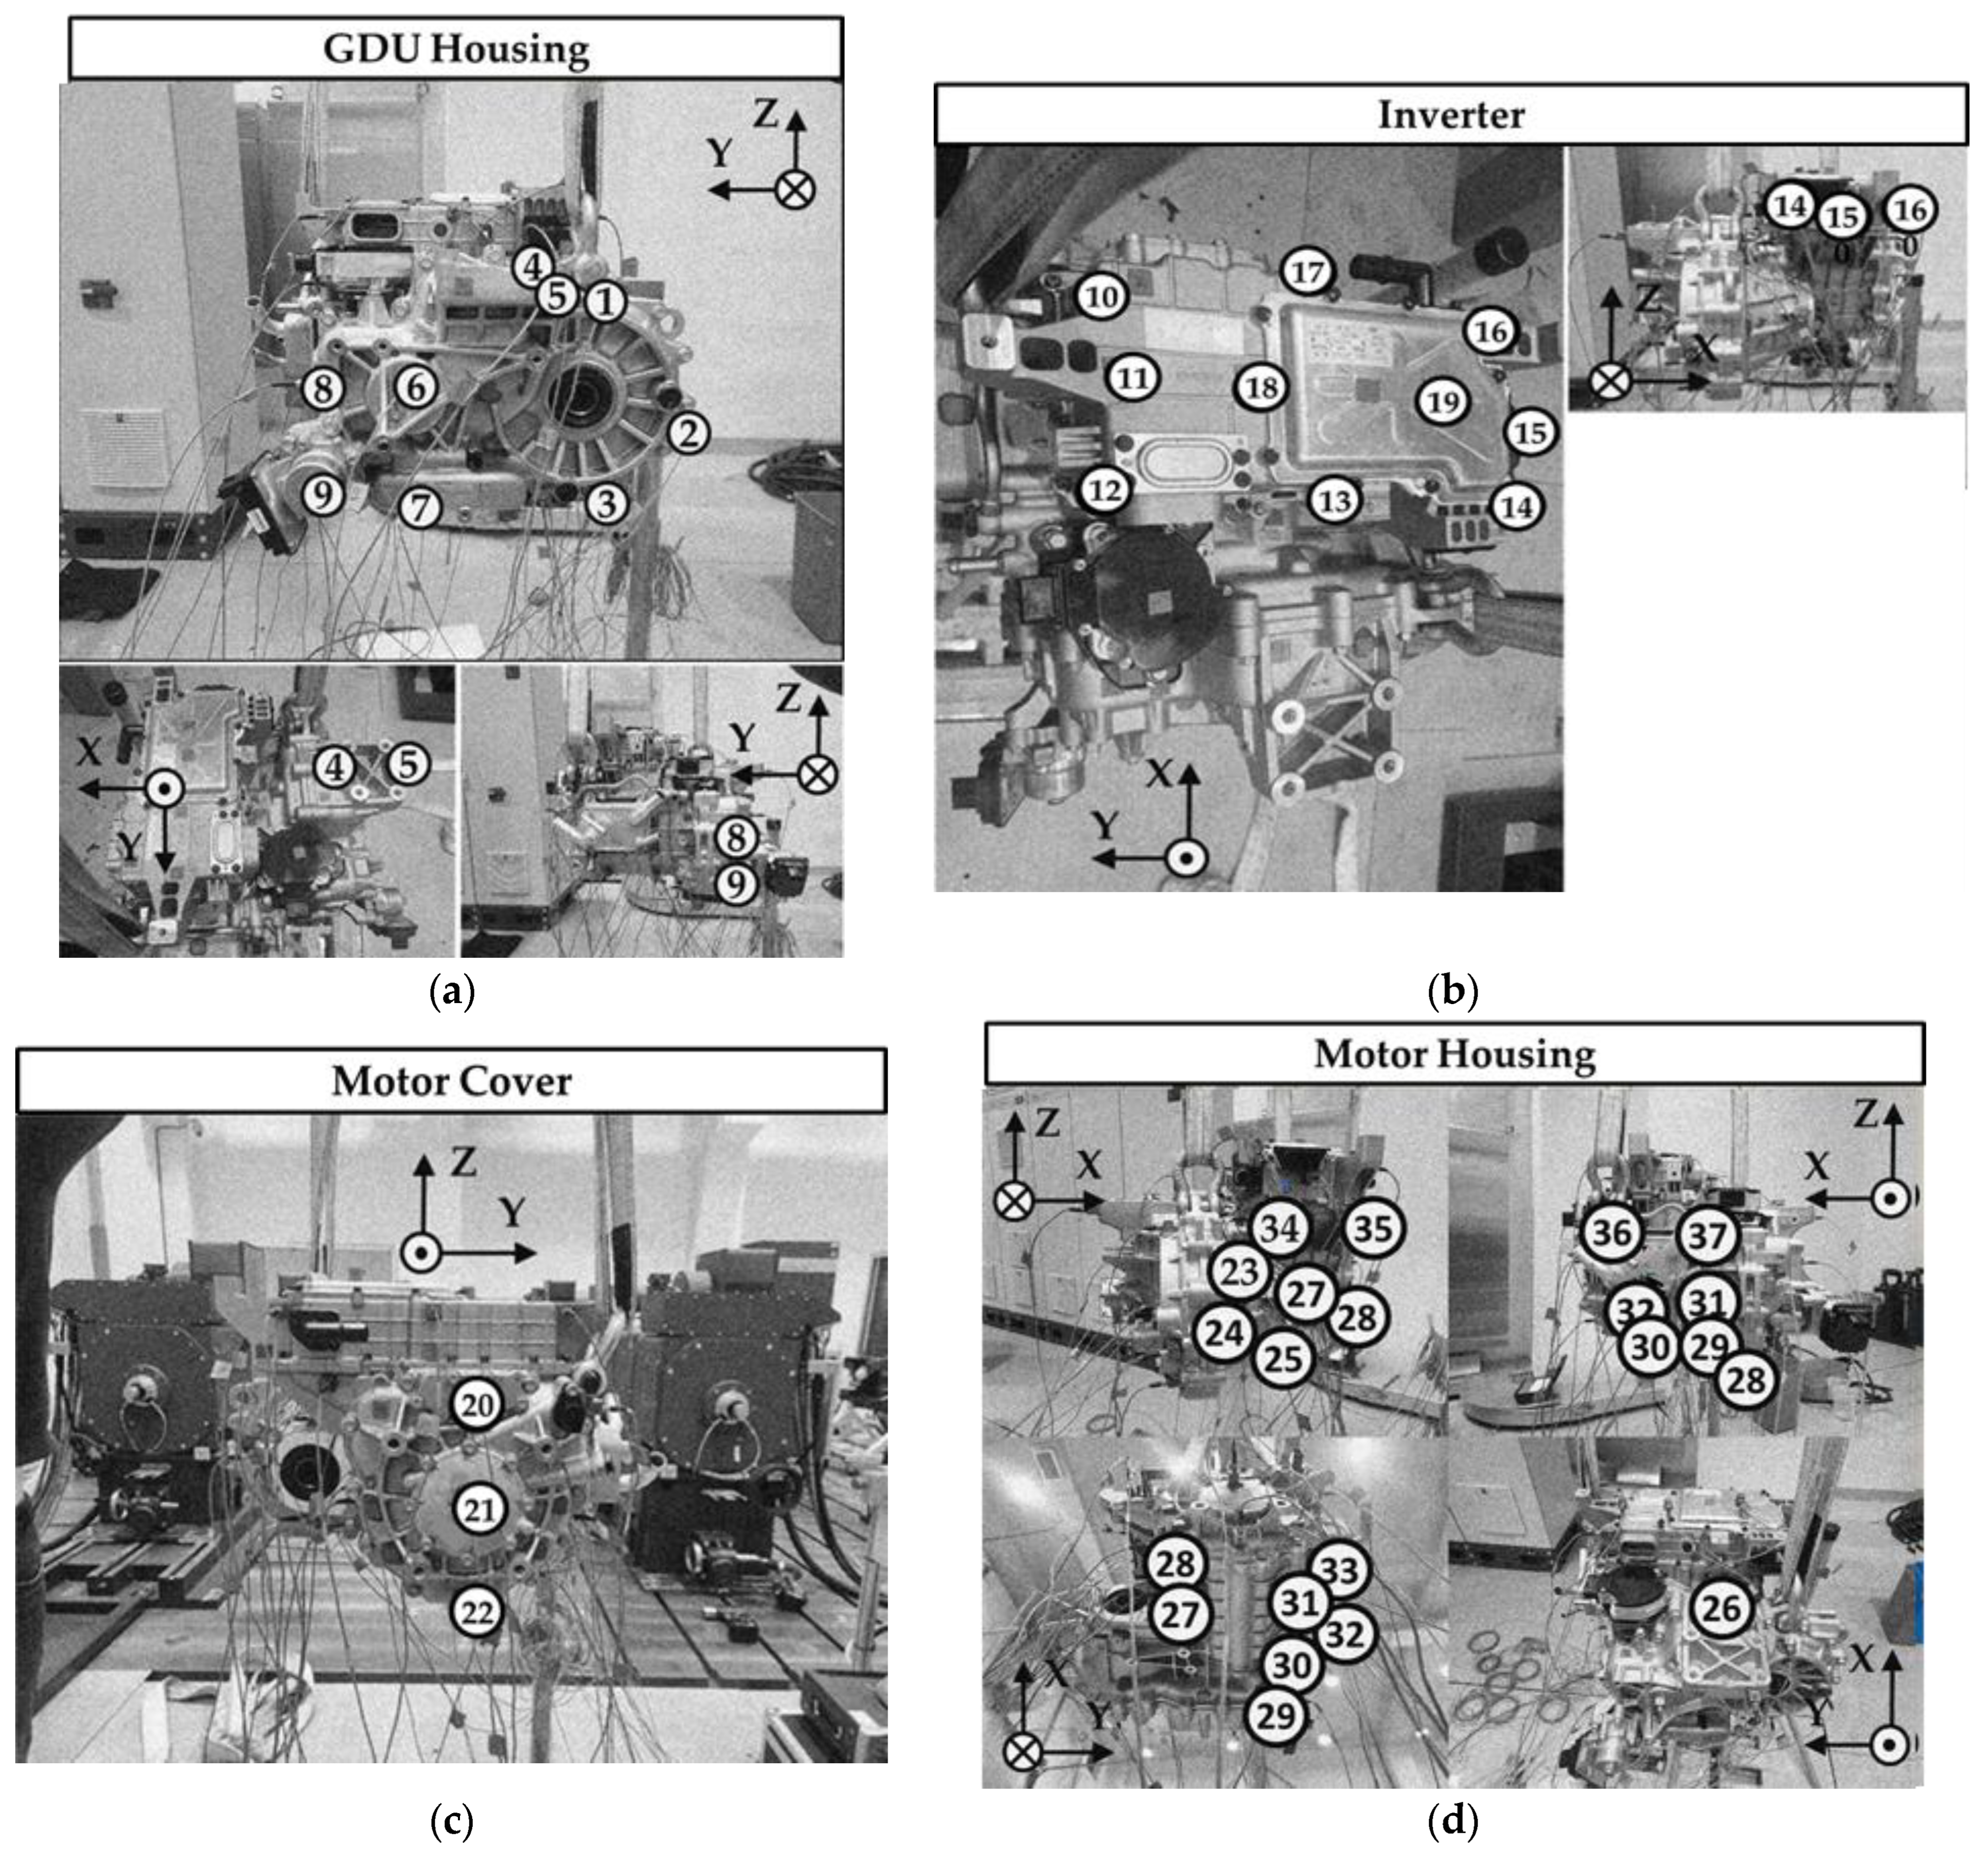
The 3-in-1 EDU comprises various subparts operating under different boundary conditions, making it challenging to assemble a complete model after rigorously verifying each part or interconnected component. To overcome this challenge, a hybrid simulation model for the 3-in-1 EDU was introduced to determine the best support mount conditions through directly implementing the experimental data into the simulation model. To identify the dynamic characteristics of the target system, experimental data from the target unit w were obtained through an experimental modal test. The free–free boundary condition for the 3-in-1 EDU was achieved through suspending the heavy test specimen in mid-air using ropes, as illustrated in Figure 3. An experimental modal test was conducted for the entire body of the 3-in-1 EDU using an impact hammer, and the response data were measured using three axial accelerometers (#1–#36), as shown in Figure 4.
Under the free–free boundary condition, the frequency response functions were measured using an impact hammer at the torque input locations. The measured frequency response functions were used to extract modal parameters within the frequency range of interest, spanning from 10 Hz to 1000 Hz using the PolyMAX algorithm in Test.Lab software (version 15A, Siemens, Munich, Germany).
4.2. Hybrid Simulation Model of 3-in-1 EDU including a Rigid Finite Element Model
The simulation model for the 3-in-1 EDU subject to 3-point support was integrated with experimentally measured data and rigid finite element models. The modal parameters of the supported 3-in-1 EDU model were based on the values provided in the experimental modal test, whereas the mechanical dynamic characteristics of the mount modules responsible for the 3-point support were directly input, as illustrated in Figure 5. This integration process was conducted using Virtual.Lab software (version 13.10, Siemens, Munich, Germany), and the connecting nodes for the stiffness and damping values of the mounts were selected using three arbitrary points from a rigid finite element model. To ensure that the first resonance frequency exceeded 15,000 Hz in the dummy FEM, the finite element model was developed using Hypermesh software (ALTAIR/Troy, MI, USA) with a very high elastic modulus. Consequently, the three mounts were connected to a virtual rigid body, creating an integrated system in which the experimental data and finite element models were combined. These subcomponents were synthesized based on the GRC method, which is theoretically expressed in Equation (14). Each sub-component was assembled via the FRF-based sub-structuring option provided in the commercial Virtual.Lab SW, and the theoretical background was obtained using the GRC method.
4.3. Verification of Hybrid Simulation Model of 3-in-1 EDU
To preserve the inherent dynamics of the 3-in-1 EDU within the simulation, a simulation model for the 3-in-1 EDU was constructed based on experimental data. If the complex powertrain system was represented using several finite element models of the sub-components, a significant portion of the effort would have been dedicated to verifying the accuracy of the simulation model. To emphasize the advantages of utilizing the hybrid model for the 3-in-1 EDU, a preliminary accuracy check was performed through comparing the resonance frequencies within the frequency range of 10–1000 Hz, as summarized in Table 2. The maximum error (=) in the resonance frequency was 0.6%, ensuring the reliability of the simulation model based on these results. The advantage of the proposed hybrid 3-in-1 EDU model can certainly be emphasized by the accuracy of the resonance frequency error in Table 2, owing to the direct utilization of the experimental data in the simulation model.
5. Evaluation of Dynamic Characteristics of Supporting Mounts
5.1. Dynamic Response from Hybrid 3-in-1 EDU Model
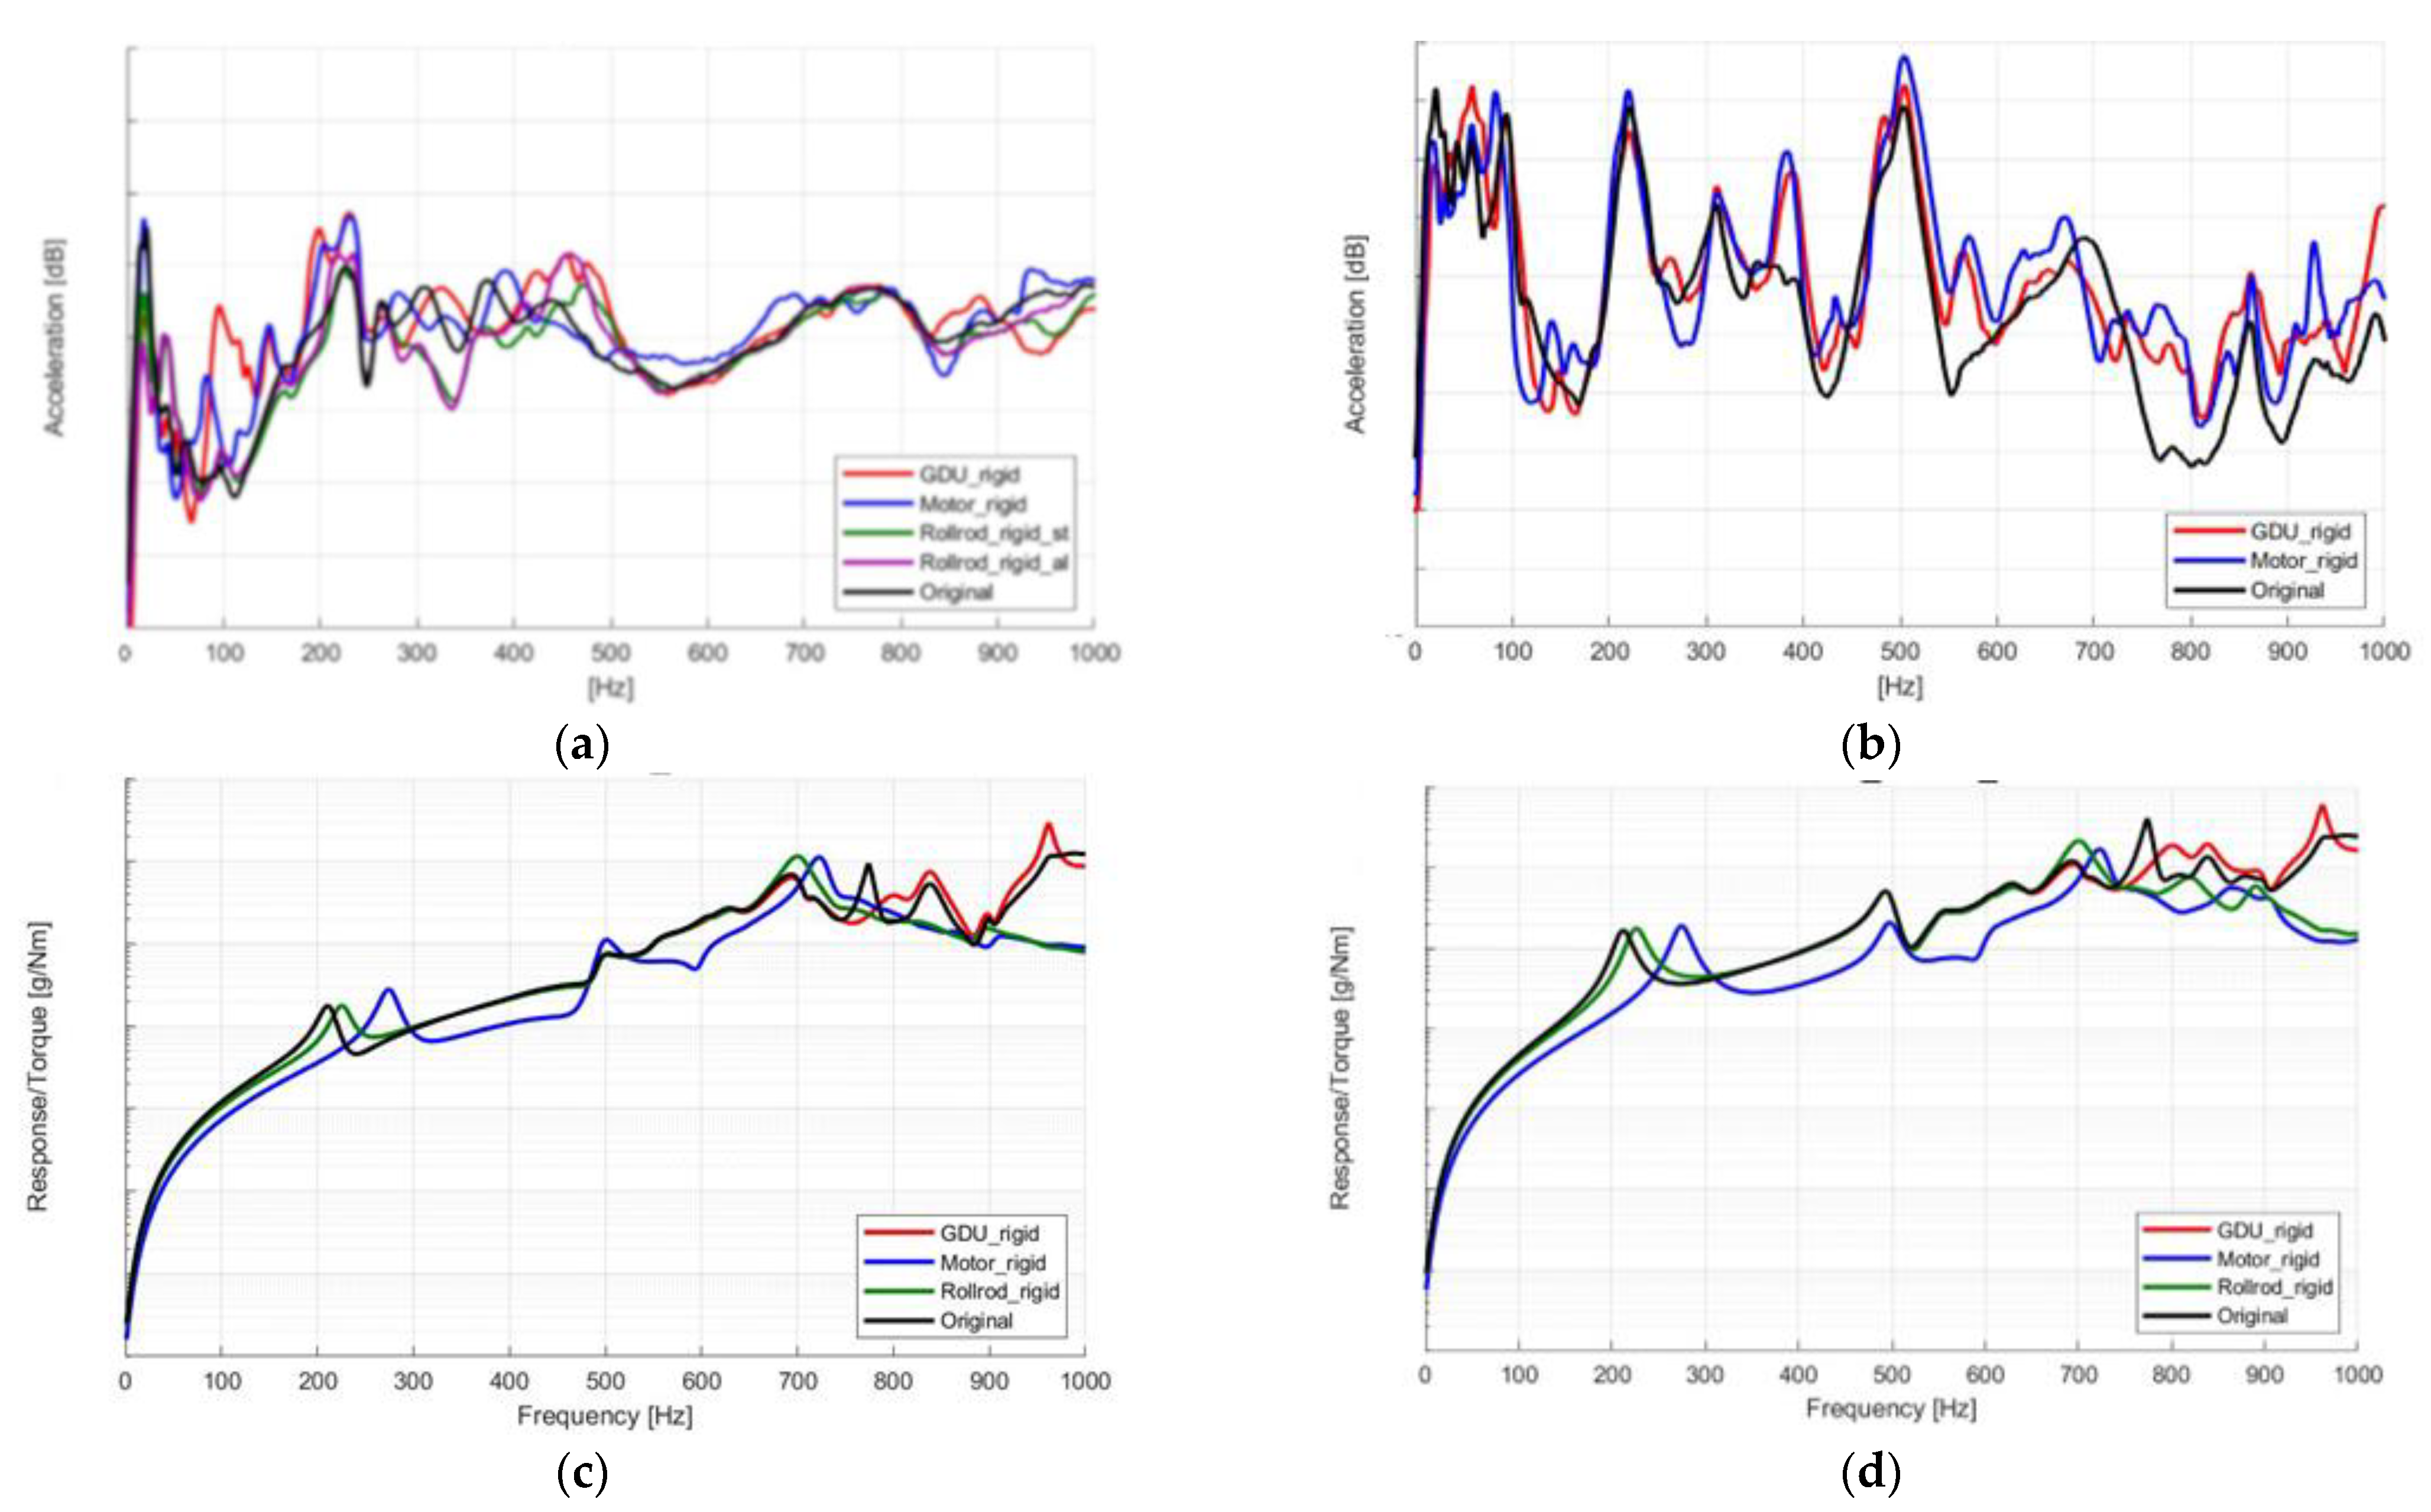
The three mounts were evaluated using the proposed hybrid 3-in-1 EDU model for four cases: original equipped mounts, rigid EDU mounts, rigid motor mounts, and rigid rollrod mounts. The original mount case represents the direct implementation of the measured dynamic stiffness data, as shown in Figure 2. To mimic the rigid behavior of the responsible mount, the rigid mount case was assigned by the increase in stiffness of each mount to more than 1000 times the original measurement across all frequency bands. The responses of the 3-in-1 EDU model were regarded as the evaluation indicator of NVH performance through selecting four measurement locations that could well represent the response of the main sub-components, the GDU housing (#1), the inverter (#2), the motor cover (#3), and the motor housing (#4), as illustrated in Figure 2 as white circles. The torque input was assigned near the location where the torque was generated during the operation of the 3-in-1 EDU in the experiment. The acceleration data for the four response positions (#1–#4) were measured under the torque input conditions, and the frequency responses of the four locations with respect to the torque input are plotted in Figure 6.
The assigned mount cases were evaluated using the averaged response data over the torque input in Figure 6, and an interesting frequency range was selected for two intervals: the low-frequency range from 10 Hz to 400 Hz and the high-frequency range from 400 Hz to 1000 Hz. In addition, for different supporting mount cases, the total value of the four measurement locations indicated the NVH performance of the 3-in-1 EDU model. Therefore, the best mounting case can be identified with the lowest total value of the averaged data, as summarized in Table 3. The simulation results indicated that the rigid rollrod mount case was the best, and the rigid GDU mount was the worst, compared to the original mounted mount case.
The average value of the two frequency ranges differed between the measurement locations; the response value was higher in the low-frequency range for #1, #3, and #4, but the average value was higher in the high-frequency range for #2. For the low-frequency range, the dynamic mechanical properties were low, such that the effect from the mount part was relatively low at the 3-in-1 EDU and the dynamics from the supporting system itself may be dominant for dynamic responses. In the high-frequency range, the dynamic mechanical properties improved, and several peaks were observed in the spectral range, as shown in Figure 2.
5.2. Dynamic Response from Powertrain Dynamometer Test of 3-in-1 EDU
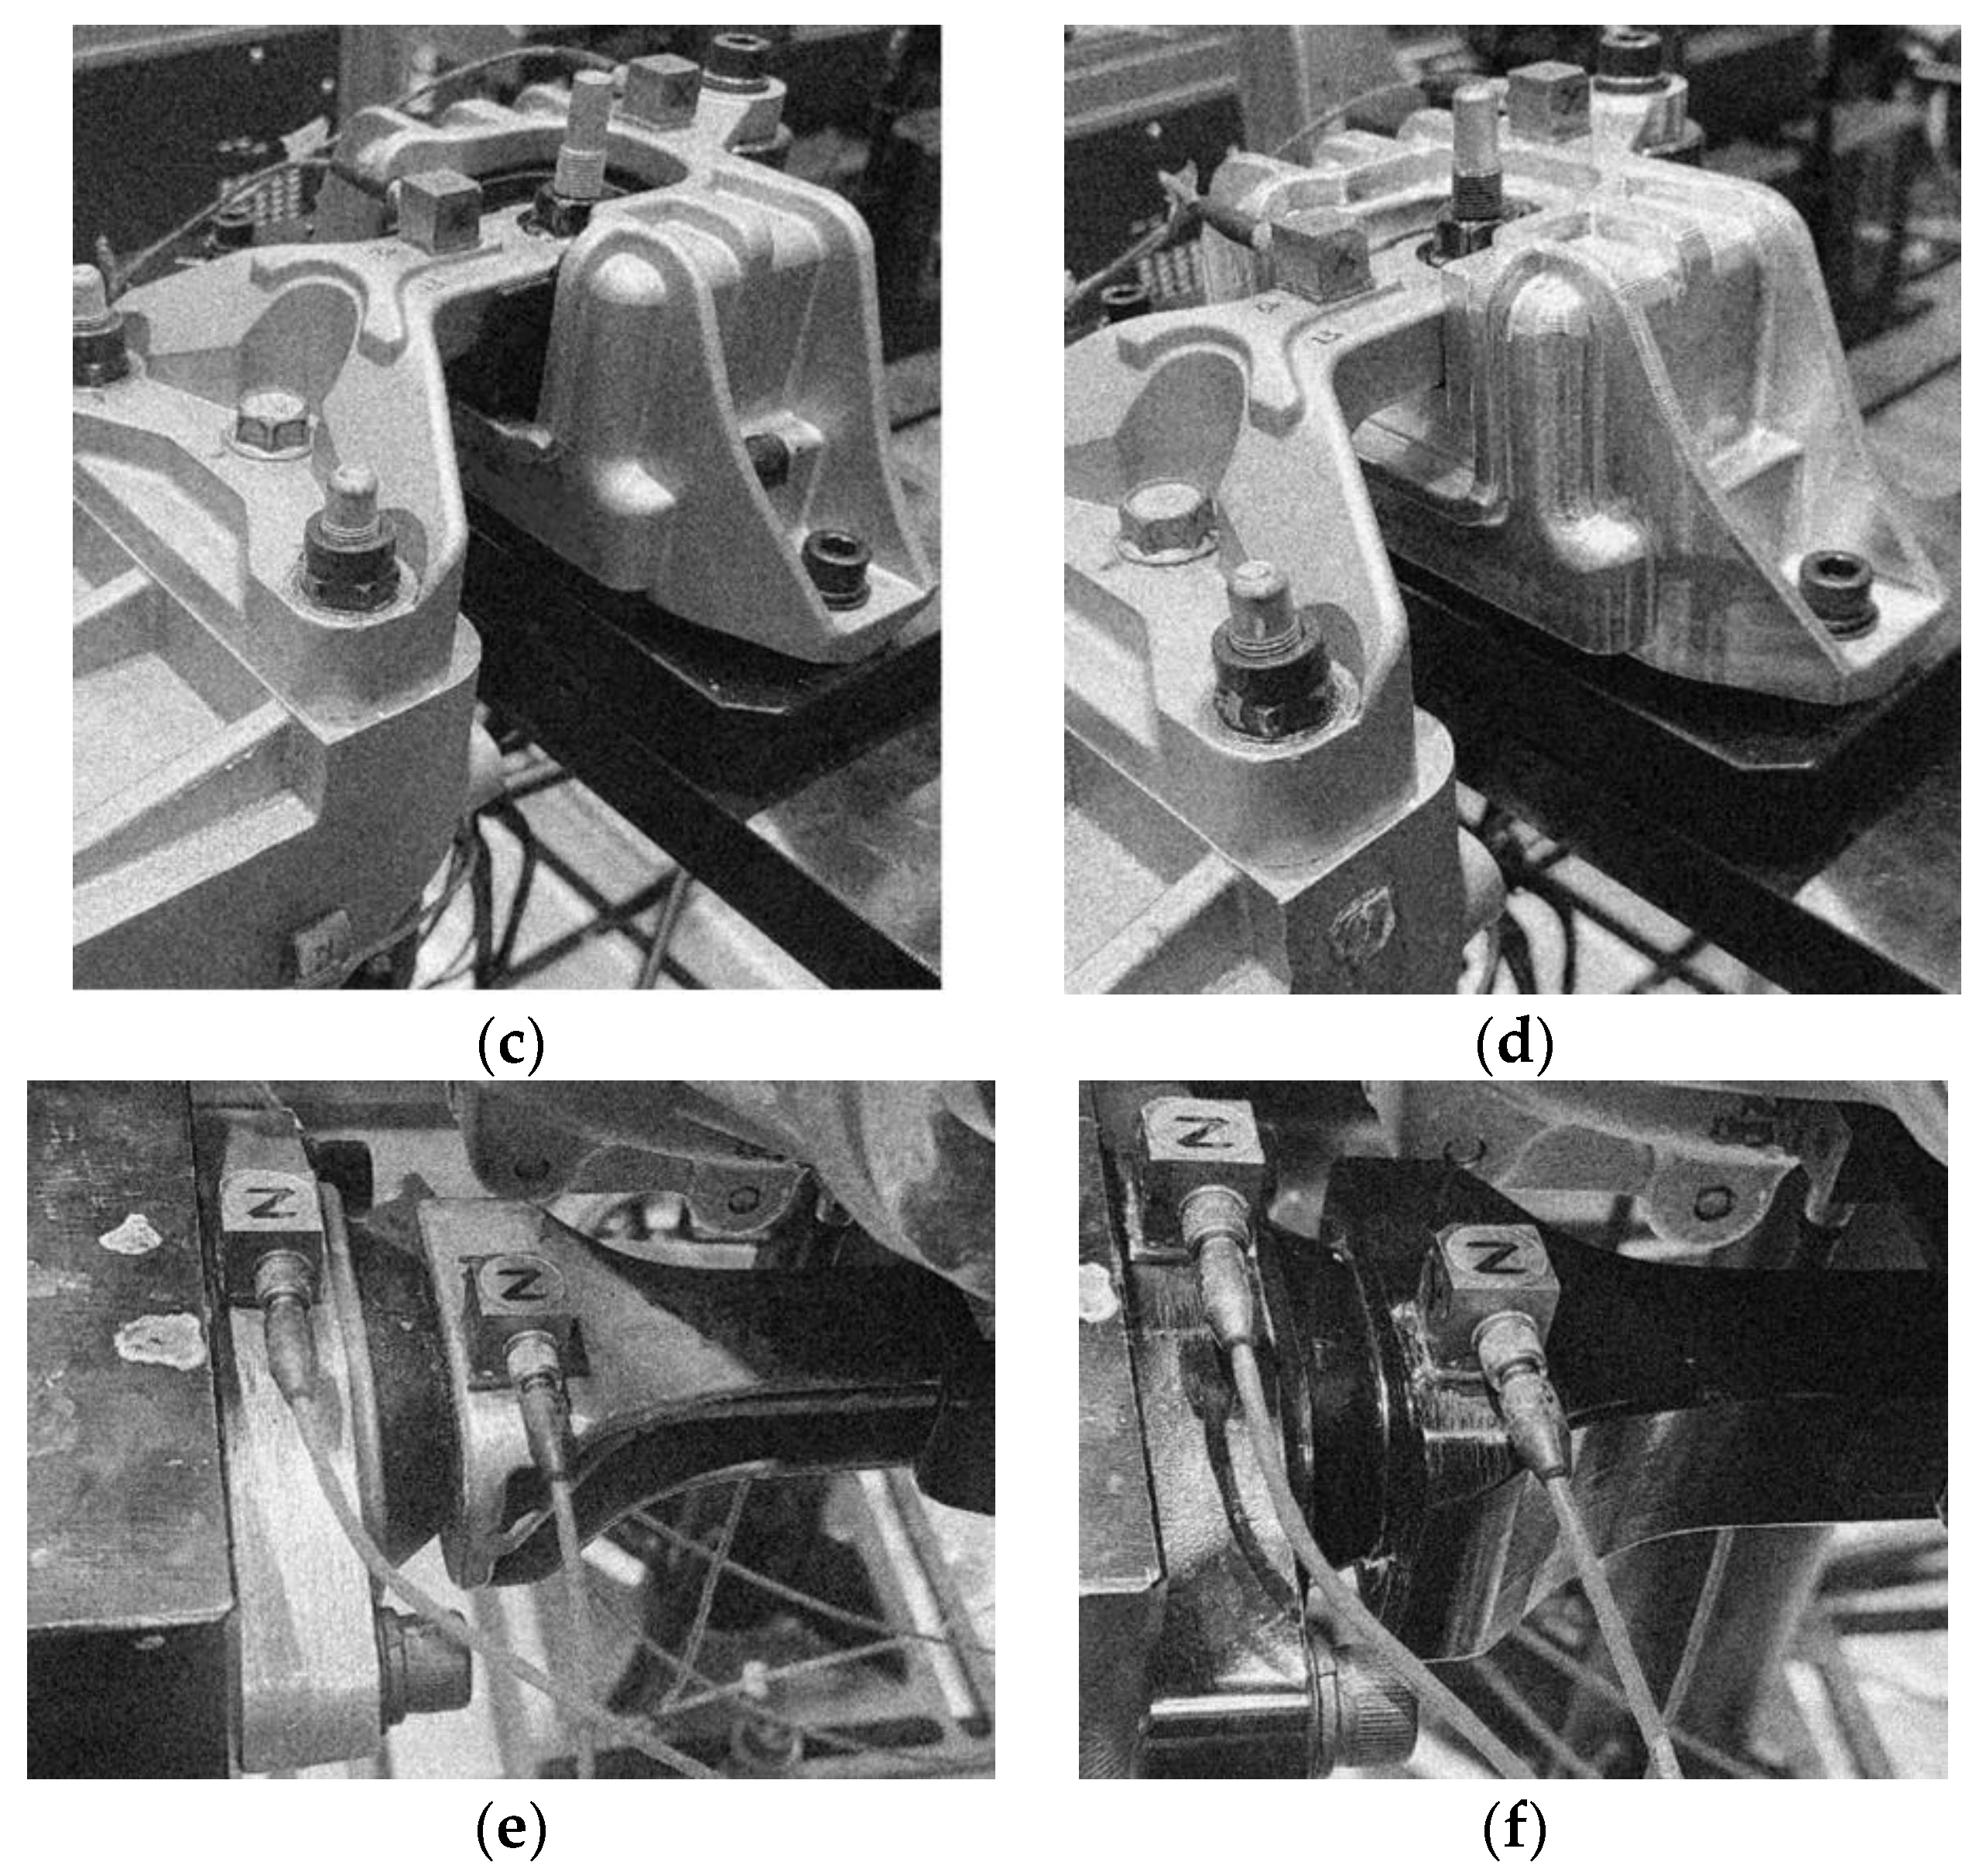
To validate the simulation results experimentally, experiments were conducted on a 3-in-1 Electric Drive Unit (EDU) using a powertrain dynamometer (AVL, Graz, Austria). The drive motor of the powertrain unit is subjected to a Wide Open Throttle (WOT) torque input. Acceleration sensors were attached to positions (#1–#4) corresponding to those in Figure 5, and measurements were taken during the operation, as illustrated in Figure 7. To implement the rigid mounting conditions presented in Table 3, the elastomer part was replaced with a stiff structure (SUS304 or aluminum), as shown in Figure 7. Under the WOT torque input, the frequency response over the torque input, which is referred to as the normalized response, was measured and plotted in Figure 8.
The experimental results show that the first resonance frequency of the 3-in-1 EDU can be found at approximately 200 Hz, and higher peaks can be found in the high-frequency range. To objectively compare the NVH performance, the same response data calculation was conducted for two frequency ranges (10–400 Hz and 400–1000 Hz), as summarized in Table 4. The test results indicated that the best and worst mount cases were the rigid rollrod mount case with a steel structure and the rigid motor mount, respectively. Because the rigid GDU mount case was the second-worst case, the test results were well represented by the simulation results in Table 3, and these results revealed the reliability of the proposed 3-in-1 EDU model. The large difference from the simulation results could be attributed to the increase in the response in the high-frequency range owing to the increase in the excitation source from the three mounted parts. Indeed, the peak values from the three mounts excited the fixture structure directly connected to the mount, such that the amplified high-frequency perturbation may increase the system response at the measurement locations. However, unexpected excitation from the supporting mount could not be triggered in the simulation model because of the ideal rigid FEM model connected to the three mounts.
From the analytical results from both the simulation and experiment, the refinement of the 3-in-1 EDU should be based on the redesign of the 3-in-1 EDU to minimize the resonance frequency peaks at approximately 200 Hz in the low-frequency range. For the high-frequency range, the dynamics of the supporting mounts are an important factor in representing the dynamic responses of the target system, and candidate mount cases are suggested based on the rigid mount condition at the supporting locations. The best result was consistently found in the rigid roll rod mount case, and the optimal plan verified the reduction in the dynamic response over the original mounted mount case. In addition, the proposed hybrid 3-in-1 EDU model is an efficient alternative for selecting the optimal mechanical properties of supporting mounts instead of expensive experimental verifications to enhance the NVH performance.
6. Conclusions
A hybrid 3-in-1 EDU model was proposed via incorporating the experimental modal data of the 3-in-1 EDU and the measured mechanical properties of the three supports. The sub-assembly between the dummy rigid FEM model and the three mounts, the sub-assembly between the three mounts, and the experimental modal model were merged into one simulation model using the GRC method. The hybrid simulation model was preliminarily compared to the measured resonance frequencies within the frequency range of interest. The reliability of the proposed simulation model was verified with experimental response data through comparing the averaged normalized responses for two spectral ranges: 10–400 Hz and 400–1000 Hz. Both results indicate that the rigid rollrod mount case was the best for the minimization of the responses at 3-in-1 EDU. Several peak values of the measured mechanical properties were found at more than 500 Hz, such that the averaged normalized response values were closely related to the nature of the three mounts, whereas the averaged normalized response in the low-frequency range was dependent on the characteristics of the 3-in-1 EDU. Therefore, the refinement of the EDU can be enhanced through decoupling them into two spectrum ranges: the design modification of the EDU itself from 10 Hz to 400 Hz, and the modification of the dynamic characteristics for supporting mounts from 400 Hz to 1000 Hz. Because the accuracy of the proposed hybrid 3-in-1 EDU model was acceptable after the verification of the dynamic responses with experimental data, the proposed model can supersede the experimental test procedure to determine the optimal condition of the supporting mount case.
Author Contributions
Conceptualization, validation, formal analysis, writing—original draft preparation, S.-H.P.; software, investigation, resources, data curation, C.-J.K.; methodology, visualization, writing—review and editing; Y.K. All authors have read and agreed to the published version of the manuscript.
Funding
This study was supported by the National Research Foundation of Korea (Grant No. 1711197340).
Data Availability Statement
The data presented in this paper are available upon reasonable request from the corresponding authors.
Conflicts of Interest
The authors declare no conflict of interest.
References
- Alujevic, N.; Cakmak, D.; Wolf, H.; Jokic, M. Passive and active vibration isolation system using inerter. J. Sound Vib. 2018, 418, 163–183. [Google Scholar] [CrossRef]
- Li, Y.; He, L.; Shuai, C.G.; Wang, C.Y. Improved hybrid isolator with maglev actuator integrated in air spring for active-passive isolation of ship machinery vibration. J. Sound Vib. 2017, 407, 226–239. [Google Scholar] [CrossRef]
- Ma, Z.; Zhou, R.; Yang, Q. Recent Advances in Quasi-Zero Stiffness Vibration Isolation Systems: An Overview and Future Possibilities. Machines 2022, 10, 813. [Google Scholar] [CrossRef]
- Ling, Y.; Wu, S.; Gu, J.; Lai, H. A Novel Ring Spring Vibration Isolator for Metro Superstructure. Appl. Sci. 2021, 11, 8422. [Google Scholar] [CrossRef]
- Yang, J.-H.; Yang, X.-D.; Han, Q.-K.; Liu, J.-G. Post-Buckling Spring Vibration Isolator Using Silicone Gel Column: A Theoretical and Experimental Study. Appl. Sci. 2021, 11, 10559. [Google Scholar] [CrossRef]
- Huang, Z.; Shi, X.; Mu, D.; Huang, X.; Tong, W. Performance and Optimization of a Dual-Stage Vibration Isolation System Using Bio-Inspired Vibration Isolators. Appl. Sci. 2022, 12, 11387. [Google Scholar] [CrossRef]
- Choi, Y.; Wereley, N.M. Vibration Isolation Performance of an Adaptive Magnetorheological Elastomer-Based Dynamic Vibration Absorber. Actuators 2022, 11, 157. [Google Scholar] [CrossRef]
- Zhang, Y.; Wang, X.; Lu, C.; Liu, K.; Song, B. Influence of Road Traffic Vibration on Micro-Dynamic Response of Precision Instrument Vibration Isolation Platforms. Eng. Proc. 2023, 36, 48. [Google Scholar] [CrossRef]
- Kim, C.-J. Design criterion of damper component of passive-type mount module without using base mass-block. Energies 2018, 11, 1548. [Google Scholar] [CrossRef]
- Park, Y.W.; Kim, T.-W.; Kim, C.-J. Compromised vibration isolator of electric power generator considering self-excitation and basement input. Inventions 2023, 8, 40. [Google Scholar] [CrossRef]
- Kim, C.; Kim, C.-J. Tuning of Two Sub-Mounts in Mass-Block Integrated Mount Module over Self-Excitation and Basement Input. Appl. Sci. 2023, 13, 10159. [Google Scholar] [CrossRef]
- Oh, H.U.; Lee, K.J.; Jo, M.S. A passive launch and on-orbit vibration isolation system for the spaceborne cryocooler. Aerosp. Sci. Technol. 2013, 28, 324–331. [Google Scholar] [CrossRef]
- Lee, J.; Okwudire, C.E. Reduction of vibrations of passively-isolated ultra-precision manufacturing machines using mode coupling. Precis. Eng. 2016, 43, 164–177. [Google Scholar] [CrossRef]
- Wu, Z.; Jing, X.; Sun, B.; Li, F. A 6DOF passive vibration isolator using X-shape supporting structures. J. Sound Vib. 2016, 380, 90–111. [Google Scholar] [CrossRef]
- Ribeiro, E.A.; Lopes, E.M.O.; Bavastri, C.A. A numerical and experimental study on optimal design of multi-DOF viscoelastic supports for passive vibration control in rotating machinery. J. Sound Vib. 2017, 411, 346–361. [Google Scholar] [CrossRef]
- Siami, A.; Karimi, H.R.; Cigada, A.; Zappa, E.; Sabbioni, E. Parameter optimization of an inerter-based isolator for passive vibration control of Michelangelo’s Rondanini Pieta. Mech. Syst. Signal Process. 2018, 98, 667–683. [Google Scholar] [CrossRef]
- Gu, X.; Yu, Y.; Li, J.; Li, Y. Semi-active control of magnetorheological elastomer base isolation system utilizing learning-based inverse model. J. Sound Vib. 2017, 406, 346–362. [Google Scholar] [CrossRef]
- Santos, M.B.; Coelho, H.T.; Neto, F.P.L.; Mafhoud, J. Assessment of semi-active friction dampers. Mech. Syst. Signal Process. 2017, 94, 33–56. [Google Scholar] [CrossRef]
- Oh, H.U.; Choi, Y.J. Enhancement of pointing performance by semi-active variable damping isolator with strategies for attenuating chattering effects. Sens. Actuators A Phys. 2011, 165, 385–391. [Google Scholar] [CrossRef]
- Azadi, M.; Behzadipour, S.; Faulkner, G. Performance analysis of a semi-active mount made by a new variable stiffness spring. J. Sound Vib. 2011, 330, 2733–2746. [Google Scholar] [CrossRef]
- Pingzhang, Z.; Jianbin, D.; Zhenhua, L. Simultaneous topology optimization of supporting structure and loci of isolators in an active vibration isolation system. Comput. Struct. 2018, 194, 74–85. [Google Scholar]
- Beijen, M.A.; Tjepkema, D.; Dijk, J. Two-sensor control in active vibration isolation using hard mounts. Control Eng. Pract. 2014, 26, 82–90. [Google Scholar] [CrossRef]
- Yang, X.L.; Wu, H.T.; Li, Y.; Chen, B. Dynamic isotropic design and decentralized active control of a six-axis vibration isolator via Stewart platform. Mech. Mach. Theory 2017, 117, 244–252. [Google Scholar] [CrossRef]
- Wang, Z.; Mak, C.M. Application of a movable active vibration control system on a floating raft. J. Sound Vib. 2018, 414, 233–244. [Google Scholar] [CrossRef]
- Chi, W.; Cao, D.; Wang, D.; Tang, J.; Nie, Y.; Huang, W. Design and experimental study of a VCM-based stewart parallel mechanism used for active vibration isolation. Energies 2015, 8, 8001–8019. [Google Scholar] [CrossRef]
- Rao, S.S. Mechanical Vibration, 5th ed.; Pearson: Singapore, 2011. [Google Scholar]
- Inman, D.J. Engineering Vibration, 4th ed.; Pearson: Singapore, 2013. [Google Scholar]
- Tsai, J.-S.; Chou, Y.-F. The identification of dynamic characteristics of a single bolt joint. J. Sound Vib. 1998, 125, 487–502. [Google Scholar] [CrossRef]
- Ren, Y.; Beards, C.F. On structure synthesis with FRF data. J. Sound Vib. 1995, 185, 845–866. [Google Scholar] [CrossRef]
- Lee, D.-H.; Hwang, W.-S.; Kim, C.-M. Design sensitivity analysis and optimization of an engine mount system using an FRF-based structuring method. J. Sound Vib. 2002, 255, 383–397. [Google Scholar] [CrossRef]
- Nicgorski, D.; Avitabile, P. Conditioning of FRF measurements for use with frequency based structuring. Mech. Syst. Singal Process. 2010, 24, 340–351. [Google Scholar] [CrossRef]
- Noh, H.-M. Prediction and reduction in vehicle noise by frequency response function-based substructuring. Adv. Mech. Eng. 2016, 8, 1–13. [Google Scholar] [CrossRef]
- Mayes, R.L.; Ross, M.R. Advancements in hybrid dynamic models combining experimental and finite element substructures. Mech. Syst. Singal Process. 2012, 31, 56–66. [Google Scholar] [CrossRef]
- Yang, G.; Wu, B.; Ou, G.; Wang, Z.; Dyke, S. HyTest: Platform for structural hybrid simulations with finite element model updating. Adv. Eng. Softw. 2017, 112, 200–210. [Google Scholar] [CrossRef]
- Ou, G.; Yang, G.; Dyke, S.; Wu, B. Investigation of hybrid simulation with model updating compared to an experimental shake table test. Front. Built Environ. 2020, 6, 103. [Google Scholar] [CrossRef]
Figure 1.
Configuration of three supporting mounts in 3in1 EDU.

Figure 2.
Dynamic mechanical properties of support mounts: (a) GDU mount, X-direction; (b) GDU mount, Y-direction; (c) GDU mount, Z-direction; (d) motor mount, X-direction; (e) motor mount, Y-direction; (f) motor mount, Z-direction; (g) rollrod mount, X-direction.
Figure 2.
Dynamic mechanical properties of support mounts: (a) GDU mount, X-direction; (b) GDU mount, Y-direction; (c) GDU mount, Z-direction; (d) motor mount, X-direction; (e) motor mount, Y-direction; (f) motor mount, Z-direction; (g) rollrod mount, X-direction.

Figure 3.
Acceleration response of two specimens.

Figure 4.
Attachment of 3-axial accelerometers: (a) GDU housing; (b) inverter; (c) motor cover; (d) motor housing.
Figure 4.
Attachment of 3-axial accelerometers: (a) GDU housing; (b) inverter; (c) motor cover; (d) motor housing.

Figure 5.
Integrated hybrid mode of 3-in-1 EDU using measured experimental data and rid finite element model.
Figure 5.
Integrated hybrid mode of 3-in-1 EDU using measured experimental data and rid finite element model.

Figure 6.
Dynamic response at simulation mode of 3-in-1 EDU: (a) GDU housing; (b) inverter; (c) motor cover; (d) motor housing.
Figure 6.
Dynamic response at simulation mode of 3-in-1 EDU: (a) GDU housing; (b) inverter; (c) motor cover; (d) motor housing.

Figure 7.
Installed mount for dynamometer test of 3-in-1 EDU: (a) GDU mount—original; (b) GDU mount—rigid; (c) motor mount—original; (d) motor mount—rigid; (e) rollrod mount—original; (f) rollrod mount—rigid.
Figure 7.
Installed mount for dynamometer test of 3-in-1 EDU: (a) GDU mount—original; (b) GDU mount—rigid; (c) motor mount—original; (d) motor mount—rigid; (e) rollrod mount—original; (f) rollrod mount—rigid.


Figure 8.
Dynamic response from powertrain dynamometer test of 3-in-1 EDU: (a) GDU housing; (b) inverter; (c) motor cover; (d) motor housing.
Figure 8.
Dynamic response from powertrain dynamometer test of 3-in-1 EDU: (a) GDU housing; (b) inverter; (c) motor cover; (d) motor housing.


Table 1.
Test specification for support mounts.
| Mount Type | Frequency (Hz) | Step (Hz) | Disp. (mm, p-p) | Direction | Preload (Static) |
|---|---|---|---|---|---|
| Rollrod | 10~100 | 2 | 0.2 | X | 0 kgf |
| 100~280 | 10 | 0.05 | |||
| 280~1000 | 10 | 0.01 | |||
| GDU | 10~100 | 2 | 0.2 | X, Y, Z | 0 kgf (X, Y) 75 kgf (Z) |
| 100~280 | 10 | 0.05 | |||
| 280~1000 | 10 | 0.005 | |||
| Motor | 10~100 | 2 | 0.2 | X, Y, Z | 0 kgf (X, Y) 70 kgf (Z) |
| 100~280 | 10 | 0.005 |
Table 2.
Comparison of resonance frequencies between experiment and simulation model.
| Experiment | Simulation | Error (%) |
|---|---|---|
| 205.6 | 206.9 | 0.6 |
| 495.2 | 495.2 | 0.0 |
| 552.5 | 553.8 | 0.2 |
| 629.3 | 629.7 | 0.1 |
| 691.9 | 693.7 | 0.3 |
| 785.8 | 790.1 | 0.5 |
| 832.6 | 834.8 | 0.3 |
| 902.6 | 907.9 | 0.6 |
Table 3.
Normalized response from 3-in-1 EDU model.
| Mount Condition | Location | Low Frequency Range (10–400 Hz) | High Frequency Range (400–1000 Hz) | Total | Rank |
|---|---|---|---|---|---|
| Original | #1 | 0.705 | 0.211 | 4.222 | 3 |
| #2 | 0.136 | 0.337 | |||
| #3 | 0.768 | 0.846 | |||
| #4 | 0.793 | 0.427 | |||
| Rigid GDU Mount | #1 | 0.705 | 0.245 | 4.667 | 4 (worst) |
| #2 | 0.135 | 0.441 | |||
| #3 | 0.768 | 1.000 (worst) | |||
| #4 | 0.793 | 0.579 | |||
| Rigid motor Mount | #1 | 0.675 | 0.162 | 3.415 | 2 |
| #2 | 0.120 | 0.206 | |||
| #3 | 0.726 | 0.334 | |||
| #4 | 1.000 (worst) | 0.193 | |||
| Rigid Rollrod mount | #1 | 0.668 | 0.152 | 3.324 | 1 (best) |
| #2 | 0.138 | 0.230 | |||
| #3 | 0.820 | 0.473 | |||
| #4 | 0.713 | 0.129 |
Table 4.
Normalized response of 3-in-1 EDU specimen from powertrain dynamometer test.
| Mount Condition | Location | Low Frequency Range (10–400 Hz) | High Frequency Range (400–1000 Hz) | Total | Rank |
|---|---|---|---|---|---|
| Original | #1 | 0.558 | 0.512 | 4.556 | 3 |
| #2 | 0.674 | 0.861 | |||
| #3 | 0.499 | 0.509 | |||
| #4 | 0.592 | 0.351 | |||
| Rigid GDU Mount (steel) | #1 | 0.674 | 0.563 | 4.932 | 4 |
| #2 | 0.664 | 0.928 | |||
| #3 | 0.520 | 0.585 | |||
| #4 | 0.626 | 0.372 | |||
| Rigid motor Mount (aluminum) | #1 | 0.776 | 0.524 | 5.826 | 5 (worst) |
| #2 | 1.000 (worst) | 1.000 (worst) | |||
| #3 | 0.981 | 0.500 | |||
| #4 | 0.678 | 0.367 | |||
| Rigid Rollrod Mount (steel) | #1 | 0.473 | 0.494 | 4.070 | 1 (best) |
| #2 | 0.576 | 0.794 | |||
| #3 | 0.456 | 0.481 | |||
| #4 | 0.460 | 0.336 | |||
| Rigid Rollrod Mount (aluminum) | #1 | 0.483 | 0.535 | 4.120 | 2 |
| #2 | 0.560 | 0.763 | |||
| #3 | 0.441 | 0.508 | |||
| #4 | 0.466 | 0.364 |
Disclaimer/Publisher’s Note: The statements, opinions and data contained in all publications are solely those of the individual author(s) and contributor(s) and not of MDPI and/or the editor(s). MDPI and/or the editor(s) disclaim responsibility for any injury to people or property resulting from any ideas, methods, instructions or products referred to in the content. |
© 2023 by the authors. Licensee MDPI, Basel, Switzerland. This article is an open access article distributed under the terms and conditions of the Creative Commons Attribution (CC BY) license (https://creativecommons.org/licenses/by/4.0/).
Share and Cite
MDPI and ACS Style
Park, S.-H.; Kim, C.-J.; Kang, Y. Evaluation of the Supporting Mounts of a Three-in-One Electric Drive Unit Using a Hybrid Simulation Model. Machines 2023, 11, 1026. https://0-doi-org.brum.beds.ac.uk/10.3390/machines11111026
AMA Style
Park S-H, Kim C-J, Kang Y. Evaluation of the Supporting Mounts of a Three-in-One Electric Drive Unit Using a Hybrid Simulation Model. Machines. 2023; 11(11):1026. https://0-doi-org.brum.beds.ac.uk/10.3390/machines11111026
Chicago/Turabian StylePark, So-Hee, Chan-Jung Kim, and Yeonjune Kang. 2023. "Evaluation of the Supporting Mounts of a Three-in-One Electric Drive Unit Using a Hybrid Simulation Model" Machines 11, no. 11: 1026. https://0-doi-org.brum.beds.ac.uk/10.3390/machines11111026
Note that from the first issue of 2016, this journal uses article numbers instead of page numbers. See further details here.