Article

An Explainable Deep Learning Framework for Detecting and Localising Smoke and Fire Incidents: Evaluation of Grad-CAM++ and LIME

by
Ioannis D. Apostolopoulos
1,*,
Ifigeneia Athanasoula
2,
Mpesi Tzani
2 and
Peter P. Groumpos
2
1
Department of Medical Physics, School of Medicine, University of Patras, 26504 Rio, Greece
2
Department of Electrical and Computer Technology Engineering, University of Patras, 26504 Rio, Greece
*
Author to whom correspondence should be addressed.
Mach. Learn. Knowl. Extr. 2022, 4(4), 1124-1135; https://0-doi-org.brum.beds.ac.uk/10.3390/make4040057
Submission received: 15 November 2022 / Revised: 27 November 2022 / Accepted: 4 December 2022 / Published: 6 December 2022
(This article belongs to the Special Issue Advances in Explainable Artificial Intelligence (XAI))

Abstract

:
Climate change is expected to increase fire events and activity with multiple impacts on human lives. Large grids of forest and city monitoring devices can assist in incident detection, accelerating human intervention in extinguishing fires before they get out of control. Artificial Intelligence promises to automate the detection of fire-related incidents. This study enrols 53,585 fire/smoke and normal images and benchmarks seventeen state-of-the-art Convolutional Neural Networks for distinguishing between the two classes. The Xception network proves to be superior to the rest of the CNNs, obtaining very high accuracy. Grad-CAM++ and LIME algorithms improve the post hoc explainability of Xception and verify that it is learning features found in the critical locations of the image. Both methods agree on the suggested locations, strengthening the abovementioned outcome.

1. Introduction

Climate change is responsible for many consequences, such as intense droughts, water scarcity, rising sea levels, flooding, polar ice melting and more. Severe and catastrophic storms have been linked to the shift in the earth’s climate. Climate change is also expected to increase fire events and activity with multiple impacts on human lives.
Long-term shifts in environmental temperatures and weather patterns are the cornerstone of climate change [1]. Although such shifts may have natural causes, such as variations in the solar cycle, the latest 200 years of human activity have accelerated the change of the earth’s climate [2]. The primary reason lies in coal, oil, and gas burning, which generates greenhouse gas emissions and is connected to the greenhouse effect [3]. Carbon Dioxide (CO2) and Methane (CH4), which are usually emitted from transportation (gasoline) and heating (coal burning), are the leading contributing gases to the greenhouse effect. CO2 is produced by land and forest clearance, whereas CH4 is prominently produced in landfills. Such gases are emitted from various human activity sectors, such as energy and agriculture.
Further, increased fire activity has the potential to affect the ecosystem, accelerating climate-induced shifts in species composition and distribution in the boreal-temperate ecotone [4].
In the study by Krikken et al. [5], the authors observe a small and non-significant increased probability of large forest fires in Sweden due to global warming up to 2018. However, their predicting models demonstrate a significant risk of future fire events due to climate change factors.
In another study by Abram et al. [6], the research team, motivated by the unprecedented 2019/20 Black Summer bushfire disaster in southeast Australia, investigated the connections of climate change and variability to large and extreme forest fires in southeast Australia. The authors argue that the likelihood of fire events may increase rapidly due to the multiple climate change contributors in southeast Australia.
Michetti et al. [7] consulted climate change projections for 2016–2035 to obtain the projected forest fire frequency and total burnt areas across the Italian peninsula. They argue that climate change is expected to increase forest fires across the peninsula.
Dealing with large forest fires and severe fire incidents in buildings and road events requires bold funding of government structures related to disaster response. In addition to the necessary measures to deal with critical situations, such as fire trucks, aeroplanes, drones, and the adequate number of firefighters, prevention and rapid detection become particularly important. Modern technology can aid in this end. Large grids of forest and city monitoring devices can assist in incident detection, accelerating human intervention in extinguishing fires before they get out of control. Such devices include smoke sensors, micro-cameras, and patrolling drones.
Monitoring devices, however, generate big data (images, video frames, sensor measurements), which are impossible to process directly, at least by humans. The emergence of modern Artificial Intelligence (AI) methods enables the real-time processing of big data. As a result, AI models can discover fire-related patterns and operate as real-time alarms.
Automatic smoke and fire event identification from patrolling drones and operating cameras is a non-trivial task and requires a suitable model at the right time.
The present study benchmarks and evaluates state-of-the-art Convolutional Neural Networks (CNNs) for smoke and fire identification from various images. The study aims to distinguish the best available CNN in terms of its performance metrics and its inner obtained knowledge. The latter requires the utilisation of explainability algorithms that reveal what CNN has learned through its training and where it locates a vital finding (e.g., smoke).
The contributions of the study can be summarised as follows:
  • The study utilises one of the largest available datasets, which is generated by merging image data from various repositories.
  • The study highlights the Inception network, which demonstrated superior performance in distinguishing smoke and fire events from the images.
  • The utilisation of explainability tools reveals that Inception seeks in the right direction and can be reliable.
The outline of this paper is as follows: After this introduction, in Section 2, related work is briefly presented, while material and methods are covered in Section 3. In Section 4, the results are given. Finally, Section 5 discusses the results, while future research opportunities are given in Section 6.

2. Related Work

There has been a plethora of research aiming to detect fire-related incidents ranging from smoke to large-scale forest fires from various image and video sources. In addition, the scientific community is exploring a broad field of sensor-aided smoke and fire detection [8,9].
Conventional and pioneering AI solutions have been extensively applied, including manual image feature extraction and Machine Learning (ML) classification methods, feature selection methods, direct image and video classification and object detection pipelines.
Here, we describe a few critical studies employing Deep Learning approaches for detecting fire-related incidents from images and videos. A very comprehensive review of recent literature is presented in [10].
Kim and Lee [11] proposed a Faster Region-based Convolutional Neural Network (R-CNN) to identify fire-related suspected image areas from video sources. Using the suggested bounding box features, the authors employed a Long Short-Term Memory (LSTM) to distinguish between fire-related and normal. The authors constructed a dataset of 73,887 images containing 22,729 flame, 23,914 smoke, and 27,244 non-fire images. They achieved an accuracy of 97.2% in detecting fire and smoke regions.
Another work by Jiao et al. [12] presented an Unmanned Aerial Vehicle (UAV) setup for real-time fire detection. They tested the well-known YOLOv3 network, the baseline algorithm for detecting fire-related incidents in the produced videos. The proposed method was evaluated using 60 images and demonstrated a success rate of 83% on a more than 3.2 fps frequency.
Seydi et al. [13] employed images from Australian and North American forest regions, the Amazon rainforest, Central Africa and Chernobyl (Ukraine), where forest fires are actively reported. The authors presented a DL-based pipeline (Fire-Net) to detect active fires and burning biomass. Seven hundred twenty-two patches were generated with 256 × 256 pixels representing the training, validation, and testing datasets by 469, 109, and 144 patches, respectively. This network achieved an accuracy of 97.35% and showed robustness in detecting small active fires.
Xue et al. [14] proposed an innovative modification of the YOLOv5 network for detecting small forest fires from aerial images. The network was trained, validated and tested on large forest fires (2537 train, 282 validation, and 314 test images). Then, the authors employed transfer learning to improve the network’s training and performance in detecting smaller fires. For the latter, the network was trained on an additional 240-image set and tested on 30 images. The model reached a [email protected] of 82.1%.
The metric-based evaluation shows remarkable results, with the accuracy in distinguishing between images that contain smoke/fire and typical images reaching above 97%. Studies that perform fire-detection incidents based on object-detection models generally demand large-scale and well-annotated datasets. Detailed annotations require heavy human intervention, and, as a result, high-quality object-detection datasets are hard to find.
Therefore, image classification methods have also been proposed [15,16,17]. However, most image classification works do not employ explainable networks to evaluate the networks’ ability to detect significant image findings related to the presence of smoke or fire.
There is a need for an in-depth assessment of what the DL model has learned, where it locates the fire-related incident, and what key image samples confuse the model resulting in False Positive and False Negative yields.

3. Materials and Methods

3.1. Deep Learning in a Nutshell

DL alludes to various ML approaches utilising many nonlinear processing units grouped by layers to process the input information by gradually applying specific transformations. Special Neural Networks (NN) are utilised in DL’s applications related to image feature extraction. Those networks are known as Convolutional Neural Networks (CNN), and their name comes from the convolution operation, which is the cornerstone of such methods. Convolutional Neural Networks (CNNs) were introduced by LeCun [18]. CNN is a deep neural network that mainly uses convolution layers to extract helpful information from the input data, usually feeding a final Fully Connected (FC) layer [19]. A convolution operation is performed as a filter, a table of weights, slides throughout the input image. An output pixel produced at every position is a weighted sum of the input pixels (the pixels that the filter has passed from). The weights of the filter, as well as the size of the table (kernel), are constant for the duration of the scan. Therefore, convolutional layers can seize the shift-invariance of visible patterns and depict robust features [19]. Usually, after a set of convolutional layers, pooling layers follow.
After several convolutional and pooling layers, one or more FC layers may aim to perform high-level reasoning. FC layers connect all previous layers’ neurons with every neuron of the FC layer. FC layers are not always necessary, as they may be replaced by convolution layers of kernel size 1 × 1 [20].
The last layer of CNN is the output layer. The softmax [21] operator is a standard classifier for CNNs. Support Vector Machine (SVM) is usually combined with CNN features [22]. Overfitting is an undesired and unneglectable situation in ML and DL. Overfitting is caused when the network has learned too specific information and tends to over-fit the input data. Therefore, when tested on unseen data, it deviates from the desired outcome. Regularisation refers to a unity of different techniques to reduce the complexity and prevent the overfitting issue. Optimisation has been a critical component of CNNs for a long time [23]. Optimising a DL algorithm is more sophisticated than optimising other algorithms [24]. For example, optimising a Random Forest would involve parameter tuning and extensive evaluation tests. In NNs, optimisation refers to parameter-tuning and specific optimisers that help training converge by reducing the loss. The Adam [25] optimiser, for example, is one of the most successful algorithms for image classification tasks.
Hence, optimisation algorithms utilised for training deep models differ significantly from traditional optimisation algorithms in many perspectives.

3.2. Dataset

A precise examination of repositories for relevant images was conducted online to identify images containing fire and smoke. Qualified images consist of the following:
(a)
Images from forest fires;
(b)
Image from fires caused by vehicle accidents;
(c)
Indoor incidents of smoke or small fire;
(d)
Fire incidents on the outside of buildings, as viewed by the streets;
(e)
Smoke incidents within large forests;
(f)
Smoke incidents on the road.
A total of nine repositories were selected, and 53,585 images were processed. Sources include research institutes, laboratories, companies, and individual users. A summary of the image sources is presented in Table 1. Table 2 provides factual information on the nature of the dataset.
To populate the non-fire class, a selection of everyday images of forests, streets, offices, and houses has been incorporated into the dataset.
A balance between the two mutually exclusive classes is crucial for network learning. Therefore, the distribution between the two classes, namely fire/smoke and normal, is carefully selected. Henceforth, the two classes shall be called PFoS (Presence of Fire or Smoke) and N (Normal).

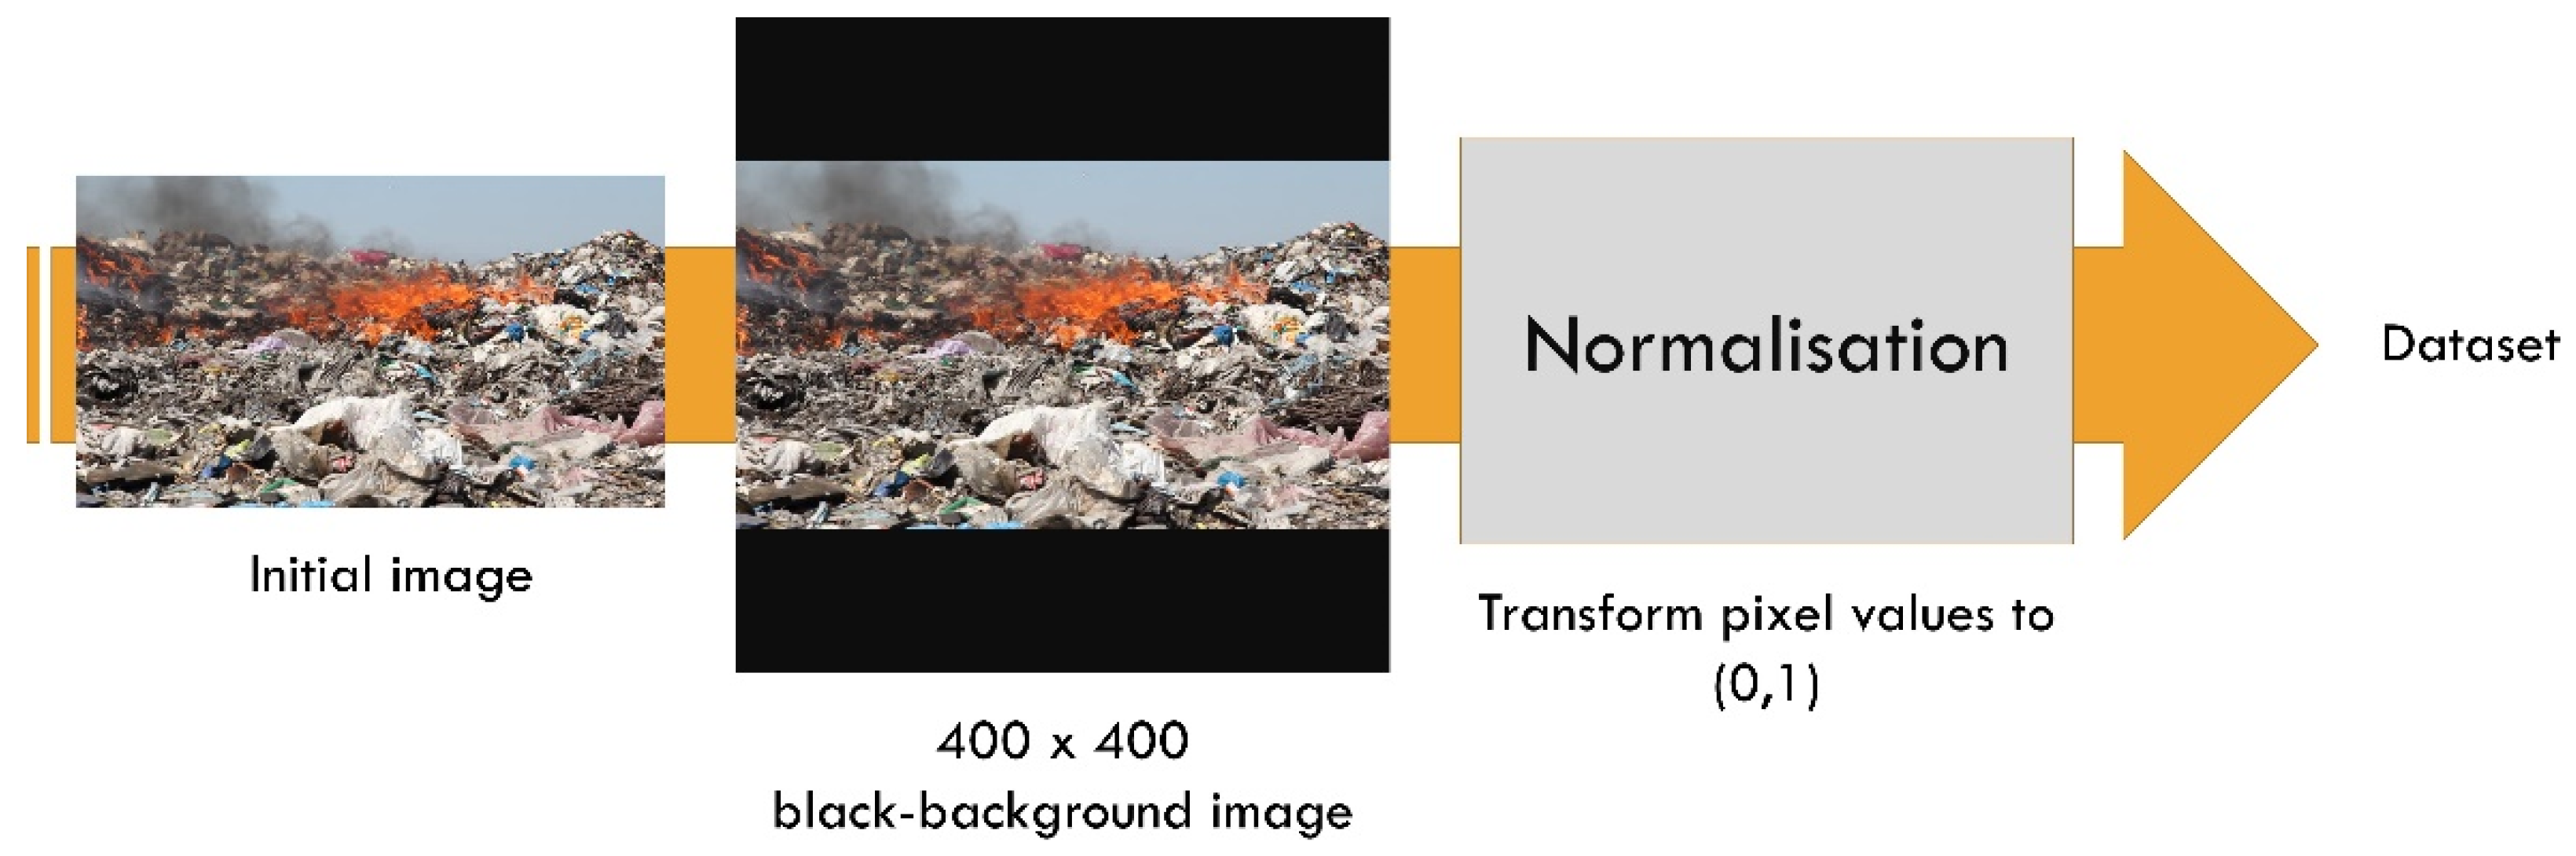
3.3. Data Processing

The dataset images are of varying sizes and pixel aspects. However, CNNs require a uniform image input size. As a result, we selected a black-background template of 400 × 400 size. Each image is rescaled to fit into this template, retaining the original height-to-width ratio. Figure 1 illustrates the data preprocessing steps.
Data augmentation has been applied online (during training). It has been implemented to increase the variety of the input images and provide the network with more data by applying some geometric transformations. Data augmentation has to be realistic, though. Strong data augmentations may produce unrealistic samples that are not met in real life, and, as a result, the CNNs may be confused rather than benefit from such data. We considered slight rotations, width and height shifts, and Gaussian noise additions.

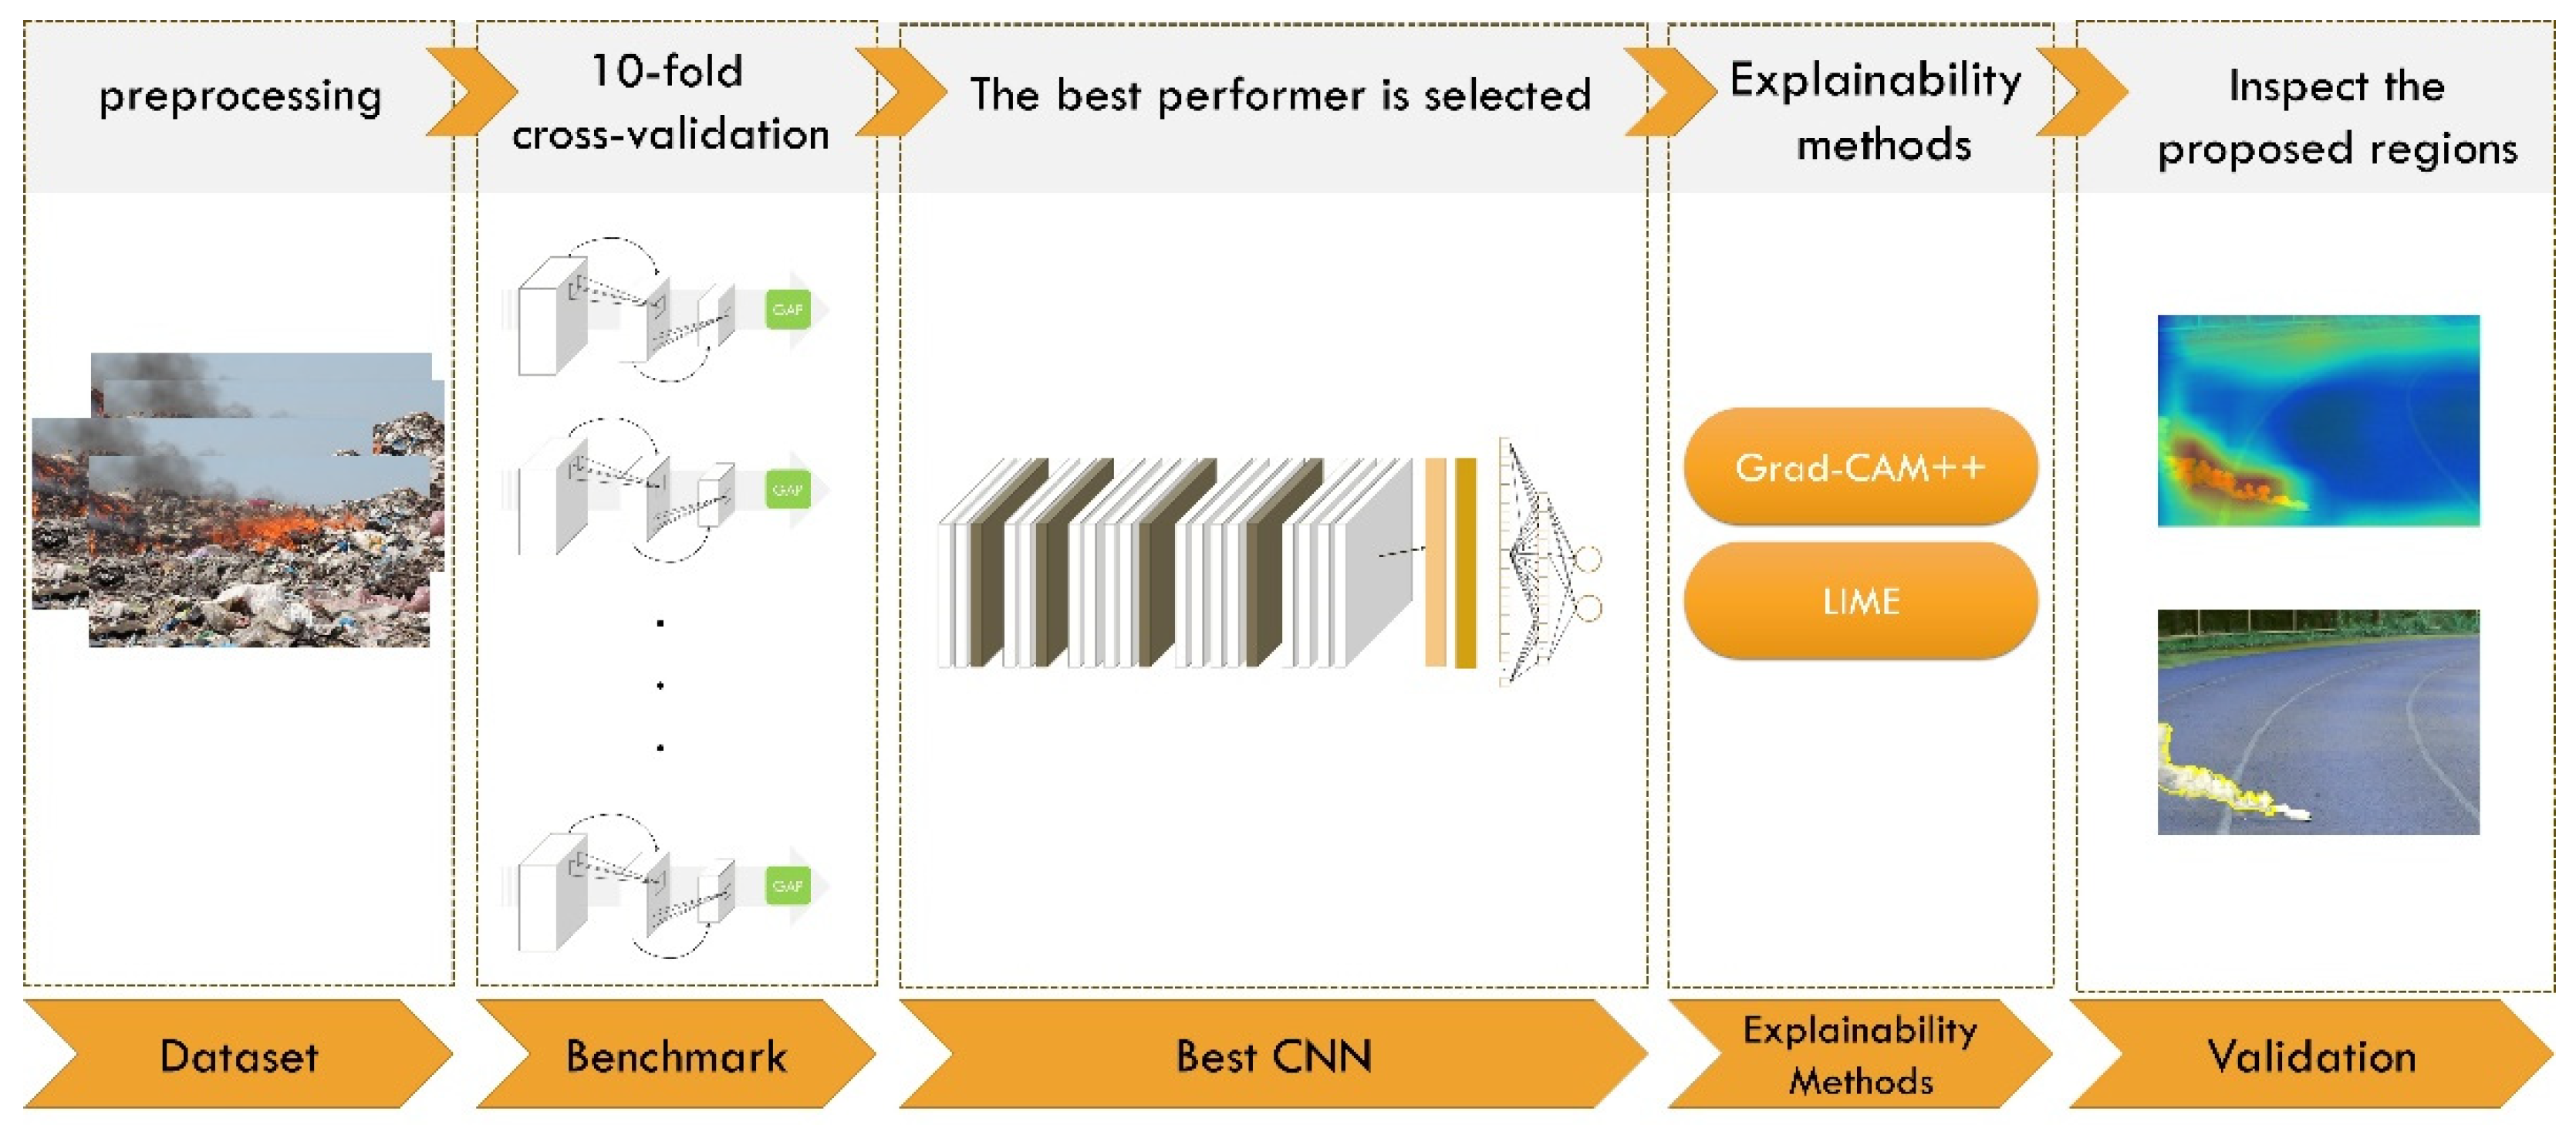
3.4. Deep Learning Fire Detection Framework

We followed the general classification pipeline based on state-of-the-art CNNs. This involves the necessary data preprocessing, training a well-established CNN that learns to process the input data distribution and extract meaningful image features, and the classification network responsible for distinguishing between the important and the irrelevant features and is placed at the top of the CNN. Figure 2 illustrates the research methodology of the study.
As far as the involved CNNs are concerned, the study deploys recent successful approaches considered to be state-of-the-art due to their practical implementation in relevant image and video classification tasks. Table 3 showcases the CNN implementation method.
The networks are employed using the standard transfer learning setup with “off-the-shelf features”. Therefore, we loaded the weights obtained by their initial training using ImageNet [21] database. The networks retain their extracted knowledge in feature extraction by freezing all their learning layers and loading the learned weights. The extracted features are processed by a densely connected network at the top of the CNN, which follows a Global Average Pooling layer. In this implementation, the number of trainable parameters is strongly reduced because the only trainable layer is the classification network at the top of the CNN.
The densely connected layer is the same for each CNN and contains 1500 input units, 500 hidden units and 2 output units corresponding to the two classes. A Dropout layer that randomly discards 50% of the learned connections is used after the 1500 node-layer and after the 500-node layer. Lastly, the classifier at the top is SoftMax [29].

3.5. Explainability Methods

ML and DL have become established and dominant disciplines in many activity sectors embracing new technologies. Feature development of human society lies in ML and DL to solve intricate problems and offer reliable solutions. It is often discussed that the potential of ML and DL may transform human-oriented processes into automatic everyday tasks wherein human intervention is no longer required. In this context, the act of DL as a black box makes the medical community reluctant to adopt DL in assisting with everyday challenges. There is an increasing demand for transparency and interpretability of the new methods. Since 2018, an increasing number of researchers have introduced a new discipline. This discipline is called eXplainable Artificial Intelligence (XAI) [30]. XAI refers not only to technical aspects of the DL models that ensure some level of interpretability, but it also integrates the concepts of data privacy and accountability.
From a technical point of view, considering the interpretability of a newly developed ML or DL model can improve its implementability. Firstly, designing an interpretable model ensures impartiality in the decision-making process. Secondly, interpretability can point out potential adversarial perturbations that affect the prediction. This enables specific improvements to the core of the model itself. Thirdly, interpretability can ensure that only the meaningful features infer the desired output, thereby highlighting that an underlying causality exists in the given data and the model reasoning.

3.5.1. Grad-CAM++ Method

The Grad-CAM++ algorithm [31] intends to identify the areas of the input image having a critical effect on the classification decision of the classifier placed at the top of the CNN. Its functionalities are fully exploited in object detection tasks, where a specific image area contains the desired object.

3.5.2. LIME Method

LIME stands for Local Interpretable Model-Agnostic Explanations [32]. Its essence is the perturbation of the original data points before feeding them into any black-box model. The new data points are weighted as a function of their proximity to the initial data.

3.6. Experiment Setup

The experiments are implemented using the TensorFlow library under a Keras backend in a Python programming language environment. GPU is enabled under this setup employing a GeForce RTX 3080 graphic card. The rest of the computational capacity specifications involve an Intel Core i9 CPU and 64 GB RAM. All time-related performance metrics are recorded under this computational infrastructure.
All networks are trained and evaluated under a 10-fold cross-validation procedure. The total allowed epochs of training are 500. An early stopping callback has been applied, which immediately stops the training process of each fold when a 99% validation accuracy is reached. The validation set contains 10% of the training set’s samples.
As far as the performance metrics are concerned, the overall accuracy, precision, recall, F1 score, and AUC score are reported. In addition, the Positive Predicting Value (PPV) and the Negative Predicting Value (NPV) are recorded.

4. Results

4.1. Image Classification

Xception is superior to the rest of the CNNs. It achieves an accuracy of 0.9881, a precision of 0.9948, a recall of 0.9833, and an AUC score of 0.9886. Table 4 showcases the average performance metrics of the CNNs for the ten folds. Besides Xception, VGG16 performs above 98% accuracy, whilst VGG19, InceptionResNetV2, MobileNetV2, and EfficientNetV2B3 attain approximately 97%.
As far as the training and testing times are concerned, there are variations among the employed networks. The results are presented in Table 5. In general, all networks require less than a second to predict the class of a new image.
The least time-consuming CNNs include NasNetMobile, EfficientNet, and ConvNeXt. Xception requires 0.09 s to predict the class of a test image. It can process ten frame-per second videos using the same computational infrastructure as the experiment.

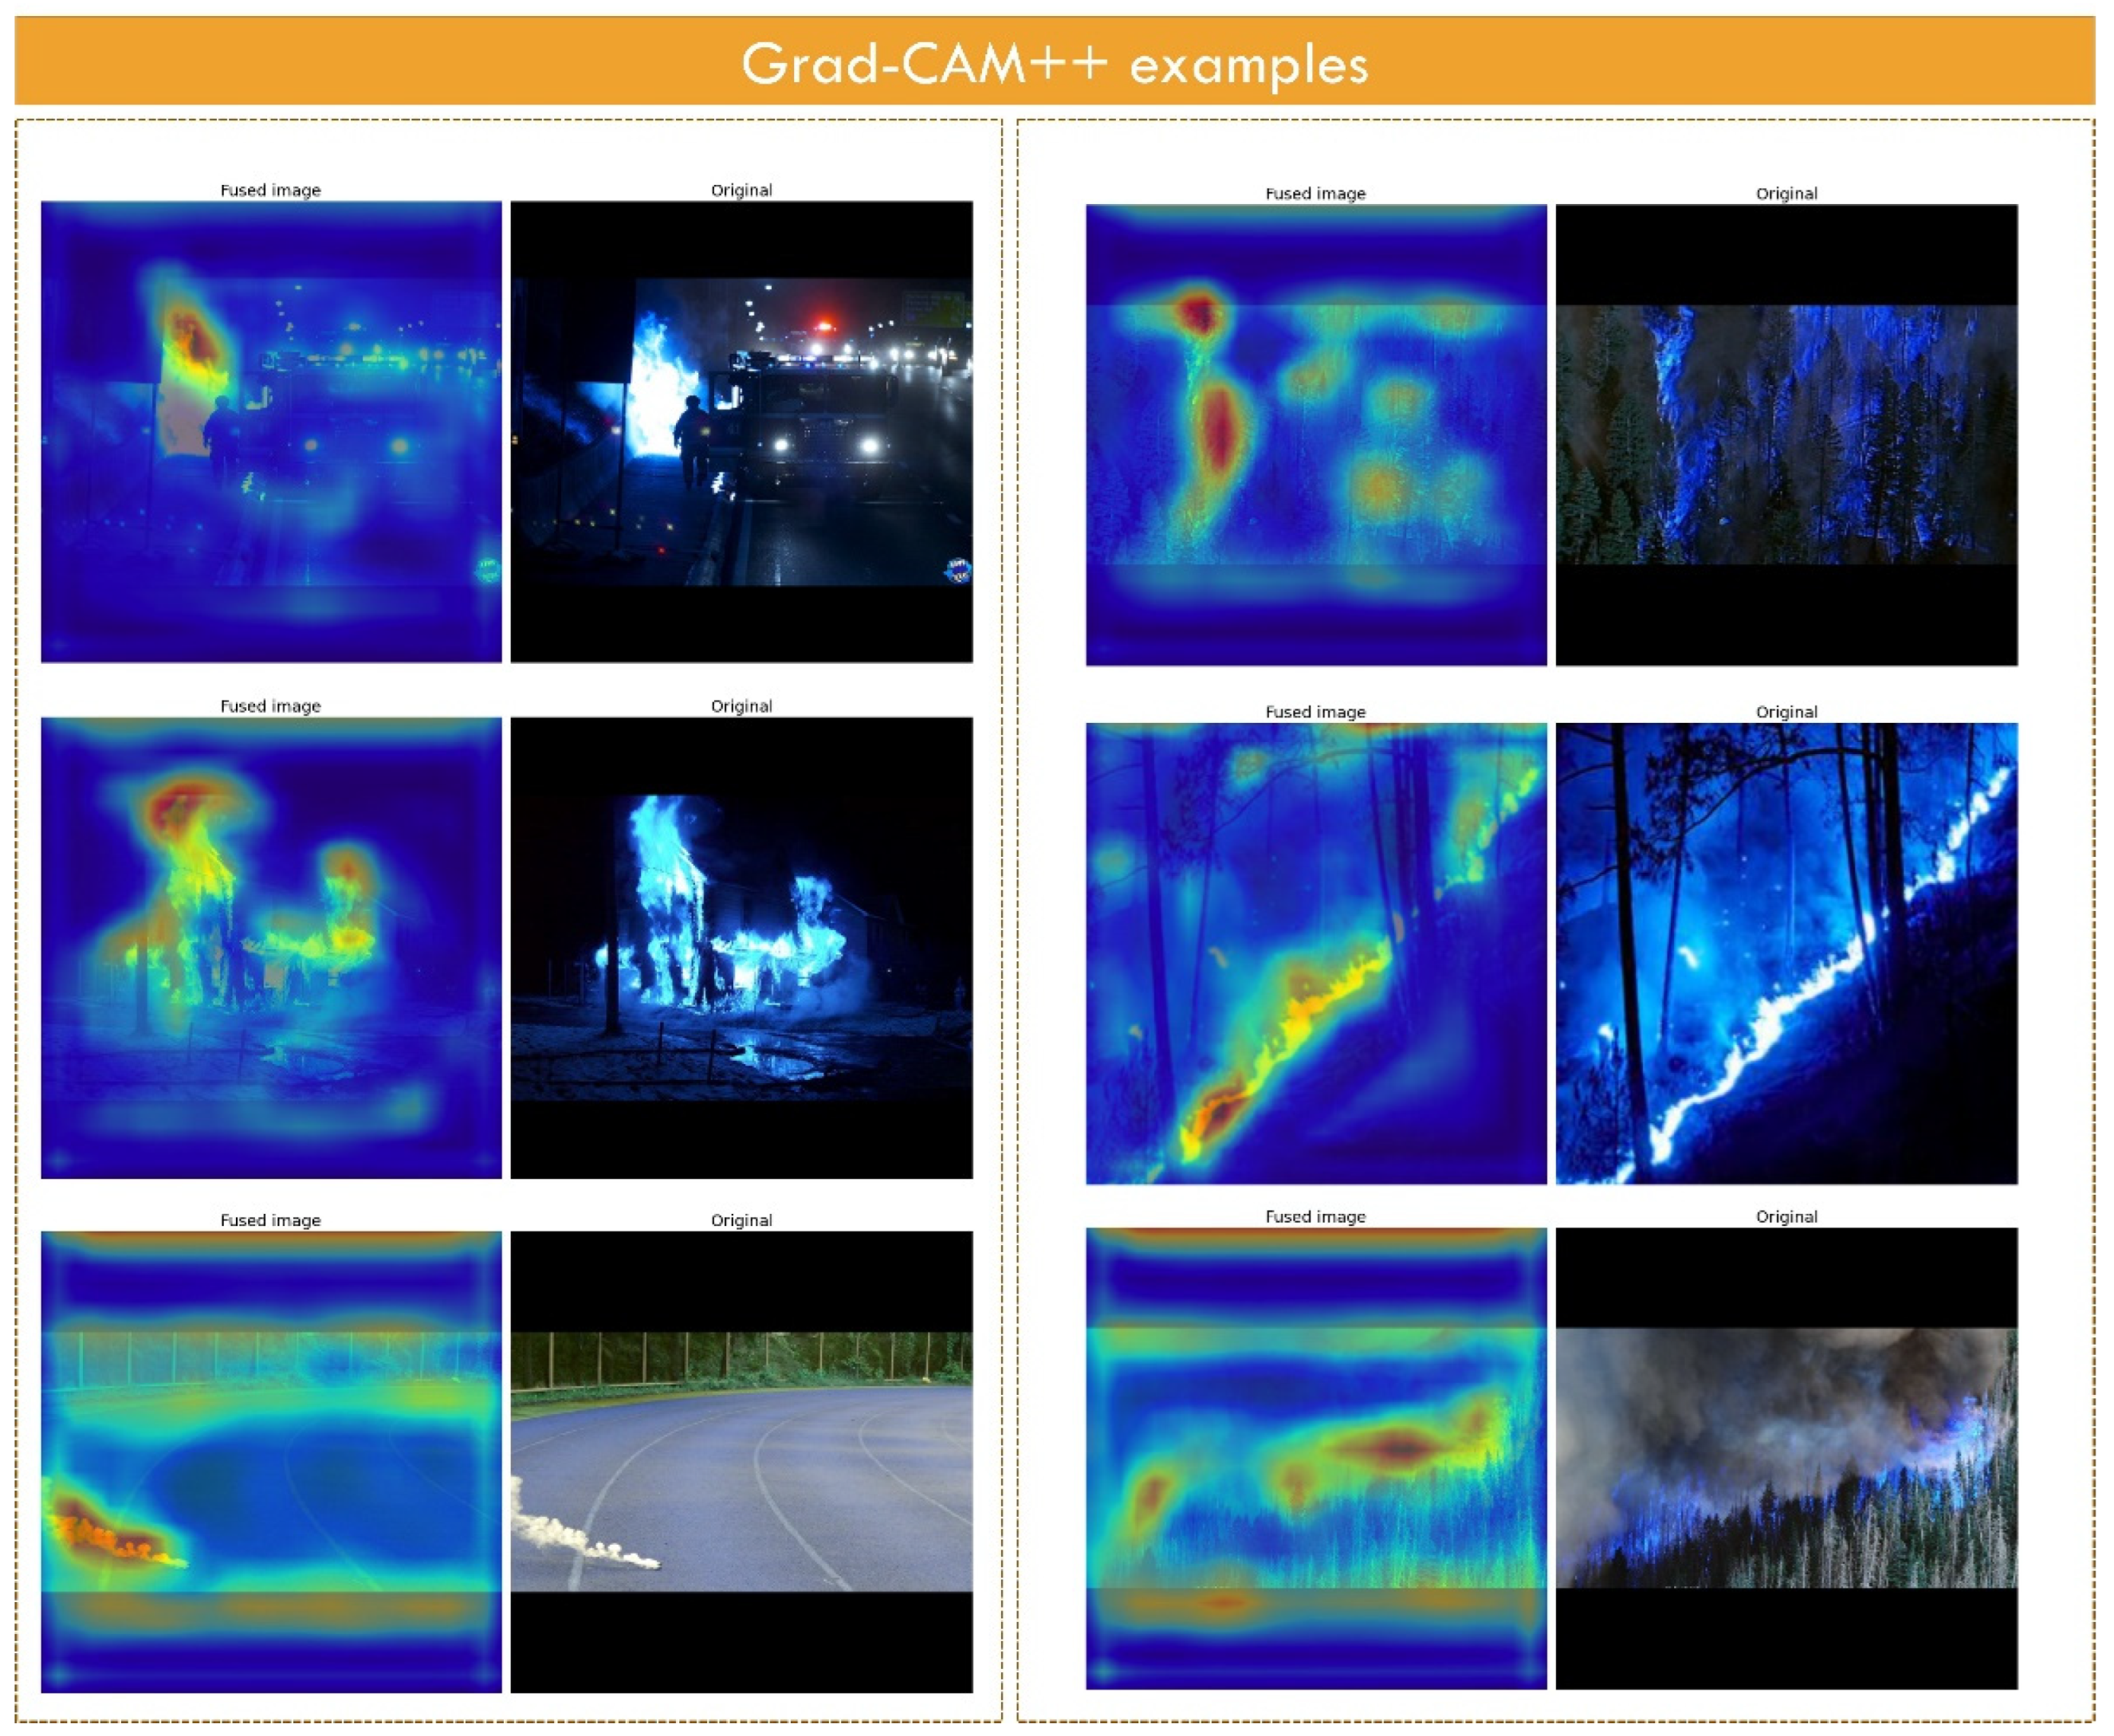
4.2. Grad-CAM++ Outputs
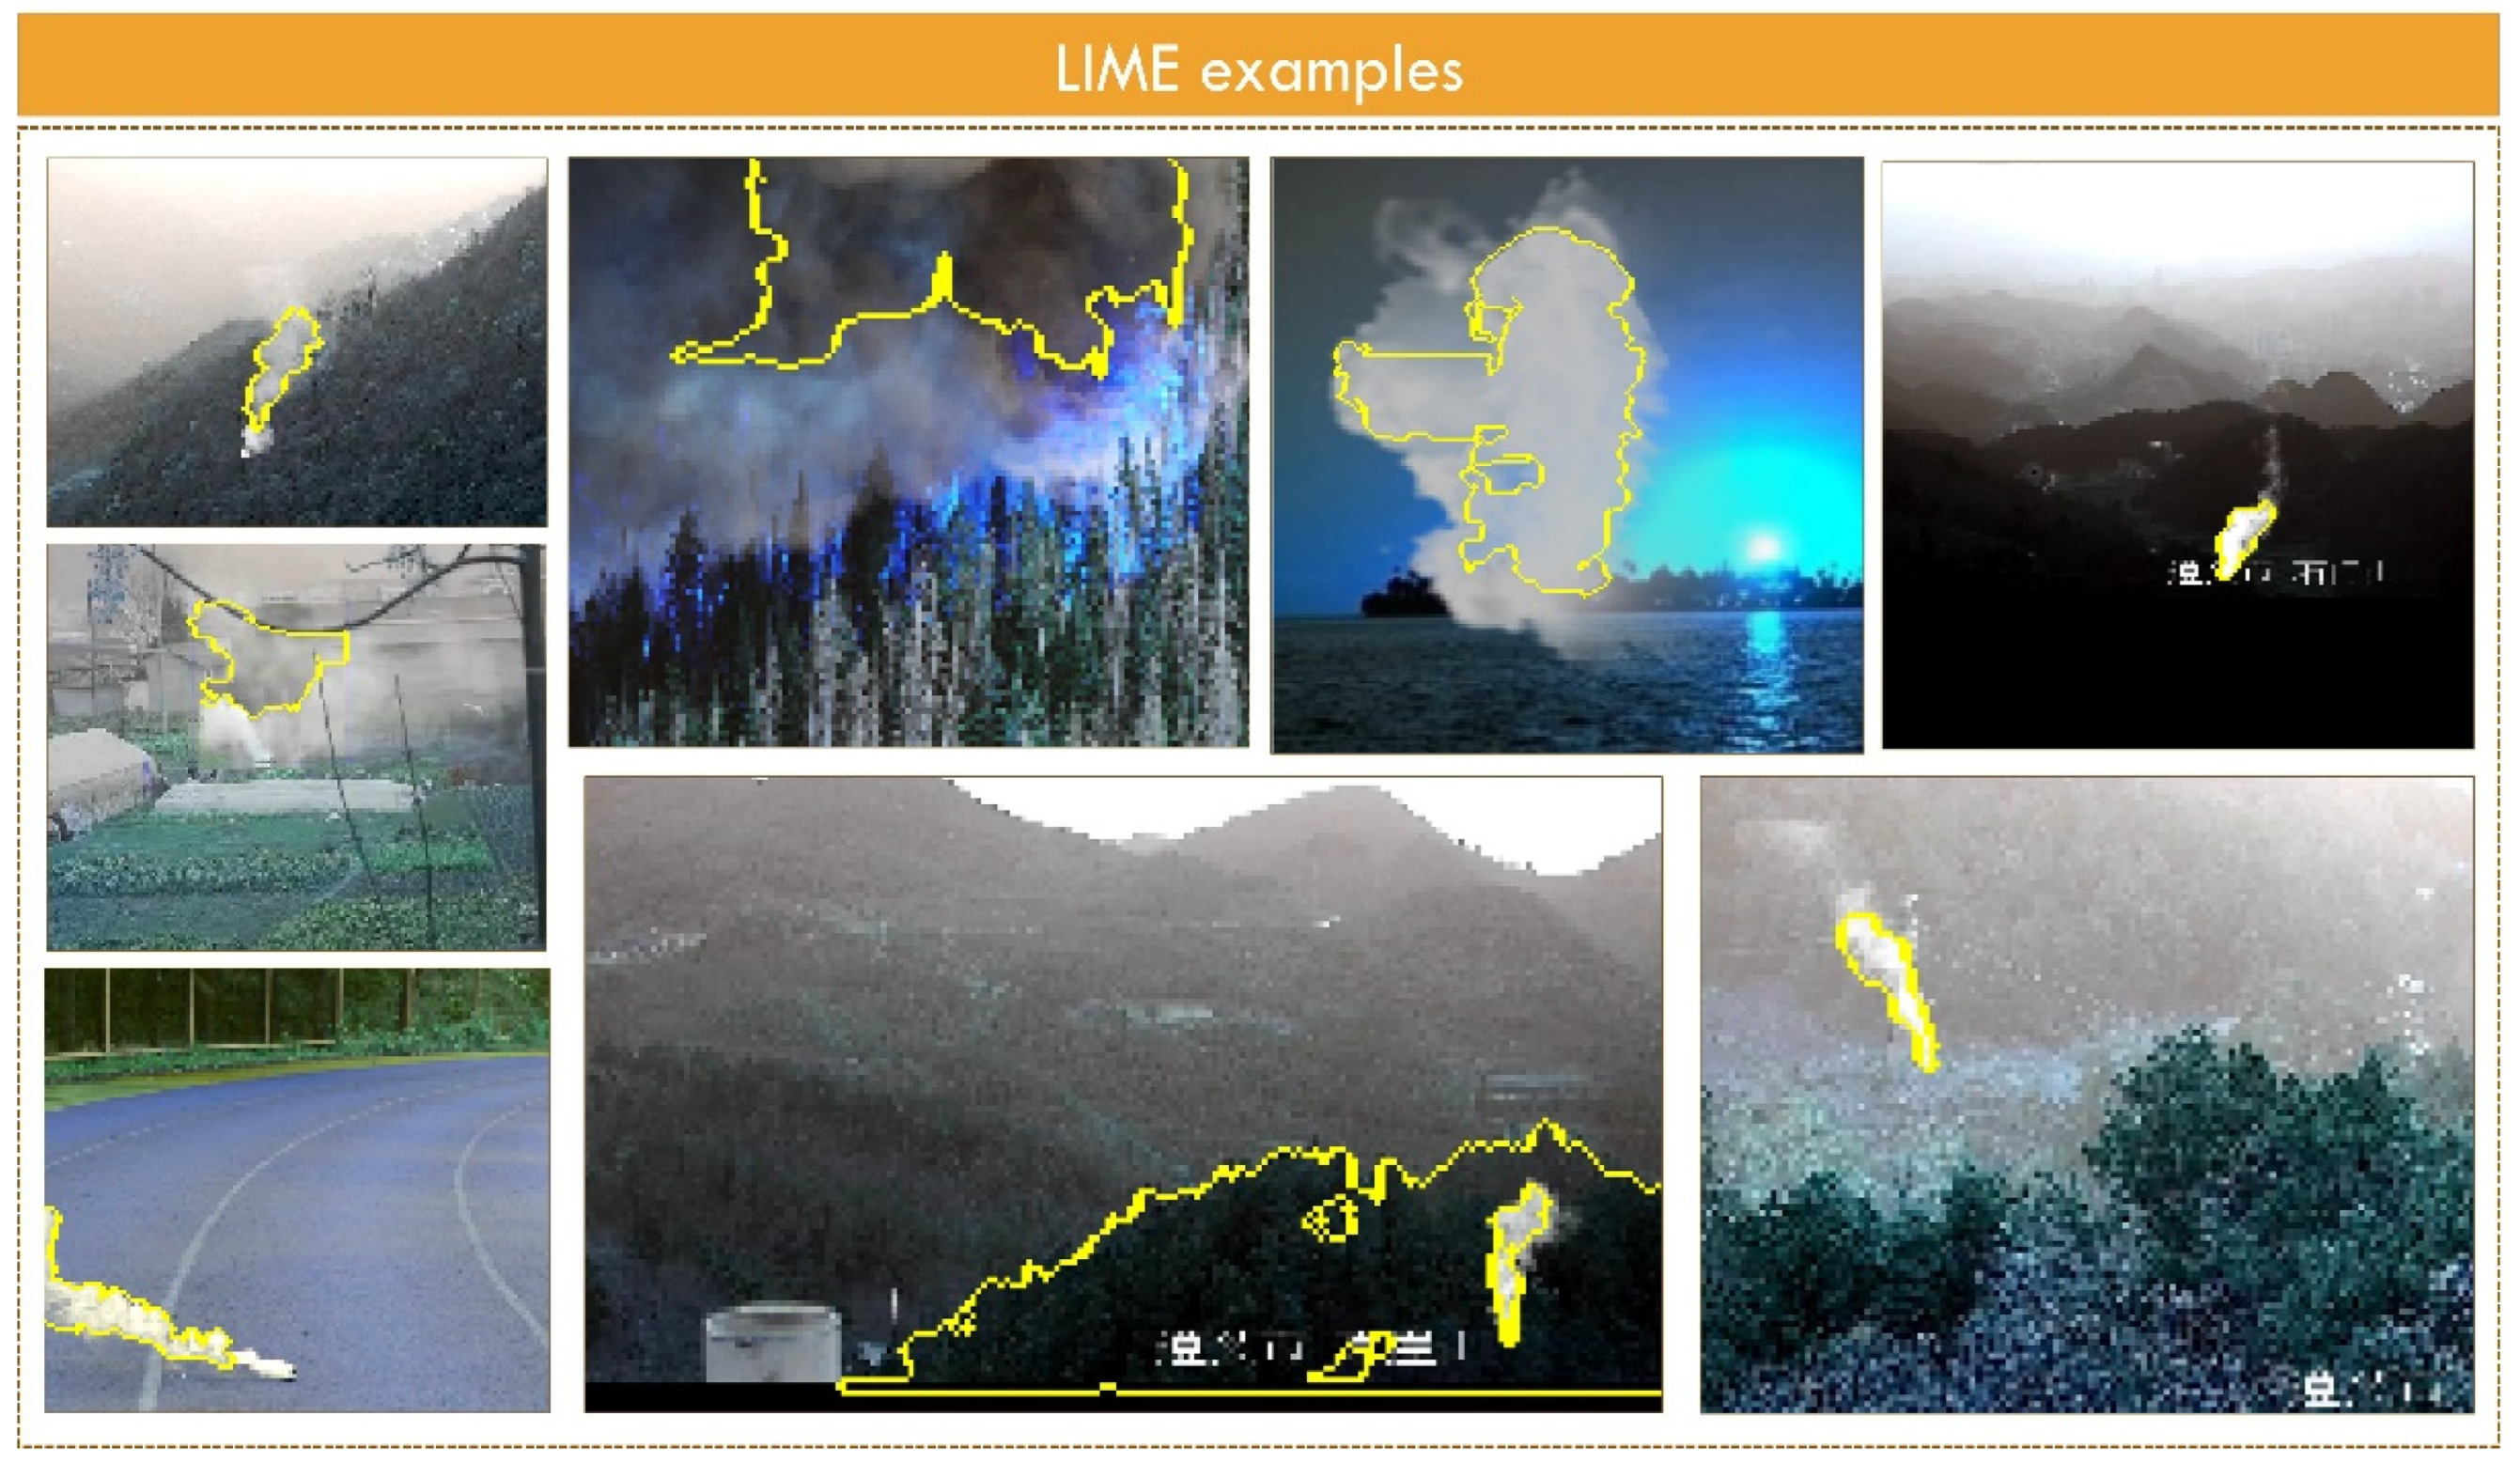
We illustrate some examples of the Grad-CAM++ algorithm in Figure 3.
As observed, Grad-CAM++ identifies significant areas of interest in many cases. However, its localisation capability is limited. There are examples where, besides the actual fire-related areas of the image, the algorithm highlighted irrelevant locations, even in red. It is highlighted that the visual inspection of the complete dataset is impossible due to its size. However, we did inspect 500 images similar to the ones presented in Figure 3. Therefore, we selected the most representative samples to highlight the effectiveness of Grad-CAM++ and its limitations, as observed from those samples.

4.3. LIME Outputs

LIME provides more straightforward explanations compared to Grad-CAM++ (Figure 4). The suggested areas are well-defined and easy for a human reader to understand if the model seeks the right direction. It is highlighted that the visual inspection of the complete dataset is impossible due to its size. However, we did inspect 500 images similar to the ones presented in Figure 4.
Though LIME is not expected to perform a complete and robust segmentation of fire-related findings, it reveals if CNN has learned to identify fire and smoke-related incidents. Therefore, we do not judge if the segmentation is correct and contains the complete findings but if it corresponds to a fire/smoke-related area. There are cases, however, where LIME identifies large areas on the image. Cases like these are inconclusive since they may or may not contain actual findings.
A visual cross-inspection of LIME and Grad-CAM++ revealed that both methods capture the same regions as the most significant ones. Hence, both methods can provide a reliable verification that the model learns where the desired incidents are. In addition, LIME can provide a more precise detection method.

4.4. Alternative Learning Methods

Transfer learning has been the selected method for training the models so far. In this experiment, we validate the performance of transfer learning against other training methods. Firstly, Xception is trained entirely from scratch. We only borrow its architecture, and the network’s layers are trainable. Secondly, we experiment without feature extraction from images. The image is first flattened and then classified from the Neural Network of 1500-500-2 nodes. Table 6 summarises the results.
Training from scratch caused model underfitting and severely increased the training time. The underfitting issue may have happened due to the images’ significant variations in fire and smoke events. In essence, despite the size of the dataset, Xception is still unable to learn how to detect smoke or fire in various scenes. This result confirms the effectiveness of transfer learning as far as the particular dataset is concerned.
Performing direct pixel-to-pixel classification using the NN did not produce optimal results. The NN performed worse than any CNN, obtaining an accuracy of 0.7418. This is due to the nature of NN, which cannot capture spatial information gathered in small image neighborhoods, due to the absence of filters. As provided by Xception, Feature extraction layers proved to be essential for this task.

5. Discussion

The study evaluated 17 state-of-the-art CNNs for detecting fire and smoke incidents from various images. The dataset captured many sceneries, ranging from large forest fires to small smoky buildings and vehicles. Joining several databases and trying to build models that can recognise the presence of smoke or fire is a strong point of this work.
It is demonstrated that most of the deployed CNN models are capable of this task. Xception stood out in this challenge, reaching 0.9881 accuracy in detecting such events. The rest of the CNNs showed remarkable but inferior results. The study revealed that transfer learning benefited Xception, despite the nature of the ImageNet [21] dataset, which did not contain fire/smoke-related scenery. However, models trained in the ImageNet database have proven to be excellent feature extractors for other image classification tasks [33,34]. Therefore, though the selection of transfer learning is still theoretically unjustified [35], the performance of transferred models makes the authors’ selection fairly justified.
A key focus of the study was to evaluate post hoc explainability methods. Grad-CAM++ and LIME were deployed to observe the suggested regions of interest and offer a more in-depth evaluation of the model’s performance. Firstly, both methods demonstrated Xception’s ability to identify fire and smoke-related incidents in the right locations of the image. Secondly, both methods agree on the suggested locations, strengthening the abovementioned outcome. Though the black-box nature of CNNs is not entirely tackled, these post hoc algorithms provided the first evidence that Xception has learned how to distinguish fire and smoke-related events from a set of other objects and scenery. Future studies shall provide deeper insight into the algorithms and the feature extraction layers.
Timing and computational resources are fundamental to modern applications. Xception processes a new image in 0.09 s, allowing for a maximum of 10 frame-per second video classification. However, since LIME is a time-consuming method (approximately 5 s per image), real-time application is prohibited. On the other side, Grad-CAM++ processes an image in less than 0.04 s because it only needs a feedforward operation of the Xception network to produce the result. Therefore, the combination of Grad-CAM++ and Xception would provide a decision in 0.14 s, allowing for seven frame-per second videos if used on a monitoring device.
The most significant limitation of the study is the preliminary inspection of the Grad-CAM++ and LIME outputs. This was due to the large-scale datasets, which hindered the cross-examination of thousands of images. Hence, there may be cases where these methods disagree, or the suggested areas are irrelevant. The human readers (i.e., the authors) visually inspected 500 images (around 1% of the dataset). A second limitation is the deployment of general pretrained CNNs, which, though undeniably successful, may be inferior to specially designed handcrafted networks that exhibit even better performance. Thirdly, only two post hoc explainability methods were employed.
The study aimed to perform object detection via object classification. That is the case when the available data are not annotated, making the training of object-detection models impossible. However, the models showed optimal performance in distinguishing between PoFS and normal images and revealing where the fire/smoke was.

6. Conclusions and Future Research

With the effects of climate change impacting human lives more and more, society needs modern solutions for limiting the destructive effects of a series of relevant phenomena. In the case of fire prevention, pioneering IoT devices and UAVs can aid in timely fire and smoke event detection. Such solutions require less human intervention in locating incidents due to artificial intelligence. This study suggests the Xception network for swiftly detecting such events from various images. In experiments on a dataset of thousands of related images, Xception manages to locate suspicious incidents with an accuracy of 98.81%, whilst the post hoc explainability methods of Grad-CAM++ and LIME confirm that Xception locates the relevant events correctly in the images.
Future research directions are always needed to further the added value of any present study. The underlined limitation, as discussed above, must be further investigated. More methods than the two post hoc explainability ones must be considered. In addition, methods of fuzzy logic and Fuzzy Cognitive Maps (FCM) need to be utilised to further investigate the timely fire and smoke event detections. Previous studies in other scientific fields, such as medicine [36], industry [37], energy [38], and agriculture [39], have provided promising and encouraging results.

Author Contributions

Conceptualization, I.A.; Data curation, I.A.; Formal analysis, I.D.A. and M.T.; Investigation, I.D.A.; Project administration, M.T.; Resources, I.A.; Software, I.D.A.; Supervision, P.P.G.; Visualization, I.D.A.; Writing—original draft, I.D.A.; Writing—review and editing, I.A., M.T. and P.P.G. All authors have read and agreed to the published version of the manuscript.

Funding

This research received no external funding.

Data Availability Statement

The data presented in this study are openly available.

Conflicts of Interest

The authors declare no conflict of interest.

References

  1. Berrang-Ford, L.; Ford, J.D.; Paterson, J. Are We Adapting to Climate Change? Glob. Environ. Change 2011, 21, 25–33. [Google Scholar] [CrossRef]
  2. Ruddiman, W.F. How Did Humans First Alter Global Climate? Sci. Am. 2005, 292, 46–53. [Google Scholar] [CrossRef]
  3. Mitchell, J.F. The “Greenhouse” Effect and Climate Change. Rev. Geophys. 1989, 27, 115–139. [Google Scholar] [CrossRef]
  4. Xu, W.; He, H.S.; Huang, C.; Duan, S.; Hawbaker, T.J.; Henne, P.D.; Liang, Y.; Zhu, Z. Large Fires or Small Fires, Will They Differ in Affecting Shifts in Species Composition and Distributions under Climate Change? For. Ecol. Manag. 2022, 510, 120131. [Google Scholar] [CrossRef]
  5. Krikken, F.; Lehner, F.; Haustein, K.; Drobyshev, I.; van Oldenborgh, G.J. Attribution of the Role of Climate Change in the Forest Fires in Sweden 2018. Nat. Hazards Earth Syst. Sci. 2021, 21, 2169–2179. [Google Scholar] [CrossRef]
  6. Abram, N.J.; Henley, B.J.; Gupta, A.S.; Lippmann, T.J.R.; Clarke, H.; Dowdy, A.J.; Sharples, J.J.; Nolan, R.H.; Zhang, T.; Wooster, M.J.; et al. Connections of Climate Change and Variability to Large and Extreme Forest Fires in Southeast Australia. Commun Earth Environ. 2021, 2, 8. [Google Scholar] [CrossRef]
  7. Michetti, M.; Pinar, M. Forest Fires Across Italian Regions and Implications for Climate Change: A Panel Data Analysis. Environ. Resour. Econ. 2019, 72, 207–246. [Google Scholar] [CrossRef] [Green Version]
  8. Khan, F.; Xu, Z.; Sun, J.; Khan, F.M.; Ahmed, A.; Zhao, Y. Recent Advances in Sensors for Fire Detection. Sensors 2022, 22, 3310. [Google Scholar] [CrossRef]
  9. Allison, R.S.; Johnston, J.M.; Wooster, M.J. Sensors for Fire and Smoke Monitoring. Sensors 2021, 21, 5402. [Google Scholar] [CrossRef]
  10. Gaur, A.; Singh, A.; Kumar, A.; Kumar, A.; Kapoor, K. Video Flame and Smoke Based Fire Detection Algorithms: A Literature Review. Fire Technol. 2020, 56, 1943–1980. [Google Scholar] [CrossRef]
  11. Kim, B.; Lee, J. A Video-Based Fire Detection Using Deep Learning Models. Appl. Sci. 2019, 9, 2862. [Google Scholar] [CrossRef] [Green Version]
  12. Jiao, Z.; Zhang, Y.; Xin, J.; Mu, L.; Yi, Y.; Liu, H.; Liu, D. A Deep Learning Based Forest Fire Detection Approach Using UAV and YOLOv3. In Proceedings of the 2019 1st International Conference on Industrial Artificial Intelligence (IAI), Shenyang, China, 23–27 July 2019; pp. 1–5. [Google Scholar]
  13. Seydi, S.T.; Saeidi, V.; Kalantar, B.; Ueda, N.; Halin, A.A. Fire-Net: A Deep Learning Framework for Active Forest Fire Detection. J. Sens. 2022, 2022, 8044390. [Google Scholar] [CrossRef]
  14. Xue, Z.; Lin, H.; Wang, F. A Small Target Forest Fire Detection Model Based on YOLOv5 Improvement. Forests 2022, 13, 1332. [Google Scholar] [CrossRef]
  15. priya, R.S.; Vani, K. Deep Learning Based Forest Fire Classification and Detection in Satellite Images. In Proceedings of the 2019 11th International Conference on Advanced Computing (ICoAC), Chennai, India, 18–20 December 2019; pp. 61–65. [Google Scholar]
  16. Khan, S.; Muhammad, K.; Hussain, T.; Ser, J.D.; Cuzzolin, F.; Bhattacharyya, S.; Akhtar, Z.; de Albuquerque, V.H.C. DeepSmoke: Deep Learning Model for Smoke Detection and Segmentation in Outdoor Environments. Expert Syst. Appl. 2021, 182, 115125. [Google Scholar] [CrossRef]
  17. Peng, Y.; Wang, Y. Real-Time Forest Smoke Detection Using Hand-Designed Features and Deep Learning. Comput. Electron. Agric. 2019, 167, 105029. [Google Scholar] [CrossRef]
  18. LeCun, Y.; Bengio, Y. Convolutional Networks for Images, Speech, and Time Series. Handb. Brain Theory Neural Netw. 1995, 3361, 1995. [Google Scholar]
  19. LeCun, Y.; Bengio, Y.; Hinton, G. Deep learning. Nature 2015, 521, 436–444. [Google Scholar] [CrossRef]
  20. Szegedy, C.; Liu, W.; Jia, Y.; Sermanet, P.; Reed, S.; Anguelov, D.; Erhan, D.; Vanhoucke, V.; Rabinovich, A. Going deeper with convolutions. In Proceedings of the IEEE Conference on Computer Vision and Pattern Recognition, Boston, MA, USA, 7–12 June 2015; pp. 1–9. [Google Scholar]
  21. Russakovsky, O.; Deng, J.; Su, H.; Krause, J.; Satheesh, S.; Ma, S.; Huang, Z.; Karpathy, A.; Khosla, A.; Bernstein, M.; et al. Imagenet Large Scale Visual Recognition Challenge. Int. J. Comput. Vis. 2015, 115, 211–252. [Google Scholar] [CrossRef] [Green Version]
  22. Tang, Y. Deep Learning Using Linear Support Vector Machines. arXiv 2013, arXiv:1306.0239. [Google Scholar]
  23. Le, Q.V.; Ngiam, J.; Coates, A.; Lahiri, A.; Prochnow, B.; Ng, A.Y. On optimization methods for deep learning. In Proceedings of the 28th International Conference on International Conference on Machine Learning, Bellevue, WA, USA, 28 June–2 July 2011. [Google Scholar]
  24. Goodfellow, I.; Bengio, Y.; Courville, A. Deep Learning; MIT Press: Cambridge, MA, USA, 2016. [Google Scholar]
  25. Kingma, D.P.; Ba, J. Adam: A Method for Stochastic Optimization. arXiv 2017, arXiv:1412.6980. [Google Scholar]
  26. Khan, A.; Hassan, B. Dataset for Forest Fire Detection. Mendeley Data V1 2020, 1, 2020. [Google Scholar] [CrossRef]
  27. Oliva, A.; Torralba, A. Modeling the Shape of the Scene: A Holistic Representation of the Spatial Envelope. Int. J. Comput. Vis. 2001, 42, 145–175. [Google Scholar] [CrossRef]
  28. Xu, G.; Zhang, Y.; Zhang, Q.; Lin, G.; Wang, J. Domain Adaptation from Synthesis to Reality in Single-Model Detector for Video Smoke Detection. arXiv 2017, arXiv:1709.08142. [Google Scholar] [CrossRef]
  29. Liu, W.; Wen, Y.; Yu, Z.; Yang, M. Large-Margin Softmax Loss for Convolutional Neural Networks. In Proceedings of the 33rd International Conference on Machine Learning, New York, NY, USA, 19–24 June 2016; Volume 2, p. 7. [Google Scholar]
  30. Barredo Arrieta, A.; Díaz-Rodríguez, N.; Del Ser, J.; Bennetot, A.; Tabik, S.; Barbado, A.; Garcia, S.; Gil-Lopez, S.; Molina, D.; Benjamins, R.; et al. Explainable Artificial Intelligence (XAI): Concepts, taxonomies, opportunities and challenges toward responsible AI. Inf. Fusion 2020, 58, 82–115. [Google Scholar] [CrossRef] [Green Version]
  31. Chattopadhyay, A.; Sarkar, A.; Howlader, P.; Balasubramanian, V.N. Grad-CAM++: Improved Visual Explanations for Deep Convolutional Networks. In Proceedings of the 2018 IEEE Winter Conference on Applications of Computer Vision (WACV), Lake Tahoe, NV, USA, 12–15 March 2018; pp. 839–847. [Google Scholar]
  32. Ribeiro, M.T.; Singh, S.; Guestrin, C. “Why Should i Trust You?” Explaining the Predictions of Any Classifier. In Proceedings of the 22nd ACM SIGKDD International Conference on Knowledge Discovery and Data Mining, New York, NY, USA, 13–17 August 2016; pp. 1135–1144. [Google Scholar]
  33. Apostolopoulos, I.D.; Papathanasiou, N.D.; Apostolopoulos, D.J. A Deep Learning Methodology for the Detection of Abnormal Parathyroid Glands via Scintigraphy with 99mTc-Sestamibi. Diseases 2022, 10, 56. [Google Scholar] [CrossRef] [PubMed]
  34. Apostolopoulos, I.D.; Pintelas, E.G.; Livieris, I.E.; Apostolopoulos, D.J.; Papathanasiou, N.D.; Pintelas, P.E.; Panayiotakis, G.S. Automatic classification of solitary pulmonary nodules in PET/CT imaging employing transfer learning techniques. Med. Biol. Eng. Comput. 2021, 59, 1299–1310. [Google Scholar] [CrossRef]
  35. Huh, M.; Agrawal, P.; Efros, A.A. What makes ImageNet good for transfer learning? arXiv 2016, arXiv:1608.08614. [Google Scholar]
  36. Apostolopoulos, I.D.; Groumpos, P.P. Non-Invasive Modelling Methodology for the Diagnosis of Coronary Artery Disease Using Fuzzy Cognitive Maps. Comput. Methods Biomech. Biomed. Eng. 2020, 23, 879–887. [Google Scholar] [CrossRef]
  37. Apostolopoulos, I.D.; Tzani, M.A. Industrial Object and Defect Recognition Utilizing Multilevel Feature Extraction from Industrial Scenes with Deep Learning Approach. J Ambient Intell Hum. Comput 2022, 1–14. [Google Scholar] [CrossRef]
  38. Vassiliki, M.; Peter, G.P. Increasing the energy efficiency of buildings using human cognition; via fuzzy cognitive maps. IFAC-Pap. 2018, 51, 727–732. [Google Scholar] [CrossRef]
  39. Targetti, S.; Schaller, L.L.; Kantelhardt, J. A Fuzzy Cognitive Mapping Approach for the Assessment of Public-Goods Governance in Agricultural Landscapes. Land Use Policy 2021, 107, 103972. [Google Scholar] [CrossRef]
Figure 1. Dataset creation pipeline.
Make 04 00057 g001
Figure 2. Fire and smoke detection framework.
Make 04 00057 g002
Figure 3. Random samples from the Grad-CAM++ assisted output of Xception CNN. The red color implies areas of high significance according to the model. Green implies medium significance and blue minor sigificance.
Make 04 00057 g003
Figure 4. Random samples produced by LIME applied to Xception CNN. LIME draws a yellow segmentation area around the most significant location according to the model.
Make 04 00057 g004
Table 1. Image sources.
DatasetDOI or LINK
FOREST FIRE IMAGE DATASEThttps://www.kaggle.com/datasets/cristiancristancho/forest-fire-image-dataset, accessed on 13 September 2022
Fire-Detection-Image-Datasethttps://github.com/cair/Fire-Detection-Image-Dataset.git, accessed on 13 September 2022
YOLOv3-for-custum-objectshttps://github.com/amineHY/YOLOv3-for-custum-objects, accessed on 13 September 2022
Fire Images Databasehttps://www.kaggle.com/datasets/gondimjoaom/fire-images-database, accessed on 13 September 2022
Forest Firehttps://www.kaggle.com/datasets/kutaykutlu/forest-fire, accessed on 13 September 2022
Wildfire Detection Image Datahttps://www.kaggle.com/datasets/brsdincer/wildfire-detection-image-data, accessed on 13 September 2022
Fire Datasethttps://www.kaggle.com/datasets/phylake1337/fire-dataset, accessed on 13 September 2022
fire smoke datasethttps://www.kaggle.com/datasets/hhhhhhdoge/fire-smoke-dataset, accessed on 13 September 2022
Dataset for Forest Fire Detection[26]
Fire and Smoke[27]
Smoke[28]
Table 2. Information regarding the dataset of the study.
Dataset FeatureDescription
Incidents of smoke/fireforest, vehicle, building, indoor, road, industrial buildings and machinery
Image acquisition devicesUAV, smartphone cameras, satellite images, surveillance cameras
Image Formatsjpg, png, tiff, gif
Image sizesWidth: 600 to 1200 pixels
Height: 500 to 1080 pixels
Table 3. Deep Learning networks of the study.
NetworkTrainable LayersDense Layers at the Top
XceptionNone1500-500-2
VGG16None1500-500-2
VGG19None1500-500-2
ResNet152None1500-500-2
ResNet152V2None1500-500-2
InceptionV3None1500-500-2
InceptionResNetV2None1500-500-2
MobileNetNone1500-500-2
MobileNetV2None1500-500-2
DenseNet169None1500-500-2
DenseNet201None1500-500-2
NASNetMobileNone1500-500-2
EfficientNetB6None1500-500-2
EfficientNetB7None1500-500-2
EfficientNetV2B3None1500-500-2
ConvNeXtLargeNone1500-500-2
ConvNeXtXLargeNone1500-500-2
Table 4. Performance metrics.
NetworkACCPRERECTNRFPRFNRNPVF1AUC
Xception0.98810.99480.98330.99380.00620.01670.98030.98900.9886
VGG160.98220.99180.97550.99030.00970.02450.97110.98350.9829
VGG190.97450.99180.96130.99040.00960.03870.95510.97630.9759
ResNet1520.94840.98190.92250.97960.02040.07750.91320.95130.9511
ResNet152V20.95160.97560.93460.97190.02810.06540.92520.95470.9533
InceptionV30.95340.96050.95380.95280.04720.04620.94490.95710.9533
InceptionResNetV20.97620.97360.98300.96800.03200.01700.97930.97830.9755
MobileNet0.89230.97300.82560.97250.02750.17440.82270.89330.8990
MobileNetV20.97900.99240.96890.99110.00890.03110.96370.98050.9800
DenseNet1690.96950.98650.95710.98430.01570.04290.95030.97160.9707
DenseNet2010.93850.94940.93720.94000.06000.06280.92570.94330.9386
NASNetMobile0.79040.83850.76280.82350.17650.23720.74280.79890.7931
EfficientNetB60.92880.89670.98280.86400.13600.01720.97660.93780.9234
EfficientNetB70.95610.93900.98330.92330.07670.01670.97880.96070.9533
EfficientNetV2B30.97200.99240.95610.99120.00880.04390.94940.97390.9737
ConvNeXtLarge0.95430.98810.92740.98660.01340.07260.91870.95680.9570
ConvNeXtXLarge0.96720.98260.95690.97960.02040.04310.94970.96950.9682
Table 5. Training and test times in seconds. Training time refers to training using the complete dataset. Test time refers to the time it took for the model to process one image after it was trained.
NetworkTraining TimeTest Time
Xception13130.09
VGG1614270.08
VGG1915870.08
ResNet15214570.08
ResNet152V214930.08
InceptionV313420.09
InceptionResNetV214770.1
MobileNet11050.05
MobileNetV211260.06
DenseNet16912740.05
DenseNet20113550.05
NASNetMobile13040.04
EfficientNetB612270.04
EfficientNetB713640.04
EfficientNetV2B312900.04
ConvNeXtLarge14340.04
ConvNeXtXLarge16510.04
Table 6. Classification metrics when applying alternative learning methods.
MethodACCPRERECTNRFPRFNRNPVF1AUC
CNN: Training from scratch0.65300.63460.67500.32500.36540.70120.60590.66630.6548
Neural Network0.74180.68530.80980.19020.31470.81230.68160.74340.7475
Transfer Learning0.98810.99480.98330.99380.00620.01670.98030.98900.9886
Publisher’s Note: MDPI stays neutral with regard to jurisdictional claims in published maps and institutional affiliations.

