
Introducing Tables to Second-Grade Elementary Students in an Algebraic Thinking Context


1
Department of Mathematics Didactics, Faculty of Education Sciences, University of Granada, 18071 Granada, Spain
2
Department of Education, School of Arts and Sciences, Tufts University, Medford, MA 02155, USA
*
Author to whom correspondence should be addressed.
Mathematics 2022, 10(1), 56; https://0-doi-org.brum.beds.ac.uk/10.3390/math10010056
Submission received: 9 November 2021
/
Revised: 15 December 2021
/
Accepted: 23 December 2021
/
Published: 24 December 2021
(This article belongs to the Special Issue Research on Teaching and Learning Mathematics in Early Years and Teacher Training)
Abstract
:In this study, we adopted a functional perspective on algebra. Our focus was on tables and how they were first used by second-grade elementary school students (7- and 8-year-olds) when working with functions. This qualitative, exploratory, and descriptive study consisted of five classroom sessions and two semi-structured interviews, one group and one individual, two weeks apart, focused on tasks involving different functions and uses of tables, with and without labels for headings. In this study, we ask the following research questions: How do children organise values in tables with or without (a priori) labels for headings? What are the regularities (structures) identified by students? Our data revealed that students were able to organise the values of variables by listing them in columns and labelling the headings (i.e., identifying the variables involved). The ways in which children organised the data in tables enabled us to identify the structures they identified as regularities between the variables involved in the functions. More structures were correctly identified in the second interview compared to the first.
1. Introduction
Mathematical tasks are necessarily performed in a representational context [1]. In this article, we explore second-grade elementary (7- and 8-year-old) students’ uses and interpretations of tabular representations when working with tasks involving generalisations of two different linear functions.
Representing entails changing the appearance of a given data item to view it differently [2]. In mathematics education research, representations have traditionally carried substantial weight in light of their role in building mathematical knowledge [3]. Mathematical representations are closely related to mathematical reasoning, given the significant part they play in the development of students’ reasoning and understanding processes [4]. Learning to use mathematical representations affords students a series of tools that enhance their ability to think about and communicate mathematical ideas [5].
This study specifically addresses tabular representations in a functional context. Functions may help introduce algebra to young children, and different types of representations are embedded within functions; for example, algebraic notations, function tables, and Cartesian coordinate graphs. An early introduction to functional thinking may favour a fuller understanding of the functions and of formal algebra [6].
Tables are a specific and frequently used representational form for recording and organising information that has multiple uses [7]. They are more commonly used in daily life than one might expect. We are all familiar with calendars, timetables (e.g., for trains), weekly school or professional task charts, weather data logs, and matrices with different types of quantitative information in texts such as scientific papers, the media, and books [8]. Children come into early contact with tables in a wide variety of environments. Nonetheless, research has traditionally paid scant attention to tabular representations [8], in contrast to the in-depth study and descriptions of children’s understandings and uses of other function-related representational tools such as variable or symbolic notation and graphs (e.g., [9,10]).
While tables are an essential element in mathematics curricula, little is known about how suitable they may be for understanding functions [11]. In this study, we did not broach functions as posed in secondary education, but rather explored the relationships between variables identified by observing regularities. In functional contexts, the observation of intervariable regularity is known as structure. In elementary education, the identification of intervariable structures encourages functional thinking, thereby favouring algebraic reasoning. Functional thinking is based on the construction, description, and representation of and reasoning with and about functions and their constituent elements [12]. The functional approach includes a number of representations: natural language, function tables, graphs, and symbolic notation.
In this study, we posed the following research questions: How do children organise values in tables with or without (a priori) labels for headings? What are the regularities (structures) identified by students?
2. Functional Thinking and Representations
Functional thinking focuses on the relationships between co-varying quantities [13]. The development of functional thinking fosters the ability to generalise, represent, explain, and reason about mathematical relationships [14], and helps students surmount the difficulties encountered in understanding the very idea of what functions are in secondary education [15]. Elementary school students’ ability to generalise and represent generalisations is consequently of interest in functional contexts (e.g., [16,17,18]). Against this backdrop, generalization may be preceded by the identification of structures ([19,20]), the latter meant as the regularity observed in the variables present in the functions at hand. Structure is defined as the form in which the regularity between specific values of the variables involved is organised or the manner in which generalisation is expressed [17]. The approach implicit in this definition makes it possible to analyse how students interpret regularities and potentially generalise [21,22]. From this perspective, generalising consists in establishing the general structure between covarying quantities.
There are authors who explored elementary school students’ ability to identify structures and generalise in functional contexts, and studied how six 7- to 8-year-old students worked with the function y = x + 3 [18]. Their participants identified four types of structures in the particular cases proposed (y = x + 3, y = x + x, y = x + 2, and y = x + 1), although most correctly generalised the structure as y = x + 3 when asked to generalise, and they consistently identified the same structure in the specific and general cases. The authors represented the structures symbolically as their interpretation of students’ oral or written statements. The authors of [17] also broached structure in a study with 8- to 9-year-olds, who identified 17 structures for the relationships between the variables in y = 2x + 6. While six of the structures (y = 2(x + 2) + 2; y = 2x + 3 + 3; y= 3(x + 2) − x; y = 3x + 1; y = 2x + 2; y = (x + 3) ⋅2; and y = (x + 6) + 2x) were appropriate, the remaining 11 were not. No data on how students used tables to identify structures were reported in these studies.
Observing children’s ability to interpret and represent generalisations provides information on their functional thinking and could provide guidance on how algebra instruction might be broached in elementary school. Underlying any discussion of generalisation among elementary school students is the acknowledgement that such students may use natural language or gestures, as well as algebraic notation, to represent relationships [23]. While the use of letters is essential, thought processes and algebraic activity may be expressed in a number of ways. The types of representations that elementary school students may use while working with linear function problems include (a) spoken natural language; (b) written natural language; and (c) pictorial, (d) numerical, (e) algebraic, (f) tabular, and (g) graphic systems [24]. We define verbal representations as meaning either oral or written natural language. Pictorial and spoken/written natural language are the two predominant types of representations used by students in the early years of schooling. The authors [25,26] noted that students’ natural language representations of particular or general cases gives them the opportunity to use other types of representations. Our focus in this study was on tabular representations.
3. Tabular Representations
This study is part of a broader research project about algebraic thinking at different educational levels. In this study, we focus on one representation, the tabular representation, within a single grade level (7–8-year-old students).
According to [27], representations imply the existence of two interrelated but functionally separate entities, the representative and the represented, and that interconnection between the representative and represented worlds is also implicit in the representative (symbol or representation) and the represented (idea) objects themselves. In our work, tables are the representations and the concepts they refer to are the relationships between the variables involved that we will identify through the structures that students express.
A table is a graphic format in which quantitative information is organised around two axes, one vertical and the other horizontal, in order to systematise interrelated data or elements [28]. The two axes serve to cross-reference the information contained in two sets of variables whose reciprocal relationship is represented. The quantitative data comprising the content in the cells must be interpreted by cross-referencing the concepts represented in the respective columns and rows.
We are interested in children’s interpretations and uses of tables at an early age when they are working with linear functions, given the scarcity of empirical studies specifically focused on children’s use of tables once they are outlined, but with blank cells. The authors of [29] conducted a study with 8- and 10-year-olds to explore how they understood, constructed, and what they thought about tables when working with additive interrelationships. The task they designed for the students revolved around three siblings who put the money received from their grandmother in a money box. The grandmother increased the amount she gave the children by one dollar per day, from day one to day three. Each grandchild started out with a different amount of money. Of the 39 students interviewed, 22 opted to build chronological tables. They labelled the columns with the names of the three characters and designated the rows by days of the week, so that the downward flow along a column reflected the number of days. The children had worked with tables in earlier classroom sessions, although they were given no template for this task. The authors of [8] adopted a similar approach to explore 8- to 11-year-old students constructing tables. In this case, as the researchers did not specify for students the type of representation requested, a wider variety of responses was observed. Although both studies focused on tabular representations, neither addressed students’ recognition of structures through the use of tables, as we will do in this study.
Both of these studies analysed the characteristics of the tables constructed by children to explore how they worked on tasks by constructing a table with which to systematically organize a set of data. According to [8], construction is the sole phase in which tables serve as an actual cognitive tool for re-organising information and effectively solving a problem. Nonetheless, as tables seldom constitute the object of classroom instruction, the functional tasks that can be performed with tables have conventionally been confined to interpreting and, on occasion, filling in the blank cells in a table.
Although the information in tables usually requires reading, studies on writing and number notation among preschool children have shown that the ability to interpret a notation does not necessarily imply that a child can construct or use it to solve a problem [29,30].
Our research explored another pathway for the study of tables in the context of learning, by giving students tables with blank cells and with columns and rows sometimes labelled. The authors of [31] conducted a study with 22 children, all 6 years old, and asked them to solve problems involving addition or subtraction. According to these authors, the tools that proved to be most useful for the children were tables with unlabelled headings, and secondarily pen and paper. However, this study did not explore the interrelationship between the use of tables and the identification of structures, as ours will do.
In this study, we analysed how children used empty tables with or without pre-established labels for headings when working with a series of linear functions, so as to gain some insight into the extent to which they had internalised an intervariable relationship on the basis of the structure they identified in the tables.
4. Research Objectives
We explored second-grade elementary (7- and 8-year-old) students’ interpretations of tables when working with two tasks involving generalisation, each focused on a different linear function. This article describes how they organised values in a table, identifying the implications of the respective labels for the headings (identification of the variables) and how they identified intervariable regularity (the structure).
5. Materials and Methods
We carried out a qualitative, exploratory, and descriptive study. We worked with the paradigm of design research and developed a teaching experiment that included instructional sessions [32]. Teaching experiments are frequently used in design research [33]. As we have done in this study, classroom teaching experiments are often complemented with semi-structured group or individual interviews.
This study consisted of five classroom sessions and two semi-structured interviews—the first was a group interview and the second was individual. Session and interview timing and the functions involved are provided in Table 1. All the functions entailed a multiplicative relationship, an additive relationship, or both. Based on existing recommendations (e.g., [16]), as the study was focused on elementary education students, it was limited to linear functions (y = mx + n, where m and n, domain and codomain, were natural numbers). All 24 students in a single classroom participated in the classroom sessions.
In keeping with the main aim of the larger study—to explore how students identified structures in different contexts—the purpose of the first four sessions was to explore how students identified the structures in the relationships between variables. We subsequently focused on the representations they used to express the relationships that the students identified.
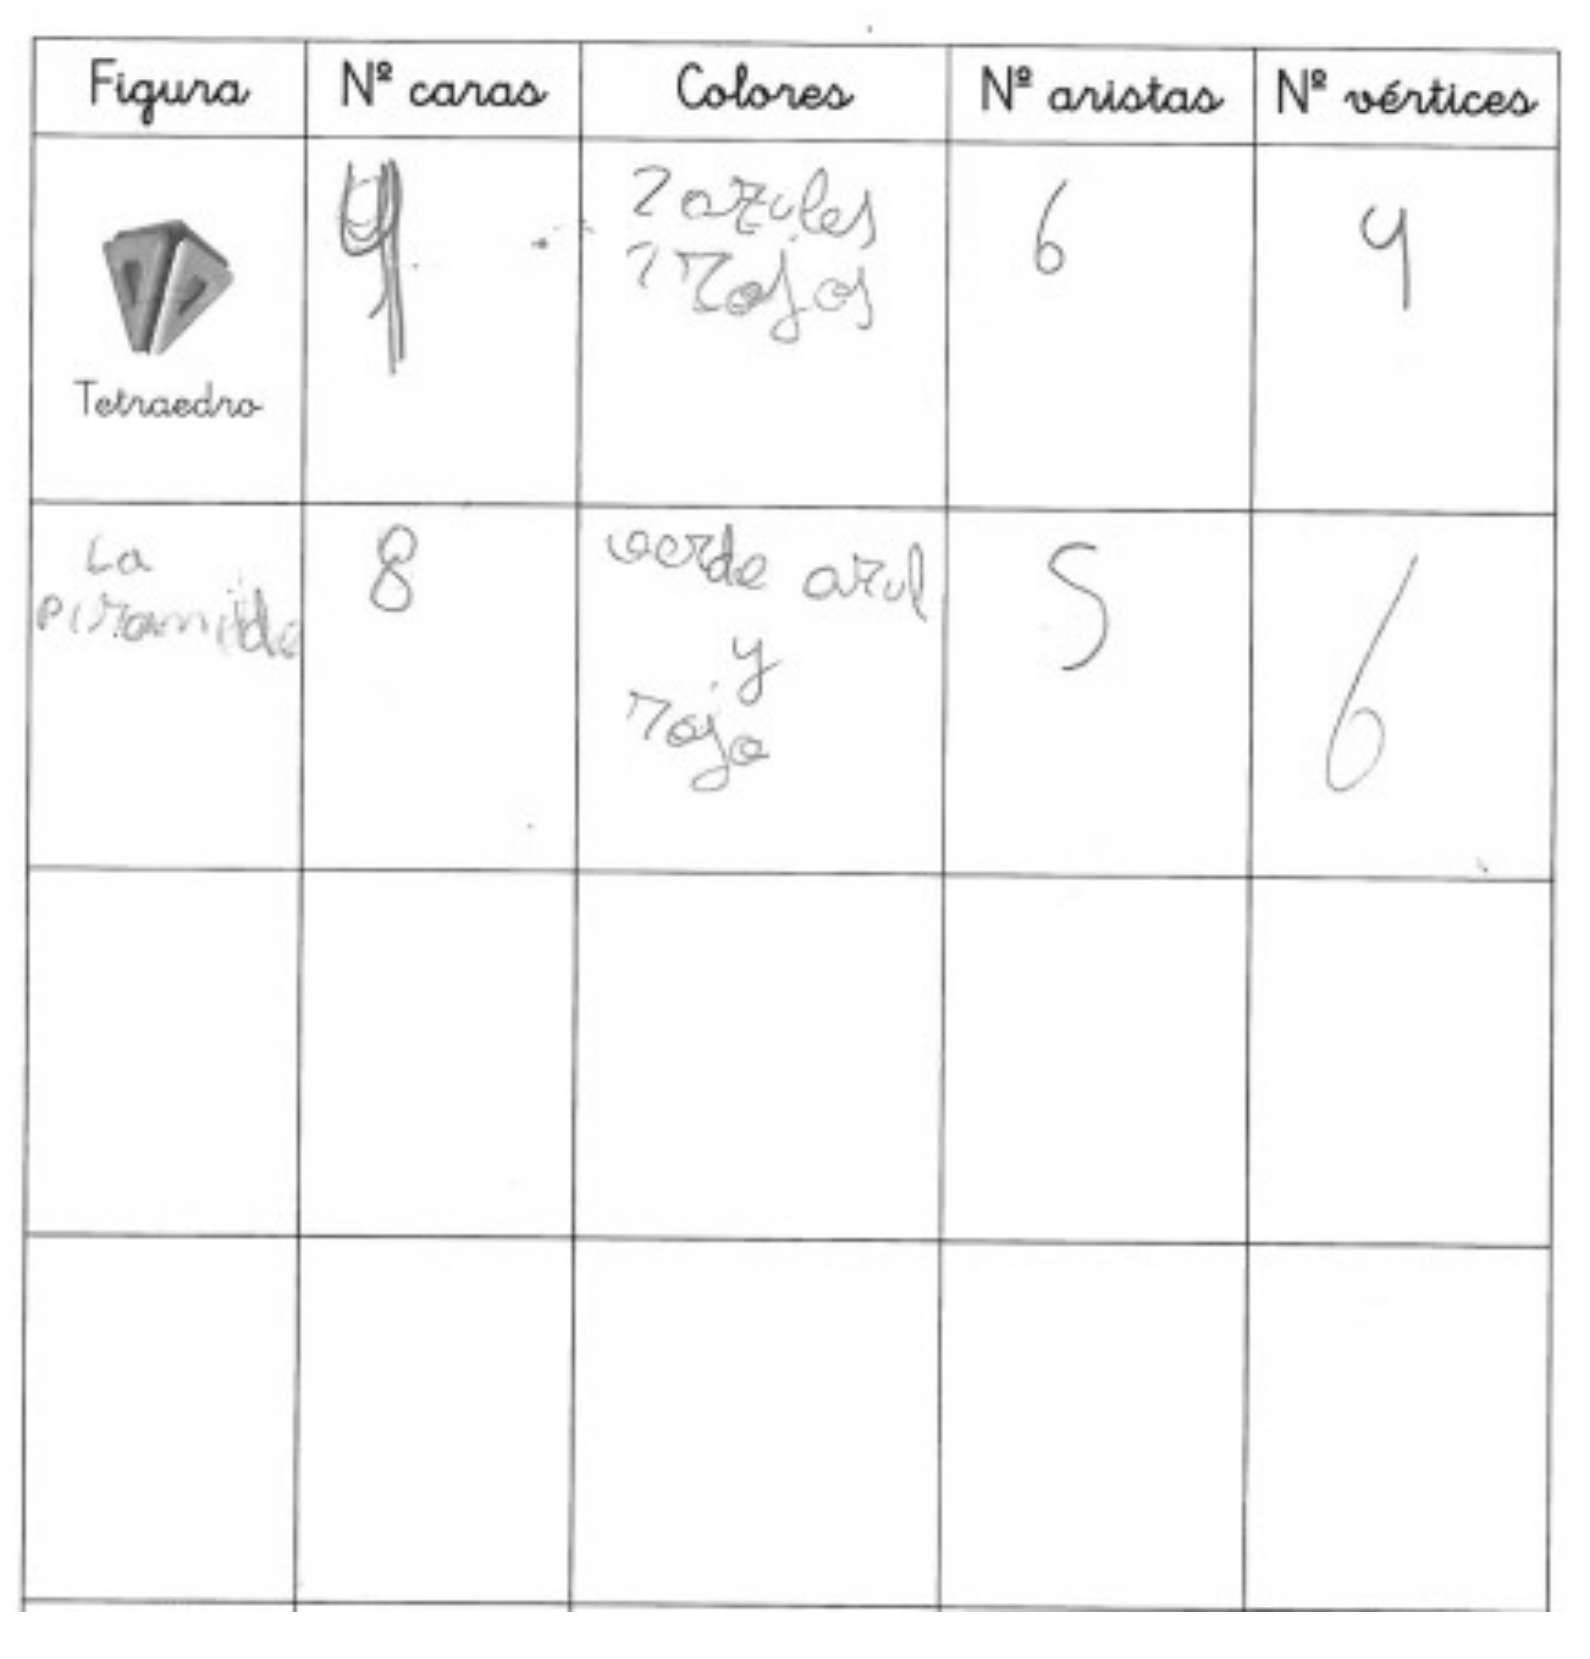
The purpose of session 5 was to introduce students to tabular representations, which they had not previously worked with. No functional context was included so as to prevent enthusiasm for the activity from waning due to the repetition of the same dynamics from earlier sessions. In session 5, the children were taught how to fill in the cells in a blank table in which the headings were labelled to specify different types of polyhedrons and their characteristics: number of surfaces, vertices, edges, and so forth. The students were provided with materials to build the figures and a worksheet with the table printed on it to record the geometric characteristics. The worksheet used by one of the students in session 5 is reproduced in Figure 1. Classroom sessions were held once a week—the first interview took place two weeks after session 5, and the second interview two weeks after the first.
5.1. Participants and School
The participants in this study were four second grade (7- to 8-year-old) elementary school students (Alba, Ángel, Darío, and Lola, all pseudonyms) in a Spanish charter school, in the academic year 2017/2018, whose students were primarily from low-income backgrounds. The school, which was participating in a social and educational transformation project (Comunidades de aprendizaje, learning communities) geared to its students’ social profile, was chosen deliberately because of its availability.
We selected four of the 24 students in the second-grade class who had been present in all five sessions and both interviews, and whose parents had provided consent and they had provided assent. The selection of the students for interviews was also based on the classroom teacher’s assessment of students’ academic achievement, attitude, and predisposition to participate actively in the interviews.
We took into account students’ prior knowledge, based on the curriculum and the information provided by the classroom teacher, for the design of the sessions: numbers from 0 to 399, comparison of numbers, and addition and subtraction operations with carry. Students had not had experiences working with linear functions, generalising, or representing data in tables prior to session 5, described above. As is frequent in much design research, one of the researchers on the team was the teacher-researcher for the five sessions, and also led the group and individual interviews.
5.2. Data Collection
In this study, we focused on the data drawn from the interviews, which were designed along the lines recommended in the [34] model on inductive reasoning focused on generalisation. This model begins with particular cases and gradually works up to general questions, enabling researchers to observe how students generalise structures initially identified in particular cases.
The interviewer (member of the research team) introduced the tasks, beginning with particular cases involving small non-consecutive (to prevent students from using recursive patterning) quantities, which were then gradually increased. The terms “a lot of” and ‘infinite” were used as indeterminate quantities to encourage generalisation. During the interviews, students were given worksheets containing tables and blank sheets that they could use to record their work. The interviews, video-recorded and held two weeks apart, aimed to provide deeper insight into the students’ interpretations of tabular representations and how tables connected to the structures students identified. The interviewer was accompanied by another member of the team who was watching the camera to record.
5.2.1. Interview 1
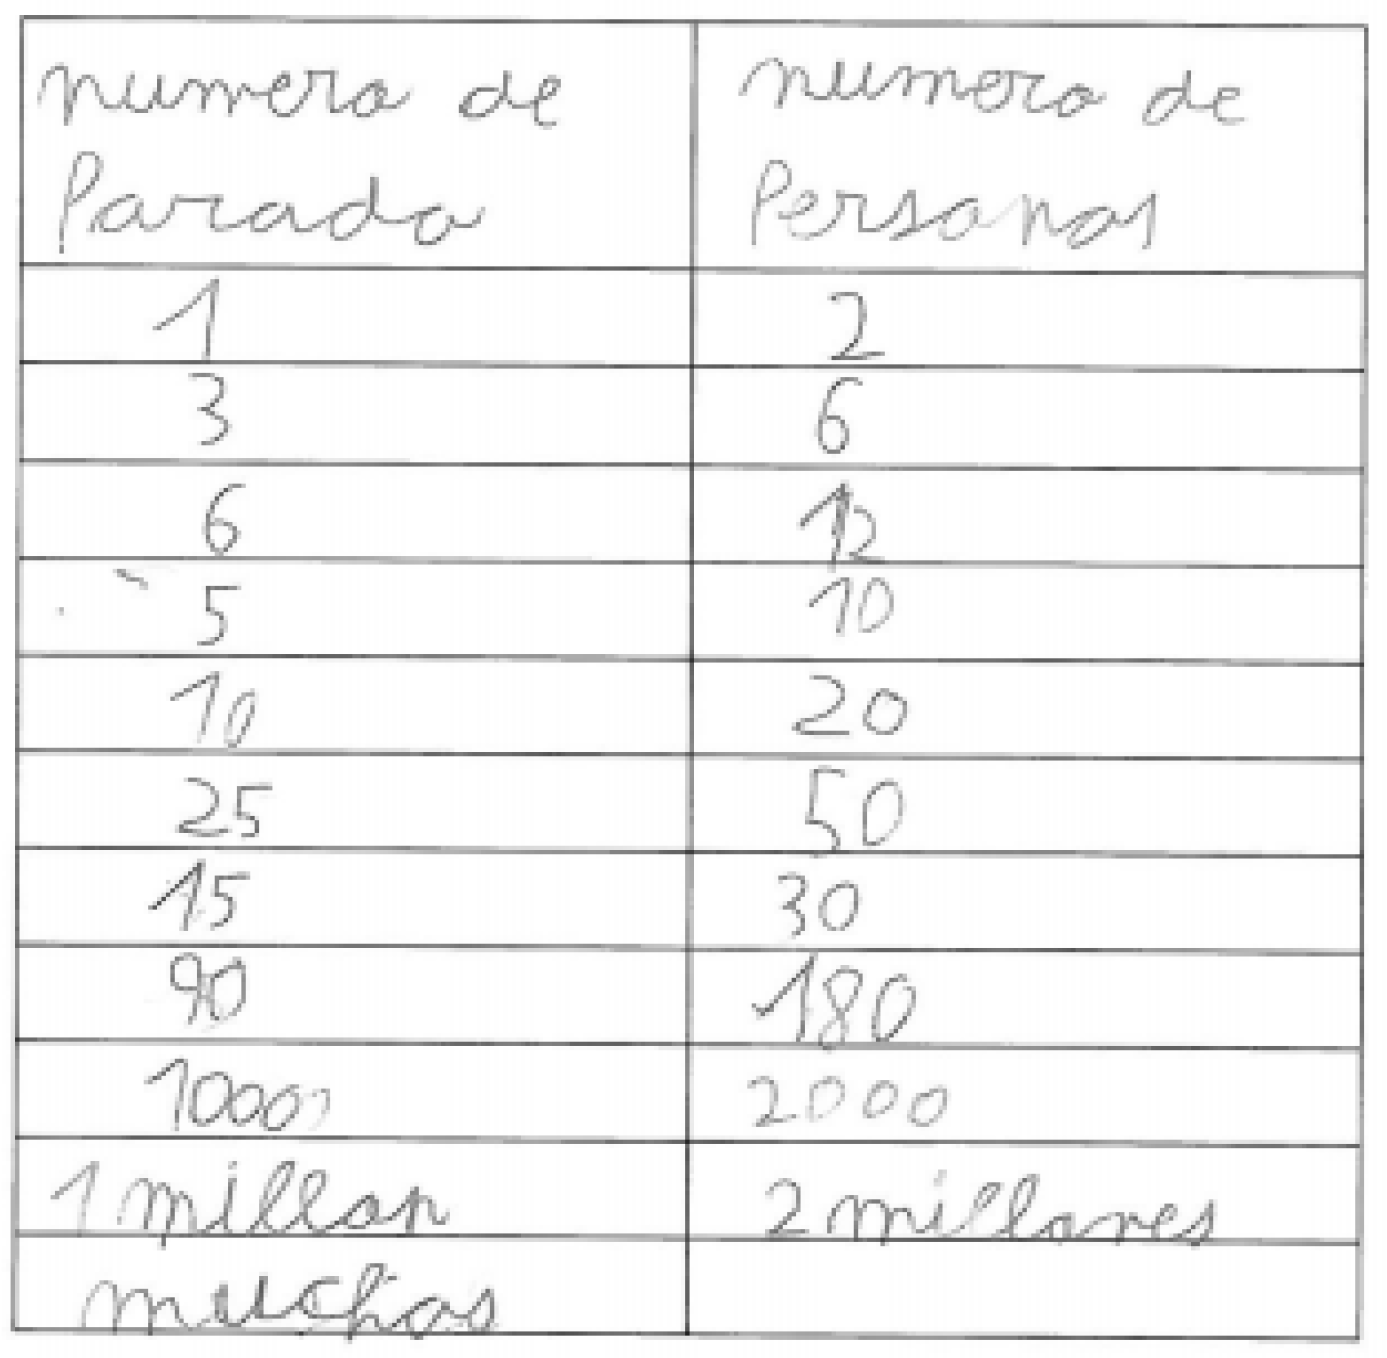
Interview 1 was a group interview in which all four students participated with the goal of obtaining a larger number of reactions that would help us explore their thinking. We introduced the interview 1 task as follows: “Elsa’s friends are taking a train to go to her birthday party. Just two people board the train at each stop”. In this interview, the students were given a worksheet each with the blank table, as shown in Figure 2. They were encouraged to share their responses.
The task continued with questions on particular cases: “How many passengers would be on the train after three stops?” “And after five? ...”. The students gave different responses in which we could observe if they expressed some structures for the relationship between the variables. We then asked about their interpretation of the table: “Do you remember using something like this before?”; “How could you put the information given in the problem in the table?”; “How can we show the number of train stops and the number of passengers in the table?”.
Once we felt sure the students understood the situation, we continued to pose questions: “What could we put in the column headings to organise the information in the problem?”; “Can you think of something?”; “How are all the numbers in the first column related?”; and “How are the numbers in one column related to the ones in the other?”.
After they answered the questions about particular cases, we went on to ask about the general case with the use of indeterminate terms: “We want to know how many people will be on the train after a lot of stops”; “How can we know how many passengers are on the train?”; “How would you explain to a friend how many people would have boarded after an infinite number of stops?”; and “Do you think using this table can help us find the number of people there are if we know the number of stops?”.
We then gave students a second worksheet to explore the intervariable relationships more closely. They were discussing and agreeing their answers. Worksheet 2 contained incorrect values intended to prompt them to explain their reasons for correcting the errors and identifying the correct values. The idea was to explore the data collected with worksheet 1 to identify the structure recognised by each student in this task and their understanding of the values pre-printed in the table. Worksheet 2 is depicted in Figure 3.
5.2.2. Interview 2
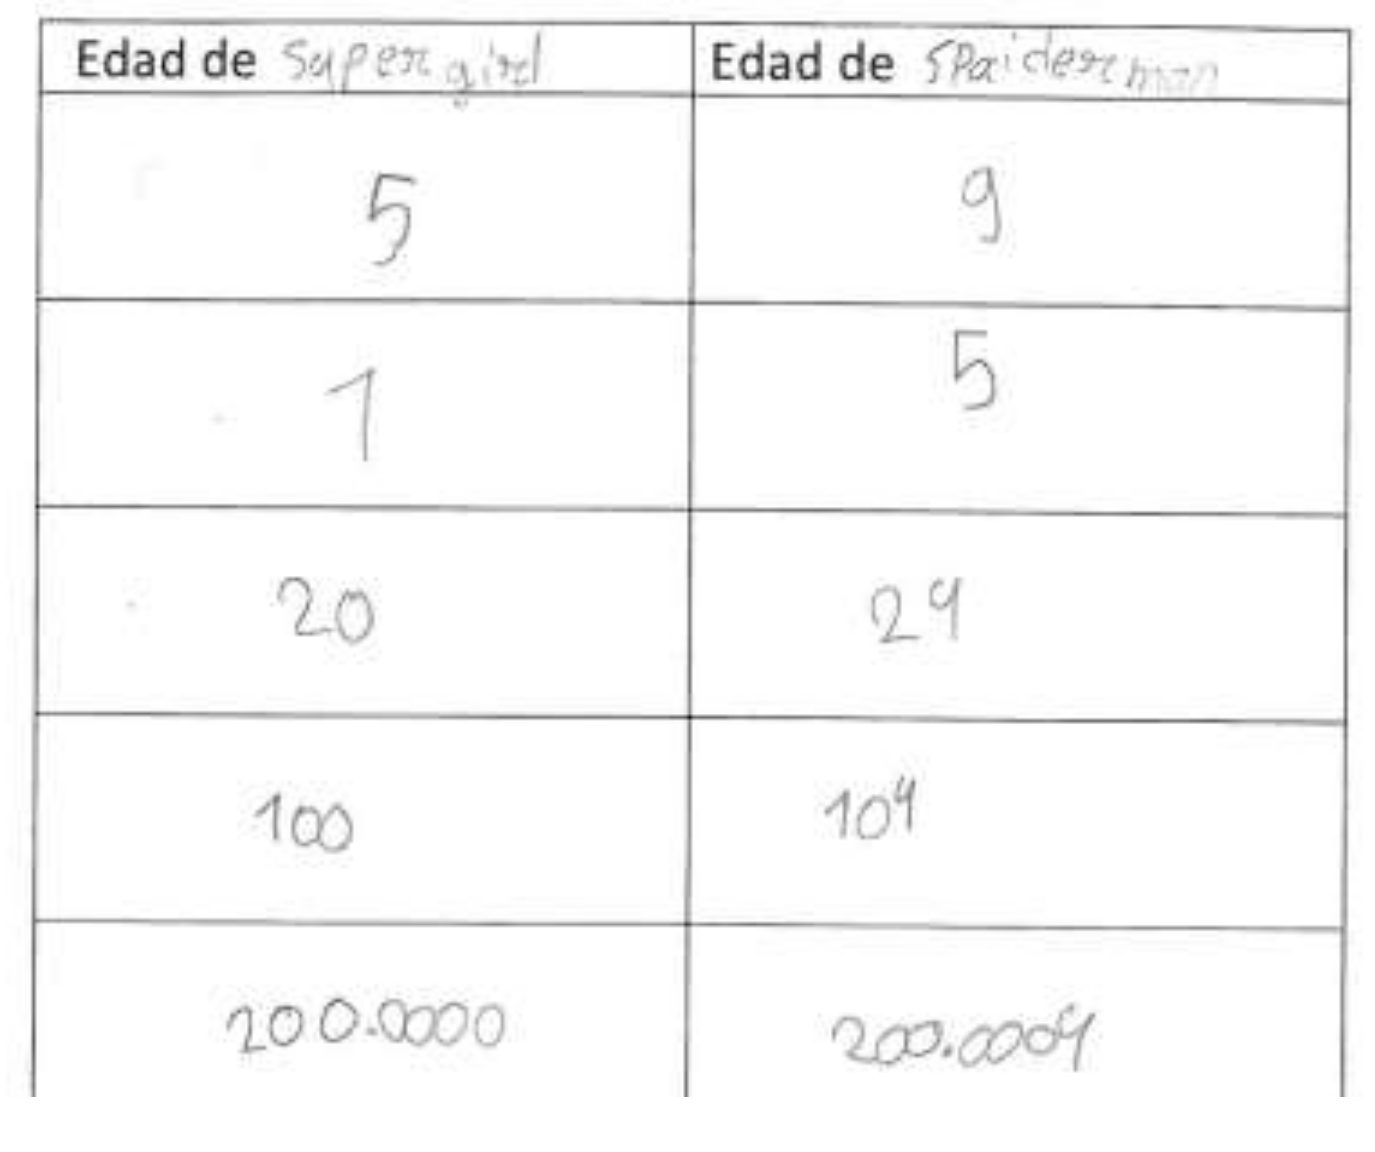
The generalisation task set up for individual interview 2, focused on the ages of two superheroes, was introduced in the following way: “Two superheroes, Iron Man and Captain America, have birthdays on the same day”. Similar to interview 1, we then gave students a series of non-consecutive (to avoid recurrence) examples: When Iron Man was 5 years old Captain America was 9, when Iron Man was 7 Captain America was 11, and when Iron Man was 3 Captain America was 7. We subsequently gave students a worksheet with a two-column table with identical but incomplete headings (“Age of…”) and space to write in each superhero’s name (see Figure 4).
The interview 2 table headings are hints, but they do not correspond to the labels of the headings as they do not include the full names of the variables. The first few particular cases were followed with others involving larger quantities: 23, 30, and 52. We also asked the students to propose their own quantities, other than the ones stated: “Choose an age for Iron Man (__). If he is that old, how old is Captain America? How do you know that?”
We concluded by asking them to generalise: “When Iron Man is very old, how old will Captain America be?”; “If Iron Man is infinitely old, how old will Captain America be?”; “How would you explain to friends what they have to do to figure out Captain America’s age?”; or, for instance: “One of your classmates said that ‘When Iron Man is XX (We did not use the letters XX or YY during the interviews. We use these symbols to refer to any example.), Captain America is YY.’ Do you agree?”. These questions were intended as support for the students to identify different structures for the intervariable relationship.
We included questions in interview 2 analogous to those described in interview 1 based on exploring their reasoning about tabular representations.
5.3. Data Analysis
After transcribing the interviews verbatim, we defined categories based on students’ ability to interpret and use tables during the tasks. The unit of analysis was each sentence uttered (verbal representation) by a student. In the same way, we analyzed the different worksheets that the students filled out during the interviews. In each interview, we determined whether they could:
- Recognise tables as elements for recording data in different functional contexts functional (yes/no)
- Organise data in the tables during the tasks:
- Did they place data in the appropriate column and row? (yes/no)
- Did they write in or complete the table headings? (yes/no)
- 3.
- Identify structures:
- Did they relate the values of each variable (numbers or quantities) in the two columns to the variables involved, identifying the regularities between them? (yes/no)
- Were the structures correctly identified? (yes/no)
The structures were those identified by the students for both the particular and general cases. A structure was deemed to have been identified when a given student used the same regularity to solve two or more particular cases or when they generalised. As in earlier studies (e.g., [17,35]), this was taken as proof of students’ identification of structure, whether or not the structure was adequate to the relationship at hand.
6. Results
We detail the results obtained in both interview 1 and 2, in this order, attending to the same categories of analysis in both interviews. The differences between the first and second interview findings on tabular representations were subsequently analysed. Examples of students’ worksheets and transcripts of excerpts from the interviews are included below to illustrate the results.
6.1. Tables as a Means to Record Data
This first analytical category was intended to explore students’ prior knowledge of tabular representations. In the group interview 1, only one student (Alba) remembered the tables from the last of the five classroom sessions, although she was not able to name it as a “table.” The other three students did not remember having used a table before, until they were reminded by the interviewer about session 5. The following excerpt from interview 1 illustrates how the table was introduced and how it was remembered.
Interviewer (I): “Today I have brought a task worksheet. Can anyone tell me if they remember what it shows?” (Pointing at the worksheet with a blank table).
All: (No response, thinking).
Lola: “It is an empty piece of paper”.
I: “But there is something drawn on it, right? Let us try to remember”.
All: (No response).
Alba: “Now I remember! We used it with the magnets (referring to lesson 5) when we had to make shapes and describe the details”.
I: “That is it, a table, we wrote in the number of vertices, surfaces, edges… Today we are going to use a table, too, but for another task, OK? Look (reading the train stop task): whenever the train stops, two friends, two people, board. Can we put that information in the table somehow?”.
All: (Silence).
When these questions were posed, the students were looking at the blank table on their worksheets (see Figure 5).
In contrast, by interview 2, the students had become acquainted with tabular representations and the dynamics of generalisation tasks; thus, they were not surprised by the new table they were given during the second interview. Not only did they remember it, but they were comfortable using it as a means to record information.
6.2. Data Organisation in Tables
In the first few cases posed on intervariable relationships, the students had trouble deciding where in the table to place the values of the independent variable (number of train stops). They asked “Where am I supposed to put it?”, as in the following excerpt.
- Interviewer (I): “When the train stops once, how many people get on?”.
- All: “Two” (in unison).
- I: “If two people board every time the train stops, how can we show that on the table?”.
- Darío: “Putting half of the word here and the other half there” (pointing to the two column headings).
- I: “Which half-word do we write in, Darío? Let us see, write down whatever you want”.
- Darío: “Hmmmm (thinking). I do not know”.
- Alba: “Yes, you can, but I do not know where”.
- Ángel: “I do not think you can”.
Up to this point, the students did not know where to place the values of the variables (either by rows or by columns). None knew how to head the columns with labels. Darío was the only student who came close to a suggestion (line 4). The following exchange with the students illustrates how they were taught the procedure for recording data in the table during the first interview.
- 9.
- I: “OK, no problem. Let’ us try something. Let us write number of stops here in this space (heading for left column). Now we are going to try to show that the train stops once and two people get on”.
- 10.
- All: (Still writing nothing)
- 11.
- I: “How could we show that the train stops once?”.
- 12.
- Lola: “Writing it down?”.
- 13.
- I: ‘Yes, but how? What should we write? Any ideas?”.
- 14.
- All: (Shaking their heads no.)
- 15.
- I: “Well, we could write in a ‘1′ under where it says number of stops? The train stops once and two people board each time it stops. We write in the number of people in the second column next to the 1. If the train stops three times, for instance, we write that down underneath the 1”.
The interviewer’s introduction to the process of recording the known values in the table did not interfere with the students’ interpretation and use of the table to guess the structure involved in each task. We will see this later with the analysis of the structures.
A substantial difference was observed in students’ organisation of data in tables between the first and second interviews. In the latter, all four students wrote in the values of the variables for the first few particular cases in the respective columns and also completed the table headings unaided. Their correct completion of the headings was an indication that they had recognised which values referred to the independent and which to the dependent variables. Figure 5 reproduces the table Ángel worked with in the first three particular cases on the superhero ages. He spelled Iron Man using Spanish phonetics (“Airon mam”) and abbreviated Captain America as “c.a.”.
After working with particular cases involving larger quantities, Lola expressed her distaste for the two superheroes, professing a preference for Supergirl and Spiderman. The only assistance she requested was the correct spelling of the superheroes’ names. Lola’s table, reproduced in Figure 6, reflects the particular cases we worked on with her and also shows that she located the variables’ labels and quantities in the correct locations in the table.
As interview 2 was carried out individually with each of the four students, the particular cases listed in their tables differed. The two other students’ responses were similar to those given by Ángel and Lola.
6.3. Identification of Structures
The structures identified in interview 1 for both the particular and general cases are listed in Table 2 (in symbolic format, although the students did not use this type of representation).
All four students identified the structures correctly when working with particular cases, although three did not answer the question for the general case. The following excerpt, a continuation of the one transcribed earlier, illustrates how the students identified structures for the particular cases.
- 16.
- I: “If the train stops three times how many people get on?”
- 17.
- All: “6”.
- 18.
- I: “Why 6?”.
- 19.
- Ángel: “Because 2 plus 2 is and 2 more make 6”.
- 20.
- I: “And how did you do that, Ángel?”.
- 21.
- Ángel: “Well, I multiplied 2 times 3”.
- 22.
- I: “And why did you multiply times 2? What is 2 here?”.
- 23.
- Ángel: “Well, the number of stops”.
- 24.
- I: “Well, let us see, when the train stops three times (pointing to the stops column), how many people (pointing to the number of people column) boarded?”.
- 25.
- All: “6” (all write in 6 in the respective cell).
- 26.
- I: “Alba, can you explain why the answer is 6?”.
- 27.
- Alba: “Because if the train stops three times six people would get on. I multiplied 3 times 2”.
- 28.
- I: “And why times 2, Alba?”.
- 29.
- Alba: “Because 2 means two people”.
- 30.
- I: “Good, now let us think about what happens if the train stops, let us say six times”.
- 31.
- Lola: “Twelve would get on”.
- 32.
- Ángel: “Twelve” (answering a little later).
- 33.
- I: “And now how did you get that answer?”.
- 34.
- Ángel: “Multiplying 6 times 2”.
- 35.
- Darío and Lola: “Multiplying times 2”.
- 36.
- Darío: “Yeah, you always need to multiply”.
- 37.
- I: “Then we can show that in the table: if the train stops six times (pointing to the stops column), what number should we put here?” (pointing to the number of people column).
- 38.
- All: (Writing 12 in the respective cell).
- 39.
- I: “Fine. Now if the train stopped five times, how many of Elsa’s friends could have boarded?”.
- 40.
- All: Ten (answering quickly at the same time; Darío and Alba write the number into the table, now unaided by the interviewer).
- 41.
- I: “OK, and if the train stops ten times?”.
- 42.
- Darío: “Well, it picks up 20 people”.
- 43.
- Ángel and Alba: “20” (answering after Darío).
- 44.
- Ángel: “Now it is 10 times 2”.
Although Ángel initially answered with an additive relationship (line 19), in the remaining cases, his responses, like those of his peers, were indicative of a structure built on a multiplicative relationship (lines 21, 27, 35, and 36). Darío’s remark in line 36 merits comment, for his assertion that “you always need to multiply” illustrates his ability to generalise after working with the first few particular cases.
Three students did not respond to the question regarding the general case in interview 1, possibly due to distraction among them at that point in the conversation. In this group interview (interview 1), it was sometimes difficult to hold all four students’ attention at once. Darío, who identified a correct structure for the function, also generalised claiming “multiplying times 2; you always need to multiply”. However, he did not write in the value corresponding to the case of “a lot of stops” (indeterminate case; see Figure 7).
As for the general case, the following excerpt from the interview illustrates students’ responses:
- 45.
- I: “If the train can carry however many people we want… It is Elsa’s train. For instance, Alba, if the train stops one million times, how many people can board?”.
- 46.
- Darío: “Well, two million” (answering quickly).
- 47.
- Alba: (No answer).
- 48.
- Darío: “But teacher, how do you write one million?”.
- 49.
- I: “You can write it out in words, Darío, no problem”.
- 50.
- Darío: (Writes “one million” in words in the table).
- 51.
- I: “Now let us suppose the train stops a lot of times, I do not know how many, but a lot. In the number of stops column we are going to write in ‘lots’, in words”.
- 52.
- All: (Three students write in “lots” in the respective cell).
- 53.
- I: “Good. If the train stops lots of times, how many people can board?”.
- 54.
- Ángel: “Nine hundred thousand?”.
- 55.
- Lola: (Raises her hands to her head, thinking)
- 56.
- Ángel: ‘Lots”.
- 57.
- I: “Not so sure. And if it stops an infinity of times?”.
- 58.
- Darío: “Oof, one trillion or one hundred thousand trillion”.
- 59.
- I: “Why, Darío?”.
- 60.
- Darío: “Because lots of stops can be a trillion”.
- 61.
- I: “I am going to ask one more question… These numbers (pointing to the number of stops column), what did we say they are?”.
- 62.
- All: (In unison) “Number of stops”.
- 63.
- I: “Very good. And these?” (pointing to the number of people column).
- 64.
- All: (In unison) ”Number of people”.
- 65.
- I: “OK, can we explain to a classmate or to one another how we can figure out the number of people that can be on the train when it stops lots of times? How can we figure that out?”.
- 66.
- Darío: “You always need to multiply, like before”.
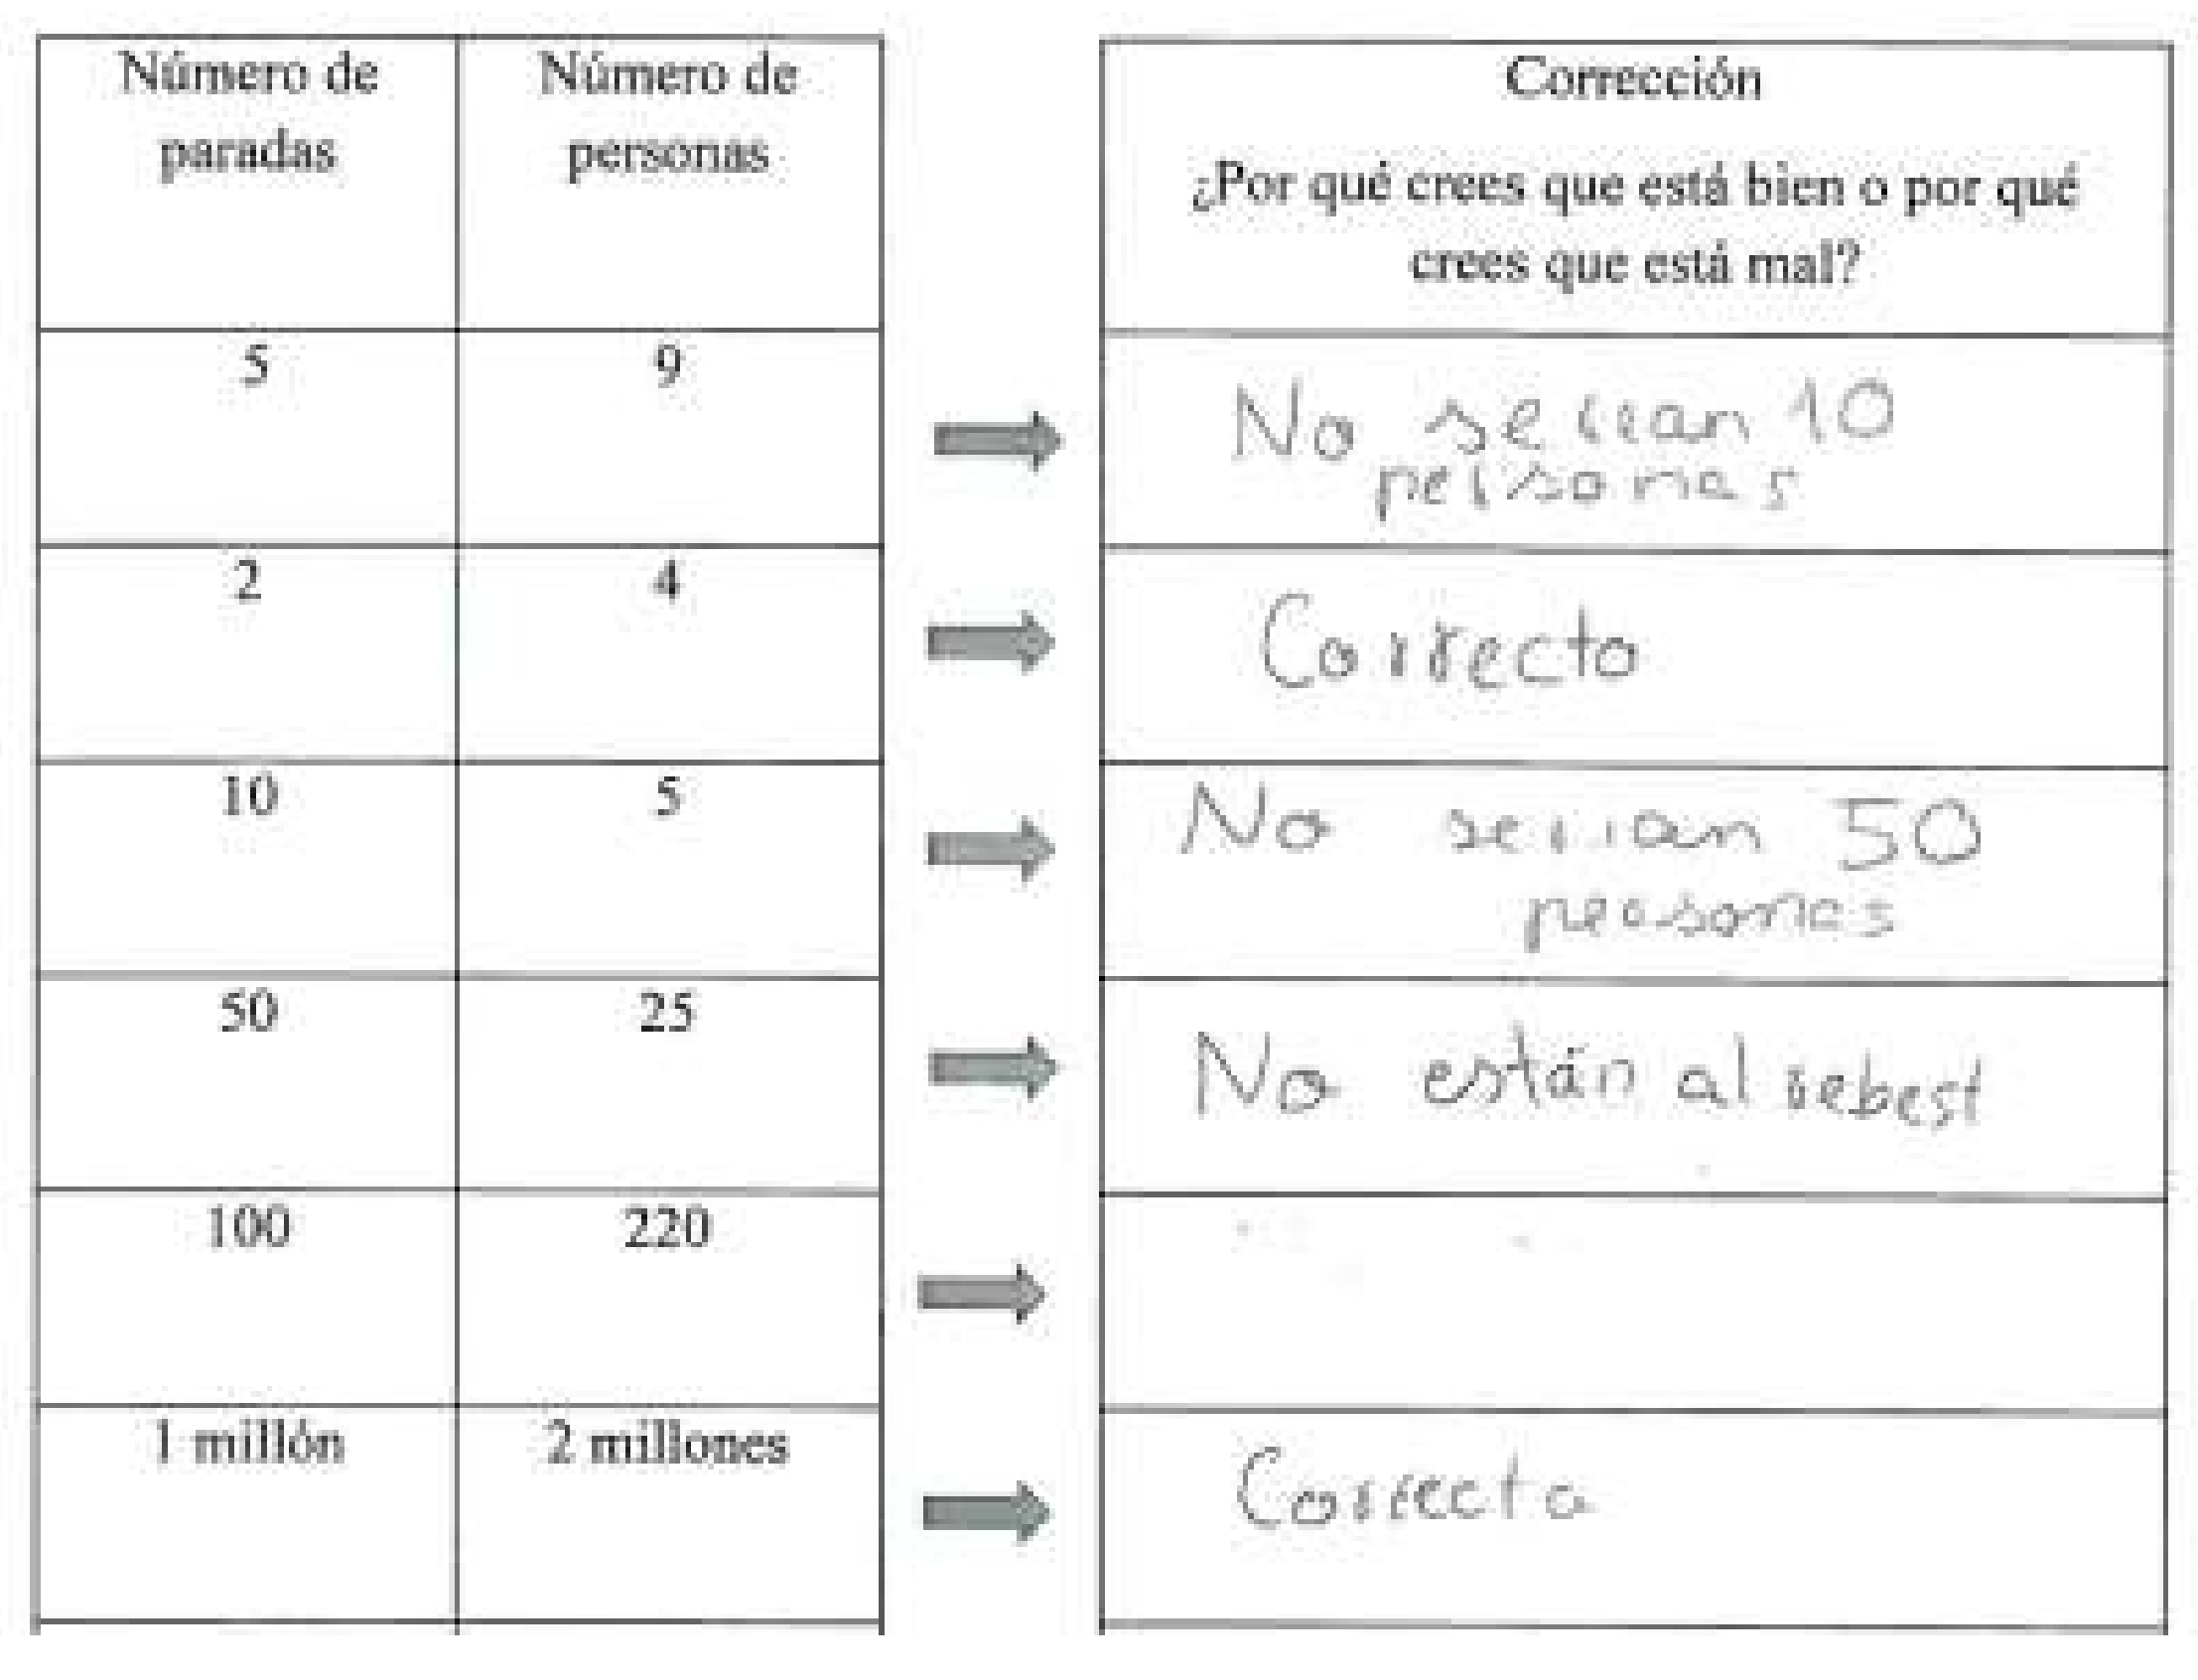
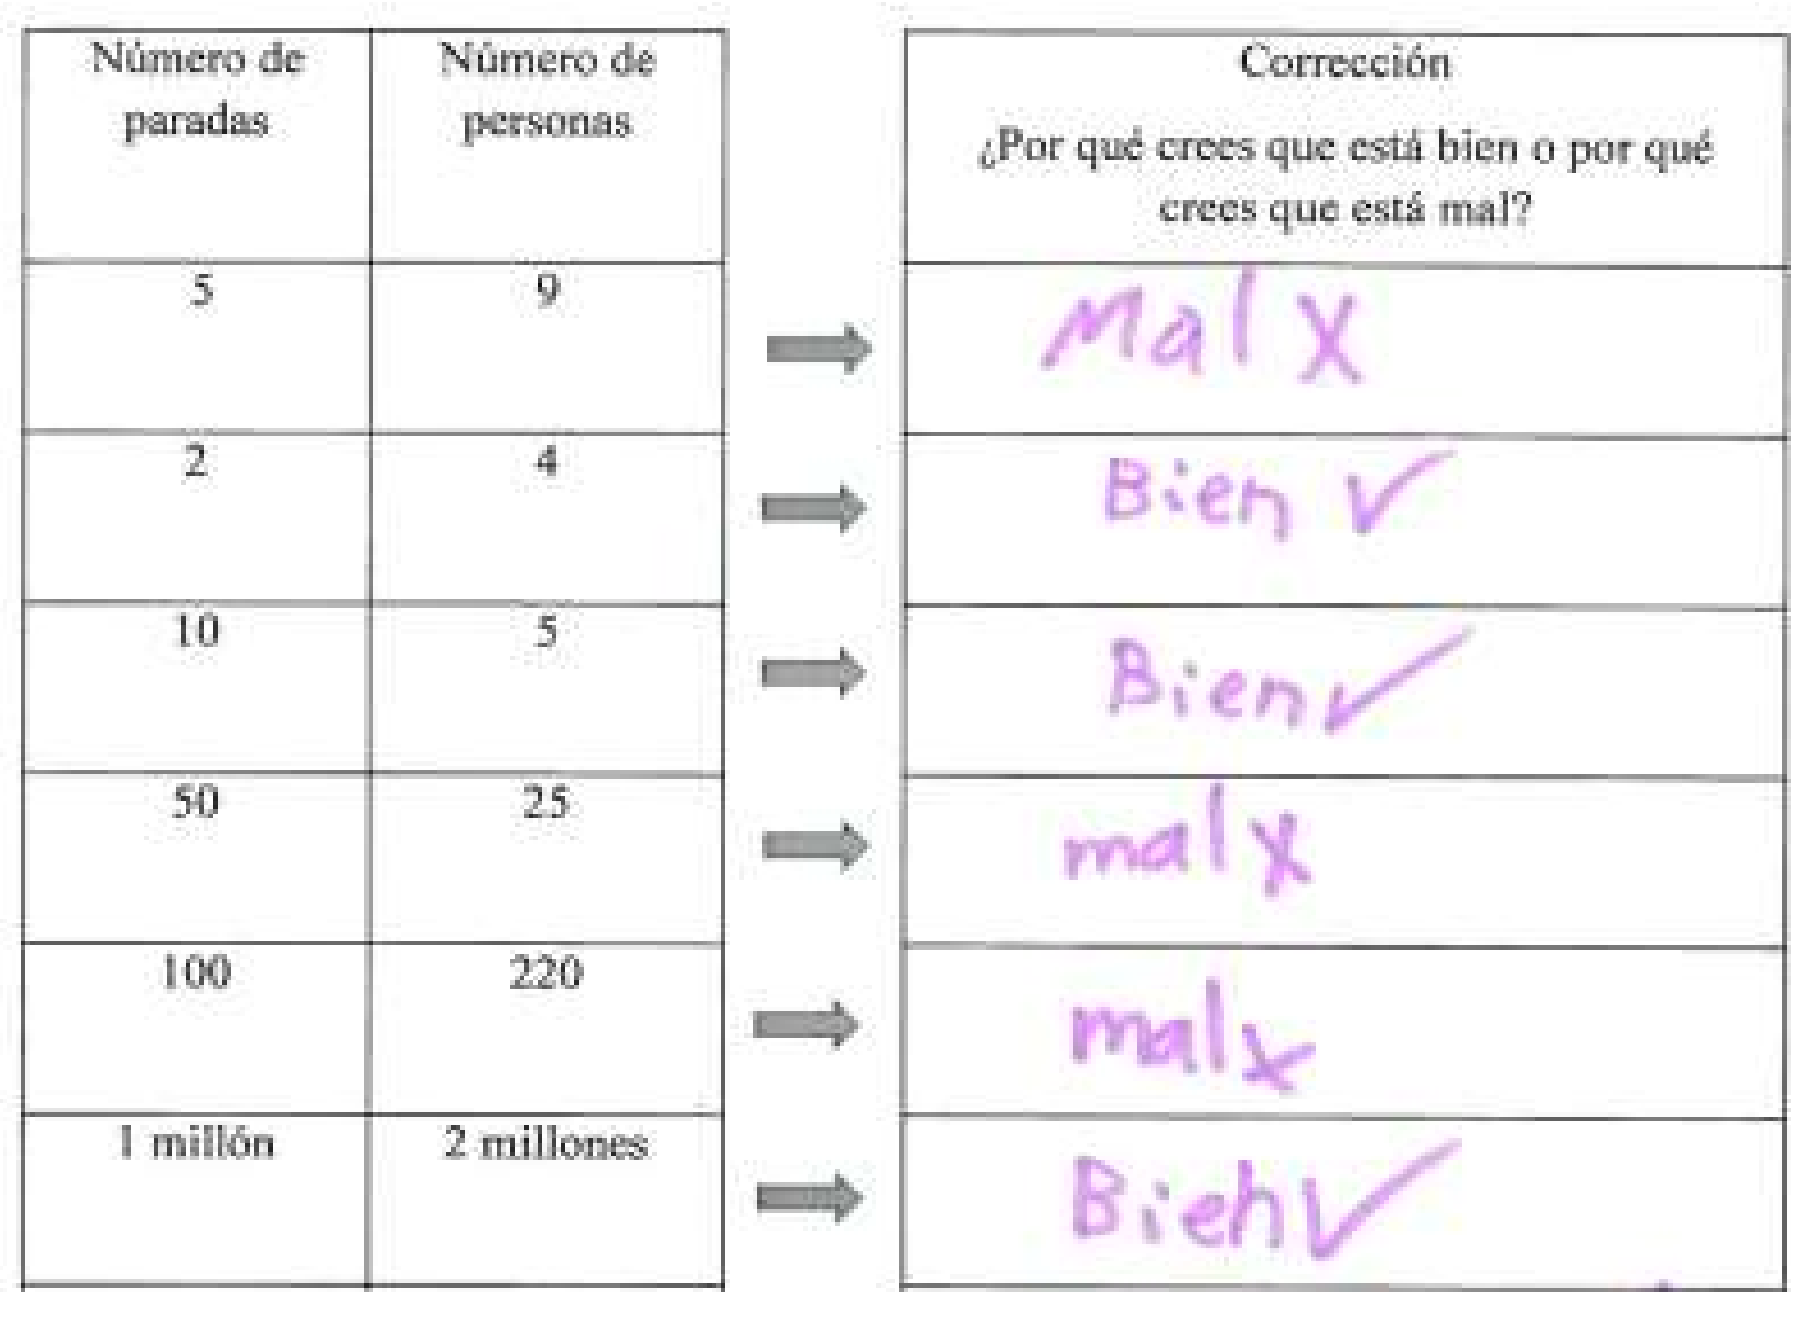
The students’ second interview 1 worksheet, on which they had to correct erroneous values pre-printed on the table, revealed that they had identified the underlying structures in the task and were able to use the table as a recording tool. Figure 8 and Figure 9 show that Alba and Lola identified the same structures as specified on earlier worksheet 1.
Taking a closer look at the differences between the two girls’ answers, we can see that Lola wrote “right” or “wrong,” with no further explanation. Alba’s observation that “it is the other way around” (see Figure 9), for the case of 50 number of stops and 25 number of people, reflects that she has identified the correct structure in this task, even though she did not recognize the structure for the general case (see Table 2). This may be due to the difficulty in holding the students’ attention in this group interview.
The structures identified in interview 2 are shown in Table 3 (symbolically here also).
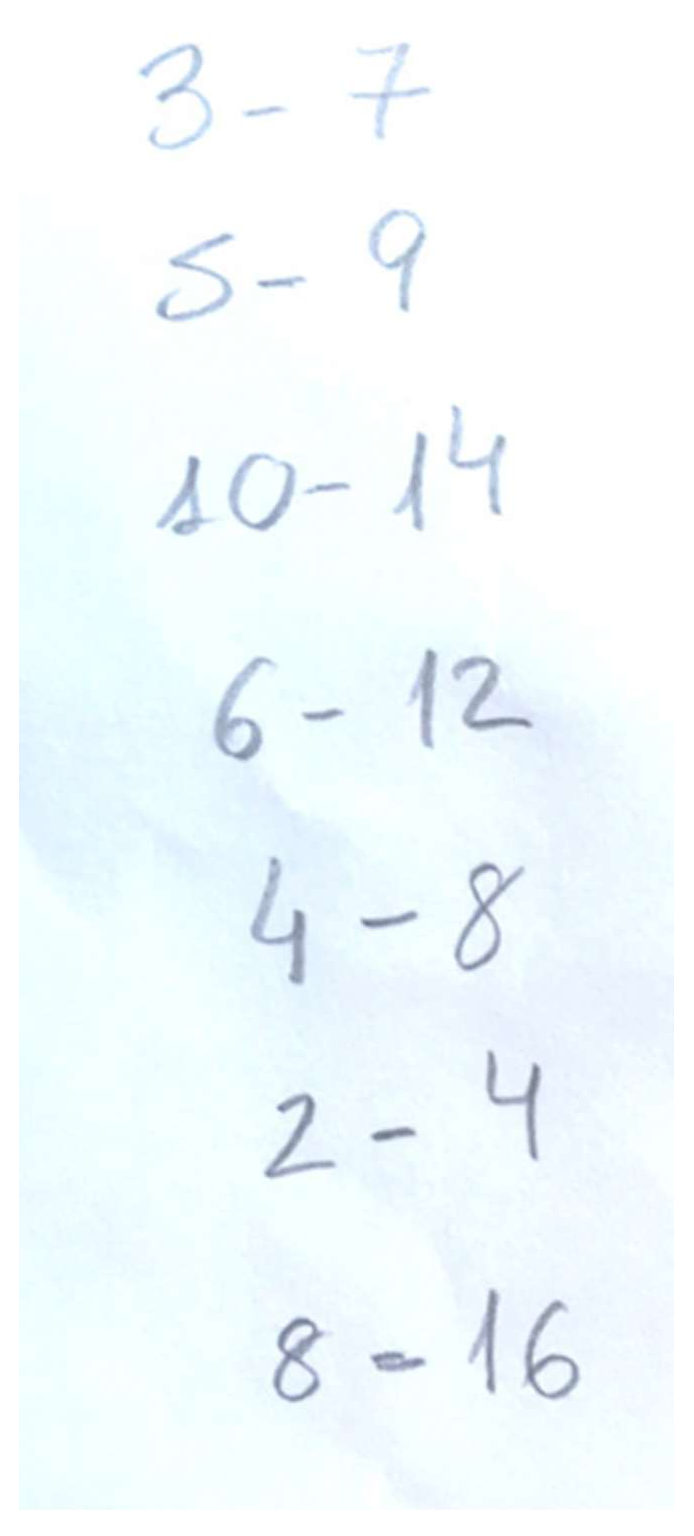
During the interview, all students correctly identified the structure involved in the particular cases. Alba’s responses were of special interest, for they revealed that she had identified two different structures (see Table 3). After initially identifying the structure correctly, as the interview progressed, she also (incorrectly) identified the structure y = x + x. Alba’s answers to the particular cases during interview 2 are reproduced in Figure 10.
The values in Figure 10 were jotted down by the interviewer as Alba called them out. We recurred to this procedure because by this point in the interview, she was inattentive and somewhat tired. When Iron Man’s ages were 3, 5, or 10, Alba used the structure y = x + 4. In contrast, when they were 6, 4, 2, or 8, she identified the structure as y = x + x, answering that she found Captain America’s age by adding Iron Man’s age in years to that same number. In other words, while working with some particular cases, Alba generalised, albeit incorrectly, the structure y = x + x. She implied the relation of double to refer to some quantities. Alba’s production without the help of the interviewer led her to fill in the table that appears in Figure 11.
Alba did not answer the question about the general case (see Table 3). The other three students did generalise when asked to; however, and they did so correctly. The verbal expression used by Ángel, Lola, and Darío to generalise would translate symbolically as y = x + 4. Ángel generalised in the following way: “Captain America was born 4 years before; you have to add 4”. Lola and Darío both replied simply that “you have to always add 4”.
Darío was one of the students who answered using indeterminate terms, such as “a lot of years old” and “infinitely old”. The following excerpt provides evidence of his ability to generalise:
- 67.
- I: “Could you tell me how much older Captain America will be when Iron Man is many years old?”.
- 68.
- Darío: “He would be many plus 4”.
- 69.
- I: “And when Iron Man is infinite years old, how old will Captain America be?”.
- 70.
- Darío: “Well, infinite plus 4”.
- 71.
- I: “How would you explain to friends what they have to do to figure out Captain America’s age?”.
- 72.
- Darío: “As always, adding 4. Captain America was born 4 years before”.
In line 70, Darío replied that Captain America’s age would be found by adding 4 to infinite, and in line 72, he generalised verbally: “As always, adding 4 [to Iron Man’s age]”.
7. Discussion and Conclusions
Given the small number of participants, the results of this study are not generalizable, and we have no intention to generalise any of our findings. Tables were introduced in the session immediately preceding the interviews, so students’ lack of familiarity with them would not interfere with their ability to identify structures in the tasks involving generalisation. Our findings show that they only effectively understood the use of tables after they were re-introduced in interview 1. As interpreting a table entails understanding the processes for classifying information and identifying the variables (set out in rows and columns), these processes follow certain conventions that are not necessarily trivial [36]. Our findings aid the research literature in that tables are an essential element in mathematics study plans and little is known about how adequate they can be for understanding functions [8,11]. Group interview 1, at times, hindered communication with the interviewer due to the nature of group interviews, which sometimes resulted in a lack of response from the students, especially in relation to the general case. The number of general structures identified was clearly smaller in the group interview (interview 1). The clue consisting in pre-printing part of the heading for the superheroes’ ages in the interview 2 worksheet may partially explain the difference in the number of structures identified. Three students did not answer the question on the general case in interview 1. All students correctly organised the data (values of variables) in the columns and rows in interview 2, when they also completed the labels for the columns, unaided by the interviewer.
Unlike the students described by [31], the students in our study found it more difficult to work with a table lacking labelled headings. It was easier for them to identify the general structure when the column headings were pre-labelled. We highlight the difficulty of working with tables without labels. In this case, writing the label headings for a table indicates understanding the relationship between the variables involved. So, a priori, this can be very complicated for children at this age.
This seems to indicate that specifying the dependent and independent variables in the table facilitated the identification of the intervariable relationship. This, in turn, may carry implications for classroom approaches to teaching functions and tables.
Students appeared to learn from interview 1 to 2, when they correctly completed the blank cells in the table. They also proved able to relate and identify the values of the dependent and independent variables (number of stops, number of people, and superheroes’ ages) in both interviews, illustrated through the structures they identified, correctly in most cases, in the two tasks. Only one incorrect structure, y = x + x, was observed in interview 2. These results are a departure compared to previous studies that have reported on students’ identification of a greater number of different structures throughout the same interview and for the same function (e.g., [17,18]). The authors of [18] report that three of the six students interviewed identified the structure y = x + x for a word problem involving the function y = x + 3. In our study, the children did not explicitly identify structures as described here. Rather, we identified the structures on the grounds of their own representations. These authors did not use tables in their study. In [18]’s study, the incorrect structure, verbally expressed as “adding a number to itself”, might have been identified because in one particular case, the answer happened to be double the value of the independent variable. The same occurs in this study with Alba’s response in interview 2, where her response implies a doubling relationship to refer to some quantities. A second possible explanation is that the students were more used to tasks involving addition when asked to sum two equal numbers.
The cognitive activity requested of students during the interviews was dual and simultaneous—we have seen how the children developed understandings of both the representation (table) and the objects represented (relationships between variables), as pointed out by Kaput (1987). Our study differs from previous studies (e.g., [8,29]) by introducing blank tables and tables with hints for the heading labels, and allows us to think of this as a possible instructional move that could help students learning about tables and functions.
Moreover, although tables are presented in the curricula of some countries as content and learning standards, like America, Australia, Spain, and Singapore [37], they are not used for interpreting relationships between variables. The results of our study are important because they indicate the need to do so. The present findings, duly systematised, may help teachers design classroom activities that support students’ use of tabular representations and their ability to engage in functional thinking. Furthering communication skills through the use of tabular representations is likewise essential, given that today’s elementary and secondary school curricular calls for a command of this and similar representational tools to graphically represent information, hence the interest in observing their use by these young students.
8. Patents
We add this section to clarify patents as it is a study that is developed within a research project.
Author Contributions
Conceptualization, B.M.B., M.C.C. and A.M.; methodology, M.D.T., M.C.C. and A.M.; validation, B.M.B., M.C.C., A.M. and M.D.T.; formal analysis, M.D.T., B.M.B., M.C.C. and A.M.; investigation, B.M.B., M.C.C., A.M. and M.D.T.; resources, B.M.B.; data curation, B.M.B. and M.D.T.; writing—original draft preparation, M.D.T.; writing—review and editing, M.D.T., B.M.B., M.C.C. and A.M.; visualization, M.D.T.; supervision, B.M.B., M.C.C. and A.M.; project administration, M.C.C.; funding acquisition, M.C.C. and others. All authors have read and agreed to the published version of the manuscript.
Funding
This research was conducted within the projects referenced EDU2016-75771-P and PID2020-113601GB-I00, financed by the Spanish National Research Agency (AEI) and the European Fund for Regional Development (FEDER). Furthermore, it was supported by a fellowship (reference BES-2017-080124) awarded by the government of Spain.
Informed Consent Statement
Informed consent was obtained from all subjects involved in the study.
Data Availability Statement
Data are available upon request due to restrictions.
Conflicts of Interest
The authors declare no conflict of interest. The funders had no role in the design of the study; in the collection, analyses, or interpretation of data; in the writing of the manuscript; or in the decision to publish the results.
References
- Duval, R. The cognitive analysis of problems of comprehension in the learning of mathematics. Edu. Stud. Math. 2006, 61, 103–131. [Google Scholar] [CrossRef]
- Rico, L. Sobre las nociones de representación y comprensión en la investigación en educación matemática (On the notions of representation and understanding notions in mathematics education research). PNA 2009, 4, 1–14. [Google Scholar]
- Castro, E.; Castro, E. Representaciones y modelización (Representations and modeling). In La Educación Matemática en la Enseñanza Secundaria; Rico, L., Ed.; Horsori: Barcelona, Spain, 1997; pp. 95–124. [Google Scholar]
- Henriques, A.; Ponte, J. As representações como suporte do raciocínio matemático dos alunos quando exploram atividades de investigação (Representations as a tool to support students’ mathematical reasoning when exploring investigation activities). Bolema 2014, 28, 276–298. [Google Scholar] [CrossRef] [Green Version]
- NCTM. Principios e Normas Para a Matemática Escolar; APM: Lisboa, Portugal, 2007. [Google Scholar]
- Martínez, M.; Brizuela, B.M. A third grader’s way of thinking about linear function tables. J. Math. Behav. 2006, 25, 285–298. [Google Scholar] [CrossRef]
- Gabucio, F.M.a.r.t.í.; EEnfedaque, J.; Gilbert, S.; Konstantinidou, A. Niveles de comprensión de las tablas en alumnos de primaria y secundaria. Cult. Edu. 2010, 22, 183–197. [Google Scholar] [CrossRef]
- Martí, E. Tables as cognitive tools in primary education. In Representational Systems and Practices as Learning Tools in Different Fields of Learning; Andersen, C., Scheuer, N., Echeverría, P., Teubal, E., Eds.; Sense Publishers: Barcelona, Spain, 2009; pp. 133–148. [Google Scholar]
- Leinhardt, G.; Zaslavsky, O.; Stein, M.K. Functions, graphs, and graphing: Tasks, learning, and teaching. Review Edu. Res. 1990, 60, 1–64. [Google Scholar] [CrossRef]
- Nemirovsky, R.; Tierney, C.; Wright, T. Body motion and graphing. Cogn. Instruct. 1998, 16, 119–172. [Google Scholar] [CrossRef]
- Brizuela, B.M.; Lara-Roth, S. Additive relations and function tables. J. Math. Behav. 2002, 20, 309–319. [Google Scholar] [CrossRef]
- Cañadas, M.C.; Molina, M. Una aproximación al marco conceptual y principales antecedentes del pensamiento funcional en las primeras edades (An approach to the conceptual framework and main antecedents of functional thinking in the early ages). In Investigación en Educació;n Matemática. Homenaje a Luis Rico; Castro, E., Lupiáñez, J.L., Ruíz, J.F., Torralbo, M., Eds.; Editorial Comares: Granada, Spain, 2016; pp. 209–218. [Google Scholar]
- Blanton, M.; Kaput, J. Elementary grades students’ capacity for functional thinking. In Proceedings of the 28th International Conference for the Psychology of Mathematics Education, Bergen, Norway, 14–18 July 2004; Hoines, M., Fuglestad, A., Eds.; Bergen University College: Bergen, Norway, 2004; Volume 2, pp. 135–142. [Google Scholar]
- Blanton, M.; Levi, L.; Crites, T.; Dougherty, B. Developing Essential Understanding of Algebraic Thinking for Teaching Mathematics in Grades 3–5; NCTM: Reston, VA, USA, 2011. [Google Scholar]
- Doorman, M.; Drijvers, P. Algebra in functions. In Secondary Algebra Education; Drijvers, P., Ed.; Sense Publishers: Rotterdam, The Netherlands, 2011; pp. 119–135. [Google Scholar]
- Carraher, D.W.; Schliemann, A. Powerful ideas in elementary school mathematics. In Handbook of International Research in Mathematics Education, 3rd ed.; English, L., Kirshner, D., Eds.; Routledge: Amsterdam, The Netherlands, 2016; pp. 191–218. [Google Scholar]
- Pinto, E.; Cañadas, M.C. Estructuras y generalización de estudiantes de tercero y quinto de primaria: Un estudio comparativo [Structures and generalisation in third and fifth year of primary school: A comparative study]. In Investigación en Educación Matemática XXI; Muñoz-Escolano, J.M., Arnal-Bailera, A., Beltrán-Pellicer, P., Callejo, M.L., Carrillo, J., Eds.; SEIEM: Zaragoza, Spain, 2017; pp. 407–416. [Google Scholar]
- Torres, M.D.; Cañadas, M.C.; Moreno, A. Estructuras, generalización y significado de letras en un contexto funcional por estudiantes de 2º de primaria. In Investigación en Educación Matemática XXII; Rodríguez-Muñiz, L.J., Rodríguez, L.M., Aguilar-González, A., Alonso, P., García, F.J.G., Bruno, A., Eds.; SEIEM: Gijón, Spain, 2018; pp. 574–583. [Google Scholar]
- Mason, J.; Stephens, M.; Watson, A. Appreciating mathematical structure for all. Math. Edu. Res. J. 2009, 21, 10–32. [Google Scholar] [CrossRef] [Green Version]
- Torres, M.D.; Moreno, A.; Cañadas, M.C. Generalization process by second grade students. Mathematics 2021, 9, 1109. [Google Scholar] [CrossRef]
- Strother, S. Algebra Knowledge in Early Elementary School Supporting Later Mathematics Ability. Ph.D. Thesis, University of Louisville, Louisville, KY, USA, 2011. [Google Scholar]
- Warren, E.; Miller, J.; Cooper, T.J. Exploring young students’ functional thinking. PNA 2013, 7, 75–84. [Google Scholar] [CrossRef]
- Radford, L. The seen, the spoken and the written: A semiotic approach to the problem of objectification of mathematical knowledge. Learn. Math. 2002, 22, 14–23. [Google Scholar]
- Carraher, D.; Martinez, M.; Schliemann, A. Early algebra and mathematical generalization. Int. J. Math. Edu. (ZDM) 2008, 40, 3–22. [Google Scholar] [CrossRef]
- Cañadas, M.C.; Fuentes, S. Pensamiento funcional de estudiantes de primero de educación primaria: Un estudio exploratorio [Functional thinking in first-year primary teacher students: An exploratory study]. In Investigación en Educación Matemática XIX; Fernández, C., Molina, M., Planas, N., Eds.; SEIEM: Alicante, Spain, 2015; pp. 211–220. [Google Scholar]
- Radford, L. Gestures, speech, and the sprouting of signs: A semiotic-cultural approach to students’ types of generalization. Math. Think. Learn. 2003, 5, 37–70. [Google Scholar] [CrossRef]
- Kaput, J. Representation systems and mathematics. In Problems of Representation in the Teaching and Learning of Mathematics; Janvier, C., Ed.; Lawrence Erlbaum Associated: Mahwah, NJ, USA, 1987; pp. 19–26. [Google Scholar]
- Campbell-Kelly, M.; Croarken, M.; Flood, R.; Robson, E. (Eds.) . The history of Mathematical Tables. From Summer to Spreadsheets; Oxford University Press: New York, NY, USA, 2003. [Google Scholar]
- Martí, E.; Garcia-Milà, M.; Teberosky, A. Notational strategies for problem solving in 5 to 7 year olds. Eur. J. Develop. Psychol. 2005, 2, 364–384. [Google Scholar] [CrossRef]
- Morales-Moreno, Y.; Martí, E. Uso de notaciones y teoría de la mente en niños de 3 a 6 años [Use of notations and theory of mind in 3 to 6 year-old children]. Infancia Aprendizaje 2004, 27, 289–305. [Google Scholar] [CrossRef]
- Brizuela, B.M.; Alvarado, M. First graders’ work on additive problems with the use of different notational tools. Revista IRICE 2010, 21, 37–43. [Google Scholar]
- Molina, M.; Castro, E.; Molina, J.L.; Castro, E. Un acercamiento a la investigación de diseño a través de los experimentos de ense- ñanza. Enseñanza Ciencias 2011, 29, 75–88. [Google Scholar] [CrossRef] [Green Version]
- Kelly, A.E.; Lesh, R.A. Research Design in Mathematics and Science Education; Lawrence Erlbaum Associates: Mahwah, NJ, USA, 2000. [Google Scholar]
- Cañadas, M.C.; Castro, E. A proposal of categorisation for analysing inductive reasoning. PNA 2007, 1, 67–78. [Google Scholar] [CrossRef]
- Torres, M.D.; Cañadas, M.C.; Moreno, A. Estructuras y representaciones de alumnos de 2º de primaria en una aproximación funcional del pensamiento algebraico [Second graders’ structures and representations used in a functional approach of algebraic thinking]. In Investigación en Educación Matemática XXIII; Marbán, J.M., Arce, M., Maroto, A., Muñoz-Escolano, J.M., Alsina, Á., Eds.; SEIEM: Valladolid, Spain, 2019; pp. 573–582. [Google Scholar]
- Kozulin, A. Psychological Tools; Harvard University Press: Cambriege, MA, USA, 1998. [Google Scholar]
- Pincheira Hauck, N.G.; Alsina, À. Hacia una caracterización del álgebra temprana a partir del análisis de los currículos contemporáneos de Educación Infantil y Primaria. Educación Matemática 2021, 33, 153–180. [Google Scholar] [CrossRef]
Figure 1.
Student’s table for session 5. (“Figura” is “Figure” in English; “Nº caras” is “Number face”; “Colores” is “colours”; “Nº aristas” is “Number of edges”; “Número de vértices” is “Number of vertexs”; “azules” is “blue”; “rojos” is “red”; “verde” is “green”; “La pirámide is “The pyramid”.
Figure 1.
Student’s table for session 5. (“Figura” is “Figure” in English; “Nº caras” is “Number face”; “Colores” is “colours”; “Nº aristas” is “Number of edges”; “Número de vértices” is “Number of vertexs”; “azules” is “blue”; “rojos” is “red”; “verde” is “green”; “La pirámide is “The pyramid”.

Figure 2.
Worksheet 1 for interview 1 with a blank table to begin to explore student thinking.

Figure 3.
Worksheet 2 (interview 1).

Figure 4.
Table used for interview 2 (“Edad de…” is “Age of…” in English).

Figure 5.
Ángel’s table (interview 2): headings and first three particular cases.

Figure 6.
Lola’s table (interview 2): headings and particular cases.

Figure 7.
Darío’s table (interview 1).

Figure 8.
Alba’s table (interview 1) (“Número de paradas” is “Number of stops” in English; “Número de personas” is “Number of people”: “Corrección” is “Correction”; “¿Por qué crees que está bien o por qué crees que está mal?” is “Why do you think it is right or why do you think it is wrong?” “No, serían 10 personas” is “No, it would be 10 people” in English; “Correcto” is “Correct”; “No, serían 50 personas” is “No, it would be 50 people”; “No, están al revés” is “No, they are backwards.”).

Figure 9.
Lola’s table (interview 1; “Número de paradas” is “Number of stops” in English; “Número de personas” is “Number of people”: “Corrección” is “Correction”; “¿Por qué crees que está bien o por qué crees que está mal?” is “Why do you think it is right or why do you think it is wrong? ”; “Mal” is “Wrong” in English; “Bien” is “Correct.”).

Figure 10.
Alba’s answers to questions on particular cases (interview 2).

Figure 11.
Alba’s table with particular cases (interview 2; “Edad de…” is “Age of…” in English).


Table 1.
Sessions and interviews.
| Context | Function |
|---|---|
| Session 1: Ball machine | y = x + 3 |
| Session 2: Amusement park 1 | y = x + 3 |
| Session 3: Amusement park 2 | y = 2x + 1 |
| Session 4: Birthday | y = 2x |
| Session 5: Introduction to tables | N/A |
| Interview 1: Train stops | y = 2x |
| Interview 2: Superhero ages | y = x + 4 |
Table 2.
Structures identified in interview 1.
| Structures | |||
|---|---|---|---|
| Function | Student | Particular Case | General Case |
| y = 2x | Ángel | y= 2x | NR |
| Lola | y= 2x | NR | |
| Darío | y= 2x | y = 2x | |
| Alba | y= 2x | NR | |
NR—no response.
Table 3.
Structures identified during interview 2.
| Structures | |||
|---|---|---|---|
| Function | Student | Particular Case | General Case |
| y = x + 4 | Ángel | y = x + 4 | y = x + 4 |
| Lola | y = x + 4 | y = x + 4 | |
| Darío | y = x + 4 | y = x + 4 | |
| Alba | y = x + 4 y = x + x | NR | |
NR—no response.
Publisher’s Note: MDPI stays neutral with regard to jurisdictional claims in published maps and institutional affiliations. |
© 2021 by the authors. Licensee MDPI, Basel, Switzerland. This article is an open access article distributed under the terms and conditions of the Creative Commons Attribution (CC BY) license (https://creativecommons.org/licenses/by/4.0/).
Share and Cite
MDPI and ACS Style
Torres, M.D.; Brizuela, B.M.; Cañadas, M.C.; Moreno, A. Introducing Tables to Second-Grade Elementary Students in an Algebraic Thinking Context. Mathematics 2022, 10, 56. https://0-doi-org.brum.beds.ac.uk/10.3390/math10010056
AMA Style
Torres MD, Brizuela BM, Cañadas MC, Moreno A. Introducing Tables to Second-Grade Elementary Students in an Algebraic Thinking Context. Mathematics. 2022; 10(1):56. https://0-doi-org.brum.beds.ac.uk/10.3390/math10010056
Chicago/Turabian StyleTorres, María D., Bárbara M. Brizuela, María C. Cañadas, and Antonio Moreno. 2022. "Introducing Tables to Second-Grade Elementary Students in an Algebraic Thinking Context" Mathematics 10, no. 1: 56. https://0-doi-org.brum.beds.ac.uk/10.3390/math10010056
Note that from the first issue of 2016, this journal uses article numbers instead of page numbers. See further details here.