
Why Not STEM? A Study Case on the Influence of Gender Factors on Students’ Higher Education Choice


1
Department of Computer Architecture and Computer Technology, University of Granada, 18014 Granada, Spain
2
Department of Statistic and Operational Research, University of Granada, 18003 Granada, Spain
*
Author to whom correspondence should be addressed.
†
These authors contributed equally to this work.
Mathematics 2022, 10(2), 239; https://0-doi-org.brum.beds.ac.uk/10.3390/math10020239
Submission received: 5 November 2021
/
Revised: 6 December 2021
/
Accepted: 7 January 2022
/
Published: 13 January 2022
(This article belongs to the Special Issue Recent Advances in STEM Education)
Abstract
:The gender gap in STEM-related job positions is a fact, and it is closely related to the low percentage of women studying STEM degrees. This poses a problem because Europe, as well as the United States and the rest of the developed countries, keep demanding the best engineers and scientists to continue developing innovative products. This problem can thus be approached by answering, firstly, the following question: Why are women not studying STEM degrees? In this paper, we summarize the factors, found in literature, that influence students—both boys and girls—to not study STEM, particularly engineering, computer sciences and technology. We study these influence factors in a sample of N = 338 students from a secondary school placed in the south of Spain; we carry out a survey in order to find out if those students fill out the same answers other researchers have found and published in the related literature. Our main conclusions are as follows: The results confirm that the number of women in technical courses decreases when the level of the course increases; the lack of role models is not an impediment for girls to feel comfortable; unlike boys, girls will not choose engineering, even if their scoring in STEM is good; and we found that girls and women see themselves as not capable of studying an engineering degree more than boys and men do. These results contribute to a deeper understanding of the situation regarding the gender gap in STEM fields in ages in which both girls and boys must choose their future studies.
1. Introduction
The origin of the concept of STEM (science, technology, engineering and mathematics) is discussed by Kennedy et al. [1]. Scholars are agreed that STEM develops a new learning approach based on placing students in a learning and practicing context so that they can apply their knowledge and also achieve higher-order thinking competences such as problem-solving, critical thinking and creative thinking (see [2,3,4]). In this manuscript, we consider, as the OECD does, the term STEM referring the aggregation of the broad fields of natural sciences, mathematics and statistics, information and communication technologies and engineering, manufacturing and construction.
In STEM fields, according to OECD data shown in [5], 84% of 25–64 year-old adults with a degree in natural sciences, mathematics and statistics were employed in 2020 on average across OECD countries, and demand is strong for those with an engineering or ICT degree, where employment peaks close to 90%. Considering the high demand of scientists and engineers in Europe, remarked in [6], several institutions and governments have mobilised in order to try to make students more interested in STEM, as the OECD showed in [7].
In addition, we observe in [8,9,10,11] that there exists a persistent under-representation of women in STEM areas. In [5], the OECD report points out that “women are less likely than men to enter a STEM field of study, although this share has increased in slightly more than half of OECD countries with data between 2013 and 2019. Despite higher attainment, the employment rate for women is lower than that of men, with a particularly large gap at lower levels of educational attainment. […] Natural sciences, mathematics and statistics are the only STEM fields that have achieved gender parity, although there is a much stronger representation of women in some countries. On average across OECD countries, women represented 52% of new entrants to the field. In contrast, still few women enter engineering and ICT fields of study. Men still strongly dominate both fields in every OECD country, representing at least 70% of new entrants to ICT and 61% in engineering, manufacturing and construction across all countries”. Since the female presence in these areas—and particularly in ICT—is low, they are considered as areas dominated by men, and this inequality produces a deep impact on the labor market and represents significant economic losses for modern societies, as we see in [12,13,14].
Focusing on ICT-related areas, a study by the Institution of Engineering and Technology in the UK found that in 2015 only 17.4% of computer science undergraduates and 15.8% of engineering and technology undergraduates were women [15]. The same happens in Spain, where this number falls from the European percentage to 31%, taking into account all engineering fields (civil, computer science, technology and aeronautics, among others). Actually, the change in the higher education system, named “the Bologna Process” in Spain [16], did not improve this situation, but the tendency for women enrollment in technology-related degrees has continued falling from almost 32% to 25% in 13 years from 2003 to 2016 and still remains close to this 25% for four more years. Meanwhile, the percentage of women as degree students in Spanish universities increased slightly and continually from 49.06 to 56.05% along these 17 observed years (data source: Spanish Government [17,18]).
Research on gender discrimination in STEM fields has used different theoretical frameworks, including implicit gender bias theory and social role theory. Following Hill, Corbett and St Rose [19], the theory of implicit, or unconscious, gender bias holds that this bias is widespread and common, even among individuals who actively reject these stereotypes. This bias is based on the assumption of a lower capacity for women and a higher capacity for men in mathematics and science, and it has been shown, as we see in [20,21], that this bias has a negative influence on women in the following cases: (a) on the intention and motivation to pursue a career in STEM fields, (b) in employment in STEM fields and (c) performance evaluations and career advancement in STEM fields. Social role theory requires a set of expectations, norms and behaviors for women and men. Women are expected to be caring, supportive, people-oriented and community-based. Therefore, they should be drawn to disciplines consistent with these roles, such as teaching and nursing, as it can be seen in [22]. Rather, STEM fields are associated with male social relationships. Norms such as being competitive, decisive, ambitious and risky are associated with men (see [23]). When individuals violate any of the social norms associated with their role, they will pay some cost or social punishment, as the researchers in [22] point out.
The striking disparity between the numbers of men and women in STEM, as is related in [19], “has often been considered as evidence of biologically driven gender differences in abilities and interests. The classical formulation of this idea is that men “naturally” excel in mathematically demanding disciplines, whereas women “naturally” excel in fields using language skills. Recent gains in girls’ mathematical achievement, however, demonstrate the importance of culture and learning environments in the cultivation of abilities and interests.”
It is worth mentioning that even though actions are being taken in some countries since the 1990’s, as Zywno et al. show in [24], the numbers are still the same. Given this situation, these statistics, and the fact that they are similar all over the world, it is crucial that we understand why is this happening because, in the near future, the demand for engineers will be even higher, and diversity in the workforce is a desirable quality already [25]. In the words of Arredondo et al. [26], “Gender equity in STEM fields must be seen not only as a basic human rights question, but a fundamental tool to reach scientific and technological excellence”.
Women currently working in technological sectors find several barriers that prevent them from starting or progressing in their professional career: “Working towards increasing and retaining the number of female students enrolled in STEM disciplines can help to alleviate part of the challenges faced by women in STEM fields” [27].
Among what is being done to encourage women into studying STEM, we differentiate between the following:
- Research projects: Funded by institutions such as the European Union, the governments or the universities themselves aim to look deeply into the reasons why women continue being underrepresented in STEM and engineering or technology. We can find an overview of the outputs from European research projects developed during the last years related to the gender gap in STEM in [28]. Usually, the result of these research projects is a number of actions to take in order to respond to identified needs. An example of these projects is “Mind the Gap” [29], which tries to help teachers to make girls more interested in STEM subjects and also to motivate girls so that they gain enough self-confidence to study STEM degrees. In addition, in [30], a project named “Computational Thinking for Girls (CT4G)” is introduced. The authors worked with girls-only groups in activities and seminars directly related to computer science, which is part of STEM, including programming and robotics. The authors found a significant growth in the interest for computer science of the participating girls at the end of the program.
- Groups and communities: These are non-profit girls groups or “clubs” interested in technology and periodically gather to talk about technology or discuss about the situation of women in STEM. Since they are non-profitable organisations, whenever they need resources such as places to gather or technological resources, they can be sponsored by companies. Moreover, it is now common that the governments include gender equality inside their ministries or offices, as it happens with Spain, the United Kingdom and the USA, to cite a few. In addition, the number of groups, communities or "clubs" dedicated to different activities related to encouraging women into STEM is constantly growing. In [31], there is a list of the most important pathfinder organisations, classified by the specific purpose: encouraging women in technology, sharing job offers and knowledge about programming, among other categories.
- Code camps, campus and occasional activities: They are similar to the activities organised in groups or communities but organised occasionally. As an example, universities usually have programs aimed at K12 students; nonetheless, they can also be funded or sponsored by companies. An example of these activities is a code camp. In these kind of camps, students learn robotics, making video games, programming and making smartphone applications. Many are for both boys and girls, but many others are for girls only, due ti females being generally less likely than males to enroll in STEM activities [32]. In [33], the author gathers many options that are intended for girls only, and the duration in time is variable.
As authors of [34] firmly assure that understanding social psychological barriers to STEM field participation is an important first step in finding effective interventions that increase female participation in adulthood. The objective of this research is to provide a study case to enrich the knowledge about these barriers.
2. Objectives, Materials and Methods
In this work we establish the following goals:
- To summarise different studies about the reasons why the percentage of women in STEM degrees is this low into influence factors;
- To clarify if those influence factors, found in the literature, are present in a public school in Spain.
First of all, we will identify in literature a set of influence factors to achieve the first goal of this work. Afterward, in order to check whether those factors are valid in the context of a small city in the south of Spain, we carry out a survey in a high school located in Granada. A proper context must be found, so that results from the performed surveys will be compared with what has been found in the literature. Therefore, in the search for a high school to perform the analysis in, we have studied the context of the place from different points of view that we will describe now.
2.1. Socioeconomic Environment
It is important to know what the socioeconomic status is of the students and their families, given that it will be stated that the wealth of the families influences the education of the children, and so it influences the election of a certain degree or to continue studies at all (see Section 3).
The neighborhood in which the school is situated is the second most inhabited in Granada (South of Spain) and holds both the traditional workers neighborhood and a more modern and wealthy one due to the placement of the Astrophysics Center or the main hospital of the city.
2.2. The Centre
The resources of the studied centre are also influential, since a good equipment in subjects such as computer science or technology makes it easier to engage children into STEM degrees.
In this way, the centre, called Zaidín-Vergeles, has 7.000 m2 of extension with open and closed spaces. This high school opens during the whole day because there are classes in the morning and also during the afternoon (adults’ education courses). The courses available at Zaidín-Vergeles are the whole secondary education and vocational courses (see Appendix A for more clarification about the educational system in Spain). As such, surveyed students are from a variety of ages and social conditions, mainly middle class. In addition, there is an active parents association that promotes gender equality and collaborative initiatives, such as displays or conferences.
2.3. The Student Body
Knowing the students is key for knowing the global status of the school before choosing the sample. The global distribution of students per course is displayed in Table 1. In this table, the number of students from the technical and science tracks is indicated, which, in the upper secondary courses, approximately represents 50%, and almost the 31% are in computer science or technology-related vocational courses.
2.4. Academics
In some way, the teachers are also related to the resources or can be considered resources themselves. In addition, it is of interest to this study the analysis of the ratio between female and male STEM teachers, so that it can be studied if the students have STEM women as role models. At the studied high school, the ratio between men and women in the departments we are interested in is described in Table 2.
2.5. The Questionnaire and the Survey
We find in [35] that Hazari et al. surveyed a national sample of college English students (7505 students at 40 institutions), calling the study the “the PRiSE survey”. It has 50 items, which were validated and tested for reliability. The researchers established the content and face validity through focus groups with college students and STEM education experts. Furthermore, content validity was established through open-ended online surveys with 412 science teachers and professors to incorporate the breadth of views and hypotheses posed by the community. In our questionnaire, we take some questions from the PRiSE survey and assume for them the validation completed before.
First of all, following the indications given in [36], the questionnaire was built, and the research has been performed taking into account the following:
- For those students younger than 18 at secondary education courses, consent was asked from their parents or tutors.
- The students had the right to not answer any particular question.
- Responses were completely anonymous and not traceable.
- Questions have been written, avoiding the bias towards a particular answer.
- In questions with answers in a check-list, the options given cover all the significant alternatives.
2.6. Goals of the Investigation
To continue, after obtaining a number of influence factors (related in Section 3) as output for goal (1) and once we have identified the environment where the survey will be performed, established goal (2) can be subdivided in aspects to identify so that the survey contains the appropriate questions. This way, we extend the definition of goal (2) into identify the following:
- (a)
- As the courses run, the number of women in technical tracks decreases;
- (b)
- Role models and environments are decisive;
- (c)
- Girls will not choose an engineering degree even though their scoring in STEM is good;
- (d)
- A bad opinion about engineering (including believing in the “geek” stereotype) contributes to lessening the number of women in STEM;
- (e)
- Girls and women see themselves as not capable of studying an engineering degree;
- (f)
- The thought about STEM degrees being overcrowded with men also causes women to dismiss studying them.
Therefore, the surveys, translated into the Spanish language, have a total of 15 questions selected form the PRiSE survey. They are available online as they have been created with the Google Forms tool. There are three different surveys; one for the compulsory secondary education courses (https://goo.gl/BE3Doa, accessed on 9 October 2021), another for the upper secondary education courses (https://goo.gl/usH9Bv, accessed on 9 October 2021) and the third one for the vocational courses (https://goo.gl/UDuVxW, accesed on 9 October 2021). Although all of them have the same heading and introduction—briefly explaining the purpose of the survey as it is described in [36]—and the questions are mostly alike, there are particular differences in the answers when asking about their future plans. There are three types of questions: single choice, numeric scale and multiple selection. Inside the single choice ones, they are presented in a simple way, meaning that there is a question and two or more answers, one of which the student has to choose, or in a table, where the rows are different but related questions and the columns represent the answers, these being either a sentence, a word or a number.
The students undertook the survey while they where in class, and the classes visited were always related to Technology or Computer Science. The courses range from the last year of high school to technical courses for undergraduates. In addition, the surveys were conducted before COVID-19 forced classrooms to close. The total amount of students and the distribution is detailed in Table 1.
2.7. Statistical Measurements
In order to study and discuss the results of the surveys, we will use the odds ratio (OR) measure jointly with p-values and 95% confidence intervals associated. An OR is a measure of association between an exposure and an outcome. The OR represents the odds that an outcome will occur given a particular exposure, compared to the odds of the outcome occurring in the absence of that exposure. OR = 1 means that exposure does not affect odds of outcome; OR > 1 means exposure associated with higher odds of outcome; and OR < 1 means exposure associated with lower odds of outcome.
The 95% confidence interval is used to estimate the precision of the OR. A large CI indicates a low level of precision of the OR, whereas a small CI indicates a higher precision of the OR; the associated p-value reports measure’s statistical significance. For more information about this measurement, see [37,38].
3. Factors of Influence on Students’ Higher Education Choice
According to [39], “women’s career choices may be constrained decisions influenced by structural factors that steer women in certain directions and deter them from pursuing certain career paths”. In [40], the authors conducted a review of the gender gap in STEM careers and proposed a typification that organizes studies on the gender gap in STEM careers according to the three types of explanation they provide: (a) a psychological explanation, (b) a sociocultural explanation and (c) a biological explanation.
When identifying the influence factors that affect children and teenagers in choosing their higher education or degrees, we are interested not only in those that have an effect in general but also gender factors. We have looked for different studies performed in USA, Europe and Spain particularly because the surveyed students for our results are boys and girls from a Spanish high school.
A variety of conclusions about the things that influence teenagers into choosing one degree or another can be found in [41], which is a study carried out in Catalonia (Spain) to students in the last courses of high school. Thus, not taking into account the results by gender, the authors have found that:
- Students who succeed in STEM subjects have a tendency to continue with technology-related studies and have greater probability of choosing an engineering degree. On the contrary, those that are not very good at STEM normally choose other degrees.
- In general, less than 33% of science track students in high school claim to be sure that they will continue their studies in an engineering degree.
- In both secondary and high school, students choose to study engineering depending on how capable they see themselves. This fact is more recognisable in girls, who tend to underestimate themselves. Hence, girls do not normally think about not choosing engineerings due to their difficulty but because they think they are not skilled enough to do it.
- Students’ interest in new technologies, such as smartphones, tablets or smartwatches, does not determining in the final choice of studying an engineering degree.
- Although in a lesser way than their perception about their own capabilities, their view, positive or negative, about the career prospects and the engineers themselves is an important part in their final decision.
When asked about stereotypes, the authors did not find the students think about engineers as “geeks” in a bad sense, however, they did observe a sexist perception of engineering. According to [42], “it is possible that nerd-genius stereotypes can be further broken down into two categories: the nerd stereotype—that people in STEM are socially awkward, physically unattractive, and romantically unsuccessful—and the genius stereotype—that people in STEM are technology obsessed geniuses. Nerd-genius stereotypes about people in STEM may especially affect women due to the incongruity of the stereotype with traditional female gender identity and cultural expectations”.
This way, up to 60% of the surveyed students think that engineering degrees are “for men”, and the rest marked that it is not exclusive for them. Meanwhile, only 42% marked that they agree with the statement “engineerings are for women”, and the rest (58%) said it is not for women. The same happens for other STEM degrees, mathematics and physics. Actually, when separating the results by gender, they found that in secondary school, the difference between boys and girls wanting to study an engineering is of 14 percentage points more alike for boys than girls, and grows to 31 percentage points in high school. In addition, the socioeconomic position of the families makes these percentages even more acute, meaning that girls coming from families with high income have more probability to study an engineering degree than others with lower incomes.
In view of these results, there is a need to further study the gender factors that might influence students when choosing a degree. Particularly for this work, a European Project called “Mind the Gap” has been analysed. In a deliverable of this project [43], the researchers compare the situation of women in technology in three different countries, the Netherlands, the United Kingdom and Spain. There are some similarities and factors in common, such as:
- The fact that the girls’ environment is very influential, their families the most influential. Furthermore, the concept of “family” itself is a crucial factor, as the researchers observed that the interviewees perceived that long workdays do not reconcile with “their housewife tasks”.
- How unconfident the girls felt with STEM subjects or engineerings because they are crowded with men and that was an uncomfortable environment for them.
- Teachers represent another influential factor because they do not know how to cope with stopping the continuation of stereotypes, although they admit is happening.
The results of the deliverable of “Mind the Gap” can be also found in the vast majority of the literature. To cite a few, in [19], the AAUW tried to identify the reasons why there were so few women in STEM degrees or careers, concluding that the main factors are:
- The continuation of the old belief that women are worse than men at mathematics, even if nowadays this has been proven wrong.
- The general assumption of women not being interested in technology.
- Lastly, in the scope of STEM companies, family reconciliation.
In [44], the authors find that “gender differences in interest in STEM majors is strongly related to women’s lower self-efficacy” (defined in [45] as the belief that one has the capability to succeed in a domain) “for STEM careers and, to a lesser degree, to women’s lower social belongingness expectations with students in STEM majors. Social belongingness expectations also partly explained men’s lower interest in HEED majors”.
Another study performed in Spain is the one presented by Molina et al. [46], in which they gathered high school students’—both boys and girls—perceptions about engineering before and after their participation in a “Girls’ day”, consisting of a series of activities during a tour through the University of Zaragoza, all carried on by women engineers. Their questionnaires covered mostly the same points as in [41] even though the event they described was held in 2008 and showed similar conclusions, such as the family support being an important influence factor and the tendency of girls to underestimate themselves. This study also showed that by taking actions focused on girls, their interest in engineering increases. However, as the situation has not changed, we still have to go deeper into the reasons why girls are not studying engineering.
As authors see in [47], “four factors mainly influence the decisions of students to declare a STEM major and to persist in the field: interest, ability, self-efficacy, and educational experiences”. In [40], it is pointed out that “beliefs and self-confidence are important predictors of student achievement and motivation in STEM careers, beyond other characteristics such as gender, ethnicity, age, experience or teaching hierarchy”. After reviewing studies conducted in the last 30 years, Wang and Degol in [48] argued that the STEM gap constitutes a “cultural phenomenon” caused by the “complex interaction” of six factors: (a) cognitive ability, (b) relative cognitive strengths, (c) occupational interests or preferences, (d) lifestyle values or work-family balance preferences, (e) field-specific ability beliefs and (f) gender-related stereotypes and biases. The study advice to reduce the gender gap in STEM, “attention should be given to address the contributory cognitive, motivational, and socio-cultural factors, primarily by maximizing the number of career options that women perceive as attainable and compatible with their abilities, preferences, and goals. Until then, large numbers of mathematically talented females will continue to slip through the cracks when their choices are restricted by cultural barriers, gender stereotypes, or misinformation”.
Finally, a study from 2013 [35] is worth mentioning because some of the questions used in their interviews have been included in the surveys made for this paper. In this study, Hazari et al. revealed how various actions can be opposing factors to those identified as negative. This way, the authors also asked the students about their interest in engineering and, at the same time, about the representation of women among their classmates and teachers and if there has been any activity in their schools that implied talking about the under-representation of women in STEM. The last one was the only activity they could relate to a change of opinion in girls, from negative to positive, about the interest for STEM or engineering degrees.
4. Survey Outcomes
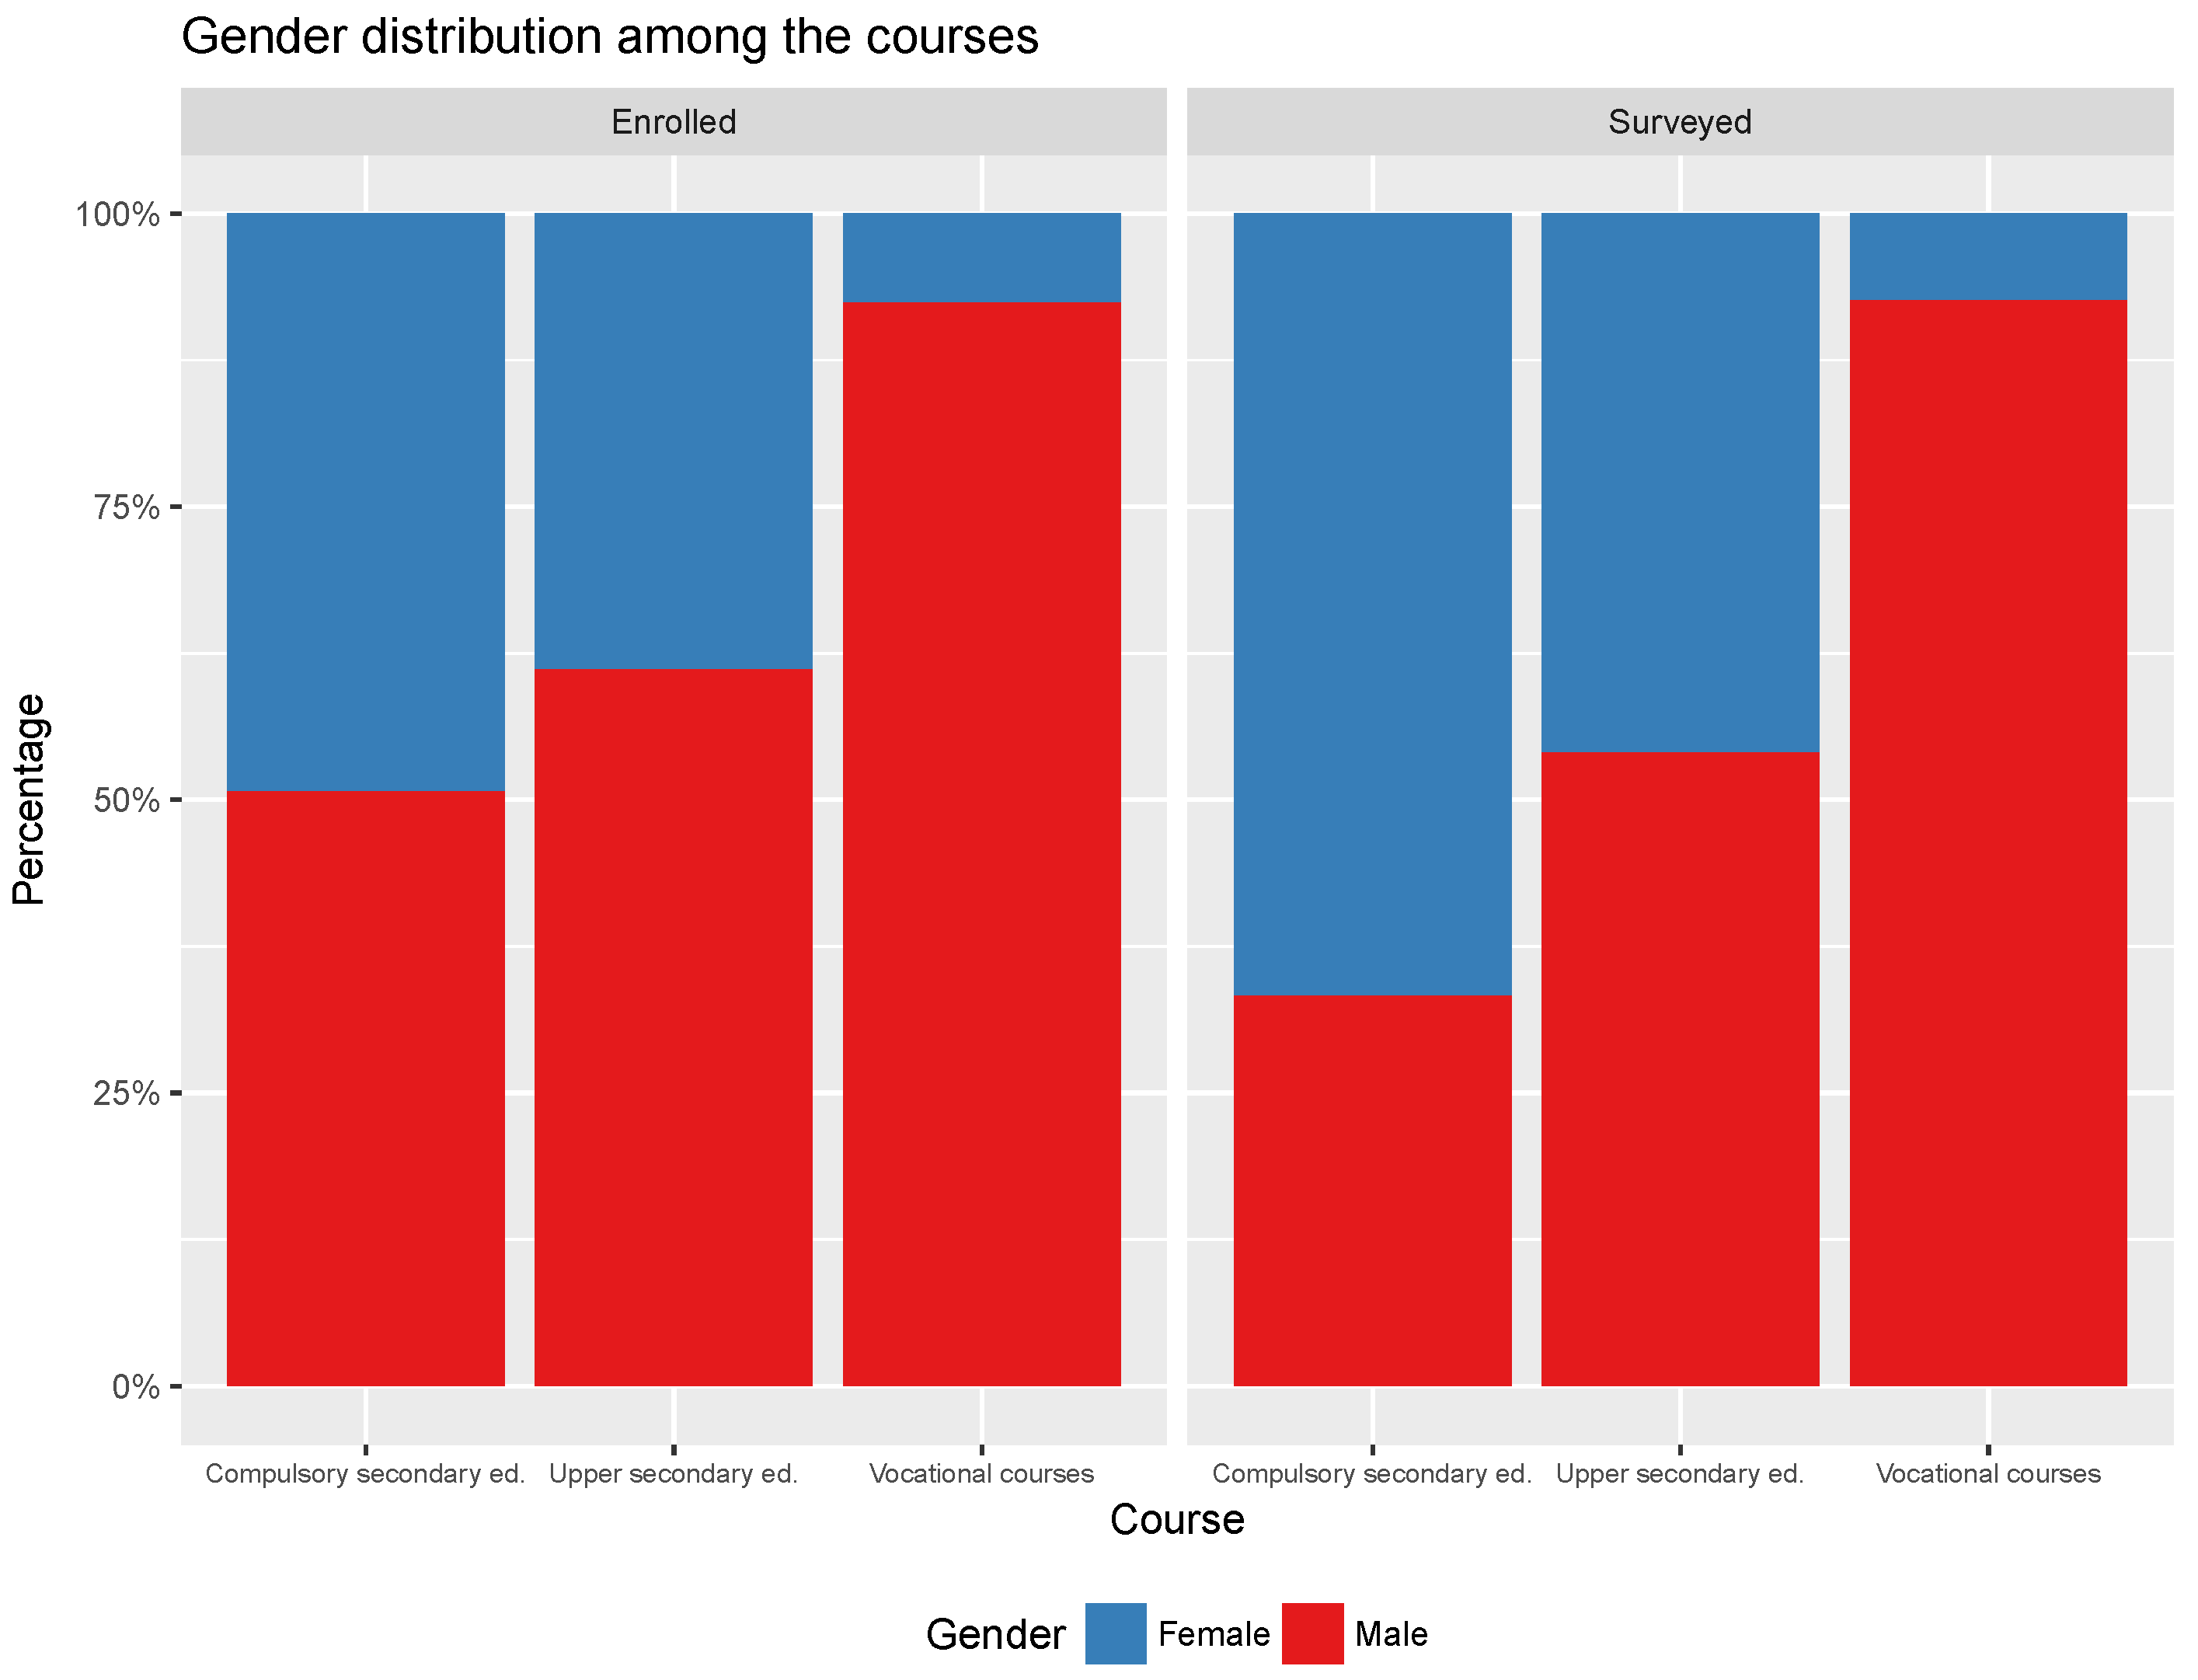
In this section, we show the results obtained in the survey responses. Therefore, and to begin with, the distribution of boys and girls who have been surveyed per course, in comparison with the total studying, is depicted in Figure 1.
We resume in Table 3 values for analysing the difference between boys and girls answering the question “Do you consider studying an engineering degree?”.
Table 4 shows the odds ratios related to different influence factors. In that table, we resume the odds ratios that express the advantage for choosing an engineering—for both male and female students—when different environmental circumstances are present. With the OR measurement, we indicate the p-value and 95% confidence interval associated.
We represent in Table 4 the influence of the scoring in mathematics and physics. The reason why computer science scoring is not represented in the table, as well as the results for technology for boys and girls separately, is because in some of the cases there is no enough data in the sample that meet all conditions, and therefore, the odds ratio cannot be obtained.
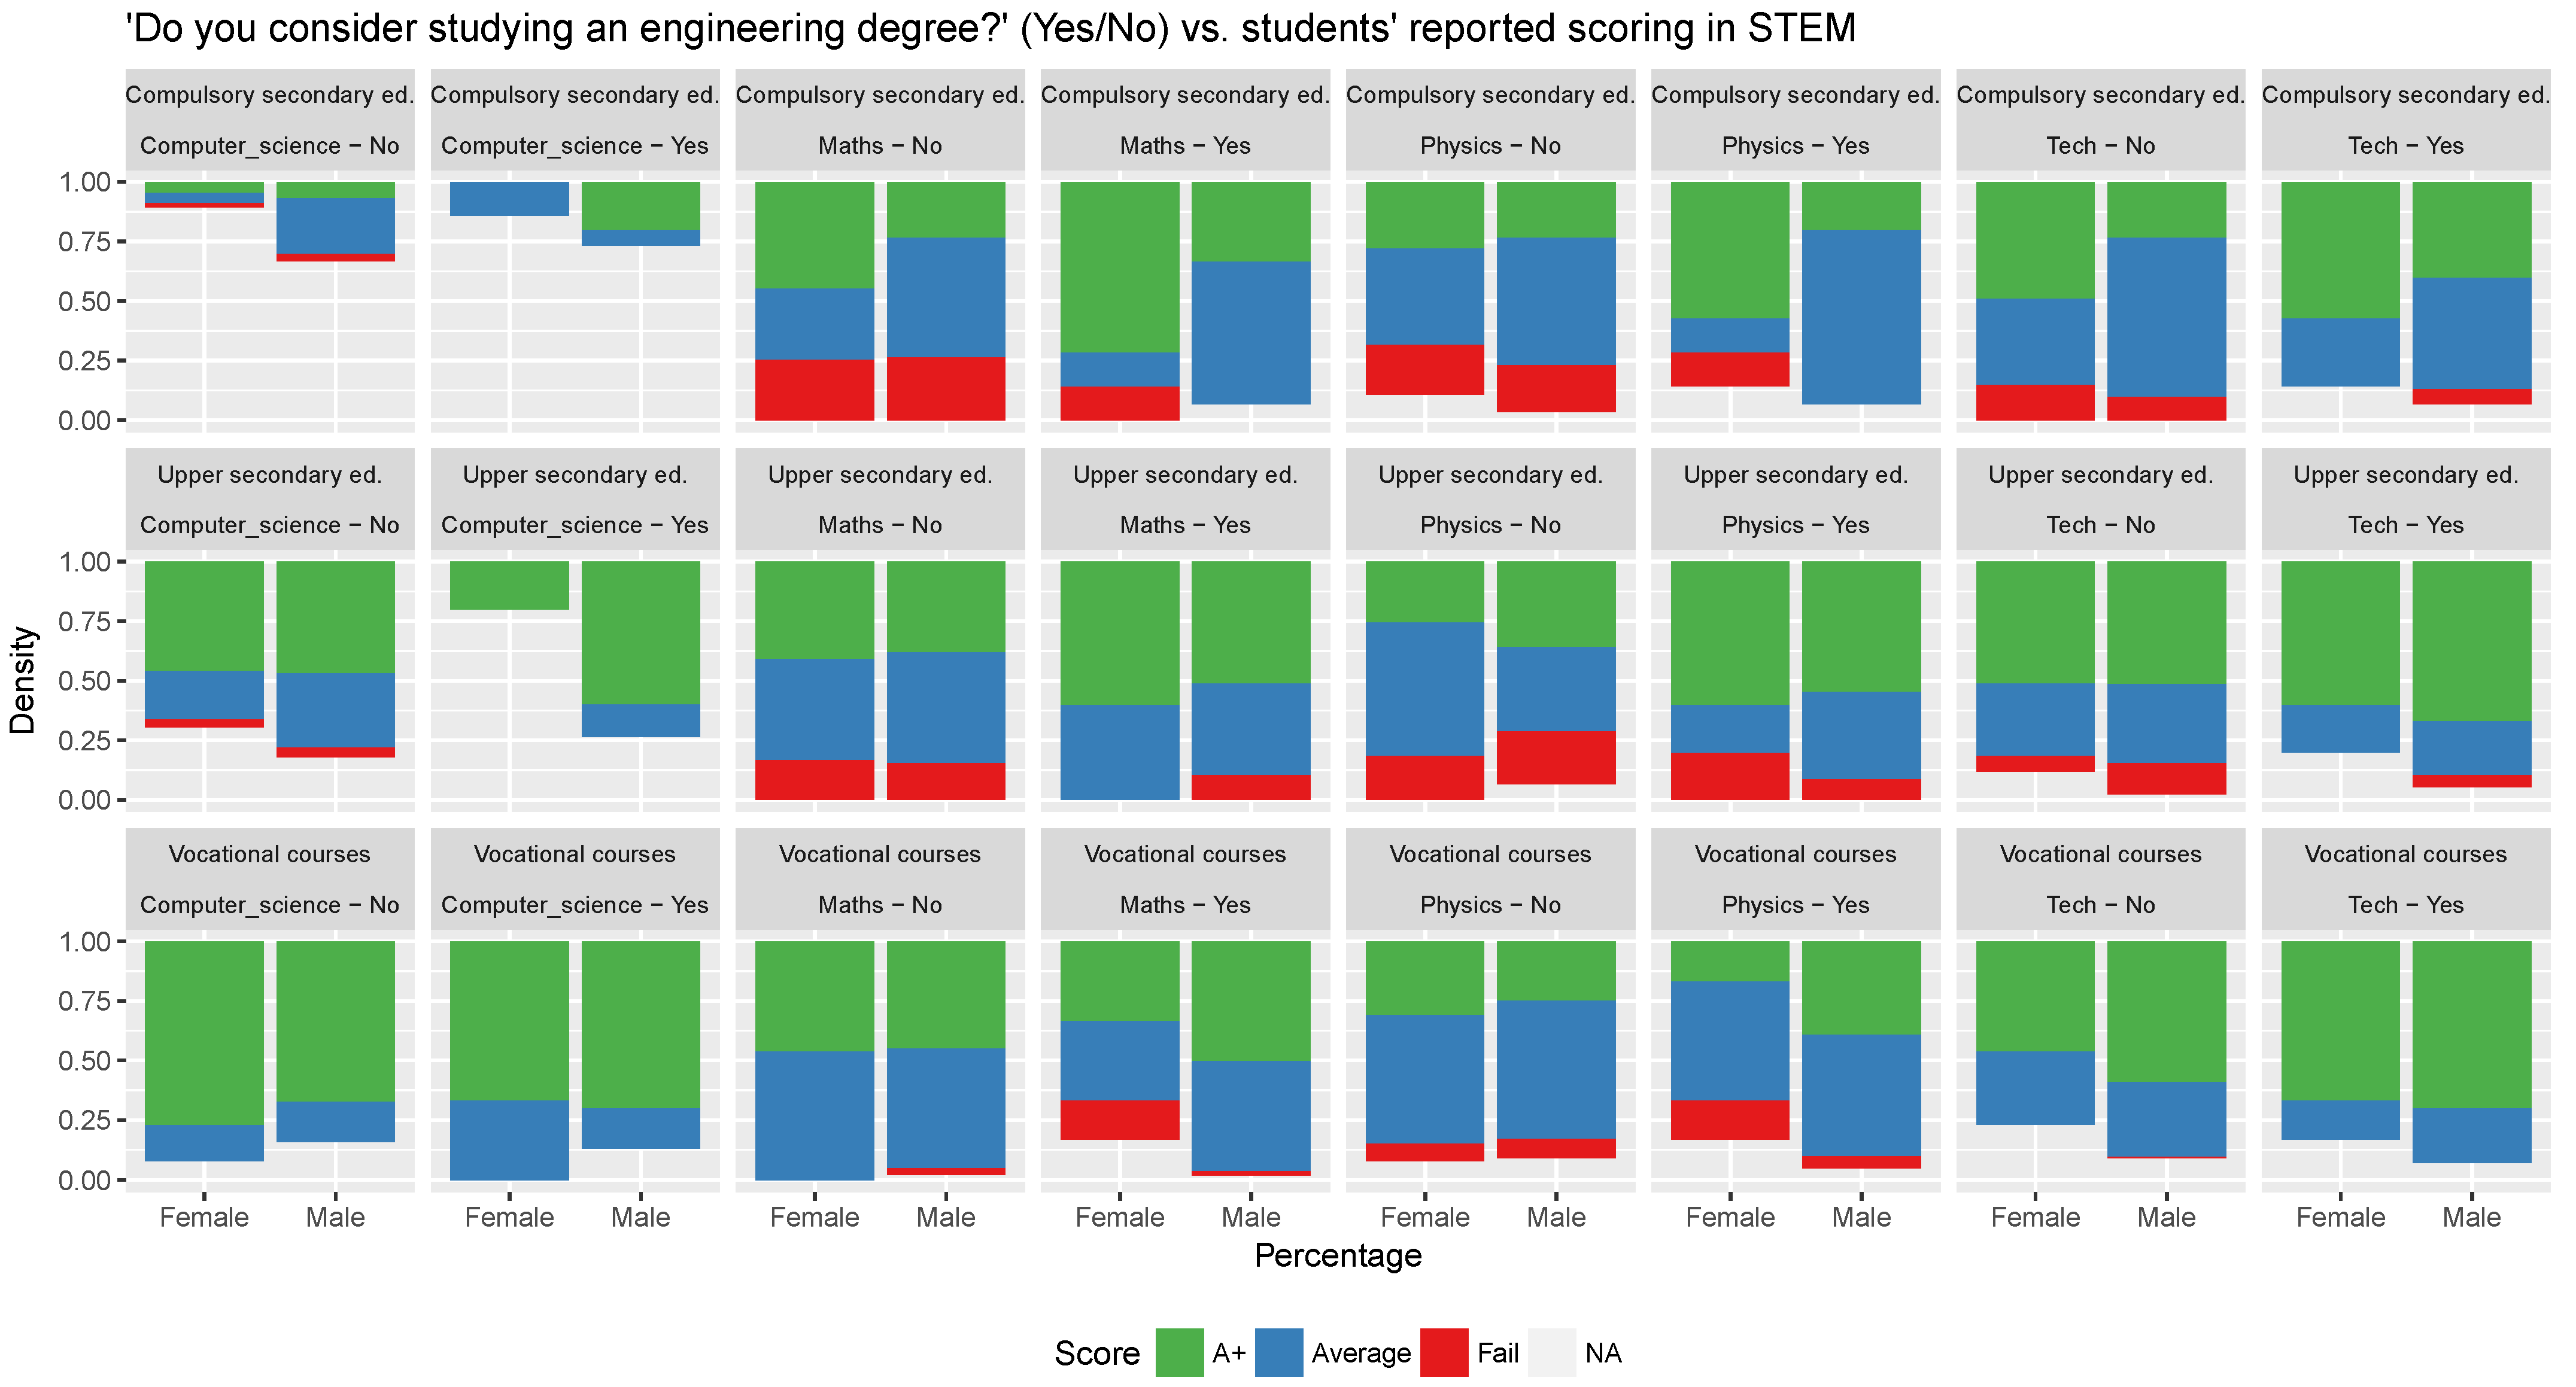
A summary of the reported scoring of the students is in Figure 2. The next set of results is about what the students think about engineering but also the engineers and their work.
Table 5 shows the odds ratios for every factor that has been studied and refers to boys, the girls being the base case.
Table 6 shows the odds ratios for answering the question “I am capable of studying an engineering” for both female and male students, as well as the associated p-values and confidence intervals.
5. Discussion
Once we find influence factors (first goal) and resume them in Section 3, we observe the behaviour of the obtained responses regarding them.
Firstly, in Figure 1, we observe that the percentage of female students quickly falls as the course level grows, being less than 10% in the vocational courses, the same found in STEM as presented in Section 1, and in particular in engineering degrees. We can assure, regarding analysis question (a) that the number of women in technical courses decreases when the level of the course increases.
We see in Table 3 that when the students are asked whether they are thinking about studying an engineering or not, the resulting odds ratio is of 7.567 for boys to study engineering. That is, if we wonder how the advantage to express intention of studying engineering increases from boys versus girls, the answer is that it is more than 7 times higher for boys in our study case.
Focusing on the environment of the students, we study now how that influences in what they want to study in the future. With regard to the environment in the classroom, we distinguish between the fellow students and teachers. This way, Table 4 reports a significant advantage of 2.524 for boys to choose engineering when the environment in the classroom is a majority of boys instead of an equal or girls majority situation. In the case of girls, there is also a slight advantage in a mainly male environment, but it is not significant. However, to have mainly, or all, male teachers in STEM subjects does matter for the girls, given that, in that case, girls present an advantage of 7.286 of choosing an engineering than for the other case where they report having teachers from both genders or mainly female. This does not necessarily mean that female role models are not important for the girls’ decisions but rather that those girls that already feel comfortable in a mainly male environment are more likely to study engineering than those who do not. As a conclusion, we can say that we have found regarding (b) that role models and environments are decisive, but not in general.
The next influence factor to study is how the scoring in STEM subjects affects to the decision of studying engineering, given that in such degrees there are subjects such as physics—inside science—mathematics and electronics or technology.
In Figure 2, we can seen that girls outperform the boys almost in every case that is depicted. At the same time, students who said that they are considering to study an engineering degree report better results than those who will not study engineering. Furthermore, no one girl saying she will study engineering reported a failing grade in technology or computer science. Then, we also observe in these results answering question (c) that girls will not choose engineering even though their scoring in STEM is good. This matches with the results in Table 4. In addition, it seems that the most determining subjects are thus mathematics and physics, although around 5 to 10% of the students who said they will study engineering degrees have reported a fail in one or both of these two subjects, and they still remain confident in what they want to study.
Even though it does not appear that mathematics are the key to decide whether to study engineering or not (results are not statistically significant), the boys show slightly more advantage to study engineering when their scoring in this subject and in physics are higher. In the case of the girls, the scoring does not significantly affect their decision, but they are still at a disadvantage with respect to the boys. A good scoring in physics, instead, is related to a higher probability of studying engineering. Nevertheless, that is in the case of boys but not for the girls. In general, girls have less odds of choosing engineering, even if they pass physics (note that value 1.00 means that there is not advantage over those who fail) or they have a good scoring. With respect to technology, the odds ratio shows an advantage of being almost three times higher for those students who pass the subject over those who do not and almost five times higher for those who have A or A+, and therefore, they are more likely to study an engineering degree.
This way, we see the odds of boys giving a particular answer over the girls. Overall, we see statistically significant differences between what boys and girls think due to the low, below 0.05, p-values obtained. Another conclusion is that boys have higher odds of taking a stance, answering either yes or no, than the girls, meaning that the girls have more doubts and prefer to remain neutral. Then, we cannot conclude for question (d) that a bad opinion about engineering (including believing in the “geek” stereotype) contributes to lessening the number of women in STEM because the opinion of the girls is mostly neutral.
However, the most revealing result is the advantage of the boys over the girls with regard to their self-confidence. Table 6 reflects that boys not only have less probability (odds ratio below 1.00) of responding “no” when asked if they see themselves as not capable of studying an engineering, but the probability of a boy seeing himself as capable is almost six times higher than a girl. Because of this, we can say that in this study case, answering question (e) that girls and women see themselves as not capable of studying an engineering degree.
There were two statements that are not represented in Table 5: “Engineering is for men” and “Engineering is for geeks”. In both cases, we obtained a p-value higher than 0.05, and thus, no statistically significant differences were found between boys’ and girls’ responses. Actually, by deeply analysing their responses, the tendency is to remain neutral to those statements. Therefore, in this way, the statement (f) "The thought about STEM degrees being overcrowded with men also causes women to dismiss studying them" cannot be confirmed due to the neutrality of the responses.
In this paper, we analyse the factors that influence the decisions of students at high school when it comes to say if they will continue studying, and if so, if it will be engineering. Two studies or projects have been analysed, mainly [41,43], and supported by an extensive bibliography. Then, literature, along with the influence factors identified in Section 3, have contributed to the elaboration of an online questionnaire that has been given to students of a high school in Granada (Spain).
The results show that, for the most part, what has been found in the literature is present in a city centre high school in the south of Spain where the students belong to middle class families. Thus, students still see themselves as not capable of studying an engineering, and girls continue to not choose an engineering degree even if their scoring in STEM subjects outperforms their counterparts.
Prejudices such as “engineers are geeks” could not be confirmed, as most of the students preferred not to pronounce themselves about the topic. The same was found with the belief that “engineering is mostly for men”, in which we have found either neutral opinions or disagreement, except for a part of the youngest female students, who actually marked that they will not study an engineering because it is for men.
6. Conclusions and Open Questions
We find in the literature the most important factors affecting students’ choices for their possible future academic training and professional development. These factors most influence girls’ and women’s decisions, distancing them from technology and computer sciences and are related to their success in STEM subjects and how capable they see themselves. We summarize the following:
- The main factor affecting choices is self-efficacy in STEM areas.
- Self-efficacy is related to environment; family, stereotypes and scope of companies are the most influential facets for this belief.
- -
- Family influence is related with future families, expected housewife role and with parents and relatives.
- -
- Stereotypes are referred to the “geek” or “nerd” image associated with STEM areas.
- -
- Environments filled by men are seen as uncomfortable and not desirable by female students.
We carried out a survey in the south of Spain, where 338 students, both girls and boys, participated. We analyse the obtained data and find results that answer our research questions:
- Are the number of women in technical tracks decreasing when the courses run? The answer for this question is that our data confirm that they are.
- Are decisive role models and environments? Our data point out that girls feel comfortable even the lack of role models in their environment. We conclude role models are not decisive.
- Will girls choose an engineering if they have good scoring at STEM? We find in data collected that, unlike boys, girls will not choose engineering even if their scoring in STEM is good.
- Do bad opinions about engineering contribute to lessening the number of women in STEM (including believing in the “geek” stereotype)? We have no conclusive data to confirm nor refute this statement. We find girls significantly report more neutral responses in questions about this kind of stereotypes than boys.
- Do girls and women see themselves as not capable of studying an engineering degree? Our finding is they do; girls and women see themselves not capable of studying an engineering degree more than boys and men do.
- Does the thought about STEM degrees being overcrowded with men cause women to dismiss studying them? We cannot confirm this statement due to high neutrality in responses.
This findings contribute to the knowledge and understanding of the situation regarding the gender gap in STEM fields. The investigation focus on two parts: Firstly, we synthesise the influence factors for both boys and girls, especially for girls, in their decisions for choosing a STEM academic training or not. Secondly, we study the case of a high school in the city of Granada located in the south of Spain, where we confirm the main difference between boys and girls is that girls and women see themselves as not capable of studying an engineering degree more than boys and men do.
There are numerous questions that we have not addressed in this research, such as what happens at younger ages, when girls begin to feel as not capable as boys or what about teachers point of view, among others. One interesting one is what is nowadays happening with special education plans in high schools? Are they improving students skills? Are they reducing gender gap?
In future work, we would like to interview the teachers and to build a separate survey for them, so that we will compare their opinions with those found in the literature. In addition, an action-research can be performed, applying some of the actions described in Section 1 and studying whether the girls feel more attracted to engineering or not.
Author Contributions
Conceptualization, P.d.l.C. and M.G.-A.; methodology, M.G.-A.; software, P.d.l.C. and N.R.; validation, P.d.l.C. and N.R.; formal analysis, M.G.-A. and N.R.; investigation, P.d.l.C., M.G.-A. and N.R.; resources, P.d.l.C., M.G.-A. and N.R.; data curation, N.R.; writing—original draft preparation, P.d.l.C.; writing—review and editing, M.G.-A. and N.R.; visualization, M.G.-A.; supervision, M.G.-A. and N.R.; project administration, M.G.-A.; funding acquisition, N.R. All authors have read and agreed to the published version of the manuscript.
Funding
This research was funded by Junta de Andalucía grant number FQM-147 and by Ministerio Español de Economía y Competitividad, project TIN2017-85727-C4-2-P (UGR-DeepBio).
Institutional Review Board Statement
Not applicable.
Informed Consent Statement
Informed consent was obtained from all subjects involved in the study.
Data Availability Statement
The data presented in this study are openly available in Zenodo at https://0-dx-doi-org.brum.beds.ac.uk/10.5281/zenodo.5586126 (accessed on 9 October 2021).
Acknowledgments
The authors would like to thank the high school Zaidín-Vergeles, and specially thank teacher Nuria Azpeitia, for their collaboration during the performance of the survey.
Conflicts of Interest
The authors declare no conflict of interest.
Abbreviations
The following abbreviations are used in this manuscript:
| STEM | Science, Technology, Engineering and Mathematics |
| ICT | Information and Communication Technologies |
| OECD | Organisation for Economic Co-operation and Development |
| HEED | Healthcare, Elementary Education and Domestic spheres |
| AAUW | American Association of University Women |
| OR | Odds Ratio |
| CI | Confidence Interval |
| ESO | Compulsory secondary education, (Enseñanza Secundaria Obligatoria) |
Appendix A. The Educational System in Spain
In order to clarify what students have participated in our study, there is a need for specifying how the educational system works in Spain. High school is divided into 6 years, of which 4 are “ESO” (Compulsory secondary education) and “Bachillerato” (Non-compulsory Upper secondary education). Normally, students from third and fourth courses of ESO and first and second courses of Bachillerato range from 15 to 18 years old. There can be students that have repeated a course and be older than 18 years old, but they are rarely older than 20.
After Bachillerato, students can go to University, work or study a “Ciclo Formativo”, which can be understood as a vocational course. They can be accessed from the ESO or from Bachillerato. Thus, depending the course from the courses are accessed, they last four or two years. The vocational courses are organised in a more practical way, and in the case of the study performed for this paper, the students are from:
- Microsystems and networks vocational courses;
- Network system administration vocational courses;
- Web applications development vocational courses;
- Multiplatform applications development vocational courses.
All target courses are related to technology or computer science. The students of these courses are not necessarily 18 or 19 years old, but sometimes are unoccupied people or University students who have abandoned their degree for a more practical option.
References
- Kennedy, T.J.; Odell, M.R.L. Engaging students in STEM education. Sci. Educ. Int. 2014, 25, 246–258. [Google Scholar]
- Lee, A. Determining the effects of computer science education at the secondary level on STEM major choices in postsecondary institutions in the United States. Comput. Educ. 2015, 88, 241–255. [Google Scholar] [CrossRef]
- Condon, M.; Wichowsky, A. Developing citizen-scientists: Effects of an inquiry-based science curriculum on STEM and civic engagement. Elem. Sch. J. 2018, 119, 196–222. [Google Scholar] [CrossRef]
- Hwang, G.J.; Li, K.C.; Lai, C.L. Trends and strategies for conducting effective STEM research and applications: A mobile and ubiquitous learning perspective. Int. J. Mob. Learn. Organ. 2020, 14, 161–183. [Google Scholar] [CrossRef]
- OECD. Education at a Glance 2021: OECD Indicators; OECD Publishing: Paris, France, 2021. [Google Scholar] [CrossRef]
- Gago, J.M.; Ziman, J.; Caro, P.; Constantinou, C.; Davies, G.; Parchmann, I.; Rannikmae, M.; Sjøberg, S. Europe Needs More Scientists: Report by the High Level Group on Increasing Human Resources for Science and Technology; European Commission, DG Research, Science and Society Programme: Brussels, Belgium, 2005. [Google Scholar]
- OECD. Increasing Student Interest in S&T Studies. In Encouraging Student Interest in Science and Technology Studies; OECD Publishing: Paris, France, 2008. [Google Scholar]
- Kahn, S.; Ginther, D. Women and STEM; NBER Working Paper; NBER: Cambridge, MA, USA, 2017; Volume 23525. [Google Scholar]
- Malik, S.; Al-Emran, M. Social factors influence on career choices for female computer science students. Int. J. Emerg. Technol. Learn. 2018, 13, 56–70. [Google Scholar] [CrossRef]
- Strachan, R.; Peixoto, A.; Emembolu, I.; Restivo, M.T. Women in engineering: Addressing the gender gap, exploring trust and our unconscious bias. In Proceedings of the 2018 IEEE Global Engineering Education Conference (EDUCON), Santa Cruz de Tenerife, Spain, 17–20 April 2018; pp. 2088–2093. [Google Scholar]
- Soler, S.C.G.; Alvarado, L.K.A.; Nisperuza, G.L.B. Women in STEM: Does college boost their performance? High. Educ. 2020, 79, 849–866. [Google Scholar] [CrossRef]
- Teignier, M.; Cuberes, D. Aggregate Costs of Gender Gaps in the Labour Market: A Quantitative Estimate; UB Economics Working Papers; Universitat de Barcelona: Barcelona, Spain, 2014; Volume 308. [Google Scholar]
- European Institute for Gender Equality (EIGE). Economic Benefits of Gender Equality in the European Union. 2017. Available online: http://eige.europa.eu/gender-mainstreaming/policy-areas/economic-and-financial-affairs/economic-benefits-gender-equality (accessed on 1 December 2021).
- World Economic Forum. The Global Gender Gap Report 2017. 2017. Available online: https://www3.weforum.org/docs/WEF_GGGR_2017.pdf (accessed on 1 December 2021).
- Women in Stem—Statistics and Facts 2015. The Institution of Engineering and Technology. Available online: https://communities.theiet.org/files/8042 (accessed on 19 October 2021).
- González, J.; Wagenaar, R. Universities’ Contribution to the Bologna Process: An introduction, 2nd ed.; Universidad de Deusto: Bilbo, Spain, 2008. [Google Scholar]
- Ministry of Education, Culture and Sports, Government of Spain. Data and Statistics of the Spanish Educational System, Years 1985–2015. Available online: https://www.educacionyfp.gob.es/servicios-al-ciudadano/estadisticas/universitaria/estadisticas/alumnado-copia/hasta-2014.html (accessed on 19 October 2021).
- Ministry of Education, Culture and Sports, Government of Spain. Data and Statistics of the Spanish Educational System, Years 2016–2020. Available online: https://estadisticas.mecd.gob.es/EducaDynPx/educabase/index.htm?type=pcaxis&path=/Universitaria/Alumnado/EEU_2021/GradoCiclo/Matriculados/ (accessed on 19 October 2021).
- Hill, C.; Corbett, C.; St. Rose, A. Why So Few? Women in Science, Technology, Engineering, and Mathematics; American Association of University Women: Washington, DC, USA, 2010. [Google Scholar]
- Yang, Y.; Carroll, D.W. Gendered Microaggressions in Science, Technology, Engineering, and Mathematics. Leadersh. Res. Educ. 2018, 4, 28–45. [Google Scholar]
- Sekaquaptewa, D. Gender-Based Microaggressions in STEM Settings. NCID Curr. J. 2019, 1, 1–10. [Google Scholar] [CrossRef]
- Diekman, A.B.; Steinberg, M. Navigating Social Roles in Pursuit of Important Goals: A Communal Goal Congruity Account of STEM Pursuits. Soc. Personal. Psychol. Compass 2013, 7, 487–501. [Google Scholar] [CrossRef]
- Yang, Y.; Barth, J.M. Gender differences in STEM undergraduates’ vocational interests: People–thing orientation and goal affordances. J. Vocat. Behav. 2015, 91, 65–75. [Google Scholar] [CrossRef] [Green Version]
- Zywno, M.S.; Gilbride, K.A.; Hiscocks, P.D.; Waalen, J.K.; Kennedy, D.C. Attracting women into engineering—A case study. IEEE Trans. Educ. 1999, 42, 7. [Google Scholar] [CrossRef]
- Wilson, L.S. The benefits of diversity in the science and engineering work force. In Science and Engineering Programs: On Target for Women? National Research Council; The National Academies Press: Washington, DC, USA, 1992; pp. 1–14. [Google Scholar]
- Arredondo, F.; Vázquez, J.; Velázquez, L. STEM y brecha de género en Latinoamérica. Rev. El Col. San Luis 2019, 9, 137–158. [Google Scholar] [CrossRef] [Green Version]
- Botella, C.; Rueda, S.; López-Iñesta, E.; Marzal, P. Gender diversity in STEM disciplines: A multiple factor problem. Entropy 2019, 21, 30. [Google Scholar] [CrossRef] [Green Version]
- García-Holgado, A.; Verdugo-Castro, S.; González, C.; Sánchez-Gómez, M.C.; García-Peñalvo, F.J. European Proposals to Work in the Gender Gap in STEM: A Systematic Analysis. IEEE Rev. Iberoam. Tecnol. Aprendiz. 2020, 15, 215–224. [Google Scholar] [CrossRef]
- Mind the Gap Project. Available online: https://www.endfgm.eu/what-we-do/mind-the-gap/ (accessed on 19 October 2021).
- Brady, C.; Orton, K.; Weintrop, D.; Anton, G.; Rodriguez, S.; Wilensky, U. All Roads Lead to Computing: Making, Participatory Simulations, and Social Computing as Pathways to Computer Science. IEEE Trans. Educ. 2017, 60, 59–66. [Google Scholar] [CrossRef]
- Newman, K.M. 30+ Organizations for Women in Technology. Tech.co. Available online: http://tech.co/organizations-women-technology-2012-07 (accessed on 19 October 2021).
- Jiang, S.; Schenke, K.; Eccles, J.; Xu, D.; Warschauer, M. Cross-national comparison of gender differences in the enrollment in and completion of science, technology, engineering, and mathematics Massive Open Online Courses. PLoS ONE 2018, 13, e0202463. [Google Scholar] [CrossRef] [PubMed]
- Learn to Code with Me. 25 Organizations Teaching Women Coders & Girls around the Globe. Available online: http://learntocodewith.me/posts/13-places-women-learn-code/ (accessed on 19 October 2021).
- Saucerman, J.; Vasquez, K. Psychological barriers to STEM participation for women over the course of development. Adultspan J. 2014, 13, 46–64. [Google Scholar] [CrossRef]
- Hazari, Z.; Potvin, G.; Lock, R.M.; Lung, F.; Sonnert, G.; Sadler, P.M. Factors that affect the physical science career interest of female students: Testing five common hypotheses. Phys. Rev. Spec. Top. Phys. Educ. Res. 2013, 9, 020115. [Google Scholar] [CrossRef] [Green Version]
- Cohen, L.; Manion, L.; Morrison, K. Research Methods in Education, 6th ed.; Routledge: London, UK; New York, NY, USA, 2013. [Google Scholar]
- Szumilas, M. Explaining odds ratios. J. Can. Acad. Child Adolesc. Psychiatry 2010, 19, 227–229. [Google Scholar]
- Bland, J.M.; Altman, D.G. The odds ratio. BMJ 2000, 320, 1468. [Google Scholar] [CrossRef] [Green Version]
- Kwon, E. For passion or for future family? Exploring factors influencing career and family choices of female medical students and residents. Gend. Issues 2017, 34, 186–200. [Google Scholar] [CrossRef]
- Morales Inga, S.; Morales Tristán, O. Why are there few Women Scientists? A Literature Review on the Gender Gap in STEM Careers. Adres. ESIC Int. J. Commun. Res. 2020, 22, 118–133. [Google Scholar] [CrossRef]
- Factores Influyentes en la Elección de Estudios Científicos, Tecnológicos y Matemáticos. Everis Tech. Rep. 2012. Available online: http://s3-eu-west-1.amazonaws.com/e17r5k-datap1/everis_documents_downloads/estudio+vocaciones.pdf (accessed on 19 October 2021).
- Starr, C. “I’m not a science nerd!”: STEM stereotypes, identity, and motivation among undergraduate women. Psychol. Women Q. 2018, 42, 489–503. [Google Scholar] [CrossRef]
- MTG Project, Mind The Gap Project. Needs Analysis Summary. Tech. Rep. 2015. Available online: http://mindthegapproject.eu/wp-content/uploads/2015/02/Final-Need-Analysis-Report.pdf (accessed on 19 October 2021).
- Tellhed, U.; Bäckström, M.; Björklund, F. Will I fit in and do well? The importance of social belongingness and self-efficacy for explaining gender differences in interest in STEM and HEED majors. Sex Roles 2017, 77, 86–96. [Google Scholar] [CrossRef] [Green Version]
- Bandura, A. Self-efficacy: Toward a unifying theory of behavioral change. Psychol. Rev. 1977, 84, 191–215. [Google Scholar] [CrossRef] [PubMed]
- Molina-Gaudo, P.; Baldassarri, S.; Villarroya-Gaudo, M.; Cerezo, E. Perception and intention in relation to engineering: A gendered study based on a one-day outreach activity. IEEE Trans. Educ. 2010, 53, 61–70. [Google Scholar] [CrossRef]
- Green, A.; Sanderson, D. The roots of STEM achievement: An analysis of persistence and attainment in STEM majors. Am. Econ. J. 2018, 63, 79–93. [Google Scholar] [CrossRef]
- Wang, M.; Degol, J. Gender gap in science, technology, engineering, and mathematics (STEM): Current knowledge, implications for practice, policy, and future directions. Educ. Psychol. Rev. 2017, 29, 119–140. [Google Scholar] [CrossRef]
Figure 1.
Distribution of gender among the students enrolled (on the left) and surveyed (on the right), per course (Compulsory secondary education, Upper secondary education and Vocational courses).
Figure 1.
Distribution of gender among the students enrolled (on the left) and surveyed (on the right), per course (Compulsory secondary education, Upper secondary education and Vocational courses).

Figure 2.
Comparison between what the students reported about their scores in STEM subjects and their plans for studying (or not) engineering. The question was “Do you consider studying an engineering degree?”. Results are detailed per course as well as by gender. Since not all students have enrolled in the computer science course, and others have decided not to report their scoring, we represent these as blanks (NA) because they give valuable information too.


Table 1.
Distribution of students per course in science and technology specialties, where the survey was undertaken. Number of enrolled/surveyed and approximate age.
Table 1.
Distribution of students per course in science and technology specialties, where the survey was undertaken. Number of enrolled/surveyed and approximate age.
| Course | Number of Students by Gender | Approx. Age | |||
|---|---|---|---|---|---|
| Total Enrolled | Surveyed | ||||
| M | F | M | F | ||
| Compulsory sec. ed., years 3 and 4 | 63 | 61 | 12 | 24 | 14–18 |
| Upper sec. ed., both years | 71 | 45 | 53 | 45 | 16–20 |
| Vocational courses | 318 | 26 | 189 | 15 | ≥18 |
Table 2.
Distribution of gender among the teachers from departments related to STEM.
| Department | Male Teachers | Female Teachers |
|---|---|---|
| Science | 3 | 2 |
| Technology | 0 | 3 |
| Computer Science | 20 | 8 |
| Mathematics | 6 | 2 |
Table 3.
Odds ratio, p-value and confidence interval obtained for the study of the advantage to answer “Yes” for boys in the question about if they think about choosing an engineering degree. An * indicates statistical significance.
Table 3.
Odds ratio, p-value and confidence interval obtained for the study of the advantage to answer “Yes” for boys in the question about if they think about choosing an engineering degree. An * indicates statistical significance.
| Influence Factor | Agree? | OR | p-Value | Low.Lim | Upp.Lim |
|---|---|---|---|---|---|
| Thinking about choosing engineering | Yes | 7.567 * | 0.000 | 3.504 | 16.342 |
Table 4.
Odds ratios, p-values and 95% confidence intervals obtained for the study of the advantage for the decision of studying an engineering depending on influence factors for both male and female students. An * indicates statistical significance at level 0.05.
Table 4.
Odds ratios, p-values and 95% confidence intervals obtained for the study of the advantage for the decision of studying an engineering depending on influence factors for both male and female students. An * indicates statistical significance at level 0.05.
| Influence Factor | Gender | OR | p-Value | Low.Lim | Upp.Lim |
|---|---|---|---|---|---|
| Classroom being mainly male | Male | 2.524 * | 0.044 | 1.027 | 6.204 |
| Classroom being mainly male | Female | 1.387 | 0.661 | 0.322 | 5.978 |
| STEM teachers being mainly male | Male | 0.963 | 0.883 | 0.584 | 1.587 |
| STEM teachers being mainly male | Female | 7.286 * | 0.020 | 1.359 | 39.055 |
| A/A+ in Mathematics | Male | 2.059 | 0.251 | 0.599 | 7.076 |
| B/C (pass) in Mathematics | Male | 1.728 | 0.384 | 0.505 | 5.919 |
| A/A+ in Mathematics | Female | 0.343 | 0.281 | 0.049 | 2.403 |
| B/C (pass) in Mathematics | Female | 0.250 | 0.250 | 0.030 | 2.057 |
| A/A+ in Physics | Male | 4.583 * | 0.012 | 1.398 | 15.030 |
| B/C (pass) in Physics | Male | 3.000 | 0.062 | 0.946 | 9.513 |
| A/A+ in Physics | Female | 1.300 | 0.012 | 0.107 | 15.836 |
| B/C (pass) in Physics | Female | 1.000 | 1.000 | 0.096 | 10.471 |
| A/A+ in Technology | Both | 4.864 | 0.142 | 0.587 | 40.290 |
| B/C (pass) in Technology | Both | 2.800 | 0.346 | 0.329 | 23.814 |
Table 5.
Odds ratios, p-values and confidence intervals obtained for the study of the advantage for male versus female students in agreeing with the questions in column “Influence factors”. An * indicates statistical significance at level 0.05.
Table 5.
Odds ratios, p-values and confidence intervals obtained for the study of the advantage for male versus female students in agreeing with the questions in column “Influence factors”. An * indicates statistical significance at level 0.05.
| Influence Factor | Agree? | OR | p-Value | Low.Lim | Upp.Lim |
|---|---|---|---|---|---|
| Engineers have social acceptance | Yes | 3.476 * | 0.000 | 1.916 | 6.307 |
| Engineers have social acceptance | No | 3.906 * | 0.000 | 1.976 | 7.721 |
| Engineers have a good salary | Yes | 1.737 | 0.060 | 0.977 | 3.087 |
| Engineers have a good salary | No | 3.225 * | 0.001 | 1.666 | 6.242 |
| An engineer’s work is creative | Yes | 4.524 * | 0.000 | 2.273 | 9.004 |
| An engineer’s work is creative | No | 7.028 * | 0.002 | 2.052 | 24.068 |
| An engineer’s work is easy | Yes | 1.385 | 0.641 | 0.352 | 5.445 |
| An engineer’s work is easy | No | 2.652 * | 0.028 | 1.113 | 6.318 |
| An engineer’s worktime is fair | Yes | 2.150 * | 0.026 | 1.095 | 4.223 |
| An engineer’s worktime is fair | No | 2.881 * | 0.001 | 1.553 | 5.346 |
| An engineer’s work has social impact | Yes | 4.371 * | 0.000 | 2.134 | 8.954 |
| An engineer’s work has social impact | No | 2.235 | 0.141 | 0.765 | 6.527 |
Table 6.
Odds ratio, p-value and confidence interval obtained for the study of the advantage of feeling capable for male and female students. An * indicates statistical significance.
Table 6.
Odds ratio, p-value and confidence interval obtained for the study of the advantage of feeling capable for male and female students. An * indicates statistical significance.
| Influence Factor | Gender | OR | p-Value | Low.Lim | Upp.Lim |
|---|---|---|---|---|---|
| I am capable of studying engineering | Male | 5.923 * | 0.000 | 2.276 | 15.418 |
| I am capable of studying engineering | Female | 0.764 | 0.389 | 0.414 | 1.409 |
Publisher’s Note: MDPI stays neutral with regard to jurisdictional claims in published maps and institutional affiliations. |
© 2022 by the authors. Licensee MDPI, Basel, Switzerland. This article is an open access article distributed under the terms and conditions of the Creative Commons Attribution (CC BY) license (https://creativecommons.org/licenses/by/4.0/).
Share and Cite
MDPI and ACS Style
de las Cuevas, P.; García-Arenas, M.; Rico, N. Why Not STEM? A Study Case on the Influence of Gender Factors on Students’ Higher Education Choice. Mathematics 2022, 10, 239. https://0-doi-org.brum.beds.ac.uk/10.3390/math10020239
AMA Style
de las Cuevas P, García-Arenas M, Rico N. Why Not STEM? A Study Case on the Influence of Gender Factors on Students’ Higher Education Choice. Mathematics. 2022; 10(2):239. https://0-doi-org.brum.beds.ac.uk/10.3390/math10020239
Chicago/Turabian Stylede las Cuevas, Paloma, Maribel García-Arenas, and Nuria Rico. 2022. "Why Not STEM? A Study Case on the Influence of Gender Factors on Students’ Higher Education Choice" Mathematics 10, no. 2: 239. https://0-doi-org.brum.beds.ac.uk/10.3390/math10020239
Note that from the first issue of 2016, this journal uses article numbers instead of page numbers. See further details here.