
An Agent-Based Interpretation of Leukocyte Chemotaxis in Cancer-on-Chip Experiments


1
Istituto per le Applicazioni del Calcolo “Mauro Picone” (CNR-IAC), 00185 Rome, Italy
2
Istituto di Analisi dei Sistemi ed Informatica “Antonio Ruberti” (CNR-IASI), 00185 Rome, Italy
3
Istituto per la Ricerca e l’Innovazione Biomedica (CNR-IRIB), 90146 Palermo, Italy
4
Department of Biomatics, Óbuda University, 1034 Budapest, Hungary
5
Department of Mathematics, Mahidol University, Bangkok 10400, Thailand
*
Author to whom correspondence should be addressed.
Mathematics 2022, 10(8), 1338; https://0-doi-org.brum.beds.ac.uk/10.3390/math10081338
Submission received: 21 February 2022
/
Revised: 8 April 2022
/
Accepted: 15 April 2022
/
Published: 18 April 2022
(This article belongs to the Special Issue Transport Phenomena Equations: Modelling and Applications)
Abstract
:The present paper was inspired by recent developments in laboratory experiments within the framework of cancer-on-chip technology, an immune-oncology microfluidic chip aiming at studying the fundamental mechanisms of immunocompetent behavior. We focus on the laboratory setting where cancer is treated with chemotherapy drugs, and in this case, the effects of the treatment administration hypothesized by biologists are: the absence of migration and proliferation of tumor cells, which are dying; the stimulation of the production of chemical substances (annexin); the migration of leukocytes in the direction of higher concentrations of chemicals. Here, following the physiological hypotheses made by biologists on the phenomena occurring in these experiments, we introduce an agent-based model reproducing the dynamics of two cell populations (agents), i.e., tumor cells and leukocytes living in the microfluidic chip environment. Our model aims at proof of concept, demonstrating that the observations of the biological phenomena can be obtained by the model on the basis of the explicit assumptions made. In this framework, close adherence of the computational model to the biological results, as shown in the section devoted to the first calibration of the model with respect to available observations, is successfully accomplished.
Keywords:
differential equations; cellular automata; mathematical biology; cell migration; microfluidic chip; biased random walksMSC:
65M06; 68Q80; 92B05; 92C17; 82C22; 60K371. Introduction
Computational models are applied in biology for understanding, explaining and predicting experimental data obtained in laboratory experiments and then translating them into possible control approaches to system behavior.
The computational model proposed in the present work is inspired by recent developments in cancer-on-chip (COC) technology [1,2,3,4,5], the availability of data from laboratory experiments using this preparation in order to test and understand the complex mechanisms behind cell dynamics and the interaction between immune and tumor cells. Inferential methods to treat COC data can be found in [6].
The migration of individuals has been a widely studied topic in mathematical modeling and has been described at different scales: microscopic, with the movement of single cells formulated with agent-based or ODE modeling but also at a macroscopic scale, through PDE modeling describing cell density or chemical gradient variations, see for instance classical models [7,8]. The evolution over time of chemical gradients in the environment can also be formulated with ODEs or PDEs, or by cellular automata incorporating local reaction–diffusion dynamics. A variety of mathematical models for biological phenomena, including dynamics of cells and amoeboid organisms and the evolution of chemical stimuli in the tumor microenvironment, can be found in the literature [9,10,11,12,13,14,15,16,17,18]. A kind of modeling known as “hybrid” multiscale consists in combining the macroscopic approach expressed by PDEs with the microscopic approach expressed by ODEs [19,20,21,22,23,24]. Comprehensive literature reviews on hybrid models exist [25].
In recent publications by one of the authors, macroscopic modeling of COC experiment, ad hoc transmission conditions for chip geometry and related estimation techniques for model parameters were proposed, describing long-range dynamics of immune cells driven by the chemical substances secreted by cancer cells in the chip environment [26,27]. A discrete-in-continuous hybrid approach was also formulated as a PDE reaction–diffusion partial model for the evolution of the chemicals, coupled with an ODE particle model for cell motion, with simulations reproducing the dynamics in only on a small portion of the right chamber and not on the whole area observed in video footage [28].
Based on biological hypotheses, we propose here a proof-of-concept hybrid agent-based model describing immune cell (leukocyte) dynamics as driven by the (gradient of the) chemical signal produced by tumor cells (TCs). The production, diffusion and consumption of the chemicals released by TCs in the environment is described by a discretization of a reaction–diffusion partial differential equation, along the lines of the Keller–Segel model [8]. The exploration of the environment by leukocytes and their migration is described by a discrete, nonisotropic Brownian motion equation, reflecting randomness in their movement as well as their sensing the chemical signal gradient in the chip.
1.1. Original Contribution of the Present Paper and Sketch of the Methodology
From the mathematical and computational viewpoint, we deal with a challenging issue arising in chemotaxis modeling of cell interaction.
Considering the modeling here proposed in comparison with previous works on the same topic, the original contribution of the present paper is the development of a rather general, easy to implement mathematical model, able to reproduce the main features of the observed COC experiments such as cell migration driven by a chemical stimulus, as well as possibly short- and long-range interactions between immune cells. Differently from the approaches mentioned above, our framework, based on cellular automata approach, does not require the development of dedicated numerical schemes for the approximation of the transmission conditions at the microchannels connecting the left and right chambers.
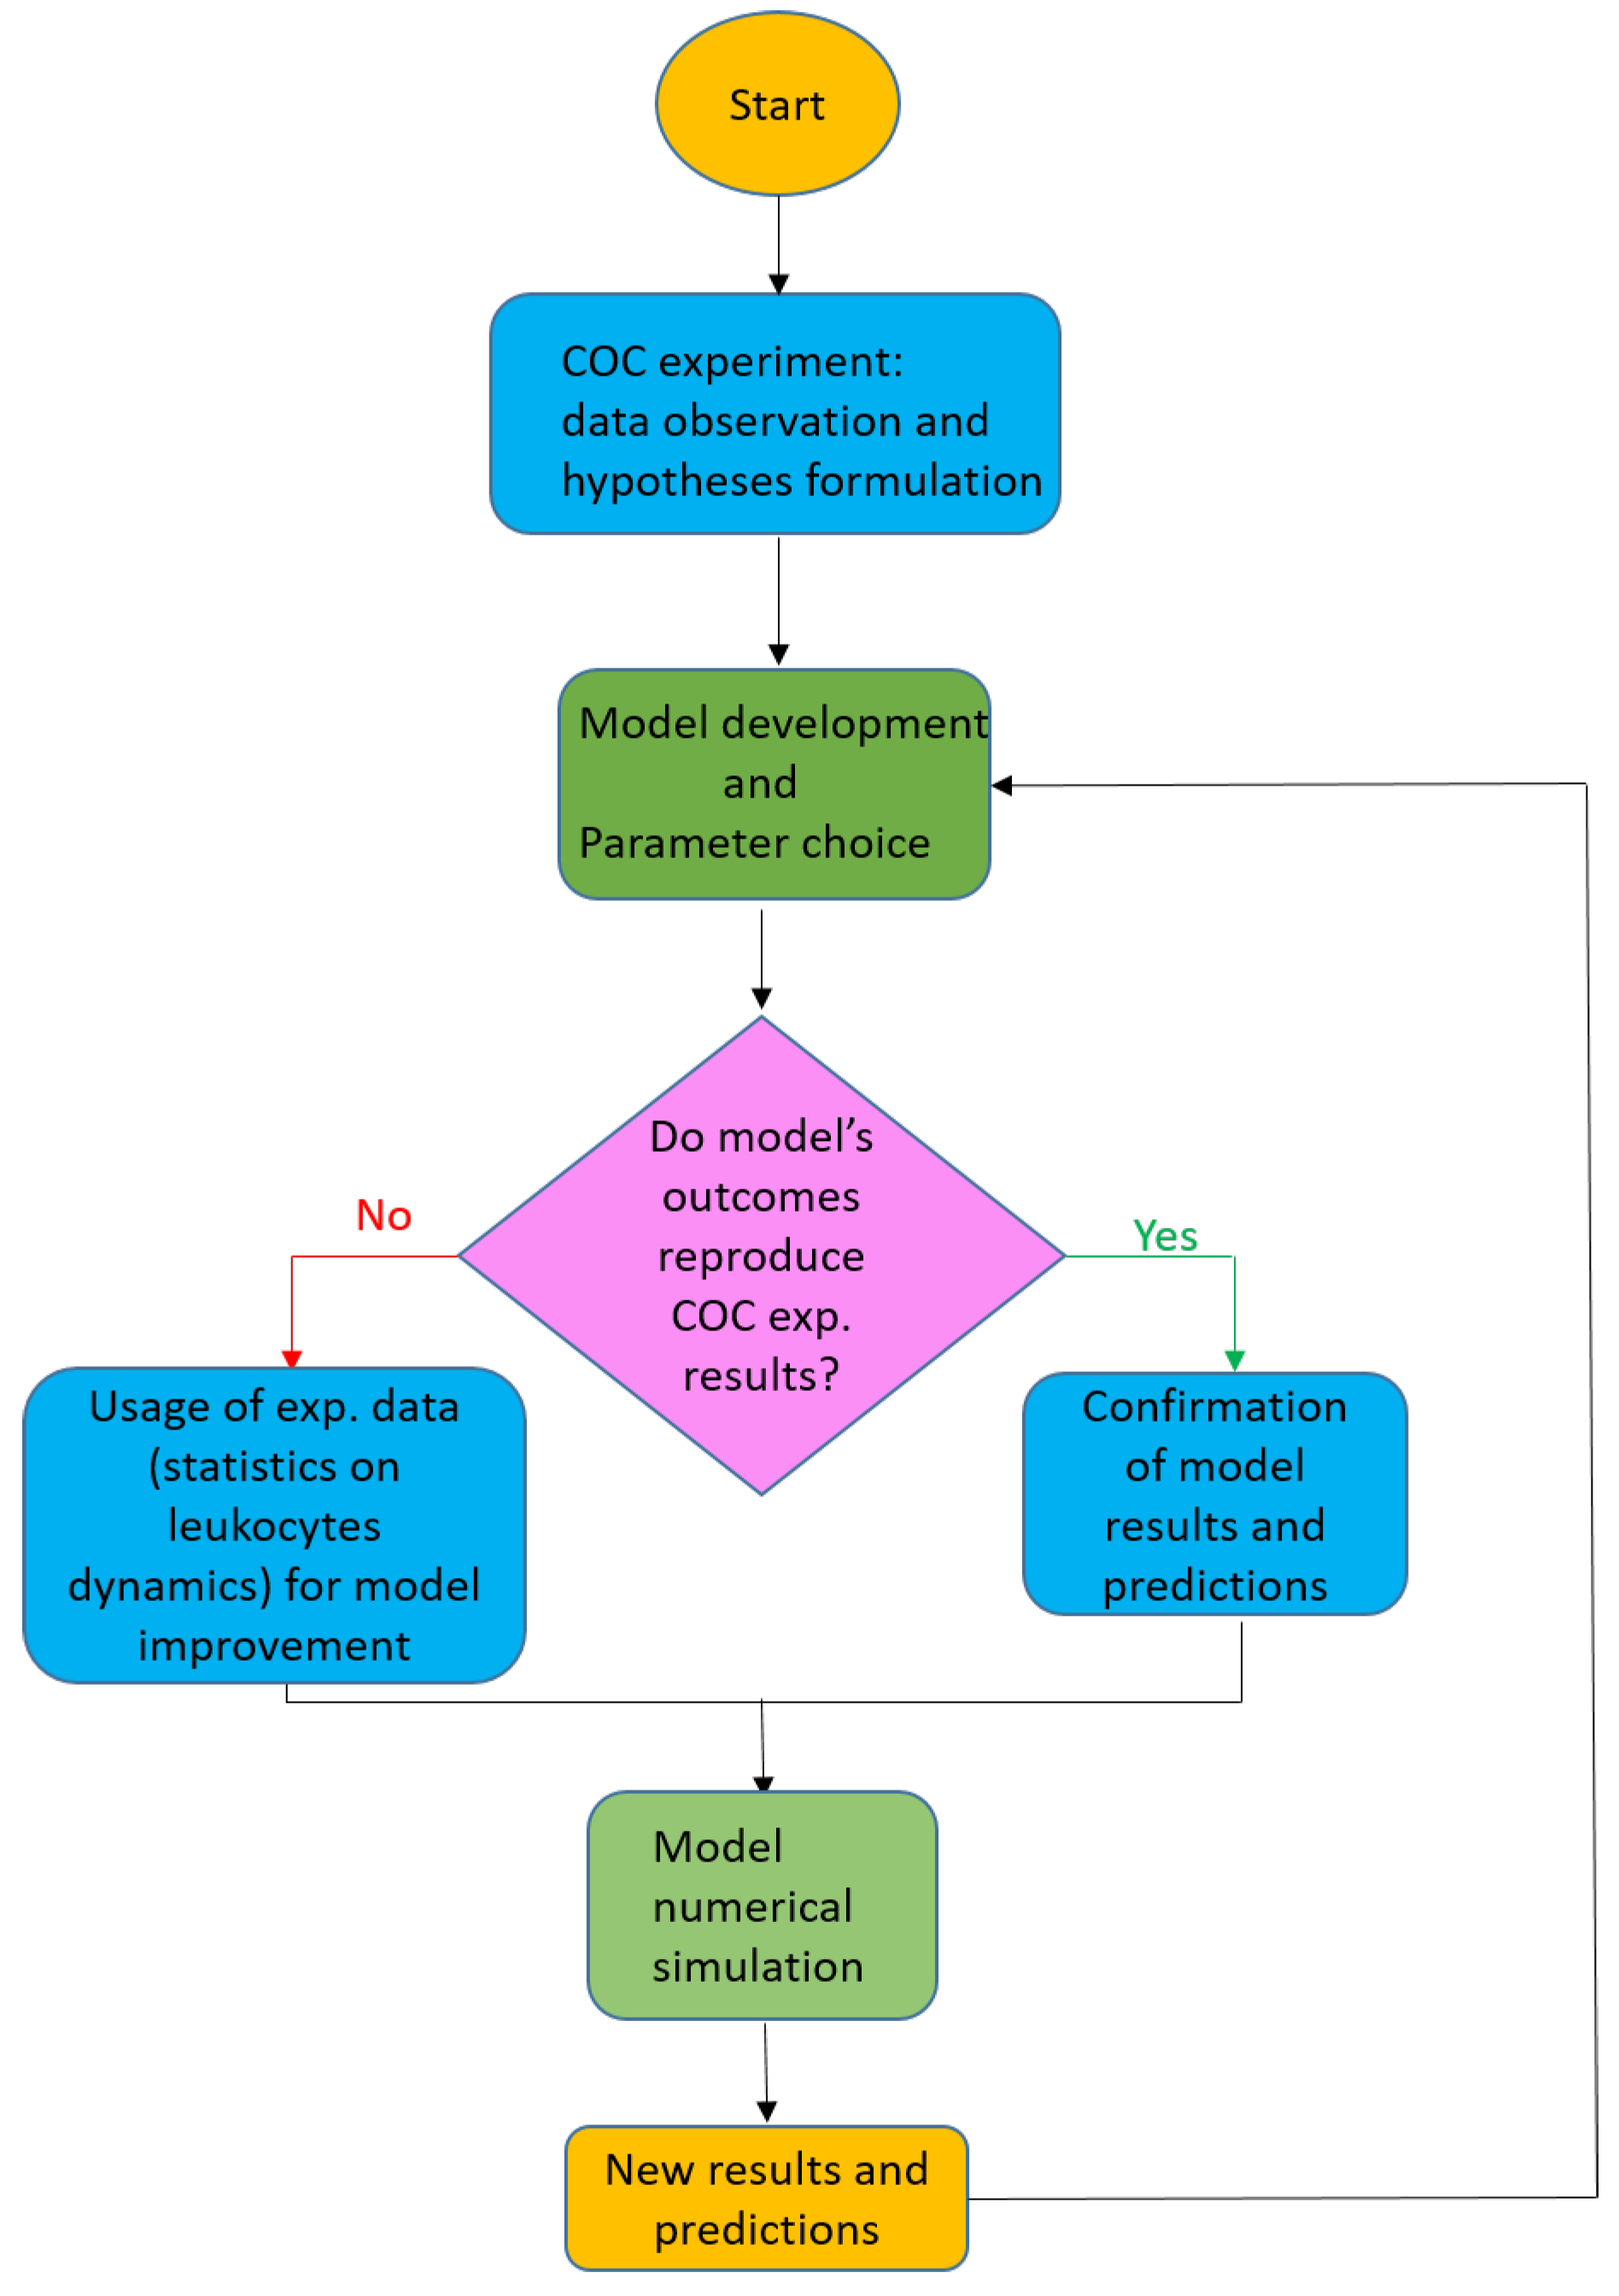
Another advantage of this agent-based approach, besides its ability to reproduce complex system-level emergent behavior with simple rules, is the flexibility and autonomy of each modeled agent, which allow an easy extension of the model to take into account heterogeneity of the environment, chemical substances and cell species. We perform a first validation of the model by visually calibrating the model parameters against aggregated real data (using time of transition from right- to left-compartment and fraction of leukocytes in the chip’s compartments as indicators). A schematization of the proposed approach is reported in the next Figure 1, where we provide an overview on the proposed framework with a flowchart showing the general structure of our approach.
1.2. Plan of the Paper
The plan of the paper is as follows. In Section 2 we describe the biological framework that inspires our study. In Section 3, the mathematical formulation of the COC agent-based model is illustrated, while in Section 4, the numerical simulations obtained with the algorithm are reported and the results of the calibration of the model parameters are displayed. Section 5 is devoted to a discussion of the results obtained and, finally, Section 6 concludes our work.
2. Biological Framework
Biological in vitro experiments are performed to mimic in vivo phenomena with reduced complexity. This simplification gives experimentalists the possibility of analyzing such phenomena when isolated from the organism in order to gain a deeper understanding of the underlying mechanisms. Recent studies on biofilm formation, bacteria, cell filamentation and multicellular pattern formation can be found in [29,30,31,32,33]. It can be challenging to extrapolate in vitro results to in vivo because the overall effects of an experiment on a living subject may be affected by factors which are not present in vitro.
Motivated by the need to gain a better understanding of the immune system’s response in the context of toxicity testing, organs-on-chip technology was recently developed and engineered [1,34,35] to recreate, as realistically as possible, the mechanical and physiochemical environment surrounding living and active cells. This technology increases the complexity of in vitro systems, better allowing the experimenter to approximate in vivo tissue response, largely avoiding the typical disadvantages of conventional cell cultures and allowing the maintenance of the normal physiological functions of cells and tissues over long periods of time.
Among different types of cancer investigations, immuno-oncology represents a hot topic in current research, as can be seen from relevant works on cancer-immune models developed in this context [34,35,36]. This modeling enables the use of a synthetic biology approach in which important molecular, biophysical, cellular and tissue components can be varied individually or in combination in a controlled manner to understand the determinants of disease progression. In this framework, many research groups have recently analyzed how microenvironmental factors influence tumor cell responses to anticancer therapies. In particular, COC experiments are used to study the interaction between cancer and immune cells within the context of immune competence and genetic mutations. This sheds light on the response of cancer to therapies when the immune system is healthy.
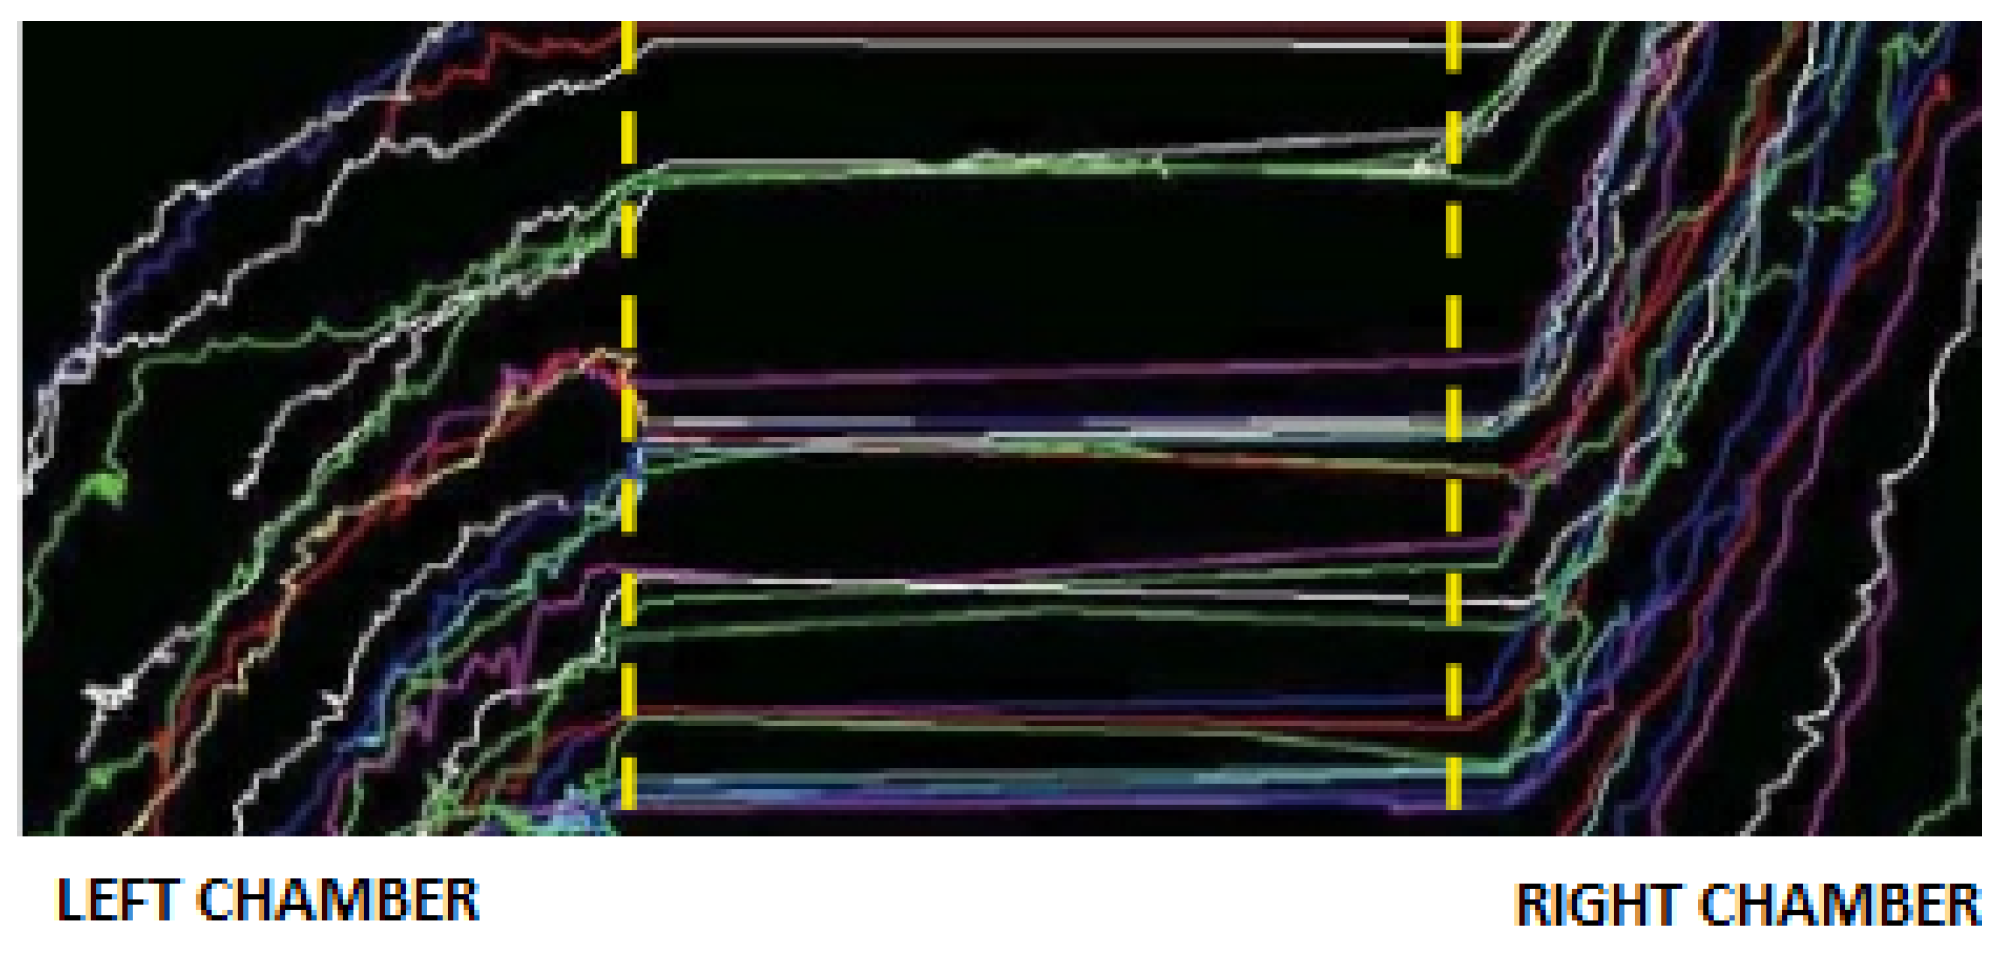
In order to show immune cells’ migration, an image of the diagonal paths from the left to the right chamber covered by leukocytes following the chemical signal secreted by tumor cells is depicted in Figure 2. It is worth noting that in Figure 2, a subarea of the domain reported in Figure 3 is shown. For this reason, some cell trajectories appear in the diagonal-lower part of the picture.
Setting of the Real Experiment
The COC experiment consists of three main culture chambers for plating adherent TCs and floating leukocytes, connected by a bridge of microchannels allowing chemical and physical contacts. The immune population is composed of different cell species, such as T and B lymphocytes, dendritic cells and monocytes.
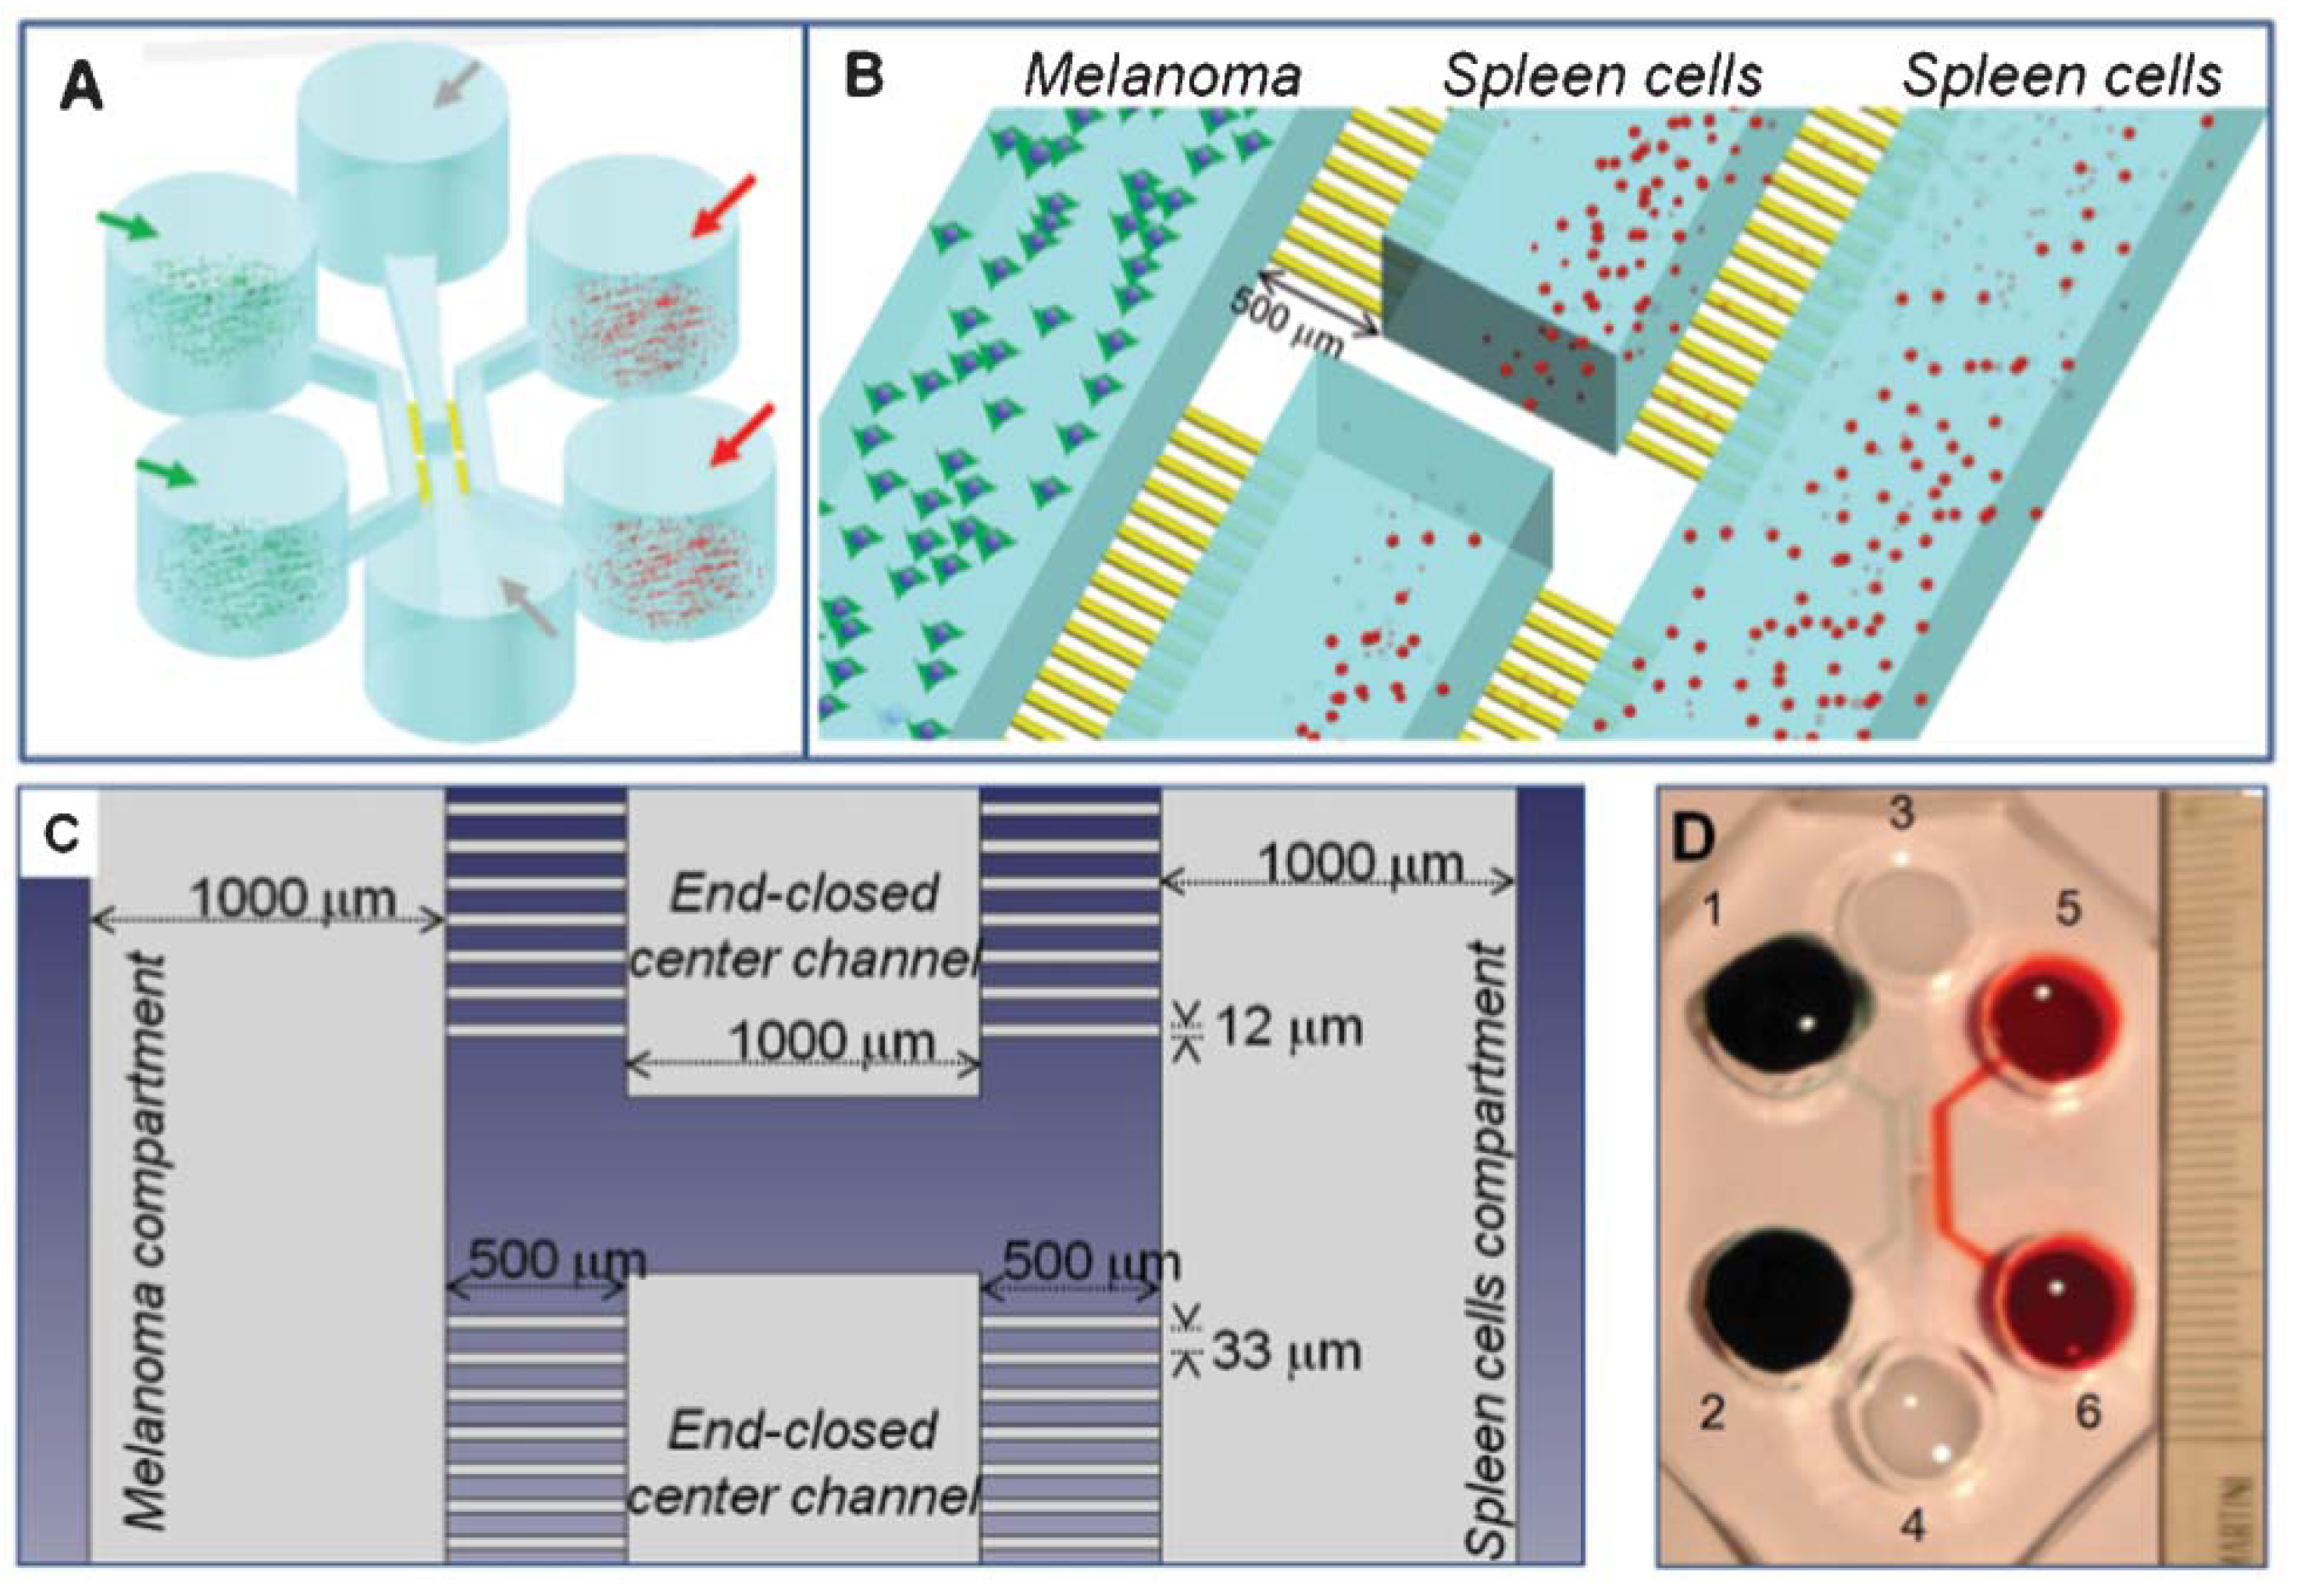
In Figure 4, a picture of the two boxes or compartments is shown. Since in the video footage the experiment is recorded at a fixed height, the third spatial dimension in our framework is neglected.
Here, we refer to the experiment of two main culture chambers (a tumor compartment and an immune cell compartment), see [2], connected via 31 narrow capillary migration microchannels having a width and length of = 12 μm and = 500 m, respectively. The whole dimension of the chip visualized in the video footage of the experiment, including culture chambers and microchannels, is (vertical height) × (horizontal width). We have, therefore, two microfluidic chambers of the same size, one on the left and the other on the right of the microchannels. The complete domain is denoted as , including all of the architecture excepting the obstacles of a width of about separating the microfluidic channels. Note that leukocytes measure approximately 10 in diameter [37], while TCs measure about 20 in diameter [38]. The microchannels have a width of 12 .
In the experimental set-up, the time-lapse observation area includes the complete domain , with leukocytes progressively being loaded into the right-hand compartment. Our goal consists in modeling the long-range migration of leukocytes towards the TCs, taking into account the different factors influencing these cells.
At the beginning of the experiment, the left chamber is populated with only about 60 cancer cells, pretreated with doxorubicin hydrochloride and immersed in a suitable culture medium. Initially, no leukocytes are present in the left compartment. Passive migration of leukocytes from the reservoirs to the right compartment occurs progressively during the first 24 h.
Due to the treatment of TCs with the chemotherapy drug, no migration nor proliferation of cancer cells occurs during the experiment. The chemotherapy administered to tumor cells at the beginning of the experiment not only depresses their replication and movement but also stimulates them, producing a host of chemoattractants, of which annexin is the main representative.
Since tumor cells are progressively dying, the chemical signal is not produced at the same rate throughout the experiment, but no quantitative information about the chemical gradients, which are established in the environment, is experimentally available. This feature is not considered in the present version of the model.
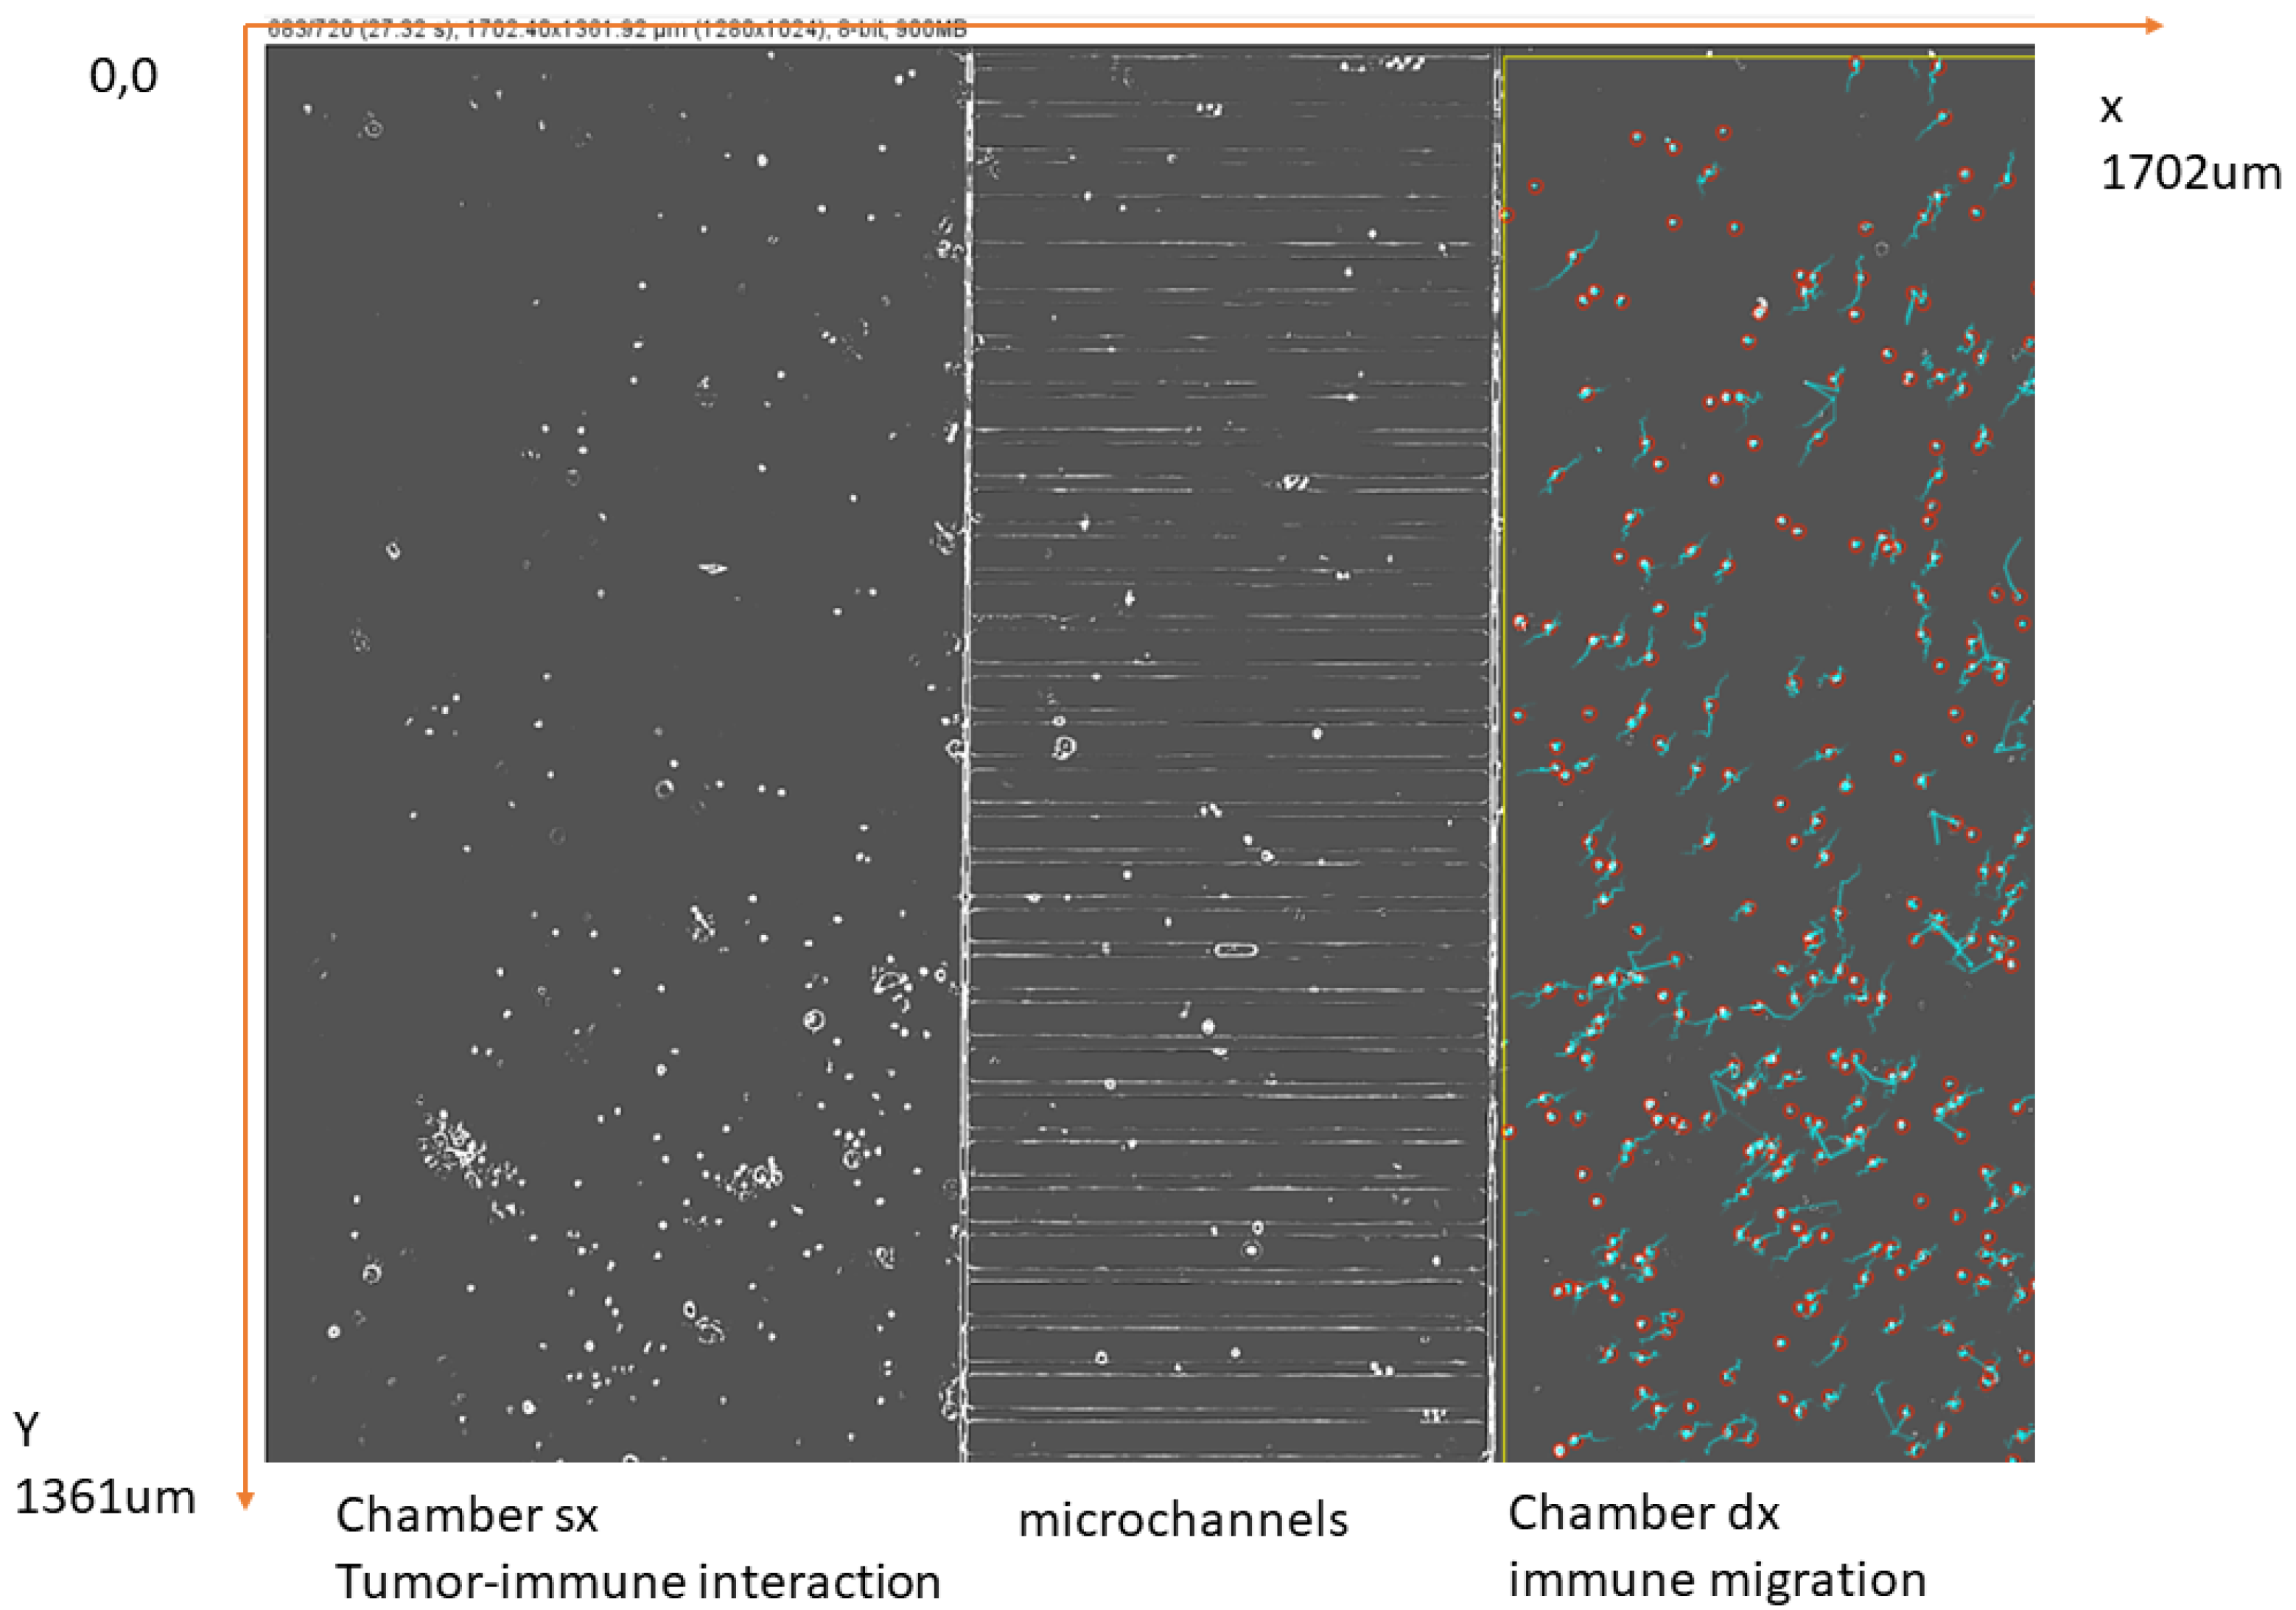
In the first 24 h, leukocytes only appear to explore the right-chamber environment; after that time they appear to progressively migrate through the microchannels, reaching the tumor cells located in the left chamber, presumably in response to the chemoattractant gradient that is being progressively established throughout the domain. In Figure 3, an image of the chip environment for the observation of interactions between immune and cancer cells is depicted, where migration of leukocytes from the right to the left compartment occurs.
3. The Hybrid Agent-Based Cellular Automata Model
The mathematical modeling of biological processes and mechanisms, i.e., the development of “in silico” models, allows computer simulations to be performed in order to obtain insight into the mechanisms and features behind the experimentally observed phenomena. At the same time, computer simulations may give rise to hypotheses, which can in turn be tested in vitro for the validation and improvement of the mathematical interpretation of what is happening.
Inspired by the biological framework described in Section 2, we developed an agent-based model which mimics the behavior of living cells, i.e., leukocytes and TCs, in the microfluidic chip environment, see Figure 3. Since in this laboratory experiment tumor cells are treated with chemotherapy, which stimulates the production of chemoattractants, we replicate this phenomenon in our model, with the main goal of verifying whether the establishment of a gradient of chemoattractant, and the hypothesized sensitivity of the leukocytes to it, are consistent with their observed migration, at least conceptually. The model parameters describing production, consumption and diffusion of the chemoattractant secreted by TCs need to be calibrated in order to replicate quantitatively the observed migration.
We describe here the general formulation of our model that is detailed in the following. First, let us introduce the computational domain composed of the two chambers and the microchannels , with the exclusion of the space occupied by obstacles, and the time-dependent position of each leukocyte l defined as and characterized by the coordinates of its center, i.e., , with , . The equation for the motion of each leukocyte could generically be written as:
with the number of leukocytes at time . The function f depends on , the time- and space-varying concentration of the main extracellular diffusing molecule annexin, which is influenced by the number, positions and production rates of tumor cells T, as well as on a vector of parameters that is specified in the Section 3, independent of t and of the positions .
Note that in the formulation here proposed we are not considering the possible state S of the agents (e.g., activated vs. not activated), nor are we considering their death. However, additional features such as these can be easily added to the model. We also remark that, for the sake of simplicity, only a single type of extracellular diffusing molecule is considered, whereas multiple diffusing molecules could also be similarly represented. Always in keeping with the simplification approach adopted, the current particle model only describes leukocytes, since neither tumor proliferation nor migration or death occur as a consequence of chemotherapy.
The time evolution of annexin in the whole domain during the experiment is modeled by a discrete formulation of a reaction–diffusion equation, similar to a classical chemotaxis model [8]:
for , with the final observation time of 48 h. We denote by D the isotropic diffusion coefficient, and and are the rate coefficients, respectively, for elimination (linear in annexin concentration) and production (fixed over time but only associated to locations where tumor cells are alive).
The first step of our modeling effort therefore consists in obtaining a field of concentration of chemicals, here represented by annexin, a ligand that binds to the FPR1 (Formyl Peptide Receptor 1) receptor expressed by leukocytes, in particular by dendritic cells.
Looking at the experimental trajectories of leukocytes, we observe that the migration does not appear to occur in the first 24 h. A time delay of 24 h seems to be necessary for the production of a sufficient quantity of chemicals and their diffusion through the microchannels to finally reach the leukocytes accruing to the right chamber and stimulate their movement.
3.1. The Mathematical Model
The representation here developed is a hybrid cell automaton (for the production and diffusion of annexin) and agent-based (for the movement of leukocytes) computational model. While the domain is represented as a 2D lattice in the plane, the methodology here presented can be easily extended to a three-dimensional model.
From the biological point of view, cell migration involves complex mechanisms: intracellular signaling, adhesion and repulsion forces and cytoskeleton remodeling. Moreover, the searching behavior of leukocytes is based on their basal movement pattern, an amoeboid-like crawling [39] with intermittent walk and zigzag turning preferences [18].
Here, we model leukocytes migration as a biased random walk to express the two driving forces responsible for leukocytes dynamics: the natural stochastic movement of cells (the random exploration of the environment) and the anisotropic, directed migration in response to the chemical signal, known as chemotaxis. Two-dimensional Brownian motion, characterized by steps of random direction and length, is inherently appropriate to express the zigzag pathways of leukocytes. The possible random absence of detectable movement is also represented in the model. This modeling approach therefore captures the idea of generalized Lévy walks, which contemplate run and pause phases, already proved to be successful in reproducing cell dynamics [40,41]. As a first approach to the problem, the stochastic model used here seems to be effective in reproducing the migration rate of leukocytes from the right to the left compartment, as confirmed by the comparison with the statistics on real data reported in the Section 4.
Notice that we do not take into account frictional forces exerted by the fluid on cell motion, nor do we consider inertia or acceleration of the leukocytes. For the current analysis, the time between observations is sufficiently long and the speed of the cells and their mass are sufficiently small to make the active movement of leukocytes in response to the chemical gradient preponderant in the model representation. In fact, spontaneous, random motion of the leukocytes is biased by the local concentration of the chemoattractant (denoted by A below) produced by TCs. The chemical then diffuses and degrades in the environment and is modeled on a continuum scale as a parabolic reaction–diffusion equation:
where D is the isotropic diffusion coefficient, is the extracellular degradation rate (assumed apparently linear), is the density of production rate at a point where tumor cells are present, is the number of tumor cells and is the (two-dimensional) ball representing the kth tumor cell of center and radius (the same for all tumor cells in the present version of the model); the indicator function has value 1 if the point belongs to the ball , otherwise it is 0. Notice that the annexin production at each point would be proportional to the number of tumor cells superposed at that point: while in the present implementation of the model we seed the left chamber with nonsuperposing tumor cells (hence each point in space here belongs to at most one tumor cell); the term in Equation (3) would be correct in the case of multiple tumor cells superimposed at some point.
In order to avoid misunderstandings, we henceforth use the term “pixel” to indicate the grid cells of the cellular automaton (whose size is determined by the spatial discretization step of the considered domain), reserving the term “cell” to leukocytes and TCs. Let us therefore denote by the pixel identified by grid coordinates (row and column coordinates). Let be the set of Moore neighbors of the pixel where the lth leukocyte center is located, and where is the radius of leukocytes (assumed all of the same size in the present version of the model). Furthermore, let the cardinality of be . In the present model version, movement of the leukocytes is observed at discrete time steps and track is kept not of the exact position but only of the pixel it occupies in the grid ().
Our model for leukocyte movement is thus discretized in time (observing the position of the cell at successive separate instants) and in space. We may describe the next position of the lth leukocyte as depending on the previous one, on annexin concentrations and on model parameters:
where is the pixel occupied by the center of the leukocyte, is the annexin concentration in a Moore neighborhood of the considered leukocyte at time t, in an amplification parameter expressing the tendency of leukocytes to migrate towards higher annexin concentrations, is a threshold parameter regulating leukocytes migration (the lower the value of , the higher the neighboring annexin concentrations needed for the leukocyte to move) and is the total number of leukocytes at time t.
The function f is a random function that depends on the probability that the leukocyte moves at all and, if so, would take into account the direction where the leukocyte is more likely to move, depending on the neighboring annexin concentrations.
Indicating with p the (central) pixel where the leukocyte resides at time t and with , a generic neighboring pixel in the -sized Moore neighborhood of p, we define the (uncorrected) total concentration of annexin in the area (including the central pixel) as:
and with
the -corrected total concentration of annexin in the area (including the central pixel), depending on .
First of all, if sufficient annexin concentrations in the neighborhood of the leukocyte are not attained, no (net) movement is appreciable, therefore, the probability of moving at all is computed as
In case the leukocyte moves, we define the probability of its movement to the neighboring pixel at time t as:
We can then compute the probability of remaining in place as
Finally, in the spirit of biased random walks, the time-dependent equation governing the lth leukocytes motion between time t and time can be formulated as:
Notice that in the present case, the coupling between annexin kinetics and leukocytes dynamics is only in one direction, since the evolution of Equation (3) is independent on the position of the leukocytes. On the contrary, the governing equation of leukocyte motion (5) depends on the quantity and distribution of the chemical product computed in (3).
3.2. Numerical Algorithm
The simulation environment used is Matlab© R2020a. We consider movement of the cells only on the microchip plane, hence we apply a discretization of the 2D computational domain given by the two chambers and the intervening channels. The whole chip is thus represented by a matrix M of square computational cells assuming the space mesh size to be over a rectangle of size ( and ), when simulating the entire chip (with the full complement of horizontal microchannels), we deal with a pixel matrix of size , with rows and columns.
The radius of each tumor cell is assumed to be , while the radius of leukocytes is fixed as . We used a time discretization step , with , so that we compute concentrations and positions at the discrete times and .
The computational time required for a simulation of this chip architecture is approximately of 1 day per microchannel on an Intel(R) Core(TM) i7-3630 QM CPU 2.4 GHz. Parallelization of the code is possible and will be considered in our future work.
The simulation algorithm based on the mathematical model is composed of three main parts:
- Definition of chip geometry and random positioning of TCs and leukocytes in the computational domain at initial time, avoiding superpositions;
- Evolution in time and space of the chemoattractant (elimination/production/diffusion);
- Migration of the leukocytes, characterized by biased random walk.
3.2.1. Part 1: Creation of the Chip Environment
The TCs are static and are placed in the lower part of the left chamber, each of them being identified by the coordinates of its center and , occupying all those pixels whose center falls within the ball . Each leukocyte is identified by initial coordinates and (notice that the number and the positions of leukocytes vary with time) and occupies the pixels whose centers fall into the ball .
In the present version of the algorithm, we hypothesize that each agent (cancer cell or leukocyte) has a center coinciding with the center of a pixel. Therefore, there is a correspondence between the matrix grid coordinates (row r, column c) and the physical coordinates (x and y in m) given by:
In order to take into account the presence of other cells and obstacles conditioning the placement or movement of TCs or leukocytes, we introduce an occupancy labeling function for each point in the computational domain in such a way that:
- if ;
- if ;
- if the point falls on an obstacle separating two consecutive channels;
- otherwise, i.e., if the point is free from obstacles and is not occupied by either cancer cells or Leukocytes.
We remark that, since we introduce a random inflow of leukocytes in the right chamber across time, such occupancy function needs to be updated at each time step of the simulation.
3.2.2. Part 2: Production/Diffusion/Elimination of Annexin
In the scheme below, we describe the second part of the algorithm, concerned with the production, diffusion and elimination (decay) of annexin over the chip. Tumor cells start secreting the chemical signals, of which annexin is taken as representative, since the initial time . Secreted annexin then diffuses throughout the environment and progressively decays over time.
Denote by the jth grid cell or pixel, centered at , and . Denote as the matrix of annexin concentrations at time and , where is the zero matrix. We index the matrix as for compactness. Let denote whether the jth pixel is occupied by a tumor cell or not, i.e.,
For each time step we proceed as follows:
- Linear elimination: for each pixel , ;
- Linear production: for each pixel , ;
- Diffusion among the Moore neighbors of the pixel .
Note that, since we build a two-dimensional square lattice here, we consider as the neighborhood structure of a pixel p the Moore neighborhood , composed of the (up to) eight cells surrounding it, excluding the central cell.
In more detail, the diffusion is implemented as follows. We denote the nth neighboring pixel of the pixel as and . Notice that the central pixel does not belong to its neighborhood as defined. Notice also that the number of pixels in the neighborhood depends on the position of the central pixel (in the interior of the map, on the border and in a corner). It is actually computationally useful to define a function , returning the index of a given neighborhood pixel: , with . We compute the euclidean distance between the coordinate center of the jth pixel and the center coordinates of its neighbors :
In order to compute the amount of annexin diffusing between pixels, we use a temporary storage matrix C initialized at zero at the beginning of each time step. We thus compute and
and
Once finished looping over all pixels in the domain, we can update the annexin matrix
We underscore that the diffusion of annexin in the environment is not allowed in the regions where the obstacles between the channels are placed. This is easily performed by simply excluding these pixels from the relevant neighborhoods.
3.2.3. Part 3: Leukocyte Migration
The chemical field is created from the initial time as annexin spreads out from the tumor cells. As soon as leukocytes sense sufficient amounts of annexin in the neighborhood, their erratic movement becomes anisotropic and they begin migrating, on the average, towards higher annexin concentrations (biased random walk on a 2D lattice). Notice that new leukocytes keep appearing in the right-hand chamber, flowing in from other (depot) regions of the chip.
At each time step, each leukocyte (centered at ) may change the location of its center, switching to the center of one of the neighboring pixels ( for some n).
The algorithm for updating the position of each leukocyte l at each time step proceeds as follows:
- Find the and neighboring pixels belonging to , disregarding the pixels occupied by obstacles and the pixels outside the map;
- Compute the total peripheral quantity of annexin and , summing over the neighboring cells and excluding the central one, as well as the total quantity of annexin , including the central pixel;
- Compute a threshold probability value , with , so that for small values of annexin in and around the central pixel the probability of the leukocyte moving at all is low. Pass to the next step only if , with a uniformly distributed random variable;
- Move to neighboring pixel with probability and . This is performed by computing cumulative probabilities and , generating another uniformly random variable and picking as next pixel position the pixel if , with the obvious stipulation that . Notice that even in this case (having decided that movement is possible), it may happen (with probability ) that the destination pixel is the same as the current pixel, i.e., that the leukocyte does not move at all.
4. Results
In the present section, we show the development of the annexin concentration field and the behavior of leukocytes as reproduced by the simulation algorithm.
Using the parameter values reported in Table 1 we obtain the dynamics in this microchip subdomain: the main features of the leukocytes dynamics observed in the video footage of the experiment are well reproduced.
As initial data for the simulation at time , we assume:
and . We consider a continuous inflow of leukocytes, randomly placed in the right chamber, with the probability of adding a new leukocyte in the discretization time step being proportional to the size of the domain, .
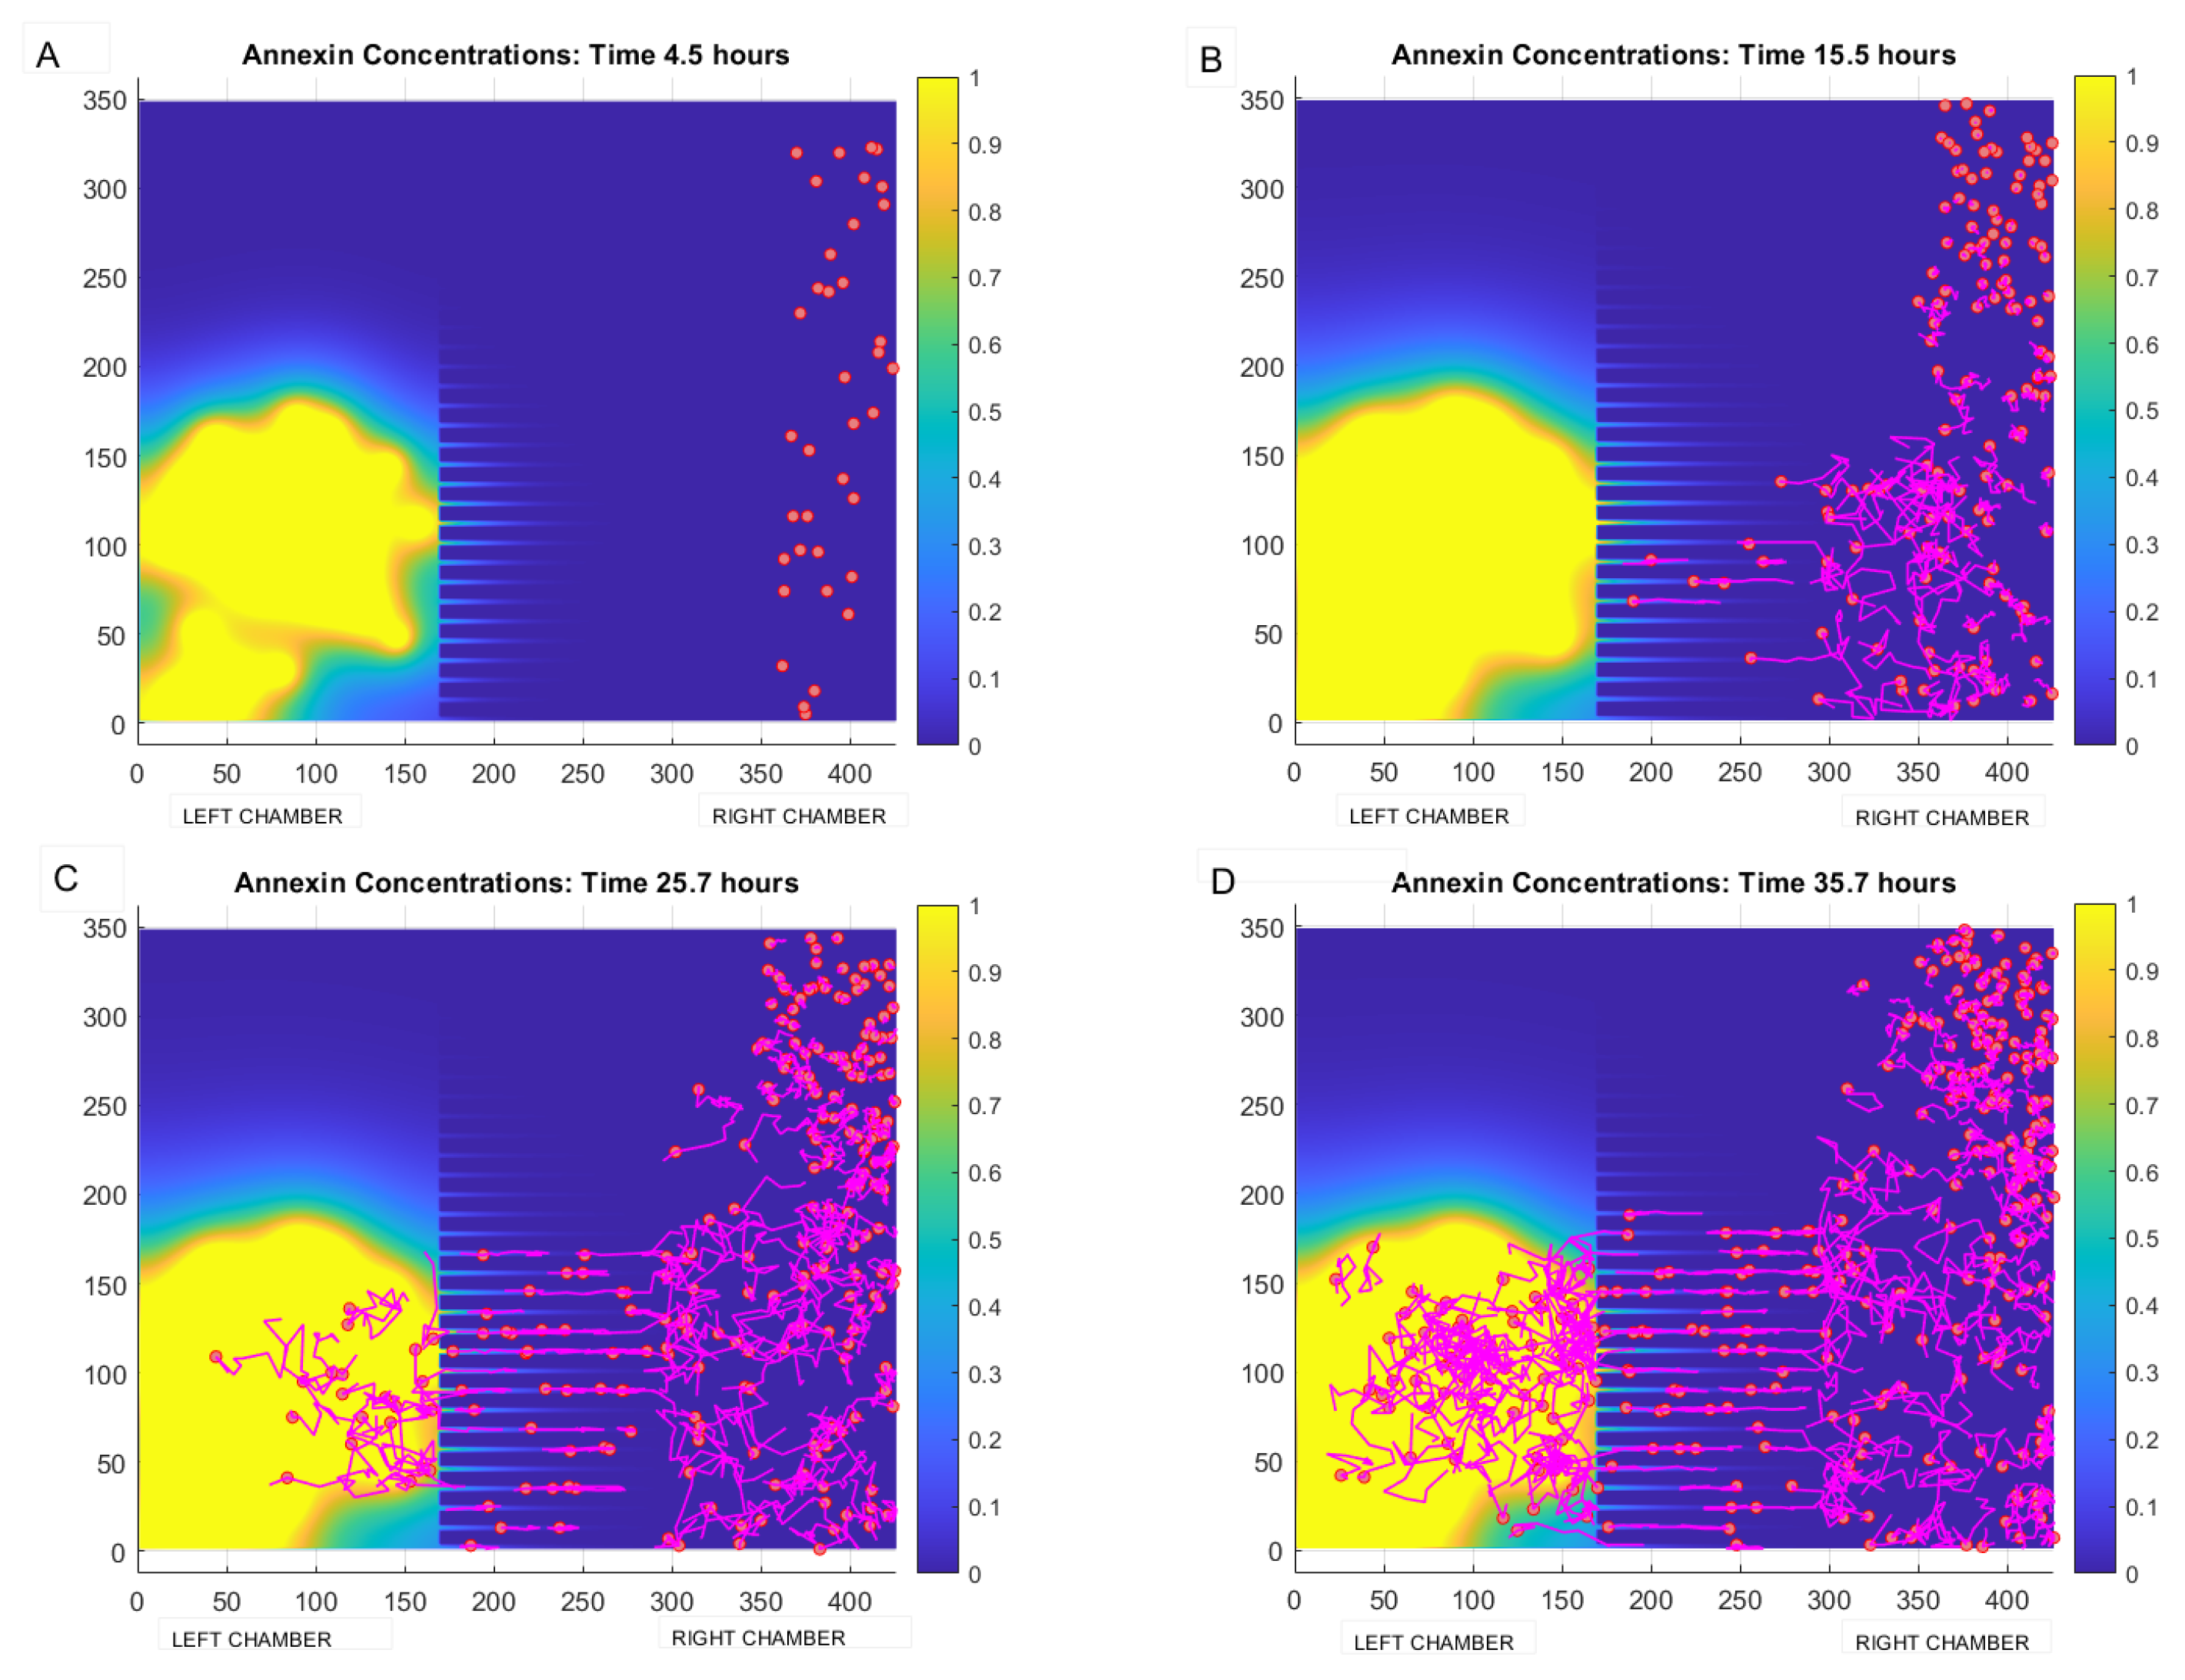
In the next Figure 5, the evolution over time of the annexin concentration field and of leukocytes positions is shown. In Panel (A), in particular, we can see the situation after 4 h, with the (nonmoving) TCs already placed in the left chamber, with a small quantity of chemoattractant secreted and diffused over the domain, no leukocytes having yet been placed in the right chamber. Successive panels show the situation at later times (B) after 15 h, (C) after 25 h and (D) at about 36 h: the chemical gradient is established, leukocytes accumulate in the right chamber and, as annexin concentrations increase, leukocytes migrate along the concentration gradient through the microchannels towards the TCs’ area from the top right towards the bottom left. Leukocytes are depicted with tails, so as to make it evident what their movement is. As it happens in the actual video recording of the experimental preparation, leukocytes accumulate in the TCs area, which was situated in the lower left region, and to do so diagonally cross the left chamber. It must be appreciated in this simulation that once leukocytes reach the very high annexin concentration region in the left chamber, immediately proximal to the microchannels, they meet an essentially constant annexin concentration and have thus no incentive to move towards TCs situated further to the left. This phenomenon occurs because in the present version of the simulation no actual damage is produced by the leukocytes to the neighboring TCs, and therefore annexin production continues unabated even in the area where leukocytes are numerous. A different simulative behavior would be produced if leukocytes damaged TCs, decreasing their annexin production; in this case, the evolving annexin gradient would induce leukocytes to further move to the left, towards as yet untouched TCs.
Qualitative Calibration of the Model
In order accomplish a first calibration of the model with respect to available observations, we compared the dynamics observed in the laboratory experiment with the dynamics obtained by the model-based simulation algorithm. In practice, we tuned the key parameters of the model ( , and D ) to reproduce, at least qualitatively, the observed migration rate of leukocytes from the right towards the left chamber. Given the heavy computational load of obtaining even one complete model simulation, and given the stochasticity of each simulated trajectory of the system, we avoided the use of standard optimization algorithms (e.g., Nelder–Mead or similar), attempting instead to guide successive calibration attempts by a physical understanding of the simulated experiment.
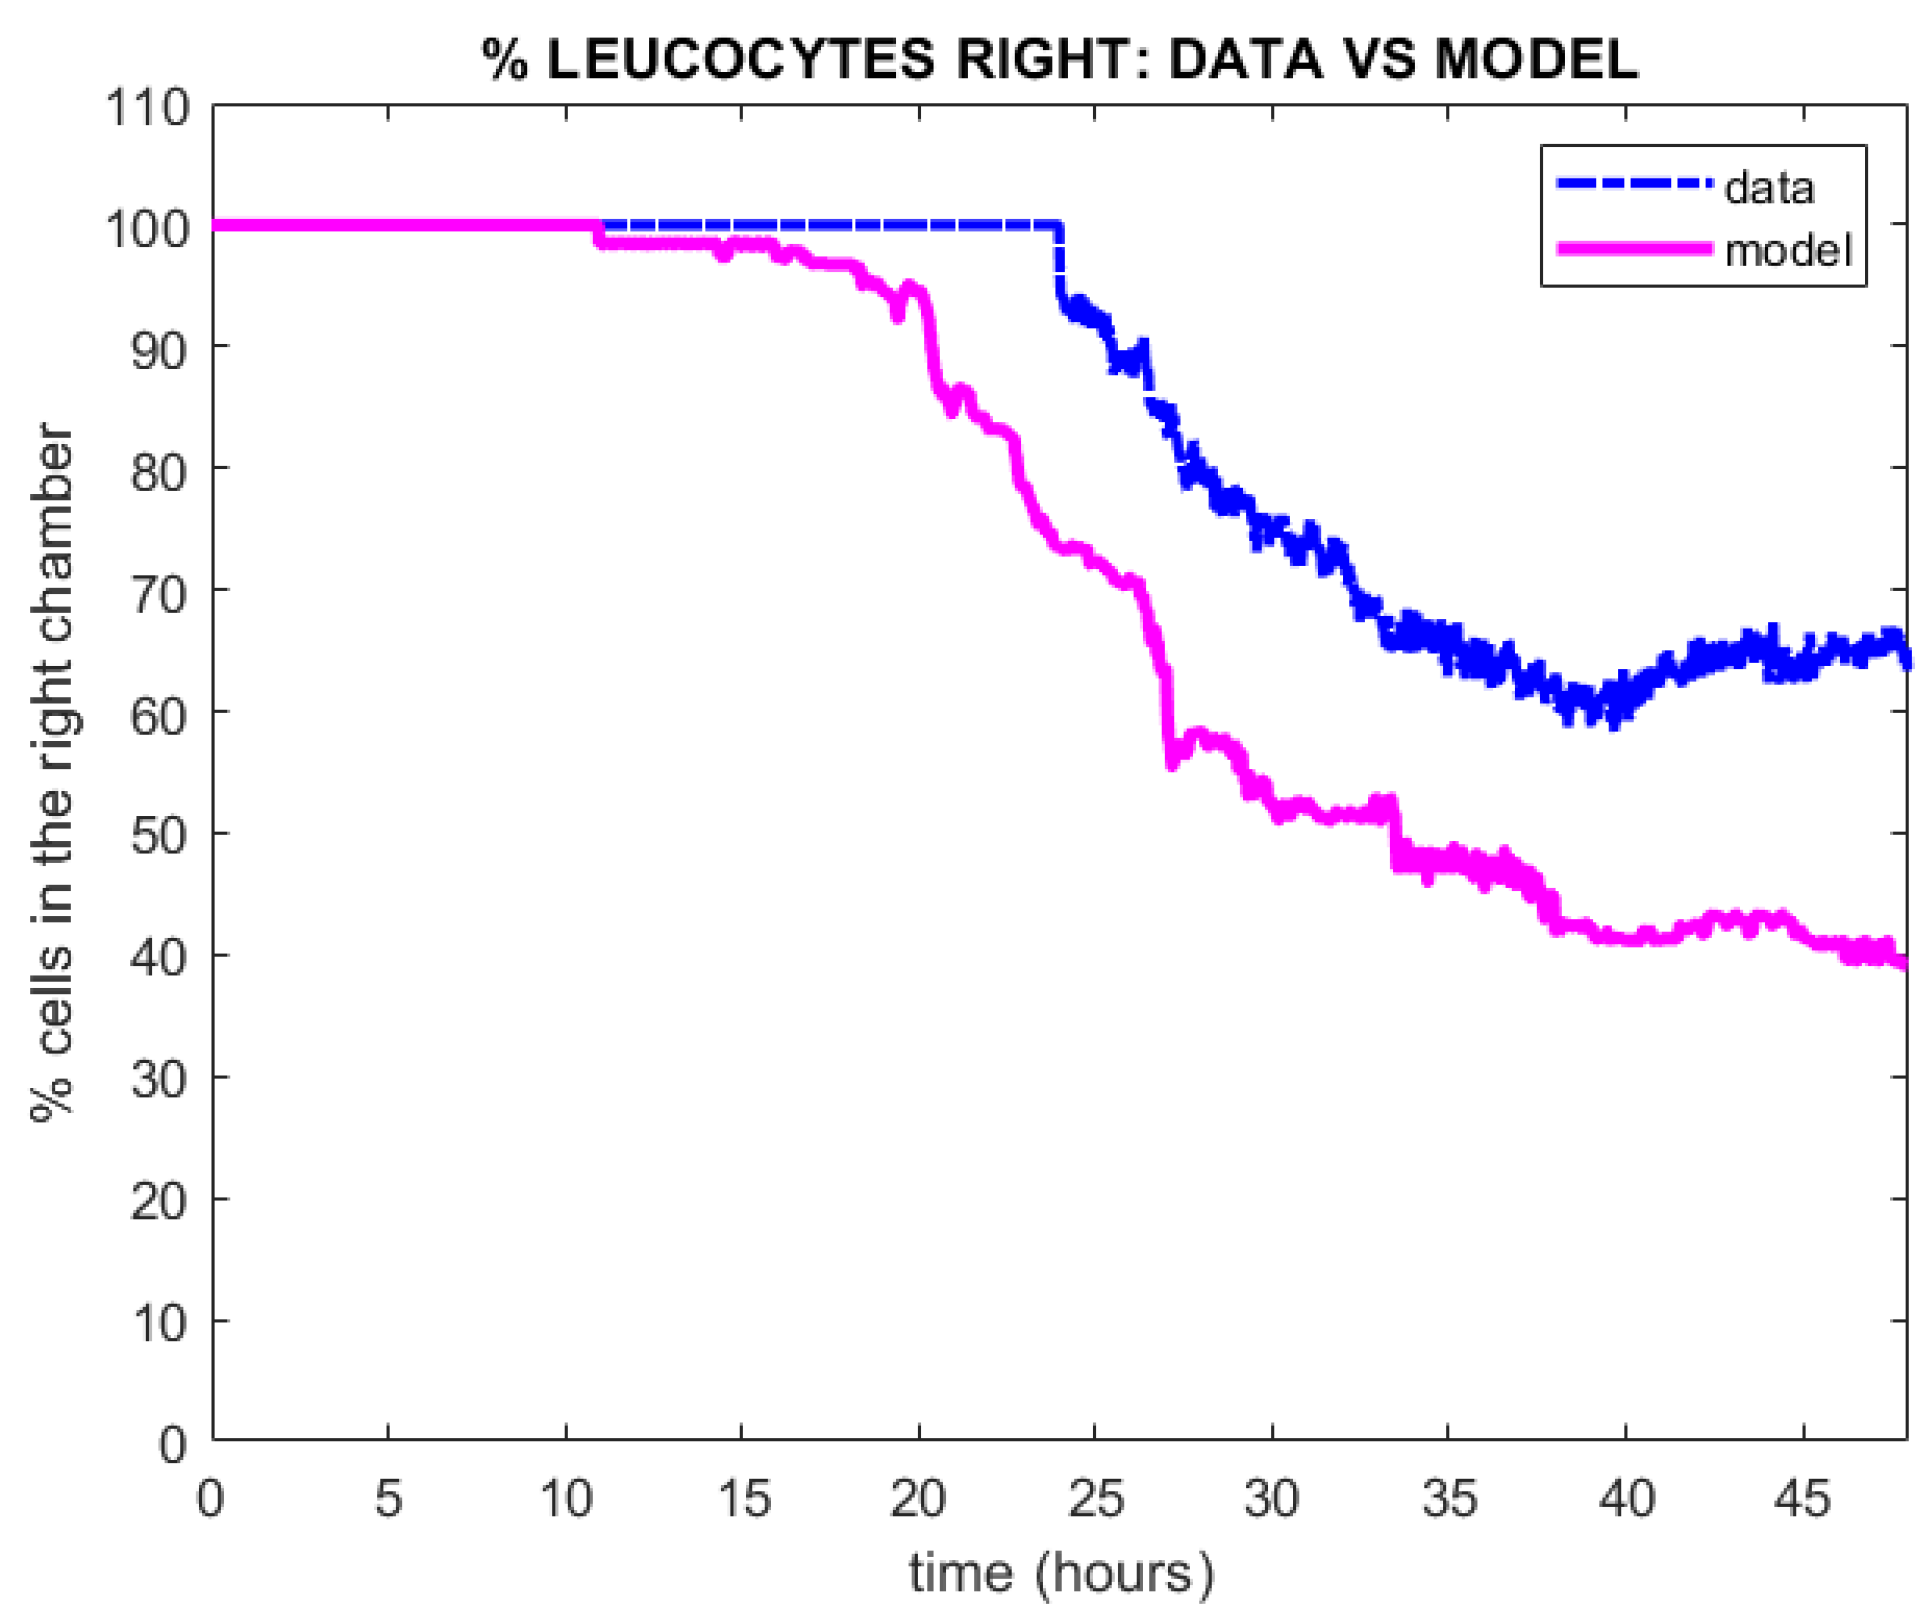
To be more precise, we considered as target solutions in the calibration procedure the percentage of leukocytes in the right chamber across the time window h, corresponding to frames (the time frame between two images is 2 min). Such percentage was determined counting the occupancy of the chambers by leukocytes as observed in the images extracted from the video footage of the experiment. Then, suitably tuning model parameters, the percentage of leukocytes in the right chamber reproducing qualitatively laboratory observations was obtained by the simulation algorithm. Notice that the migration of leukocytes from the right to the left compartment takes place essentially in the time window h. During the first 24 h, accrual of the leukocytes in the right chamber is observed without any significant movement to the left chamber. This happens in all likelihoods because sufficient chemoattractant concentrations have not yet been established in the right chamber. Over the second day, when the number of leukocytes is observed to be around 200, the migration takes place, as observed from cell trajectories extracted from the video footage of the experiment [2]. The percentage of leukocytes occupying the right chamber of the microchip computed using the model (in magenta line) vs experimental data (in blue dotted line) is depicted in Figure 6. It is worth noting that the percentage of leukocytes in the right chamber does not drop to zero but stabilizes to around because of the continuing arrival of leukocytes into the right chamber. Even then, the right-chamber occupation percentage would not stabilize unless leukocyte mortality (not considered in the present version of the model) were explicitly incorporated.
5. Discussion
We underscore first of all that the present work, inspired by previous contributions [1,35], is intended as a first step towards the construction of a complete simulation tool, based on a hybrid agent-based model, for the description of the dynamics observed experimentally in the microfluidic chip environment. The ultimate use of such a tool would be to assess the effect of different experimental conditions on the parameters underlying the observed dynamics.
In order to quantitatively approximate the behavior of the experimental system with a model, it is necessary to decide on some statistics, which can be computed both on the observations and on the simulations, based on which a distance or merit or loss functional can be optimized. In the present approach, we look at the percentage of leukocytes occupying the right chamber of the microchip, which is a quantity that can be retrieved from videos recorded on the chip, see Figure 6. It should be underlined that, conversely, chemoattractant concentration is not observable. In particular, it is not observable in a position-dependent way on the microchip preparation. The chemoattractant gradient, which is the main signal for chemotaxis, is thus inferred from the actual movement of the leukocytes responding to it.
Given the chosen statistics, the adaptation of the model to the observed data (see Figure 6) is here assessed in a completely empirical fashion. While qualitatively the two time courses (observed and simulated) are matched, a better quantitative fit could be hypothesized. There are several considerations to be made in this respect. First of all, we are observing a single realization of a biological stochastic system and, due to computational cost, are showing a single realization of the corresponding in silico stochastic system. For both of them, due to this stochasticity, appreciably different trajectories are expected to be produced. Furthermore, the stochastic system that we are observing is inherently non-Markovian: the behavior of the future observations of leukocyte positions does not depend only on observed current positions but on the developing annexin concentration field. In a future development of this model, assuming for instance an effect of leukocytes on TCs, the system would not even be quantifiable as hidden Markovian but would depend essentially on the past history of the process. In other words, the stochastic system would be nonlocal, and for such nonlocal systems, to the best of our knowledge, available statistical parameter estimation approaches are very computationally expensive, if at all practicable. This is an area where progress is sorely needed.
The development of a reliable simulation algorithm, able to reproduce and forecast the immunocompetent dynamics observed in the chip, also requires addressing the heavy computational cost that such simulations entail, in particular if iterative model computation and functional optimization procedures are needed for the statistical estimation of the model parameters against available data. From this point of view, it should be noted that this type of model lends itself naturally to a parallelized implementation; this is another area of necessary future work.
From the biological point of view, the current model only embodies the very basic elements of chemoattractant production, diffusion and elimination and of leukocytes movement following its gradient. Important elements of the real situation have not yet been considered, such as the toxic effect of leukocytes on TCs, thereby decreasing the chemoattractant concentration, gradient and the mortality of leukocytes. Both of these effects, in combination with the continuing inflow of leukocytes into the right chamber, would in fact contribute to an earlier convergence to some asymptotic value of the proportion of right-compartment leukocytes over the total, as observed in the experiments.
Notwithstanding all of the above limitations, the present work represents a different, possibly more natural and direct approach, with respect to other works on the same topic published in the past by one of the authors [26,28]. The relatively straightforward implementation of the model, not requiring special numerical treatment at the boundaries of the chip domain or a separate, ad hoc formalization of the movement of cells through the microchannels, allows the direct representation of this and other possible geometries, with a unified understanding, throughout the whole domain, of the meaning of the relatively few parameters representing chemical dynamics and cell behavior.
6. Conclusions and Future Aims
In the present work, we show that a simulation tool based on a hybrid agent-based model is able to mimic the experimentally observed behavior in a microchip coculture of wildtype leukocytes and treated TCs. The model describes both the establishment of a concentration field of chemoattractants secreted by TCs and the migration of leukocytes along the gradient of chemical stimulus. The reliability of our approach depends on the following aspects: firstly, we represent directly the physiological hypotheses made by biologists (migration of leukocytes following the direction of higher concentration of chemical gradients generated by tumor cells which the production of chemoattractant stimulated by chemotherapy drug), and this implies a close adherence of the model to biological understanding; secondly, this approach produces forecasts consistent with available experimental observations.
It should be noted that this work does not aim to provide accurate statistical estimates of key model parameters (production/consumption/diffusion of chemical gradients); to perform this, we would need a whole correct statistical framework, which, at least for nonlocal, non-Markovian dynamical models, is not yet available. Our paper conversely establishes proof of concept, demonstrating that the required behavior can in fact be obtained on the basis of the explicit assumptions made.
In order to allow model identification, our future work will include parallelizing the computations and using applicable parameter estimation techniques to fit the model to the data. Furthermore, the model may be enriched by introducing different immune cell species or possibly different chemicals as well as tumor cell death caused by leukocyte aggression, immune cell death and possible interaction between different immune cell species. The final goal is to build a good model of the observable dynamics in the microchip so as to understand and reproduce the complex mechanisms behind the interaction between the immune system and cancer in different experimental conditions.
Author Contributions
Methodology, G.B. and A.D.G. (modeling and computational framework). Software, G.B. and A.D.G.; Validation, G.B. and A.D.G.; Visualization, G.B and A.D.G.; Data curation, G.B.; Conceptualization, G.B. and A.D.G.; Investigation, G.B. and A.D.G. Writing, G.B. and A.D.G. All authors have read and agreed to the published version of the manuscript.
Funding
This research received no external funding.
Institutional Review Board Statement
Not applicable.
Informed Consent Statement
Not applicable.
Data Availability Statement
All data are contained within the article.
Acknowledgments
We are grateful to Francesca Romana Bertani, Luca Businaro, Adele De Ninno and Annamaria Gerardino from IFN-CNR for inspiring our work with discussions about the microfluidic chip experiment and for helping us understand the experimental data.
Conflicts of Interest
The authors declare no conflict of interest.
References
- Businaro, L.; De Ninno, A.; Schiavoni, G.; Lucarini, V.; Ciasca, G.; Gerardino, A.; Belardelli, F.; Gabriele, L.; Mattei, F. Cross talk between cancer and immune cells: Exploring complex dynamics in a microfluidic environment. Lab Chip 2013, 13, 229–239. [Google Scholar] [CrossRef]
- Vacchelli, E.; Ma, Y.; Baracco, E.E.; Sistigu, A.; Enot, D.P.; Pietrocola, F.; Kroemer, G.; Stoll, G.; Boige, V.; Mulot, C.; et al. Chemotherapy-induced antitumor immunity requires formyl peptide receptor 1. Science 2015, 13, 972–978. [Google Scholar] [CrossRef]
- Biselli, E.; Agliari, E.; Barra, A.; Bertani, F.R.; Gerardino, A.; De Ninno, A.; Businaro, L. Organs on chip approach: A tool to evaluate cancer-immune cells interactions. Sci. Rep. 2017, 7, 912737. [Google Scholar] [CrossRef]
- Comes, M.C.; Casti, P.; Mencattini, A.; Di Giuseppe, D.; Mermet-Meillon, F.; De Ninno, A.; Martinelli, E. The influence of spatial and temporal resolutions on the analysis of cell-cell interaction: A systematic study for time-lapse microscopy applications. Sci. Rep. 2019, 9, 6789. [Google Scholar] [CrossRef] [PubMed]
- Gori, M.; Simonelli, M.C.; Giannitelli, S.M.; Businaro, L.; Trombetta, M.; Rainer, A. Investigating nonalcoholic fatty liver disease in a liver-on-a-chip microfluidic device. PLoS ONE 2016, 11, e0159729. [Google Scholar] [CrossRef]
- Agliari, E.; Biselli, E.; De Ninno, A.; Schiavoni, G.; Gabriele, L.; Gerardino, A.; Businaro, L. Cancer-driven dynamics of immune cells in a microfluidic environment. Sci. Rep. 2014, 4, 6639. [Google Scholar] [CrossRef]
- Greenberg, J.M.; Alt, W. Stability results for a diffusion equation with functional drift approximating a chemotaxis model. Trans. Am. Math. Soc. 1987, 300, 235–258. [Google Scholar] [CrossRef]
- Keller, E.F.; Segel, L.A. Initiation of slime mold aggregation viewed as an instability. J. Theor. Biol. 1970, 26, 399–415. [Google Scholar] [CrossRef]
- Altrock, P.M.; Liu, L.L.; Michor, F. The mathematics of cancer: Integrating quantitative models. Nat. Rev. Cancer 2015, 15, 730–745. [Google Scholar] [CrossRef] [PubMed]
- Bretti, G.; Natalini, R. Numerical approximation of nonhomogeneous boundary conditions on networks for a hyperbolic system of chemotaxis modeling the physarum dynamics. J. Comput. Methods Sci. Eng. 2018, 18, 85–115. [Google Scholar] [CrossRef] [Green Version]
- Hillen, T.; Painter, K.J. A user’s guide to PDE models for chemotaxis. J. Math. Biol. 2009, 58, 183–217. [Google Scholar] [CrossRef] [PubMed]
- Checcoli, A.; Pol, J.G.; Naldi, A.; Noel, V.; Barillot, E.; Kroemer, G.; Thieffry, D.; Calzone, L.; Stoll, G. Dynamical Boolean Modeling of Immunogenic Cell Death. Front Physiol. 2020, 11, 590479. [Google Scholar] [CrossRef] [PubMed]
- Kirschner, D.; Panetta, J.C. Modeling immunotherapy of the tumor-immune interaction. J. Math. Biol. 1998, 37, 235–252. [Google Scholar] [CrossRef] [PubMed] [Green Version]
- Lee, J.H.; Kim, S.K.; Khawar, I.A.; Jeong, S.Y.; Chung, S.; Kuh, H.J. Microfluidic co- culture of pancreatic tumor spheroids with stellate cells as a novel 3D model for investigation of stroma- mediated cell motility and drug resistance. J. Exp. Clin. Cancer Res. 2018, 37, 4. [Google Scholar] [CrossRef] [Green Version]
- Lee, S.W.L.; Seager, R.J.; Litvak, F.; Spill, F.; Sieow, J.L.; Leong, P.H.; Kumar, D.; Tan, A.S.M.; Wong, S.C.; Adriani, G.; et al. Integrated in silico and 3D in vitro model of macrophagemigration in response to physical and chemical factors in the tumor microenvironment. Integr. Biol. 2020, 12, 90–108. [Google Scholar] [CrossRef] [PubMed]
- Perthame, B. Transport Equations in Biology; Birkhäuser: Basel, Switzerland, 2007. [Google Scholar]
- Segovia-Juarez, J.L.; Ganguli, S.; Kirschner, D. Identifying control mechanisms of granuloma formation during M. tuberculosis infection using an agent-based model. J. Theor. Biol. 2004, 231, 357–376. [Google Scholar] [CrossRef]
- Yang, T.D.; Park, J.; Choi, Y.; Choi, W.; Ko, T.; Kyoung, J. Zigzag turning preference of freely crawling cells. PLoS ONE 2011, 6, e20255. [Google Scholar] [CrossRef] [PubMed] [Green Version]
- An, G.; Mi, Q.; Dutta-Moscato, J.; Vodovotz, Y. Agent-based models in translational systems biology. Wiley Interdiscip. Rev. Syst. Biol. Med. 2009, 1, 159–171. [Google Scholar] [CrossRef] [Green Version]
- Bauer, A.L.; Beauchemin, C.A.; Perelson, A.S. Agent-based modeling of host-pathogen systems: The successes and challenges. Inf. Sci. 2009, 179, 1379–1389. [Google Scholar] [CrossRef] [PubMed]
- Cilfone, N.A.; Kirschner, D.E.; Linderman, J.J. Strategies for efficient numerical implementation of hybrid multi-scale agent-based models to describe biological systems. Cell. Mol. Bioeng. 2015, 8, 119–136. [Google Scholar] [CrossRef] [PubMed] [Green Version]
- Nguyen Edalgo, Y.T.; Zornes, A.L.; Ford Versypt, A.N. A hybrid discrete-continuous model of metastatic cancer cell migration through a remodeling extracellular matrix. Aiche J. 2019, 65, e16671. [Google Scholar] [CrossRef]
- Perfahl, H.; Hughes, B.D.; Alarcón, T.; Maini, P.K.; Lloyd, M.C.; Reuss, M.; Byrne, H.M. 3D hybrid modelling of vascular network formation. J. Theor. Biol. 2017, 414, 254–268. [Google Scholar] [CrossRef] [PubMed]
- Macfarlane, F.R.; Chaplain, M.A.; Lorenzi, T. A hybrid discrete-continuum approach to model Turing pattern formation. Math. Biosci. Eng. 2020, 17, 7442–7479. [Google Scholar] [CrossRef] [PubMed]
- Othmer, H.G. Cell-Based, Continuum and Hybrid Models of Tissue Dynamics. In Mathematical Models and Methods for Living Systems; Book Series: Lecture Notes in Mathematics; Springer: Berlin/Heidelberg, Germany, 2016; pp. 1–72. [Google Scholar]
- Braun, E.C.; Bretti, G.; Natalini, R. Mass-Preserving Approximation of a Chemotaxis Multi-Domain Transmission Model for Microfluidic Chips. Mathematics 2021, 9, 688. [Google Scholar] [CrossRef]
- Braun, E.C.; Bretti, G.; Natalini, R. Parameter estimation techniques for a chemotaxis model inspired by Cancer-on-Chip (COC) experiments. Int. J. -Non-Linear Mech. 2022, 140, 103895. [Google Scholar] [CrossRef]
- Bretti, G.; De Ninno, A.; Natalini, R.; Peri, D.; Roselli, N. Estimation Algorithm for a Hybrid PDE–ODE Model Inspired by Immunocompetent Cancer-on-Chip Experiment. Axioms 2021, 10, 243. [Google Scholar] [CrossRef]
- Anbumani, S.; da Silva, A.M.; Carvalho, I.G.; Fischer, E.R.; de Souza e Silva, M.; von Zuben, A.A.G.; Cotta, M.A.; Carvalhom, H.F.; de Souza, A.A.; Janissen, R. Controlled spatial organization of bacterial growth reveals key role of cell filamentation preceding Xylella fastidiosa biofilm formation. NPJ Biofilms Microbiomes 2021, 7, 86. [Google Scholar] [CrossRef]
- Curk, T.; Marenduzzo, D.; Dobnikar, J. Chemotactic sensing towards ambient and secreted attractant drives collective behaviour of E. coli. PLoS ONE 2013, 8, e74878. [Google Scholar] [CrossRef] [PubMed] [Green Version]
- Kindler, O.; Pulkkinen, O.; Cherstvy, A.G.; Metzler, R. Burst statistics in an early biofilm quorum sensing model: The role of spatial colony-growth heterogeneity. Sci. Rep. 2019, 9, 12077. [Google Scholar] [CrossRef] [Green Version]
- Limoli, D.H.; Warren, E.A.; Yarrington, K.D.; Donegan, N.P.; Cheung, A.L.; O’Toole, G.A. Interspecies interactions induce exploratory motility in Pseudomonas aeruginosa. eLife 2019, 8, e47365. [Google Scholar] [CrossRef] [PubMed]
- Sugihara, K.; Yamaguchi, Y.; Usui, S.; Nashimoto, Y.; Hanada, S.; Kiyokawa, E.; Miura, T.; Uemura, A.; Yokokawa, R.; Nishiyama, K. A new perfusion culture method with a self-organized capillary network. PLoS ONE 2020, 15, e0240552. [Google Scholar] [CrossRef] [PubMed]
- Parlato, S.; De Ninno, A.; Molfetta, R.; Toschi, E.; Salerno, D.; Mencattini, A.; Romagnoli, G.; Fragale, A.; Roccazzello, L.; Buoncervello, M.; et al. 3D Microfluidic model for evaluating immunotherapy efficacy by tracking dendritic cell behaviour toward tumor cells. Sci. Rep. 2017, 7, 1–16. [Google Scholar] [CrossRef]
- Mattei, F.; Andreone, S.; Mencattini, A.; De Ninno, A.; Businaro, L.; Martinelli, E.; Schiavoni, G. Oncoimmunology Meets Organs-on-Chip. Front. Mol. Biosci. 2021, 8, 627454. [Google Scholar] [CrossRef] [PubMed]
- Maulana, T.I.; Kromidas, E.; Wallstabe, L.; Cipriano, M.; Alb, M.; Zaupa, C.; Loskill, P.; Hudecek, M.; Fogal, B. Immunocompetent cancer-on-chip models to assess immuno-oncology therapy. Adv. Drug Deliv. Rev. 2021, 173, 281–305. [Google Scholar] [CrossRef] [PubMed]
- Wiśniewski, J.R.; Hein, M.Y.; Cox, J.; Mann, M. A “proteomic ruler” for protein copy number and concentration estimation without spike-in standards. Mol. Cell. Proteom. 2014, 13, 3497–3506. [Google Scholar] [CrossRef] [PubMed] [Green Version]
- Boulter, E.; Grall, D.; Cagnol, S.; Van Obberghen-Schilling, E. Regulation of cell-matrix adhesion dynamics and Rac-1 by integrin linked kinase. FASEB J. 2006, 20, 1489–1491. [Google Scholar] [CrossRef]
- Weninger, W.; Biro, M.; Jain, R. Leukocyte migration in the interstitial space of non-lymphoid organs. Nat. Rev. Immunol. 2014, 14, 232–246. [Google Scholar] [CrossRef]
- Harris, T.H.; Banigan, E.J.; Christian, D.A.; Konradt, C.; Tait Wojno, E.D.; Norose, K.; Hunter, C.A.; Wilson, E.M.; John, B.; Weninger, W.; et al. Generalized Lévy walks and the role of chemokines in migration of effector CD8+ T cells. Nature 2012, 486, 545–548. [Google Scholar] [CrossRef] [PubMed] [Green Version]
- Li, H.; Qi, S.; Jin, H.; Qi, Z.; Zhang, Z.; Fu, L.; Luo, Q. Zigzag Generalized Lévy Walk: The In Vivo Search Strategy of Immunocytes. Theranostics 2015, 5, 1275–1290. [Google Scholar] [CrossRef] [PubMed] [Green Version]
Figure 1.
Flowchart schematizing the procedure applied in the present work.

Figure 2.
Diagonal trajectories driven by the chemical signal of immune cells from the right chamber to the left chamber, crossing the microchannels. Credit: Crop of picture in Agliari et al. (2014), Reference [6].
Figure 2.
Diagonal trajectories driven by the chemical signal of immune cells from the right chamber to the left chamber, crossing the microchannels. Credit: Crop of picture in Agliari et al. (2014), Reference [6].

Figure 3.
Video frame representing the microfluidic chip area under observation. The migration of leukocytes from the right to the left chamber is traced. Credit: Crop of an image in Vacchelli et al. [2] edited by AAAS.
Figure 3.
Video frame representing the microfluidic chip area under observation. The migration of leukocytes from the right to the left chamber is traced. Credit: Crop of an image in Vacchelli et al. [2] edited by AAAS.

Figure 4.
Microfluidic chip environment. Panel (A): schematics of the 3-D configuration of the whole chip. Panel (B): schematics of the central, active portion of the chip. Panel (C): 2D-representation of the active, central portion of the chip as modeled. Panel (D): actual photograph of the microfluidic device. Credit: Businaro et al. (2013) [1], edited by The Royal Society of Chemistry.

Figure 5.
Evolution in time of annexin secreted by chemical sources (TCs) and of leukocyte dynamics computed by the model (3)–(5). Panel (A): situation at time of about 4 h with TCs (depicted as yellow balls) located in the right chamber, and the presence of some leukocytes (depicted as magenta balls) migrated passively from another location of the chip towards the right chamber. Panel (B): formation of chemical field (in yellow) after 15 h and migration of leukocytes by crossing the microchannels and following the chemical gradient in the left chamber. Panel (C): situation after 25 h, with some leukocytes migrated in the left chamber. Panel (D): configuration after 35 h, with leukocytes distributed in the left and right chamber. Both in Panel (C,D) it can be observed that leukocytes in the left chamber accumulate in the zone with higher concentration of annexin.

Figure 6.
Plot of the percentage of leukocytes in the right chamber detected experimentally (blue dotted line) vs the percentage of leukocytes in the right chamber obtained by once simulating the mathematical model (3)–(5), (magenta line).


Table 1.
Parameters of the model.
| Parameter | Description | Units | Value | Refs. |
|---|---|---|---|---|
| discretization time step | design | |||
| D | Diffusivity of chemoattractant | calibration | ||
| production rate of chemicals | calibration | |||
| consumption rate of chemicals | calibration | |||
| threshold value for migration | - | 1000 | calibration | |
| parameter enforcing migration towards high concentration | - | 1 | calibration | |
| length of the channels | 500 | datum | ||
| horizontal size of the box | 1702 | datum | ||
| vertical size of the box | 1362 | datum | ||
| number of microchannels in the video footage | - | 31 | datum | |
| width of each microchannel | 12 | datum | ||
| width of obstacles | 33 | datum | ||
| observation time | datum | |||
| radius of leukocytes | 4 | [37] | ||
| radius of tumor cells | 10 | [38] | ||
| number of tumor cells | ∼60 | datum | ||
| normalized rate of new leukocyte accrual | calibration | |||
| number of frames of the laboratory experiment | - | 1440 | datum |
Publisher’s Note: MDPI stays neutral with regard to jurisdictional claims in published maps and institutional affiliations. |
© 2022 by the authors. Licensee MDPI, Basel, Switzerland. This article is an open access article distributed under the terms and conditions of the Creative Commons Attribution (CC BY) license (https://creativecommons.org/licenses/by/4.0/).
Share and Cite
MDPI and ACS Style
Bretti, G.; De Gaetano, A. An Agent-Based Interpretation of Leukocyte Chemotaxis in Cancer-on-Chip Experiments. Mathematics 2022, 10, 1338. https://0-doi-org.brum.beds.ac.uk/10.3390/math10081338
AMA Style
Bretti G, De Gaetano A. An Agent-Based Interpretation of Leukocyte Chemotaxis in Cancer-on-Chip Experiments. Mathematics. 2022; 10(8):1338. https://0-doi-org.brum.beds.ac.uk/10.3390/math10081338
Chicago/Turabian StyleBretti, Gabriella, and Andrea De Gaetano. 2022. "An Agent-Based Interpretation of Leukocyte Chemotaxis in Cancer-on-Chip Experiments" Mathematics 10, no. 8: 1338. https://0-doi-org.brum.beds.ac.uk/10.3390/math10081338
Note that from the first issue of 2016, this journal uses article numbers instead of page numbers. See further details here.