
EADN: An Efficient Deep Learning Model for Anomaly Detection in Videos

 ,
, 
 ,
, 
Abstract
:1. Introduction
- Pre-Processing: Surveillance camera generates huge amount of data on a regular basis in the current technological era, needing a considerable amount of computational complexity and time for exploration. Existing techniques in anomaly detection in surveillance video literature lack the focus on pre-processing steps. In this paper, we present a novel and efficient pre-processing strategy of video shots segmentation, where shots boundaries are segmented based on underlying activity. Further, the segmented shots of the video can be processed for advanced analysis such as anomaly activities without any transmission delay. Thus, our pre-processing strategy plays a prominent role in the overall anomaly detection in the surveillance video framework.
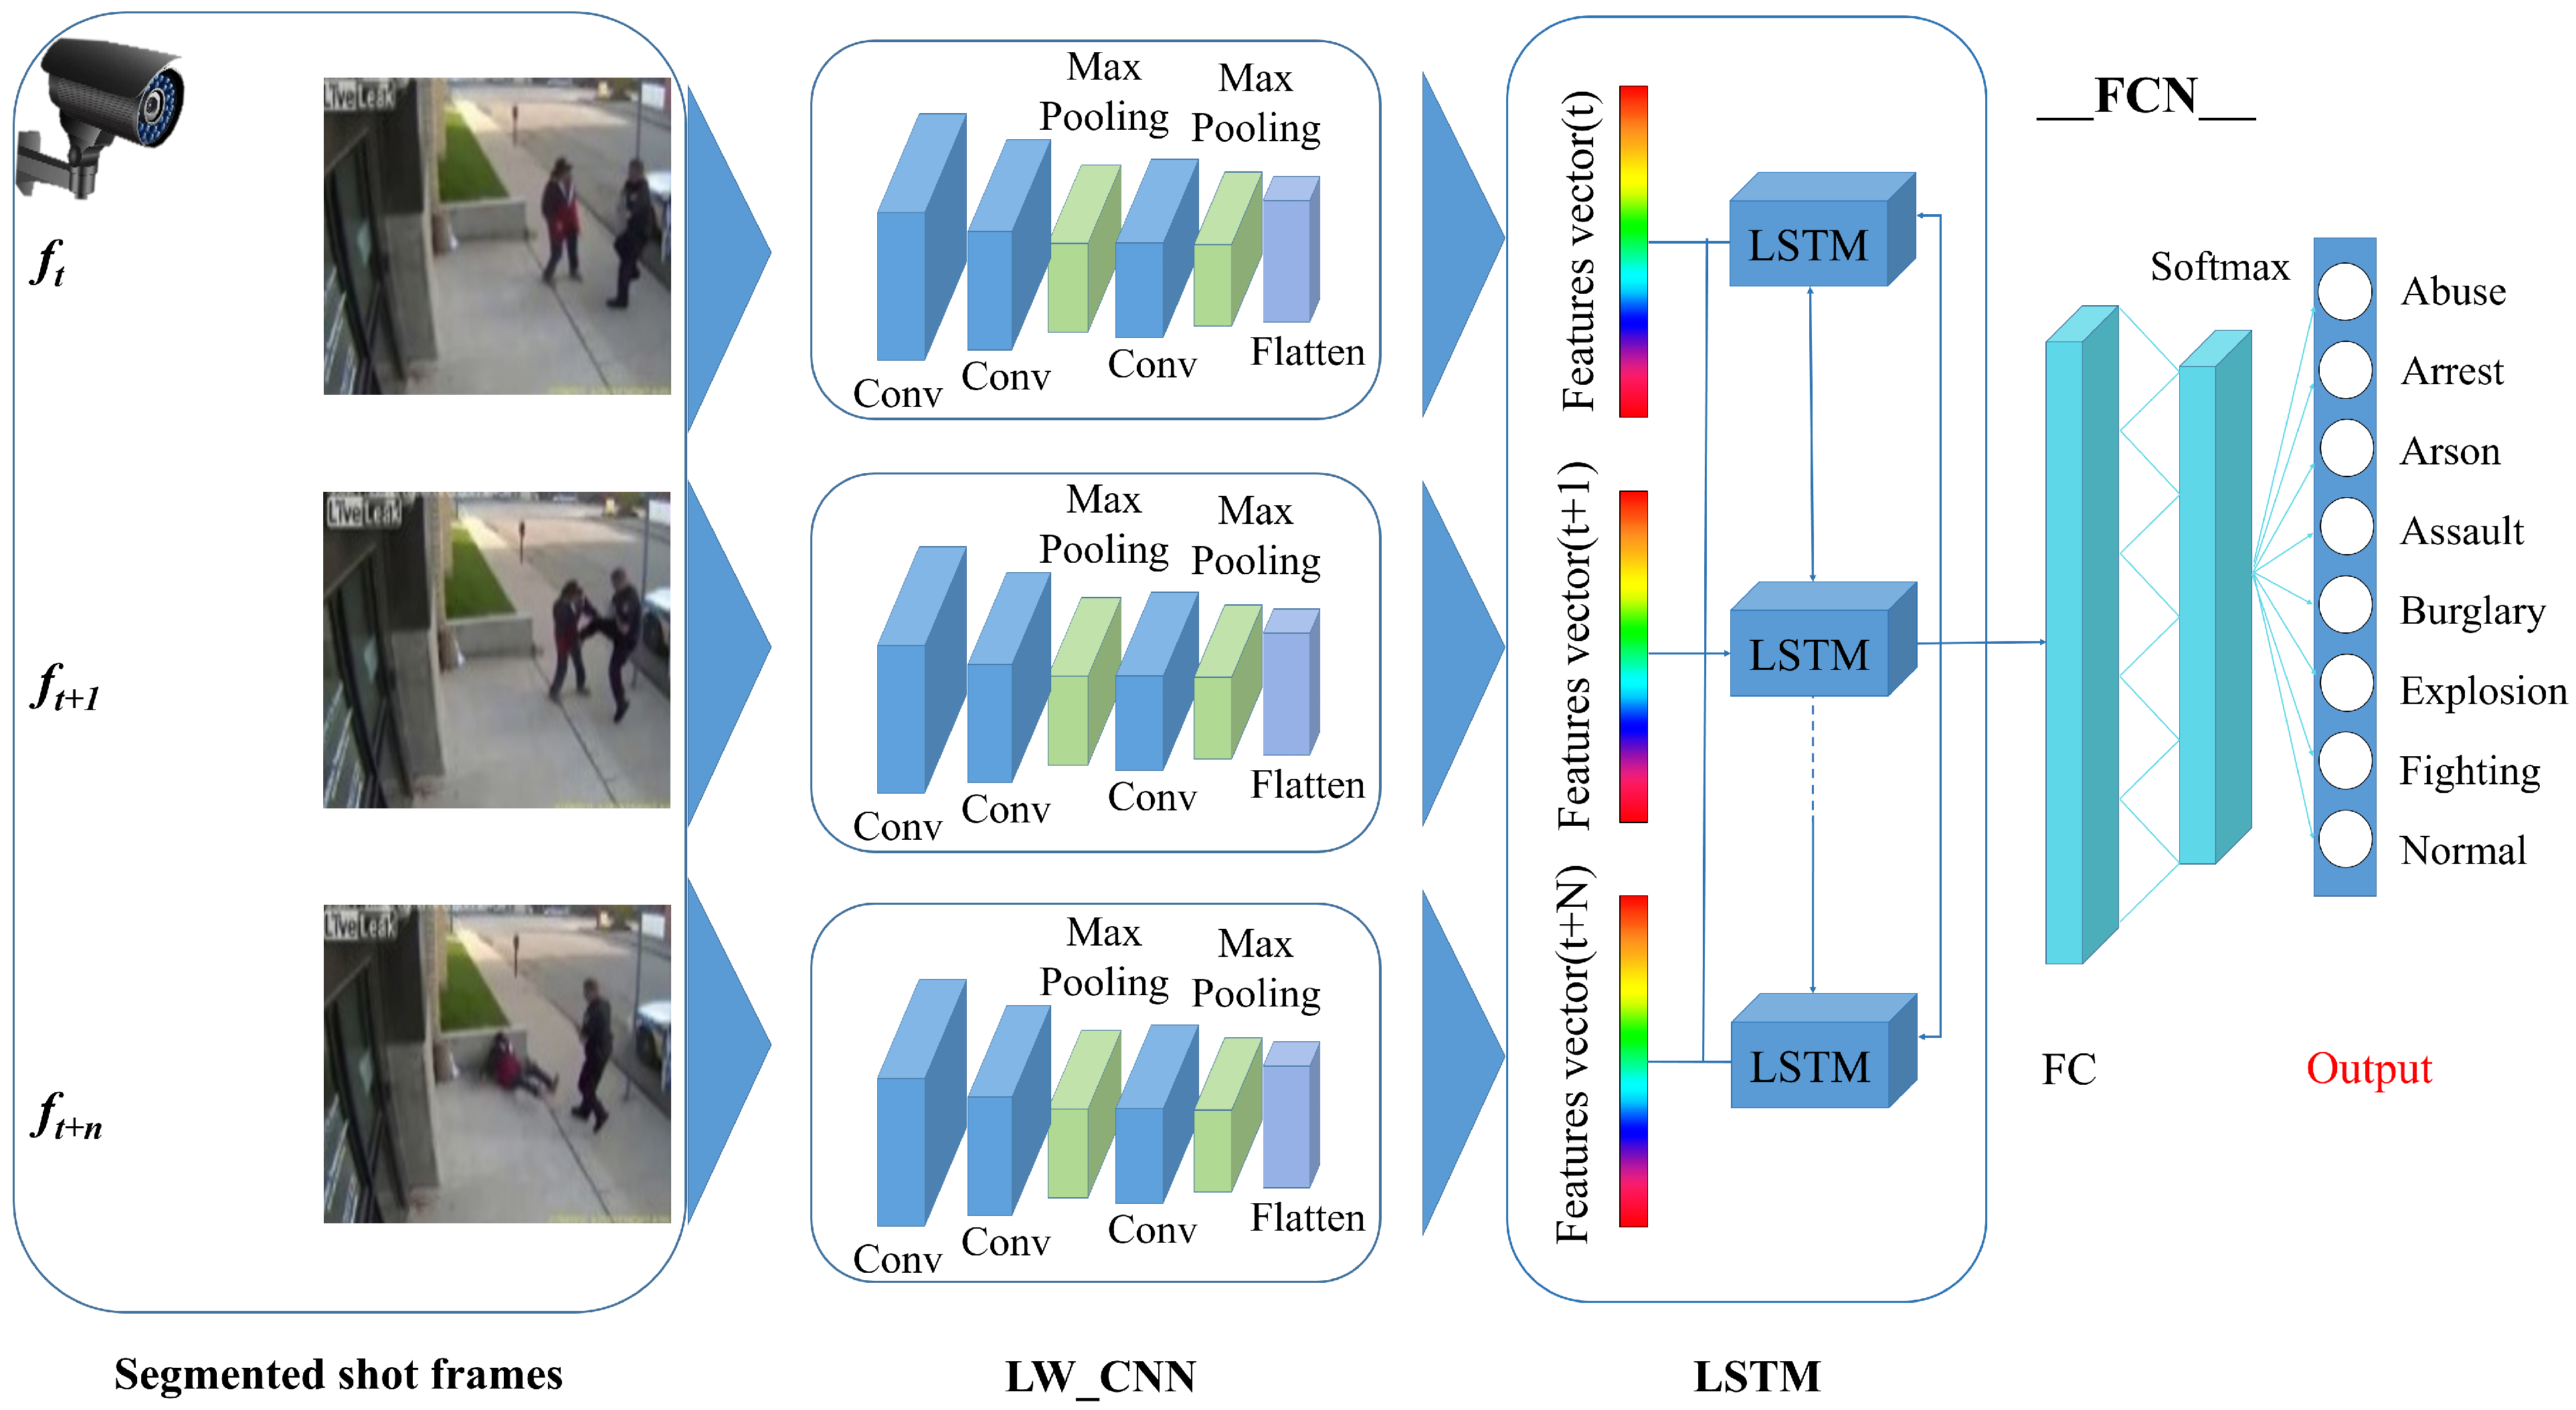
- A simple, light-weight, and novel CNN model consisting of time-distributed layers for learning spatiotemporal features from a series of frames per sample is proposed.
- A comprehensive model evaluation on standard performance metrics using a challenging benchmark dataset and achieving promising results compared to the state-of-the-art with a model size of only 53.9 MBs.
2. Related Work
3. Proposed Framework
3.1. Shot Segmentation Using Boundary Detection
- Step 1:
- First, divide a frame into blocks with m rows and n columns. Second, compute a histogram that matches the difference in corresponding blocks between consecutive frames in the video sequence. Here, the histograms of bth blocks in the and frames are and , respectively. Finally, use the following equation to calculate the difference between blocks:represents block difference, and is the total number of blocks, while is the total number of possible gray levels and is the histogram value for the jth level in the channel c at the bth block in the frame t.
- Step 2:
- Calculate the difference through histograms between two consecutive frames:where denotes the block’s weight at k and represents the total number of blocks, while is the block difference at k between and frames.
- Step 3:
- Calculate the threshold: For the entire video sequence, compute the difference of the histogram through mean and standard deviations as follows:where is the total number of video sequence.
- Step 4:
- Detection of shot boundaries: Let be the threshold. is the constant. It weights the standard deviation for the overall threshold . If , the frame represents the end of the previous shot, and the frame represents the end of the following shot. Generally, the shortest shot should last between 1 and 2.5 s. For the sake of fluency, the frame rate must be at least 25 frames per second (in most situations, it is 30 frames per second), or a flash may appear. As a result, a shot must have at least 30 to 45 frames. Thus, a shot merging principle created that state: If a detected shot has fewer than 38 frames, it will be merged into the preceding shot or considered independent. The pseudo-code is given in Algorithm 20.
| Algorithm 1 Pseudocode of shot boundary detection |
| Require: Total number of videos = ∈ |
| Require: Distribute Each frame f in sixteen block i.e., ∀f∈ |
| for← 1 do |
| for do |
| if then |
| Previous shot last frame |
| Next shot last frame . |
| else if then |
| Print “Shot not detected” |
| end if |
| end for |
| return Shot boundary detection for the given video. |
| Repeat loop until last video frame |
| end for |
3.2. Extraction of Keyframes
- Step 1:
- Compute the difference between the general frames (all frames except the reference frame) and the reference frame (first frame of each shot):where denotes the block’s weight at k and represents the total number of blocks, while is the block difference at k between the x reference frame and y general frames.
- Step 2:
- Within a shot, look for the maximum difference:where represents the maximum histogram within shot i, and is the difference between the x reference frame and y general frames, while is the total number of the current shots.
- Step 3:
- Use the relationship between and to determine “Shot Type”:A shot will be declared as a dynamic shot if its is bigger than ; otherwise it is a static shot.
- Step 4:
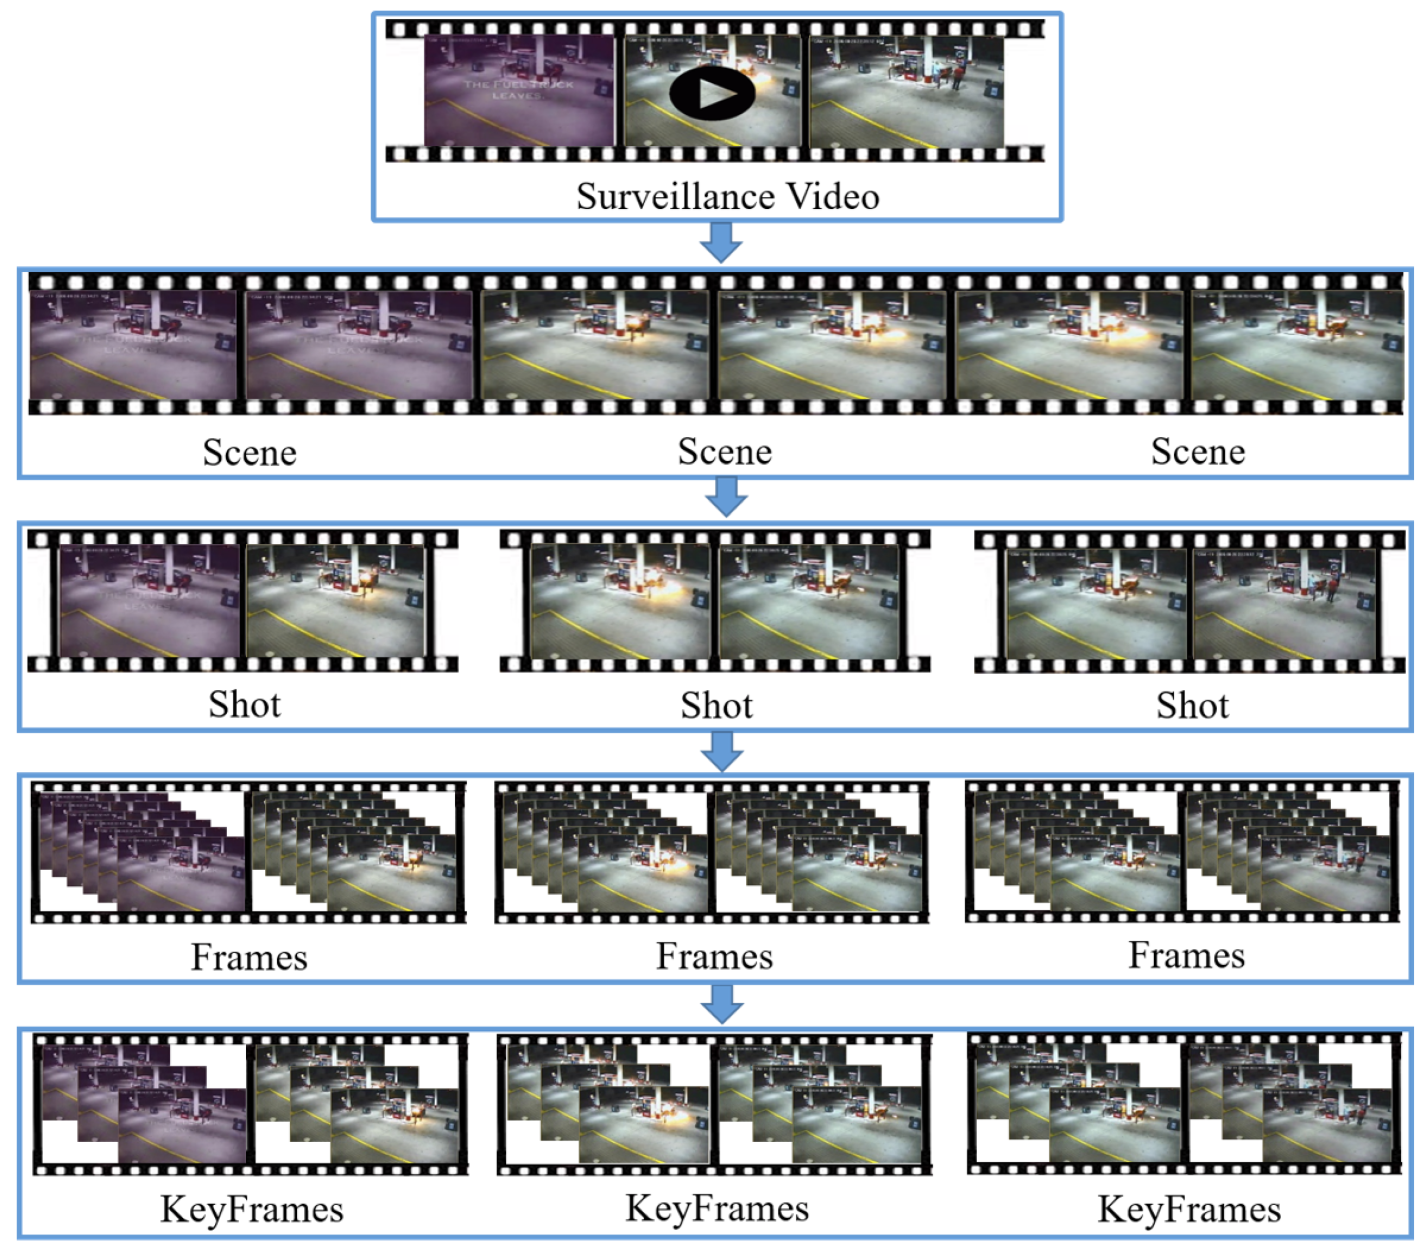
- Determine the keyframe’s location: If and the number of frames in the shot is odd, the frame in the center of the shot is chosen as a keyframe; if the number of frames is even, any frame between the two frames in the middle of the shot can be chosen as the keyframe. When equals 1, the frame with the greatest difference is designated as the keyframe [23]. The graphical depiction of the four steps for extracting the keyframes is given in Figure 2.
3.3. Proposed CNN Architecture
4. Experimental Results
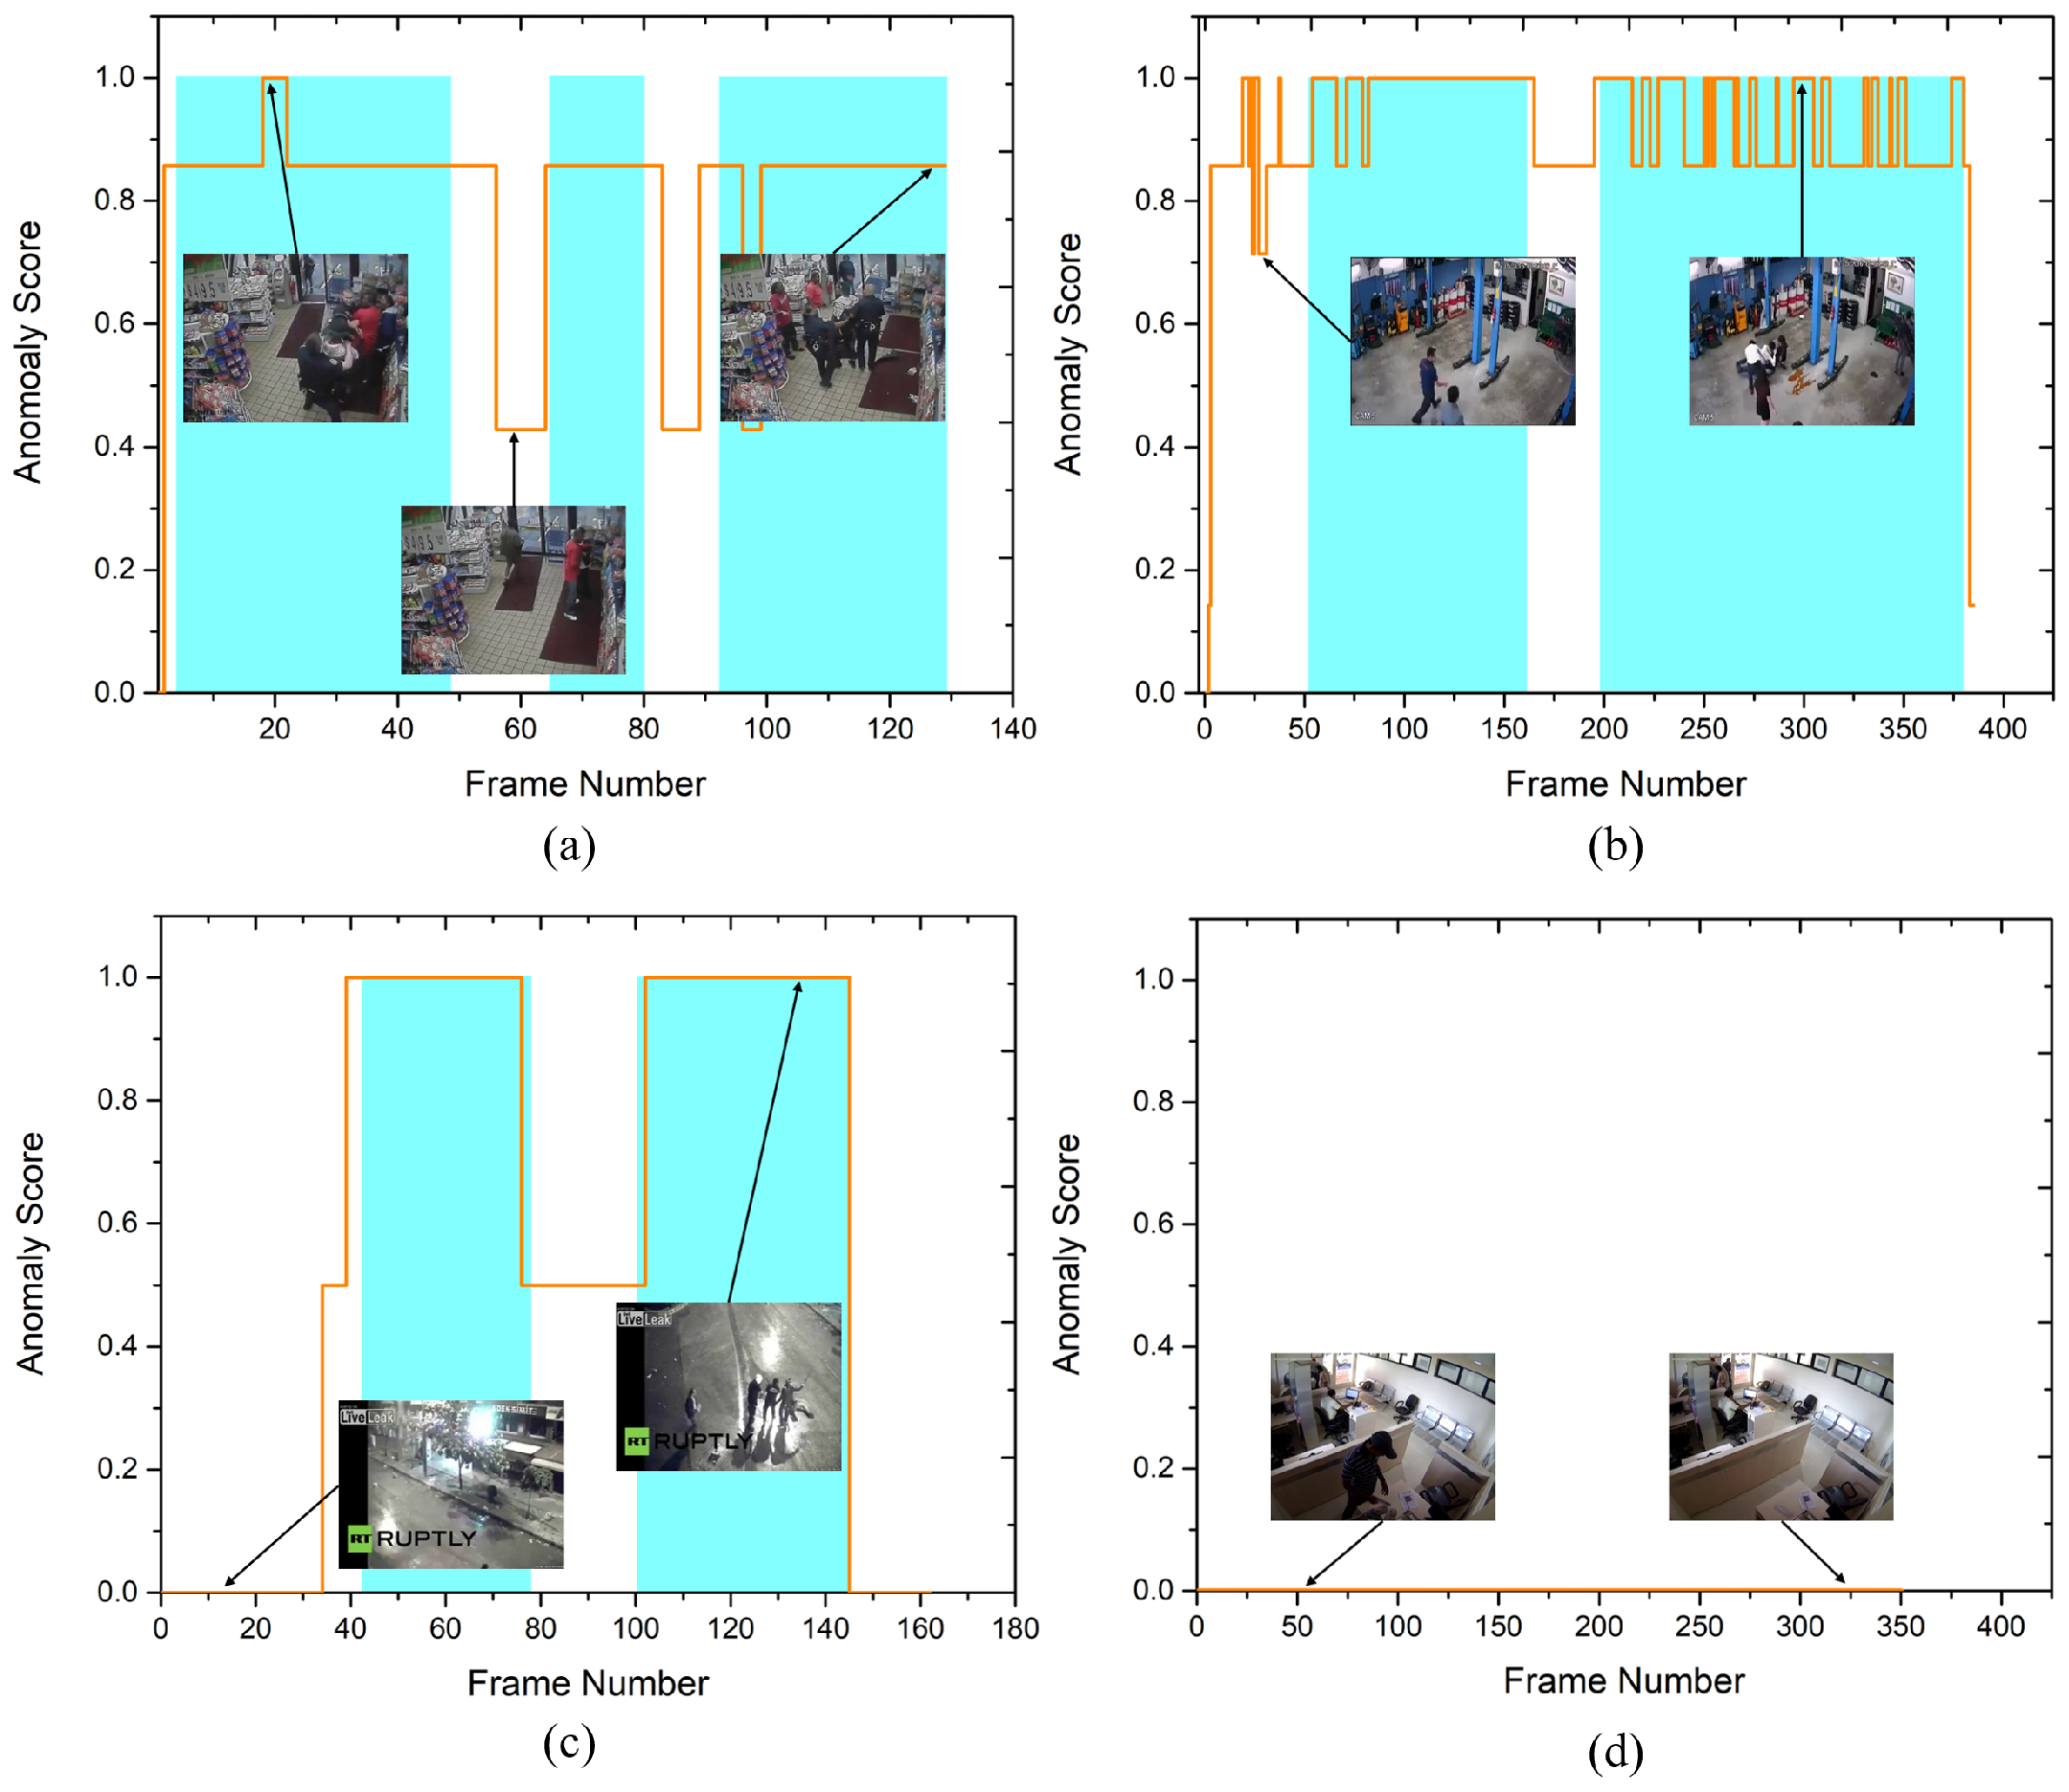
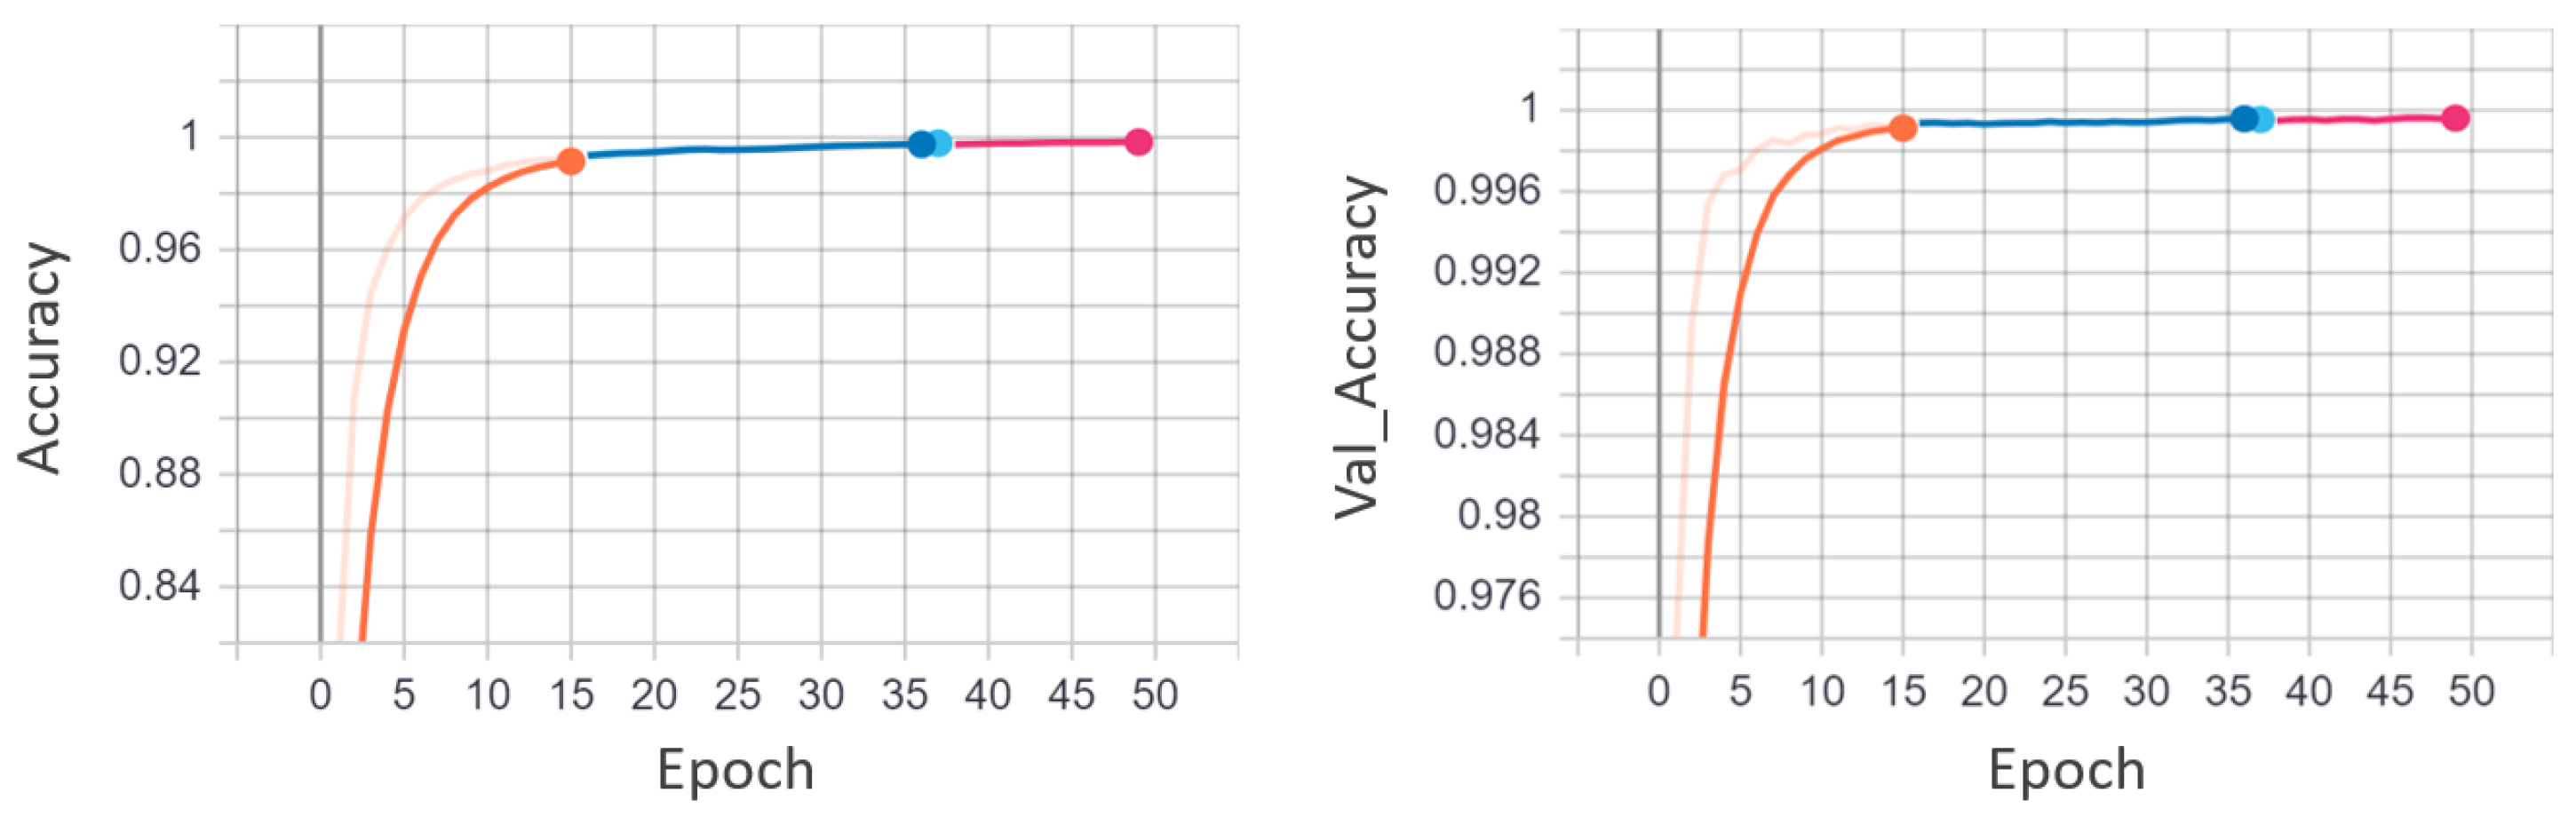
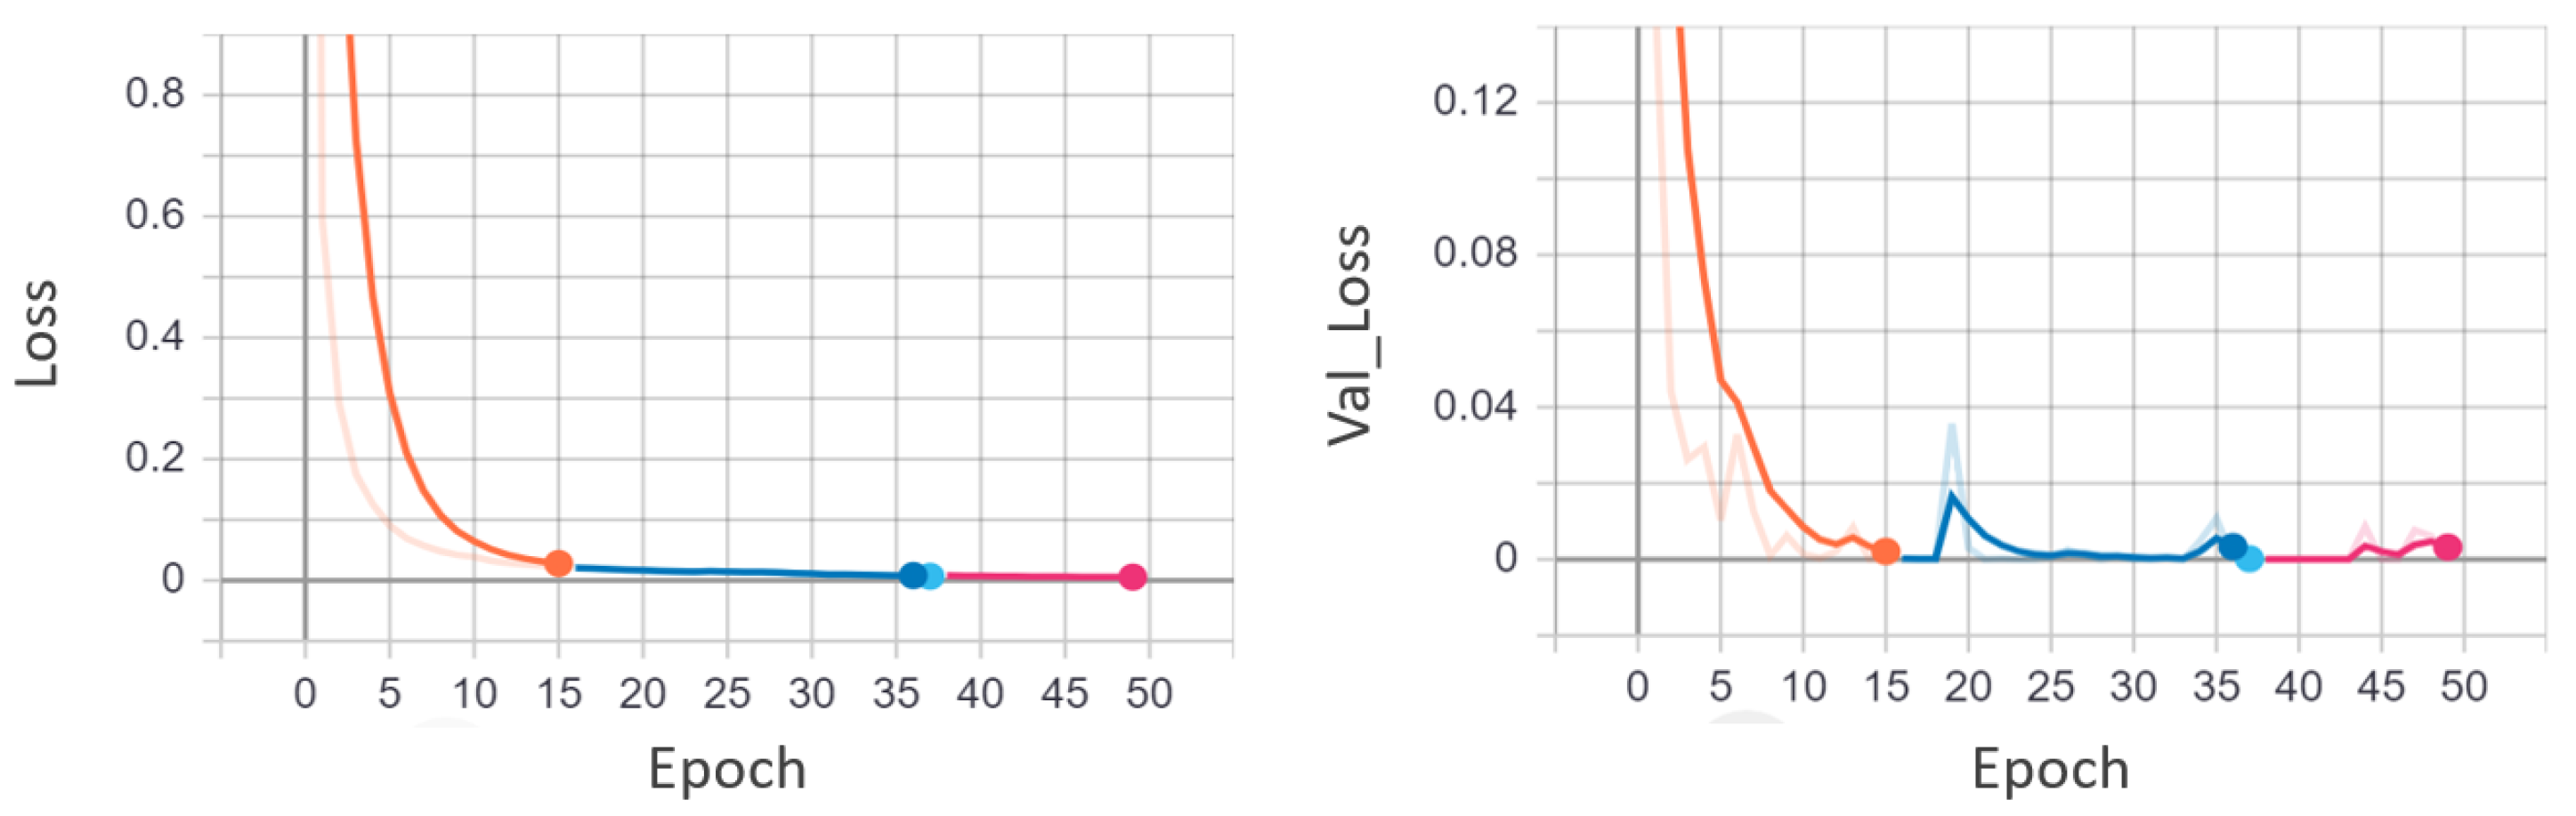
4.1. Quantitative Results
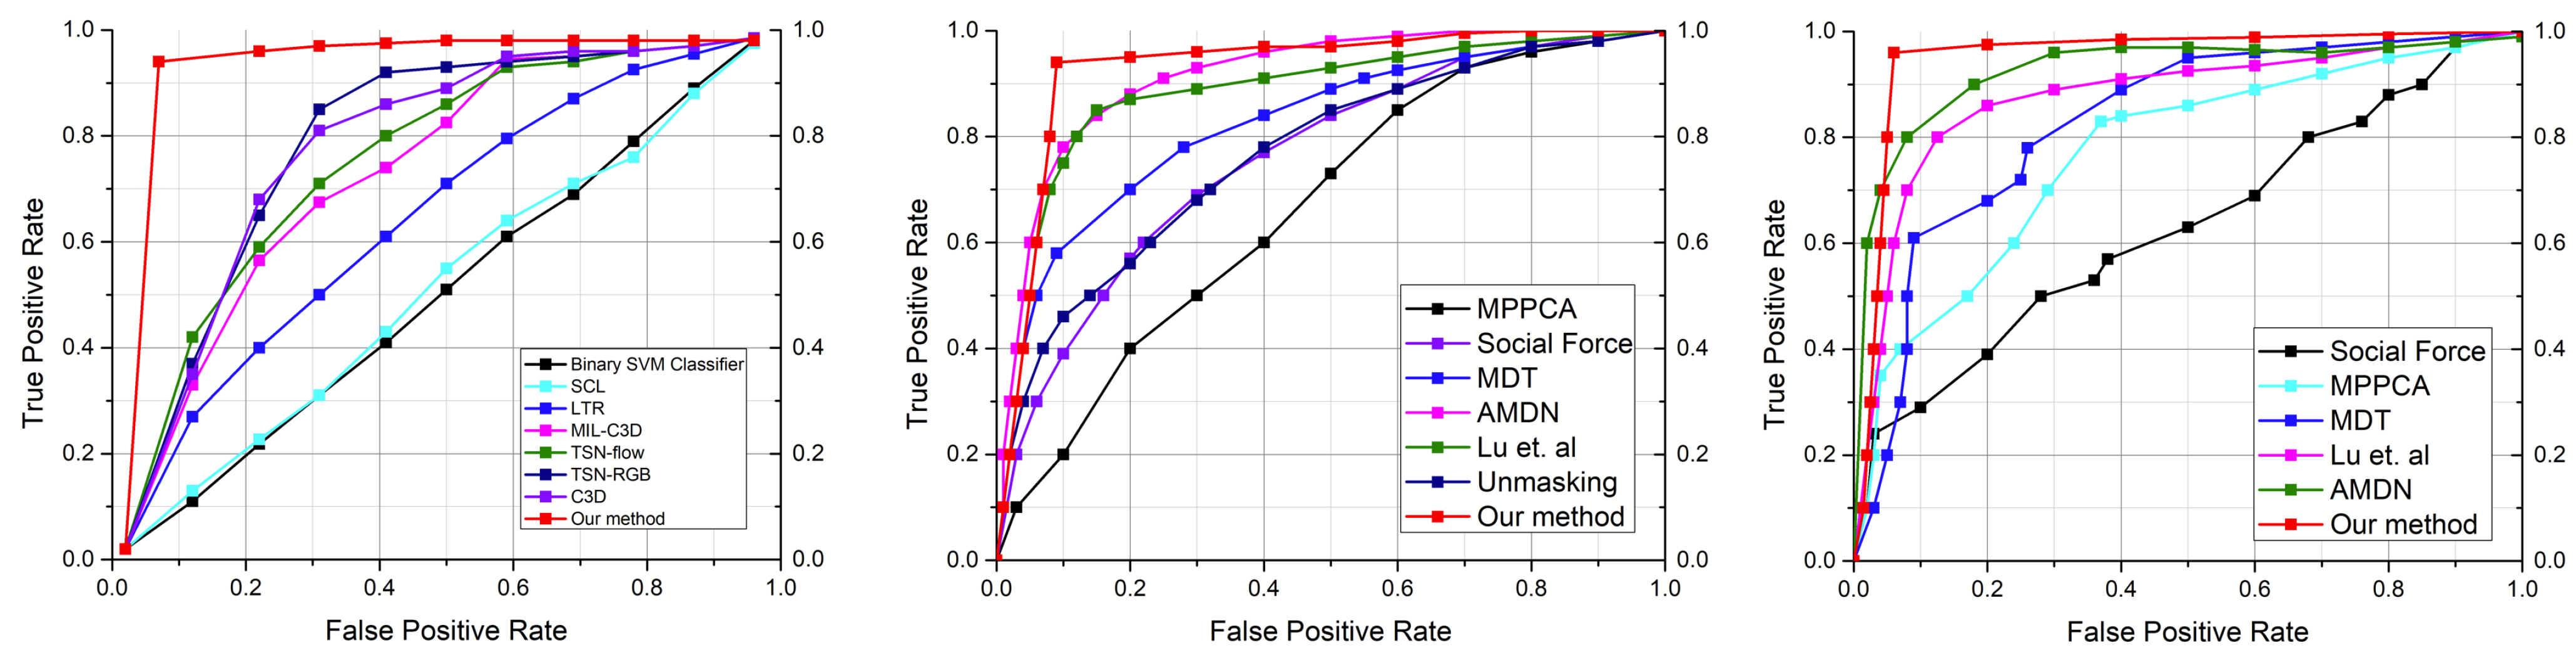
4.2. Comparison with the State-of-the-Art Techniques
5. Conclusions
Author Contributions
Funding
Institutional Review Board Statement
Informed Consent Statement
Data Availability Statement
Conflicts of Interest
References
- Piza, E.L.; Welsh, B.C.; Farrington, D.P.; Thomas, A.L. CCTV surveillance for crime prevention: A 40-year systematic review with meta-analysis. Criminol. Public Policy 2019, 18, 135–159. [Google Scholar] [CrossRef] [Green Version]
- Cheng, K.W.; Chen, Y.T.; Fang, W.H. An efficient subsequence search for video anomaly detection and localization. Multimed. Tools Appl. 2016, 75, 15101–15122. [Google Scholar] [CrossRef]
- He, C.; Shao, J.; Sun, J. An anomaly-introduced learning method for abnormal event detection. Multimed. Tools Appl. 2018, 77, 29573–29588. [Google Scholar] [CrossRef]
- Lu, C.; Shi, J.; Jia, J. Abnormal event detection at 150 fps in matlab. In Proceedings of the IEEE International Conference on Computer Vision (ICCV), Sydney, Australia, 1–8 December 2013; pp. 2720–2727. [Google Scholar]
- Sultani, W.; Chen, C.; Shah, M. Real-world anomaly detection in surveillance videos. In Proceedings of the IEEE Conference on Computer Vision and Pattern Recognition, Salt Lake City, UT, USA, 18–22 June 2018; pp. 6479–6488. [Google Scholar]
- Huo, J.; Gao, Y.; Yang, W.; Yin, H. Abnormal event detection via multi-instance dictionary learning. In International Conference on Intelligent Data Engineering and Automated Learning; Springer: Berlin/Heidelberg, Germany, 2012; pp. 76–83. [Google Scholar]
- Zhang, D.; Gatica-Perez, D.; Bengio, S.; McCowan, I. Semi-supervised adapted hmms for unusual event detection. In Proceedings of the 2005 IEEE Computer Society Conference on Computer Vision and Pattern Recognition (CVPR’05), San Diego, CA, USA, 20–25 June 2005; Volume 1, pp. 611–618. [Google Scholar]
- Mehran, R.; Oyama, A.; Shah, M. Abnormal crowd behavior detection using social force model. In Proceedings of the 2009 IEEE Conference on Computer Vision and Pattern Recognition, Miami, FL, USA, 20–25 June 2009; pp. 935–942. [Google Scholar]
- Nor, A.K.M.; Pedapati, S.R.; Muhammad, M.; Leiva, V. Abnormality detection and failure prediction using explainable Bayesian deep learning: Methodology and case study with industrial data. Mathematics 2022, 10, 554. [Google Scholar] [CrossRef]
- Ullah, M.; Mudassar Yamin, M.; Mohammed, A.; Daud Khan, S.; Ullah, H.; Alaya Cheikh, F. Attention-based LSTM network for action recognition in sports. Electron. Imaging 2021, 2021, 302-1–302-6. [Google Scholar] [CrossRef]
- Selicato, L.; Esposito, F.; Gargano, G.; Vegliante, M.C.; Opinto, G.; Zaccaria, G.M.; Ciavarella, S.; Guarini, A.; Del Buono, N. A new ensemble method for detecting anomalies in gene expression matrices. Mathematics 2021, 9, 882. [Google Scholar] [CrossRef]
- Riaz, H.; Uzair, M.; Ullah, H.; Ullah, M. Anomalous Human Action Detection Using a Cascade of Deep Learning Models. In Proceedings of the 2021 9th European Workshop on Visual Information Processing (EUVIP), Paris, France, 23–25 June 2021; pp. 1–5. [Google Scholar]
- Zhao, B.; Fei-Fei, L.; Xing, E.P. Online detection of unusual events in videos via dynamic sparse coding. In Proceedings of the CVPR 2011, Colorado Springs, CO, USA, 20–25 June 2011; pp. 3313–3320. [Google Scholar]
- Luo, W.; Liu, W.; Gao, S. Remembering history with convolutional lstm for anomaly detection. In Proceedings of the 2017 IEEE International Conference on Multimedia and Expo (ICME), Hong Kong, China, 10–14 July 2017; pp. 439–444. [Google Scholar]
- Hasan, M.; Choi, J.; Neumann, J.; Roy-Chowdhury, A.K.; Davis, L.S. Learning temporal regularity in video sequences. In Proceedings of the IEEE Conference on Computer Vision and Pattern Recognition, Las Vegas, NV, USA, 27–30 June 2016; pp. 733–742. [Google Scholar]
- Liu, W.; Luo, W.; Lian, D.; Gao, S. Future frame prediction for anomaly detection–a new baseline. In Proceedings of the IEEE Conference on Computer Vision and Pattern Recognition, Salt Lake City, UT, USA, 18–23 June 2018; pp. 6536–6545. [Google Scholar]
- Chang, Y.; Tu, Z.; Xie, W.; Yuan, J. Clustering driven deep autoencoder for video anomaly detection. In European Conference on Computer Vision; Springer: Berlin/Heidelberg, Germany, 2020; pp. 329–345. [Google Scholar]
- Sabokrou, M.; Khalooei, M.; Fathy, M.; Adeli, E. Adversarially learned one-class classifier for novelty detection. In Proceedings of the IEEE Conference on Computer Vision and Pattern Recognition, Salt Lake City, UT, USA, 18–23 June 2018; pp. 3379–3388. [Google Scholar]
- Ullah, W.; Ullah, A.; Hussain, T.; Khan, Z.A.; Baik, S.W. An Efficient Anomaly Recognition Framework Using an Attention Residual LSTM in Surveillance Videos. Sensors 2021, 21, 2811. [Google Scholar] [CrossRef] [PubMed]
- Tomar, D.; Agarwal, S. Multiple instance learning based on twin support vector machine. In Advances in Computer and Computational Sciences; Springer: Berlin/Heidelberg, Germany, 2017; pp. 497–507. [Google Scholar]
- Landi, F.; Snoek, C.G.; Cucchiara, R. Anomaly locality in video surveillance. arXiv 2019, arXiv:1901.10364. [Google Scholar]
- Zhong, J.X.; Li, N.; Kong, W.; Liu, S.; Li, T.H.; Li, G. Graph convolutional label noise cleaner: Train a plug-and-play action classifier for anomaly detection. In Proceedings of the IEEE/CVF Conference on Computer Vision and Pattern Recognition, Long Beach, CA, USA, 15–20 June 2019; pp. 1237–1246. [Google Scholar]
- Rathod, G.I.; Nikam, D.A. An algorithm for shot boundary detection and key frame extraction using histogram difference. Int. J. Emerg. Technol. Adv. Eng. 2013, 3, 155–163. [Google Scholar]
- Zhang, D.; Yao, L.; Zhang, X.; Wang, S.; Chen, W.; Boots, R.; Benatallah, B. Cascade and parallel convolutional recurrent neural networks on EEG-based intention recognition for brain computer interface. In Proceedings of the AAAI Conference on Artificial Intelligence, New Orleans, LA, USA, 2–7 February 2018; Volume 32. [Google Scholar]
- Mahadevan, V.; Li, W.; Bhalodia, V.; Vasconcelos, N. Anomaly detection in crowded scenes. In Proceedings of the 2010 IEEE Computer Society Conference on Computer Vision and Pattern Recognition, San Francisco, CA, USA, 13–18 June 2010; pp. 1975–1981. [Google Scholar]
- Li, W.; Mahadevan, V.; Vasconcelos, N. Anomaly detection and localization in crowded scenes. IEEE Trans. Pattern Anal. Mach. Intell. 2013, 36, 18–32. [Google Scholar]
- Kim, J.; Grauman, K. Observe locally, infer globally: A space-time MRF for detecting abnormal activities with incremental updates. In Proceedings of the 2009 IEEE Conference on Computer Vision and Pattern Recognition, Miami, FL, USA, 20–25 June 2009; pp. 2921–2928. [Google Scholar]
- Hinami, R.; Mei, T.; Satoh, S. Joint detection and recounting of abnormal events by learning deep generic knowledge. In Proceedings of the IEEE International Conference on Computer Vision, Venice, Italy, 22–29 October 2017; pp. 3619–3627. [Google Scholar]
- Luo, W.; Liu, W.; Gao, S. A revisit of sparse coding based anomaly detection in stacked rnn framework. In Proceedings of the IEEE International Conference on Computer Vision, Venice, Italy, 22–29 October 2017; pp. 341–349. [Google Scholar]
- Ravanbakhsh, M.; Nabi, M.; Mousavi, H.; Sangineto, E.; Sebe, N. Plug-and-play cnn for crowd motion analysis: An application in abnormal event detection. In Proceedings of the 2018 IEEE Winter Conference on Applications of Computer Vision (WACV), Lake Tahoe, NV, USA, 12–15 March 2018; pp. 1689–1698. [Google Scholar]
- Xu, D.; Yan, Y.; Ricci, E.; Sebe, N. Detecting anomalous events in videos by learning deep representations of appearance and motion. Comput. Vis. Image Underst. 2017, 156, 117–127. [Google Scholar] [CrossRef]
- Tudor Ionescu, R.; Smeureanu, S.; Alexe, B.; Popescu, M. Unmasking the abnormal events in video. In Proceedings of the IEEE International Conference on Computer Vision, Venice, Italy, 22–29 October 2017; pp. 2895–2903. [Google Scholar]
- Chong, Y.S.; Tay, Y.H. Abnormal event detection in videos using spatiotemporal autoencoder. In International Symposium on Neural Networks; Springer: Berlin/Heidelberg, Germany, 2017; pp. 189–196. [Google Scholar]
- Zhou, J.T.; Du, J.; Zhu, H.; Peng, X.; Liu, Y.; Goh, R.S.M. Anomalynet: An anomaly detection network for video surveillance. IEEE Trans. Inf. Forensics Secur. 2019, 14, 2537–2550. [Google Scholar] [CrossRef]
- Gianchandani, U.; Tirupattur, P.; Shah, M. Weakly-Supervised Spatiotemporal Anomaly Detection; University of Central Florida Center for Research in Computer Vision REU: Orlando, FL, USA, 2019. [Google Scholar]
- Lee, S.; Kim, H.G.; Ro, Y.M. BMAN: Bidirectional multi-scale aggregation networks for abnormal event detection. IEEE Trans. Image Process. 2019, 29, 2395–2408. [Google Scholar] [CrossRef] [PubMed]
- Zaheer, M.Z.; Mahmood, A.; Shin, H.; Lee, S.I. A self-reasoning framework for anomaly detection using video-level labels. IEEE Signal Process. Lett. 2020, 27, 1705–1709. [Google Scholar] [CrossRef]
- Singh, K.; Rajora, S.; Vishwakarma, D.K.; Tripathi, G.; Kumar, S.; Walia, G.S. Crowd anomaly detection using aggregation of ensembles of fine-tuned convnets. Neurocomputing 2020, 371, 188–198. [Google Scholar] [CrossRef]
- Tang, Y.; Zhao, L.; Zhang, S.; Gong, C.; Li, G.; Yang, J. Integrating prediction and reconstruction for anomaly detection. Pattern Recognit. Lett. 2020, 129, 123–130. [Google Scholar] [CrossRef]
- Ganokratanaa, T.; Aramvith, S.; Sebe, N. Unsupervised anomaly detection and localization based on deep spatiotemporal translation network. IEEE Access 2020, 8, 50312–50329. [Google Scholar] [CrossRef]
- Maqsood, R.; Bajwa, U.I.; Saleem, G.; Raza, R.H.; Anwar, M.W. Anomaly recognition from surveillance videos using 3D convolution neural network. Multimed. Tools Appl. 2021, 80, 18693–18716. [Google Scholar] [CrossRef]
- Ullah, W.; Ullah, A.; Haq, I.U.; Muhammad, K.; Sajjad, M.; Baik, S.W. CNN features with bi-directional LSTM for real-time anomaly detection in surveillance networks. Multimed. Tools Appl. 2021, 80, 16979–16995. [Google Scholar] [CrossRef]
- Wu, C.; Shao, S.; Tunc, C.; Satam, P.; Hariri, S. An explainable and efficient deep learning framework for video anomaly detection. Clust. Comput. 2021, 1–23. [Google Scholar] [CrossRef] [PubMed]
- Qiang, Y.; Fei, S.; Jiao, Y. Anomaly detection based on latent feature training in surveillance scenarios. IEEE Access 2021, 9, 68108–68117. [Google Scholar] [CrossRef]
- Madan, N.; Farkhondeh, A.; Nasrollahi, K.; Escalera, S.; Moeslund, T.B. Temporal Cues from Socially Unacceptable Trajectories for Anomaly Detection. In Proceedings of the IEEE/CVF International Conference on Computer Vision, Montreal, BC, Canada, 11–17 October 2021; pp. 2150–2158. [Google Scholar]
- Tian, Y.; Pang, G.; Chen, Y.; Singh, R.; Verjans, J.W.; Carneiro, G. Weakly-supervised video anomaly detection with robust temporal feature magnitude learning. In Proceedings of the IEEE/CVF International Conference on Computer Vision, Montreal, BC, Canada, 11–17 October 2021; pp. 4975–4986. [Google Scholar]
- Simonyan, K.; Zisserman, A. Very deep convolutional networks for large-scale image recognition. arXiv 2014, arXiv:1409.1556. [Google Scholar]
- Szegedy, C.; Vanhoucke, V.; Ioffe, S.; Shlens, J.; Wojna, Z. Rethinking the inception architecture for computer vision. In Proceedings of the IEEE Conference on Computer Vision and pattern Recognition, Las Vegas, NV, USA, 27–30 June 2016; pp. 2818–2826. [Google Scholar]
- He, K.; Zhang, X.; Ren, S.; Sun, J. Deep residual learning for image recognition. In Proceedings of the IEEE Conference on Computer Vision and Pattern Recognition, Las Vegas, NV, USA, 27–30 June 2016; pp. 770–778. [Google Scholar]


| Symbol | Description |
|---|---|
| m | Rows. |
| n | Columns. |
| Block Difference between the corresponding blocks of the consecutive frames. | |
| Histogram value for the jth level, in the channel c at the bth block in the frame t. | |
| Histogram value for the jth level, in the channel c at the bth block in the frame . | |
| Total number of blocks. | |
| Total number of possible gray levels. | |
| Histogram difference between two consecutive frames. | |
| Block’s weight at . | |
| Mean of the histogram difference. | |
| Standard variance of the histogram difference. | |
| Threshold. | |
| x | Reference frame. |
| Total number of video sequences. | |
| Searching for the maximum difference within a shot. | |
| Light-Weight Convolutional Neural Network. | |
| Spatial feature representation series. | |
| Temporal feature representation series. | |
| Hidden state of the LSTM layer at current time step t. | |
| Hidden state of the LSTM layer at previous time step . | |
| Input gate at time t. | |
| Forget gate at time t. | |
| Output gate at time t. | |
| g | Recurrent unit. |
| Memory cell. |
| Layer Type | Number of Filters | Size | Padding Value | Stride | Activation | Output Shape |
|---|---|---|---|---|---|---|
| Time Distributed Conv2D1 | 64 | 3 × 3 | same | 2 × 2 | Relu | 5, 112, 112, 64 |
| Time Distributed Conv2D2 | 64 | 3 × 3 | same | 2 × 2 | Relu | 5, 56, 56, 64 |
| Time Distributed MaxPooling2D1 | 1 | 2 × 2 | - | 2 × 2 | - | 5, 28, 28, 64 |
| Time Distributed Conv2D3 | 128 | 3 × 3 | same | 2 × 2 | Relu | 5, 14, 14, 128 |
| Time Distributed MaxPooling2D2 | 1 | 2 × 2 | - | 2 × 2 | - | 5, 7, 7, 128 |
| Time Distributed Flatten1 | - | - | - | - | - | 56272 |
| Dataset | No. of Videos | Training Set | Test Set | Average Frames | Dataset Length | Example of Anomalies |
|---|---|---|---|---|---|---|
| UCSDPet1 | 70 | 34 | 36 | 201 | 5 min | Bikers, small carts, walking across walkways |
| UCSDPet2 | 28 | 16 | 12 | 163 | 5 min | Bikers, small carts, walking across walkways |
| Avenue | 37 | 16 | 21 | 839 | 5 min | Run, throw, new object |
| Anomaly’s Types | No. of Videos | Training Set | Test Set |
|---|---|---|---|
| Abuse | 50 | 48 | 2 |
| Arrest | 50 | 45 | 12 |
| Arson | 50 | 41 | 21 |
| Assault | 50 | 47 | 21 |
| Explosion | 50 | 29 | 21 |
| Fighting | 50 | 45 | 21 |
| Shooting | 50 | 27 | 21 |
| Shoplifting | 50 | 29 | 21 |
| Vandalism | 50 | 45 | 21 |
| Burglary | 100 | 87 | 21 |
| Stealing | 100 | 95 | 21 |
| Accident | 150 | 127 | 21 |
| Robbery | 150 | 145 | 5 |
| Total | 950 | 810 | 140 |
| Publication Year | Method | UCSDped1 [25] | UCSDped2 [25] | CUHK Avenue Dataset [4] | UCF-Crime Dataset [5] |
|---|---|---|---|---|---|
| 2009 | Kim and Grauman [27] | 59 | 69.3 | ||
| 2009 | Mehran et al. [8] | 67.5 | 55.6 | ||
| 2010 | Mahadevan et al. [25] | 81.1 | 82.9 | ||
| 2013 | Lu et al. [4] | 91.8 | - | 65.51 | |
| 2016 | Hasan et al. [15] | 81.0 | 90.0 | 70.2 | 50.6 |
| 2017 | Ionescu et al. [32] | 68.4 | 82.2 | 80.6 | |
| 2017 | Hinami et al. [28] | - | 92.2 | ||
| 2017 | Luo et al. [29] | - | 92.2 | 81.7 | |
| 2017 | Chong & Tay [33] | 80.3 | |||
| 2017 | Xu et al. [31] | 92.1 | 90.8 | ||
| 2018 | Binary SVM classifier. [5] | 50.0 | |||
| 2018 | MIL-C3D without constraints [5] | 74.44 | |||
| 2018 | MIL-C3D with constraints [5] | 75.41 | |||
| 2018 | Liu et al. [16] | 83.1 | 95.4 | 84.9 | |
| 2019 | Zhong et al. [22] | - | 93.2 | 81.08 | |
| 2019 | TSN-Optical Flow [22] | 92.8 | 78.08 | ||
| 2019 | Zhou et al. [34] | 86.1 | |||
| 2019 | Spatiotemporal [35] | 63.0 | |||
| 2019 | Zhou et al. [34] | 83.3 | 94.9 | 86.1 | |
| 2019 | Lee et al. [36] | 96.6 | 90.0 | ||
| 2020 | Zaheer et al. [37] | 94.47 | 79.54 | ||
| 2020 | Singh et al. [38] | 94.6 | 95.9 | 92.7 | |
| 2020 | Tang et al. [39] | 82.6 | 96.2 | 83.7 | |
| 2020 | Ganokratanaa et al. [40] | 98.5 | 95.5 | 87.9 | |
| 2021 | Maqsood et al. [41] | 45.0 | |||
| 2021 | Ullah et al. [42] | 85.53 | |||
| 2021 | Wu et al. [43] | 85.9 | 92.4 | ||
| 2021 | Qiang et al. [44] | 85.2 | 97.1 | 85.8 | |
| 2021 | Madan et al. [45] | 86.9 | |||
| 2021 | Tian et al. [46] | 96.5 | 84.30 | ||
| 2022 | EADN (Ours) | 93.0 | 97.0 | 97.0 | 98.0 |
| Method | UCF-Crime Dataset [5] |
|---|---|
| MIL-C3D with constraints [5] | 1.9 |
| Hasan et al. [15] | 27.2 |
| Lu et al. SCL [4] | 3.1 |
| C3D [22] | 2.8 |
| TSN-RGB [22] | 0.1 |
| TSN-Optical flow [22] | 1.1 |
| EADN (Ours) | 0.03 |
| Method | Parameter Count (in million) | Model Size (MB) | Latency/Per Sequence (s) |
|---|---|---|---|
| C3D [22] | - | 313 | - |
| VGG-19+multi-layer BD-LSTM [47] | 143 | 605.5 | 0.22 |
| Inception V3+ multi-layer BD-LSTM [48] | 23 | 148.5 | - |
| ResNet-50 + multi-layer BD-LSTM [42,49] | 25 | 143 | 0.20 |
| EADN (Ours) | 14.14 | 53.9 | 0.20 |
Publisher’s Note: MDPI stays neutral with regard to jurisdictional claims in published maps and institutional affiliations. |
© 2022 by the authors. Licensee MDPI, Basel, Switzerland. This article is an open access article distributed under the terms and conditions of the Creative Commons Attribution (CC BY) license (https://creativecommons.org/licenses/by/4.0/).
Share and Cite
Ul Amin, S.; Ullah, M.; Sajjad, M.; Cheikh, F.A.; Hijji, M.; Hijji, A.; Muhammad, K. EADN: An Efficient Deep Learning Model for Anomaly Detection in Videos. Mathematics 2022, 10, 1555. https://0-doi-org.brum.beds.ac.uk/10.3390/math10091555
Ul Amin S, Ullah M, Sajjad M, Cheikh FA, Hijji M, Hijji A, Muhammad K. EADN: An Efficient Deep Learning Model for Anomaly Detection in Videos. Mathematics. 2022; 10(9):1555. https://0-doi-org.brum.beds.ac.uk/10.3390/math10091555
Chicago/Turabian StyleUl Amin, Sareer, Mohib Ullah, Muhammad Sajjad, Faouzi Alaya Cheikh, Mohammad Hijji, Abdulrahman Hijji, and Khan Muhammad. 2022. "EADN: An Efficient Deep Learning Model for Anomaly Detection in Videos" Mathematics 10, no. 9: 1555. https://0-doi-org.brum.beds.ac.uk/10.3390/math10091555