
A Multi-Agent Approach for Self-Healing and RES-Penetration in Smart Distribution Networks


1
Engineering Consultants Group S. A. (ECG), Alexandria 21532, Egypt
2
Electrical and Control Engineering Department, College of Engineering and Technology, Arab Academy for Science and Technology (AAST), Abu-Kir Campus, Alexandria 1029, Egypt
*
Author to whom correspondence should be addressed.
Mathematics 2022, 10(13), 2275; https://0-doi-org.brum.beds.ac.uk/10.3390/math10132275
Submission received: 31 May 2022
/
Revised: 23 June 2022
/
Accepted: 27 June 2022
/
Published: 29 June 2022
(This article belongs to the Special Issue Advances in Reliability Modeling, Optimization and Applications)
Abstract
:Smart grid technology has gained much consideration recently to make use of intelligent control in the automatic fault-detection and self-healing of electric networks. This ensures a reliable electricity supply and an efficient operation of the distribution system against disasters with minimum human interaction. In this paper, a fully decentralized multi-agent system (MAS) algorithm, for self-healing in smart distribution systems, is proposed. The novelty of the proposed algorithm, compared to related work, is its ability to combine the zone and feeder agents, specified for system self-healing, with micro-grid agents. This enables the system to successfully achieve functions of fault locating and isolation along with service-restoration using expert rules while considering both operational constraint and load priorities. Meanwhile, managing the power flow and controlling the distributed generator (DG) contribution, in the considered network, is a bonus merit for the proposed algorithm. Hence, system self-healing as well as strengthening energy security and resiliency are guaranteed. The proposed algorithm is tested on a 22 kV radial distribution system through several case-studies with/without a DG wind-energy source. The employed agents are implemented in the Java Agent Developing Framework (JADE) environment to communicate and make decisions. Power system simulation and calculations are carried out in MATLAB to validate the agents’ decisions.
Keywords:
smart distribution systems; automatic fault detection; service restoration; multi-agent system; renewable energy sourceMSC:
68T201. Introduction
Damages or even degradation of distribution system devices may result in interruptions to electrical power services, great inconveniences to customers, and/or severe financial and productivity losses to factories [1]. To ensure a high-quality and secure supply of electrical power, much consideration is directed into what is called the “Smart Grid”, which guarantees safe, reliable, and efficient operation of electrical distribution systems’ components. A smart grid includes a variety of efficient energy sources, renewable energy resources, and smart appliances, as well as advanced metering infrastructure [2]. Energy management measures, electronic power conditioning, and intelligent control of the production and distribution of electricity are important aspects of the smart grid to maintain automated fault-detection processes and possess self-healing capabilities [3].
Using smart grid solutions, utilities can remotely monitor power equipment to achieve [4]:
- Fast fault identification, fault location detection, and fault isolation;
- Electricity flow reconfiguration to re-energize the out-of-service zones with minimum human intervention, depending on the level of automation;
- Optimum service restoration, thus minimizing the number of outage zones while satisfying system and load constraints. This guarantees fast recovery and reduces the outages’ duration and the number of affected customers.
Various studies have been carried out to solve the service restoration problem via centralized optimization schemes which read the whole system data and process them as a lump sum [5,6]. These approaches include heuristic algorithms [7], mathematical programing [8], fuzzy logic [9], knowledge-based expert systems [10], etc. However, the implementation of centralized control in large size systems is quite challenging, owing to the large amount of data to be processed and the huge number of control and decision variables determined by the central controller (CC). In such systems, the centralized approaches are subject to a single-point-of-failure disaster (i.e., the whole system collapses when the CC fails) [11].
Decentralized approaches are introduced to solve the centralized scheme limitations and to focus mostly on parallelizing the solution of the self-healing problem. In other words, in the decentralized restoration approach, the control and protection actions are taken within each distribution system or primary substation individually; then, the entire system performance results from the combination of these individual behaviors [11]. Multi agent systems (MAS)-based control schemes have emerged as a liable and robust technology for achieving decentralized, distributed control in different applications, ranging from small systems to large ones [12,13,14]. This work studies decentralized MAS-based self-healing solutions since, currently, MAS represents the main platform of autonomous solving, parallel operations, and distributed processing in power systems [13].
MAS has been studied to fulfill distribution systems’ needs for fault diagnosis and service restoration and monitoring as introduced in related work in the literature [4,14,15,16,17,18,19,20,21,22,23]. In [18], the MAS design includes two main agents: a bus agent and a facilitator agent. Bus agents communicate together to complete the self-healing process, while the facilitator agents organize and facilitate these negotiations. On the other hand, in [19], three agent types are employed: switch, load, and generator agents. In both studies, fault identification and service restoration were achieved; however, a large number of agents were employed, i.e., an agent for each bus in [18], while an agent for each switch in [19], thus increasing the restoration time. In [20,21,22], efficient MAS-based self-healing approaches were proposed. A belief–desire–intention (BDI)-based MAS is proposed in [20], where the BDI mental architecture is adopted for restoration in distribution systems. In [21], an automatic fault isolation and restoration solution for distribution systems, using JADE-based multi-agents, is introduced, while in [22], a complete MAS design was carried out in which Q-learning was used to restore the faulted zones. A strategic plan for energy restoration is proposed in [23], aiming at maximizing the number of loads restored through switching. All approaches in [18,19,20,21,22,23] succeeded in achieving self-healing purposes, i.e., fault locating, isolation, and efficient service restoration. However, none of these studies considered the effect of DG penetration in smart grids, which is an essential capability for maintaining a secure power supply [24,25]. On the contrary, DG application was considered in [4,14,15,16,17], where MAS was designed for service restoration. Nevertheless, [4,14,15,16] lacked the capability of fault locating and isolation, while [17] did not take into account load priorities or different restoration scenarios.
In this paper, a fully decentralized self-healing MAS algorithm, based on expert system rules, is proposed to overcome the previously discussed limitations and shortages of related studies in literature. The proposed approach masters the following capabilities:
- It merges the distribution feeder MAS (zone and feeder agents) and micro-grid MAS (manager, load, and DG agents) to successfully accomplish the self-healing functions and control the DG contribution;
- Unlike related studies, which do not consider fault locating and isolation, the proposed scheme can efficiently achieve all self-healing functions. This includes fault detection, locating, and isolation, as well as service restoration;
- Service restoration takes place using the proposed algorithm while considering operation constraints, loads priorities, and the critical importance of different zones, which are not always taken into account in other relevant works;
- Unlike related studies, which do not consider DGs penetration, the proposed approach features an additional capability of managing energy from RESs integrated with distribution systems to guarantee a sustainable power supply, even during faults;
- Robust and efficient performance under different restoration scenarios and variable load conditions.
Hence, the primary capability of the proposed algorithm is guaranteed, which is self-healing in distribution systems in accordance with system constraints. Meanwhile, controlling the DG contribution is an extra merit of the proposed approach to maintain a secure power supply, especially during faults.
To verify the effectiveness of the proposed algorithm, it is investigated on a 22 kV radial distribution system for different individual cases of restoration and load levels with/without a DG wind-energy source. The considered power system is simulated using MATLAB/Simulink, while the employed agents are implemented in the Java Agent Developing Framework (JADE) environment. For further validation of the proposed algorithm, a multiple-situation case study is discussed. The latter includes different scenarios of restoration, fault locations, load conditions, and DG existence, all in a single case-study and one simulation run. Finally, the superiority of the proposed approach is demonstrated by comparing its functionalities by other MAS-based self-healing approaches in related work.
This paper is organized as follows. Section 2 presents the problem formulation and operation constrains for the considered self-healing problem. The design of the adopted agents is described in Section 3, while the proposed MAS methodology is illustrated in Section 4. The latter demonstrates the proposed fault identification and isolation algorithm as well as the proposed service-restoration procedure and backup plan. In Section 5, the simulation study of the investigated system under different cases is presented and the results are shown and analyzed. Moreover, a multiple-scenario case study is presented for further validation of the proposed work. In Section 6, the results of the proposed approach are discussed and its capabilities versus others in related work are listed to verify its superiority and effectiveness. Finally, the work’s conclusion is presented in Section 7.
2. Problem Formulation and Constraints
Self-healing aims at increasing the total number of restored critical loads while minimizing the total switching operations based on system voltage and current constraints. Moreover, the network radial configuration after restoration should not be violated. Finally, constraints of micro-grid and DG penetration should be considered. These goals can be expressed in the form of a number of objectives and constraints as follows.
2.1. Objectives
The main objectives are:
Objective 1: Maximizing the number of restored loads while ensuring that loads with higher priorities are served first [5].
where is the bus number, Li is the load at the bus, is the status of the load at OK keep it italic the bus (i.e., 1 for the restored load and 0 for the unrestored one), and is the priority or importance level of the load at the bus.
Objective 2: Minimizing the number of switching operations to reduce both the time and the operational cost required for the restoration process [21].
where is the total number of switches, is the status of the switch in the restored network (i.e., 1 for the closed switch and 0 for the opened one), and is the status of the switch immediately after the fault has been isolated.
Objective 3: Minimizing losses during the restoration time.
where is the total number of branches, is the current in the branch, and is the resistance of the branch.
2.2. Constraints
The main constraints are:
Constraint 1: Voltages at all buses should be kept within limits.
where is the voltage at the bus, and and are the maximum and minimum acceptable bus voltages, respectively. The nodes’ voltages should be kept within 0.9 and 1.05 p.u. limits, based on the ANSI C84.1 standard [26].
Constraint 2: The currents in all branches should be less than the maximum permissible loading of the line.
where is the current in branch j and is the maximum line current.
Constraint 3: The radial configuration constraint, i.e., the configuration of the resulting post-fault network, must be radial to be used in the actual power system operations. To guarantee a radial configuration, a given load bus should be fed by only one branch, i.e., only one switch at any given instant, as given by Equation (6) [21]:
where is the number of switches supplying power to a bus at any given time.
If the number of switches feeding the bus is more than one, this means that the load bus is supplied from two sources, so radial configuration is not achieved. Hence, Equation (6) is given to show that the number of switches is to be 1 or less, i.e., 0 to guarantee radial configuration; 1 when the load is supplied from one way and 0 means the load is not supplied.
Constraint 4: The micro-grid constraint is described by the equality equation shown in Equation (7), i.e., the total micro-grid generation and the load demand should satisfy a balanced situation at all times. This includes whether the utility grid injects or absorbs energy during unbalanced periods [27].
where is the active power of the DG, is the active power delivered from/to the utility grid to maintain the power balance within the micro-grid, taking into account grid losses, and is the active demand required by the load in the micro-grid. and are the number of DG units and load number within a micro-grid, respectively.
Constraint 5: Upper and lower limit constraints of each DG output active power.
3. Agents’ Design of the Proposed MAS Approach
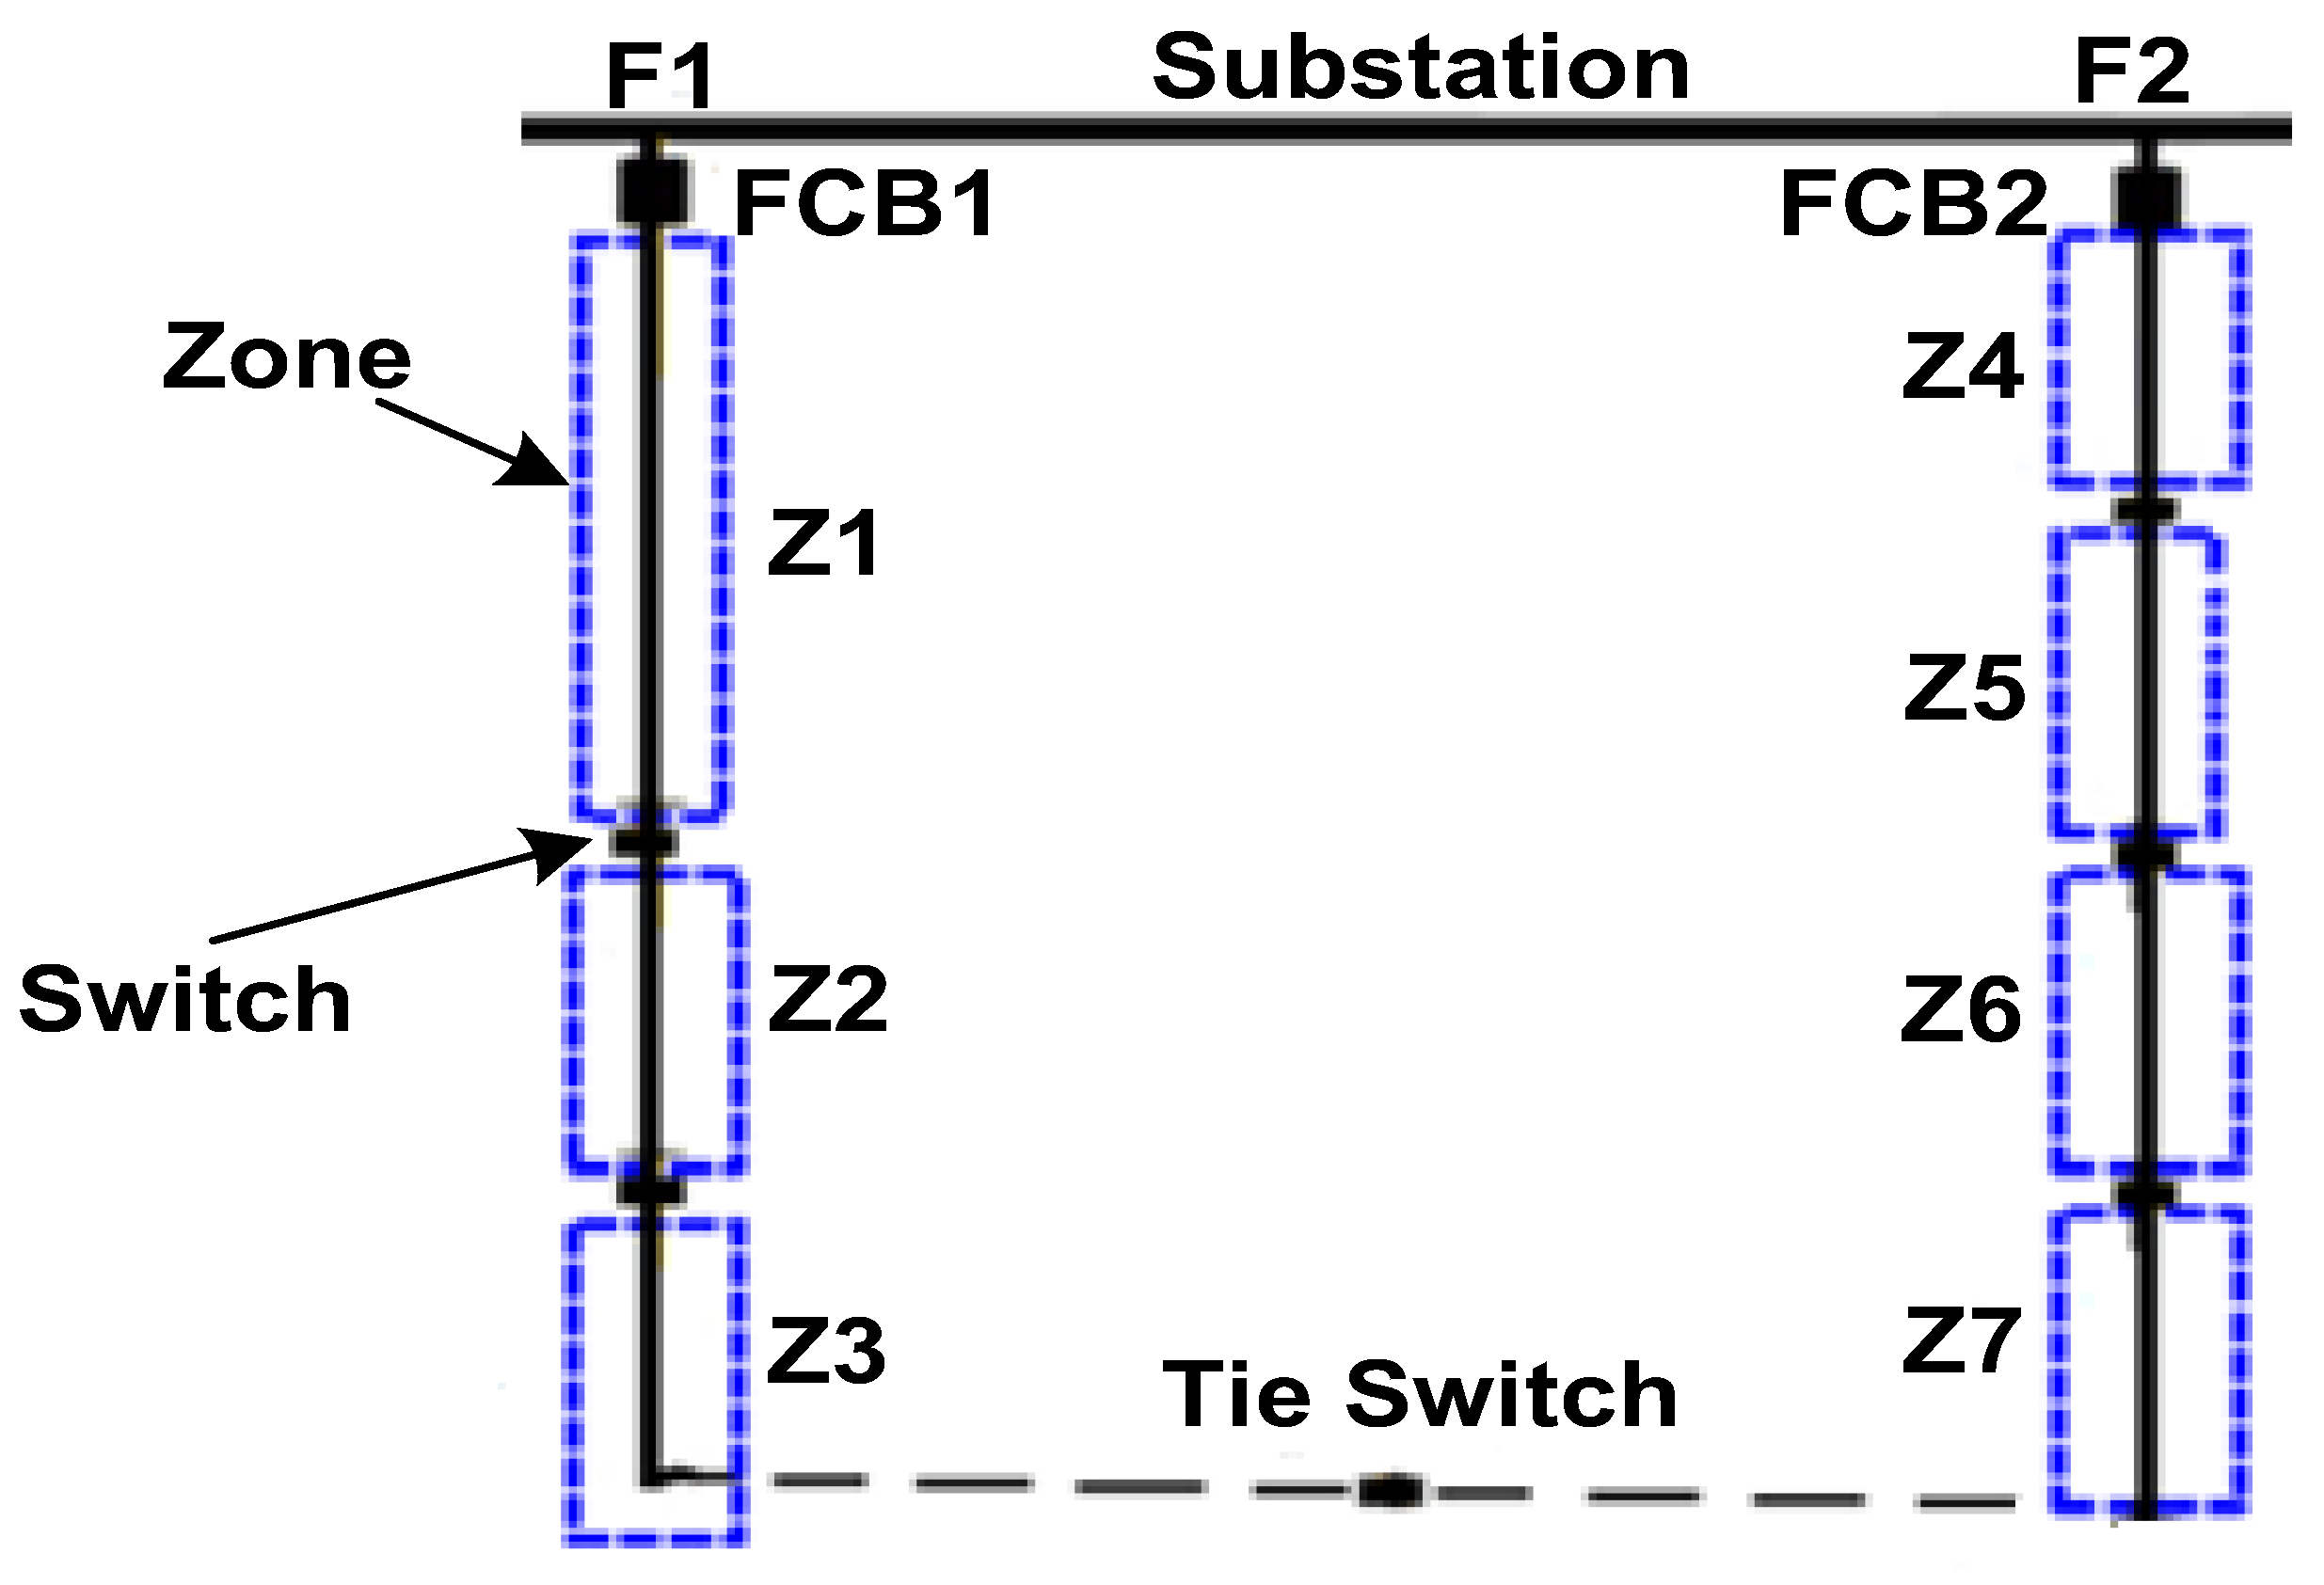
In the proposed MAS, the hierarchical distributed MAS framework is used in which each distribution feeder is divided into a number of zones based on the location of protection devices. As shown in Figure 1, each considered zone is a section bounded by two or more switches without any switch included inside it. The boundaries between neighboring feeders would be tie switches that would aid in the restoration process during a fault. Regarding the applied agents, there are two main sets: the first set of distribution feeder agents is responsible for fault locating and service restoration, while the second set of micro-grid agents assists in the restoration process as well as in maintaining energy balance and controlling DG penetration into the micro-grid.
3.1. Distribution Feeder Agents
Two layers of agents are used to represent distribution feeders, which are the zone agent and the feeder agent, as follows:
3.1.1. Zone Agent
The zone agent (ZA) is the first layer, charged with monitoring and continuous tracking of the corresponding zone voltage and current, making simple calculations, and implementing control actions. In order to reduce the required communication and delay time, the algorithm allows the zone agents to communicate to their feeder agent solely rather than communicating with one another. The ZAs of the out-of-service areas are responsible for calculating the demand, while the ZAs of healthy feeders are responsible for calculating the remaining capacity. Each ZA identifies itself as one of the following:
- Faulted Zone Agent (FZA);
- Helped Zone Agent (HZA).
The FZAs are the agents of the zones which lost power due to fault occurrence, while the HZAs are the agents of the zones in the backup healthy feeder along the restoration path. For example, in Figure 1, for a fault in Z1, the FZAs are Z1, Z2, and Z3, while the HZAs can be Z4, Z5, Z6, and Z7. Before fault occurrence, all agents have the same nature, as they monitor the readings of the measuring devices located at their zones’ boundary switches. However, when a fault occurs, each agent is capable of identifying the problem and starts performing its role, as will be explained in detail in Section 4.
3.1.2. Feeder Agent
The feeder agent (FA) is the second layer committed to negotiations in order to determine the fault location and create the appropriate restoration plan. Each feeder agent communicates only with its neighbored feeder agents connected with them by tie switches. Then, it makes the appropriate decision and sends the control actions to the appropriate zone agent for service restoration. Hence, the restoration problem is solved to achieve optimal post-fault configuration, as explained below.
The FA sends proposals to the neighbor FAs, which have the capability of supplying power to the faulted downstream zones via tie switches. The neighbor FAs are aware of their corresponding zones’ power load and can answer this proposal if they can supply additional loads. Once the FA receives the net power of fault-free zones that are ready for restoration and also neighbor FA’s extra spare power, an optimal load restoration decision can be achieved by satisfying the restoration constraints. Once the zones that can be restored are known, the load restoration process can be started via a command sent by the FA to the appropriate zone agents to connect the two feeders. Each FA identifies itself as one of the following:
- Faulted Feeder Agent (FFA);
- Helped Feeder Agent (HFA).
The FFA is the feeder agent of a faulty feeder such as F1, while the HFA is the feeder agent of the neighboring feeders, such as F2, as illustrated in Figure 1.
3.2. Micro-Grid Agents
Micro-grids are considered an important research topic for power systems at the distribution level [28]. They consist of DGs, energy storage devices, loads, and communication, monitoring, and protection devices. Today, there is a big interest in micro-grids with DGs, particularly for on-site power generation for businesses and homeowners, as they provide better power quality, high reliability, and less environmental problems. Recently, the use of MAS in micro-grid applications is quite appealing. These applications include agent-based market operation, fault protection schemes, and distributed energy management systems.
In the proposed work, a MAS design for the micro-grid is developed to help in the self-healing process and control the contribution of DG. The latter is applied to offer the power required to restore as many faulted zones as it can afford. In the proposed architecture, wind energy resource is used as the applied DG, since it is a clean power source that can supply adequate power levels at a reasonable price.
Micro-grid MAS consists of three types of agents, as follows:
- Load agent: It contains the loads information in the micro-grid, i.e., power consumption, load number, and load priority according to load criticality;
- DG agent: It is responsible for storing the related DG information as well as monitoring and controlling the contribution of DG power;
- Manager agent: It is considered the heart of the micro-grid operation since it monitors all system conditions, whether loads or DGs. It receives information from the load agent and DG agent, then calculates the spare capacity. The feeder agent makes negotiations with the manager agent to obtain the amount of power which can be supplied by the DG in the process of service restoration.
4. Methodology of the Proposed MAS Approach
In this section, the proposed MAS-based approach is discussed in detail to achieve the self-healing objectives mentioned in Section 2, taking into account the stated constraints. It consists mainly of fault locating and isolation algorithm followed by the service restoration algorithm and a backup plan.
4.1. Fault Locating and Isolation Algorithm
A key aspect of the self-healing issue, when applied to smart distribution systems, is the need to identify the fault location and isolate it. Each ZA obtains measurements from the measuring devices, then calculates the current injected into the area between this ZA and the upstream or downstream ZAs using Kirchhoff’s current law, as shown in Equation (9):
where is the current usage of zone j, defined as the difference between the sum of currents entering the zone (Iinput) and currents leaving the zone (Ioutput). By continuous monitoring to the nature of zone current changes (, each ZA can determine whether there is a fault in its zone or not. Changes are calculated using
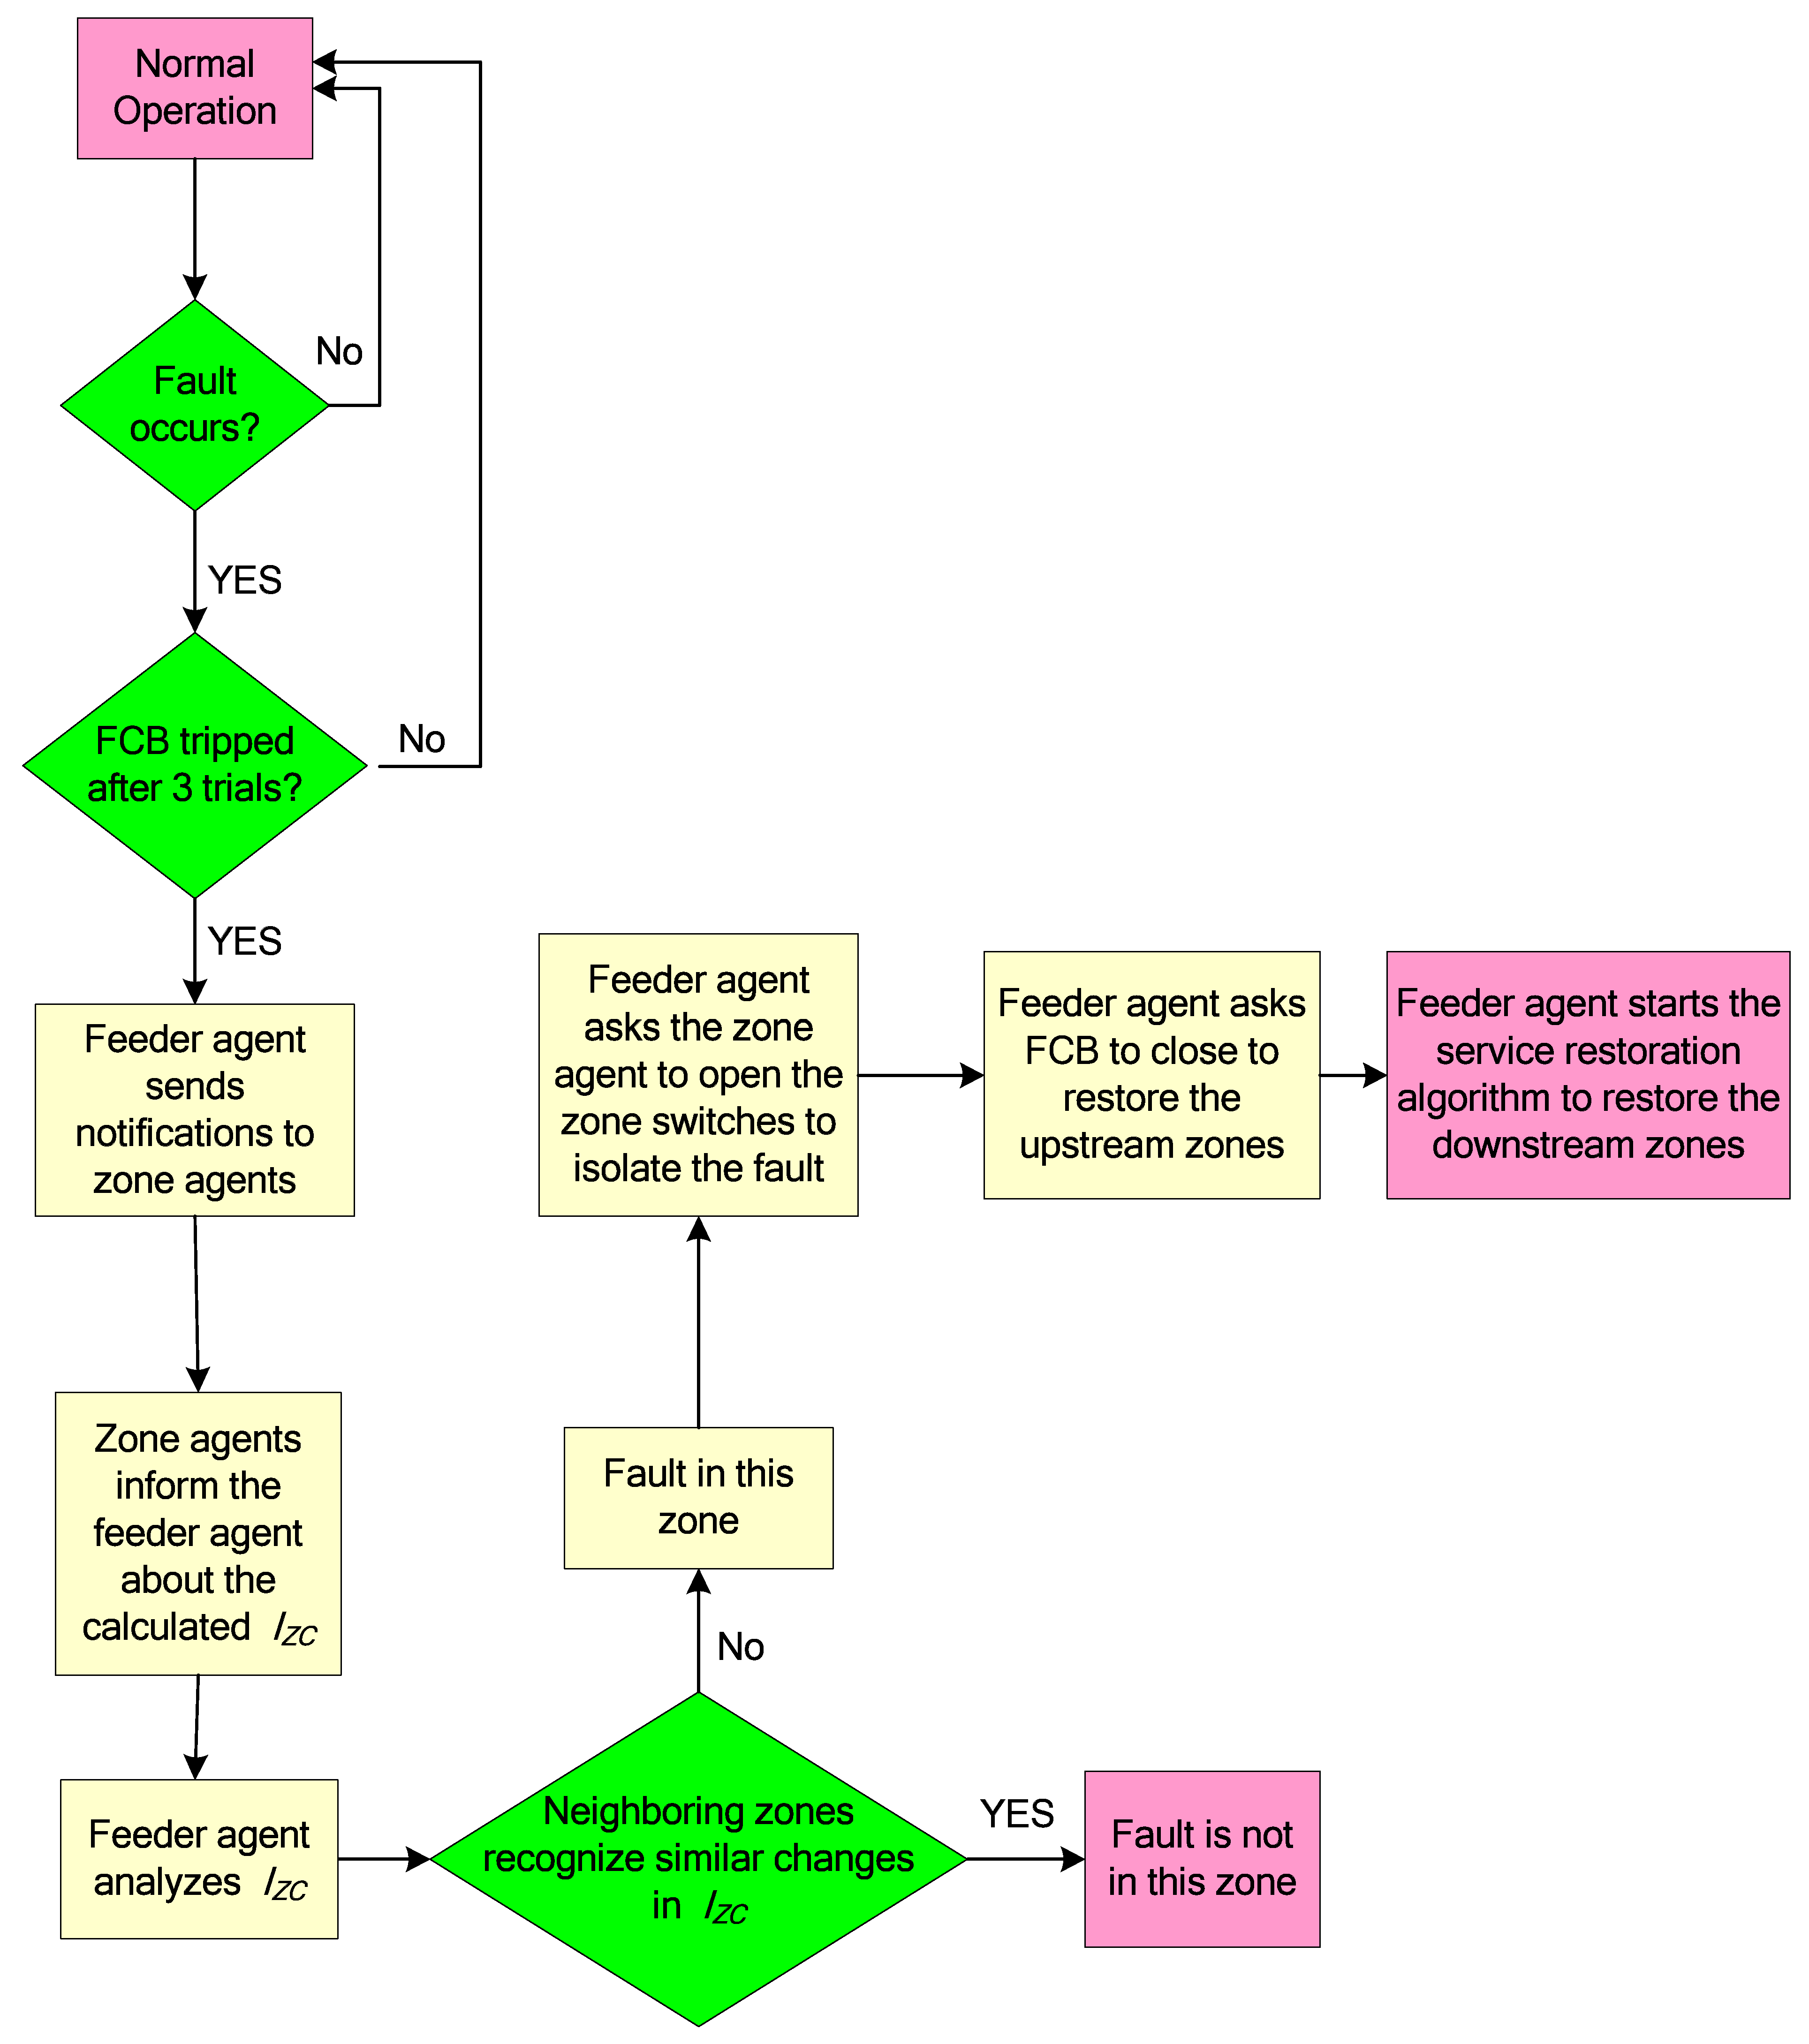
The flowchart of the proposed fault locating and isolation algorithm is shown in Figure 2. For a single fault at a time, steps of this algorithm are listed as follows,
- Each ZA computes its current usage using Equation (9) and continuously updates it using the information from measuring devices;
- When there is a fault in the feeder, the feeder circuit breaker (FCB) goes for its three trials and the FA informs its ZAs to be aware of the trials;
- After FCB tripping, the FA notifies its ZAs about the trip;
- The ZAs exchange the changes in their drawn current with their FA. This current change is continuously calculated by the ZAs using Equation (10) before and during the FCB trials;
- The FA studies for each zone. If a big difference between the of a certain zone and that of the neighboring zones exists, then the fault location is detected within this zone;
- FA starts communicating the downstream ZA of the zone in which the fault is diagnosed to confirm fault isolation by asking the switching devices to open and separate the faulted downstream zones;
- Then, the upstream service zones are restored by the closure of the FCB;
- Finally, a service restoration algorithm is applied to restore the downstream faulted service zones, which will be described in the next subsection.
4.2. Service Restoration Algorithm
After fault locating and isolation, the service restoration plan is started, However, the search space of the problem has many possible switching combinations which increase with the increase of the networks’ dimensions. As a result, the majority of works in this area use expert algorithms to achieve service restoration objectives and power flow control while considering system operational constraints, zones’ priority, and loads’ criticality. In this work, an expert-based decision-making algorithm has been proposed to carry out the agents’ decisions and control actions.
Regarding the proposed service restoration procedure, four types of restoration are included, as follows:
- Group Restoration: The outage loads are restored as a single group with one switching action;
- Zone Restoration: It takes place if group restoration is not valid since the total capacity of outage zones cannot be fulfilled by a single HFA. In this case, if the total available capacity of HFAs is more than outage zones capacity, then outage zones are restored by more than one switching action. Suitable restoration paths are specified using the zone/switch relationship table, as explained later [20];
- Zone Restoration with Load Transfer: It takes place if the HFAs’ total available capacity is less than the outage zones’ capacity. In this case, some zones are transferred from the main HFs to their neighbors to restore the remaining unrestored zones;
- Zone Restoration with Load Shedding: In this case, the least-priority zones are shed to restore the remaining unrestored zones with the remaining limited capacity.
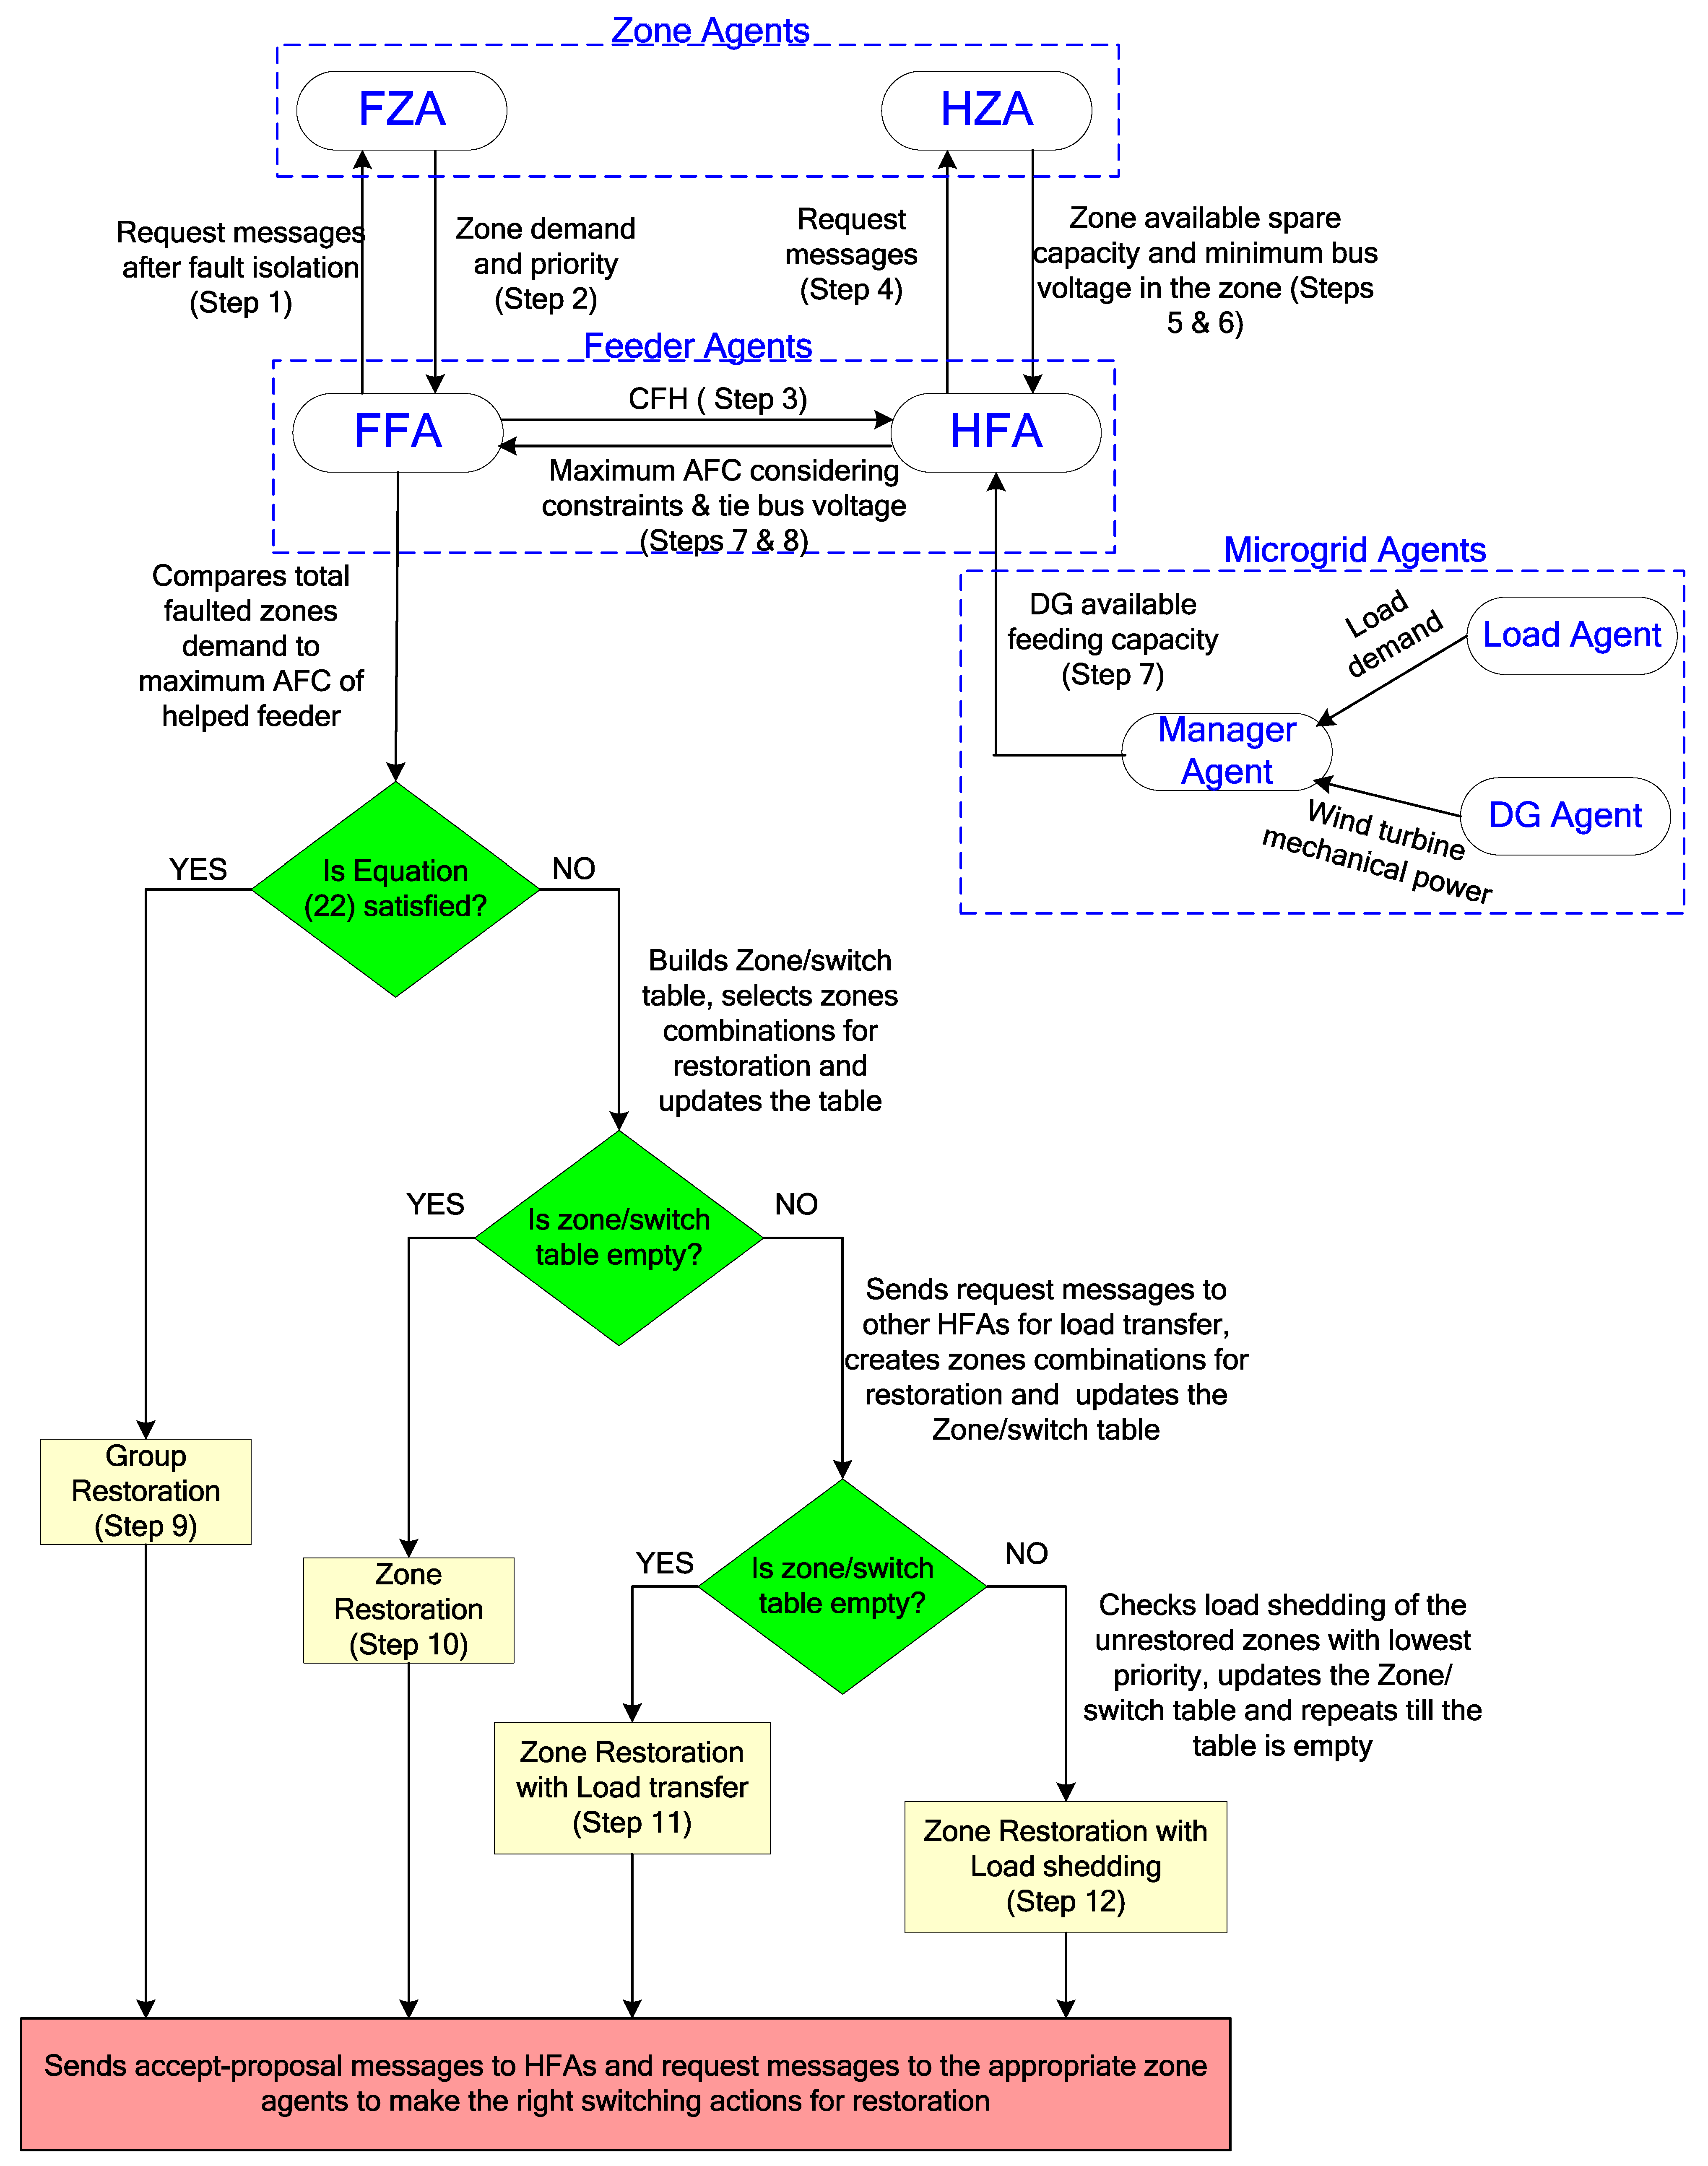
Based on the problem objectives, the proposed restoration algorithm implements a multi-step procedure while avoiding infeasible solutions as follows:
1. The FZA identifies itself once its faulted zone loses the power due to fault isolation. It receives a request message from the FFA to send the demand and the priority of its zone.
2. The FZA calculates its zone demand and priority, according to Equation (11), to send this information back to the FFA:
where and are the priority and demand of load j in zone i, respectively, and is the total number of loads in zone i.
3. The FFA receives the previous information and starts the negotiations by sending call for help (CFH) messages to the HFAs.
4. Each HFA sends a request message to its corresponding HZA, which is the agent of each zone in the backup healthy feeder along the restoration path. Each HZA is requested to send the available spare capacity of its zone branches and the minimum bus voltage of the zone buses.
5. The HZA calculates the spare capacity using Equation (12):
where Is(j) represents the available spare capacity of each zone before it is overloaded, Imax(j) is the upper limit current in branch j, and I(j) is the magnitude of the current that flows in branch j.
6. HZA replies to the corresponding HFA with a message containing the zone available spare capacity and the minimum bus voltage within the zone. In case a zone has more than one branch, the minimum spare capacity of its branches is sent. Additionally, a zone with more than one bus sends the lowest bus voltage magnitude.
7. After receiving the message, the HFA calculates the following:
- First, the maximum spare capacity of the restoration path is computed without violating both current and voltage operating constraints as follows [29]:where j is the order of the zone in the restoration path, Vo is the lowest bus voltage magnitude received from the zone agent, is the minimum allowable voltage magnitude in the network (0.95 p.u.), is the series impedance of the restoration path, is the maximum spare capacity of the restoration path with respect to the current limit constraint, and is the maximum spare capacity in the restoration path with respect to the voltage limit constraint and the Is of the maximum spare capacity of the restoration path, without violating both current and voltage operating constraints.
- Then, using the computed Is, the HFA calculates the available feeding capacity (AFC) as follows:
Including the voltage limit (VL) ≥ 0.95 p.u., the maximum AFC for the helped feeder will be:
- In case of DG penetration, the HFA sends to the micro-grid manager agent asking for the DG available feeding capacity . To calculate the latter:
- i
- The DG agent calculates the mechanical power provided by wind turbine using Equations (18) and (19) [30]:where is the air density, R is the wind turbine radius, is the wind speed, w is the rotation speed of the wind turbine, is the tip speed ratio, is the pitch angle, and is the wind energy capture coefficient, and it is the function of the tip speed ratio and the pitch angle;
- ii
- The manager agent receives information from the micro-grid load agent about the load consumption and from the DG agent about the DG power level i.e., wind power ;
- iii
- Then, it calculates the DG available feeding capacity ,where is the summation of power consumption of micro-grid loads;
- iv
- Finally, the manager agent informs the HFA about this spare power to contribute to the service restoration process.
8. The HFA calculates the new available AFC according to Equation (21), then sends a proposal message to the FFA that includes its AFC and tie bus voltage:
9. Group Restoration
First, the FFA checks for group restoration by comparing the AFC with the total demand of the downstream faulted zones:
where is zone j load demand, is the total number of faulted zones and is the total number of HFAs.
If the condition in Equation (22) is satisfied, the FFA implements group restoration by restoring all the downstream faulted zones through one switching operation, i.e., group restoration. In case more than one helped feeder has enough capacity, the FFA agent will send an accept-proposal message to the HFA of the helped feeder with the highest AFC. A request message is then sent from FFA to the FZA that neighbors the selected helped feeder, asking it to close its tie switch to complete faulted zones restoration.
10. Zone Restoration
If the condition in Equation (22) is not fulfilled, the FFA implements zone restoration:
- FFA starts to create all possible downstream faulted zones’ combinations that can be restored through multiple switching operations [20]:where the set represents all the possible zone combinations for zone transfer; is the collection of j adjacent zones bounded by two or more switches at least one of which is a tie switch.
After the elements in are identified, the FFA builds its zone/switch relationship table [20]. The information in this table is the zones in each combination , the bounded switches for each combination , the load demand in each combination according to Equation (24), and the equivalent priority index for each combination according to Equation (25):
- FFA compares the of HFAs with the combinations of ; then, after checking all available possibilities, the FFA does the following:
- Sends accept-proposal messages to the HFAs that will be used in the restoration;
- Places tie switches between the feeder agents with accepted proposals and the combinations selected for restoration in a switch-to-be-closed list;
- Places the bounded sectionalizing switches of the selected combinations in a switch-to-be-opened list in order to satisfy the radial constraint;
- Updates the zone/switch relation table.
- The FFA checks whether all zones have been restored (i.e., the table is empty) or not. If the table is empty, the FFA sends request messages to the appropriate zone agents, asking them to open their switches, included in the switch-to-be-opened list, in order to separate the outage area and also to close their tie switches, included in the switch-to-be-closed list, for restoration.
11. Zone Restoration with Load Transfer
At the end of the previous step, if the table is not empty, FFA sends request messages to the HFAs neighboring the remaining unrestored zone combinations. The request message contains the load demand required for the remaining unrestored zone combinations.
- The request messages ask the HFAs to start negotiations with their neighbors (other helped feeder agents) to find another spare power using Load transfer. Thus, Load Transfer is carried out to provide additional AFC and restore the remaining faulted zones combinations.
- The main helped feeder selects its zones to be transferred to the neighboring helped feeders according to Equation (26):
- After deciding on the zones to be transferred to a neighboring helped feeder, the HFA sends a proposal message to FFA agent with its new AFC after Load Transfer.
- After HFAs reply to FFA with their new AFC, and the FFA repeats step 10.
The FFA checks if all zones are restored. If the table becomes empty, the HFA receives an accept message from the FFA; then, it sends a confirm message to neighboring HFA. Moreover, it sends a request message to the appropriate zone agents asking them to open the bounded sectionalizing switches included in the final switch-to-be-opened list and to close the tie switches included in the final switch-to-be-closed list to complete the Load Transfer to the neighboring helped feeder.
12. Zone Restoration with Load Shedding
At the end of the last step, if the table is not empty, the FFA checks the load shedding of the zones with the lowest-priority zone index in the remaining unrestored zone combinations and checks whether all zones have been restored or not. This is repeated until the zone/switch relationship table becomes empty; then, it implements the switching actions required to complete the restoration process.
The role of the proposed approach agents and the proposed procedure steps are summarized in the demonstrative diagram shown in Figure 3.
4.3. Backup Algorithm in Case of Communication Link Failure
In the proposed algorithm, there are two levels of communication between agents. The first one is between the feeder agent and its zone agents, while the second one is between the FFA and the HFA. No communication messages are exchanged between zone agents to reduce messages number, thus reducing the restoration time.
System reliability is essential; thus, a backup plan, in case of communication failure between any two agents, is mandatory to proceed in the restoration process. The algorithm has the knowledge of the expected time for exchanging messages between two agents; thus, if this time is exceeded, the receiving agent will notice this and modify its algorithm to solve the problem and continue restoration.
In the backup plan, if one zone agent loses communication with its feeder agent, it can change the communication route. It sends its message to its neighboring zone agent, which transfers it to the feeder agent, then forwards the reply from the feeder agent to the zone agent with the communication problem. Similarly, if a feeder agent loses the communication with one of its zone agents or another feeder agent, it will change the message route. The message will be sent to its neighboring zone agent, which will forward this message to either the zone agent or the other feeder agent, and then send the reply back to the troubled feeder agent.
5. Simulation Cases and Results
To demonstrate the effectiveness of the proposed restoration technique, it is tested under eight different simulation cases. For further validation, a multiple-situation case study, with different scenarios of fault locations, load levels, and DG existence, is simulated and discussed. To calculate the required power for restoration, the pre-fault demand of the zones is considered.
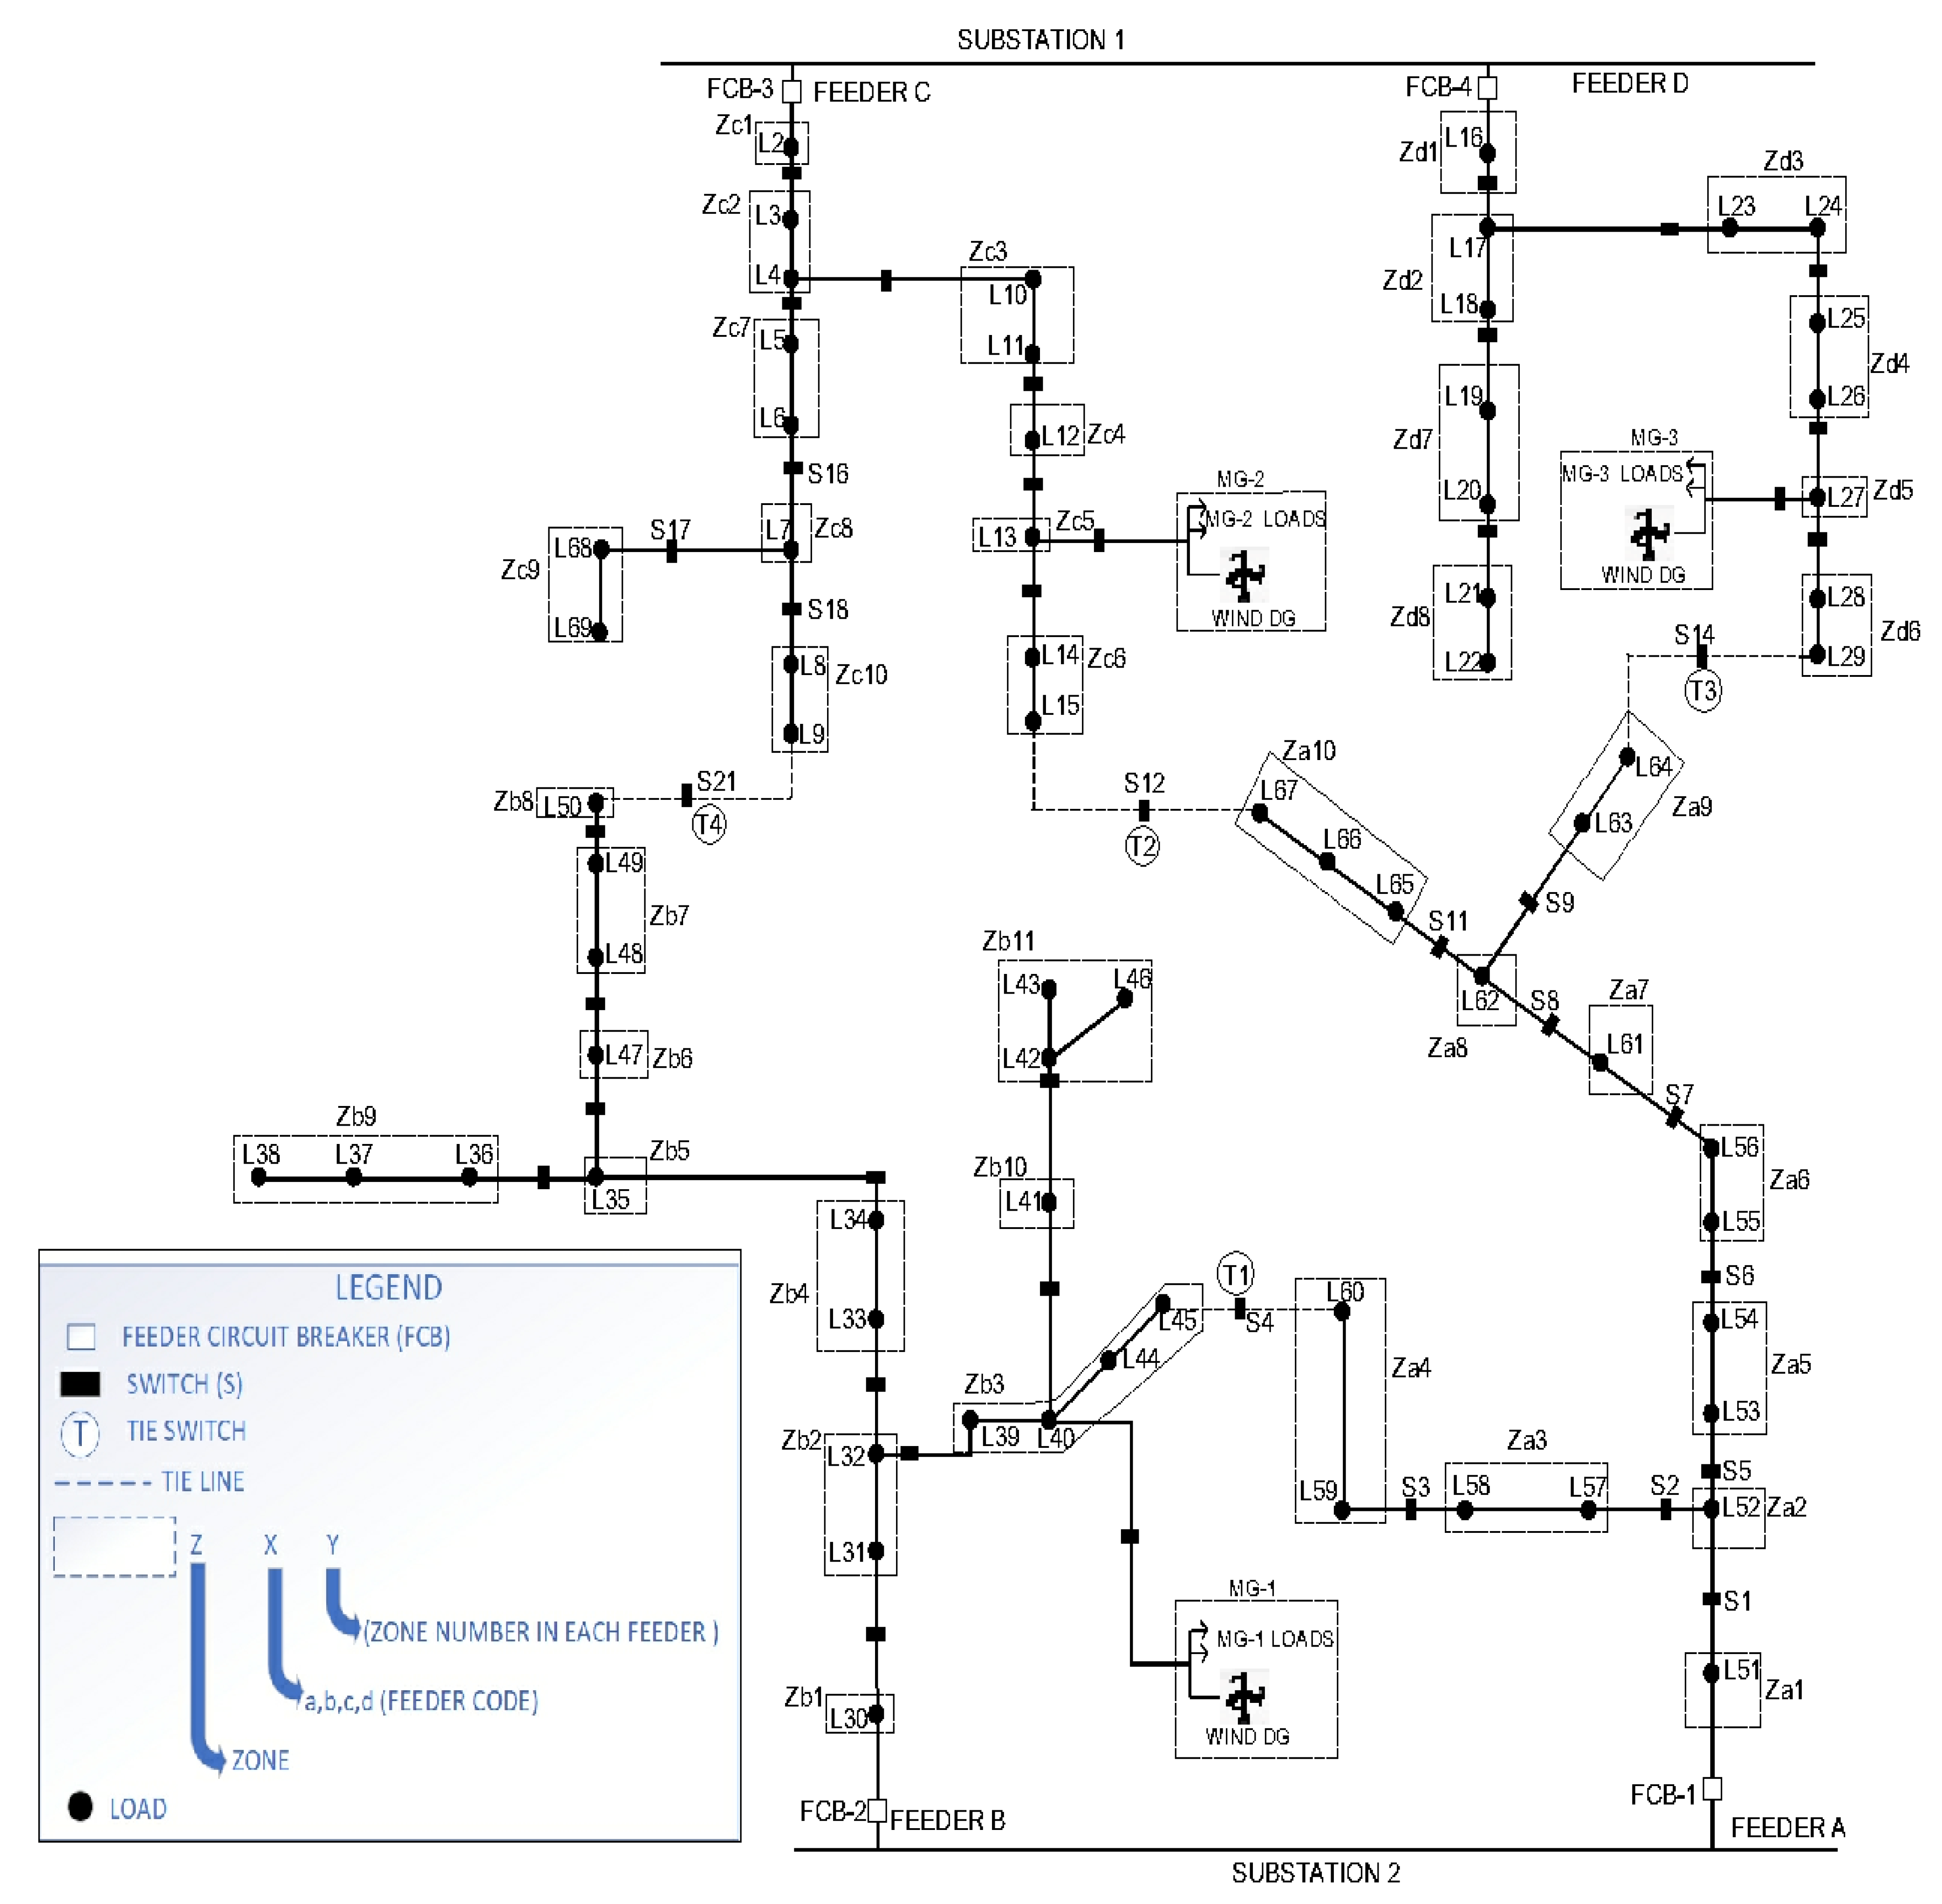
The proposed algorithm is tested on a 22 kV radial distribution system with a configuration shown in Figure 4 [31]. This system has 2 substations, 4 feeders, and 70 nodes, and the distribution model is created in MATLAB. The MAS is implemented in JADE, which enables the agents to communicate together according to the FIPA standards [32]. Eclipse is used for java agent development and an interface “MACSIMJX” is used to implement data transfer between JADE and MATLAB [33]. To check the agents’ decisions, power flow calculations in MATLAB are carried out after restoration to check current and voltage limits.
5.1. Different Restoration Simulation Cases
For the validation of the proposed self-healing algorithm, it is investigated under different scenarios of restoration: group restoration, zone restoration, zone restoration with load transfer, and restoration while considering zone priority and load shedding. To show the importance and the effect of DG existence, the previous cases are simulated again while adding a wind DG to the distribution system.
For each case, Table 1 shows fault location, loading period, faulted zones and their total demand, DGs existence and their AFCs, helped feeders AFCs and tie voltages, switching actions and number of switching operations, minimum voltage at restored zones’ buses, and load shed for each case.
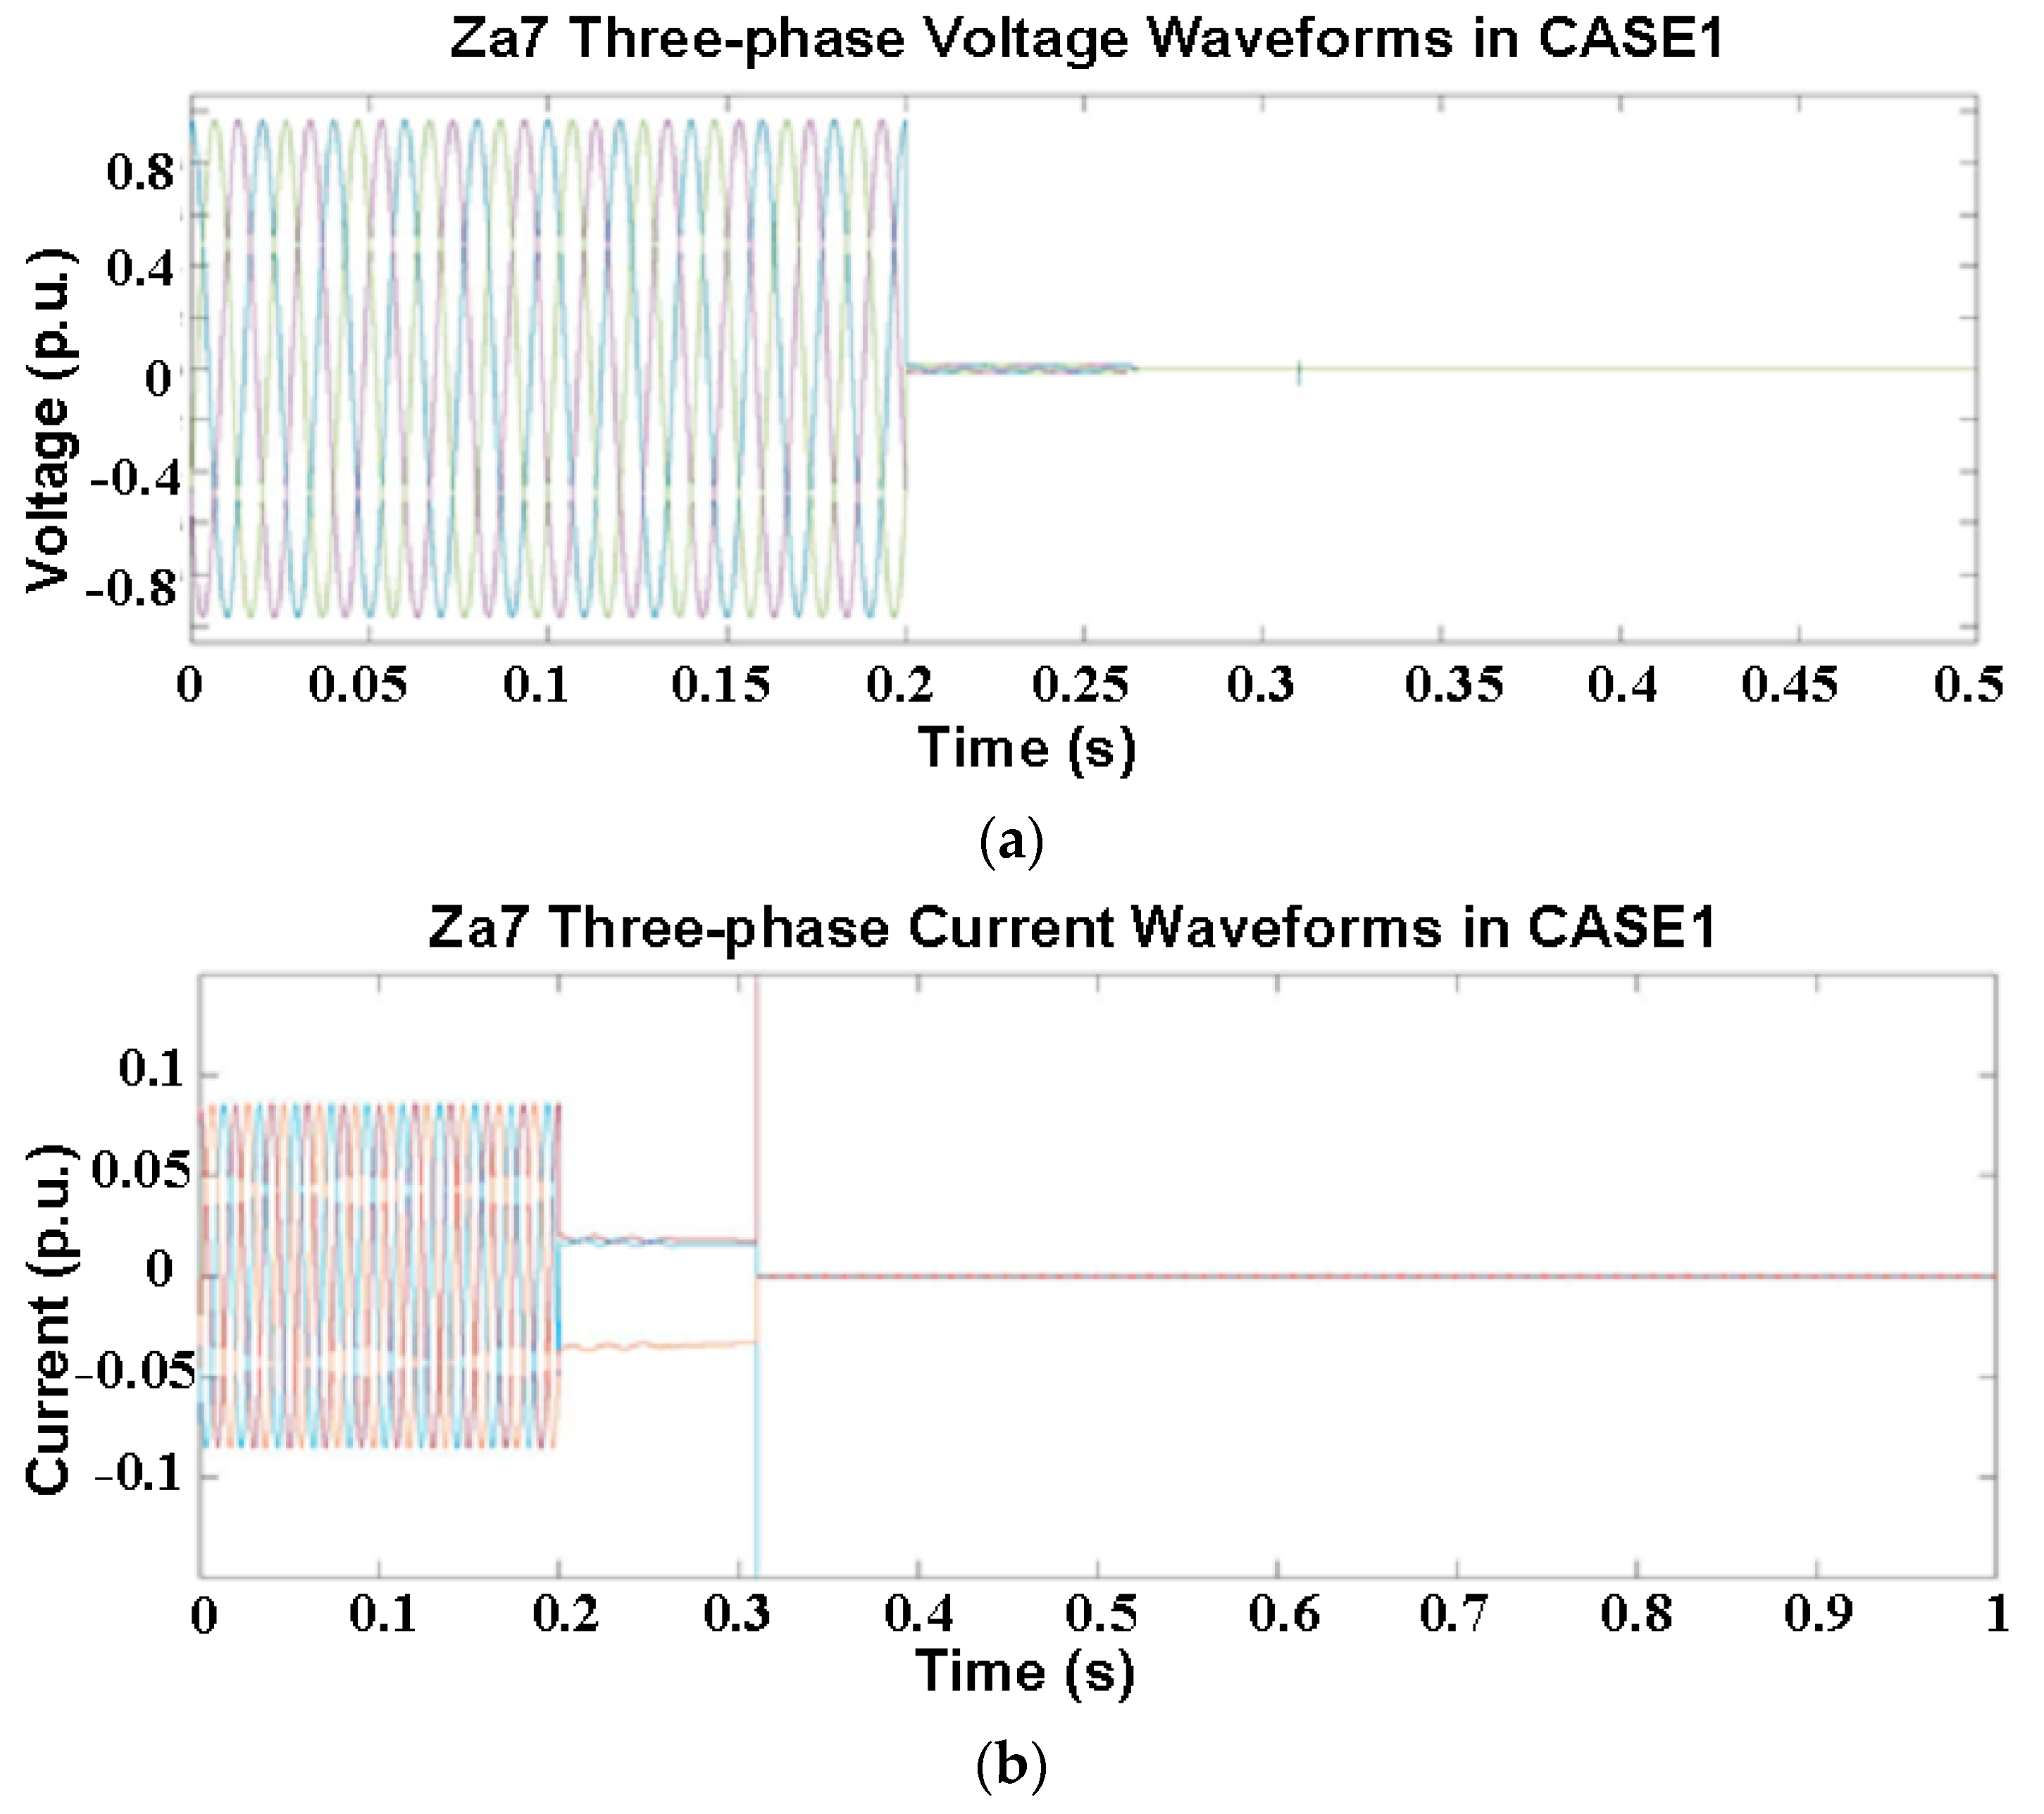
5.1.1. CASE 1: Group Restoration without DG
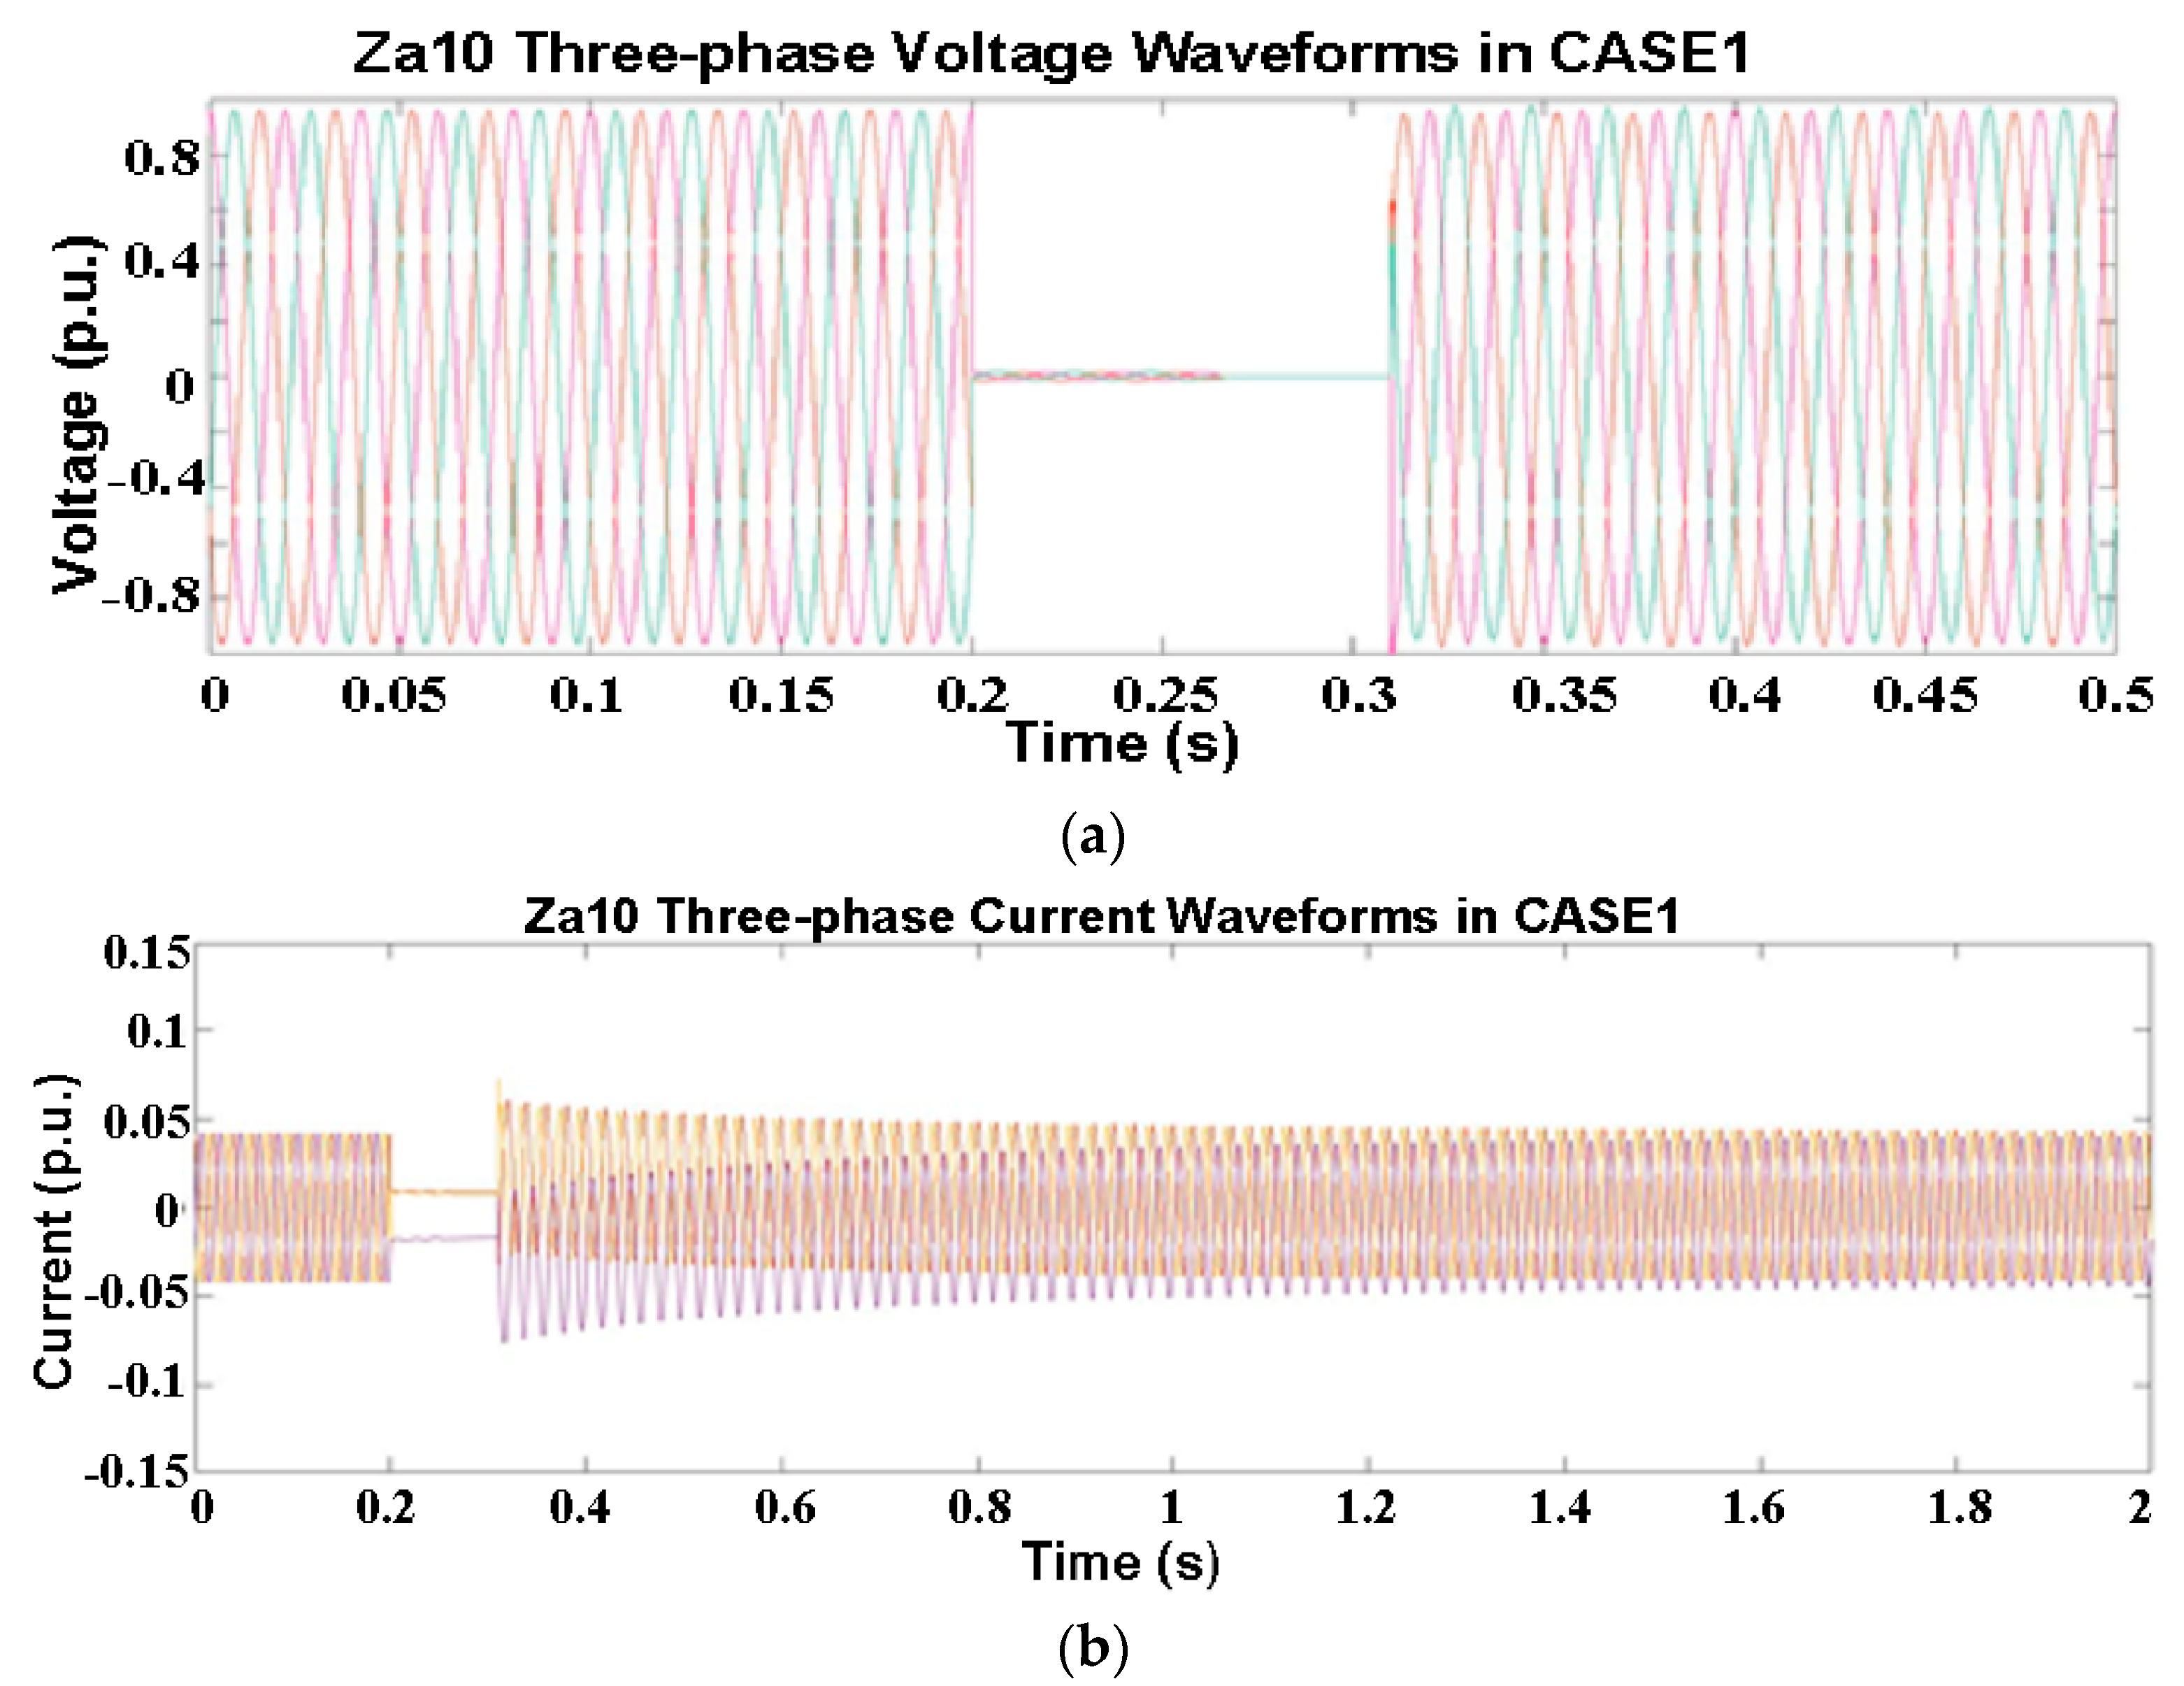
In this case, the proposed approach achieves group restoration during a light load period. A fault occurs in Za7 of Feeder “A” at time 0.2 s. When the fault occurs, FCB-1 trips, FFA of feeder “A” (FFA “A”) analyzes of neighboring zones, then locates the fault. After that, FFA “A” asks Zone 7 to open its sectionalizing switch S7 and S8 for fault isolation. Voltage and current waveforms at Za7, after fault isolation, are shown in Figure 5. Then, service restoration starts when FFA “A” sends a signal to FCB-1 to reclose and energize the upstream part of the faulted feeder. The outage zones are Zone 8 to Zone 10 with total demand of 0.1254 p.u. (Base: 22 KV, 150 MVA). FFA “A” receives two proposals from HFA “C” and HFA “D”, and then FFA “A” accepts feeder “D” proposal as it has a higher tie bus voltage. Voltage and current waveforms at Za10, after service restoration, are shown in Figure 6. It is clear that group restoration is successfully achieved from feeder ‘’D’’.
5.1.2. CASE 2: Zone Restoration without DG
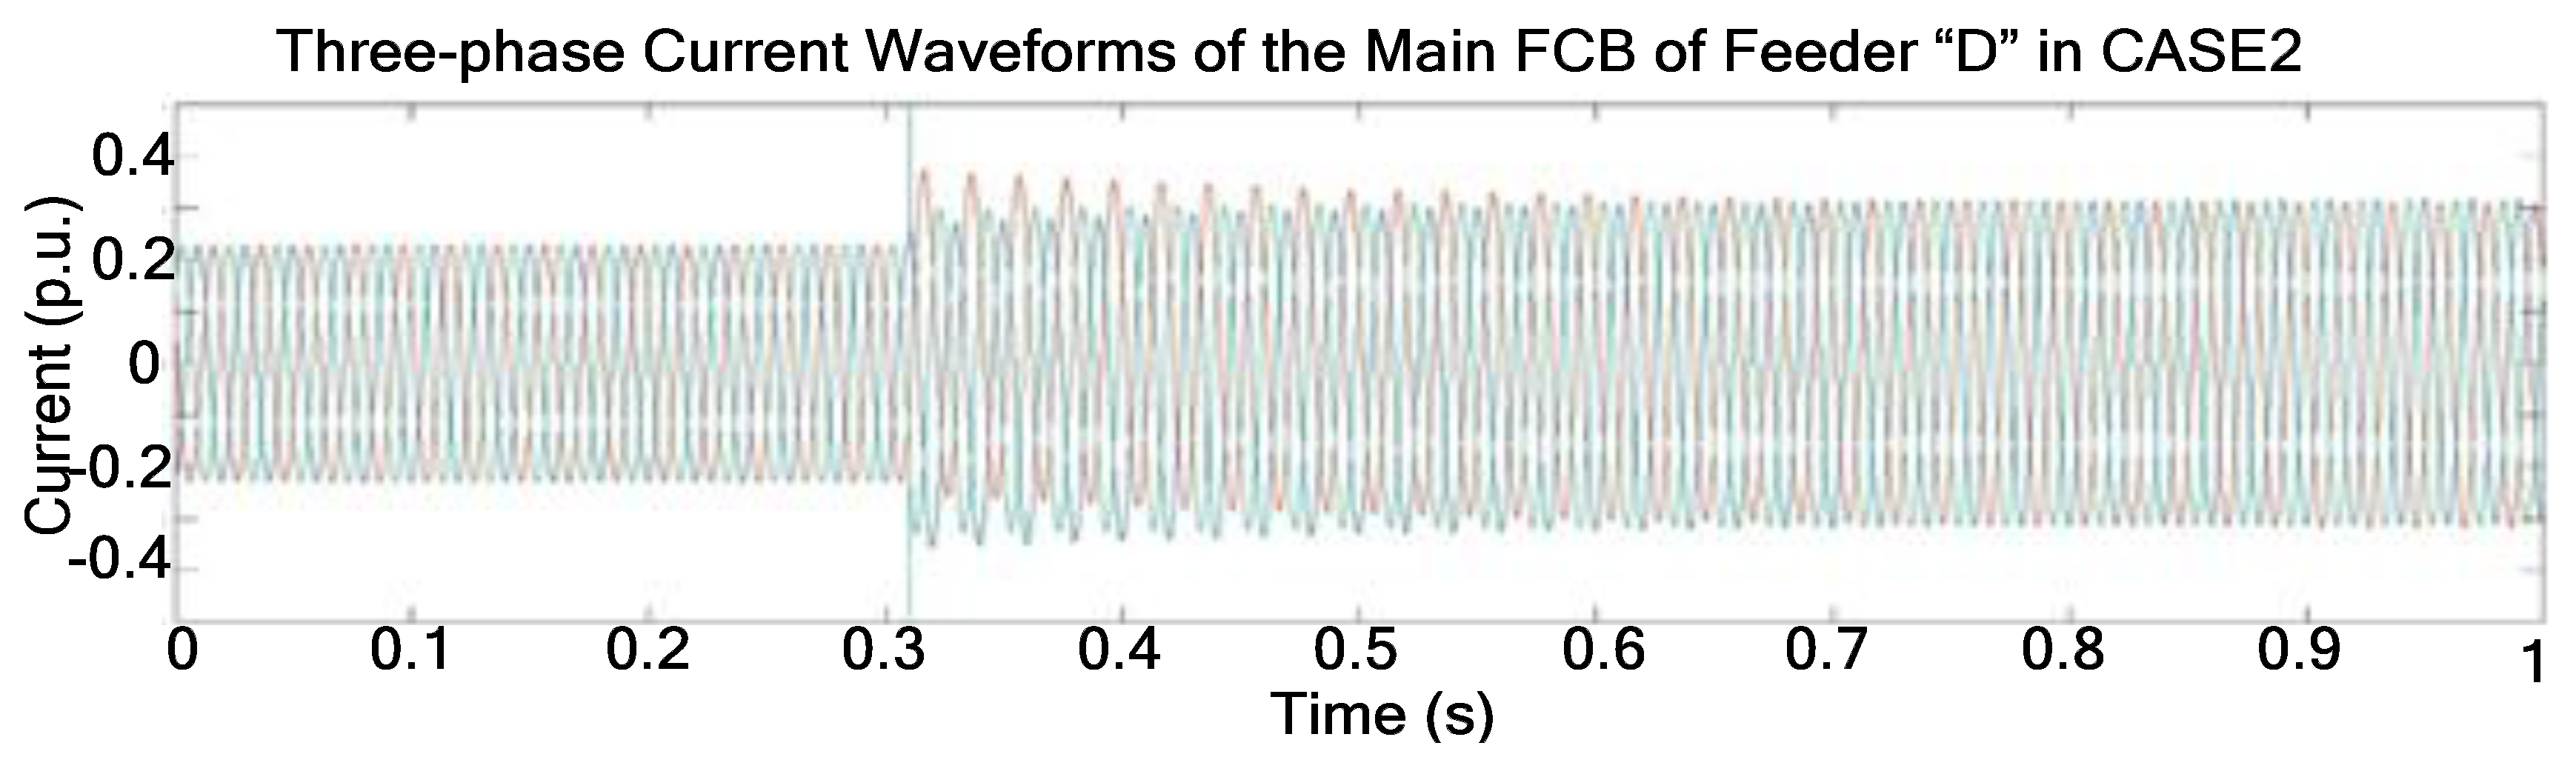
In this case, the proposed approach achieves zone restoration during a light load period. A fault is assumed to occur in Za1 of Feeder “A”. The detection and isolation of the fault is similar to CASE 1, i.e., FCB-1 trips and FFA “A” sends a request message to Zone 1 FZA to open its sectionalizing switch S1 for fault isolation. Since Za1 is at the beginning of the feeder, FFA “A” does not send a signal to FCB-1 to reclose. The down zones are Za2 to Za10 with total demand of 0.3454 p.u. FFA “A” receives proposals from HFAs “B”, “C”, and “D”. Since the total capacity of the outage zones cannot be fulfilled by a single HFA, as concluded from Table 1, group restoration is not possible and FFA “A” goes to the second option, which is zone restoration. Thus, it builds a zone/switch table and arranges the combinations in a descending order according to the required demand; then, it compares the AFC of each helped feeder agent with the load demand of these combinations. Consequently, FFA “A” can restore Za2, Za3, Za4, and Za5 from feeder B through T1, and Za6, Za7, Za8, and Za9 from feeder D through T3, and Za10 from feeder “C” through T2. The current waveform at the main circuit breaker of feeder “D” is shown in Figure 7. It is clear that this current increases to help faulted feeder “A” to restore their faulted zones, thus verifying the proposed approach role for zone restoration.
5.1.3. CASE 3: Zone Restoration with Load Transfer without DG
In this case, the proposed approach achieves zone restoration with load transfer between helped feeders during a heavy load period. A fault is assumed to occur in Zone Za7 of Feeder “A”. The detection and isolation of the fault is the same as CASE 1. The outage zones are Za8 to Za10 with total demand of 0.1654 p.u. FFA “A” asks HFA “C” and HFA “D” for help; however, none of them has the required power for restoration of all faulted zones. Thus, group restoration is not possible and zone restoration is applied. After searching, FFA “A” restores Za8 and Za9 from feeder “D” via T3 and Za10 from feeder “C” via T2. However, AFC of HFA “C” is not enough; thus, it sends CFH to HFA “B” for load transfer to increase its AFC. As shown in Table 1, HFA “B” AFC is 0.1615 p.u., so it can help in supplying Zc10 by closing T4 and opening S18. Hence, AFC of HFA “C” increases to 0.1545 p.u. and now can supply Za10 by closing T2 and opening S11.
5.1.4. CASE 4: Zone Restoration with Load Shedding without DG
In this case, the proposed approach achieves zone restoration, during a heavy load period, while applying the option of load shedding to the least-priority zones. Table 2 shows the weight factor for Feeder “A” zones. From one to three, the zones are weighted according to importance, i.e., zones with weight one are of least importance while those featuring weight three are of highest importance.
A fault is assumed to occur in Za1 of Feeder “A”. After fault detection and isolation, the down zones are Za2 to Za10, and they require a total demand of 0.36502 p.u. Like the previous two cases, group restoration is not valid; thus, zone restoration is carried out. FFA “A” builds a zone/switch table and after searching, FFA “A” restores Za2 to Za4 from feeder “B” through T1. There are two options to restore the remaining faulted zones: the first option is to restore Za6, Za7, Za8, and Za9, while the second option is to restore Za8, Za9, and Za10. FFA “A” chooses the second option, as it sees that Za10’s priority is higher than Za6 and Za7. So FFA “A” restores Za8, Za9, and Za10 from feeder D through T3. FFA “A” decides to shed Za5, Za6, and Za7, as there are no other feasible combinations fitted with the AFC of helped feeders and voltage limits on restored zones.
5.1.5. CASE 5: CASE 2 with DG
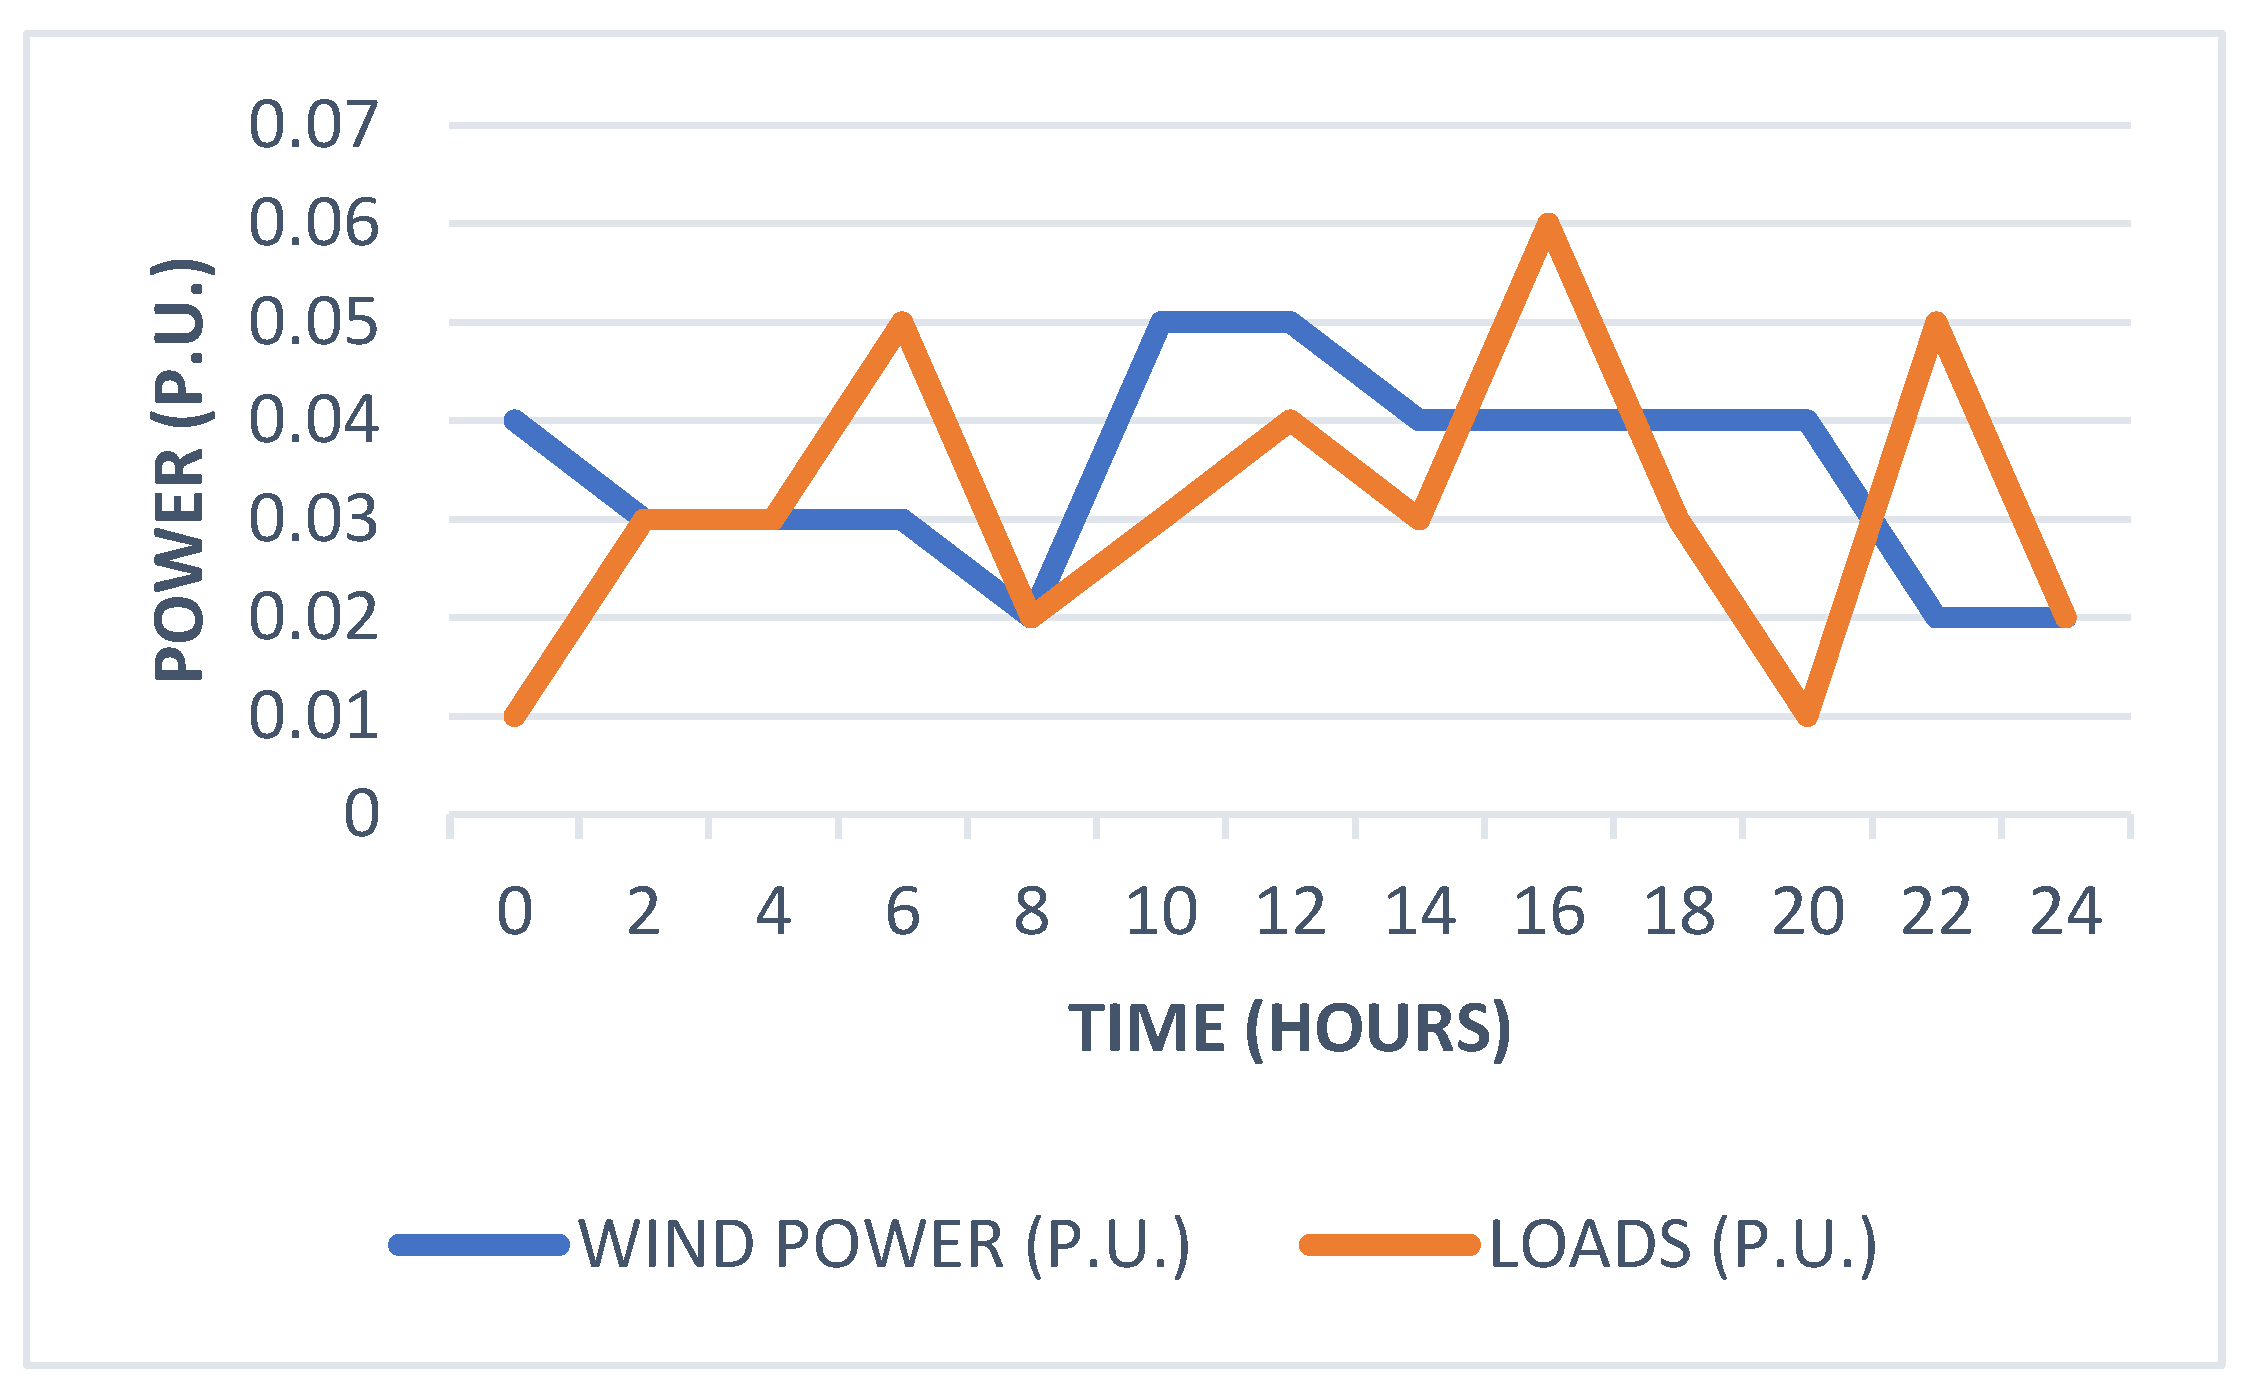
This case is similar to CASE 2, however with DG contribution. As shown in Figure 4, three micro-grids with wind-based DG units are inserted at load points L13, L27, and L40. An SG 6.6 MW wind turbine is employed in each micro-grid as the DG unit [34]. The profiles of wind turbine generation and load demand within each micro-grid over 24 h are shown in Figure 8 [35].
The manager agent of each micro-grid obtains information from the load and DG agents to calculate the spare power that can be supplied by the DGs, as explained in the previous section. Then, each helped feeder is informed by DG AFC.
After searching, FFA “A” restores Za2 and Za5 from feeder “B” via T1 and Za6 to Za10 from feeder “D” via T3. This is related to the following; as shown in Table 1, micro-grid1 DG with 0.042 p.u. AFC adds to feeder “B” AFC to have a total of 0.2 p.u. Similarly, micro-grid3 DG of 0.035 p.u. AFC contributes to feeder “D” to have a total of 0.286 AFC. Hence, unlike CASE 2, feeder “C” is not needed due to the DG AFC contribution, thus reducing the number of switching operations.
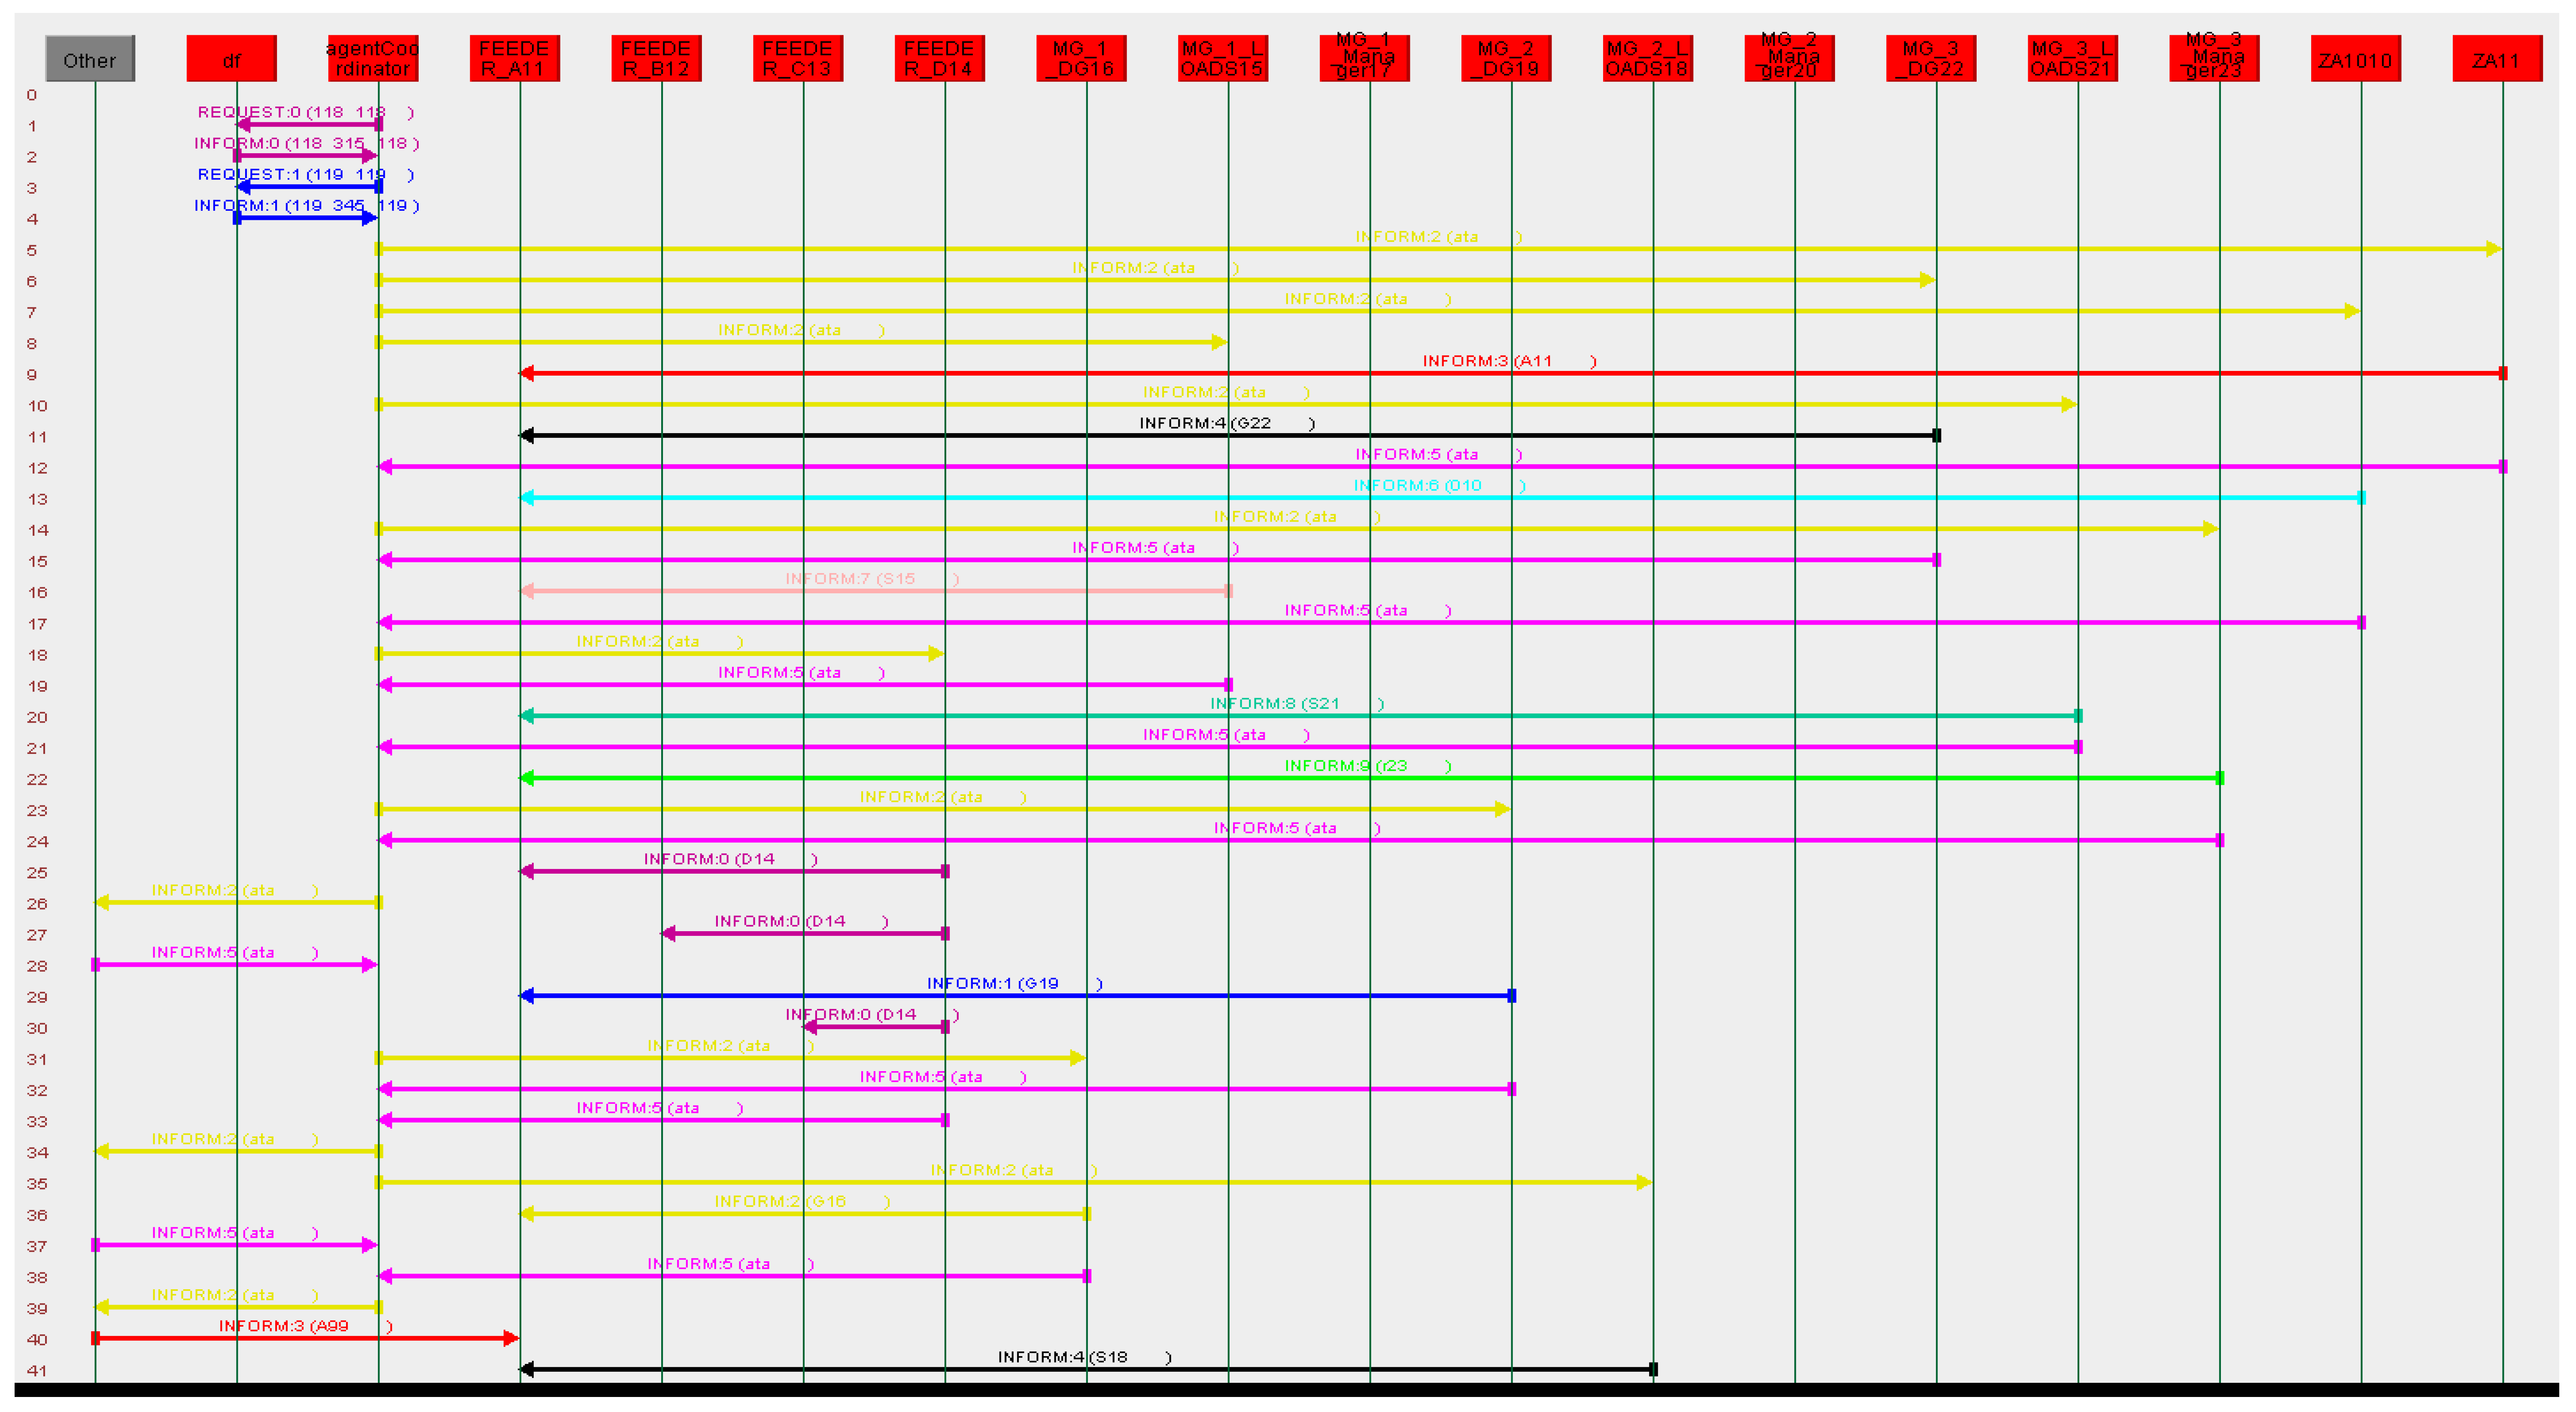
To demonstrate agents’ communication, Figure 9 shows messages’ transfer between system agents for service restoration during the considered CASE 5.
5.1.6. CASE 6: CASE 3 with DG
This case shows same conditions of CASE 3, but with DG contribution. In CASE 3, zone restoration is applied, but with load transfer where feeder “C” HFA transfers loads from feeder “C” to feeder “B”. However, in the present case, DGs AFC of micro-grids 2 and 3 adds to that of feeder “C” and feeder “D” relatively. Thus, when FFA “A” builds the zone/switch table and after searching, FFA “A” restores Za10 from feeder “C” through T2 and Za8 to Za9 from feeder “D” through T3 without the need of load transfer. Hence, the advantage of DG penetration during service restoration is highlighted.
5.1.7. CASE 7: CASE 4 with DG
This case has the same scenario of CASE 4, yet with DG penetration. Unlike CASE 4, in which the FFA “A” uses load shedding for Za5, Za6, and Za7, DG contribution in the present case saved the load shed solution. DG ACF when added to the AFCs of feeders “B”, “C”, and “D” allows FFA “A” to restore Za2, Za3, Za4, and Za5 from feeder “B” through T1, then Za6, Za7, Za8, and Za9 from feeder “D” via T3, and Za10 from feeder “C” through T2. This points out DG’s effect in increasing system reliability during service restoration.
5.1.8. CASE 8: Load Shedding with DG
This case is similar to CASE 7, yet with a noticeable decrease in the DGs power due to wind energy shortage. After searching, FFA “A” restores Za2 to Za4 from feeder “B” through T1, then Za6 to Za9 from feeder “D” through T3, and Za10 from feeder “C” through T2. Unlike CASE 7, FFA “A” sheds Za5, which has low priority due to the DG power shortage. Although DGs penetration in micro-grids positively affects service restoration, the surrounding conditions still have a noticeable impact that should be taken into consideration.
5.2. Multi-Scenario Case Study
The functionality of the proposed self-healing approach is further verified using a multiple-scenario case study. In one simulation run, the proposed algorithm is tested by simulating frequent situations of different fault locations, restoration cases, and DG existence all collected in a single comprehensive case study.
Table 3 summarizes different scenarios of the considered case study. During the time interval of each scenario, the following are listed; fault location, faulted zones total demand, DG contribution, each helped feeder AFC and tie voltage, switching actions, minimum voltage in restored zones, and load shed.
At the beginning, the fault occurs at 0.2 s in Za6, so the upstream zone Za5 is under fault and the downstream faulted zones are Za7 to Za10, with a total demand of 0.157 p.u. FFA “A” identifies the fault and isolates it by opening S6, S7, and FCB-1. Then, FFA “A” starts restoration by closing FCB-1 to re-energize Za5 and making negotiations with feeders “C” and “D” to restore the downstream zones. During this period, DG does not share any spare power. After making the zone/switch table, feeder “C” can restore Za10 by closing T2 and opening S11, and feeder “D” can restore Za7, Za8, and Za9 by closing T3. At time 0.8 s, the fault is cleared and the switches are returned to their initial status.
At 1.2 s, a fault takes place in Za2; thus, the faulted zones are Za3 to Za10, with a total demand of 0.33 p.u. FFA “A” isolates the fault by opening S1, S2, S5, and FCB-1. Next, FFA “A” starts service restoration by closing FCB-1 and sending CFH to feeders “B”, “C”, and “D”. At this time, each DG has spare power and shares it with the HFAs. After constructing the zone/switch table, feeder “B” can restore Za3 and Za4 by closing T1, feeder “C” can restore Za10 by closing T2 and opening S11, and feeder “D” can restore Za5, Za6, Za7, Za8, and Za9 by closing T3.
At 2 s, the power shared from the DG sources has decreased, thus reducing its contribution in the AFC of helped feeders “B”, “C”, and “D”. After building the zone/switch table, feeder “B” restores Za3 and Za4 by closing T1, feeder “C” restores Za10 by closing T2 and opening S11, and feeder “D” restores Za6, Za7, Za8, and Za9 by closing T3 and opening S6. FFA “A” sheds Za5 due to the insufficient AFC of the helping feeders. At time 2.5 s, the fault is cleared and the switches are back to normal conditions.
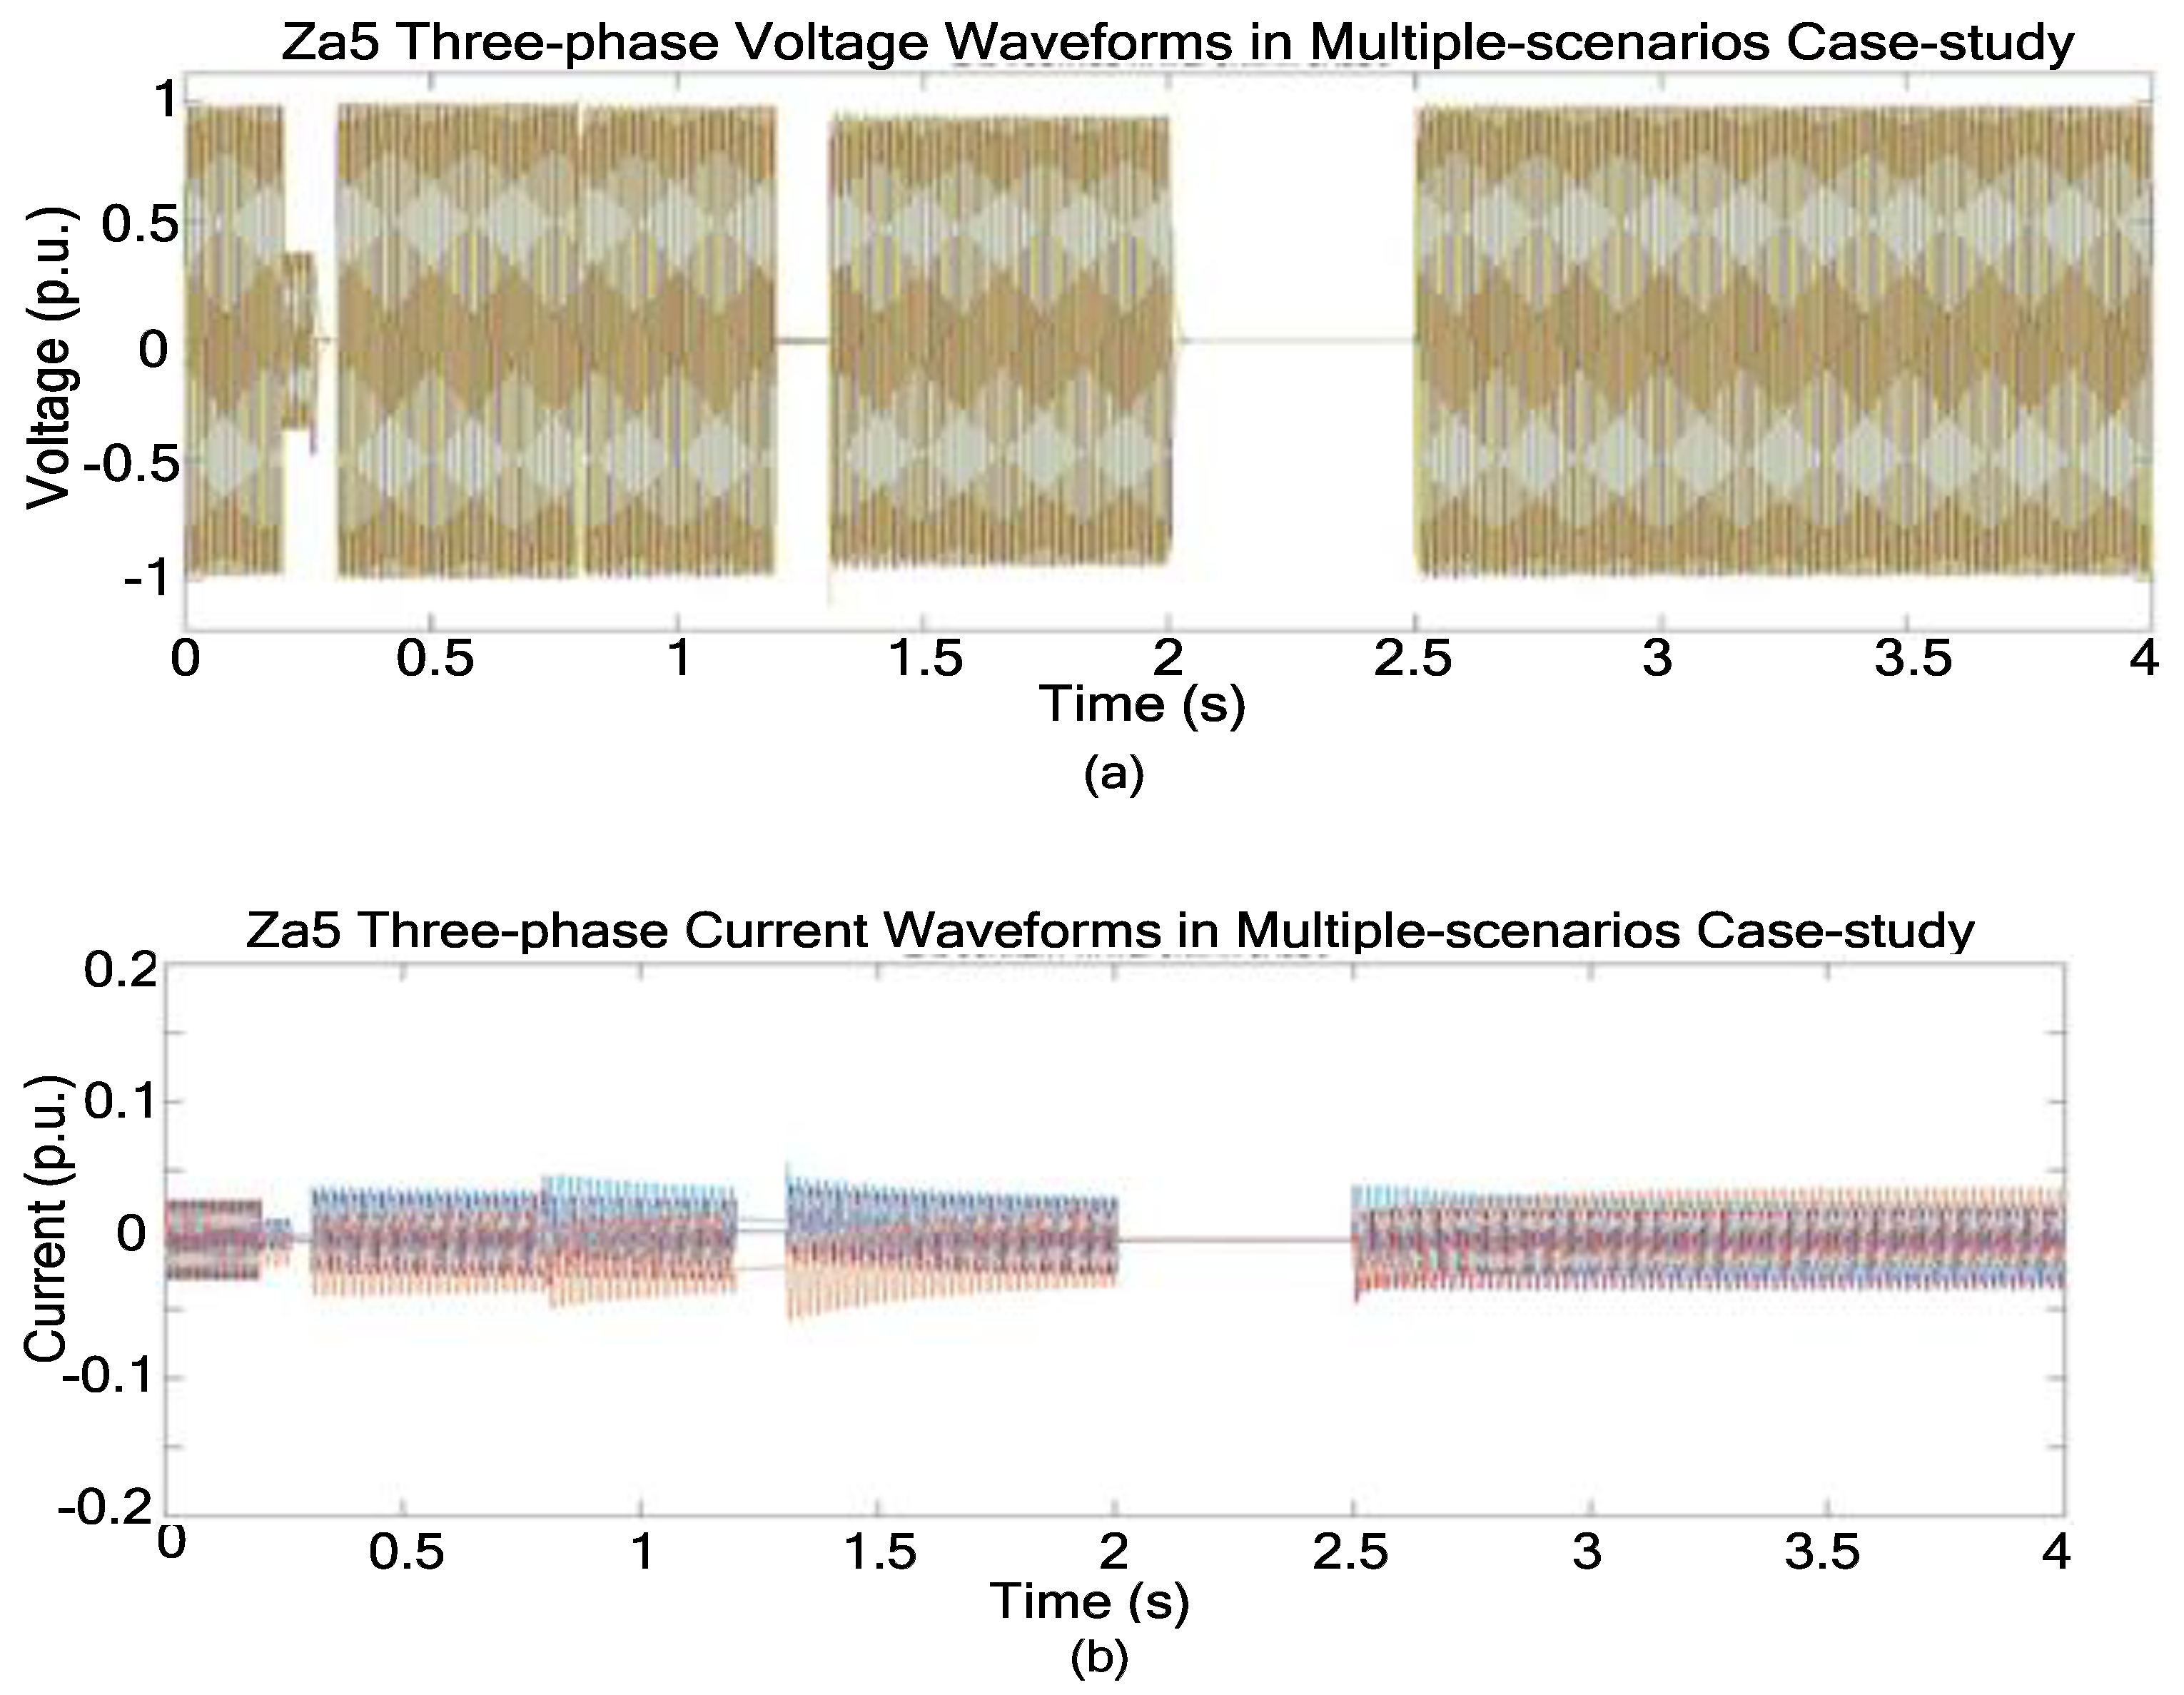
To verify that restoration performance of the proposed approach goes with the response discussed above, a specimen is demonstrated in Figure 10 which shows the voltage and current waveforms at Za5. Confirming the above results, it can be noticed that Za5 is in service till the fault occurs in Za6 at 0.2 s. From 0.25 till 0.3 s, the fault is isolated and the current in Za5 is zero during this interval. At 0.3 s, service restoration starts when FFA “A” sends a signal to FCB-1 to reclose and energize the upstream part of the faulted feeder so ZA5 is back to service. From 0.8 to 1.2 s, the fault is cleared and Za5 is back in service with the initial switching actions. At 1.2 s, another fault occurs in Za2; however, Za5 is restored by feeder “D” from 1.3 till 2 s. At 2 s, the least priority Za5 is shed due to the decrease in DG power. Finally, at 2.5, the fault is cleared and Za5 is back in service.
6. Discussion
To summarize the proposed work, this paper introduces a MAS approach capable of achieving self-healing objectives (fault locating, isolation, and restoration) according to the operational constraints, as well as allowing DG penetration during restoration.
According to the proposed MAS design, the applied agents’ roles are as follows. First, the zone agents monitor the status of the corresponding zone voltage, current waveforms, and calculate its current usage. Second, the feeder agents lead the negotiations with each other, and third, the micro-grids’ agents provide the required data about DGs capacity. The proposed methodology is thoroughly explained to list the procedure principle and steps. This is implemented via communication between agents to restore the outage zones using group restoration, zone restoration, zone restoration with load transfer, or load shedding.
As demonstrated from the simulation results, the proposed approach successfully functioned in all restoration cases with and without DGs contribution. However, as concluded from Table 1 and Table 3, DG existence is quite useful for reducing the switching actions, load shedding, load transfer, and improving voltage profile at restored zones, especially during convenient environmental conditions.
For further validation of the superiority of the proposed approach, the capabilities and limitations of other self-healing MAS frameworks in the literature [4,14,15,16,17,18,19,20,21,22,23], versus the proposed approach’s capabilities, are given in Table 4. Regarding DG penetration, it was only considered in [4,14,15,16,17], yet they still show some deficiencies when compared to the proposed approach. In [17,18,19,20,21,22,23], all self-healing objectives of fault detection, locating, isolation, and service restoration were successfully accomplished, unlike [4,14,15,16], where the service-restoration task was solely achieved without the capability of fault locating and isolation. Moreover, all studies considered the voltage and current limits as well as load priorities in their MAS design, except for [17,18,20,21], which did not consider load priorities, and [19,21], which did not consider voltage and current constraints. As for their applicability in large-data systems, [17,18,19,21] lacked this property. Moreover, [17,18,19,22] did not consider validating their developed algorithms using different cases of restoration and load shedding. The proposed work is developed to overcome the limitations of these studies by designing a self-healing MAS approach that achieves all functions of fault identification, isolation, and service-restoration, taking into account operational constraints and load priorities as well as zones priorities. It is applicable in large systems and studies DG penetration in smart grids in details to achieve the required energy management. Additionally, it involves multiple scenarios and multi-fault case studies to test the proposed approach validity during different zone and group restorations and load shedding and transfers.
Regarding algorithm implementation complexity and restoration speed, they are affected by a number of factors as follows. First, applied agents’ number and type greatly affect the algorithm performance. Some agents are high in number as they depend on certain components which are numerously placed in the network such as load agents, switch agents, etc., unlike other agents which are lower in number, such as feeder and zone agents. Moreover, the communication method between agents is another key factor where the hybrid approach features more communication operations between agents rather than the hierarchical communication. In addition, algorithm-required tasks, the size of the power system for which the algorithm is designed, and the size of the information carried by every agent can also affect system performance. Accordingly, the considered self-healing approaches can be further classified with respect to their complexity and speed. As concluded from Table 4, the authors in [4,17,19,22,23] introduced self-healing algorithms which employed more than two agent types, which, in turn, increased implementation complexity and reduced its speed, especially in the case of agents scattered around the system in high number, such as load agents, switch agents, or device agents. When these agents communicate together, they experience huge data transfers which add to system complexity. Although in [21], three types of agents were applied, this algorithm is hierarchal in its architecture, i.e., no communication between switch agents, which results in moderate speed and complexity. In [16,18], the authors proposed self-healing algorithms featuring two agent types as well as hierarchal architectures with determined tasks for each agent. So, these algorithms are classified as average in complexity and speed. Regarding algorithms introduced in [14,15,20], only one agent type is employed. Hence, they are simple in implementation and fast in restoration. However, in these algorithms, all information are captured in one agent type, which may affect the decentralized architecture in case of this agent failure; thus, a backup plan is mandatory. In the proposed work, two main agents are employed, the zone agent and feeder agent, with hierarchal architecture since zone agents communicate with feeder agents only and not together. Additional micro-grid agents are employed to control DG penetration, yet they are not large in number and work in hierarchal nature. Hence, the proposed algorithm is classified to feature average complexity and speed.
7. Conclusions
In this paper, an efficient self-healing approach which allows DG penetration is proposed. It features a decentralized MAS design that can locate and isolate the fault and then restore faulted zones while considering system objectives and operational constraints. Moreover, its ability to control DG contribution during restoration helps maintain continuous power supply, even at heavy load periods.
The proposed MAS design, agents and procedure steps are thoroughly explained. The zone agent collects information from measuring devices then sends it to the feeder agent, which makes simple calculations and negotiates with other feeder agents to restore the outage zones, while the micro-grid agents control the DG penetration to secure a robust power supply in smart grids. Employing a hierarchal communication architecture, the proposed approach features moderate implementation complexity and satisfactory restoration response.
The proposed approach is tested on a large distribution system modeled using MATLAB/Simulink, while the MAS is implemented in JADE. The results of eight simulation cases of different fault locations, load demands, and DG existences verified the proposed approach effectiveness in realizing different restoration scenarios. The latter is further verified using a multi-scenario case-study. Simulation results highlighted the DG role in the restoration process, especially under convenient environmental conditions. Finally, when compared to other approaches in related work, the proposed approach’s superiority is verified.
Author Contributions
Data curation, S.E.S.; Formal analysis, A.M.A.; Investigation, N.E.Z.; Methodology, A.M.A.; Software, A.M.A.; Supervision, N.E.Z. and S.E.S.; Validation, N.E.Z.; Visualization, S.E.S.; Writing—original draft, A.M.A. and N.E.Z.; Writing—review & editing, S.E.S. All authors have read and agreed to the published version of the manuscript.
Funding
This research received no external funding.
Institutional Review Board Statement
Not applicable.
Informed Consent Statement
Not applicable.
Data Availability Statement
Not applicable.
Conflicts of Interest
The authors declare no conflict of interest.
Nomenclature
The following abbreviations are used in this work:
| AFC | Available feeding capacity |
| ANSI | American National Standards Institute |
| BDI | Belief–desire–intention |
| CC | Central controller |
| CFH | Call for help |
| DG | Distributed generator |
| FA | Feeder agent |
| FCB | Feeder circuit breaker |
| FFA | Faulted feeder agent |
| FZA | Faulted zone agent |
| HFA | Helped feeder agent |
| HZA | Helped zone agent |
| JADE | Java Agent Developing Framework |
| LT | Load transfer |
| MAS | Multi-agent system |
| RES | Renewable energy source |
| VTB | Virtual test bed |
| ZA | Zone agent |
| The following symbols are used in this work: | |
| Total number of HFAs | |
| Maximum spare capacity of the restoration path with respect to the current limit constraint | |
| Maximum line current | |
| IS | Maximum spare capacity of the restoration path without violating both current and voltage operating constraints. |
| Is(j) | Available spare capacity of each zone before it gets overloaded |
| Maximum spare capacity in the restoration path with respect to the voltage limit constraint | |
| Zone current change | |
| Current usage of zone j | |
| Li | bus |
| , | Total number of branches and buses respectively |
| Total number of DG units and loads in a micro-grid respectively | |
| Number of switches supplying power to a bus at any given time | |
| Total number of faulted zones | |
| load in micro-grid | |
| DG available feeding capacity | |
| DG | |
| Active power delivered from/to the utility grid taking into account grid losses | |
| Summation of power consumption of micro-grid loads | |
| Mechanical power provided by wind turbine | |
| R | Wind turbine radius |
| branch. | |
| switch in the restored network (i.e., 1 for the closed switch and 0 for the opened one) | |
| switch immediately after the fault has been isolated | |
| Demand of load j in zone i | |
| bus | |
| Maximum and minimum acceptable bus voltages respectively | |
| Vo | Lowest bus voltage magnitude received from the zone agent |
| bus load | |
| Priority of load j in zone i | |
| bus load (i.e., 1 for the restored load and 0 for the unrestored one) | |
| All zone combinations possible for zone transfer | |
| Series impedance of the restoration path | |
| Air density | |
| Wind speed | |
| w | Rotation speed of the wind turbine |
| Tip speed ratio of the wind turbine | |
| Pitch angle of the wind turbine | |
| Wind energy capture coefficient | |
References
- Wu, T.L.; Lu, C.; Su, S. An Autonomous Decision Approach for Fault Allocation and Service Restoration in Electrical Distribution Systems by Multi Agent System. In Proceedings of the Ninth International Conference on Hybrid Intelligent Systems, Salamanca, Spain, 11–13 June 2009; pp. 89–94. [Google Scholar]
- Hu, J.; Lanzon, A. Distributed Finite-time Consensus Control for Heterogeneous Battery Energy Storage Systems in Droop-controlled Microgrids. IEEE Trans. Smart Grid 2019, 10, 4751–4761. [Google Scholar] [CrossRef] [Green Version]
- Saleh, M.S.; Althaibani, A.; Esa, Y.; Mhandi, Y.; Mohamed, A.A. Impact of Clustering Microgrids on their Stability and Resilience during Blackouts. In Proceedings of the International Conference on Smart Grid and Clean Energy Technologies (ICSGCE), Offenburg, Germany, 20–23 October 2015; pp. 195–200. [Google Scholar]
- Shirazi, E.; Jadid, S. Autonomous Self-Healing in Smart Distribution Grids Using agent Systems. IEEE Trans. Ind. Inform. 2019, 15, 6291–6301. [Google Scholar] [CrossRef]
- Zidan, A.; El-Saadany, E.F. A Cooperative Multiagent Frame-work for Self-healing Mechanisms in Distribution Systems. IEEE Trans. Smart Grid 2012, 3, 1525–1539. [Google Scholar] [CrossRef]
- Nagata, T.; Sasaki, H. An Efficient Algorithm for Distribution Network Restoration. In Proceedings of the IEEE Power Engineering Society Summer Meeting, Vancouver, BC, Canada, 15–19 July 2001; pp. 54–59. [Google Scholar]
- Asadi, Q.; Amini, A.; Falaghi, H.; Ramezani, M. A Heuristic Algorithm for Effective Service Restoration Toward Distribution Networks Automation. In Proceedings of the 15th International Conference on Protection and Automation of Power Systems (IPAPS), Shiraz, Iran, 30–31 December 2020; pp. 19–24. [Google Scholar]
- Golshani, A.; Sun, W.; Zhou, Q.; Zheng, Q.P.; Tong, J. Two-Stage Adaptive Restoration Decision Support System for a Self-Healing Power Grid. IEEE Trans. Ind. Inform. 2017, 13, 2802–2812. [Google Scholar] [CrossRef]
- Chen, S.J.; Zhan, T.S.; Huang, C.H.; Chen, J.L.; Lin, C.H. Nontechnical Loss and Outage Detection Using Fractional-Order Self-Synchronization Error-Based Fuzzy Petri Nets in Micro-Distribution Systems. IEEE Trans. Smart Grid 2015, 6, 411–420. [Google Scholar] [CrossRef]
- Lee, H.; Park, Y. A Restoration Aid Expert System for Distribution Substations. IEEE Trans. Power Deliv. 1996, 11, 1765–1770. [Google Scholar] [CrossRef]
- Zidan, A.; Khairalla, M.; Abdrabou, A.M.; Khalifa, T.; Shaban, K.; Abdrabou, A.; El Shatshat, R.; Gaouda, A.M. Fault Detection, Isolation, and Service Restoration in Distribution Systems: State-of-the-Art and Future Trends. IEEE Trans. Smart Grid 2017, 8, 2170–2185. [Google Scholar] [CrossRef]
- Martín, F.; Sánchez, A.; Rivier, M. A Literature Review of Microgrids: A Functional Layer Based Classification. Renew. Sustain. Energy Rev. 2016, 62, 1133–1153. [Google Scholar] [CrossRef]
- Lim, I.; Sidhu, T.S.; Choi, M.S.; Lee, S.J.; Hong, S.; Lim, S.I.; Lee, S.W. Design and Implementation of Multiagent-Based Distributed Restoration System in DAS. IEEE Trans. Power Deliv. 2013, 28, 585–593. [Google Scholar] [CrossRef]
- Hafez, A.A.; Omran, W.A.; Hegazy, Y.G. A Decentralized Technique for Autonomous Service Restoration in Active Radial Distribution Networks. IEEE Trans. Smart Grid 2018, 9, 1911–1919. [Google Scholar] [CrossRef]
- Bagherzadeh, L.; Shayeghi, H.; Pirouzi, S.; Shafie-khah, M.; Catalão, J. Coordinated Flexible Energy and Self-healing Management according to the Multi-agent System-based Restoration Scheme in Active Distribution Network. IET Renew. Power Gener. 2021, 15, 1765–1777. [Google Scholar] [CrossRef]
- Al-Hinai, A.; Alhelou, H.H. A Multi-agent System for Distribution Network Restoration in Future Smart Grids. Energy Rep. 2021, 7, 8083–8090. [Google Scholar] [CrossRef]
- Habib, H.F.; Youssef, T.; Cintuglu, M.H.; Mohammed, O. A Multi-Agent Based Technique for Fault Location, Isolation and Service Restoration. IEEE Trans. Ind. Appl. 2017, 53, 1841–1851. [Google Scholar] [CrossRef]
- Nagata, T.; Sasaki, H. A Multi-Agent Approach to Power System Restoration. IEEE Trans. Power Syst. 2002, 17, 457–462. [Google Scholar] [CrossRef]
- Solanki, J.M.; Khushalani, S.; Schulz, N.N. A Multi-Agent Solution to Distribution Systems Restoration. IEEE Trans. Power Syst. 2007, 22, 1026–1034. [Google Scholar] [CrossRef]
- Tsai, M.; Pan, Y. Application of BDI-based Intelligent Multi-agent Systems for Distribution System Service Restoration Planning. Eur. Trans. Electr. Power 2011, 21, 1783–1801. [Google Scholar] [CrossRef]
- Chellaswamy, I.; Rani, S.P.J. Automatic Fault Isolation and Restoration of Distribution System using JADE-based Multi-Agents. Turk. J. Electr. Eng. Comput. Sci. 2019, 27, 2226–2242. [Google Scholar] [CrossRef]
- Ye, D.; Zhang, M.; Sutanto, D. A Hybrid Multiagent Framework with Q-learning for Power Grid Systems Restoration. IEEE Trans. Power Syst. 2011, 26, 2434–2441. [Google Scholar] [CrossRef]
- Martins, F.A.; Batista de Almeida, A. Automatic Power Restoration in Distribution Systems Modeled through Multi-agent Systems. IEEE Lat. Am. Trans. 2020, 18, 1768–1776. [Google Scholar] [CrossRef]
- Paliwal, P.; Patidar, N.P.; Nema, R.K. Planning of Grid Integrated Distributed Generators: A Review of Technology, Objectives and Techniques. Renew. Sustain. Energy Rev. 2014, 40, 557–570. [Google Scholar] [CrossRef]
- Eddy, Y.S.; Gooi, H.B.; Chen, S.X. Multi-Agent System for Distributed Management of Microgrids. IEEE Trans. Power Syst. 2015, 30, 24–34. [Google Scholar] [CrossRef]
- American National Standards Institute Report (ANSI C84.1-2020): Electric Power Systems Voltage Ratings (60 Hz). Available online: https://www.nema.org/docs/default-source/news-document-library/nema-espg.pdf (accessed on 15 April 2021).
- Pipattanasomporn, M.; Feroze, H.; Rahman, S. Multi-agent Systems in a Distributed Smart Grid: Design and Implementation. In Proceedings of the IEEE/PES Power Systems Conference and Exposition, Seattle, WA, USA, 15–18 March 2009; pp. 1–8. [Google Scholar]
- Yu, H.; Luan, W.; Sheng, W.; Liu, H.; Ma, W. Evaluation of the Standardization Needs of Microgrids Technology. In Proceedings of the 5th International Conference on Electric Utility Deregulation and Restructuring and Power Technologies (DRPT), Changsha, China, 26–29 November 2015; pp. 2144–2148. [Google Scholar]
- Ciric, R.; Popovic, D. Multi-objective Distribution Network Restoration using Heuristic Approach and Mix Integer Programming Method. Electr. Power Energy Syst. 2000, 22, 497–505. [Google Scholar] [CrossRef]
- Xing, C.; Xi, X.; He, X.; Liu, M. Research on the MPPT Control Simulation of Wind and Photovoltaic Complementary Power Generation System. In Proceedings of the IEEE Sustainable Power and Energy Conference (ISPEC), Chengdu, China, 23–25 November 2020; pp. 1058–1063. [Google Scholar]
- Das, D. Reconfiguration of Distribution System using Fuzzy Multi-objective Approach. Electr. Power Energy Syst. 2006, 28, 331–338. [Google Scholar] [CrossRef]
- JADE Agent Development Toolkit. Available online: http://jade.tilab.com (accessed on 3 January 2021).
- Robinson, C.R.; Mendham, P.; Clarke, T. MACSimJX: A Tool for Enabling Agent Modelling with Simulink using JADE. J. Phys. Agents 2010, 4, 1–7. [Google Scholar] [CrossRef] [Green Version]
- SG 6.6.-170: Onshore wind turbine. Available online: https://www.siemensgamesa.com/products-and-services/onshore/wind-turbine-sg-5-8-170 (accessed on 7 July 2021).
- Zhang, Y.; Tang, X.; Qi, Z.; Liu, Z. The Ragone plots guided sizing of hybrid storage system for taming the wind power. Int. J. Electr. Power Energy Syst. 2015, 65, 1016. [Google Scholar] [CrossRef]
Figure 1.
Zone concept in distribution systems.

Figure 2.
Flowchart of the proposed fault locating and isolation algorithm.

Figure 3.
Illustrative diagram for the steps and agents’ roles of the proposed restoration approach.
Figure 3.
Illustrative diagram for the steps and agents’ roles of the proposed restoration approach.

Figure 4.
Distribution system under investigation.

Figure 5.
CASE 1 waveforms at Za7 after fault isolation; (a) voltage, (b) current.

Figure 6.
CASE 1 waveforms at Za10 after fault isolation; (a) voltage, (b) current.

Figure 7.
CASE 2 three-phase current waveforms at feeder “D” circuit breaker.

Figure 8.
Power profiles for the wind unit generation and loads’ demand within the micro-grid during 24 h.
Figure 8.
Power profiles for the wind unit generation and loads’ demand within the micro-grid during 24 h.

Figure 9.
Messages transfer between system agents during CASE 5.

Figure 10.
Za5 waveforms in the multiple-scenario case study; (a) voltage, (b) current.


Table 1.
Summary of service restoration results for the eight simulation cases.
| Cases | Fault Location | Loading Period | Faulted Zones/ Demand | DG Existence | AFC of DG in p.u. | , Tie Voltage | Switching Actions Service Restoration | No of Switching Actions | Minimum Bus Voltage | Load Shed |
|---|---|---|---|---|---|---|---|---|---|---|
| Case 1 | Zone Za7 of Feeder “A” | Light Load Period | Za8 to Za10/ 0.1254 p.u. | ✗ | ----- | Feeder C: 0.2038 p.u., 0.9589 p.u., Feeder D: 0.2586 p.u., 0.9812 p.u. | - Close T3 -Feeder D restores Za8 toZa10 | 1 | 0.9616 p.u. at Za10 | ---- |
| Case 2 | Zone Za1 of Feeder “A” | Light Load Period | Za2 to Za10/ 0.3454 p.u. | ✗ | ----- | Feeder B: 0.1615 p.u., 0.9766 p.u., Feeder C: 0.2014 p.u., 0.9663 p.u., Feeder D: 0.2577 p.u., 0.9836 p.u. | -Open S6, S11 -Close T1, T2, T3 -Feeder B restores Za2 to Za5 -Feeder C restores Za10 -Feeder D restores Za6 to Za9 | 5 | 0.953 3p.u. at Za5 | ---- |
| Case 3 | Zone Za7 of Feeder “A” | High Load Period | Za8 to Za10/ 0.1654 p.u. | ✗ | ----- | Feeder B: 0.1615 p.u., 0.9766 p.u., Feeder C: 0.0759 p.u., 0.9576 p.u., Feeder D: 0.0786 p.u., 0.9755 p.u. | -Open S11, S18 -Close T2, T3, T4 Feeder C restores Za10 by load transfer to HFA “B” -Feeder D restores Za8 to Za9 | 5 | 0.95 p.u. at Za10 | ---- |
| Case 4 | Zone Za1 of Feeder “A” | High Load Period | Za2 to Za10/ 0.36502 p.u. | ✗ | ----- | Feeder B: 0.1141 p.u., 0.9739 p.u., Feeder D: 0.1531 p.u., 0.9803 p.u. | -Open S5, S8 -Close T1, T3 -Feeder B restores Za2 to Za4 -Feeder D restores Za8 toZa10 | 4 | 0.959 p.u. at Za2 and Za10 | Za5, Za6, Za7 |
| Case 5 | Zone Za1 of Feeder “A” | Light Load Period | Za2 to Za10/ 0.3454 p.u. | ✓ | MG1: 0.042 MG3: 0.035 | Feeder B: 0.2 p.u., 0.9783 p.u., Feeder D: 0.286 p.u., 0.982 p.u. | -Open S6 -Close T1, T3 -Feeder B restores Za2 to Za5 -Feeder D restores Za6 toZa10 | 3 | 0.9539 p.u. at Za6 | ---- |
| Case 6 | Zone Za7 of Feeder “A” | High Load Period | Za8 to Za10/ 0.1654 p.u. | ✓ | MG2: 0.035. MG3: 0.008. | Feeder C: 0.11 p.u., 0.9608 p.u., Feeder D: 0.088 p.u., 0.971 p.u. | -Open S11 -Close T2, T3 -Feeder C restores Za10 -Feeder D restores Za8 to Za9 | 3 | 0.953 p.u. at Za10 | ---- |
| Case 7 | Zone Za1 of Feeder “A” | High Load Period | Za2 to Za10/ 0.36502 p.u. | ✓ | MG1: 0.042 MG2: 0.035 MG3: 0.008 | Feeder B: 0.157 p.u., 0.9758 p.u., Feeder C: 0.11 p.u., 0.9608 p.u., Feeder D: 0.162 p.u., 0.982 p.u. | -Open S6, S11 -Close T1, T2, T3 -Feeder B restores Za2 to Za5 -Feeder C restores Za10 -Feeder D restores Za6 to Za9 | 5 | 0.95 p.u. at Za10 | ---- |
| Case 8 | Zone Za1 of Feeder “A” | High Load Period | Za2 to Za10/ 0.36502 p.u. | ✓ | MG1: 0.022 MG2: 0.015 MG3: 0.008 | Feeder B: 0.137 p.u., 0.9758 p.u., Feeder C: 0.09 p.u., 0.9608 p.u., Feeder D: 0.162 p.u., 0.9774 p.u. | -Open S5, S6, S11 -Close T1, T2, T3 -Feeder B restores Za2 to Za4 -Feeder C restores Za10 -Feeder D restores Za6 to Za9 | 6 | 0.95 p.u. at Za10 | Za5 |
Table 2.
Weight factors for feeder “A” zones.
| Feeder A Zone Numbers | Weight Factor |
|---|---|
| Za1, Za3, Za4, Za9, Za10 | 3 |
| Za2, Za7, Za8 | 2 |
| Za5, Za6 | 1 |
Table 3.
Restoration results for the multi-scenario case study.
| Interval | Fault Location | Faulted Zones/Demand | DG Contribution | AFC of DG in p.u. | Total Maximum AFC at Helped , Tie Voltage | Switching Actions for Service Restoration | Minimum Bus Voltage | Load Shed |
|---|---|---|---|---|---|---|---|---|
| 0.2 to 0.8 s | Zone Za6 of Feeder “A” | Za7 to Za10/ 0.157 p.u. | ✗ | --------- | Feeder C: 0.0755 p.u., 0.9608 p.u., Feeder D: 0.1536 p.u., 0.9774 p.u. | -Open S11 -Close T2, T3 -Feeder C restores Za10 -Feeder D restores Za7 to Za9 | 0.95 p.u. at Za10 | ---- |
| 1.2 to 2 s | Zone Za2 of Feeder “A” | Za3 to Za10/ 0.33 p.u. | ✓ | MG1: 0.035 MG2: 0.022 MG3: 0.022 | Feeder B: 0.15 p.u., 0.9758 p.u., Feeder C: 0.097 p.u., 0.9687 p.u., Feeder D: 0.175 p.u., 0.9802 p.u. | -Open S11 -Close T1, T2, T3 -Feeder B restores Za3 & Za4 -Feeder C restores Za10 -Feeder D restores Za5 to Za9 | 0.953 p.u. at Za5 | ---- |
| 2 to 2.5 s | Zone Za2 of Feeder “A” | Za3 to Za10/ 0.33 p.u. | ✓ | MG1: 0.005 MG2: 0.002 MG3: 0.002 | Feeder B: 0.12 p.u., 0.97 p.u., Feeder C: 0.077 p.u., 0.959 p.u., Feeder D: 0.155 p.u., 0.976 p.u. | -Open S6, S11 -Close T1, T2, T3 -Feeder B restores Za3 & Za4 -Feeder C restores Za10 -Feeder D restores Za6 to Za9 | 0.95 p.u. at Za10 | Za5 |
Table 4.
The proposed algorithm versus other MAS self-healing algorithms in related work.
| PAPERS | Fault Location and Isolation | Service Restore | Voltage and Current Constraints | Load Priorities | Suitable for Large Systems? | Multi-Case Study | DG Penetration | Main Agents | Applied Computer Resources | Complexity | Restoration Speed | |
|---|---|---|---|---|---|---|---|---|---|---|---|---|
| System Design | Agents Design | |||||||||||
| [4] | ✗ | ✓ | ✓ | ✓ | ✓ | ✓ | ✓ | Feeder, Switch, Zone, and DG Agents | MATLAB–NETLOGO Extension | NETLOGO | High | Low |
| [14] | ✗ | ✓ | ✓ | ✓ | ✓ | ✓ | ✓ | Zone Agent | MATLAB | JADE | Low | High |
| [15] | ✗ | ✓ | ✓ | ✓ | ✓ | ✓ | ✓ | Zone Agent | Undefined | Low | High | |
| [16] | ✗ | ✓ | ✓ | ✓ | ✓ | ✓ | ✓ | Initiator and Zone Agents | MATLAB | JADE | Average | Average |
| [17] | ✓ | ✓ | ✓ | ✗ | ✗ | ✗ | ✓ | Load, Section, Restoration, and Generator Agents | MATLAB | JADE | High | Low |
| [18] | ✓ | ✓ | ✓ | ✗ | ✗ | ✗ | ✗ | Facilitator and Bus Agents | Undefined | Average | Average | |
| [19] | ✓ | ✓ | ✗ | ✓ | ✗ | ✗ | ✗ | Generator, Switch, and Load Agents | VTB | JADE | High | Low |
| [20] | ✓ | ✓ | ✓ | ✗ | ✓ | ✓ | ✗ | Switch Agent | Undefined | JADE | Low | High |
| [21] | ✓ | ✓ | ✗ | ✗ | ✗ | ✓ | ✗ | Recloser, Feeder Section, and Smart Switch Agents | MATLAB | JADE | Average | Average |
| [22] | ✓ | ✓ | ✓ | ✓ | ✓ | ✗ | ✗ | Generator, Switch, and Load Agents | Undefined | High | Low | |
| [23] | ✓ | ✓ | ✓ | ✓ | ✓ | ✓ | ✗ | Substation, Line, and Device Agents | SMAs | JADE | High | Low |
| Proposed | ✓ | ✓ | ✓ | ✓ | ✓ | ✓ | ✓ | Zone and Feeder Main Agents + additional Micro-grid Agent | MATLAB | JADE | Average | Average |
Publisher’s Note: MDPI stays neutral with regard to jurisdictional claims in published maps and institutional affiliations. |
© 2022 by the authors. Licensee MDPI, Basel, Switzerland. This article is an open access article distributed under the terms and conditions of the Creative Commons Attribution (CC BY) license (https://creativecommons.org/licenses/by/4.0/).
Share and Cite
MDPI and ACS Style
Abdelhamid, A.M.; Zakzouk, N.E.; El Safty, S. A Multi-Agent Approach for Self-Healing and RES-Penetration in Smart Distribution Networks. Mathematics 2022, 10, 2275. https://0-doi-org.brum.beds.ac.uk/10.3390/math10132275
AMA Style
Abdelhamid AM, Zakzouk NE, El Safty S. A Multi-Agent Approach for Self-Healing and RES-Penetration in Smart Distribution Networks. Mathematics. 2022; 10(13):2275. https://0-doi-org.brum.beds.ac.uk/10.3390/math10132275
Chicago/Turabian StyleAbdelhamid, Ahmed Maged, Nahla E. Zakzouk, and Samah El Safty. 2022. "A Multi-Agent Approach for Self-Healing and RES-Penetration in Smart Distribution Networks" Mathematics 10, no. 13: 2275. https://0-doi-org.brum.beds.ac.uk/10.3390/math10132275
Note that from the first issue of 2016, this journal uses article numbers instead of page numbers. See further details here.