
HJ-Biplot as a Tool to Give an Extra Analytical Boost for the Latent Dirichlet Assignment (LDA) Model: With an Application to Digital News Analysis about COVID-19


Abstract
:1. Introduction
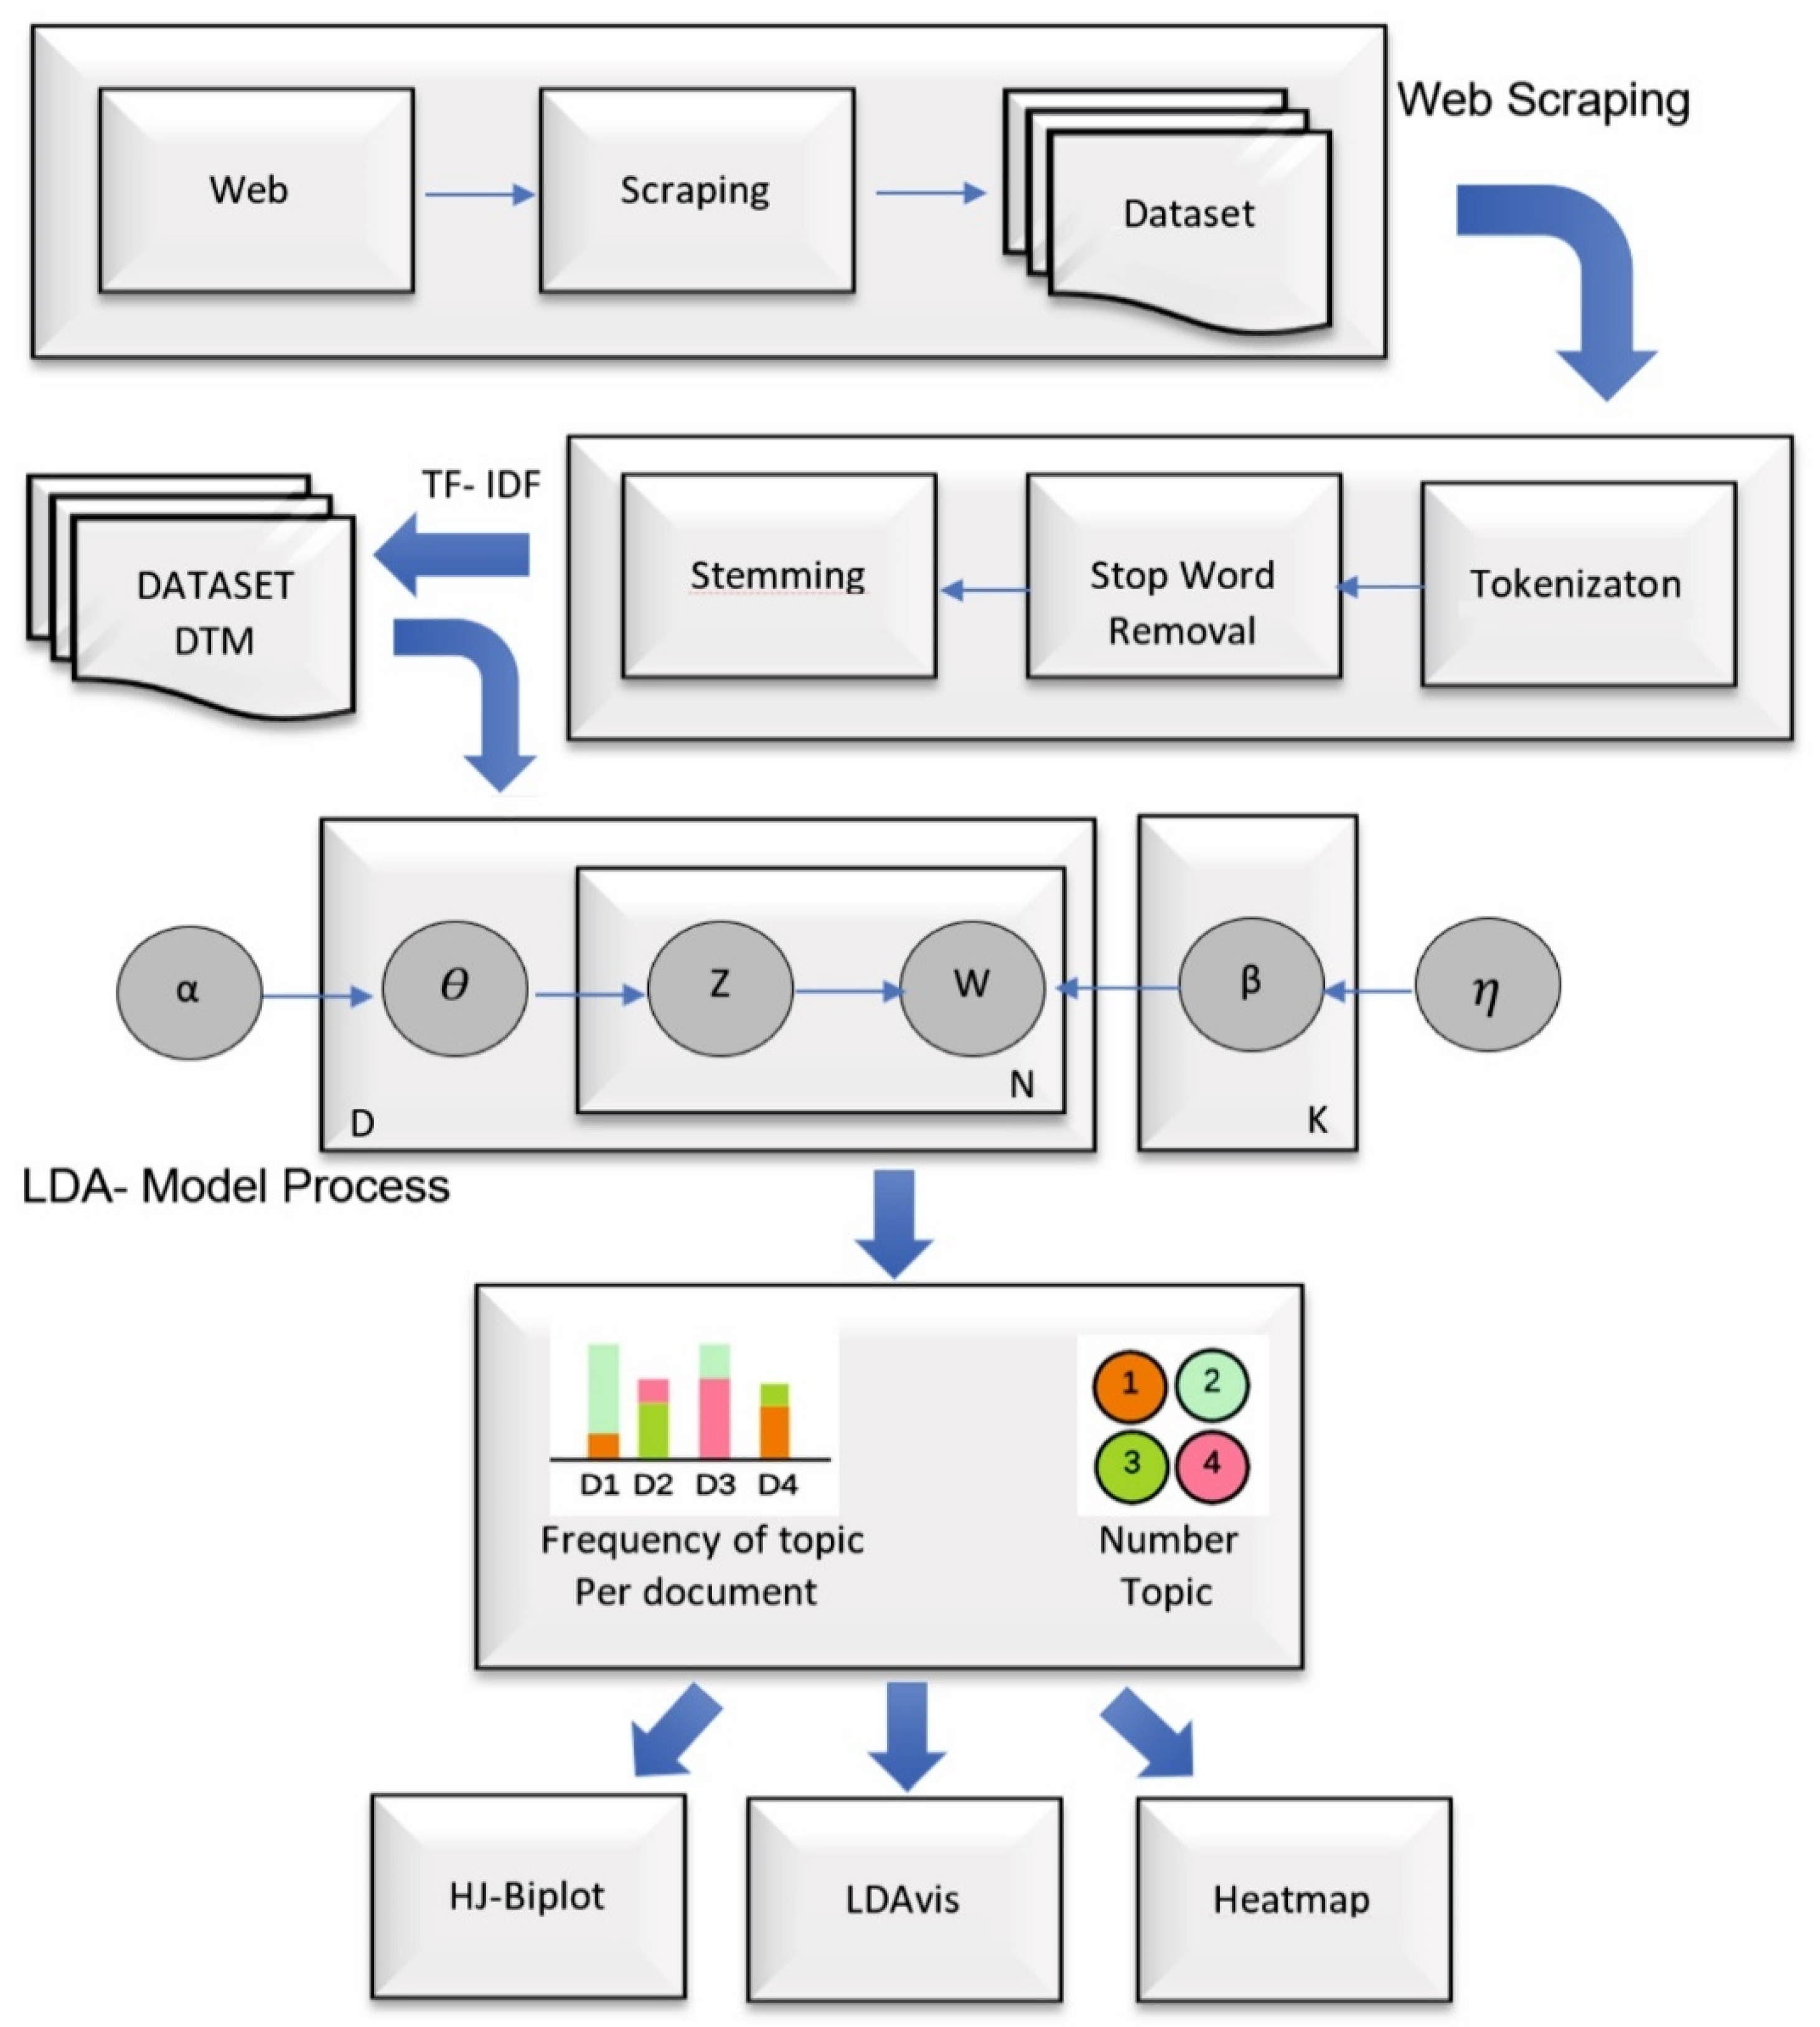
2. Materials and Methods
2.1. Web Data Extraction
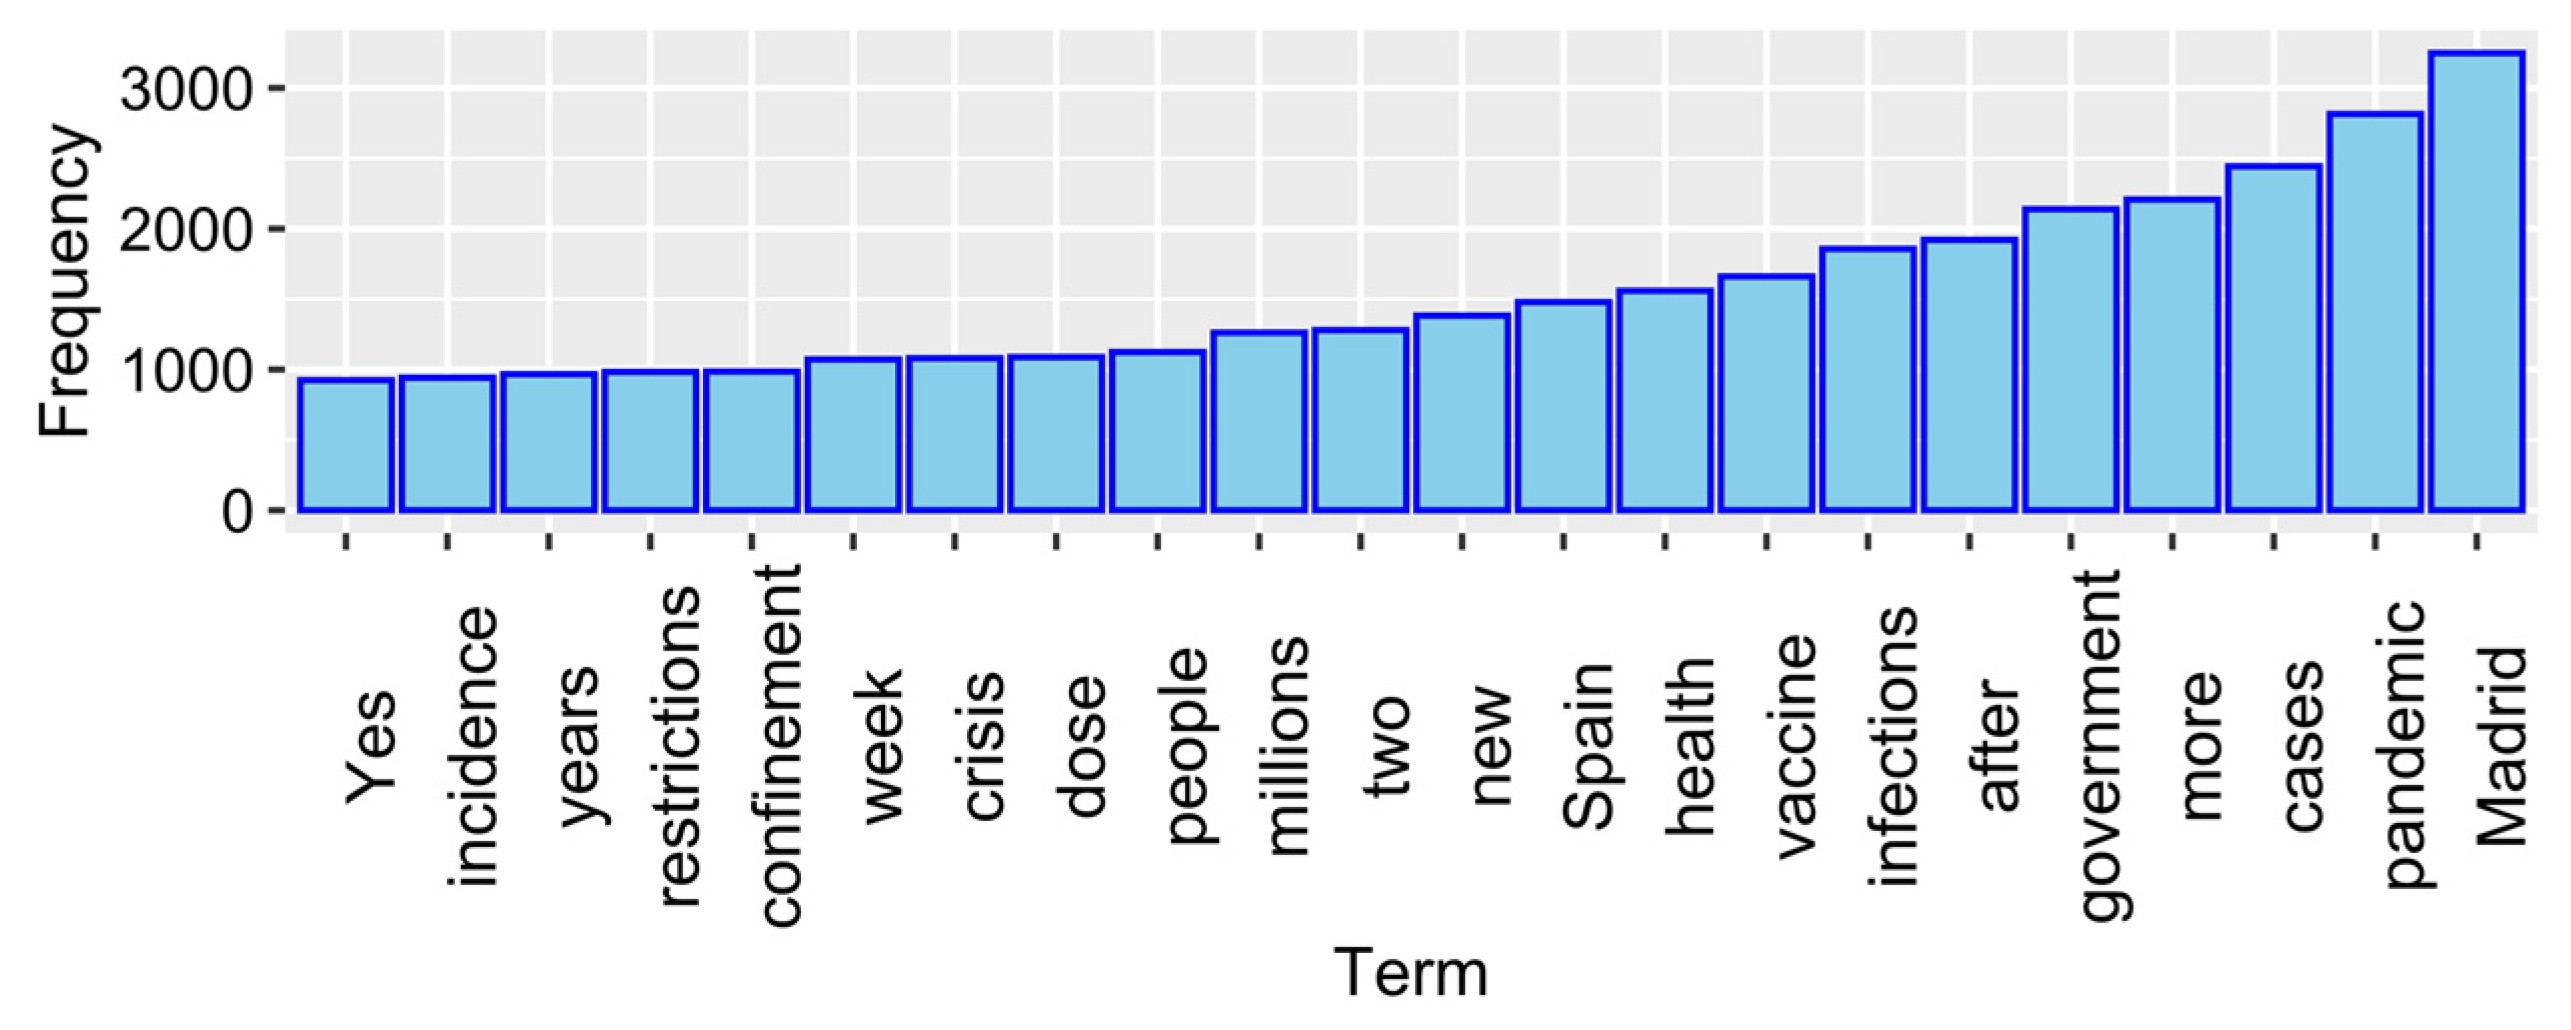
2.2. Term Frequency
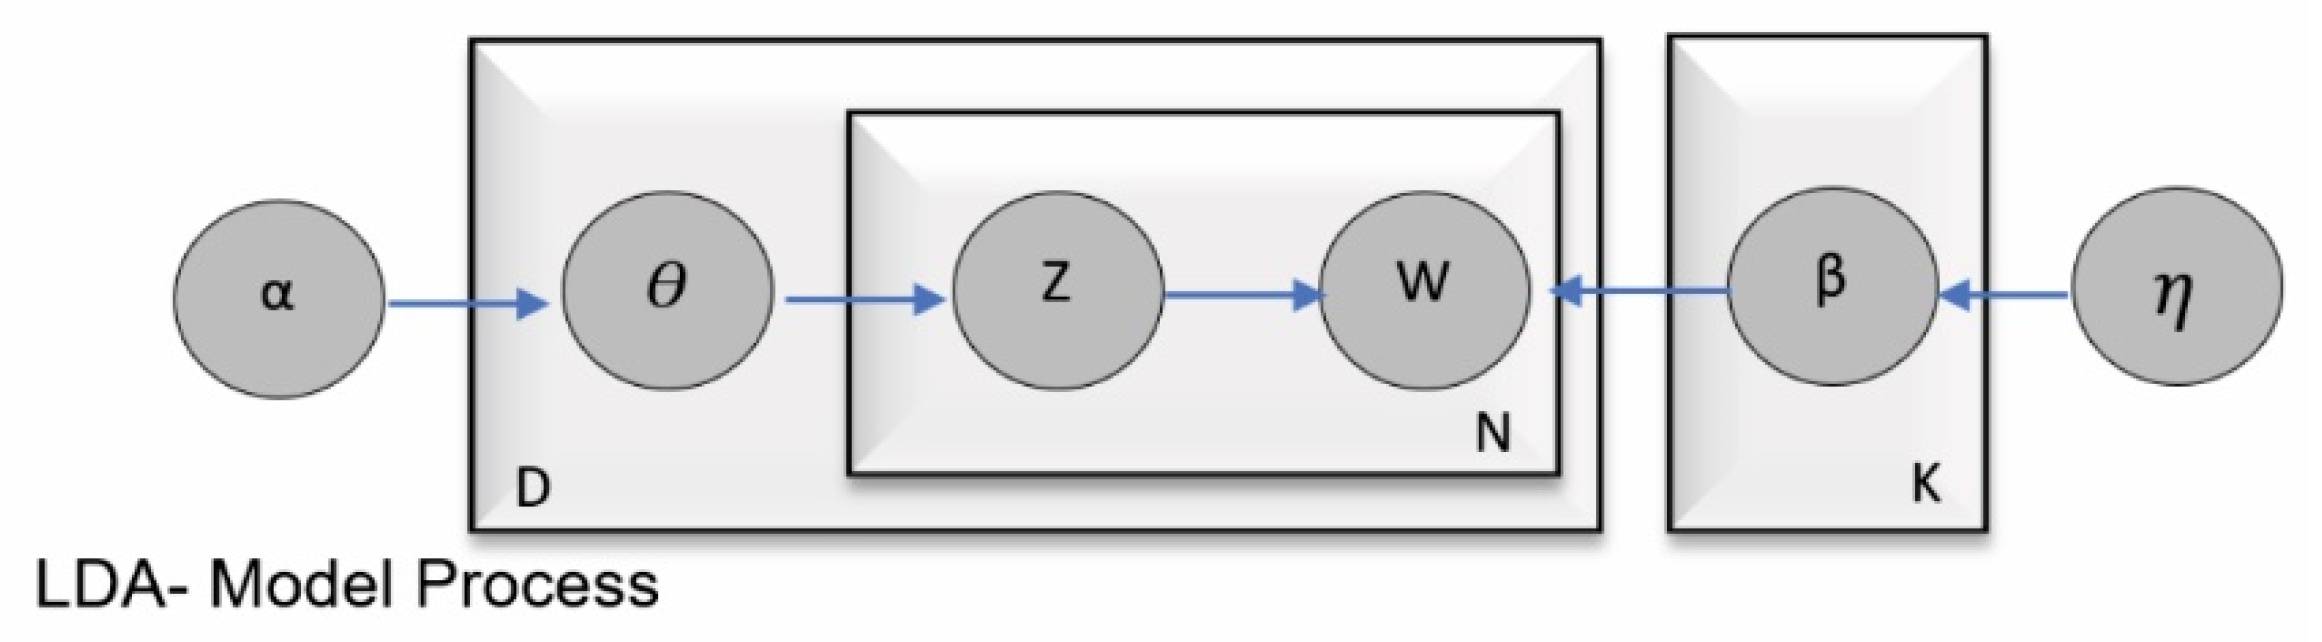
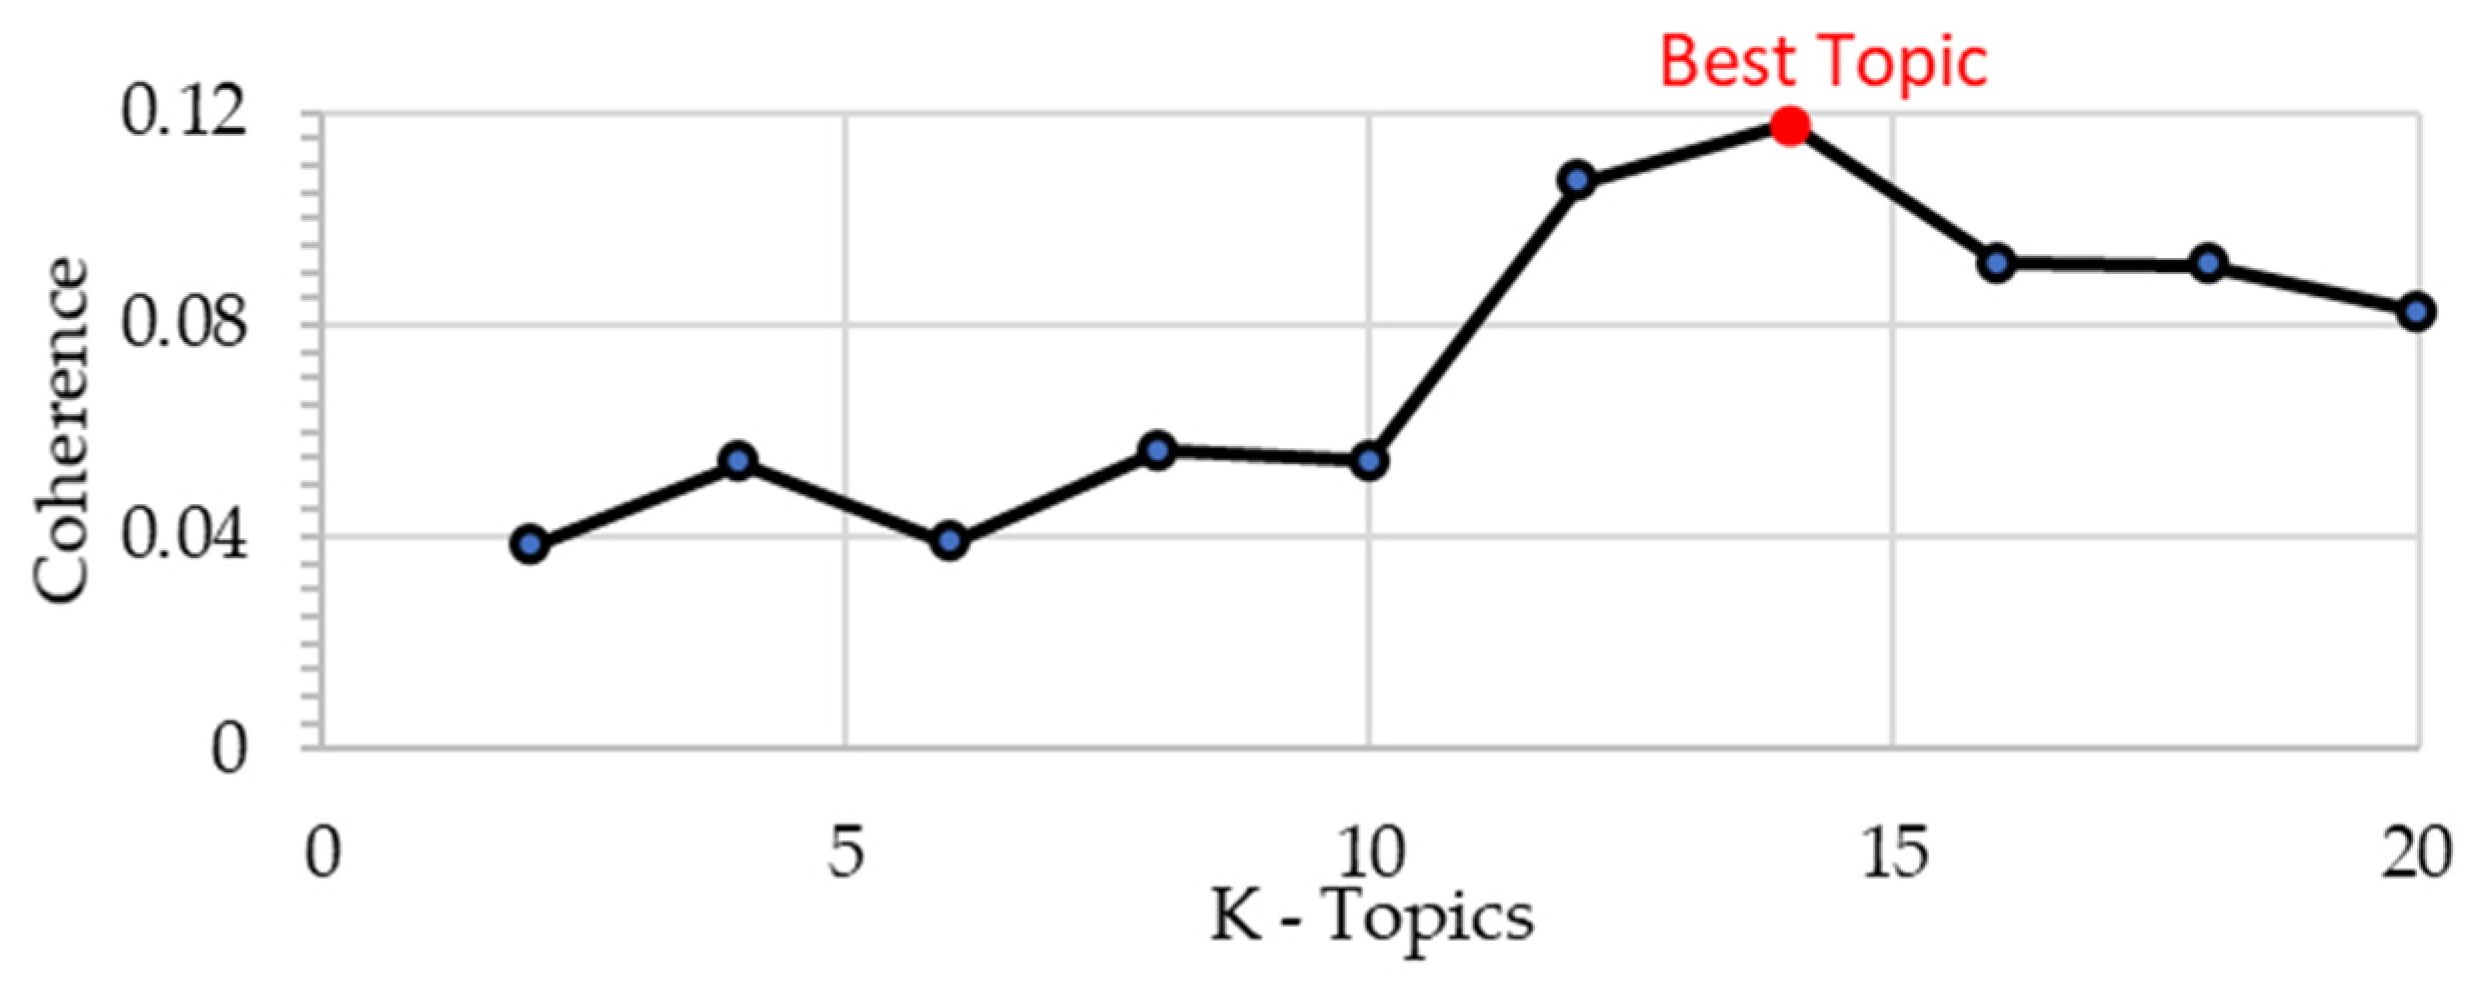
2.3. Latent Dirichlet Assignment (LDA)
- 1.
- For each topic K
- I.
- Draw a distribution over the words (i.e., vocabulary V),
- 2.
- For each document D:
- I.
- Draw a distribution over topics (i.e., ratio of the topic to document)
- II.
- For each word w within document D:
- i.
- Draw a topic assignment, (i.e., topic assignment per word)
- ii.
- draw a word
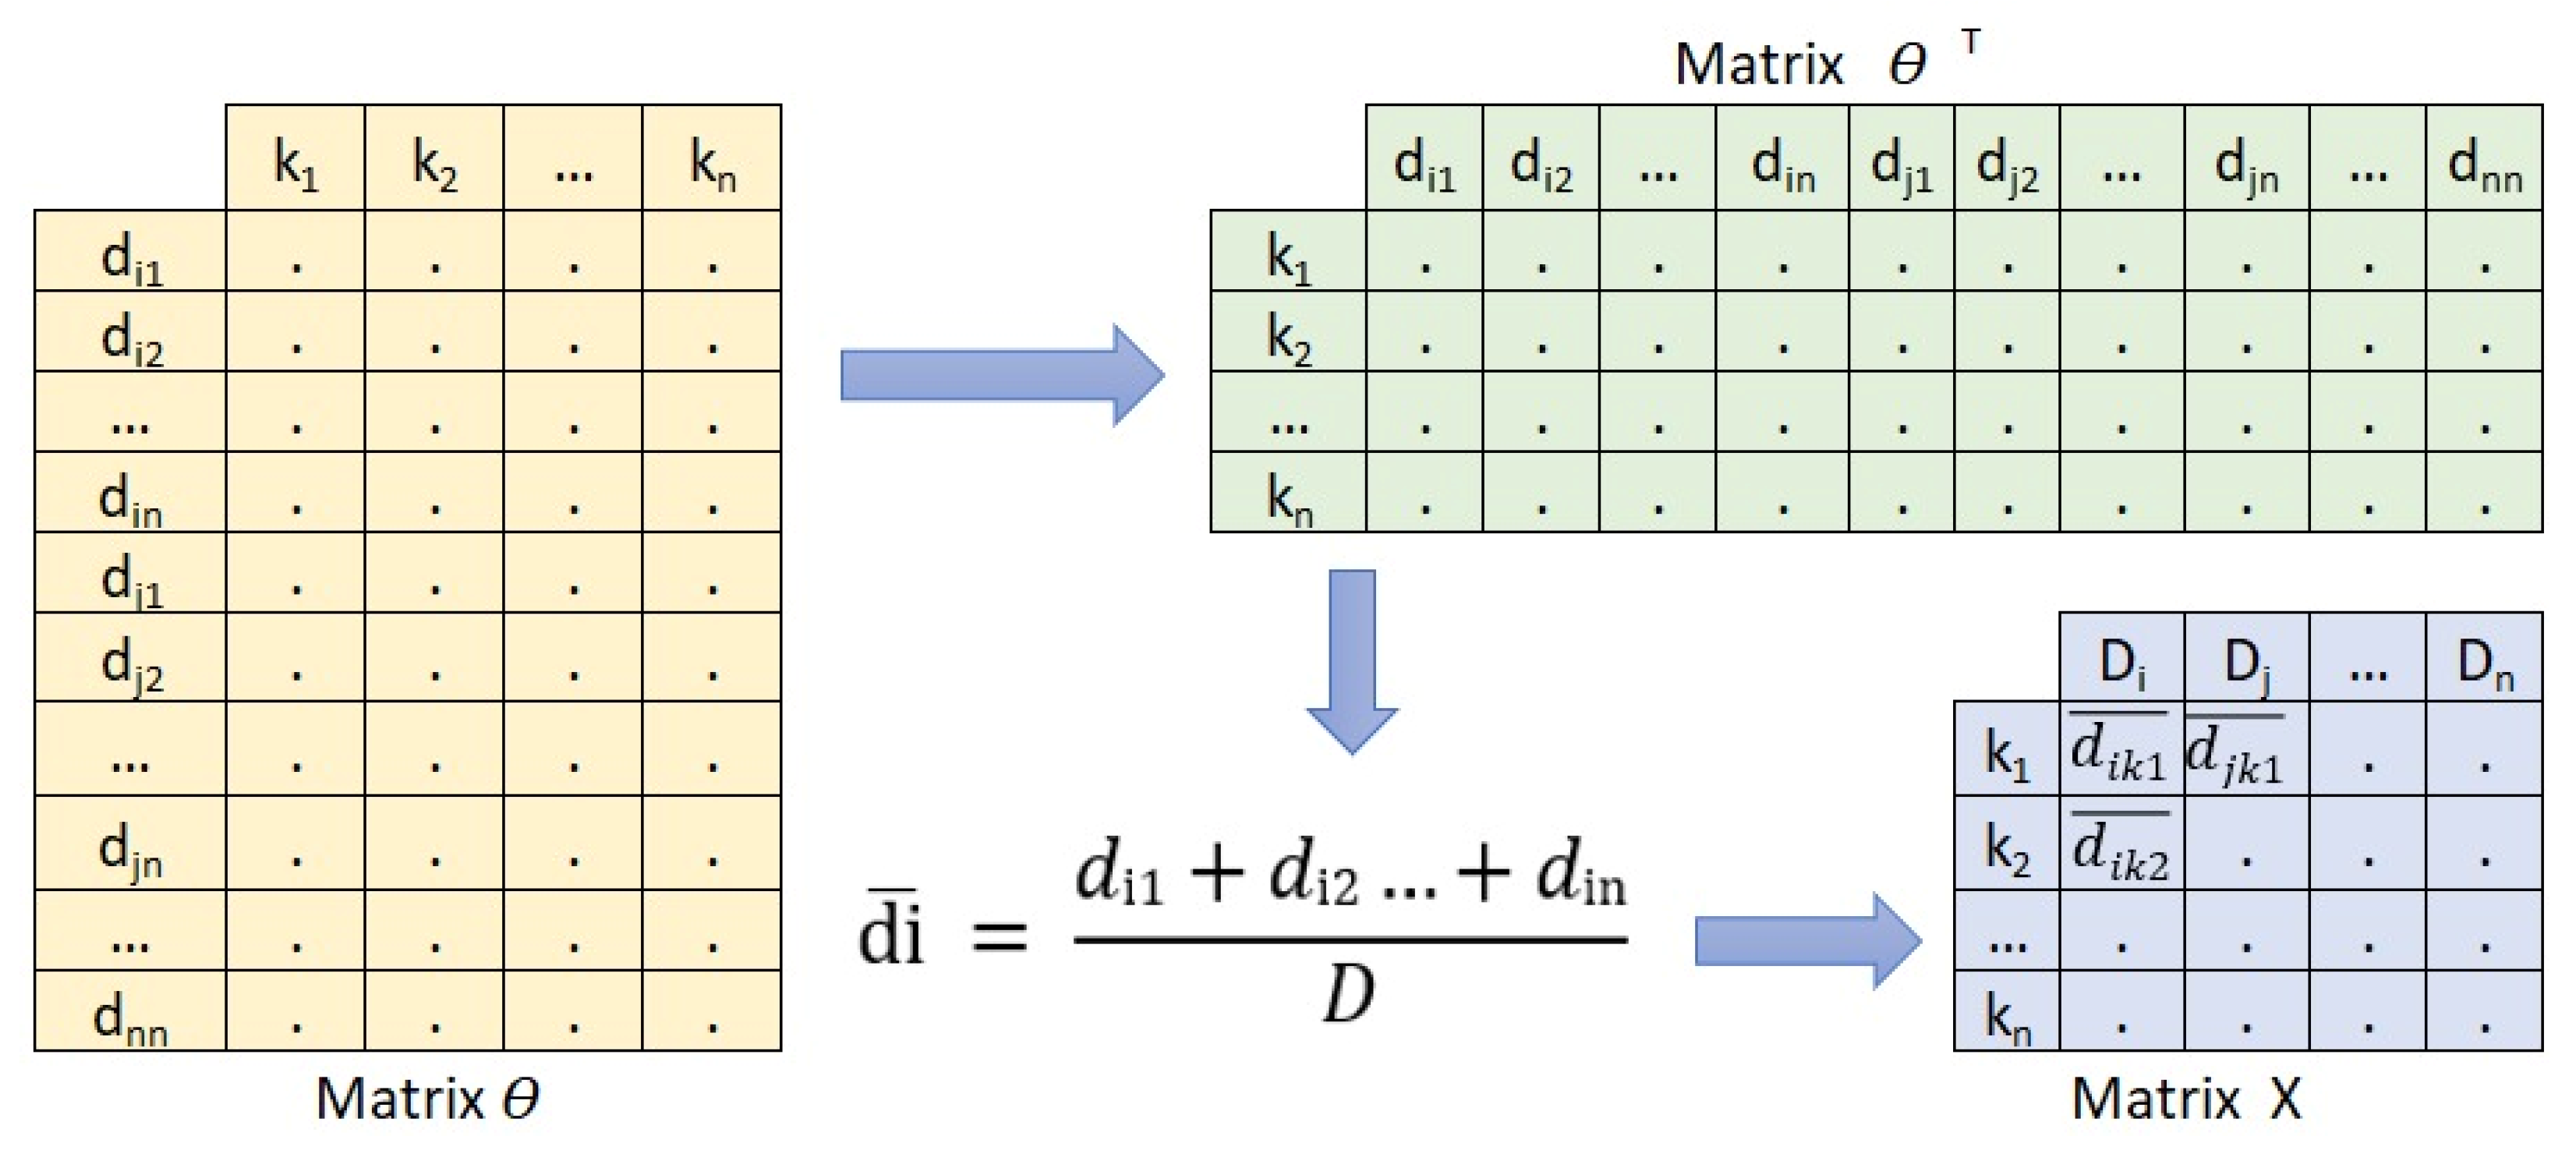
2.4. HJ-Biplot
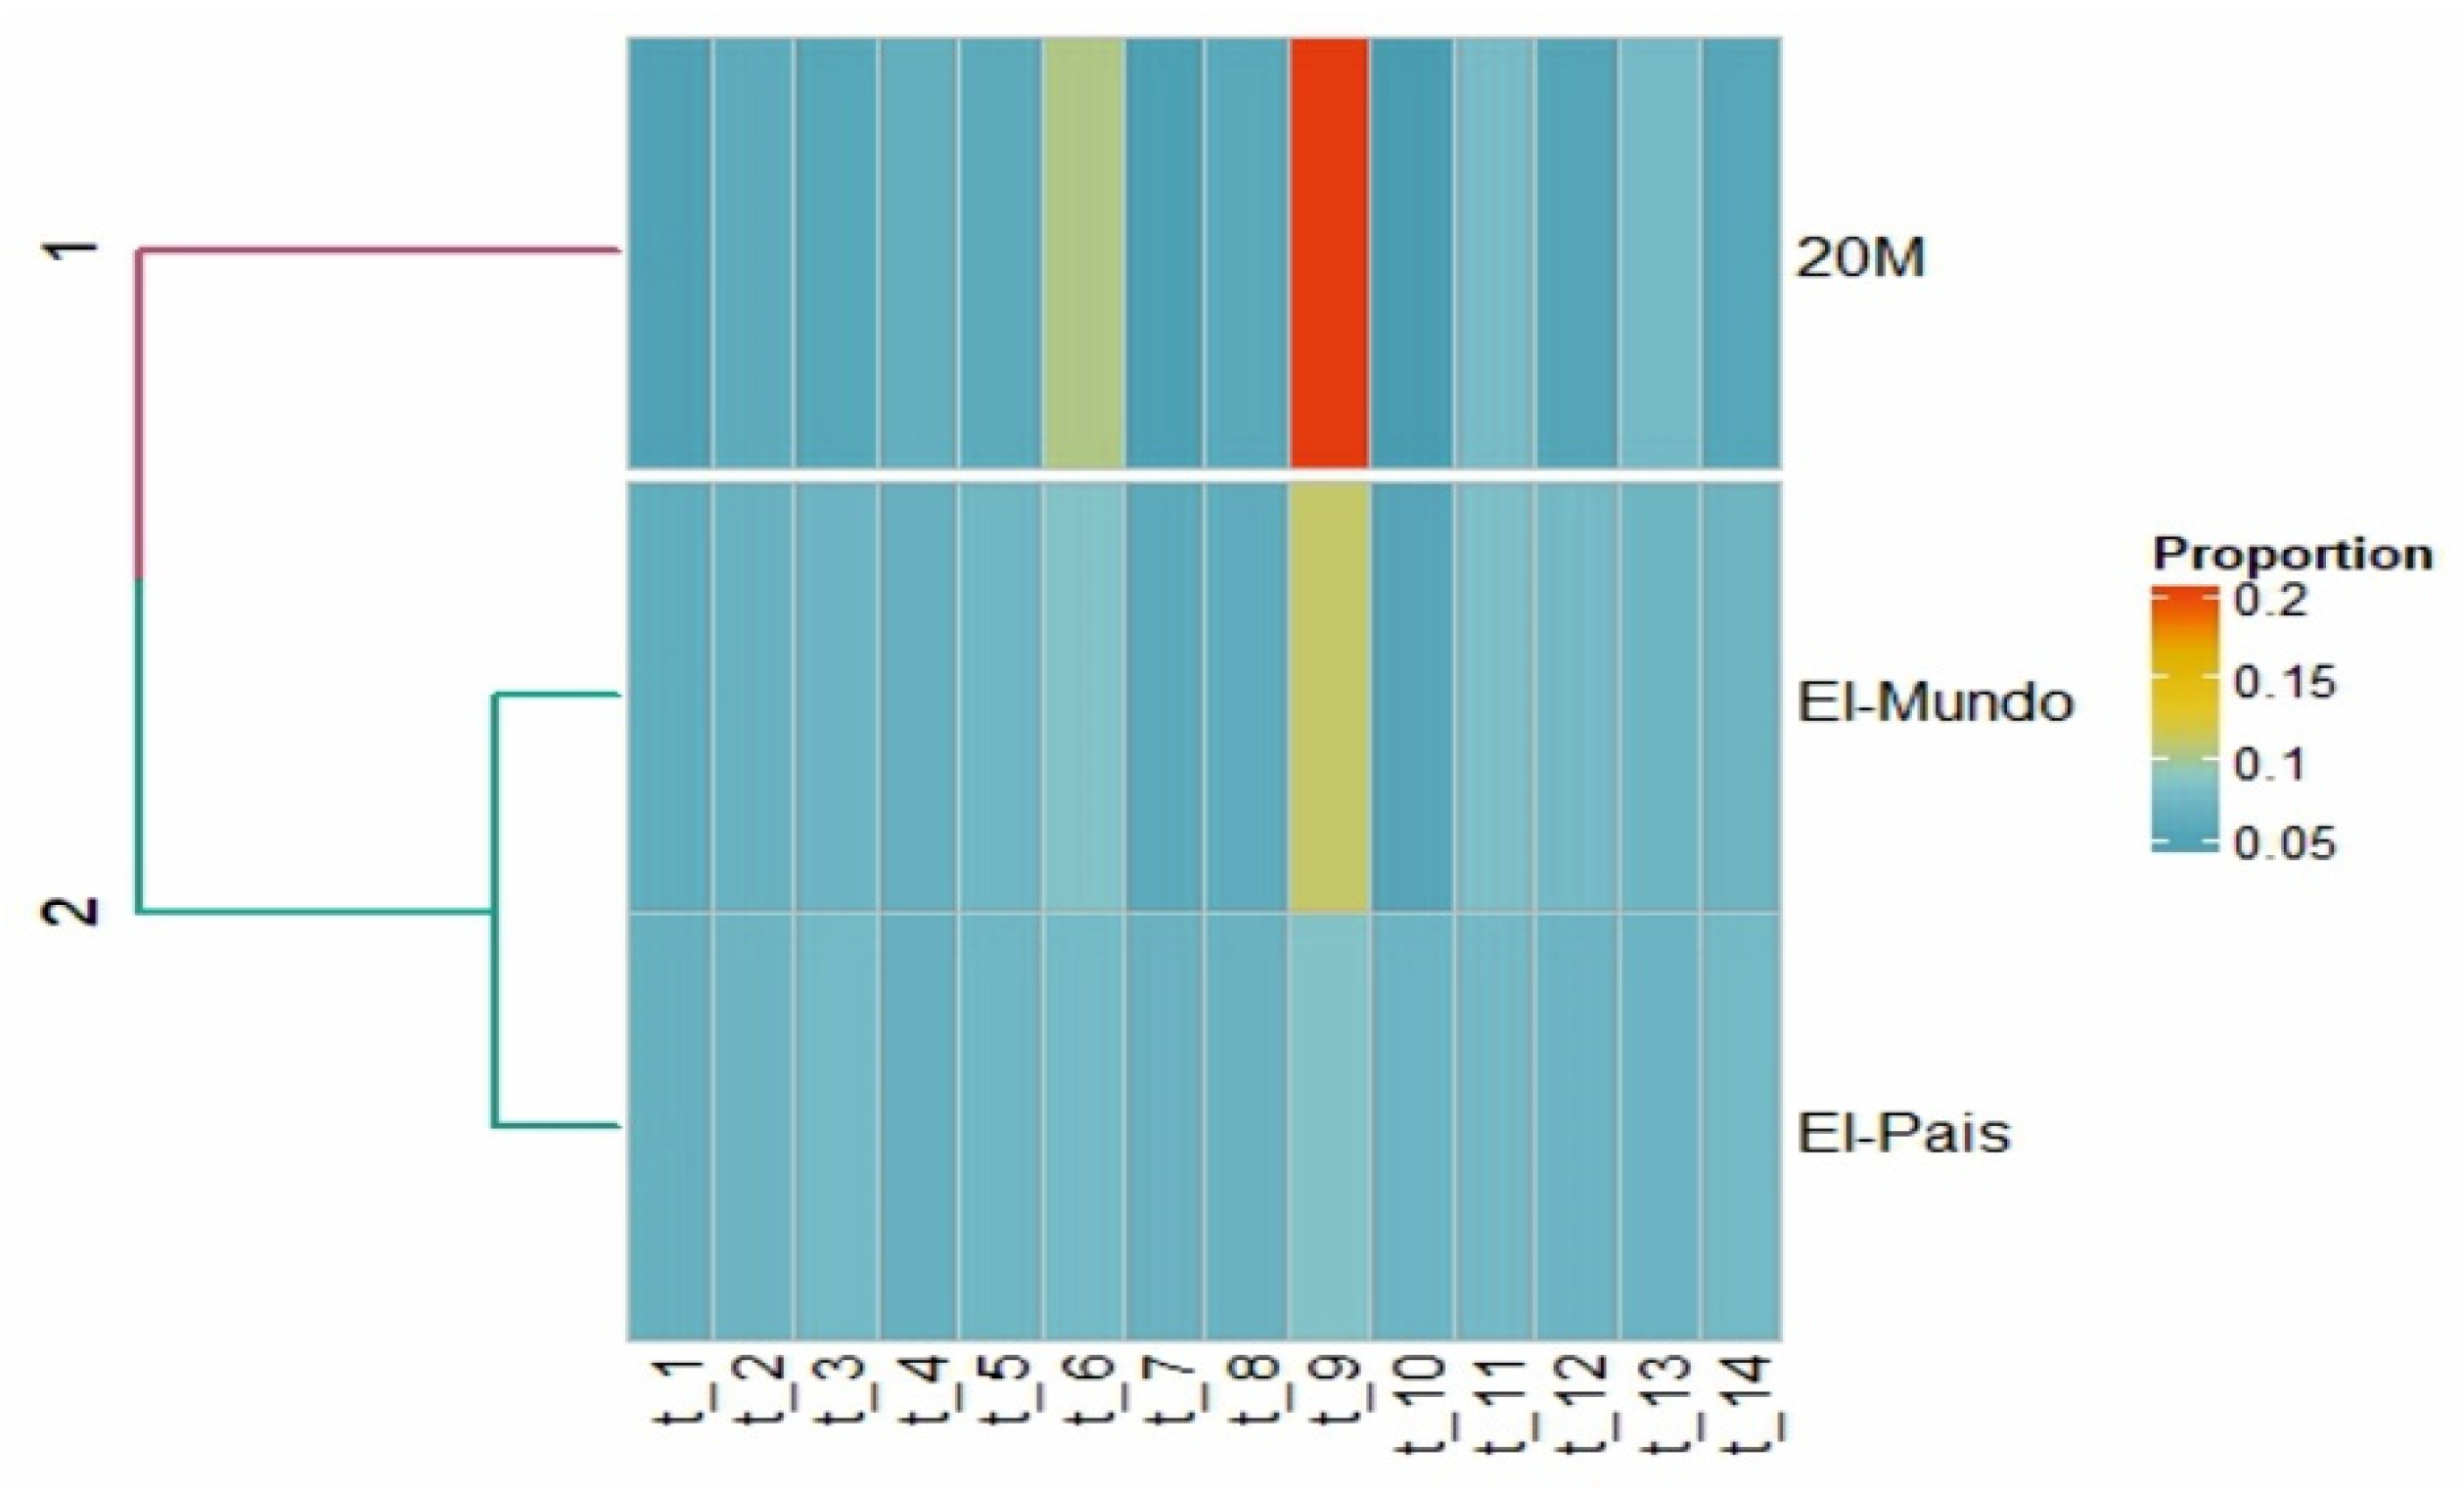
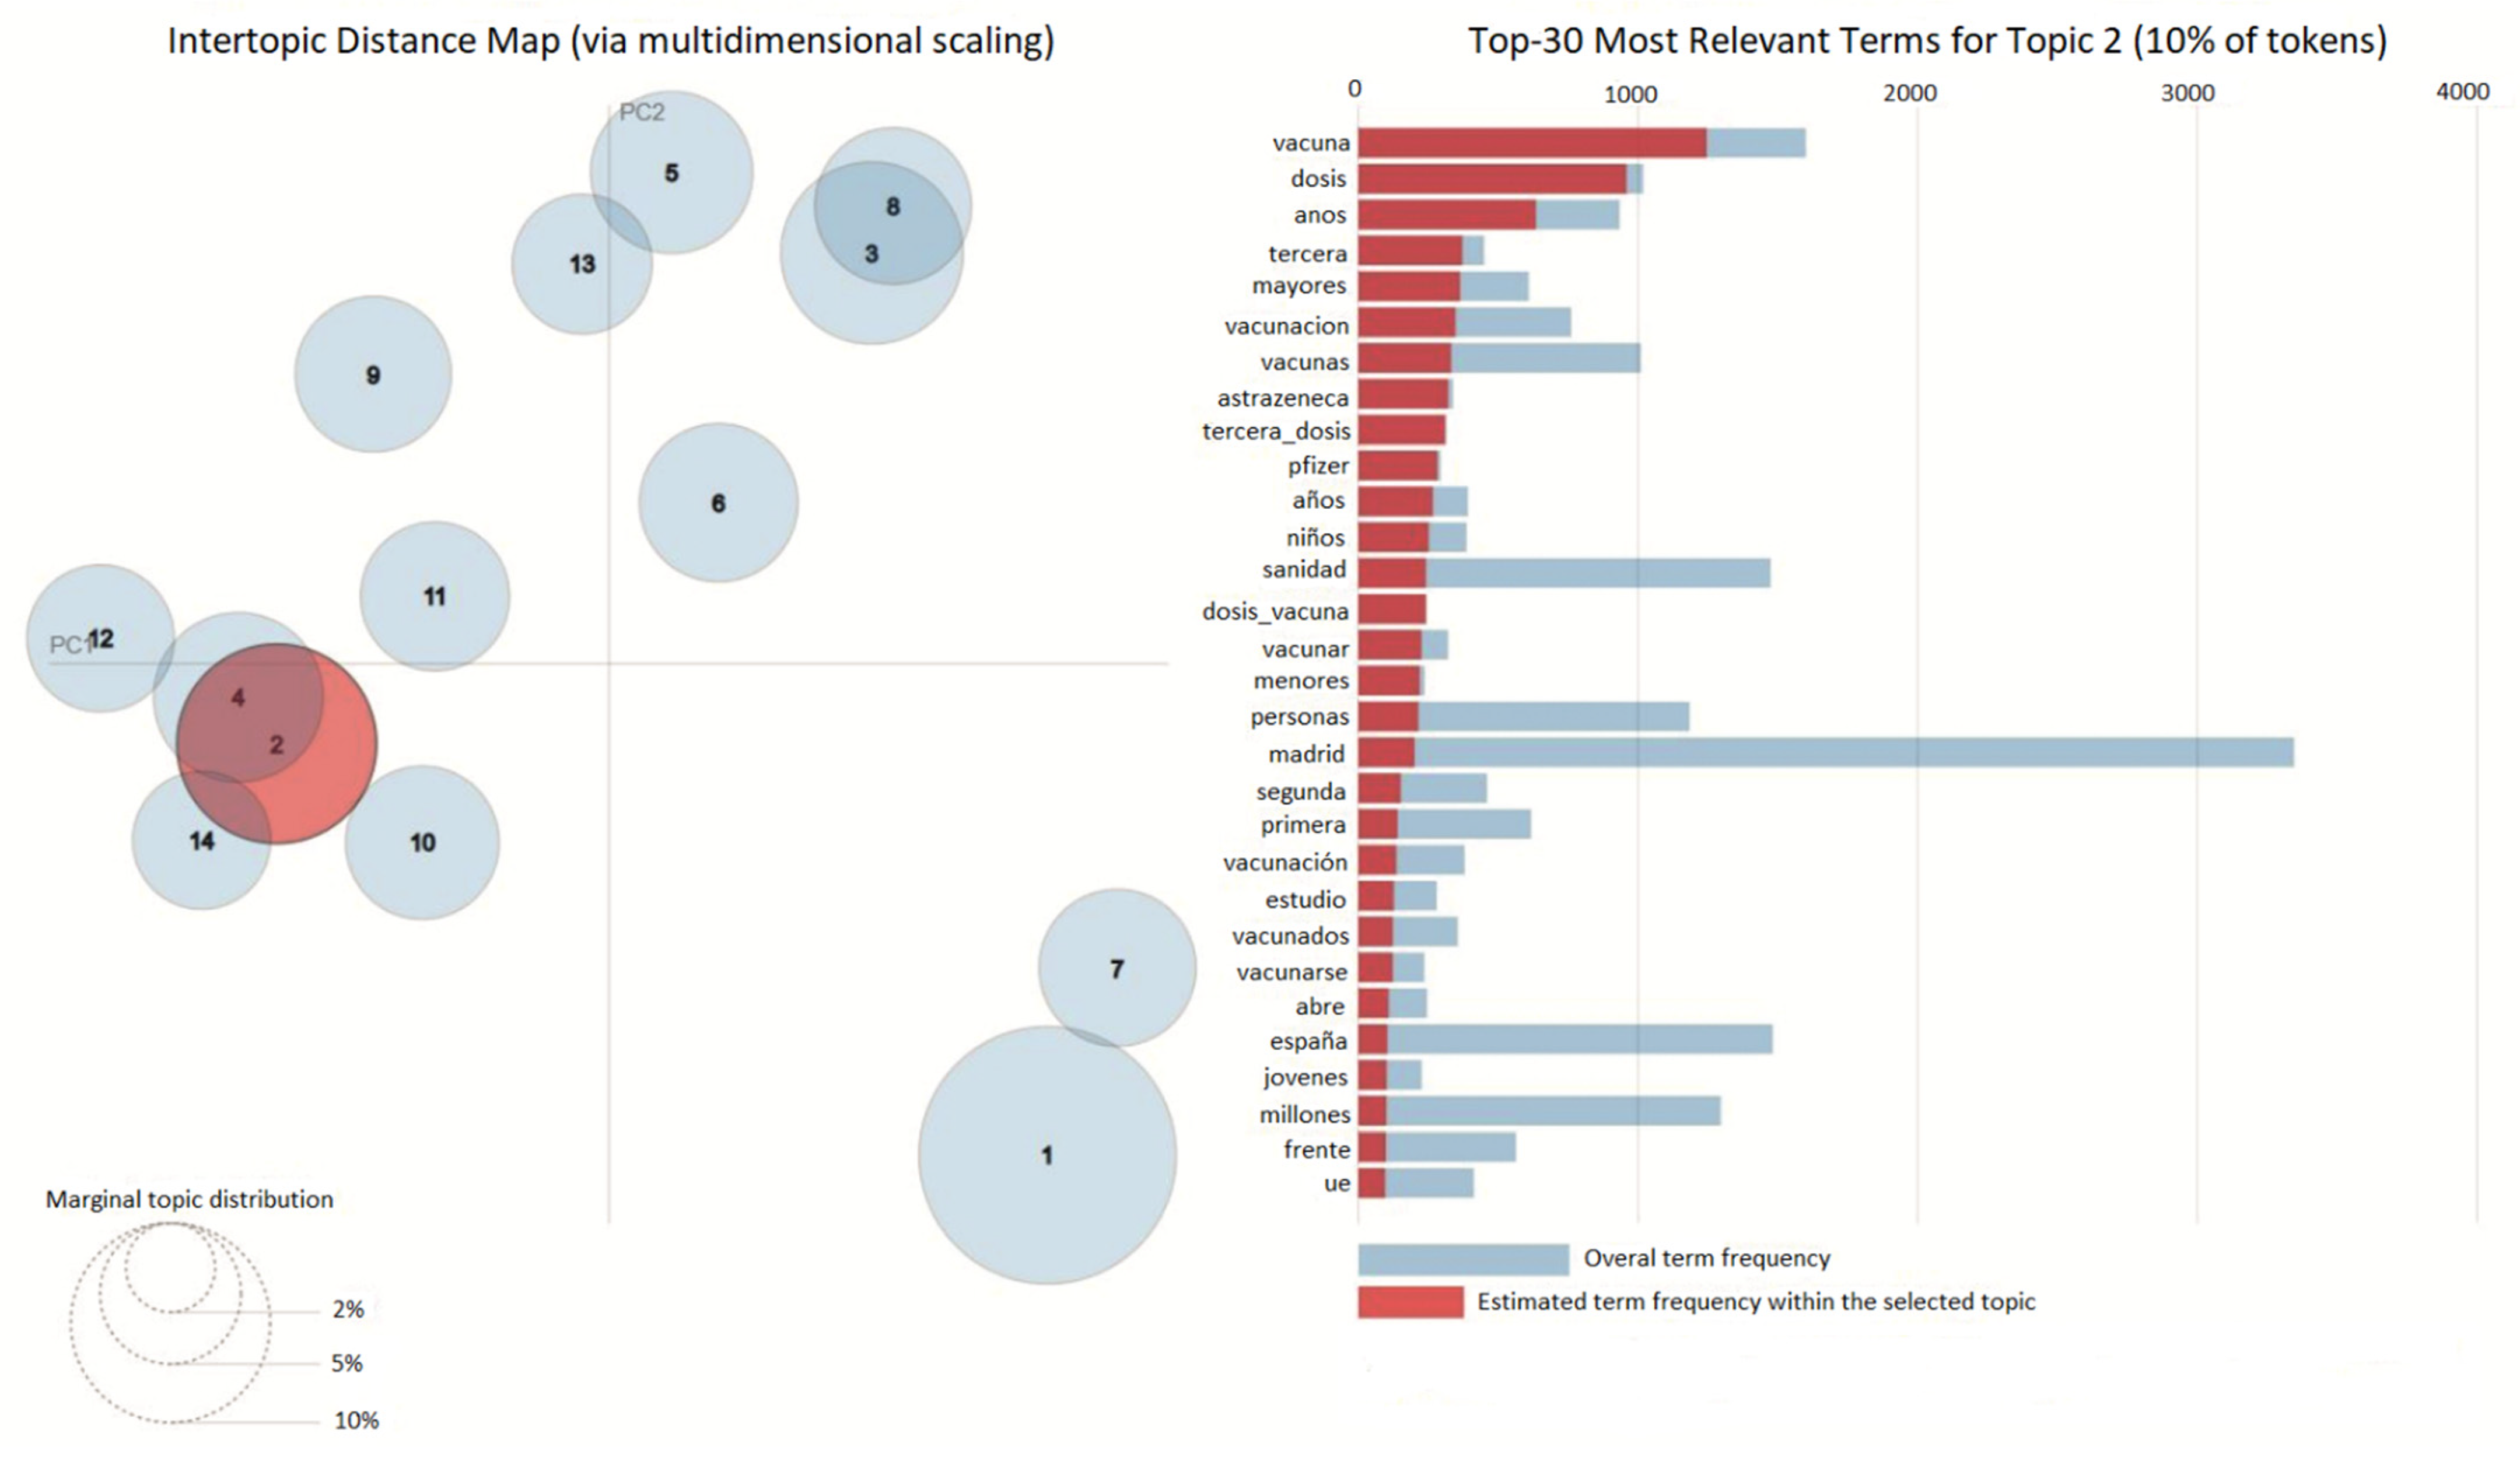
2.5. LDAvis and Heatmap
3. Results
3.1. Results LDAvis and Heatmap
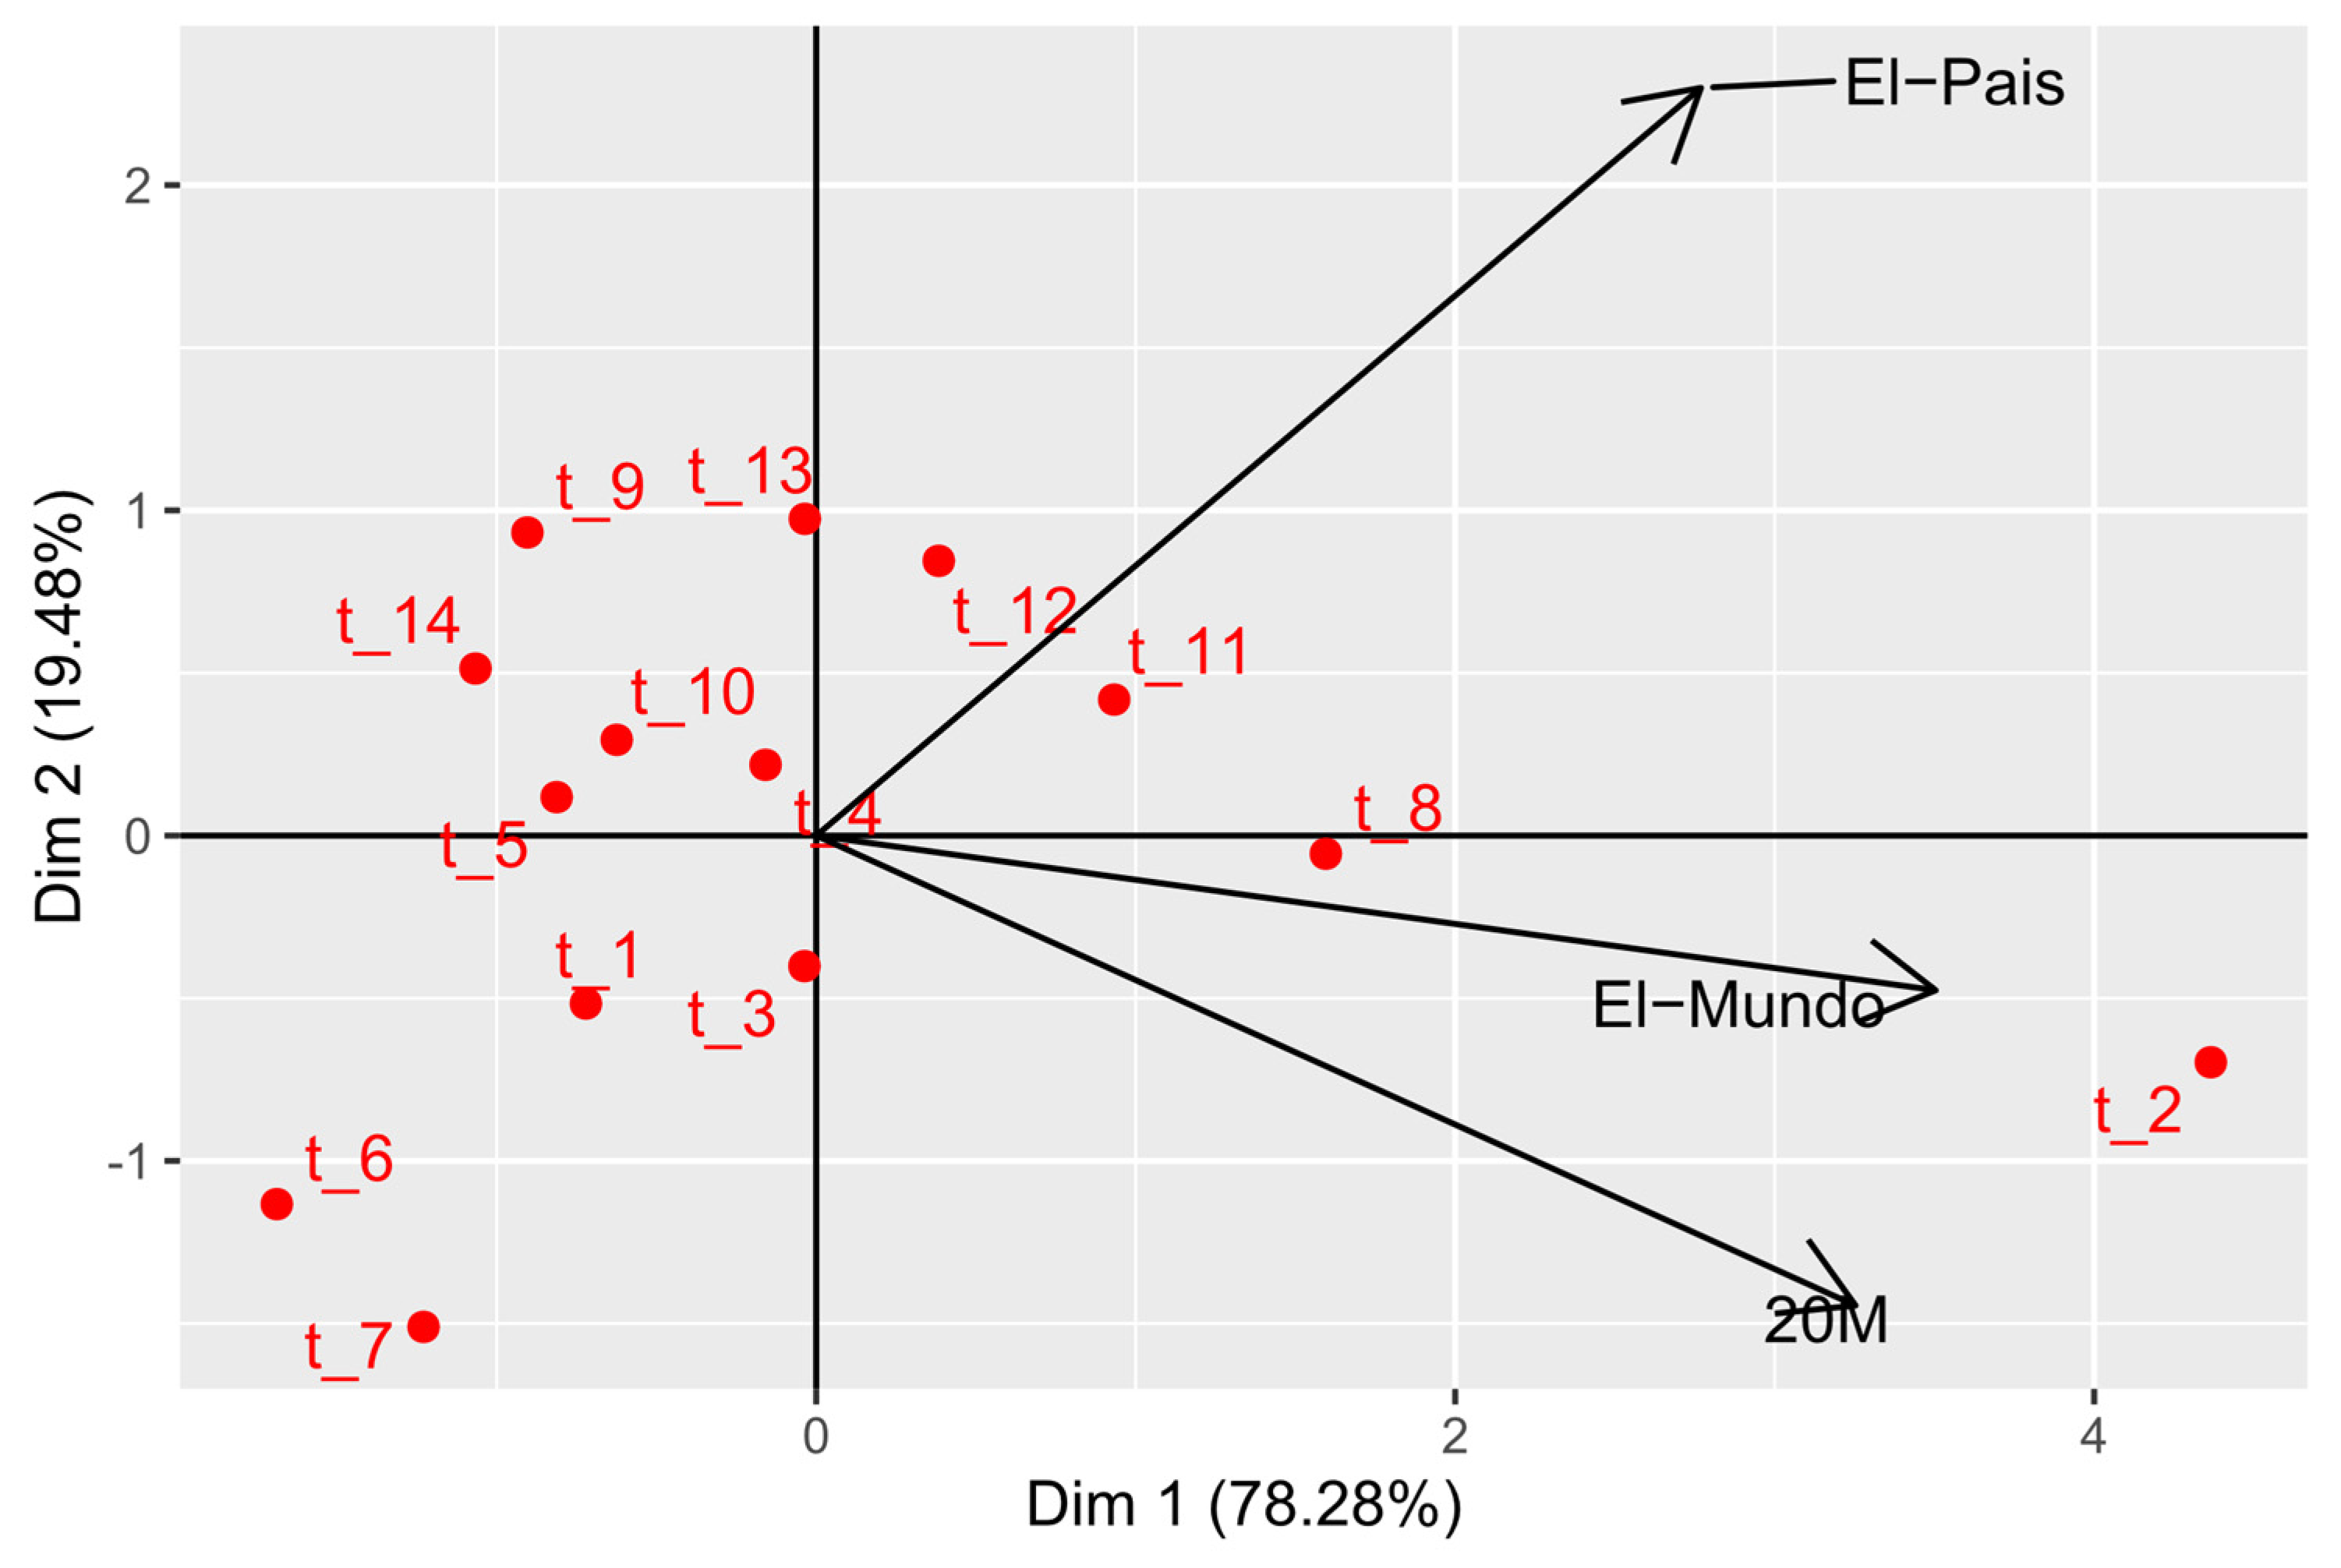
3.2. Results HJ-Biplot
4. Discussion
5. Conclusions
Author Contributions
Funding
Institutional Review Board Statement
Informed Consent Statement
Data Availability Statement
Conflicts of Interest
Appendix A

| Topics | Label Topics | Coherence | Prevalence | Top Terms |
|---|---|---|---|---|
| t_1 | Positive_Cases | 0.046 | 6.533 | positive, gives, dies, months, years, days, three, quarantine, give, after, hospital, test, first, four, Madrid, six, five, UCI, pandemic, days, home, ago, case, life, trump, virus, anus, seven, fear, years, weeks, people, health, Barcelona, mask, patients, USA, returns, PCR, less |
| t_2 | New_Contagions | 0.138 | 11.359 | cases, new, infections, incidence, health, deaths, registered, deceased, hours, Spain, new_cases, week, dead, positive, sum, notifies, UCI, Balearic, islands, low, new_infections, day, Madrid, last, figure, last_hours, continues, exceeds, Cantabria, Euskadi, pandemic, almost, hospitalized, last, income, increase, four, Spain, risk, three, decrease |
| t_3 | New_Variant | 0.166 | 7.178 | new, variant, omicron, kingdom, united, united_kingdom, span, Europe, virus, normality, who, quarantine, Johnson, first, Spain, case, restrictions, confinement, pandemic, country, vaccinated, asi, Germany, alert, risk, puts, EU, vaccines, France, Italy, new, test, vaccine, wave, cases, return, tourism, united, returns, experts |
| t_4 | Third_dose | 0.021 | 6.919 | residences, Madrid, hospital, outbreak, health, residence, elderly, hospitals, elderly, health, patients, centers, infected, test, positive, people, health, three, new, workers, UCI, virus, Valencia, masks, missing, PCR, pandemic, four, Generalitat, less, dead, leave, health, board, Catalonia, Barcelona, get vaccinated, Ayuso, ask, death |
| t_5 | Community_Madrid | 0.205 | 6.359 | community, Madrid, Valenciano, valencia_community, madrid_community, phase, Monday, test, de-escalation, health, week, closure, Generalitat, leave, restrictions, cvirus, government, passport, vaccination, Catalonia, Ayuso, health, residences, PCR, may, masks, Barcelona, requests, infections, measures, people, mask, pandemic, centers, vaccination, hospitals, bars, areas, leisure, Spain |
| t_6 | Vaccines_people | 0.013 | 5.8 | vaccines, people, pandemic, millions, Spain, complete, vaccination, world, population, like this, year, less, rioja, almost, front, half, first, exceeds, vaccine, greater, EU, Galicia, ago, country, Europe, months, Spain, study, virus, six, crisis, summer, three, great, children, dose, USA, vaccinated, years, five |
| t_7 | Measures_Pedro_Sanchez | 0.146 | 6.272 | Sanchez, cases, active, Pedro, active_cases, Pedro_Sanchez, day, Galicia, rioja, infections, alarm, days, deceased, decrease, increase, municipalities, new, new, Sanchez, government, positive, new_contagions, week, pp, hospitalized, Spain, requests, exceeds, less, announces, citizens, low, cvirus, crisis, continues, centers, front, maintains, pandemic, plan |
| t_8 | Dose_Vaccine | 0.121 | 8.65 | vaccine, dose, years, third, older, vaccination, vaccines, AstraZeneca, third_dose, Pfizer, years, children, health, vaccine_dose, vaccinate, minors, people, Madrid, second, first, vaccination, study, vaccinated, get vaccinated, open, Spain, young people, millions, front, EU, population, residences, week, risk, less, USA, leave, health, experts, months |
| t_9 | USA_Pandemic | 0.114 | 6.2 | pandemic, China, Mexico, USA, USA, uu, city, who, world, trump, vaccine, virus, united, new, new, alert, crisis, vaccination, first, great, vaccines, Johnson, year, millions, Europe, case, USA, how, outbreak, health, variant, major, ask, medium, announce, normality, home, health, government, EU |
| t_10 | Wave_Pandemic | 0.066 | 6.51 | pandemic, wave, first, second, time, risk, Spain, virus, greater, worse, Spain, contagion, infections, world, middle, year, ICU, life, crisis, death, third, year, fear, new, confinement, new, alert, low, Europe, less, incidence, front, hospitals, asi, month, study, week, health, health, China |
| t_11 | Curfew | 0.276 | 7.89 | restrictions, Madrid, curfew, touch, touch, stay, measures, closure, new, confinement, people, government, Catalonia, bars, leisure, request, municipalities, passport, areas, infections, Barcelona, week, Catalonia, Andalusia, Christmas, close, alarm, health, communities, mask, curb, Generalitat, meeting, avoid, start, Monday, three, healthcare, weigh, six, maintain |
| t_12 | Government_Madrid | 0.027 | 7.316 | government, Madrid, Ayuso, ask, pp, crisis, measures, alarm, masks, pandemic, Sanchez, citizens, plan, front, ask, Sanchez, confinement, communities, de-escalation, health, avoid, test, says, new, virus, now, health, mask, EU, phase, lack, residences, sanitary, return, weigh, announce, Christmas, sanitary, put, data |
| t_13 | Government_Millions | 0.023 | 6.925 | millions, government, pandemic, euros, crisis, companies, erte, aid, workers, tourism, sector, plan, Spain, masks, Barcelona, year, summer, less, announce, almost, request, Generalitat, Madrid, year, test, health, board, work, month, middle, half, front, first, may, EU, health, new, Sanchez, leave, Spain |
| t_14 | House_confinement | 0.004 | 6.09 | home, confinement, Madrid, quarantine, children, mask, how, students, day, homecoming, course, street, masks, alarm, first, today, Spain, work, pandemic, so, Monday, leave, may, government, less, Catalonia, Barcelona, de-escalation, now, children, days, phase, restrictions, life, avoid, fear, France, close, day, normality |
References
- He, W.; Zha, S.; Li, L. Social Media Competitive Analysis and Text Mining: A Case Study in the Pizza Industry. Int. J. Inf. Manag. 2013, 33, 464–472. [Google Scholar] [CrossRef]
- Alalwan, A.A.; Rana, N.P.; Dwivedi, Y.K.; Algharabat, R. Social Media in Marketing: A Review and Analysis of the Existing Literature. Telemat. Inform. 2017, 34, 1177–1190. [Google Scholar] [CrossRef] [Green Version]
- Pejic-Bach, M.; Bertoncel, T.; Meško, M.; Krstić, Ž. Text Mining of Industry 4.0 Job Advertisements. Int. J. Inf. Manag. 2020, 50, 416–431. [Google Scholar] [CrossRef]
- De la Hoz-M, J.; Fernández-Gómez, M.J.; Mendes, S. LDAShiny: An R Package for Exploratory Review of Scientific Literature Based on a Bayesian Probabilistic Model and Machine Learning Tools. Mathematics 2021, 9, 1671. [Google Scholar] [CrossRef]
- Slobodin, O.; Plochotnikov, I.; Cohen, I.-C.; Elyashar, A.; Cohen, O.; Puzis, R. Global and Local Trends Affecting the Experience of US and UK Healthcare Professionals during COVID-19: Twitter Text Analysis. Int. J. Environ. Res. Public Health 2022, 19, 6895. [Google Scholar] [CrossRef]
- WHO. COVID-19 Weekly Epidemiological Update; WHO: Geneva, Switzerland, 2022. [Google Scholar]
- Zhu, N.; Zhang, D.; Wang, W.; Li, X.; Yang, B.; Song, J.; Zhao, X.; Huang, B.; Shi, W.; Lu, R.; et al. A Novel Coronavirus from Patients with Pneumonia in China, 2019. N. Engl. J. Med. 2020, 382, 727–733. [Google Scholar] [CrossRef]
- Brüssow, H. The Novel Coronavirus—A Snapshot of Current Knowledge. Microb. Biotechnol. 2020, 13, 607–612. [Google Scholar] [CrossRef]
- McKibbin, W.J.; Fernando, R. The Global Macroeconomic Impacts of COVID-19: Seven Scenarios. SSRN Electron. J. 2020, 20, 1–30. [Google Scholar] [CrossRef] [Green Version]
- 20Minutos. ¿Cuál Fue El Primer Caso de Coronavirus en España y en La Península? Available online: https://www.20minutos.es/noticia/4186871/0/coronavirus-primer-caso-espana-peninsula/ (accessed on 15 April 2020).
- Estudio General de Medios Ranking de Diarios. Available online: http://reporting.aimc.es/index.html#/main/diarios (accessed on 16 April 2020).
- Mutz, D.C.; Soss, J. Reading Public Opinion: The Influence of News Coverage on Perceptions of Public Sentiment. Public Opin. Q. 1997, 61, 431. [Google Scholar] [CrossRef]
- Hoffman, L.H.; Glynn, C.J.; Huge, M.E.; Sietman, R.B.; Thomson, T. The Role of Communication in Public Opinion Processes: Understanding the Impacts of Intrapersonal, Media, and Social Filters. Int. J. Public Opin. Res. 2007, 19, 287–312. [Google Scholar] [CrossRef]
- Peretti, P.O.; Lucas, C. Newspaper Advertising Influences on Consumers’ Behavior by Socioeconomic Status of Customers. Psychol. Rep. 1975, 37, 693–694. [Google Scholar] [CrossRef]
- Thornton, J.A.; Wahl, O.F. Impact of a Newspaper Article on Attitudes toward Mental Illness. J. Community Psychol. 1996, 24, 17–25. [Google Scholar] [CrossRef]
- Baumgartner, R.; Gatterbauer, W.; Gottlob, G. Web Data Extraction System. Encycl. Database Syst. 2009, 1, 3465–3471. [Google Scholar]
- Collobert, R.; Weston, J.; Com, J.; Karlen, M.; Kavukcuoglu, K.; Kuksa, P. Natural Language Processing (Almost) from Scratch. J. Mach. Learn. Res. 2011, 12, 2493–2537. [Google Scholar] [CrossRef]
- Jones, K.S. A Statistical Interpretation of Term Specificity and Its Application in Retrieval. J. Doc. 1972, 28, 11–21. [Google Scholar] [CrossRef]
- Deerwester, S.; Harshman, R.; Susan, T.; George, W.; Thomas, K. Indexing by Latent Semantic Analysis. J. Am. Soc. Inf. Sci. 1990, 41, 391–407. [Google Scholar] [CrossRef]
- Blei, D.M.; Ng, A.Y.; Jordan, M.I. Latent Dirichlet Allocation. J. Mach. Learn. Res. 2003, 3, 993–1022. [Google Scholar] [CrossRef]
- Aldjanabi, W.; Dahou, A.; Al-Qaness, M.A.A.; Elaziz, M.A.; Helmi, A.M.; Damaševičius, R. Arabic Offensive and Hate Speech Detection Using a Cross-Corpora Multi-Task Learning Model. Informatics 2021, 8, 69. [Google Scholar] [CrossRef]
- Hadwan, M.; Al-Sarem, M.; Saeed, F.; Al-Hagery, M.A. An Improved Sentiment Classification Approach for Measuring User Satisfaction toward Governmental Services’ Mobile Apps Using Machine Learning Methods with Feature Engineering and SMOTE Technique. Appl. Sci. 2022, 12, 5547. [Google Scholar] [CrossRef]
- Sievert, C.; Shirley, K.E. LDAvis: A Method for Visualizing and Interpreting Topics. In Proceedings of the Workshop on Interactive Language Learning, Visualization, and Interfaces, Baltimore, MD, USA, 27 June 2014; Association for Computational Linguistics: Stroudsburg, PA, USA, 2014; pp. 63–70. [Google Scholar]
- Raivo Kolde. cran.r-project.org/package=pheatmap— Pheatmap: Pretty heatmaps. R Package Heatmap version 2.12.00. 2019. Available online: https://cran.r-project.org/web/packages/pheatmap/index.html/ (accessed on 15 April 2022).
- Galindo-Villardón, P. Una Alternativa de Representacion Simultánea: HJ-Biplot (An Alternative of Simultaneous Representation: HJ-Biplot). Questíio 1986, 10, 13–23. [Google Scholar]
- Díaz-Faes, A.A.; González-Albo, B.; Galindo, M.P.; Bordons, M. HJ-Biplot Como Herramienta de Inspección de Matrices de Datos Bibliométricos. Revista Española Documentación Científica 2013, 36, e001. [Google Scholar] [CrossRef] [Green Version]
- Julia, D.C.; Galindo, P.V.; Villardón, M.P.G. Grupos de Discusión y HJ-Biplot: Una Nueva Forma de Análisis Textual. Revista Ibérica Sistemas Tecnologias Informação 2014, E2, 19–35. [Google Scholar] [CrossRef]
- Zulaima, O.M. Contribuciones al Análisis de Datos Textuales; Universidad de Salamanca: Salamanca, Spain, 2006. [Google Scholar]
- Han, J.; Kamber, M.; Pei, J. Data Mining: Concepts and Techniques, 3rd ed.; Elsevier Inc.: Amsterdam, The Netherlands, 2012; ISBN 9780123814791. [Google Scholar]
- Fayyad, U.; Stolorz, P. Data Mining and KDD: Promise and Challenges. Futur. Gener. Comput. Syst. 1997, 13, 99–115. [Google Scholar] [CrossRef]
- Alyahyan, E.; Düştegör, D. Predicting Academic Success in Higher Education: Literature Review and Best Practices. Int. J. Educ. Technol. High. Educ. 2020, 17, 3. [Google Scholar] [CrossRef] [Green Version]
- The R Foundation R 2020. Available online: https://www.r-project.org/ (accessed on 1 May 2021).
- Manning, C.; Raghavan, P.; Schütze, H. Introduction to Information Retrieval; Cambridge University Press: Cambridge, UK, 2008; ISBN 9780511809071. [Google Scholar]
- Markov, Z.; Larose, D.T. Data Mining the Web: Uncovering Patterns in Web Content, Structure, and Usage; John Wiley & Sons: Hoboken, NJ, USA, 2007; ISBN 0470108088. [Google Scholar]
- Kamath, S.S.; Bagalkotkar, A.; Khandelwal, A.; Pandey, S.; Poornima, K. Sentiment Analysis Based Approaches for Understanding User Context in Web Content. In Proceedings of the 2013 International Conference on Communication Systems and Network Technologies, CSNT 2013, Gwalior, India, 6–8 April 2013; pp. 607–611. [Google Scholar]
- Catanese, S.A.; De Meo, P.; Ferrara, E.; Fiumara, G.; Provetti, A. Crawling Facebook for Social Network Analysis Purposes. In Proceedings of the International Conference on Web Intelligence, Mining and Semantics, Sogndal, Norway, 25–27 May 2011; ACM Press: New York, NY, USA, 2011; p. 1. [Google Scholar]
- Chandler, J.D.; Salvador, R.; Kim, Y. Language, Brand and Speech Acts on Twitter. J. Prod. Brand Manag. 2018, 27, 375–384. [Google Scholar] [CrossRef]
- Plake, C.; Schiemann, T.; Pankalla, M.; Hakenberg, J.; Leser, U. ALIBABA: PubMed as a Graph. Bioinformatics 2006, 22, 2444–2445. [Google Scholar] [CrossRef]
- Xie, X.; Fu, Y.; Jin, H.; Zhao, Y.; Cao, W. A Novel Text Mining Approach for Scholar Information Extraction from Web Content in Chinese. Futur. Gener. Comput. Syst. 2019, 111, 859–872. [Google Scholar] [CrossRef]
- Schedlbauer, J.; Raptis, G.; Ludwig, B. Medical Informatics Labor Market Analysis Using Web Crawling, Web Scraping, and Text Mining. Int. J. Med. Inform. 2021, 150, 104453. [Google Scholar] [CrossRef]
- Rekik, R.; Kallel, I.; Casillas, J.; Alimi, A.M. Assessing Web Sites Quality: A Systematic Literature Review by Text and Association Rules Mining. Int. J. Inf. Manag. 2018, 38, 201–216. [Google Scholar] [CrossRef]
- Zhao, Y. R and Data Mining: Examples and Case Studies; Academic Press: Cambridge, MA, USA; Elsevier: Amsterdam, The Netherlands, 2012; ISBN 9780123969637. [Google Scholar]
- Khalil, S.; Fakir, M. RCrawler: An R Package for Parallel Web Crawling and Scraping. SoftwareX 2017, 6, 98–106. [Google Scholar] [CrossRef]
- Wickham Hadley Easily Harvest (Scrape) Web Pages 2019. Available online: https://rvest.tidyverse.org/ (accessed on 1 May 2021).
- Salton, G.; Buckley, C. Term-Weighting Approaches in Automatic Text Retrieval. Inf. Process. Manag. 1988, 24, 513–523. [Google Scholar] [CrossRef] [Green Version]
- Aizawa, A. An Information-Theoretic Perspective of Tf-Idf Measures. Inf. Process. Manag. 2003, 39, 45–65. [Google Scholar] [CrossRef]
- Luhn, H.P. A Statistical Approach to Mechanized Encoding and Searching of Literary Information. IBM J. Res. Dev. 1957, 1, 309–317. [Google Scholar] [CrossRef]
- Thomas, J. Función TermDocFreq|RDocumentation 2019. Available online: https://www.rdocumentation.org/packages/textmineR/versions/3.0.4/topics/TermDocFreq (accessed on 1 May 2021).
- Tommy, J.; William, D. Functions for Text Mining and Topic Modeling 2019. Available online: https://www.rtextminer.com/ (accessed on 1 May 2021).
- Blei, D.M.; Lafferty, J.D. Topic Models. In Text Mining: Classification, Clustering, and Applications; Taylor & Francis Group, Ed.; Chapman and Hall/CRC: New York, NY, USA, 2009; pp. 71–82. ISBN 9780429191985. [Google Scholar]
- Steyvers, M.; Griffiths, T. Probabilistic Topic Models. In Handbook of Latent Semantic Analysis; Landauer, T.K., McNamara, D.S., Dennis, S., Kintsch, W., Eds.; Laurence Erlbaum: Mahwah, NJ, USA, 2006; pp. 427–448. ISBN 1135603286. [Google Scholar]
- Jones, T. A Coefficient of Determination for Probabilistic Topic Models. arXiv 2019, arXiv:1911.11061. [Google Scholar] [CrossRef]
- Rosner, F.; Hinneburg, A.; Röder, M.; Nettling, M.; Both, A. Evaluating Topic Coherence Measures. arXiv 2014, arXiv:1403.6397. [Google Scholar] [CrossRef]
- Gabriel, K.R. The Biplot Graphic Display of Matrices with Application to Principal Component Analysis. Biometrika 1971, 58, 453–467. [Google Scholar] [CrossRef]
- Eckart, C.; Young, G. The Approximation of One Matrix by Another of Lower Rank. Psychometrika 1936, 1, 211–218. [Google Scholar] [CrossRef]
- Eckart, C.; Young, G. A Principal Axis Transformation for Non-Hermitian Matrices. Bull. Am. Math. Soc. 1939, 45, 118–121. [Google Scholar] [CrossRef] [Green Version]
- Frutos, E.; Galindo, M.P. cran.r-project.org/package=GGEBiplotGUI. GGEBiplotGUI 2016. Available online: https://cran.r-project.org/web/packages/GGEBiplotGUI/index.html (accessed on 1 May 2021).
- Frutos, E.; Galindo, M.P.; Leiva, V. An Interactive Biplot Implementation in R for Modeling Genotype-by-Environment Interaction. Stoch. Environ. Res. Risk Assess. 2014, 28, 1629–1641. [Google Scholar] [CrossRef]
- Bostock, M.; Ogievetsky, V.; Heer, J. D3 Data-Driven Documents. IEEE Trans. Vis. Comput. Graph. 2011, 17, 2301–2309. [Google Scholar] [CrossRef]
- Lin, J. Divergence Measures Based on the Shannon Entropy. IEEE Trans. Inf. Theory 1991, 37, 145–151. [Google Scholar] [CrossRef] [Green Version]
- Zuguang, G. Packages ComplexHeatmap. 2021. Available online: https://www.bioconductor.org/packages/release/bioc/html/ComplexHeatmap.html (accessed on 1 May 2021).
- Pearson, K. LIII. On Lines and Planes of Closest Fit to Systems of Points in Space. Lond. Edinb. Dublin Philos. Mag. J. Sci. 1901, 6, 559–572. [Google Scholar] [CrossRef] [Green Version]
- Benzécri, J.-P. L’analyse Des Données. Tomo I: La Taxonomie; Dunod: Paris, France, 1973; Volume 2, ISBN 2040071539. [Google Scholar]


| ID | Newspapers | Frequency |
|---|---|---|
| 1 | El-Pais | 19,375 |
| 2 | El-Mundo | 18,547 |
| 3 | 20 M | 10,190 |
| Topics | Label Topics | Topics | Label Topics |
|---|---|---|---|
| t_1 | Positive_Cases | t_8 | Dose_Vaccine |
| t_2 | New_Contagions | t_9 | USA_Pandemic |
| t_3 | New_Variant | t_10 | Wave_Pandemic |
| t_4 | Third_dose | t_11 | Curfew |
| t_5 | Community_Madrid | t_12 | Government_Madrid |
| t_6 | Vaccines_people | t_13 | Government_Millions |
| t_7 | Measures_Pedro_Sanchez | t_14 | House_confinement |
Publisher’s Note: MDPI stays neutral with regard to jurisdictional claims in published maps and institutional affiliations. |
© 2022 by the authors. Licensee MDPI, Basel, Switzerland. This article is an open access article distributed under the terms and conditions of the Creative Commons Attribution (CC BY) license (https://creativecommons.org/licenses/by/4.0/).
Share and Cite
Pilacuan-Bonete, L.; Galindo-Villardón, P.; Delgado-Álvarez, F. HJ-Biplot as a Tool to Give an Extra Analytical Boost for the Latent Dirichlet Assignment (LDA) Model: With an Application to Digital News Analysis about COVID-19. Mathematics 2022, 10, 2529. https://0-doi-org.brum.beds.ac.uk/10.3390/math10142529
Pilacuan-Bonete L, Galindo-Villardón P, Delgado-Álvarez F. HJ-Biplot as a Tool to Give an Extra Analytical Boost for the Latent Dirichlet Assignment (LDA) Model: With an Application to Digital News Analysis about COVID-19. Mathematics. 2022; 10(14):2529. https://0-doi-org.brum.beds.ac.uk/10.3390/math10142529
Chicago/Turabian StylePilacuan-Bonete, Luis, Purificación Galindo-Villardón, and Francisco Delgado-Álvarez. 2022. "HJ-Biplot as a Tool to Give an Extra Analytical Boost for the Latent Dirichlet Assignment (LDA) Model: With an Application to Digital News Analysis about COVID-19" Mathematics 10, no. 14: 2529. https://0-doi-org.brum.beds.ac.uk/10.3390/math10142529