
Impact of Regressand Stratification in Dataset Shift Caused by Cross-Validation


1
Department of Statistics and Operations Research, University of Granada, Fuentenueva s/n, 18071 Granada, Spain
2
ibs.GRANADA —Instituto de Investigación Biosanitaria, 18012 Granada, Spain
3
IMAG—Institute of Mathematics of the University of Granada, Ventanilla 11, 18001 Granada, Spain
*
Author to whom correspondence should be addressed.
Mathematics 2022, 10(14), 2538; https://0-doi-org.brum.beds.ac.uk/10.3390/math10142538
Submission received: 29 June 2022
/
Revised: 16 July 2022
/
Accepted: 19 July 2022
/
Published: 21 July 2022
(This article belongs to the Special Issue Applied Statistical Modeling and Data Mining)
Abstract
:Data that have not been modeled cannot be correctly predicted. Under this assumption, this research studies how k-fold cross-validation can introduce dataset shift in regression problems. This fact implies data distributions in the training and test sets to be different and, therefore, a deterioration of the model performance estimation. Even though the stratification of the output variable is widely used in the field of classification to reduce the impacts of dataset shift induced by cross-validation, its use in regression is not widespread in the literature. This paper analyzes the consequences for dataset shift of including different regressand stratification schemes in cross-validation with regression data. The results obtained show that these allow for creating more similar training and test sets, reducing the presence of dataset shift related to cross-validation. The bias and deviation of the performance estimation results obtained by regression algorithms are improved using the highest amounts of strata, as are the number of cross-validation repetitions necessary to obtain these better results.
1. Introduction
Knowing the performance of different models over a dataset or determining their best parameter setup are common tasks when facing a new problem in data science [1,2]. In order to address these aspects, k-fold cross-validation (k-fcv) [3,4] is one of the most simple and frequently used approaches (for a survey on cross-validation procedures, the reader may consult the work of Arlot and Celisse [5]). k-fcv creates k pairs of training and test sets from the original dataset, in such a way that the models are built from the training sets and validated on the test sets. After this, the mean of the test results is taken as the model performance estimate.
Even though k-fcv offers several advantages for performance estimation, such as a reduced computation time compared to leave-one-out [6], its application is not totally risk-free [7,8]. It may cause dataset shift [9,10], in which the data used to build and evaluate the model do not follow the same distribution. This fact usually involves wrong predictions when testing the system, implying an underestimation of the model performance [10].
There are different types of dataset shift that have been studied in the specialized literature, such as covariate shift [11] (which affects the distributions of the input variables), conditional shift [12] (which also affects the conditional distributions of the output variable given an input) and posterior shift [13] (which is produced when the conditional distributions of the output given an input vary but the input distributions do not). Among them, a common type of dataset shift, known as target shift or prior probability shift [11,14], occurs in the output variable. The problem of target shift has been widely studied in classification [15,16]. In this context, stratification [6] is employed to reduce target shift related to k-fcv. It consists of having the same proportion of samples of each class in the training and test sets. This approach has provided successful results creating cross-validation folds for both model selection and evaluation in classification [6].
Nevertheless, in regression problems [17], the most common k-fcv scheme for performance estimation is the application of standard cross-validation (CV) [18,19,20], in which training and test sets are randomly built. Since the distribution of the output variable is not considered when partitioning a dataset, this approach has the inconvenience that it can potentially introduce target shift. Despite this, there are works that have applied stratification on the output variable to build more similar training and test sets [7,21,22]. These are mainly based on ordering the samples according to their regressand values, creating different strata of samples and evenly distributing the samples of each stratum among all the folds. Krstajic et al. [7] noted that there appears to be no clear consensus regarding the application of stratified cross-validation. Thus, Breiman and Spector [21] compared several partitioning approaches with regression datasets and concluded that there were no significant improvements using stratification. On the other hand, Baxter et al. [22] used stratification in the context of water treatment data as an effective alternative to make training and test sets illustrative of the problem domain. Their approach first determined the proportion of samples contained in each set and then iteratively assigned the previously ordered samples to each set based on such proportions. Other works are somewhere in the middle and concluded that stratification is not particularly useful when a large number of repeated k-fcv is used in model selection, whereas it is recommended for model assessment [7]. These facts highlight the importance of further studying the dataset shift induced by k-fcv and the usage of stratification in the field of regression to better understand their implications.
This paper deepens the understanding of the impacts of target shift induced by k-fcv in regression datasets. It analyzes the influence on target shift and its consequences of different stratification schemes in k-fcv with respect to CV. These schemes include a series of artificial strata of samples according to the values of the output variable, aiming to minimize the target shift between the distributions of the output variable in training and test sets. Thus, inspired by previous works [7,21,22], several stratification schemes have been designed and compared against CV, considering different amounts of strata: from the minimum amount of two strata to the maximum possible amount of strata equivalent to the quantity of samples in the dataset. The most common values of k in k-fcv in the literature (2, 5 and 10) have been considered along with these stratification schemes to study the effect of target shift in 28 real-world regression datasets using five algorithms belonging to several regression paradigms (such as decision trees and neural networks, among others [23,24]). The partitionings have been repeated thousands of times with each approach, leading to a total of more than 4 M results to analyze. The statistical tests recommended in the literature have been employed to contrast the conclusions derived from the analysis of test performance results and target shift between the training and test sets [25]. A webpage with the details of the experimentation, datasets, additional results and plots can be accessed at https://joseasaezm.github.io/scvreg/ (accessed on 29 June 2022). In summary, the main contributions of this paper are the following:
- Delving into the use of regressand stratification in k-fcv and analyzing whether, despite not being generalized, it should be recommended when dealing with regression data.
- Establishing a direct comparison between k-fcv with and without stratification at three levels (amount of dataset shift introduced, quality of performance estimation and convergence speed) to determine in which aspects stratification offers advantages and the degree of improvement in each of them.
- Studying different amounts of strata in the output variable in order to check if they significantly affect the results obtained and recommend the most appropriate values.
- Analyzing if the effects of stratification on the results depend on the number of folds k in k-fcv, through the study of the values of k commonly used in the literature (2, 5 and 10).
- Drawing conclusions through experimentation with different regression paradigms, both classic and more recent, including decision trees, extreme learning machines and ensembles, among others.
Note that, even though there are works in the literature dealing with regressand stratification, most of the research in this field has considered the distributions in the input space, thus addressing the presence of covariate shift in the data [26,27,28]. Some of these methods, such as representative splitting cross-validation (RSCV) [26], are based on the DUPLEX [29] algorithm to create partitions with k-fcv. Other works [27,30] are based on clustering to create training, validation and test sets for use with neural networks. For example, May et al. [27] created groups of samples using self-organizing maps, which were then distributed among the three sets. The proposal of Diamantidis et al. [28] is also based on clustering and one-center strategies, creating the folds deterministically using the distributions in the input space. A different process is followed by SPlit [31], which is based on the usage of support points and a sequential nearest neighbor method.
Unlike the above approaches, this paper focuses exclusively on target shift to delve into its impacts when partitioning using k-fcv. This fact will allow for knowing the degree of improvement in performance solely attributable to regressand stratification (considering different amounts of strata). Even though there are other works that have applied regressand stratification when using k-fcv (mainly to develop hydrological models [32,33,34]), to our best knowledge, this paper differs for simultaneously combining a comprehensive study on the impacts of regressand stratification while also considering different regression paradigms, dozens of datasets, stratification levels, numbers of folds k in k-fcv and a numerical study of the amount of target shift, performance and convergence speed for each of the k-fcv approaches studied dealing with regression problems.
The remainder of this manuscript is disposed as follows. Section 2 introduces how k-fcv can introduce dataset shift. Section 3 describes the partitioning methods employed in this paper and Section 4 details the experimental framework. Section 5 is devoted to the analysis of the results. Finally, Section 6 closes this work, summarizing the main findings.
2. On Dataset Shift Induced by Cross-Validation
Let x and y respectively be the input attributes and the output variable in a dataset, with and their corresponding domains. In supervised learning, a function is usually estimated from a training set of m samples , , in order to predict the output variable in a different test set of samples , . Commonly, it is assumed that the training and test sets have identical joint distributions, that is, [17]. However, if these sets are obtained by a k-fcv procedure without considering the distributions of the input and output variables, is likely to occur. This scenario is known as dataset shift [9,10] and occurs when the training and test sets follow different distributions [11]. In supervised data, either classification or regression, two main types of data shift are found:
Among them, covariate shift has been widely studied in the specialized literature [26,27,37]. A common approach to reduce its negative impacts is to estimate a weight for each training sample relative to the test set [38], which is then used by learning algorithms. Examples of this strategy are the KLIEP [37] and uLSIF [39] methods. Other works are based on computing the weights by analyzing the means of the training and test sets in a kernel Hilbert space [40] or introducing a surrogate kernel matching [41]. There are also approaches to reduce covariate shift related to partitioning with k-fcv, such as the DB-SCV [42] and DOB-SCV [8] approaches in the field of classification or the aforementioned proposals for regression problems based on the DUPLEX algorithm [26], clustering [27] or support points [31]. These methods are generally based on creating training and test partitions by choosing close samples in the input space.
Even though it is recommended to address covariate and target shifts simultaneously in real-world applications, this research focuses on target shift since the output variable usually has a strong influence on the building and evaluation processes of the models. Note that, although other factors of the data apart from target shift (such as covariate shift) could affect the results obtained, these can potentially equally affect all the partition schemes in this paper since none of the k-fcv approaches studied deals with them specifically.
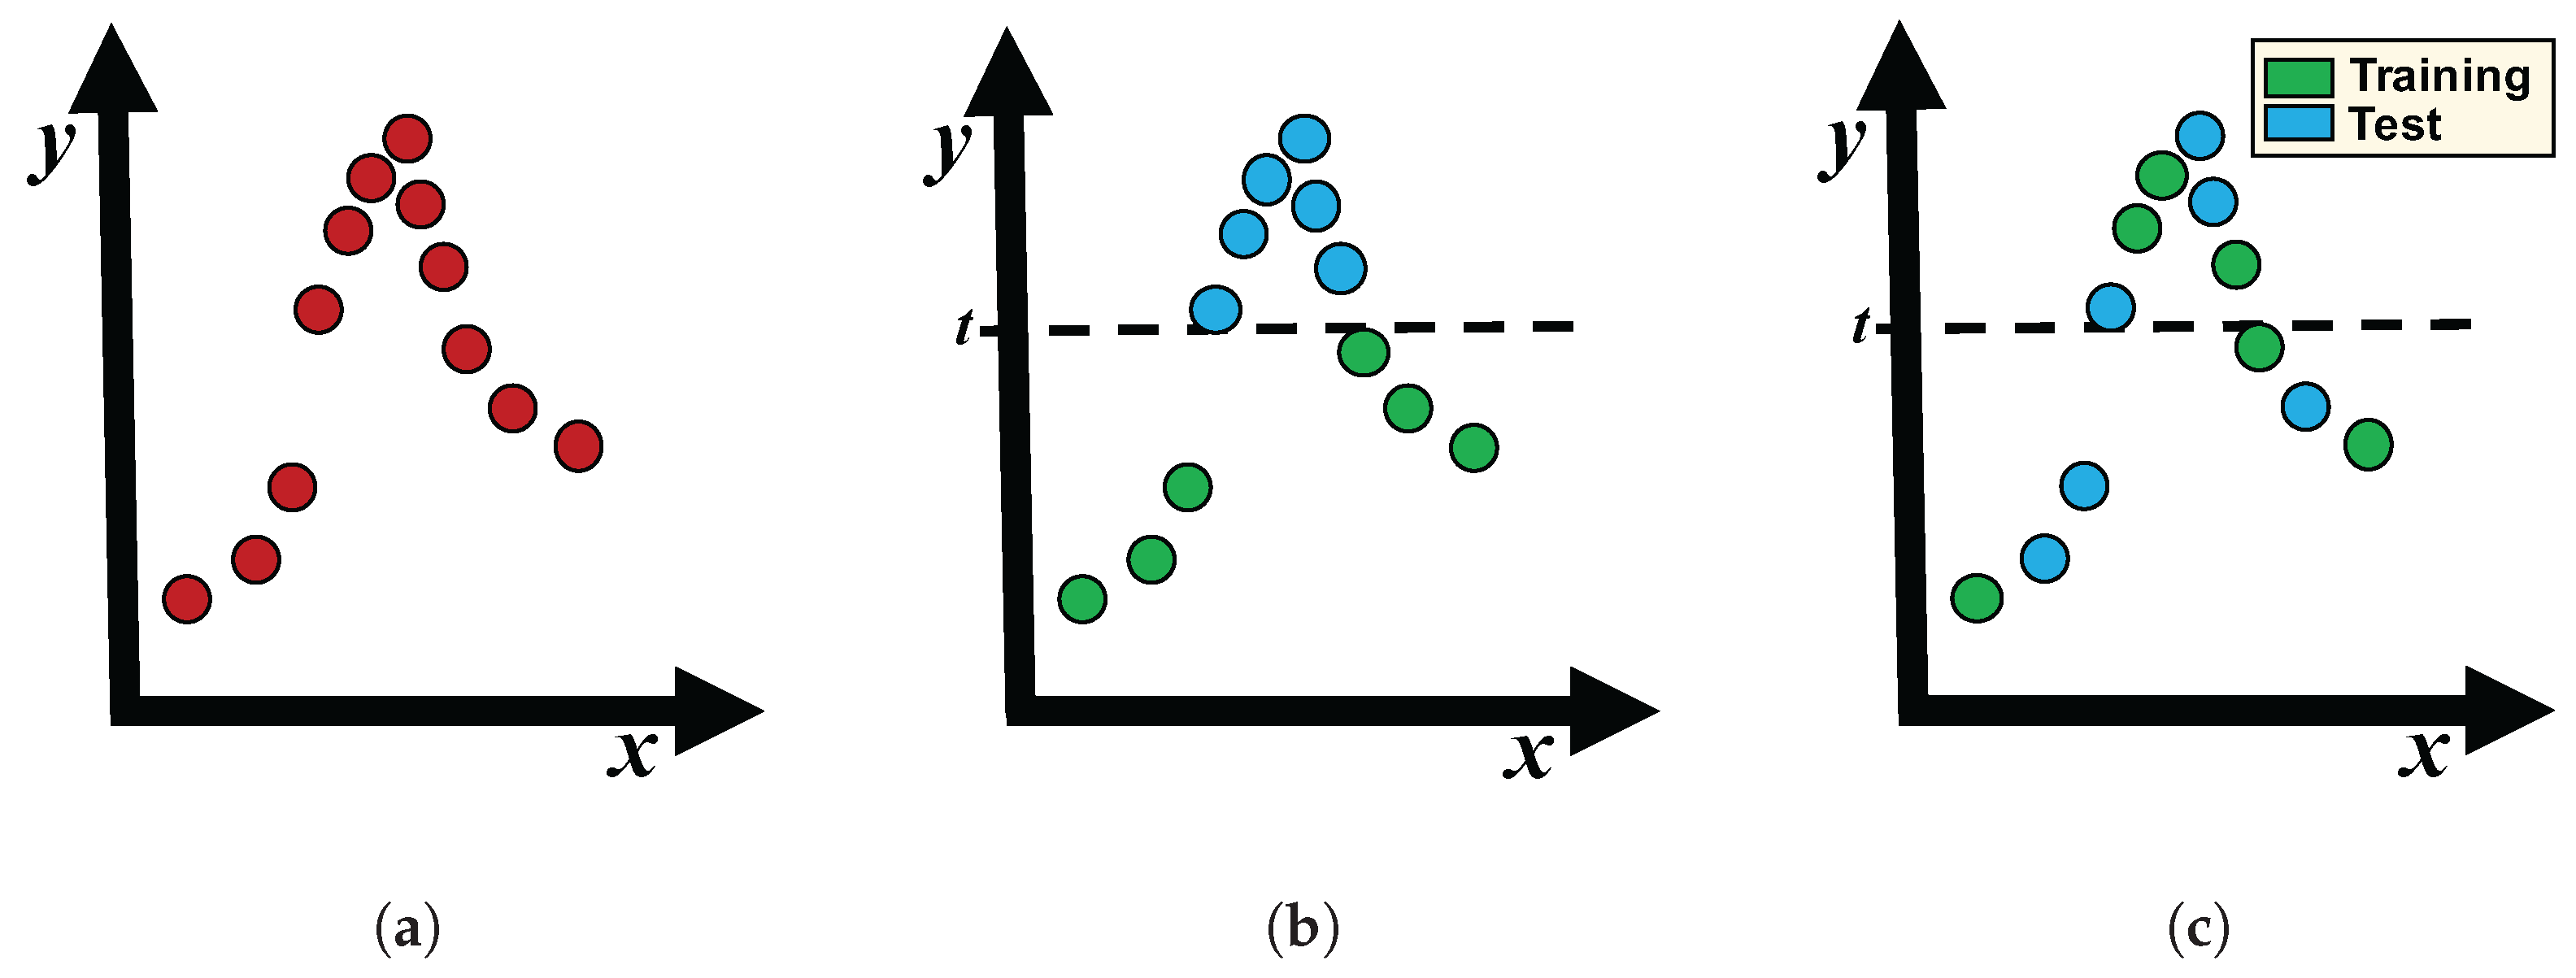
Figure 1 shows a regression dataset with varying degrees of target shift, x and y being the input and output variables, respectively. Figure 1b illustrates a high target shift, since those samples with used to validate the model are not considered to build it and, thus, they are probably wrongly predicted. This situation is partially corrected in Figure 1c, which shows that both sets have samples along the domain of y.
In real-world applications, target shift can occur because of the nature of the problem (e.g., when a model is built on past data and used to predict future data with different characteristics) or it can be unexpectedly introduced by cross-validation during the performance estimation of the models [8]. Using k-fcv, the data are divided into k separate folds. Then, each fold is used to test the model trained with the remaining folds and, finally, the k evaluation results are averaged to obtain an individual estimation. If the training and test sets are obtained without taking into account the distribution of the output variable, the data used to build the model may differ from those used to validate it.
In classification, target shift induced by k-fcv is commonly prevented by applying a stratification scheme [6]. However, the usage of k-fcv based on folds of random samples, usually employed in the field of regression, may imply that the impact of target shift is overlooked. This research focuses on the analysis of the presence and impact of target shift induced by k-fcv in regression datasets, studying how regressand stratification can help to reduce its negative consequences.
3. Cross-Validation in Regression Problems
This section describes the different k-fcv partitioning methods used in this research. They split a regression dataset D into k approximately equal-sized folds (). Each of these folds represents a test set and the remaining folds represent the corresponding training sets.
3.1. Standard Cross-Validation
Algorithm 1 shows the most widely used and simplest approach to partition a regression dataset with k-fcv: standard cross-validation (CV) [18,19]. First, it computes the number of samples per fold (line 2, being the number of samples). Then, the whole dataset D is split into k random folds of samples of equal size (lines 3–6). Note that, since this partitioning scheme does not consider the distribution of the output variable to create each fold, it can introduce target shift uncontrollably.
| Algorithm 1 Standard cross-validation (CV). |
| Input: dataset D, number of folds k. Output: folds
|
3.2. Totally Stratified Cross-Validation
Contrary to CV, which does not use the information of the regressand to create the folds, totally stratified cross-validation (TSCV) is one of the approaches used in this research to reduce target shift to the maximum degree. Algorithm 2 shows its pseudocode.
It introduces as many strata as samples in the dataset. The different strata are created according to the regressand distribution. First, it sorts the samples in D considering their output variable (line 2). Then, each sample is selected in order (line 3) and assigned to a fold with less samples (lines 4–5). If several folds are tied with less samples (line 4), one of them is arbitrarily chosen, which adds some randomness in the partitioning.
TSCV is based on the idea of assigning the closest samples (according to their output variables) to different folds. In this way, folds are intended to be as similar as possible to each other, while each of them contains the maximum possible diversity of values of the output variable. This fact finally implies that training and test sets have similar distributions of the output variables, reducing target shift.
| Algorithm 2 Totally stratified cross-validation (TSCV). |
| Input: dataset D, number of folds k. Output: folds
|
3.3. Stratified Cross-Validation
At an intermediate point between CV and TSCV, t-stratified cross-validation (SCV ) is another approach used in this paper to introduce a variable stratification in the k-fcv process with regression problems. It is presented in Algorithm 3.
This procedure allows for creating the desired amount of strata t when building the k folds. First, SCV sorts all the samples according to the value of the output variable (line 2) and computes the number n of samples per stratum (line 3). Afterwards, it starts an iterative process to assign samples to each fold (lines 4–13): it selects blocks of n samples conforming each stratum (lines 5–6) and, then, each of the samples of that block (line 8) is assigned to a fold with less samples (line 9) until there are no more available samples to assign. Thus, SCV considers the same number of samples from each stratum in each of the folds.
SCV is a generalization of the previous k-fcv schemes: CV and TSCV. If , no stratification is considered and, thus, SCV is equivalent to CV. If , the maximum number of strata are considered and SCV is equivalent to TSCV.
| Algorithm 3t-stratified cross-validation (SCV ). |
| Input: dataset D, number of folds k, number of strata t. Output: folds
|
4. Experimental Framework
Next, Section 4.1 and Section 4.2 introduce the datasets and the parameter setup for the regression algorithms, respectively. Then, Section 4.3 describes the methodology of analysis.
4.1. Real-World Datasets
This research considers 28 real-world regression datasets taken from the UCI machine learning and KEEL-dataset repositories (https://archive.ics.uci.edu/, http://www.keel.es; both accessed on 29 June 2022). In order to study the impact of stratification in k-fcv with regression problems regardless of the characteristics of the data, datasets belonging to different applications and areas (including fields such as biology, geology, chemistry and so on) and with different numbers of attributes and samples are selected. Table 1 presents them, along with their number of attributes (at) and samples (sa). Those samples containing missing values in these datasets are removed before their usage. Furthermore, both the input attributes and the output variables are normalized to the interval .
4.2. Regression Algorithms
In order to build models on the above datasets, 5 algorithms belonging to different regression paradigms are chosen, including decision trees [23], distance-based models [43], neural networks [24], multiple linear regression [44] and ensemble-based models [45]. They are briefly described below along with their main parameters, which are shown in Table 2. In order to delve into the specific characteristics of each algorithm, the reader can consult the reference associated with each of them.
- Recursive partitioning and regression trees (RPART) [23]. It builds a decision tree from the dataset, in which the nodes are successively split into subnodes using a homogeneity-based threshold attribute value. The process stops when the last subset of samples is included in the tree or the maximum number of leaves is reached (known as tree pruning).
- k-nearest neighbors (NN) [43]. To estimate the output value for a sample, it computes the distances between such sample and all the training samples. Then, it selects the k closest samples to the query and averages their regressand values to obtain a single prediction.
- Extreme learning machine (ELM) [24]. It is a feedforward neural network with a hidden layer of nodes whose parameters do not need to be tuned. Its main advantage is that it produces good generalization performance in less time compared to traditional neural networks trained with backpropagation.
- Multivariate adaptive regression spline (MARS) [44]. It is a non-parametric algorithm based on two main stages. In the forward stage, it splits the data in several subsets and runs a linear regression model on each partition. In the backward stage, the model is pruned to avoid overfitting by removing the functions that contribute the least to performance.
- Generalized boosted regression modeling (GBM) [45]. It iteratively builds decision trees based on random subsets of the training samples using boosting. For each new tree, those samples poorly modeled by previous trees have a higher probability of being selected.

Table 2.
Regression methods.
| Method | Parameters |
|---|---|
| RPART | min. split ; min. leaf ; complexity ; max. depth |
| NN | ; distance: Euclidean |
| ELM | neurons ; activation: radial basis; input weights: |
| MARS | degree ; pruning = backward |
| GBM | distribution = Gaussian; trees ; learning rate ; bag |
4.3. Methodology of Analysis
To study the effects of target shift induced by k-fcv in regression datasets and how stratification can help to reduce its impacts, the following experimental study is performed. Each dataset in Table 1 is partitioned using three different values of k in k-fcv (2, 5 and 10). These folds are obtained with eight partitioning schemes (see Section 3), each one with a different stratification degree:
- CV, which does not consider any stratification;
- TSCV, which considers a total stratification of the samples;
- SCV with six different values of t (2, 5, 10, 20, 50 and 100), which allows for controlling the stratification degree.
Once the datasets are split into k folds with the aforementioned schemes, the regression methods in Table 2 are evaluated over them, obtaining their test performance results with the RMSE metric:
with n the amount of samples and and the real and predicted regressand values for the i-th sample, respectively.
Additionally, the Kolmogorov–Smirnov statistic () [46] is used to estimate the amount of target shift between the training and test sets, that is, the difference between the distributions of the regressand values in both sets. Given the samples of regressand values in the training and test sets, X and Y, and their empirical distribution functions and , is computed as:
The above procedure is repeated 1000 times with different seeds to generate random numbers, obtaining, thus, different partitions in each run. Table 3 shows a summary of the experiment performed, in which # indicates the amount of values of each variable. Thus, the experimentation of this research entails the analysis of more than 4 M results. The conclusions derived from them are contrasted using the statistical tests recommended in the specialized literature [25]. Specifically, Wilcoxon’s test [25] is used for rejecting the null hypothesis of the equality of means in pairwise comparisons, implying the superiority of one of the methods. A significance level is assumed in this paper.
5. Analysis of Results
The analysis of results is divided into three main parts. First, Section 5.1 analyzes the amount of induced target shift by the different k-fcv schemes. Then, Section 5.2 focuses on the effect of stratification on the error estimation of the regression methods with k-fcv. Finally, Section 5.3 studies the convergence speed of the stratification schemes with respect to the performance estimated using CV, that is, the number of repetitions necessary by each stratification approach to reach a stable (better) behavior with respect to CV.
5.1. Analysis of Induced Target Shift by Cross-Validation Schemes
In order to measure the amount of target shift existing between the training and test sets created by each k-fcv approach, the Kolmogorov–Smirnov [46] non-parametric test is used. This test calculates a statistic , which can be taken as an indicator of the difference between two samples. is measured considering the distributions of the output variable in the different training and test sets created by each k-fcv scheme for each dataset. The lower the value of is, the more similar the training and test distributions and the lower amount of target shift introduced by k-fcv are.
Table 4 shows the averaged values when measuring target shift between training and test sets for all the datasets considering each one of the k-fcv schemes (with and 10). The results of each partitioning scheme are compared against two reference methods using Wilcoxon’s test, obtaining their associated p-values:
- CV, which does not consider any stratification (row vs. CV);
- TSCV, which considers a maximum stratification (row vs. TSCV).
The p-value of Wilcoxon’s test allows for rejecting the null hypothesis that the mean results of the two algorithms involved in the comparison are equal, that is, they have a similar behavior on average in all the datasets. Given that a significance level of 0.1 is considered and p-values are in scientific notation in Table 4, those with exponent −1 do not allow for rejecting the null hypothesis, whereas the rest do (indicating that there are differences between the behaviors of the two methods compared).
The best results in Table 4 are underlined, whereas p-values lower than are remarked in bold. A darker background in the results indicates that these are better. In addition to the p-value, the sum of ranks [47] associated with each algorithm within Wilcoxon’s test is calculated as a way of representing their effectiveness. In order to do this, the differences between both methods in the results of each dataset are computed and a ranking is assigned to the absolute value of each difference. The sum of ranks associated with the positive differences is assigned to the first algorithm, whereas the sum of ranks of negative differences is assigned to the second method. A higher sum of ranks represents a greater effectiveness of the corresponding algorithm. Finally, those cases in Table 4 in which the method of the row obtains a higher sum of ranks than that of the column in Wilcoxon’s test are indicated with an asterisk.
Table 4.
Induced target shift by different k-fcv schemes. A darker background in the results indicates that these are better. Those cases in which the method of the row obtains a higher sum of ranks than that of the column in Wilcoxon’s test are indicated with an asterisk.
Table 4.
Induced target shift by different k-fcv schemes. A darker background in the results indicates that these are better. Those cases in which the method of the row obtains a higher sum of ranks than that of the column in Wilcoxon’s test are indicated with an asterisk.
| Folds | CV | SCV | SCV | SCV | SCV | SCV | SCV | TSCV |
|---|---|---|---|---|---|---|---|---|
| 2-fcv | 0.0604 | 0.0491 | 0.0390 | 0.0280 | 0.0217 | 0.0150 | 0.0109 | 0.0055 |
| vs. CV | ✗ | 7.45E-9 | 7.45E-9 | 7.45E-9 | 7.45E-9 | 7.45E-9 | 7.45E-9 | 7.45E-9 |
| vs. TSCV | 7.45E-9 * | 7.45E-9 * | 7.45E-9 * | 7.45E-9 * | 7.45E-9 * | 7.45E-9 * | 1.49E-8 * | ✗ |
| 5-fcv | 0.0754 | 0.0615 | 0.0491 | 0.0354 | 0.0273 | 0.0195 | 0.0155 | 0.0109 |
| vs. CV | ✗ | 7.45E-9 | 7.45E-9 | 7.45E-9 | 7.45E-9 | 7.45E-9 | 7.45E-9 | 7.45E-9 |
| vs. TSCV | 7.45E-9 * | 7.45E-9 * | 7.45E-9 * | 7.45E-9 * | 7.45E-9 * | 7.45E-9 * | 7.45E-9 * | ✗ |
| 10-fcv | 0.1002 | 0.0820 | 0.0656 | 0.0480 | 0.0378 | 0.0287 | 0.0246 | 0.0213 |
| vs. CV | ✗ | 7.45E-9 | 7.45E-9 | 7.45E-9 | 7.45E-9 | 7.45E-9 | 7.45E-9 | 7.45E-9 |
| vs. TSCV | 7.45E-9 * | 7.45E-9 * | 7.45E-9 * | 7.45E-9 * | 7.45E-9 * | 7.45E-9 * | 1.49E-8 * | ✗ |
The above results show that, for each value of k in k-fcv, a total ordering according to the increasing number of strata is observed: from CV (with the highest target shift value) to TSCV (with the lowest target shift value). This ordering is also observed in the results of most of the individual datasets.
The comparisons among k-fcv schemes using Wilcoxon’s test support the above conclusions. They show that those partitionings considering stratification provide better results than not considering it (CV). Similarly, using the maximum number of strata (TSCV) implies an improvement compared to considering a fewer amount of strata.
When comparing the results of each partitioning method for the different values of k, it is observed that a higher k involves an increment of the injected target shift by k-fcv. This fact may be due to that the greater the number of folds, the more difficult it is for all of them to be similar.
The above results show the positive effects of the stratification schemes to reduce target shift in regression datasets compared to the traditional approach, which does not consider any stratification (CV). Specifically, TSCV is the stratification that achieves further reducing the differences between the distributions of values of the output variables in the training and test sets, with clear differences compared to the rest of the approaches. The next section analyzes whether this reduction in target shift in the data leads to a better error estimation of the models, implying a lower bias in performance estimation.
5.2. Effect of Stratification in Error Bias Related to Target Shift
Table 5 shows the error estimation using RMSE and standard deviation results of each partitioning scheme, considering all the runs with different numbers of folds k (2, 5 and 10). Additionally, the p-value associated with Wilcoxon’s test after comparing the results of each partitioning method against the method with no stratification (CV) and the method with maximum stratification (TSCV) is computed. Due to the large amount of results obtained, just those for the RPART and NN regression methods are shown in this paper. The results for the rest of the regression techniques are found on the webpage of this paper and show conclusions similar to those presented here.
Analogously to the amount of target shift in the previous section, the error estimation results for RPART and NN show that, for each value of k in k-fcv, an ordering according to the increasing number of strata is observed: from CV (with the highest error values) to TSCV (with lowest error values). Although there are some exceptions, this fact is also true in standard deviation results.
The statistical comparisons for the error results also support that all the methods using stratification are generally better than CV (although no differences are observed between CV and its closest stratification levels in some cases). The comparisons with TSCV show similar behavior: TSCV is usually better than the methods using a lower stratification, although with the approaches closest in number of strata (50 and 100), no differences are observed in some cases. The analysis of standard deviation provides similar results.
As a conclusion, it is observed that the reduction in target shift shown in Section 5.1 by the stratification schemes is related to that when estimating the error made by the models. This fact implies that the application of stratification allows for obtaining better estimations of the performance of the models, so its usage can be recommended against not considering it.
5.3. Convergence Speed of Stratification Schemes against CV
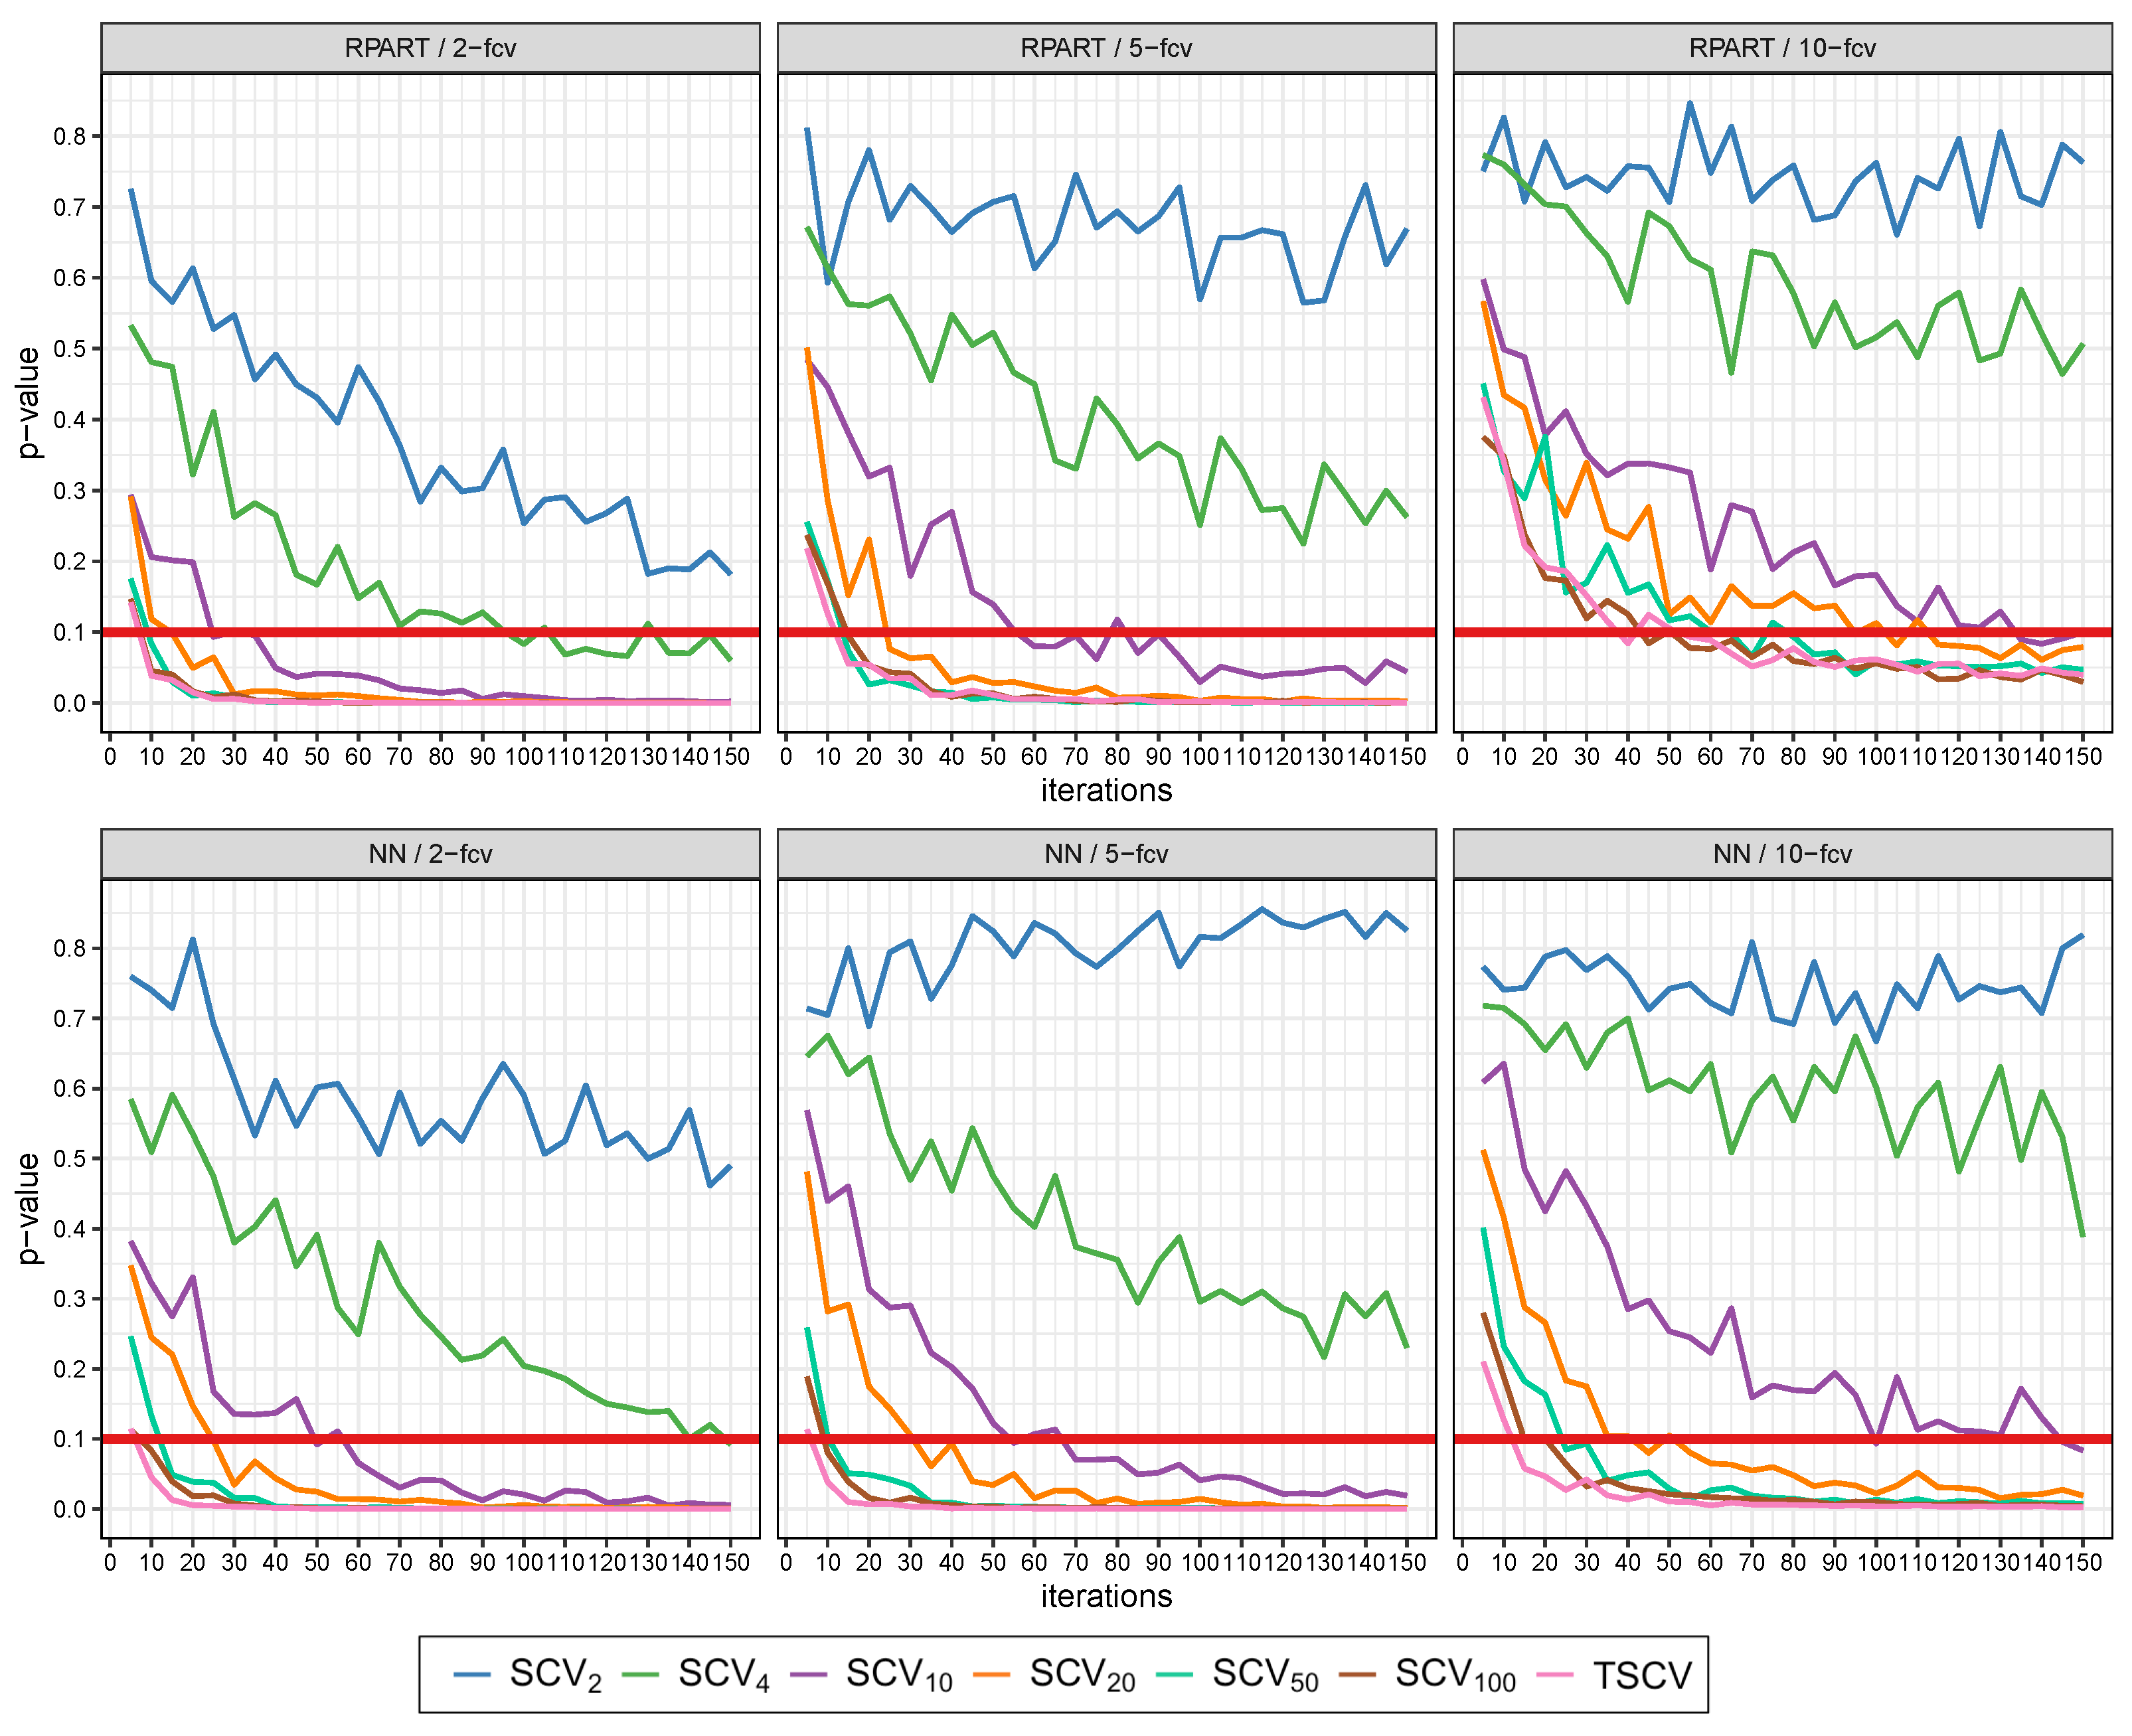
Section 5.2 focuses on error estimation when a large number of k-fcv repetitions are performed (1000). The analysis of the p-values of Wilcoxon’s test shows that stratification generally improves error estimation compared to not considering it. This section studies the speed (number of k-fcv repetitions) required by each partitioning method to reach this p-value lower than when compared to CV. To this end, the performance (from 5 to 150 repetitions, by increments of 5) of each regression method using stratified k-fcv against CV is compared with Wilcoxon’s test and the associated p-values are computed. This process is repeated 50 times to obtain more robust results. Figure 2 shows the results for RPART and NN—the rest of the methods can be found on the webpage of this paper.
The analysis of Figure 2 shows a certain ordering in the results of the different stratification strategies. The highest p-values are usually related to those approaches that use a smaller number of strata, whereas an increase in the number of strata implies that the p-values are reduced. A higher variability in the results between consecutive k-fcv repetitions is also observed in those approaches that use a lower number of strata. Thus, these results show that the usage of higher amounts of strata in k-fcv usually involve lower numbers of k-fcv repetitions to obtain better and stable results compared to CV. Furthermore, Figure 2 shows that, if higher values of k in k-fcv are considered, the p-values obtained are generally higher with all the partitioning methods. A higher variability in the results between consecutive repetitions is also presented with higher values of k in k-fcv.
6. Conclusions
This research has analyzed both how k-fcv can introduce target shift in regression datasets and its negative impact in performance estimation. Several stratification schemes have been analyzed to build more similar training and test distributions, decreasing the existence of target shift produced by cross-validation.
The experiments performed have shown that both dataset shift and bias are reduced by considering stratification. In general, the larger the number of strata is, the lower the target shift and error estimation results are. The convergence speed of the different stratification schemes when they are compared to CV shows that a larger number of strata usually implies that cross-validation provides a stable and better performance estimation faster. Among the stratification schemes studied, the usage of TSCV can be recommended, since it is the one that generally provides the best results in terms of the introduced target shift and estimation of the error made by the models built. Despite this, it should be noted that other regressand stratification schemes using a smaller number of strata also obtain good results compared to CV. Furthermore, the usage of lower stratification may imply some advantages in terms of computational cost when partitioning the dataset, particularly if the number of samples is high. Finally, even though this research has focused on the study of target shift in regression problems, it is also important to consider the presence of other types of dataset shift, such as that occurring in the input attributes. Their joint consideration may imply the need to further investigate the most appropriate synergy between the number of strata in the regressand with the different strategies to reduce other forms of dataset shift.
In future works, it is planned to study the behavior of other regression methods, such as Support Vector Regression [48] or XGBoost [49], with the proposed stratification schemes, as well as to use these algorithms along with other k-fcv approaches considering different types of dataset shift simultaneously, such as target and covariate shift.
Author Contributions
J.A.S. and J.L.R.-B. have contributed equally to this work. All authors have read and agreed to the published version of the manuscript.
Funding
J.L. Romero has been partially supported by grants MCIU/AEI/ERDF, UE PGC2018-098860-B-I00, grant A-FQM-345-UGR18 cofinanced by ERDF Operational Programme 2014–2020 and the Economy and Knowledge Council of the Regional Government of Andalusia, Spain, and grant CEX2020-001105-M MCIN/AEI/10.13039/501100011033.
Data Availability Statement
The datasets used in this research are taken from the UCI machine learning (https://archive.ics.uci.edu/) and KEEL-dataset (http://www.keel.es) repositories (both accessed on 29 June 2022).
Conflicts of Interest
The authors declare no conflict of interest. The funders had no role in the design of the study; in the collection, analyses, or interpretation of data; in the writing of the manuscript or in the decision to publish the results.
References
- Liu, Y.; Liao, S.; Jiang, S.; Ding, L.; Lin, H.; Wang, W. Fast cross-validation for kernel-based algorithms. IEEE Trans. Pattern Anal. Mach. Intell. 2020, 42, 1083–1096. [Google Scholar] [CrossRef] [PubMed]
- Rad, K.; Maleki, A. A scalable estimate of the out-of-sample prediction error via approximate leave-one-out cross-validation. J. R. Stat. Soc. Ser. B Stat. Methodol. 2020, 82, 965–996. [Google Scholar] [CrossRef]
- Qi, C.; Diao, J.; Qiu, L. On estimating model in feature selection with cross-validation. IEEE Access 2019, 7, 33454–33463. [Google Scholar] [CrossRef]
- Jiang, G.; Wang, W. Error estimation based on variance analysis of k-fold cross-validation. Pattern Recognit. 2017, 69, 94–106. [Google Scholar] [CrossRef]
- Arlot, S.; Celisse, A. A survey of cross-validation procedures for model selection. Stat. Surv. 2010, 4, 40–79. [Google Scholar] [CrossRef]
- Kohavi, R. A study of cross-validation and bootstrap for accuracy estimation and model selection. In Proceedings of the 14th International Joint Conference on Artificial Intelligence, Montreal, QC, Canada, 20–25 August 1995; Volume 2, pp. 1137–1143. [Google Scholar]
- Krstajic, D.; Buturovic, L.; Leahy, D.; Thomas, S. Cross-validation pitfalls when selecting and assessing regression and classification models. J. Cheminform. 2014, 6, 10. [Google Scholar] [CrossRef] [Green Version]
- Moreno-Torres, J.; Sáez, J.; Herrera, F. Study on the impact of partition-induced dataset shift on k-fold cross-validation. IEEE Trans. Neural Netw. Learn. Syst. 2012, 23, 1304–1312. [Google Scholar] [CrossRef]
- Maldonado, S.; López, J.; Iturriaga, A. Out-of-time cross-validation strategies for classification in the presence of dataset shift. Appl. Intell. 2022, 52, 5770–5783. [Google Scholar] [CrossRef]
- Wei, T.; Wang, J.; Chen, H.; Chen, L.; Liu, W. L2-norm prototypical networks for tackling the data shift problem in scene classification. Int. J. Remote Sens. 2021, 42, 3326–3352. [Google Scholar] [CrossRef]
- Moreno-Torres, J.G.; Raeder, T.; Alaíz-Rodríguez, R.; Chawla, N.V.; Herrera, F. A unifying view on dataset shift in classification. Pattern Recognit. 2012, 45, 521–530. [Google Scholar] [CrossRef]
- Nikzad-Langerodi, R.; Andries, E. A chemometrician’s guide to transfer learning. J. Chemom. 2021, 35, e3373. [Google Scholar] [CrossRef]
- Huyen, C. Designing Machine Learning Systems: An Iterative Process for Production-Ready Applications; O’Reilly Media: Sebastopol, CA, USA, 2022. [Google Scholar]
- Li, Y.; Murias, M.; Major, S.; Dawson, G.; Carlson, D. On target shift in adversarial domain adaptation. In Proceedings of the 22nd International Conference on Artificial Intelligence and Statistics, Naha, Japan, 16–18 April 2019; Volume 89, pp. 616–625. [Google Scholar]
- Redko, I.; Courty, N.; Flamary, R.; Tuia, D. Optimal transport for multi-source domain adaptation under target shift. In Proceedings of the 22nd International Conference on Artificial Intelligence and Statistics, Naha, Japan, 16–18 April 2019; Volume 89, pp. 849–858. [Google Scholar]
- Podkopaev, A.; Ramdas, A. Distribution-free uncertainty quantification for classification under label shift. In Proceedings of the 37th Conference on Uncertainty in Artificial Intelligence, Online, 27–30 July 2021; pp. 844–853. [Google Scholar]
- Hastie, T.; Tibshirani, R.; Friedman, J. The Elements of Statistical Learning; Springer Series in Statistics; Springer: New York, NY, USA, 2001. [Google Scholar]
- Kang, S.; Kang, P. Locally linear ensemble for regression. Inf. Sci. 2018, 432, 199–209. [Google Scholar] [CrossRef]
- Carrizosa, E.; Mortensen, L.; Romero Morales, D.; Sillero-Denamiel, M. The tree based linear regression model for hierarchical categorical variables. Expert Syst. Appl. 2022, 203, 117423. [Google Scholar] [CrossRef]
- Dhanjal, C.; Baskiotis, N.; Clémençon, S.; Usunier, N. An empirical comparison of V-fold penalisation and cross-validation for model selection in distribution-free regression. Pattern Anal. Appl. 2016, 19, 41–53. [Google Scholar] [CrossRef] [Green Version]
- Breiman, L.; Spector, P. Submodel selection and evaluation in regression. The x-random case. Int. Stat. Rev. 1992, 60, 291–319. [Google Scholar] [CrossRef]
- Baxter, C.W.; Stanley, S.J.; Zhang, Q.; Smith, D.W. Developing artificial neural network models of water treatment processes: A guide for utilities. J. Environ. Eng. Sci. 2002, 1, 201–211. [Google Scholar] [CrossRef] [Green Version]
- Breiman, L.; Friedman, J.; Olshen, R.; Stone, C. Classification and Regression Trees; Chapman and Hall/CRC: Boca Raton, FL, USA, 2017. [Google Scholar]
- Ding, S.; Zhao, H.; Zhang, Y.; Xu, X.; Nie, R. Extreme learning machine: Algorithm, theory and applications. Artif. Intell. Rev. 2015, 44, 103–115. [Google Scholar] [CrossRef]
- Baringhaus, L.; Gaigall, D. Efficiency comparison of the Wilcoxon tests in paired and independent survey samples. Metrika 2018, 81, 891–930. [Google Scholar] [CrossRef]
- Xu, L.; Hu, O.; Guo, Y.; Zhang, M.; Lu, D.; Cai, C.; Xie, S.; Goodarzi, M.; Fu, H.; She, Y. Representative splitting cross validation. Chemom. Intell. Lab. Syst. 2018, 183, 29–35. [Google Scholar] [CrossRef]
- May, R.; Maier, H.; Dandy, G. Data splitting for artificial neural networks using SOM-based stratified sampling. Neural Netw. 2010, 23, 283–294. [Google Scholar] [CrossRef]
- Diamantidis, N.; Karlis, D.; Giakoumakis, E. Unsupervised stratification of cross-validation for accuracy estimation. Artif. Intell. 2000, 116, 1–16. [Google Scholar] [CrossRef] [Green Version]
- Snee, R. Validation of regression models: Methods and examples. Technometrics 1977, 19, 415–428. [Google Scholar] [CrossRef]
- Sahoo, A.K.; Zuo, M.J.; Tiwari, M.K. A data clustering algorithm for stratified data partitioning in artificial neural network. Expert Syst. Appl. 2012, 39, 7004–7014. [Google Scholar] [CrossRef]
- Joseph, V.R.; Vakayil, A. SPlit: An optimal method for data splitting. Technometrics 2022, 64, 166–176. [Google Scholar] [CrossRef]
- Wu, W.; May, R.; Dandy, G.C.; Maier, H.R. A method for comparing data splitting approaches for developing hydrological ANN models. In Proceedings of the International Congress on Environmental Modelling and Software, Leipzig, Germany, 1–5 June 2012; p. 394. [Google Scholar]
- Wu, W.; May, R.; Maier, H.; Dandy, G. A benchmarking approach for comparing data splitting methods for modeling water resources parameters using artificial neural networks. Water Resour. Res. 2013, 49, 7598–7614. [Google Scholar] [CrossRef]
- Zheng, F.; Maier, H.; Wu, W.; Dandy, G.; Gupta, H.; Zhang, T. On lack of robustness in hydrological model development due to absence of guidelines for selecting calibration and evaluation data: Demonstration for data-driven models. Water Resour. Res. 2018, 54, 1013–1030. [Google Scholar] [CrossRef]
- Chapaneri, S.; Jayaswal, D. Covariate shift adaptation for structured regression with Frank-Wolfe algorithms. IEEE Access 2019, 7, 73804–73818. [Google Scholar] [CrossRef]
- Chen, X.; Monfort, M.; Liu, A.; Ziebart, B. Robust covariate shift regression. In Proceedings of the 19th International Conference on Artificial Intelligence and Statistics, Cadiz, Spain, 9–11 May 2016; Volume 51, pp. 1270–1279. [Google Scholar]
- Sugiyama, M.; Nakajima, S.; Kashima, H.; Buenau, P.; Kawanabe, M. Direct importance estimation with model selection and its application to covariate shift adaptation. Adv. Neural Inf. Process. Syst. 2007, 20, 1–8. [Google Scholar]
- Shimodaira, H. Improving predictive inference under covariate shift by weighting the log-likelihood function. J. Stat. Plan. Inference 2000, 90, 227–244. [Google Scholar] [CrossRef]
- Kanamori, T.; Hido, S.; Sugiyama, M. A least-squares approach to direct importance estimation. J. Mach. Learn. Res. 2009, 10, 1391–1445. [Google Scholar]
- Huang, J.; Smola, A.J.; Gretton, A.; Borgwardt, K.M.; Schölkopf, B. Correcting sample selection bias by unlabeled data. Adv. Neural Inf. Process. Syst. 2006, 19, 601–608. [Google Scholar]
- Zhang, K.; Zheng, V.W.; Wang, Q.; Kwok, J.T.; Yang, Q.; Marsic, I. Covariate shift in Hilbert space: A solution via sorrogate kernels. In Proceedings of the 30th International Conference on Machine Learning, Atlanta, GA, USA, 17–19 June 2013; Volume 28, pp. 388–395. [Google Scholar]
- Zeng, X.; Martinez, T.R. Distribution-balanced stratified cross-validation for accuracy estimation. J. Exp. Theor. Artif. Intell. 2000, 12, 1–12. [Google Scholar] [CrossRef]
- Curteanu, S.; Leon, F.; Mircea-Vicoveanu, A.M.; Logofatu, D. Regression methods based on nearest neighbors with adaptive distance metrics applied to a polymerization process. Mathematics 2021, 9, 547. [Google Scholar] [CrossRef]
- Raj, N.; Gharineiat, Z. Evaluation of multivariate adaptive regression splines and artificial neural network for prediction of mean sea level trend around northern australian coastlines. Mathematics 2021, 9, 2696. [Google Scholar] [CrossRef]
- Boehmke, B.; Greenwell, B. Gradient Boosting. In Hands-On Machine Learning with R; Chapman and Hall/CRC: Boca Raton, FL, USA, 2019; pp. 221–246. [Google Scholar]
- Dimitrova, D.; Kaishev, V.; Tan, S. Computing the Kolmogorov-Smirnov distribution when the underlying CDF is purely discrete, mixed, or continuous. J. Stat. Softw. 2020, 95, 1–42. [Google Scholar] [CrossRef]
- Derrac, J.; García, S.; Molina, D.; Herrera, F. A practical tutorial on the use of nonparametric statistical tests as a methodology for comparing evolutionary and swarm intelligence algorithms. Swarm Evol. Comput. 2011, 1, 3–18. [Google Scholar] [CrossRef]
- Smola, A.J.; Schölkopf, B. A tutorial on support vector regression. Stat. Comput. 2004, 14, 199–222. [Google Scholar] [CrossRef] [Green Version]
- Chen, T.; Guestrin, C. XGBoost: A scalable tree boosting system. In Proceedings of the 22nd International Conference on Knowledge Discovery and Data Mining, San Francisco, CA, USA, 13–17 August 2016; pp. 785–794. [Google Scholar]
Figure 1.
Examples of target shift in a regression dataset. (a) Original dataset. (b) High target shift. (c) Moderate target shift.
Figure 1.
Examples of target shift in a regression dataset. (a) Original dataset. (b) High target shift. (c) Moderate target shift.

Figure 2.
Evolution of Wilcoxon’s p-value across different iterations (k-fcv repetitions) after comparing each stratification scheme against not considering stratification with CV using RPART and NN.
Figure 2.
Evolution of Wilcoxon’s p-value across different iterations (k-fcv repetitions) after comparing each stratification scheme against not considering stratification with CV using RPART and NN.

Table 1.
Regression datasets employed in the experimentation.
| Dataset | at | sa | Dataset | at | sa |
|---|---|---|---|---|---|
| abalone | 8 | 4177 | friedman | 5 | 1200 |
| airfoil | 5 | 1503 | laser | 4 | 993 |
| anacalt | 7 | 4052 | machinecpu | 6 | 209 |
| autompg8 | 7 | 392 | mortgage | 15 | 1049 |
| baseball | 16 | 337 | plastic | 2 | 1650 |
| concrete | 8 | 1030 | quake | 3 | 2178 |
| coolingeff | 8 | 768 | realestate | 6 | 414 |
| dailerons | 5 | 7129 | stock | 9 | 950 |
| dee | 6 | 365 | traffic | 17 | 135 |
| delevators | 6 | 9517 | treasury | 15 | 1049 |
| elength | 2 | 495 | wankara | 9 | 321 |
| emaintenance | 4 | 1056 | watertoxicity | 8 | 546 |
| fish | 6 | 908 | wizmir | 9 | 1461 |
| forest | 12 | 517 | yacht | 6 | 308 |
Table 3.
Details of the experimentation.
| Parameter | Values | # |
|---|---|---|
| Datasets | See Table 1 | 28 |
| Folds | and 10 | 3 |
| Partitioning | CV, TSCV and SCV () | 8 |
| Seed | Random without replacement in [1, 1,000,000] | 1000 |
| Regression | RPART, NN, ELM, MARS, GBM | 5 |
| Metric | RMSE (performance) and (target shift) | 2 |
Table 5.
Effect of stratification in error estimation (RMSE) and standard deviation results. A darker background in the results indicates that these are better. Those cases in which the method of the row obtains a higher sum of ranks than that of the column in Wilcoxon’s test are indicated with an asterisk.
| Metric | Error | Standard Deviation | ||||||||||||||
|---|---|---|---|---|---|---|---|---|---|---|---|---|---|---|---|---|
| RPART | CV | SCV | SCV | SCV | SCV | SCV | SCV | TSCV | CV | SCV | SCV | SCV | SCV | SCV | SCV | TSCV |
| 2-fcv | 9.2947E-2 | 9.2766E-2 | 9.2609E-2 | 9.2355E-2 | 9.2156E-2 | 9.1978E-2 | 9.1991E-2 | 9.1875E-2 | 3.3380E-3 | 3.3012E-3 | 3.1851E-3 | 3.0756E-3 | 2.9521E-3 | 2.8680E-3 | 2.8328E-3 | 2.7992E-3 |
| vs. CV | ✗ | 2.44E-4 | 1.51E-5 | 7.45E-9 | 5.22E-7 | 2.46E-7 | 1.54E-6 | 2.76E-6 | ✗ | 1.71E-1 | 1.87E-3 | 5.83E-4 | 2.75E-5 | 1.88E-6 | 7.45E-8 | 1.26E-6 |
| vs. TSCV | 2.76E-6 * | 4.77E-6 * | 7.96E-6 * | 1.35E-4 * | 7.16E-4 * | 3.27E-1 * | 1.26E-1 * | ✗ | 1.26E-6 * | 4.10E-7 * | 1.20E-4 * | 7.92E-4 * | 3.66E-5 * | 2.02E-1 * | 9.73E-1 | ✗ |
| 5-fcv | 9.0102E-2 | 9.0086E-2 | 9.0023E-2 | 8.9920E-2 | 8.9815E-2 | 8.9701E-2 | 8.9705E-2 | 8.9653E-2 | 1.9316E-3 | 1.9204E-3 | 1.9172E-3 | 1.8594E-3 | 1.8275E-3 | 1.7749E-3 | 1.7593E-3 | 1.7456E-3 |
| vs. CV | ✗ | 3.62E-1 | 4.21E-5 | 1.29E-3 | 1.88E-6 | 1.10E-5 | 1.77E-5 | 4.83E-5 | ✗ | 2.64E-1 | 3.05E-1 | 4.41E-3 | 4.73E-4 | 1.06E-4 | 3.66E-5 | 3.18E-5 |
| vs. TSCV | 4.83E-5 * | 9.32E-5 * | 2.74E-4 * | 3.81E-4 * | 8.86E-3 * | 5.37E-1 * | 7.35E-2 * | ✗ | 3.18E-5 * | 1.20E-4 * | 5.53E-5 * | 4.41E-3 * | 1.70E-3 * | 5.64E-2 * | 6.62E-1 * | ✗ |
| 10-fcv | 8.9141E-2 | 8.9143E-2 | 8.9137E-2 | 8.9071E-2 | 8.9021E-2 | 8.8974E-2 | 8.8957E-2 | 8.8945E-2 | 1.5020E-3 | 1.5006E-3 | 1.4981E-3 | 1.4373E-3 | 1.4092E-3 | 1.3977E-3 | 1.3674E-3 | 1.3662E-3 |
| vs. CV | ✗ | 9.55E-1 | 2.64E-2 | 4.06E-3 | 1.36E-2 | 1.67E-2 | 1.03E-2 | 1.36E-2 | ✗ | 8.67E-1 | 5.67E-1 | 3.18E-5 | 6.32E-5 | 3.66E-5 | 1.35E-4 | 5.68E-6 |
| vs. TSCV | 1.36E-2 * | 8.86E-3 * | 2.64E-2 * | 1.79E-2 * | 8.15E-2 * | 1.09E-1 * | 6.30E-1 * | ✗ | 5.68E-6 * | 6.32E-5 * | 2.76E-6 * | 8.75E-4 * | 6.55E-3 * | 3.74E-3 * | 9.73E-1 | ✗ |
| NN | CV | SCV | SCV | SCV | SCV | SCV | SCV | TSCV | CV | SCV | SCV | SCV | SCV | SCV | SCV | TSCV |
| 2-fcv | 8.6539E-2 | 8.6454E-2 | 8.6336E-2 | 8.6196E-2 | 8.6106E-2 | 8.5954E-2 | 8.5849E-2 | 8.5689E-2 | 3.0571E-3 | 3.0134E-3 | 3.0113E-3 | 3.0113E-3 | 2.9897E-3 | 2.9681E-3 | 2.9352E-3 | 2.9453E-3 |
| vs. CV | ✗ | 6.98E-2 | 7.92E-4 | 4.77E-6 | 6.56E-7 | 4.77E-6 | 2.46E-7 | 4.10E-7 | ✗ | 5.95E-2 | 1.57E-1 | 6.62E-2 | 1.56E-2 | 3.06E-4 | 3.66E-5 | 2.81E-2 |
| vs. TSCV | 4.10E-7 * | 4.77E-6 * | 1.94E-4 * | 3.42E-4 * | 1.29E-3 * | 2.47E-2 * | 2.18E-1 * | ✗ | 2.81E-2 * | 4.51E-2 * | 2.18E-2 * | 1.67E-2 * | 5.34E-2 * | 9.93E-2 * | 6.14E-1 * | ✗ |
| 5-fcv | 8.1336E-2 | 8.1350E-2 | 8.1270E-2 | 8.1197E-2 | 8.1136E-2 | 8.1016E-2 | 8.0928E-2 | 8.0752E-2 | 1.8602E-3 | 1.8664E-3 | 1.8340E-3 | 1.8393E-3 | 1.7967E-3 | 1.7092E-3 | 1.6800E-3 | 1.6733E-3 |
| vs. CV | ✗ | 4.51E-1 * | 1.79E-2 | 6.32E-5 | 5.53E-5 | 1.20E-4 | 8.20E-5 | 6.32E-5 | ✗ | 5.22E-1 * | 3.74E-1 | 5.64E-2 | 4.25E-4 | 1.55E-3 | 6.32E-5 | 1.17E-3 |
| vs. TSCV | 6.32E-5 * | 5.53E-5 * | 1.72E-4 * | 5.26E-4 * | 1.72E-4 * | 2.90E-3 * | 1.55E-3 * | ✗ | 1.17E-3 * | 3.81E-4 * | 9.54E-3 * | 7.92E-4 * | 9.00E-2 * | 2.64E-2 * | 9.55E-1 * | ✗ |
| 10-fcv | 7.9092E-2 | 7.9089E-2 | 7.9092E-2 | 7.9071E-2 | 7.9063E-2 | 7.9006E-2 | 7.8983E-2 | 7.8874E-2 | 1.3628E-3 | 1.3489E-3 | 1.3409E-3 | 1.3100E-3 | 1.2730E-3 | 1.2442E-3 | 1.2360E-3 | 1.2129E-3 |
| vs. CV | ✗ | 9.55E-1 * | 2.95E-1 | 1.27E-2 | 4.78E-3 | 2.04E-3 | 3.16E-3 | 4.73E-4 | ✗ | 6.14E-1 | 1.57E-1 | 2.90E-3 | 2.44E-4 | 1.54E-6 | 1.26E-6 | 3.18E-5 |
| vs. TSCV | 4.73E-4 * | 5.83E-4 * | 1.70E-3 * | *1.06E-3 | 4.06E-3 * | 9.54E-3 * | 1.03E-2 * | ✗ | 3.18E-5 * | 1.88E-6 * | 1.42E-3 * | 2.04E-3 * | 2.04E-2 * | 4.77E-2 * | 3.99E-1 * | ✗ |
Publisher’s Note: MDPI stays neutral with regard to jurisdictional claims in published maps and institutional affiliations. |
© 2022 by the authors. Licensee MDPI, Basel, Switzerland. This article is an open access article distributed under the terms and conditions of the Creative Commons Attribution (CC BY) license (https://creativecommons.org/licenses/by/4.0/).
Share and Cite
MDPI and ACS Style
Sáez, J.A.; Romero-Béjar, J.L. Impact of Regressand Stratification in Dataset Shift Caused by Cross-Validation. Mathematics 2022, 10, 2538. https://0-doi-org.brum.beds.ac.uk/10.3390/math10142538
AMA Style
Sáez JA, Romero-Béjar JL. Impact of Regressand Stratification in Dataset Shift Caused by Cross-Validation. Mathematics. 2022; 10(14):2538. https://0-doi-org.brum.beds.ac.uk/10.3390/math10142538
Chicago/Turabian StyleSáez, José A., and José L. Romero-Béjar. 2022. "Impact of Regressand Stratification in Dataset Shift Caused by Cross-Validation" Mathematics 10, no. 14: 2538. https://0-doi-org.brum.beds.ac.uk/10.3390/math10142538
Note that from the first issue of 2016, this journal uses article numbers instead of page numbers. See further details here.