
Modeling of Territorial and Managerial Aspects of Robotization of Agriculture in Russia


1
Department of Chess Art and Computer Mathematics, Ural State University of Economics, March 8 Str./Narodnaya Volya St., 62/45, 620144 Yekaterinburg, Russia
2
Department of Competition Law and Antimonopoly Regulation, Ural Federal University of Economics, 620144 Yekaterinburg, Russia
3
Department of Economics, Management and Law, Ural State University of Economics, March 8 Str./Narodnaya Volya St., 62/45, 620144 Yekaterinburg, Russia
4
Department of Economics, Management and Law, South Ural State University, Pr. Lenina, 76, 454080 Chelyabinsk, Russia
5
Department of Competition Law and Antimonopoly Regulation, Ural State University of Economics, March 8 Str./Narodnaya Volya St., 62/45, 620144 Yekaterinburg, Russia
*
Author to whom correspondence should be addressed.
Mathematics 2022, 10(14), 2540; https://0-doi-org.brum.beds.ac.uk/10.3390/math10142540
Submission received: 22 June 2022
/
Revised: 19 July 2022
/
Accepted: 19 July 2022
/
Published: 21 July 2022
Abstract
:In the context of a shortage of labor and objective patterns of the development of means of production in a number of sectors of agriculture, farmers are increasingly using robotics. Despite the presence of significant positive economic effects, the robotization of agriculture in Russia is carried out at a slow pace and is very uneven. This suggests that the robotization of agriculture is influenced by the socio-economic characteristics and characteristics of the regions. The methods are based on a systematic approach to research and an algebraic approach to modelling, which, in our opinion, is a system of several components. To build models, data on the introduction of robotics in Russian agriculture for 2006–2020 and the socio-economic characteristics of the regions during the period of the most intensive introduction of robots (2013–2017) were used. As a conclusion, it can be noted that the robotization of agriculture in the Russian Federation is at the implementation stage, which is confirmed by a significant spread in the correlation coefficient of robotization indicators and various socio-economic characteristics of the regions, including the share of organizations using the Internet, availability of road infrastructure, the share of the rural population in the regions and a number of other indicators. It is shown that, at this stage of the robotization of agriculture, the most important are the models of the management process, while the priority is the subjective component of decision-making about the introduction of robotics, both at the micro level and at the regional level. We have proposed models that reflect various aspects of the robotization process and three mathematical models for the implementation of the strategy are built, which form a model-triad. Three theorems on the existence of an optimal realization of the strategy are proved.
Keywords:
mathematical model; algebraic approach; modelling; robotization; agriculture; territorial featuresMSC:
37M101. Introduction
Agricultural organizations have recently faced labor shortages [1]. First of all, there is a need in the industry for workers of mass professions, which include workers in harvesting, caring for animals. One of the reasons for the current situation in the agricultural sector of the economy is the unfavorable demographic situation in a number of regions and the growing urbanization of the population. There is an increase in the cost of labor, which forces agricultural producers to introduce labor-saving technologies. Recently, the situation has escalated amid the spread of the COVID-19 epidemic and related restrictions on the movement of labor [2]. The COVID-19 pandemic has clearly shown the growing dependence of the industry on the supply of labor and has become a real challenge for the sustainability of agricultural production [3,4]. The solution to the aggravated and growing problems can include the further digitalization of agriculture, which will improve the efficiency of the industry and reduce the impact of adverse environmental factors. Digitalization is based on a system of models, including mathematical ones.
Therefore, the purpose of this work is to build a system of models that describe various aspects of the robotization of agriculture. To achieve this purpose, the following objectives were set:
- (1)
- develop a system of robotization models for agriculture;
- (2)
- identify aspects of the process of robotization of agriculture in Russia that are priority at this stage of development;
- (3
- create models for constructing and implementation of activity plans;
- (4)
- construct and study a system of mathematical models for the implementation of the strategy.
Currently, the use of robots in various sectors of the economy is increasing. According to the International Organization for Robotics (IFR), more than 3 million robots are used worldwide [5]. This gives rise to many scientists declaring the beginning of a new industrial and agricultural revolution, or industry 4.0 [6,7] or 5.0 [8,9]. Robots are most widely used in the automotive and electronics industries. However, even in such a conservative industry as agriculture, the use of robots in various industries is growing, but not in all industries and processes. The most commercialized milking robot is one of the most successful and important innovations in the dairy farming system. The use of a milking robot completely changes the production technology, in which the entire milking process is carried out without human intervention. At the same time, the cows are freely kept indoors; they independently come to the box with a milking robot, which identifies each cow, cleans the udder, brings the teat cups to the teats with a manipulator arm, directly carries out the milking process, and so on. In recent years, there has been a high rate of the introduction of digital technologies in agricultural production, including the robotization of agriculture [10].
The use of robotics is becoming a key element of the new technological reality in agriculture. Currently, using robots, they perform a wide range of operations in agriculture, which for another two decades were the prerogative of exclusively human activity. Thus, robots have been developed and successfully used for harvesting strawberries [11], identifying and controlling weeds [12], for performing work in greenhouses [13], for harvesting [14,15], for performing standard tillage operations [16], for pest control [17] and many other operations. This is happening at a time when farmers are systemically experiencing labor shortages and—with the global population expected to grow from 7.7 billion to 9.7 billion people in just 30 years—food demand will rise significantly [18]. One of the reasons for the actualizing applications of robotics is the need to reduce the harmful effects on the environment. Excessive use of mineral fertilizers, pesticides and herbicides by farmers manually, results in environmental pollution, including carbon, nitrogen and water footprint, water pollution, soil degradation and so on [19]. The use of robotics allows for the point application of fertilizers, pesticides and herbicides, which will reduce the harmful impact on nature [20]. Another important reason that actualizes the need for the use of robotics in agriculture is climate change [21]. The use of robots enables the collection of accurate data to develop more accurate and appropriate adaptation strategies in the face of climate change [19].
Some researchers note that the introduction of robotics in agriculture and in particular in milking animals leads to a reduction in the need for labor, an improvement in the social life of peasants and an increase in labor productivity. For example, there is a growing debate about the impact of robotization on employment and skills, on inequality, and on the personal health and well-being of the population. In many respects, the positive effects of the use of robots are obvious, but a number of aspects of further robotization remain insufficiently studied. This applies primarily to the potential impact of robotization on unemployment. According to available estimates, in the course of the further development of robotics, up to half of jobs can be replaced by robots [22,23], although some authors point to positive effects for the creation of additional jobs in the process of robotization [24,25]. The use of robotics in agriculture has significant positive economic effects. In a study by Canadian scientists, which was conducted on a total of 530 robotic farms in 2014–2015, a significant improvement in economic performance was found. On average, after the introduction of robotics on farms, the number of employees per farm decreased from 2.5 to 2.0, while the time spent on milking activities decreased by 62% (from 5.2 to 2.0 h/day). The average milking frequency increased to 3.0 times per day, and the workload of robots averaged 77% during the day. Producers reported an increase in milk yield; at the same time, the average milk yield on robotic farms increased to 32.6 kg/cows per day. In general, the study characterizes the consequences of farm robotization as positive [26]. The work of Turkish scientists summarizes the results of 33 studies in 13 different countries for 1998–2017 on the problems of using robotics in cow milking. The main conclusions are that dairy farms using a robotic milking system have an advantage over traditional farms. Thus, in terms of gross milk production, the increase was 8.66% compared to farms without robots, labor intensity is lower than 27.84%, and the frequency of milking is 33.58% higher. However, it should be noted an increase in capital costs of 58.46% compared to a traditional farm. Despite the shortcomings in net income, the amount of investment, the use of robotic installations in the world is increasing day by day. This happens, among other things, due to the improvement of the social life of the peasant. So farmers have more time for family, fewer health problems, and have the opportunity to attract qualified personnel [27]. The use of digital technologies, and in particular robotics, leads, among other things, to a decrease in the influence of the geographical factor on the performance of agricultural organizations (farmers) [28]. As practice shows, the proximity to the places of sale of products allows farmers to get additional benefits [29,30]. Thus, many agricultural organizations that are located near large cities and agglomerations, as a rule, have higher economic indicators. At the same time, agricultural organizations located on the periphery are in stagnation. According to many scientists, there is a huge potential for increasing the economic efficiency of production and society as a whole, the discussion of further digitalization, including robotization, is shifting towards the risks that accompany these processes. Robotics in agricultural production is changing many aspects of farm management, as both the nature and organization of labor are being transformed. Manual labor is partially replaced by management and control, and the constant presence of the operator during the performance of production operations is not required [31]. However, in Russia, despite the existing positive experience, the use of robots in agriculture is not carried out in all regions. Thus, a project of 100 robotic farms has been implemented in the Kaluga region, and about 50 units of robotics are used in the Sverdlovsk region. However, in most regions it focuses on traditional technologies, despite the high performance achieved with the use of robotics in agriculture. In our opinion, insufficient infrastructure provision and low level of subsidies may be a deterrent to the introduction of robotics in certain regions. Provision of road infrastructure plays an important role in the development of rural areas. However, there are not enough data on the magnitude and distribution of benefits from the development of this type of infrastructure. Some studies show that providing wide access to roads will bring significant benefits on average, most of which will go to low-income households [32]. The development of road infrastructure in rural areas can facilitate the movement of workers. However, there are no major changes in agricultural results, income or assets, and employment in agricultural organizations increases slightly. Even with improved market links, remote areas may still lack economic opportunities [33]. The main hypothesis is that the robotization of agriculture in Russia is carried out under the influence of regional characteristics and socio-economic characteristics and characteristics of regions and rural areas. These features include the level and conditions of socio-economic development, the level of urbanization, the development of infrastructure, the demographic situation, the competitiveness of the agricultural sector and its ability to attract labor in comparison with other industries, etc. It is necessary to highlight the regional features of robotization that may be related to the characteristics of rural areas. As the main result of the study, an economic-mathematical model of spatial robotization of Russian agriculture will be created depending on various socio-economic characteristics of the regions. The significance of the results lies in the possibility of their use in the development of reasonable measures for the priority robotization of agricultural production in rural areas and regions where this activity is slow or not carried out, and thus the technological backlog is allowed and intensifies.
2. Materials and Methods
The methodology of the work is based on a systematic approach to research (von Bertalanffy, Bogdanov, etc.) and on an algebraic approach to modelling.
At present, science has accumulated a huge array of various models that describe various aspects of various processes and other phenomena. However, they are quite difficult to use to build models that describe several aspects of the prototype at the same time. As a basis for creating a mechanism for constructing new models based on the existing set of built and studied models, we previously proposed [34] a construction that we called the algebraic approach to modeling, which we defined as a system of three components:
- (1)
- system of basic models;
- (2)
- system of typical transformations and typical combinations of models;
- (3)
- an approximation mechanism designed for, generally speaking, an approximate representation of the model being created or studied as a result of applying typical transformations and typical combinations of basic models.
The basis for applying the algebraic approach to modelling is the formal-constructive interpretation of the model proposed by us.
Typically, the definition of a model is based on one or another requirement of the “similarity” of an image to its prototype. Here are a few examples:
- (1)
- requirement that the study of the model allows obtaining information about the prototype;
- (2)
- results of model calculations are close to the results of the corresponding instrumental calculations;
- (3)
- results of instrumental measurements carried out on the model (for example, layout), after recalculation taking into account the effect of scale, are close to the measurement results for the prototype;
- (4)
- the results of observations in the experimental group allow us to confirm the presence of a certain relationship between the subjects of a certain type of activity;
- (5)
- a portrait of a person can be considered his model, let’s say, if a person can be recognized by his portrait or, for example, if the portrait evokes emotions similar to the emotions from communicating with this person, etc.
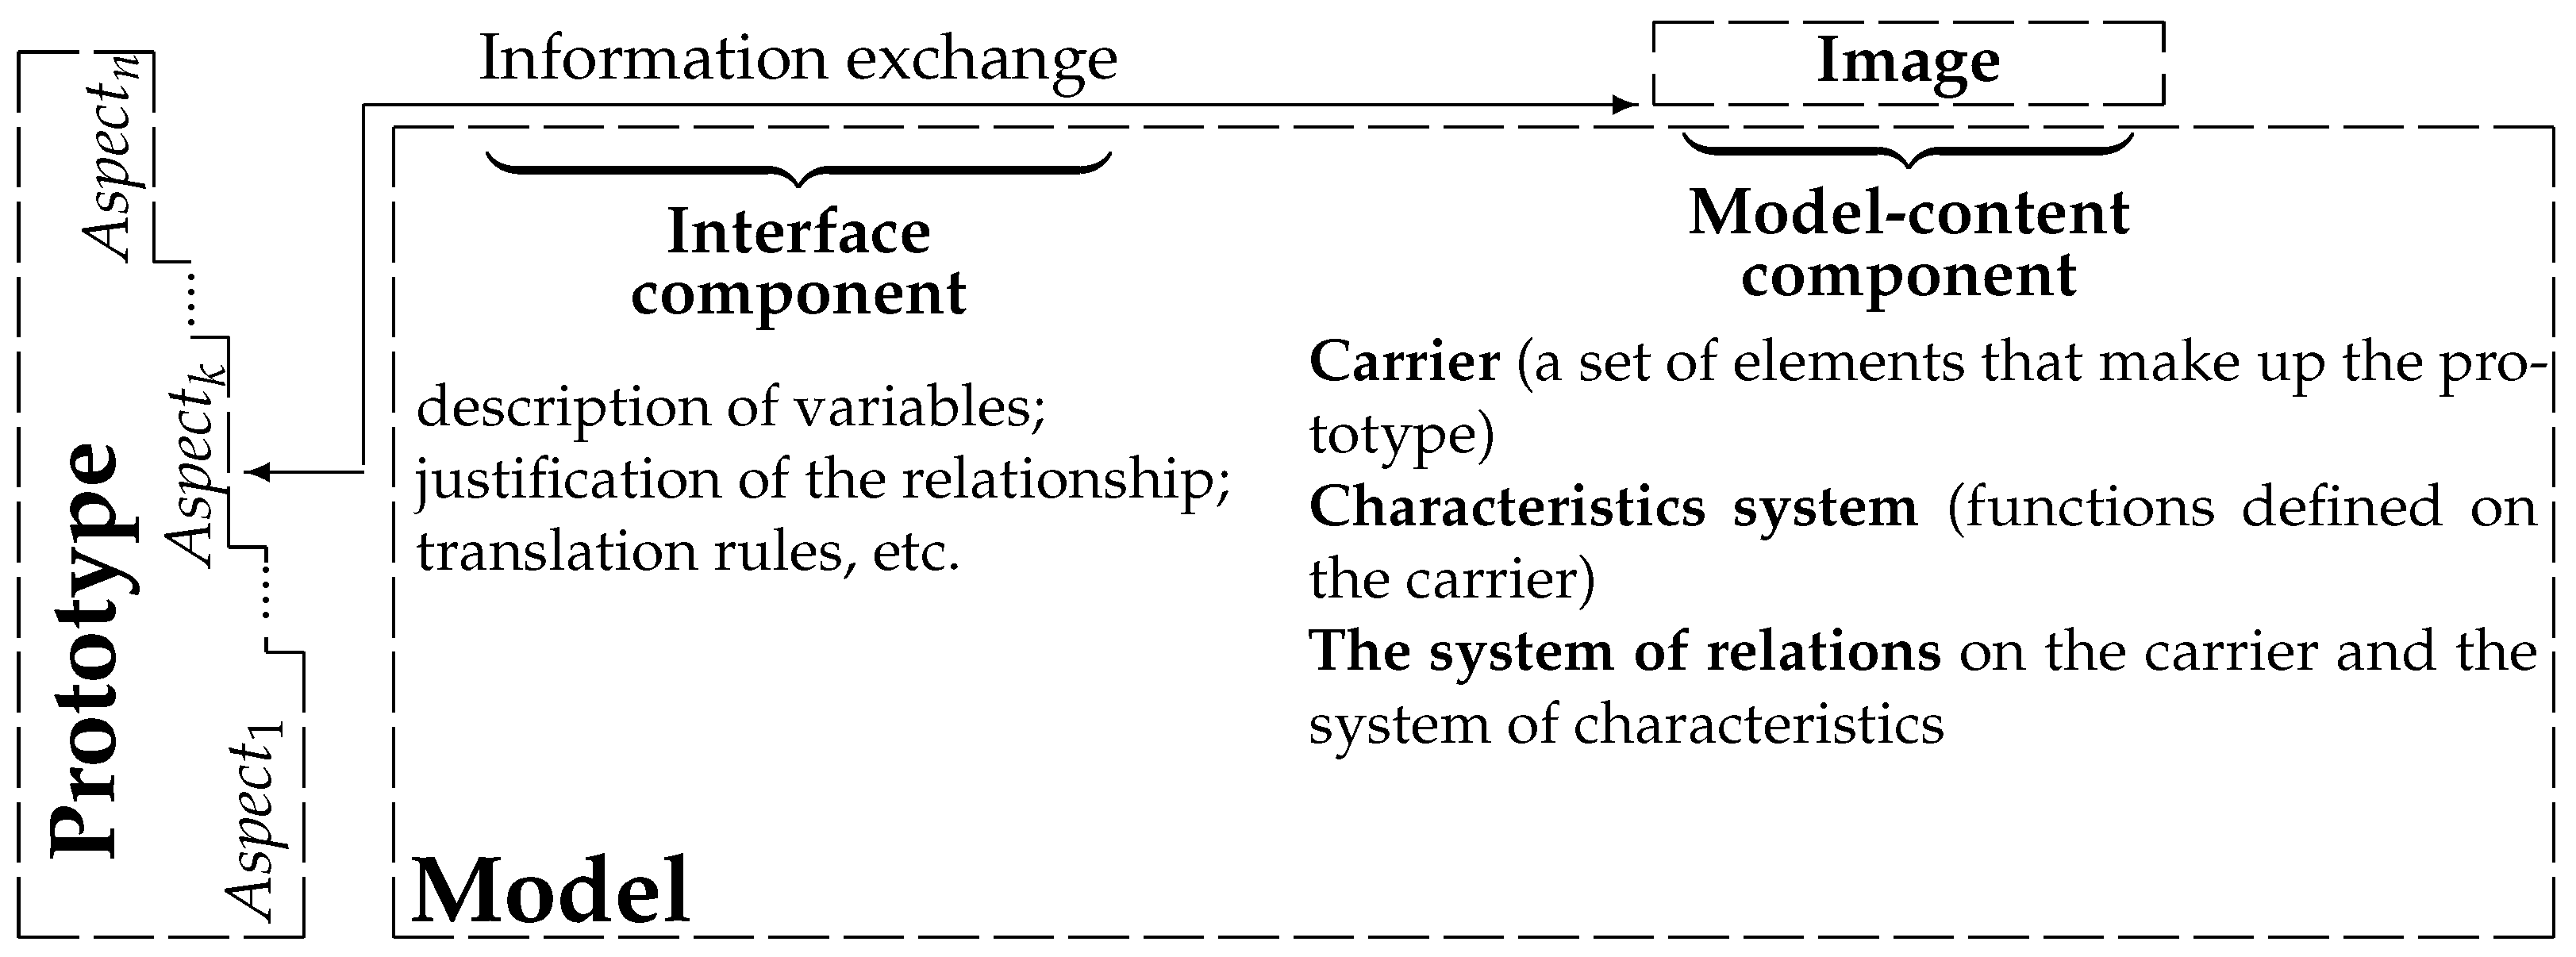
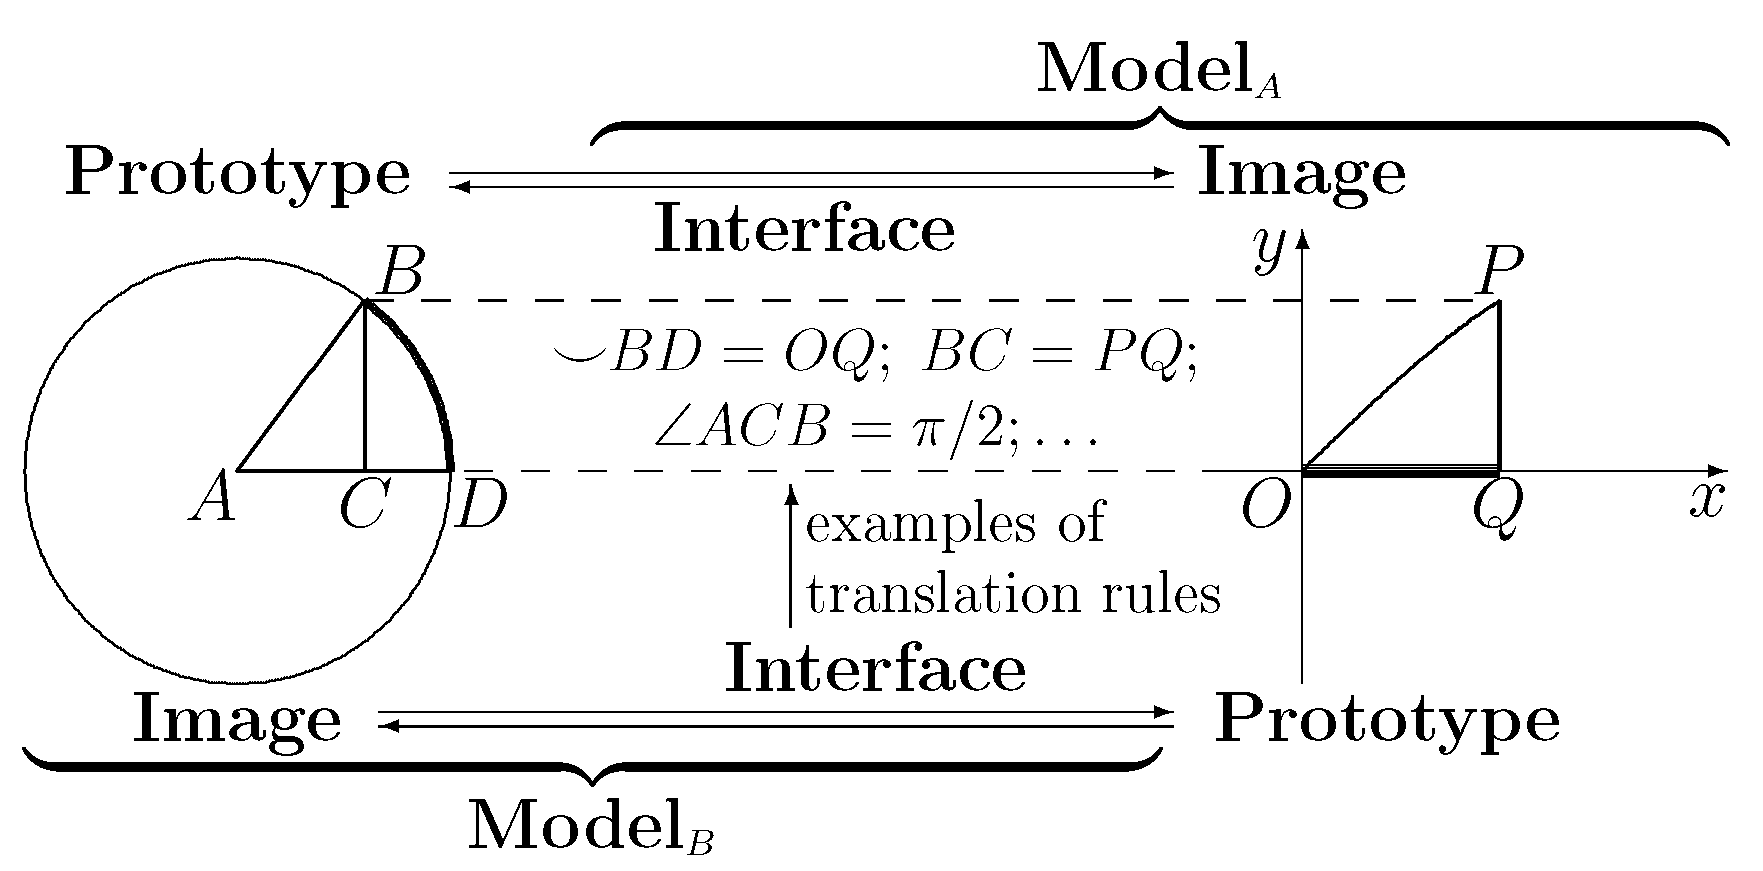
However, to say whether, for example, some equation will be a model of a specific economic process is possible only if the interpretation of the variables, the economic meaning of the derivative of the function, etc. are known. Therefore, we consider as a model not an image, but a system <<interface-image>>, where the interface ensures the exchange of information between the prototype and the image, more precisely, the interpretation of information about the prototype in terms of those theories about in whose languages the image is described and vice versa, the interpretation of information about the image in terms of theories about in which languages the prototype is described, see Figure 1. In addition, in the phrases <<model of the movement of the car>>, <<model of the evaporation process>>, and <<model of the development of the economic crisis>> the prototype is actually identified with the object, not the subject of research. Therefore, the model usually reflects a certain aspect of the prototype: economic, environmental, technological, social, etc. Often this aspect is considered as a prototype, but taking into account different aspects is necessary when building complex models that are the result of combining models that reflect different aspects of the prototype.
From the point of view of the algebraic approach to building models described above, we note that type transformations and typical combinations of models are universal, some of which are given in [34]. The approximation mechanism currently depends on the specific type of models, although, in our opinion, it is possible to create a universal approximation mechanism based on the author’s recommendations to improve the adequacy of models. Therefore, in this article we will limit ourselves to describing some basic models that describe various aspects of the robotization of Russian agriculture. At the same time, the model of one of the management aspects is the strategy implementation model, represented by three mathematical models created by us.
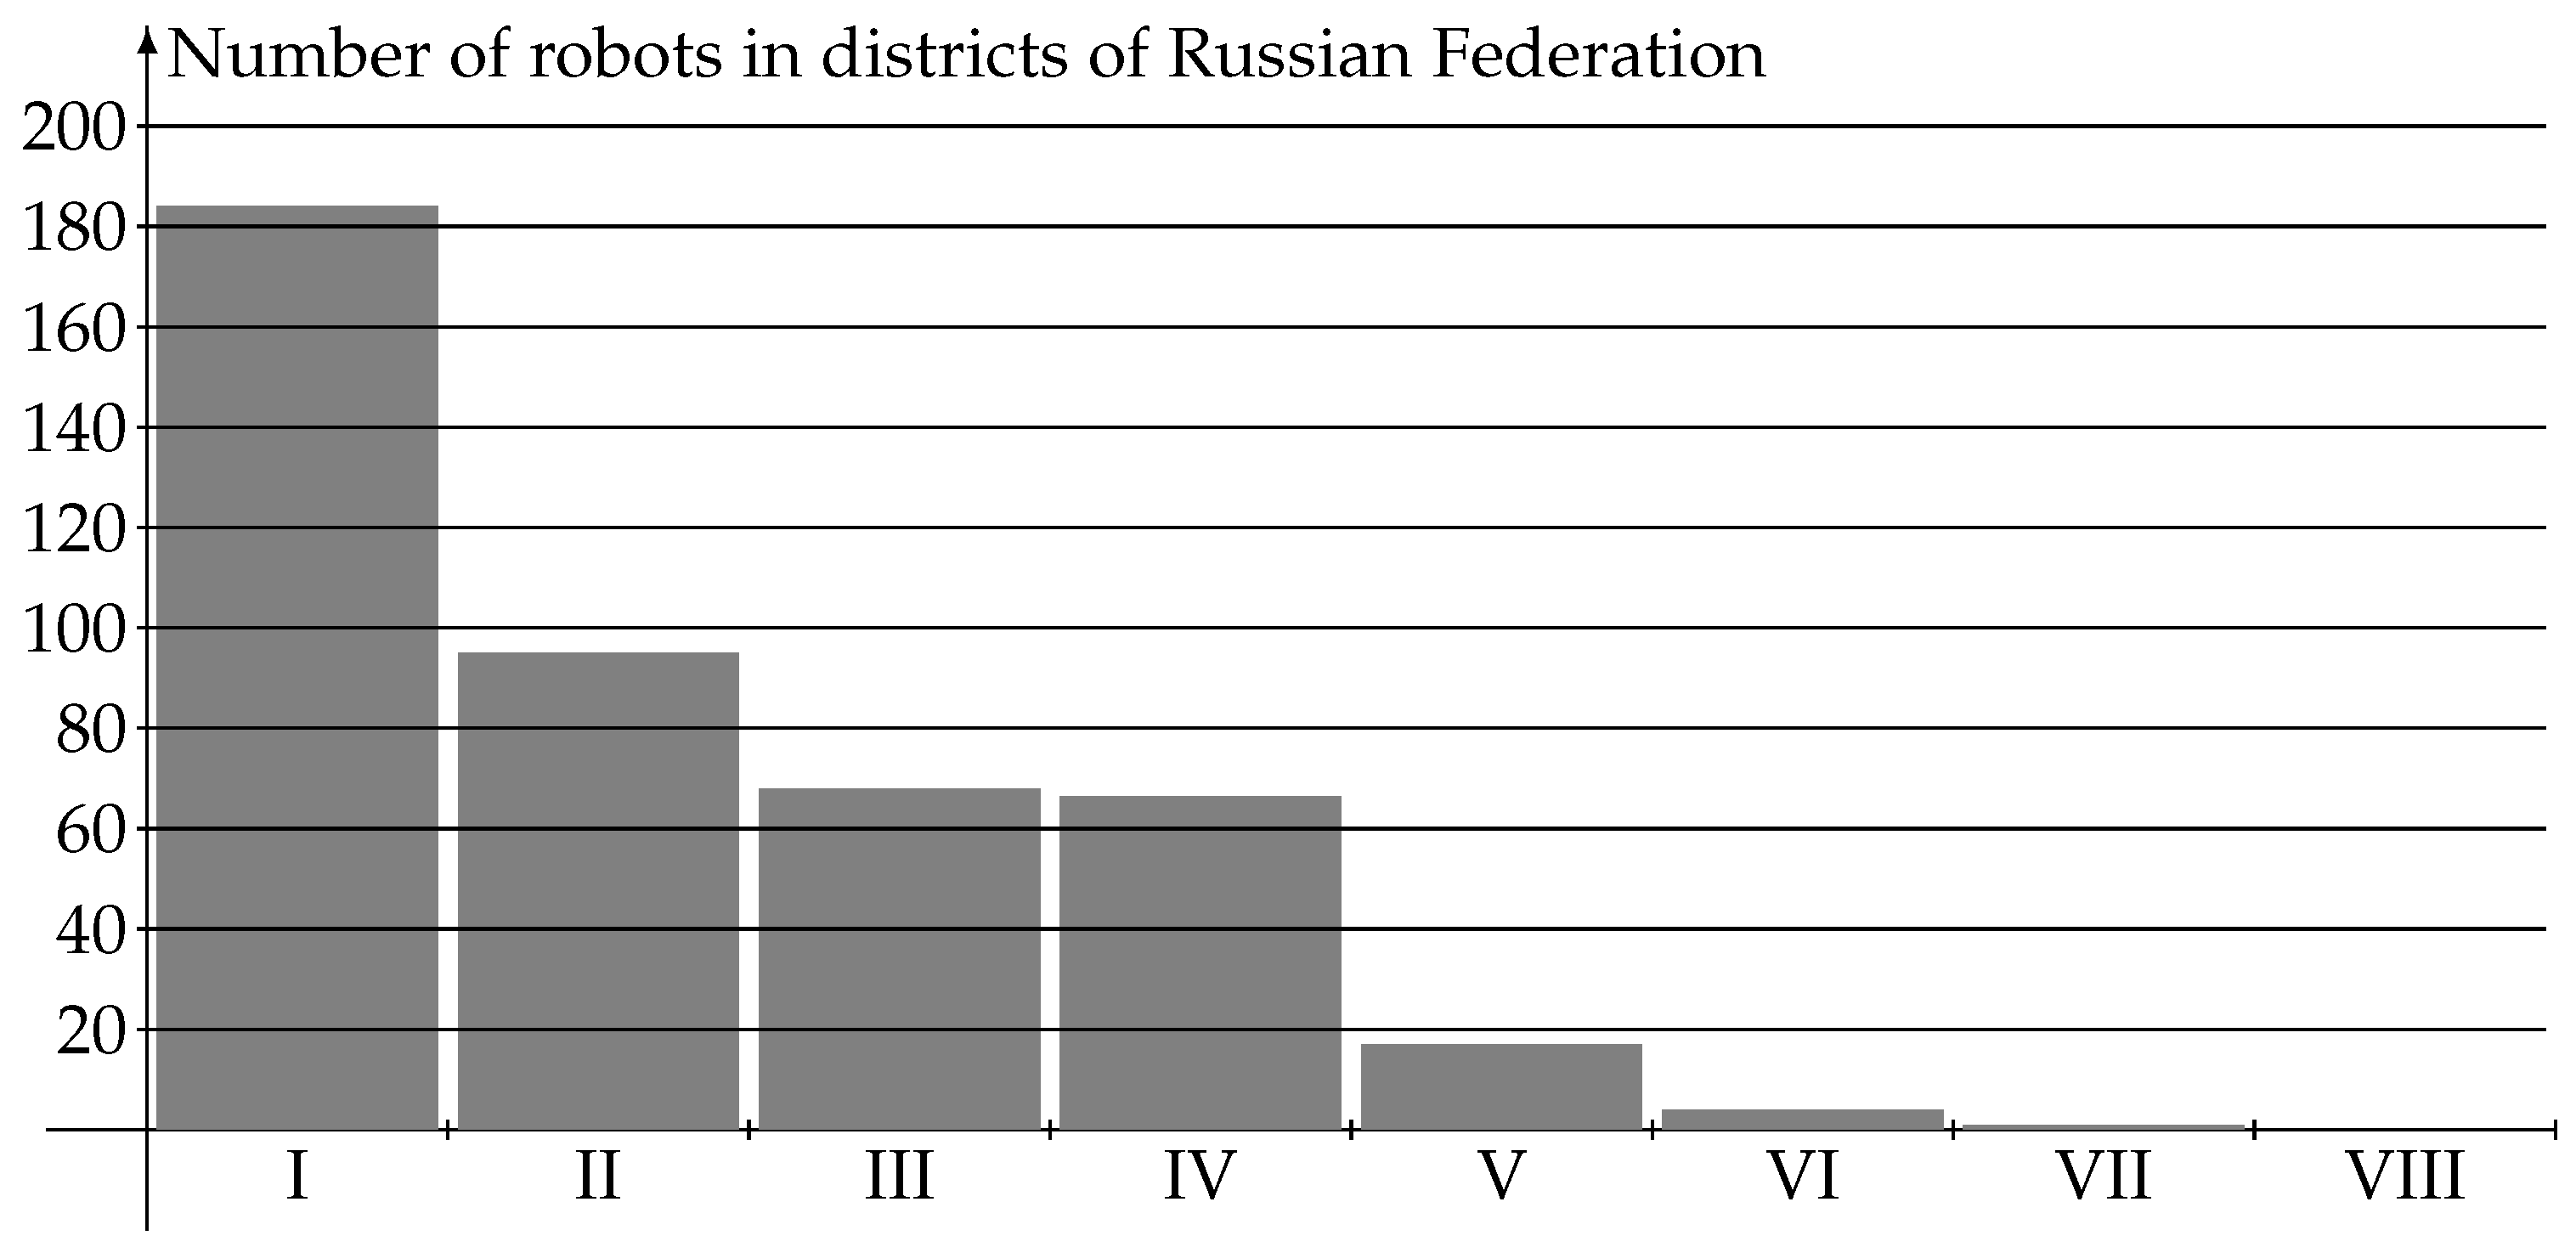
To clarify the amount of robotics used in agriculture, relevant requests were made to the regional ministries of agriculture and the agro-industrial complex of Russia. An analysis of the use of robotics in agriculture by federal districts is presented below (Figure 2).
As can be seen from Figure 2, the largest number of robotics used in agriculture in the Russian Federation is observed in the Central Federal District (184 units). Targeted events are being held here to robotize the industry in several regions at once. So in the Kaluga region, a project of 100 robotic farms was implemented. Robotics is widely used in agriculture in the Volga (95 units), Northwestern (66 units) and Ural (68 units) federal districts. The use of robots in agriculture is practically not carried out in the Southern, Siberian and North Caucasus federal districts. Disproportions in the introduction and use of robots in agriculture actualize the need to analyze the territorial patterns of the introduction of robotics in this conservative sector of the economy.
3. Results
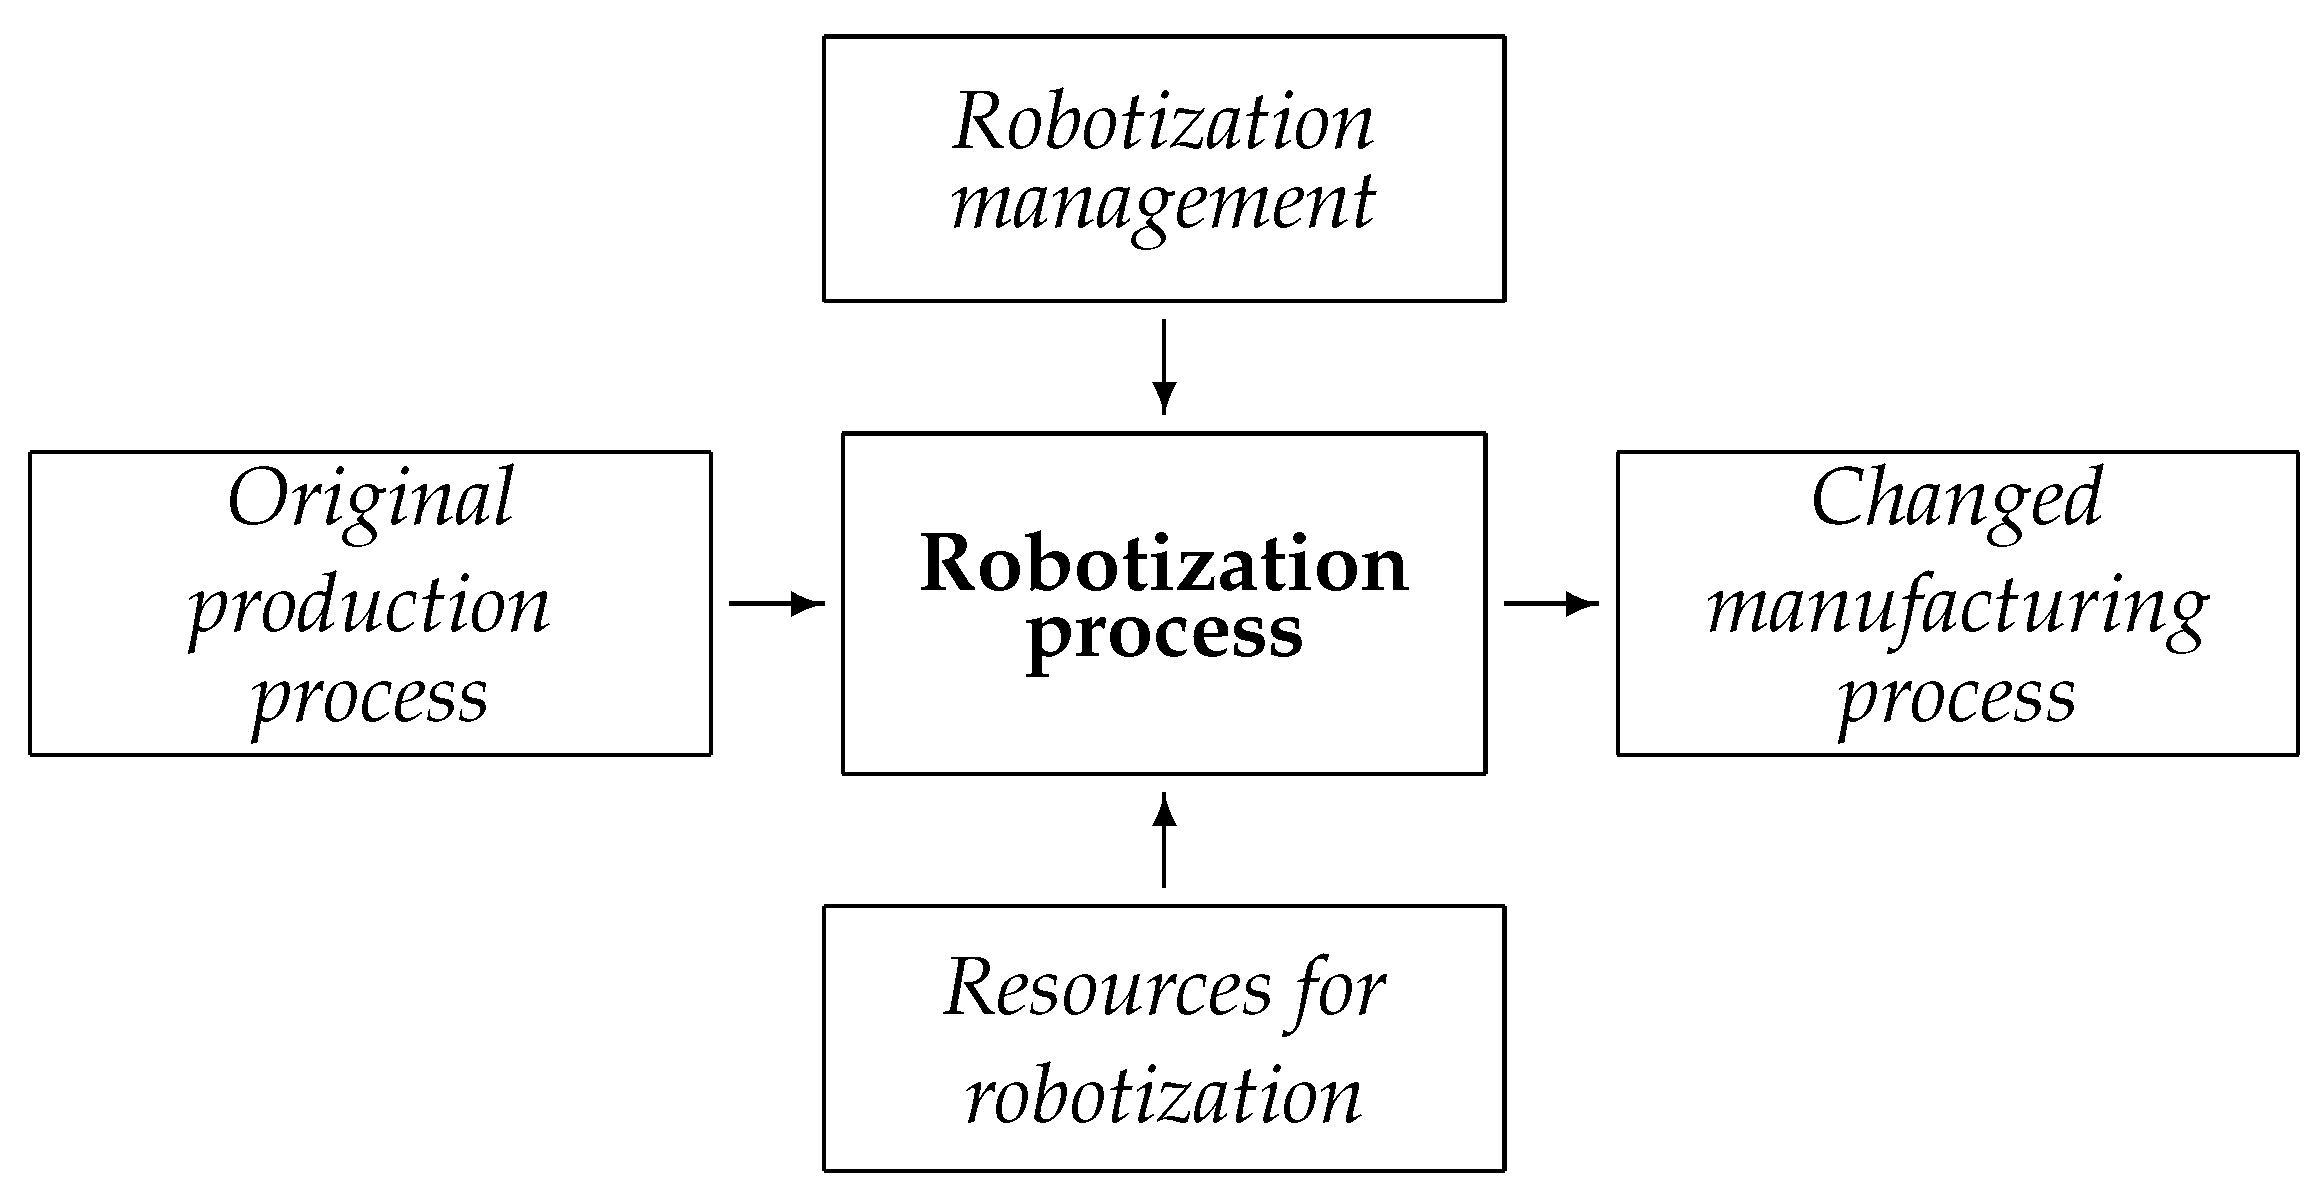
First of all, we can single out the economic and managerial model of the robotization process (Figure 3).
As can be seen from Figure 3, the following types of resources for robotization can be distinguished: (1) Material; (1.1) logistics; (1.2) industrial (production of spare parts, repair facilities); (1.3) availability of natural and industrially processed raw materials. (2) Management and information; (2.1) availability of personnel; (2.2) availability of a system for their training and retraining; (2.3) infrastructure for logging, transmission and processing of technical and managerial information. (3) Socio-demographic: (3.1) availability of labor resources; (3.2) the potential for the formation of the necessary labor resources (including the education system, the traditions of the local population, the balance of the age composition); (3.3) the development of cultural and community infrastructure (which affects, in particular, the ability to accept external labor resources); (3.4) the presence of natural and recreational zones (both functioning and suitable for development); (3.5) flexibility and relative homogeneity of the population. (4) Financial and economic: (4.1) availability of financial resources; (4.2) availability of financial structures; (4.3) variety, efficiency and availability of financial instruments.
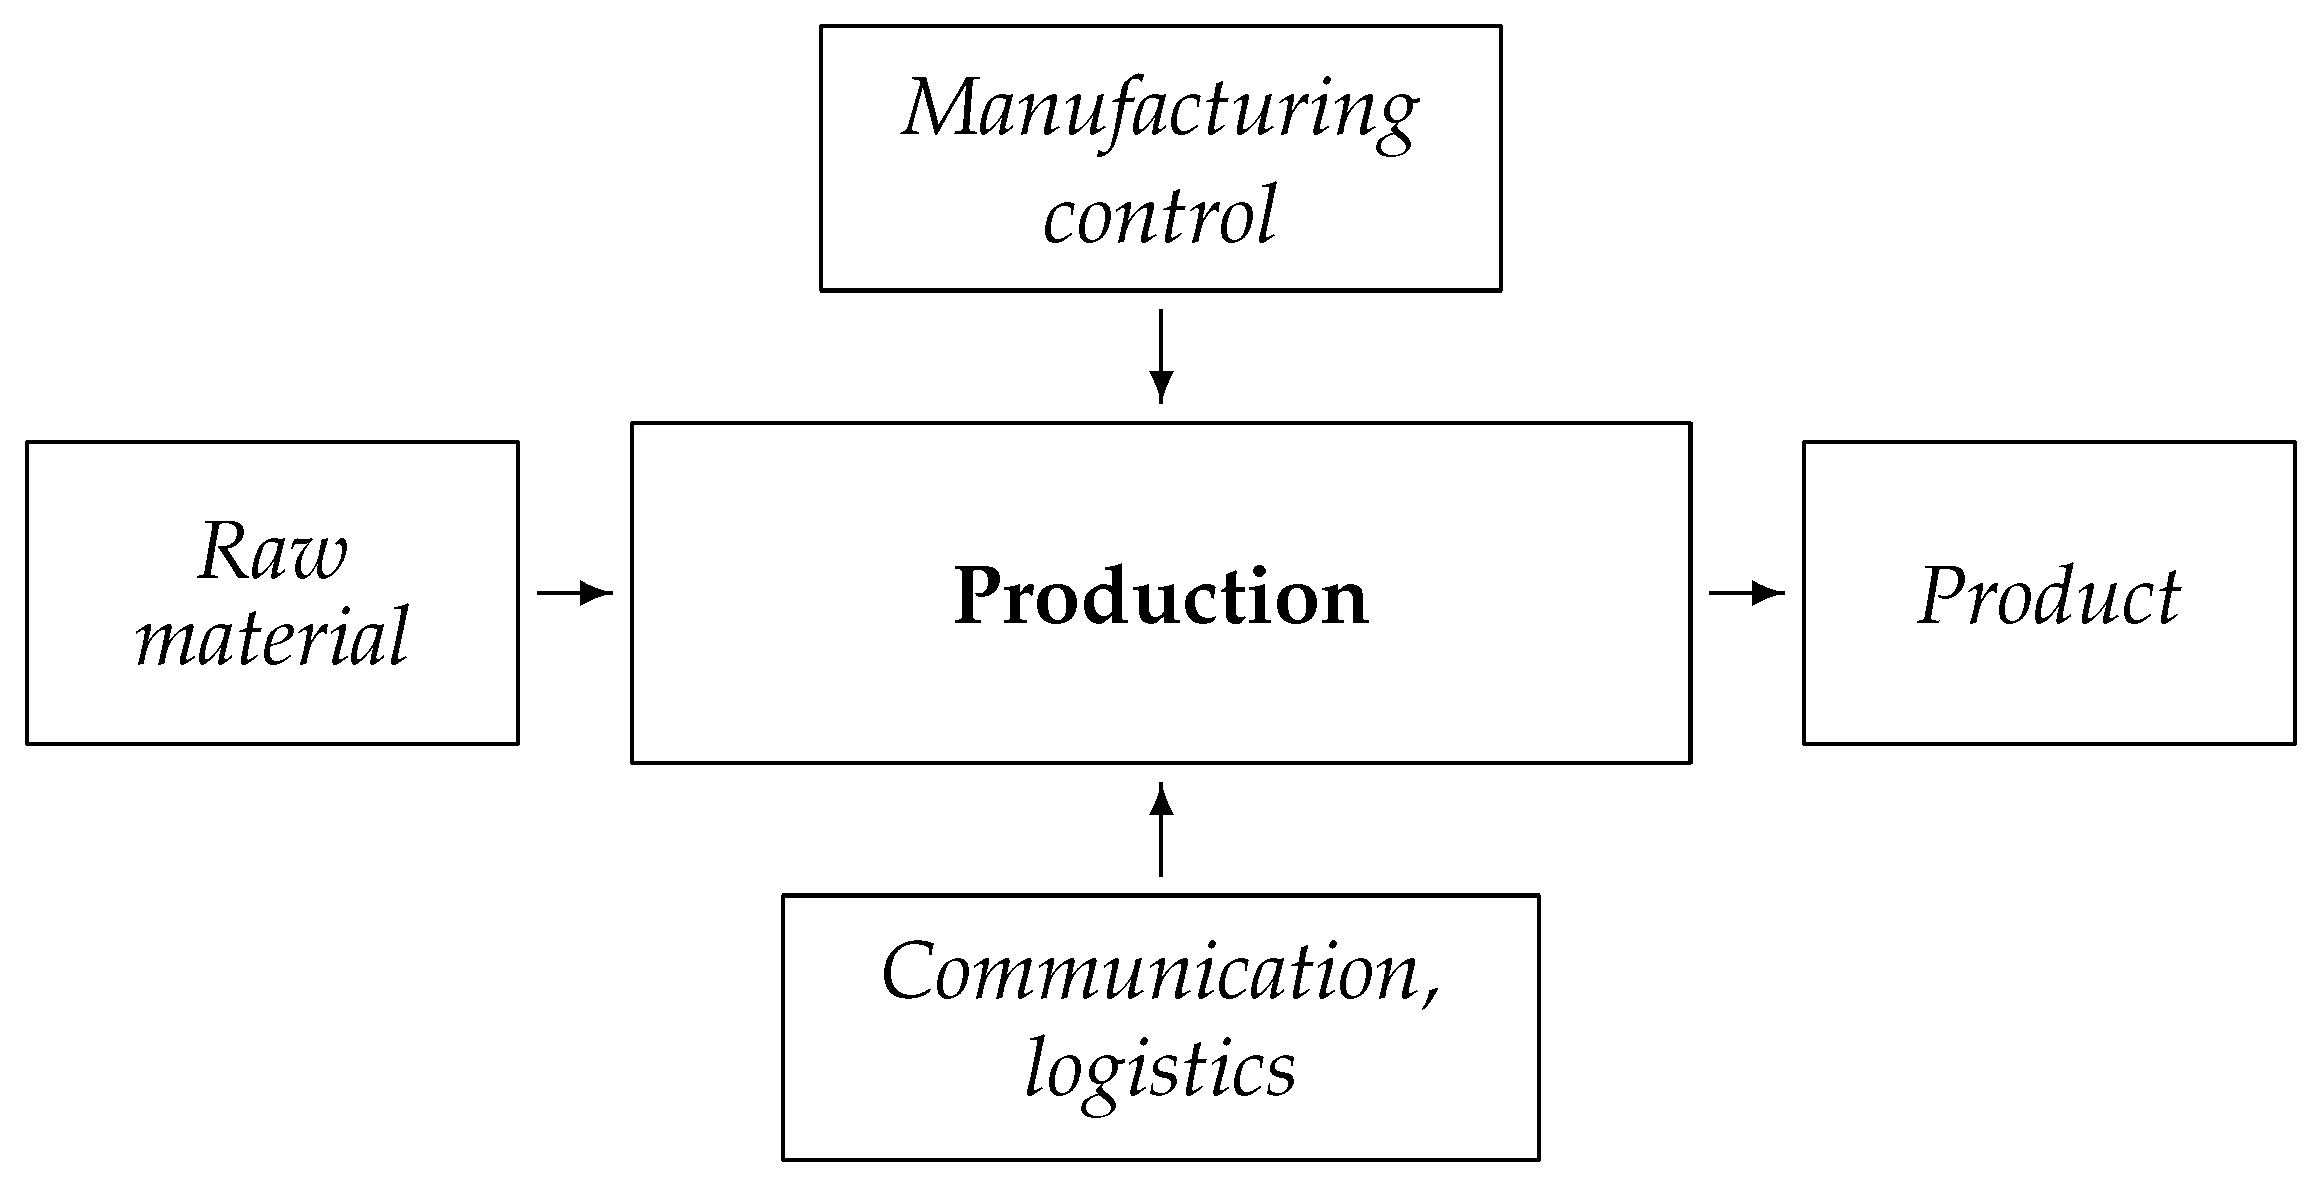
Another approach to the introduction of robots in agriculture is the production model of robotization (Figure 4).
As can be seen in Figure 4, the following components can be distinguished in this block: (1) Interaction: (1.1) internal (i.e., interaction between substructures of an economic entity) economic and technological interaction; (1.2) internal information and management interaction; (1.3) external (i.e., interaction between subjects of economic activity) economic and technological interaction; (1.4) external information and management interaction. (2) Logistics: (2.1) internal (i.e., between substructures of an economic entity) movement of material objects; (2.2) internal information and signal transmission; (2.3) internal accumulation—storage of material objects; (2.4) internal accumulation-storage of information and logging (recording and storage) of signal sequences; (2.5) external (i.e., between subjects of economic activity) movement of material objects; (2.6) external information and signal transmission.
Internal interaction and internal logistics are limited to the structural components of a particular economic entity. In the case when various subjects of economic activity are considered, we are talking about external interaction and external logistics. At the implementation stage, additional costs are necessary for the formation, distribution and formalization, firstly, of the objective component of management, i.e., management decision-making schemes (see, for example, Figure 5) and management infrastructure, as well as the formation of personnel and their training system, providing a subjective component of management. Secondly, the formation of resources for robotization include material (logistics, industrial, sources of raw materials), management and information (personnel and their training system, infrastructure for logging, transmission and processing of technical and managerial information), socio-demographic (labor resources, cultural and community infrastructure, infrastructure of natural and recreational areas), financial and economic (availability of financial resources and financial structures, diversity, efficiency and availability of financial instruments).
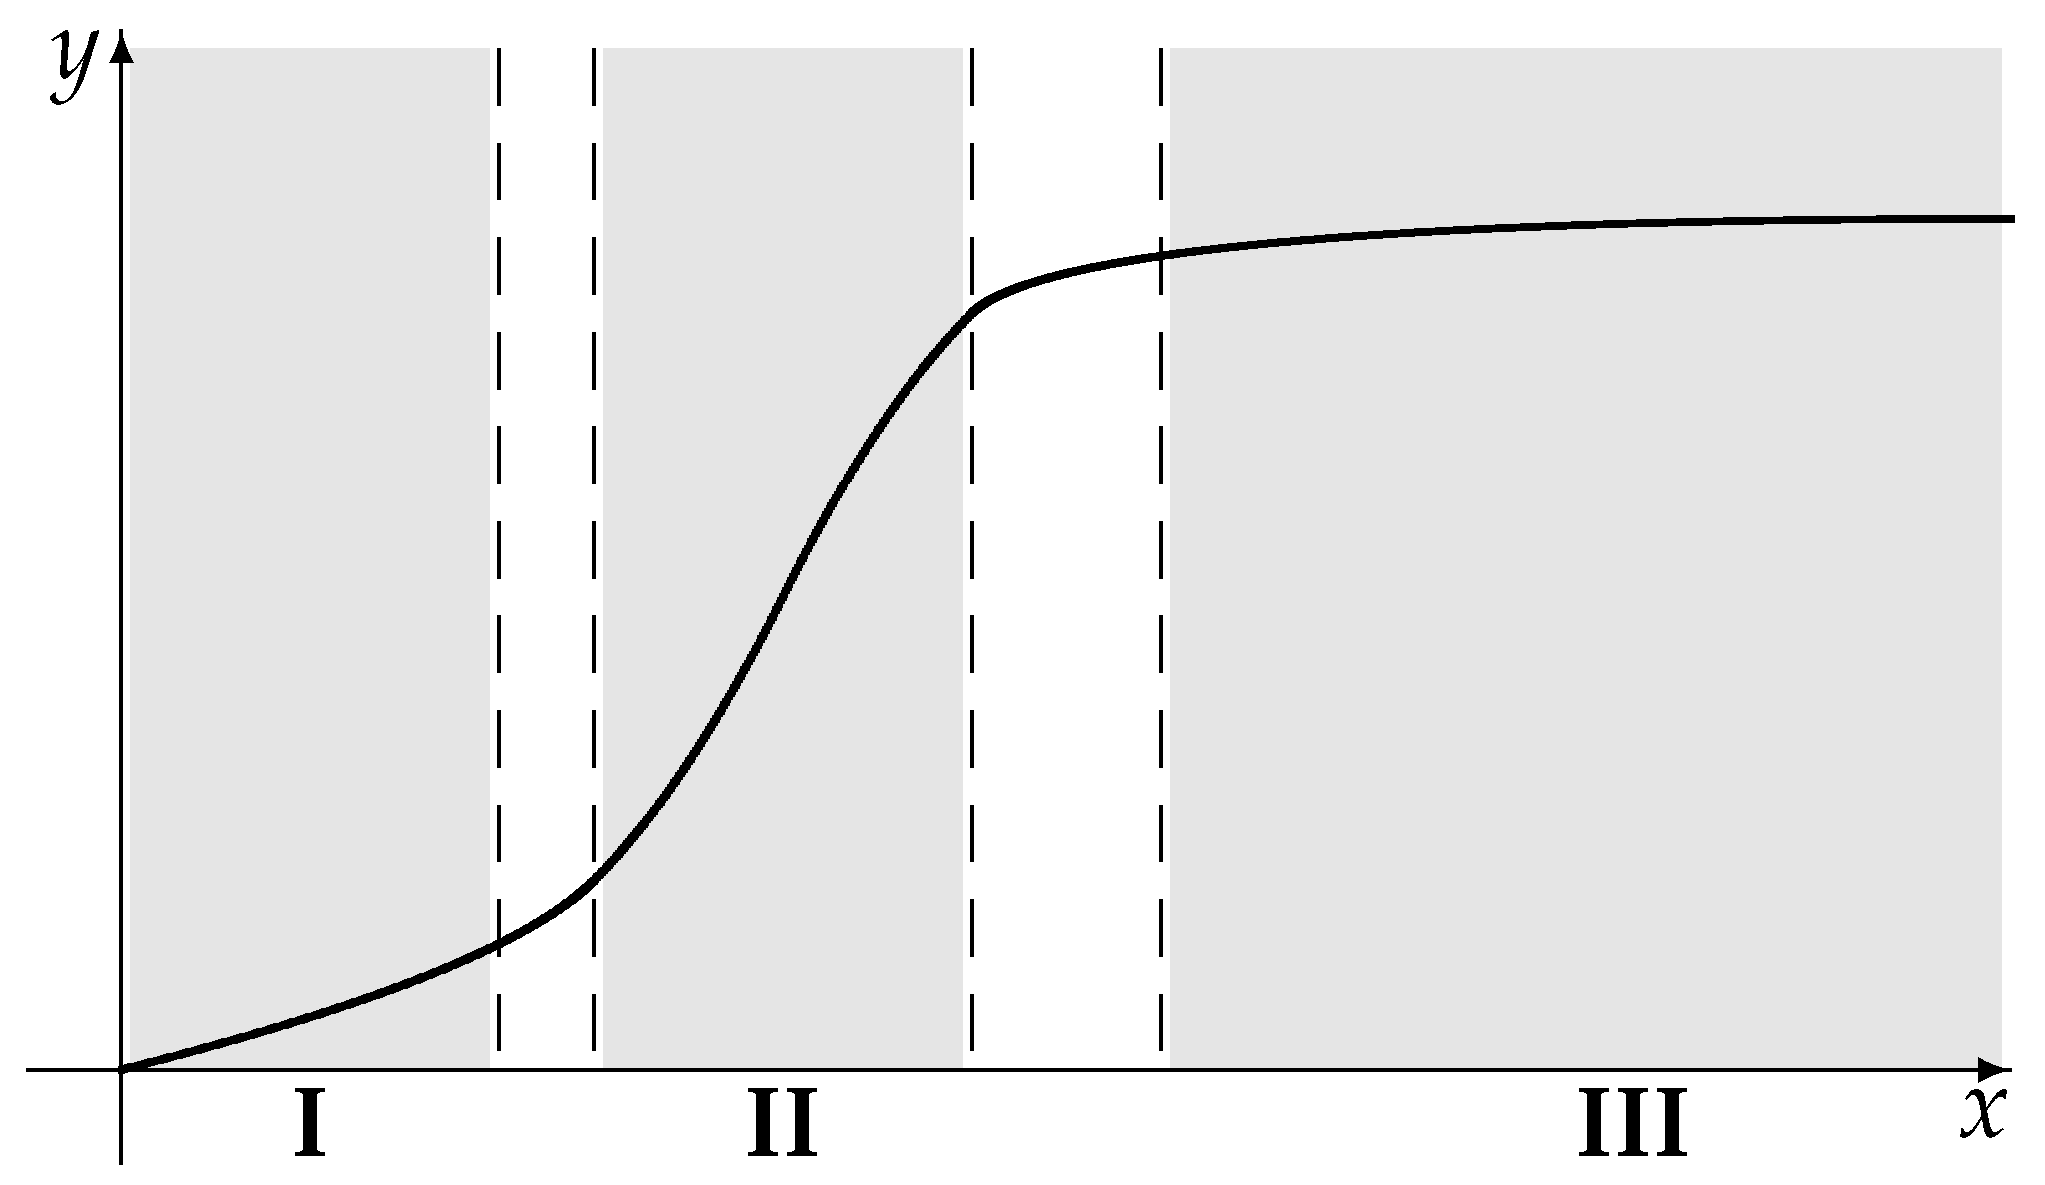
To characterize the process of the robotization of agriculture, we propose to use a graph of the life cycle of a product, in which it is possible to conditionally distinguish the stages of implementation (I), growth (II) and saturation (III) (the stage of reduction, and even more so the cessation of production for Russia is not relevant now) (Figure 6).
In our opinion, Russia is currently at stage I, the implementation stage (see Figure 6), since the prevalence of robotics in Russian agriculture is relatively low. Firstly, at the moment the influence of the subjective component of management (see explanations for Figure 4) on the number of robots in agriculture is excessively large, which is natural for this stage.
Secondly, in view of the relatively small number of robots being introduced, the dependence of the number of robots on time, on the investment of various types of resources (financial, human, material, etc.), on changes in the control system, etc., is obviously discrete. This statement is confirmed in particular, in a large spread in the correlation coefficient of the dependence of the percentage of robotization on the share of organizations using the Internet according to the result of averaging for 2013–2017, without taking into account the regions in which the percentage of robotization was zero: for the Central Federal District the correlation coefficient is 0.14; for the Northwestern District it is 0.15; in the Southern and North Caucasus Federal Districts robotization is almost zero; in the Ural Federal District two regions (Sverdlovsk and Tyumen) have non-zero robotization (therefore, the correlation coefficient is equal to 1); the situation is similar in the Siberian Federal District, but there the dependence on the number of organizations using the Internet is inverse, i.e., the correlation coefficient is , in the Far Eastern Federal District the correlation coefficient is 0.015, in the Volga Federal District this correlation coefficient turned out to be negative (!) .
In our opinion, at stage I, the leading role is played by the control system, designated as “Robotization management” (Figure 3) and as “Manufacturing control” (Figure 4). Therefore, it is required to disclose the management models (in particular, robotization and production) presented by elements “Robotization management” (Figure 3) and “Manufacturing control” (Figure 4). There are three components of the control system: (1) An objective component of the control system: (1.1) Management decision-making schemes (“soft” part); (1.2) Management infrastructure (“hard” part). (2) The subjective component of management: the subject of management decisions: (2.1) The objective component of the control system; (2.2) Management decision-making schemes: direct, indirect control, schemes of interaction between planning and execution of plans.
We have identified three levels of work with information: the level of standard algorithms, the level of strategies typical for a given field of activity and the level of methodology.
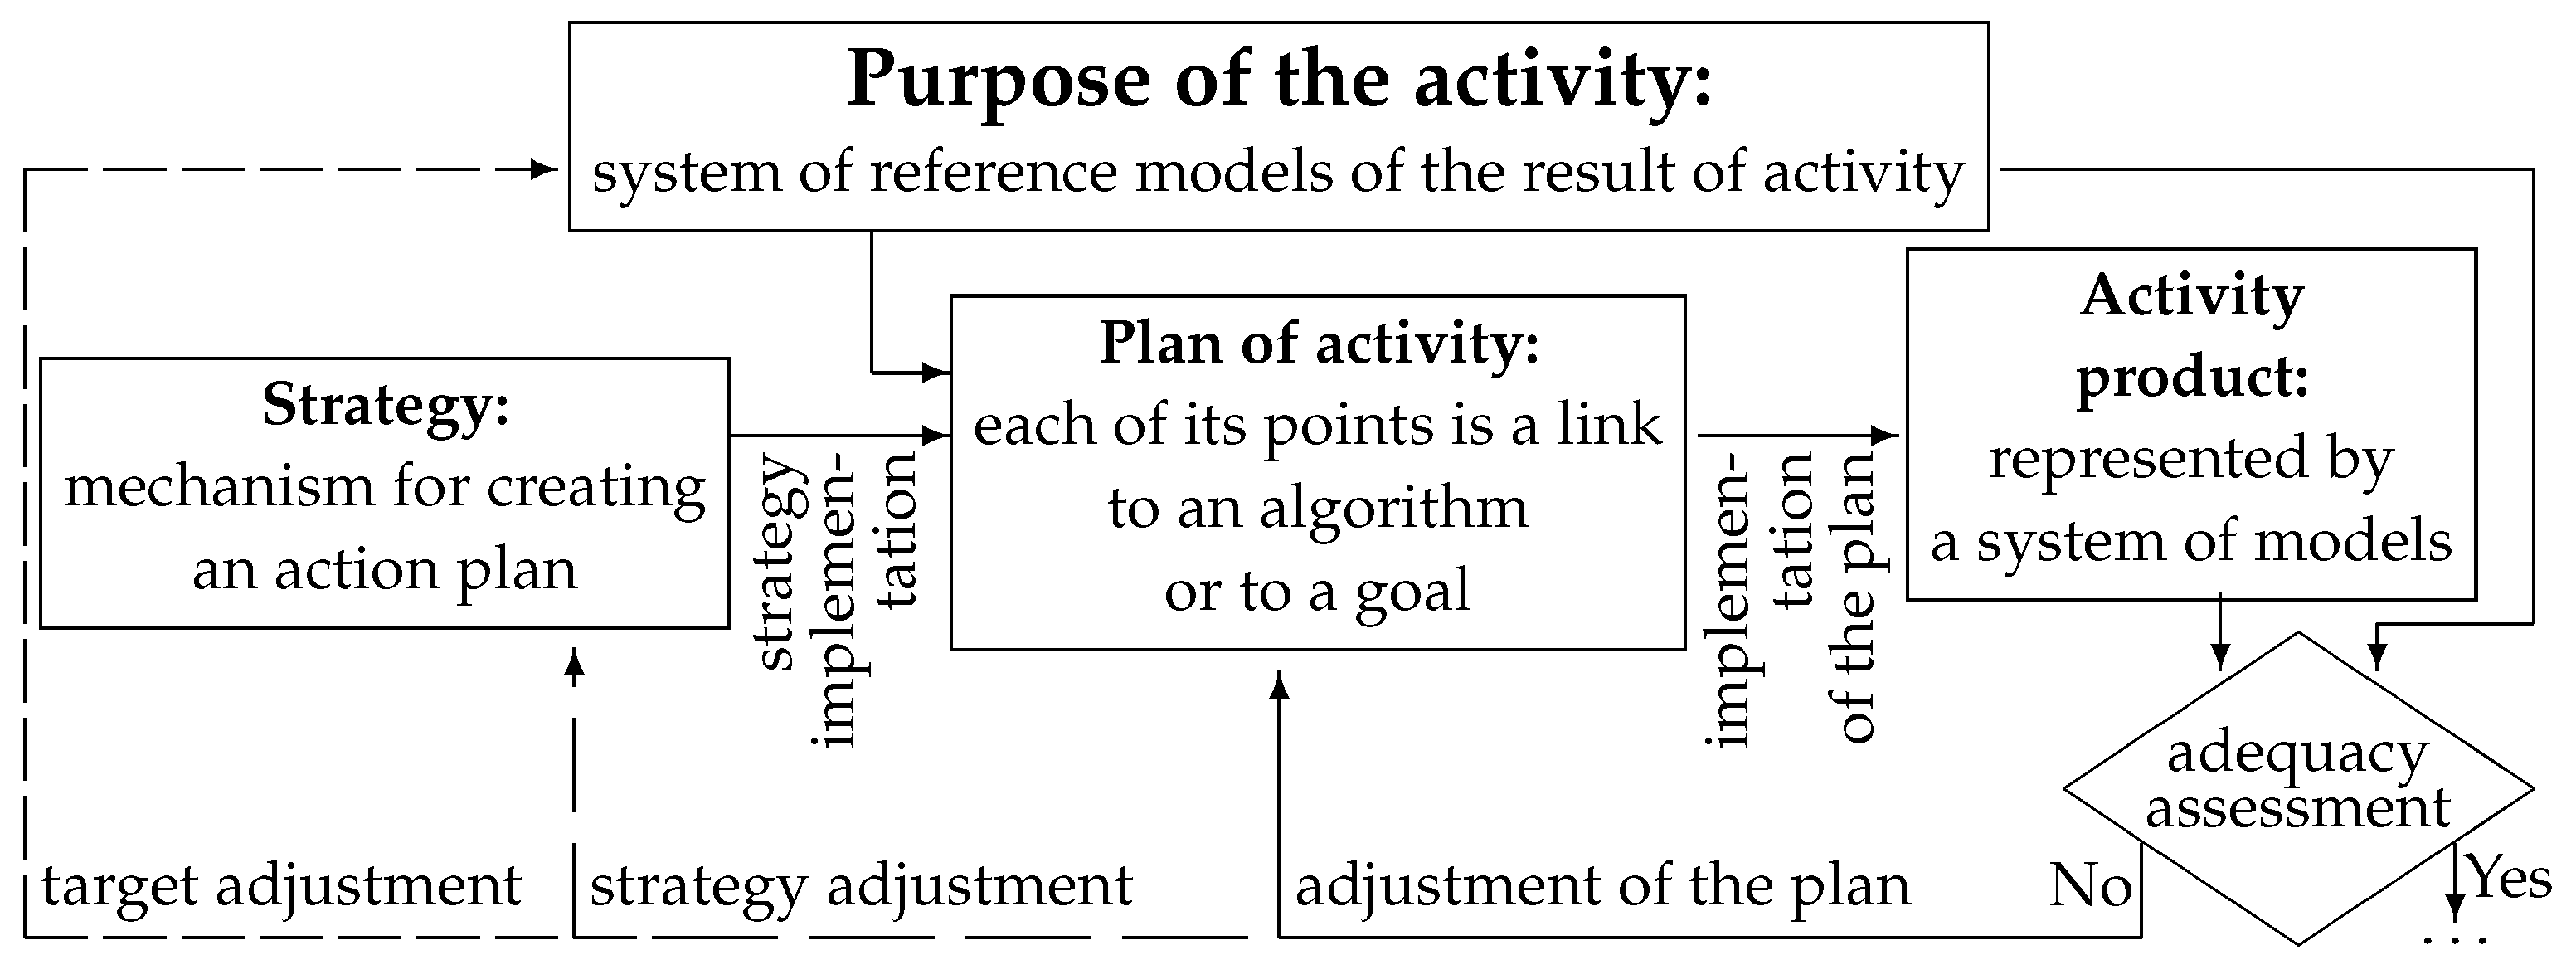
The strategy and implementation of the strategy are presented in Figure 5.
(1.2) The management infrastructure includes systems for transmitting control signals (formats, the procedure for agreeing and transferring documents, the system for storing and writing off/transferring to the archive, the sequence and timing of responses to them, etc.). Currently, electronic formats for the transmission of information, in particular, electronic document management, play an increasingly important role.
(2) The subjective component of management: the subject’s influence on managerial decision-making. Its role usually declines as the spread of technology increases. Difficulties with modelling the subject of control include: (1) Dynamically (often unpredictably) changing prototype; (2) A large number of factors influencing decision-making by the subject of management; (3) The role and place of the subject in the management system, interaction with other subjects. These components are interconnected. Improving the infrastructure allows management to an increasing extent to control schemes to switch to control through standard algorithms. For example, if a region has a developed infrastructure for installing and servicing robots in a certain area of production, providing qualified personnel for servicing and repairing robots, then robotization of production is carried out through relatively simple formalized procedures (algorithms). Otherwise, you have to come up with different ways to purchase robots, ways to provide consumables and spare parts, train personnel to maintain and repair them, reduce minimization of losses from downtime during maintenance and repair, etc., which requires the construction of activity plans, that is, the use of strategies.
3.1. Modeling the Implementation of a Strategy
As our research has shown, complex strategies can be represented as a combination of basic strategies. For example, we thus decomposed into basic strategies for routine research activities, routine design activities and routine modeling [35]. We defined these strategies axiomatically.
3.2. Modeling the Implementation of a Strategy with Colored Graphs
So, let us assume that, as a result of applying some strategy, the goal , considered as a plan of one point, was first transformed into a plan then, replace the point, let us say, , perceived as a secondary goal, of the plan for achieving it, into the plan etc. Finally, the plan is developed, all the points of which the performer will take as links to the available algorithm.
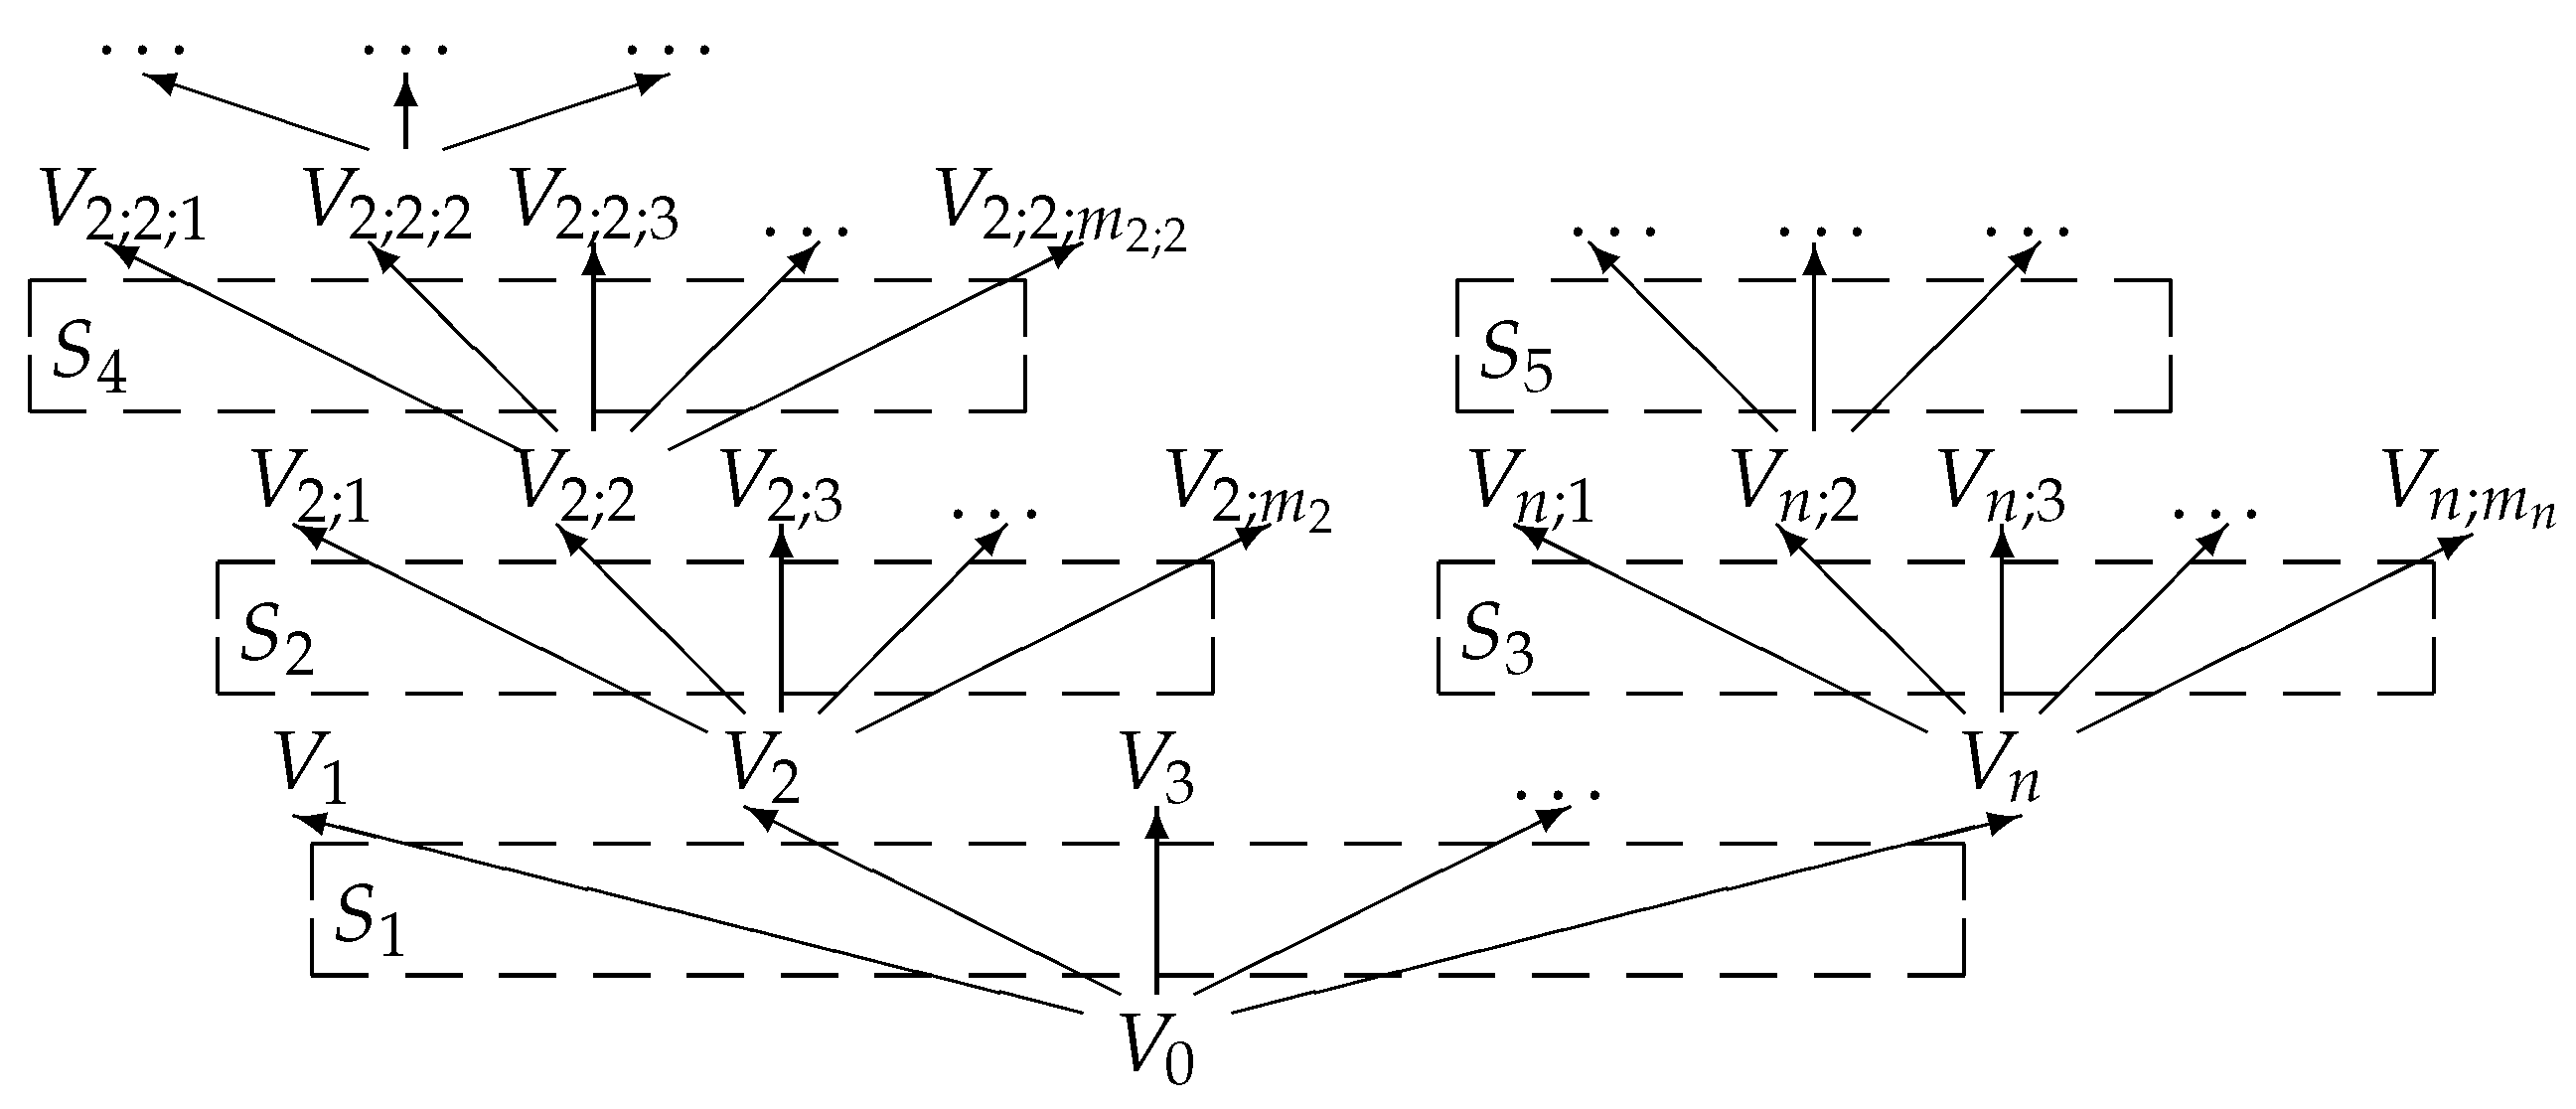
This implementation of the strategy is in correspondence with a graph, the set of vertices of which consists of all the points of the plans that were in the process of implementing these strategies. The arc enters this directed graph only if is one of the points of the plan to achieve the goal .
If the strategy is a composition of basic strategies then the graph can be considered colored, considering the color of the edge to be the basic strategy , which helps to develop a plan for achieving the goal , one of the points of which is (Figure 7).
Let the function of each arc of the -color coordinate the volume of resources , which are necessary to achieve the -goal in the conditions when the -goal is achieved. Individual types of resources can be measured (for example, timing, the required knowledge or skills), but the resource can also be considered as a vector quantity. At the same time, a priori assessments of the volumes of resources expended and actual and a posteriori assessments are of practical importance.
Let us say there is a route:
If considering as a volume of required resources on achieving of the -goal to the achievement of the secondary -goal using the strategy , then
can be considered the “total cost of resources” to achieve the -goal to the -goal using a combination of strategies and secondary goals represented by this route.
The existence of a strategy for making the -goal achieve the -goal, which is optimal from the point of view of “total resource costs”, follows from the following Theorem 1.
Theorem 1.
Let be a certain goal, is a set of basic strategies, and G is a set of colorful digraphs whose all edge colors are contained in and which are models of successful implementations of strategies to achieve the -goal. Let us assume that for any graph (here, —the set of vertex of graph Γ, —the set of arcs of graph Γ.) there is a function whose range is included in , defined on the total of , and
Let us take
Then there is a graph , on which the function α reaches its minimum value, i.e.,
Proof of Theorem 1.
Take an arbitrary graph . Let a graph from satisfy the inequality . So, due to (1) and (2)
So,
It remains to be noted that there are only a finite number of colorful graphs with arcs of a finite number of colors whose number of vertices is less than . Therefore, among them there is a graph with the minimum value.
3.3. Theoretical and Logical Model of Strategy Implementation
One of the tasks of mathematical logic is the development of procedures that would make it possible to find out at a syntactic level whether certain statements are true in any model with a certain interpretation of grammatical structures.
Let us start with some classical definitions.
Definition 1.
Calculus I is said to be given if the following four sets are given:
- alphabet ;
- set of words of the alphabet , called a set of expressions of the calculus I;
- set of expressions of calculus I, called a set of axioms of calculus I;
- set of partial operations on the set , called the inference rules of calculus I.
The ordered pair is called the calculus language I and will be denoted by .
Definition 2.
Let be a subset of the set of expressions defined by the inductive rule (that is, the smallest set for which the following statements are true)
- ;
- if , then for any n-inference rule f of the calculus I we have: .
Then, the set is called a set of theorems of calculus I or a set of provable expressions of calculus I, and its elements are called theorems of calculus I.
The theory of the language is an arbitrary set of theorems of this language.
In this model presented in Table 1, as well as in the graph-theoretic model, the feasibility of the plan is not taken into account, i.e., availability of resources for its implementation.
Within the framework of this model, the process of development of a plan can be considered a special case of making a proof by means of some calculus. This, in particular, makes it possible to use tools developed for automatic construction of proofs of theorems to construct the plan.
Theorem 2.
Let be a certain fixed goal, is a strategy modeling calculus, where is a set of inference rules, and all inference rules (basic strategies) have a finite number of arguments. Denote by T a set of Gentzen proof trees that model successful implementations of the strategy to achieve the goal . Let us assume that and is a function defined on the set of formulas from the tree T, with a range included in , and
Take for any
Then there is a tree for which takes the minimum value, i.e.,
Proof of Theorem 2.
For any , denote by the number of formulas (goals) in the tree T. Let . If and , then due to (3) and (4)
So,
On the other hand, there is only a finite number of trees from T for which . Hence, among trees with , there is a tree with the minimum value of the function :
Let’s note that due to (3) and (4)
and with the help of (6), there is
So, for any
and, according to (5) and the proved inequality ,
Thus, the value of the function on the is minimal.
3.4. Theoretic-Functional Model for Implementation of a Co-Strategy
Definition 3.
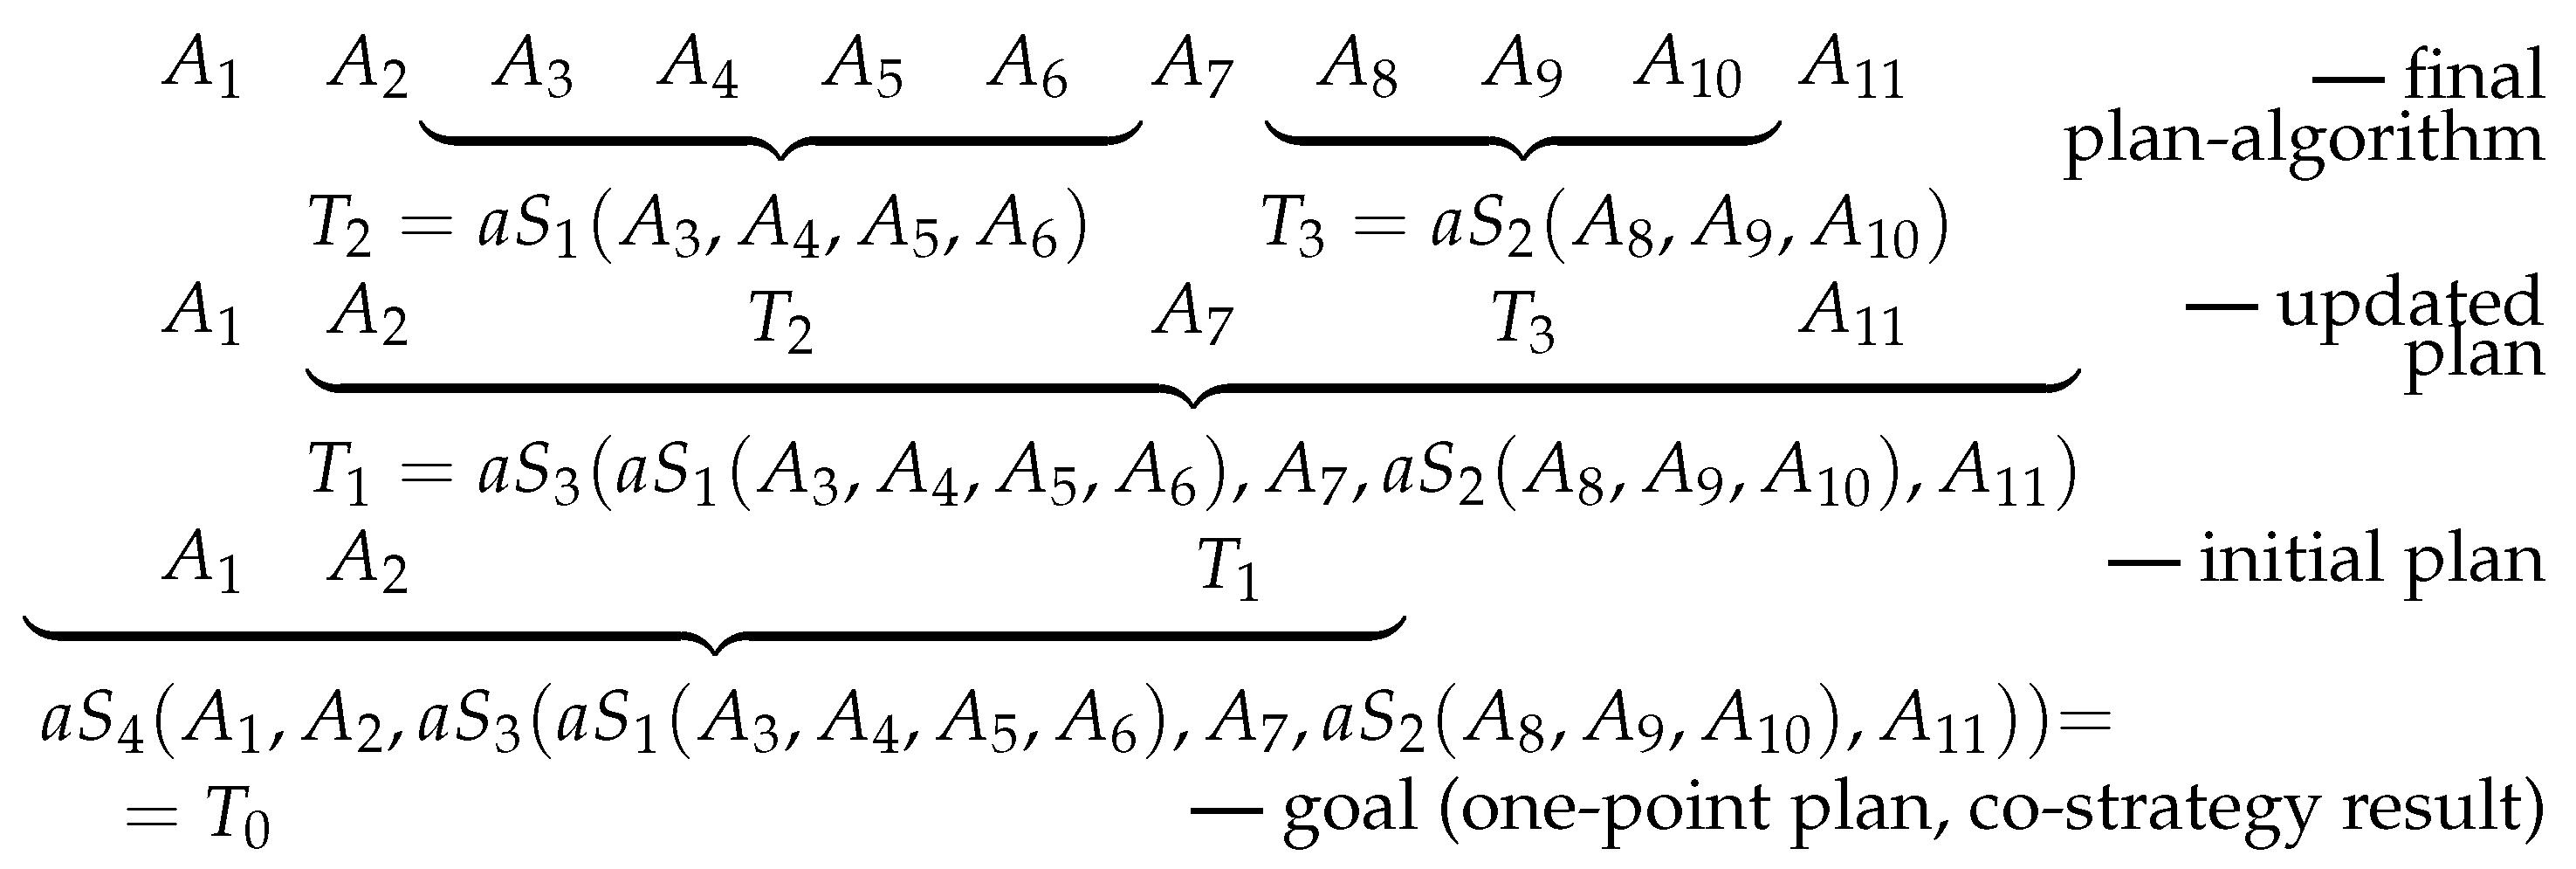
Let us call a map, , a co-strategy that associates the activity plan with the result of implementing this plan, considered a possible goal of the development of this plan.
Certainly, this mapping, generally speaking, can be ambiguous.
The situation when strategy S is represented as a combination of basic strategies can be modeled by the co-strategy shown in Figure 8.
This representation of the strategy is a reflection of an analytical method.
Let us assume that the plan is the result of the implementation of the strategy S, the co-strategy corresponds to the application of the strategy S, and the function assigns the number to the plan . The can be a volume of a certain type of resources required on the development of this plan, and an a priori, actual or a posteriori assessment of a volume of necessary resources to fulfill this plan, etc. We assume that for the function , the following axioms are hold.
- The axiom of curtailment:
- The axiom of additivity: if
Theorem 3.
Let be a set of co-strategies corresponding to successful implementations of strategies for achieving the goal , and all these strategies are combinations of the basic strategies , whose realizations correspond to the co-strategy , and all the functions satisfy, firstly, the axioms of curtailment and additivity, and, secondly, the condition:
Then there exists a co-strategy and a plan for achieving the goal that a value of the function is minimal, i.e.,
Proof of Theorem 3.
For the co-strategy from , denote by the number of applications of basic strategies in the process of implementing the strategy S. Let be a certain co-strategy from and
It follows from the axiom of additivity and (7) that:
So,
On the other hand, there is a finite number of co-strategies from , that:
Therefore, among such co-strategies, there exists the co-strategy with the minimum value , i.e.,
Considering that, obviously, , we obtain that is the required co-strategy.
4. System of Strategy Implementation Models as a Model-Polyad
The formal-constructive interpretation of the model allows us to look at the three models of strategy implementation presented above. Namely, according to the proposed formal-constructive interpretation (Figure 1), the model is a system of two components: (1) an image; (2) an interface that provides information exchange between a prototype and an image.
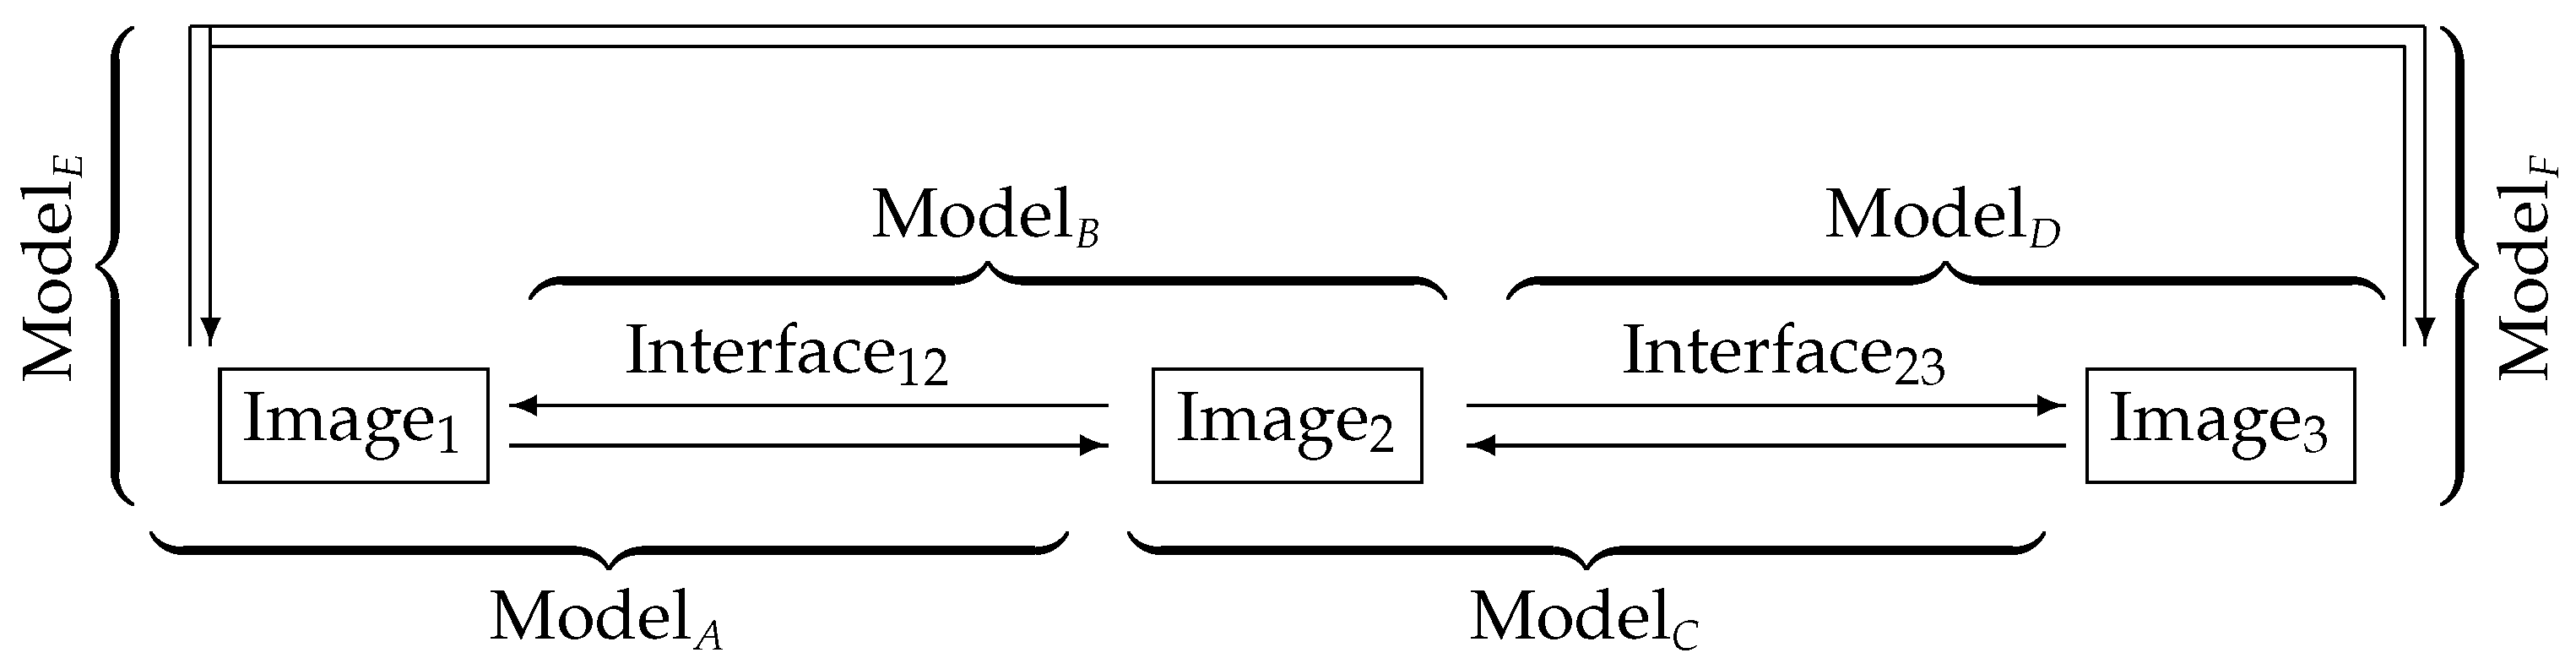
If we change the roles of a prototype and an image in the “prototype-interface-image” system, we will get a system of two models “Model” and “Model” with a common interface (Figure 9).
Another example of model-dyad, besides the one shown in Figure 9, is the representation of rational numbers; on the one hand, with ordinary fractions, i.e., ordered pairs where on the other hand, with periodic rational decimal fractions. In addition, a model-dyad can be considered the representation of a numerical function, on the one hand, with a formula and, on the other hand, with a graph.
The effectiveness of the application of model-dyad is due, first of all, to the possibility of combining the analytical apparatus of several theories for information analysis. We usually use the following analogy to demonstrate the capabilities of a model-dyad. It is clear that even a well-trained sports person will not be able to climb too high on a high vertical rough wall without protrusions (symbolizing a prototype). However, if at a convenient distance (to ensure the “functioning of the interface”) there is a parallel wall of the same type (symbolizing the image), then this person will be able to climb very high.
5. Discussion
The results allow us to identify several promising areas of research and the application of these results. To outline a set of basic strategies for different stages of robotization implementation. As a basis, we can take the previously obtained decompositions of the strategy of routine research activities [35] and similar results for routine project activities and routine modeling. They are based on an axiomatic approach to the formalization of these activities.
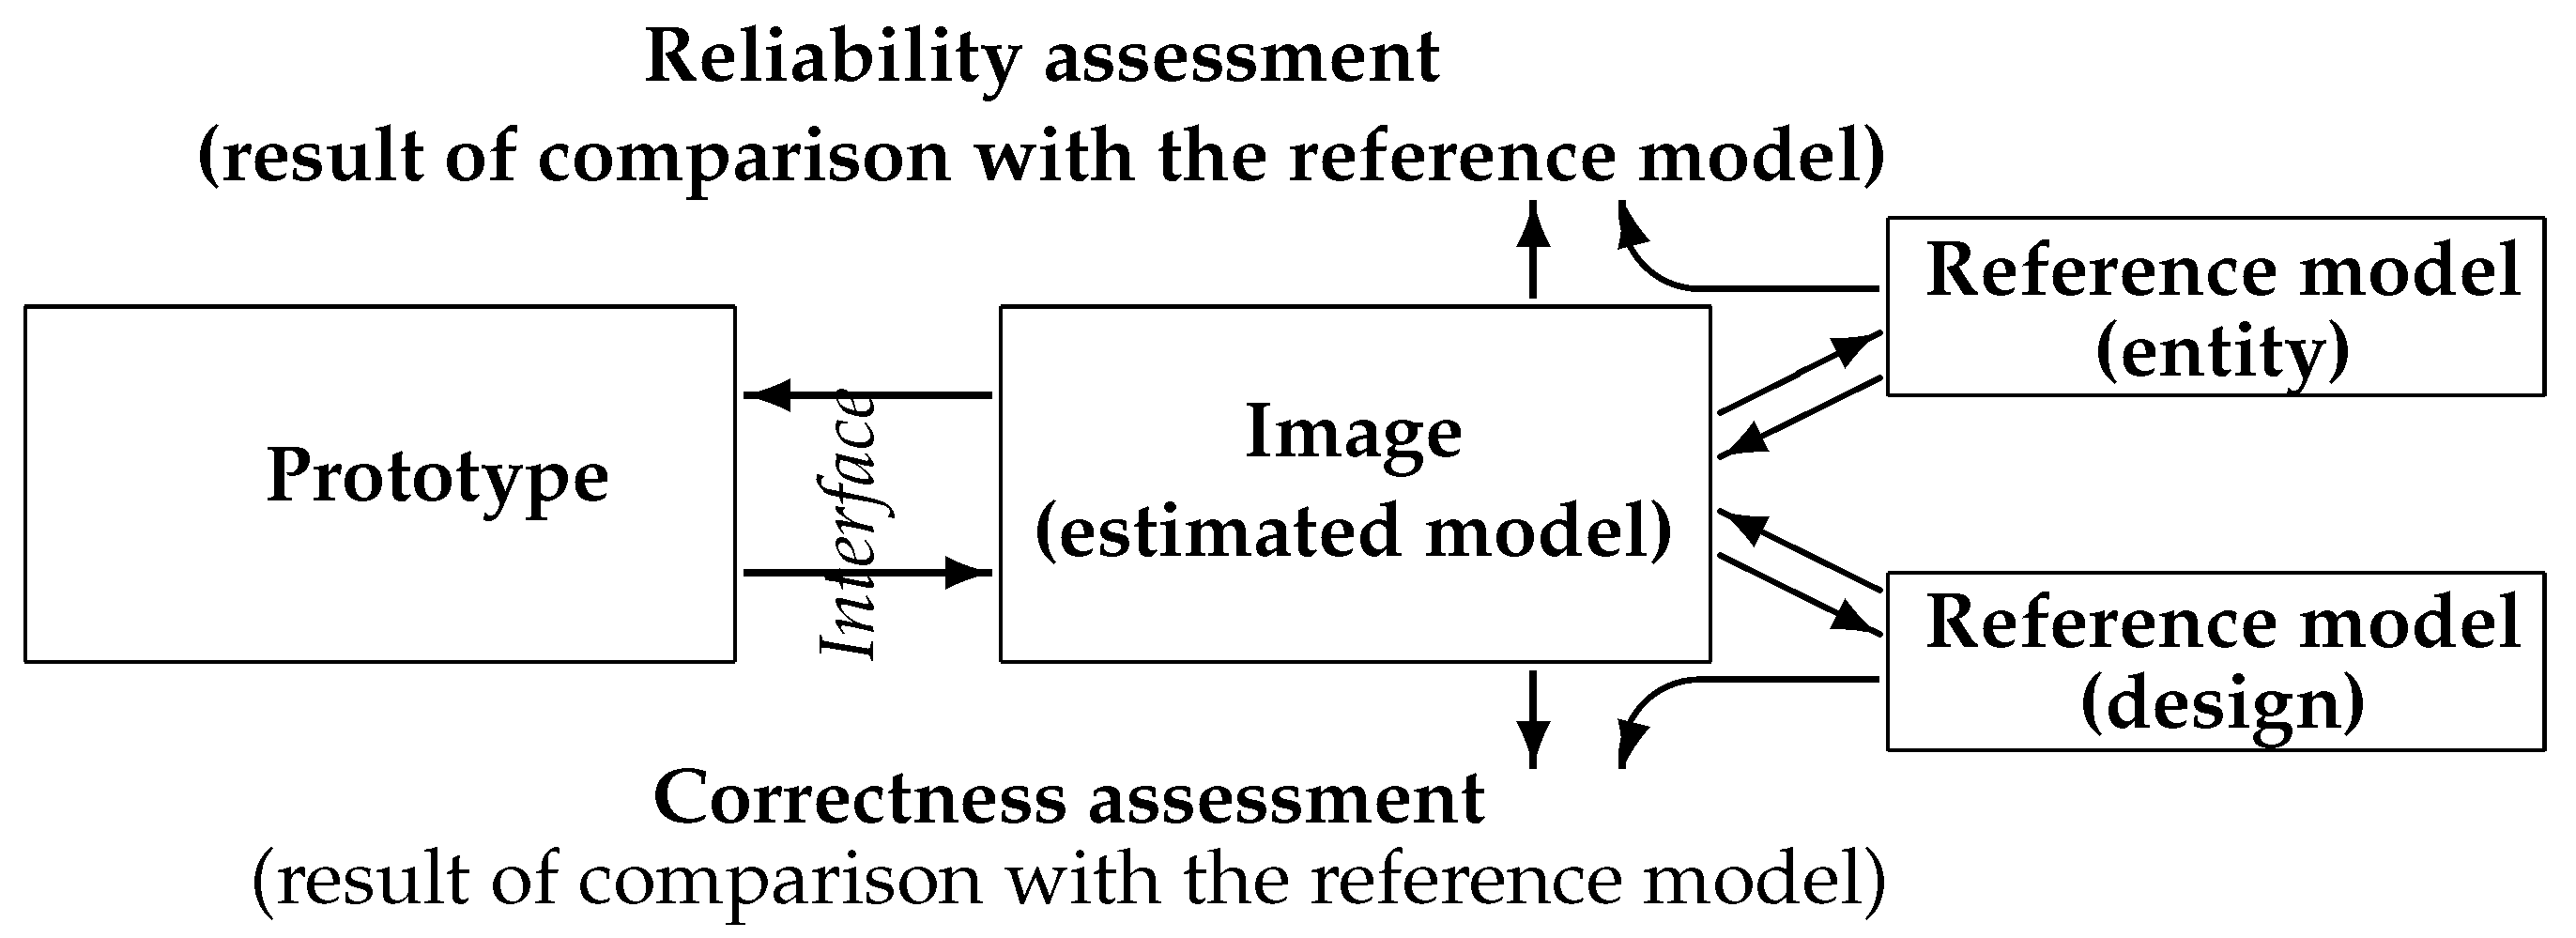
Our developed theory of adequacy allows for the development of the main difference between research and project activities (Figure 11). Here, the reference model is understood as a model taken as a standard sample. For example, when evaluating reliability, this may be part of the technical specifications, which indicate the range of permissible values of quantities (for example, permissible mass, dimensions, energy consumption, cost), and the presence of the necessary relationships between objects (for example, if the maximum permissible current is exceeded, protection should work, if wheel slip, the differential lock should work), i.e., substantive requirements. The corresponding reference model is marked in Figure 11 as (entire). Correctness is assessed by comparing with a reference model that fixes the requirements for the representation of the image, for example: requirements for the design of text, drawings, the form of transmission of reporting materials, requirements for the conditions for conducting experiments or observations, and requirements for describing these conditions. As an example, we can cite the system for evaluating the compositions of schoolchildren in Russia. Usually, two marks are given for an essay: for content and for grammar. The mark <<for content>> reflects the accuracy of the transfer of thought, the fidelity of the judgments expressed (for example, the correctness of the reflection of the plot of a literary work, which is the basis for the theme of the essay, the names and functions of the characters, etc.). This is an assessment of the reliability of the text of the essay. The mark <<for literacy>> assesses compliance with grammatical rules, the typical structure of an essay as a literary work. This is an assessment of the correctness of the text of the essay.
The specificity of research activity is in the fact that when assessing the adequacy of the activity results, the characteristics of correctness are of priority: the accuracy of compliance with the requirements for the conditions of the experiment, the correctness of the formulation of statements (in particular, definitions and theorems), and the correctness of proofs, etc. For project activities, on the contrary, the priorities are the characteristics of reliability—the achievement of the values provided for by the project assignment, the presence of the required relationships between elements and components, the necessary properties, etc. The second direction of research is to assess the consumption of different types of resources for the implementation of these strategies, in particular, based on the experience of applying these strategies. As the third direction, we state the formation of evidence-based recommendations for optimizing the resources used for management activities.
6. Conclusions
- (1)
- The paper proposes several models of robotization in agriculture;
- (2)
- We have established that, at this stage, the most important are the models of the management process, and here the priority is the subjective component.
- (3)
- We propose to consider the strategy as a mechanism for the development of an activity plan (Figure 5). Thus, we distinguish between a strategy and its implementation, and if the strategy is objective, then its implementation is subjective.
- (4)
- The paper presents three mathematical models developed by us for the implementation of the strategy, and they form a model-triad.
- (5)
- We formulated and proved three theorems on the existence of an optimal implementation of the strategy.
Consequently, the objectives of the study are solved and, therefore, the purpose of the study is achieved.
Author Contributions
Conceptualization, Y.B.M., E.S.; methodology, Y.B.M., E.S.; software, Y.B.M.; validation, Y.B.M., A.K.; formal analysis Y.B.M., E.S. and N.Z.; investigation, E.S., N.Z. and A.K.; resources, N.Z. and A.K.; data curation, E.S.; writing—original draft preparation, Y.B.M., E.S.; writing—review and editing, Y.B.M., E.S.; visualization, Y.B.M. and E.S.; supervision, E.S. and A.K.; project administration, E.S. and A.K.; funding acquisition, E.S., N.Z. and A.K. All authors have read and agreed to the published version of the manuscript.
Funding
The study was carried out with the financial support of the Russian Foundation for Basic Research within the framework of scientific project No. 20-010-00636 A “Spatial development of robotization of agriculture in Russia: trends, factors, mechanisms”.
Conflicts of Interest
The authors declare no conflict of interest.
References
- Meuwissen, M.P.M.; Feindt, P.H.; Midmore, M.; Wauters, E.; Finger, R.; Appel, A.; Spiegel, A.; Mathijs, E.; Termeer, K.J.A.M.; Balmann, A.; et al. The struggle of farming systems in Europe: Looking for explanations through the lens of resilience. Eurochoices 2020, 19, 4–11. [Google Scholar] [CrossRef]
- Meuwissen, M.P.M.; Feindt, P.H.; Slijper, T.; Spiegel, A.; Finger, R.; de Mey, Y.; Paas, W.; Termeer, K.J.A.M.; Poortvliet, P.M.; Peneva, M.; et al. Impact of Covid-19 on farming systems in Europe through the lens of resilience thinking. Agric. Syst. 2021, 191, 103152. [Google Scholar] [CrossRef]
- Hobbs, J. Food supply chains during the COVID-19 pandemic. Can. J. Agric. Econ. 2020, 68, 171–176. [Google Scholar] [CrossRef] [Green Version]
- Barichello, R. The COVID-19 pandemic: Anticipating its effects on Canada’s agricultural trade. Can. J. Agric. Econ. 2020, 68, 219–224. [Google Scholar] [CrossRef]
- International Organization for Robotics. Available online: https://ifr.org/downloads/press2018/2021_10_28_WR_PK_Presentation_long_version.pdf (accessed on 21 June 2022).
- Zambon, I.; Cecchini, M.; Egidi, G.; Saporito, M.G.; Colantoni, A. Revolution 4.0: Industry vs. Agriculture in a Future Development for SMEs. Processes 2019, 7, 36. [Google Scholar] [CrossRef] [Green Version]
- Adnan, N.; Nordin, S.M.; Rahman, I.; Noor, A. The effects of knowledge transfer on farmers decision making toward sustainable agriculture practices: In view of green fertilizer technology. World J. Sci. Technol. Sustain. Dev. 2018, 15, 98–115. [Google Scholar] [CrossRef]
- Salgues, B. Society 5.0: Industry of the Future, Technologies, Methods and Tools; John Wiley Sons: Hoboken, NJ, USA, 2018. [Google Scholar]
- Özdemir, V.; Hekim, N. Birth of industry 5.0: Making sense of big data with artificial intelligence, “the internet of things” and next-generation technology policy. Omics 2018, 22, 65–76. [Google Scholar] [CrossRef]
- de Koning Automatic Milking, K. Common practice on dairy farms. In International Symposium Automatic Milking, a Better Understanding; Wageningen Academic Publishers: Wageningen, The Netherlands, 2004; p. 526. [Google Scholar] [CrossRef]
- Hayashi, S.; Shigematsu, K.; Yamamoto, S.; Kobayashi, K.; Kohno, Y.; Kamata, J.; Kurita, M. Evaluation of a strawberry-harvesting robot in a field test. Biosyst. Eng. 2010, 105, 160–171. [Google Scholar] [CrossRef]
- Slaughter, D.C.; Giles, D.K.; Downey, D. Autonomous robotic weed control systems: A review. Comput. Electron. Agric. 2008, 61, 63–78. [Google Scholar] [CrossRef]
- Zanlorensi, L.A.; Araújo, V.M.; Guimarães, A.M. Automatic control and robotics for greenhouses: A review on heating technologies. Am. J. Appl. Comput. 2016, 4, 21–28. [Google Scholar]
- Zhao, Y.; Gong, L.; Huang, Y.; Liu, C. A review of key techniques of vision-based control for harvesting robot. Comput. Electron. Agric. 2016, 127, 311–323. [Google Scholar] [CrossRef]
- Bac, C.W.; Henten, E.J.; Hemming, J.; Edan, Y. Harvesting robots for High-value crops: State-of-the-art review and challenges ahead. J. Field Robot. 2014, 31, 888–911. [Google Scholar] [CrossRef]
- Bechar, A.; Vigneault, C. Agricultural robots for field operations. Part 2: Operations and systems. Biosyst. Eng. 2017, 153, 110–128. [Google Scholar] [CrossRef]
- Giles, D.K. Use of remotely piloted aircraft for pesticide applications: Issues and outlook. Outlooks Pest Manag. 2016, 27, 213–216. [Google Scholar] [CrossRef]
- Woldometer. Available online: https://www.worldometers.info/world-population/ (accessed on 21 June 2022).
- Arunrat, N.; Sereenonchai, S.; Chaowiwat, W.; Wang, C.; Hatano, R. Carbon, Nitrogen and Water Footprints of Organic Rice and Conventional Rice Production over 4 Years of Cultivation: A Case Study in the Lower North of Thailand. Agronomy 2022, 12, 380. [Google Scholar] [CrossRef]
- Scialabba, N.; Müller-Lindenlauf, M. Organic agriculture and climate change. Renew. Agric. Food Syst. 2010, 25, 158–169. [Google Scholar] [CrossRef] [Green Version]
- Parry, M.L.; Rosenzweig, C.; Iglesias, A.; Livermore, M.; Fischer, G. Effects of climate change on global food production under SRES emissions and socio-economic scenarios. Glob. Environ. Chang.-Hum. Policy Dimens. 2004, 14, 53–67. [Google Scholar] [CrossRef]
- Brynjolfsson, E.; McAfee, A. The Second Machine Age: Work, Progress, and Prosperity in a Time of Brilliant Technologies; Norton: New York, NY, USA, 2014. [Google Scholar]
- Manyika, J.; Chui, M.; Miremadi, M.; Bughin, J.; George, K.; Willmott, P.; Dewhurst, M. A Future That Works: Automation, Employment, and Productivity; McKinsey Global Institute: New York City, NY, USA, 2017. [Google Scholar]
- Vivarelli, M. Innovation, employment and skills in advanced and developing countries: A survey of economic literature. J. Econ. Issues 2014, 48, 123–154. [Google Scholar] [CrossRef]
- Berger, T.; Frey, C. Industrial renewal in the 21st century: Evidence from US cities. Reg. Stud. 2017, 51, 404–413. [Google Scholar] [CrossRef]
- Tse, C.; Barkema, H.W.; DeVries, T.J.; Rushen, E.A. Pajor Impact of Automatic Milking Systems on Dairy Cattle Producers’ Reports of Milking Labour Management, Milk Production and Milk Quality; Cambridge University Press: Cambridge, UK, 2018. [Google Scholar] [CrossRef]
- Örs, A.; Oğuz, C. Comparison of the Economic Performance of Robotic Milking System and Conventional Milking System. Manas J. Agric. Vet. Life Sci. 2018, 8, 35–51. [Google Scholar]
- Leonard, C. Spatial Development and Innovation in Russia. Foresight Sti Gov. 2016, 10, 30–33. [Google Scholar] [CrossRef] [Green Version]
- Davidson, N.; Mariev, O.; Pushkarev, A. The Impact of Externalities on the Innovation Activity of Russian Firms. Foresight STI Gov. 2018, 12, 62–72. [Google Scholar] [CrossRef]
- Asheim, B.T.; Cooke, P.; Martin, R. The Rise of the Cluster Concept in Regional Analysis and Policy. Clusters and Regional Development: Critical Reflections and Explorations; Asheim, B.T., Cooke, P., Martin, R., Eds.; Routledge: London, UK, 2006; pp. 1–29. [Google Scholar]
- Meskens, L.; Mathijs, E. Socio-economic aspects of automatic milking, Motivation and characteristics of farmers in vesting in automatic milking systems. In Deliverable D2 Project EU: Implications of the Introduction of Automatic Milking Systems (QLK5-2000-31006); SAGE: San Jose, CA, USA, 2002; 16p. [Google Scholar]
- Jacoby, H.G. Access to markets and the benefits of rural roads. Econ. J. 2000, 110, 713–737. [Google Scholar] [CrossRef] [Green Version]
- Asher, S.; Novosad, P. Rural Roads and Local Economic Development. Am. Econ. Rev. 2018, 110, 797–823. [Google Scholar] [CrossRef] [Green Version]
- Melnikov, Y.B. Modeling theory based on the formal-constructive interpretation of the model. In Lecture Notes in Networks and Systems; 2021; Volume 231 LNNS, pp. 615–627. Available online: https://0-www-scopus-com.brum.beds.ac.uk/inward/record.uri?eid=2-s2.0-85120673335&doi=10.1007%2f978-3-030-90321-3_51&partnerID=40&md5=964ba61707aaa0c04df1a839866030fa (accessed on 21 June 2022).
- Melnikov, Y.B. The algebraic presentation of research strategy in the activity of tax authorities. In Globalization and Its Socio-Economic Consequences, Proceedings of the 16th International Scientific Conference, Proceedings, Part III, Rajecke Teplice, Slovak Republic, 5–6 October 2016; Melnikov, Y.B., Onokhina, E.A., Shitikov, S.A., Eds.; ZU—University of Zilina: Zilina, Slovak Republic, 2016; pp. 1355–1362. [Google Scholar]
Figure 1.
Illustration for the formal-constructive interpretation of the concept of “model”.

Figure 2.
Units of robotics in agriculture by federal districts: (I) Central Federal District; (II) Volga Federal District; (III) Ural federal district; (IV) Northwestern Federal District; (V) Far Eastern Federal District; (VI) Siberian Federal District; (VII) Southern Federal District; (VIII) North Caucasian Federal District.

Figure 3.
Economic and managerial model of the robotization process.

Figure 4.
Production model of robotics.

Figure 5.
Action plan and strategy. An arrow with “branches” describing the reaction to an inadequate result of the implementation of the plan means that you should first try to change the plan using the old strategy, if this does not help, you should change the strategy, and if this does not bring the desired result, you will have to adjust the goal of the activity.

Figure 6.
Fragment of the graph of the life cycle of robotization of agriculture: x—time; y—the level of robotization (for example, the volume of production of agricultural robots, the number of imported robots, the number of robots working in agriculture by the time x, etc.); (I) implementation stage; (II) stage of growth; (III) stage of saturation.

Figure 7.
Graph-theoretic model of strategy implementation.

Figure 8.
Representation of the implementation of strategies using a functional-theoretic model for the introduction of a co-strategy.
Figure 8.
Representation of the implementation of strategies using a functional-theoretic model for the introduction of a co-strategy.

Figure 9.
Illustration for the concept of “model-dyad”.

Figure 10.
Illustration of the concept of “model-triad”.

Figure 11.
Illustration for the concept of “model of adequacy”.


Table 1.
Calculus I modeling the application of strategy S.
| Alphabet | Words | Axioms | Output Rules |
|---|---|---|---|
| Links to generic targets and generic algorithms | Typical activity plans, i.e., “words” whose “letters” are links to typical targets and algorithms | Typical algorithms: where are references to basic algorithms | Replacing goal T with a plan to achieve it: |
Publisher’s Note: MDPI stays neutral with regard to jurisdictional claims in published maps and institutional affiliations. |
© 2022 by the authors. Licensee MDPI, Basel, Switzerland. This article is an open access article distributed under the terms and conditions of the Creative Commons Attribution (CC BY) license (https://creativecommons.org/licenses/by/4.0/).
Share and Cite
MDPI and ACS Style
Melnikov, Y.B.; Skvortsov, E.; Ziablitckaia, N.; Kurdyumov, A. Modeling of Territorial and Managerial Aspects of Robotization of Agriculture in Russia. Mathematics 2022, 10, 2540. https://0-doi-org.brum.beds.ac.uk/10.3390/math10142540
AMA Style
Melnikov YB, Skvortsov E, Ziablitckaia N, Kurdyumov A. Modeling of Territorial and Managerial Aspects of Robotization of Agriculture in Russia. Mathematics. 2022; 10(14):2540. https://0-doi-org.brum.beds.ac.uk/10.3390/math10142540
Chicago/Turabian StyleMelnikov, Yury B., Egor Skvortsov, Natalia Ziablitckaia, and Alexander Kurdyumov. 2022. "Modeling of Territorial and Managerial Aspects of Robotization of Agriculture in Russia" Mathematics 10, no. 14: 2540. https://0-doi-org.brum.beds.ac.uk/10.3390/math10142540
Note that from the first issue of 2016, this journal uses article numbers instead of page numbers. See further details here.