Article

Techno-Economic Evaluation of Optimal Integration of PV Based DG with DSTATCOM Functionality with Solar Irradiance and Loading Variations

1
Electrical Engineering Department, Faculty of Engineering, Aswan University, Aswan 81542, Egypt
2
Department of Electrical Engineering, Faculty of Engineering, Sohag University, Sohag 82524, Egypt
3
Facultad de Ingeniería, Arquitectura y Diseño, Universidad San Sebastián, Bellavista 7, Santiago 8320000, Chile
4
Electrical Engineering Department, College of Engineering, Jouf University, Sakaka 72388, Saudi Arabia
5
AWCRC, Electrical Engineering Department, Faculty of Engineering, Aswan University, Aswan 81542, Egypt
6
Electricity Department, Faculty of Technology and Education, Sohag University, Sohag 82524, Egypt
*
Author to whom correspondence should be addressed.
Submission received: 19 June 2022 / Revised: 15 July 2022 / Accepted: 18 July 2022 / Published: 21 July 2022

Abstract

:
Nowadays, the trend of countries and their electrical sectors moves towards the inclusion of renewable distributed generators (RDGs) to diminish the use of the fossil fuel based DGs. The solar photovoltaic-based DG (PV-DG) is widely used as a clean and sustainable energy resource. Determining the best placements and ratings of the PV-DG is a significant task for the electrical systems to assess the PV-DG potentials. With the capability of the PV-DG inverters to inject the required reactive power in to the system during the night period or during cloudy weather adds the static compensation (STATCOM) functionality to the PV unit, which is being known as distributed static compensator (DSTATCOM). In the literature, there is a research gap relating the optimal allocation of the PV-DGs along with the seasonal variation of the solar irradiance. Therefore, the aim of this paper is to determine the optimal allocation and sizing of the PV-DGs along with the optimal injected reactive power by their inverters. An efficient optimization technique called Gorilla troop’s optimizer (GTO) is used to solve the optimal allocation problem of the PV-DGs with DSTATCOM functionality on a 94 bus distribution network. Three objective functions are used as a multi-objective function, including the total annual cost, the system voltage deviations, and the system stability. The simulation results show that integration of PV-DGs with the DSTATCOM functionality show the superiorities of reducing the total system cost and considerably enhancing system performance in voltages deviations and system stability compared to inclusion of the PV-DGs without the DSTATCOM functionality. The optimal integration of the PV-DGs with DSTATCOM functionality can reduce the total cost and the voltage deviations by 15.05% and 77.05%, respectively. While the total voltage stability is enhanced by 25.43% compared to the base case.

1. Introduction

Recently, optimization methods have been presented for solving several problems in electrical energy systems [1,2]. Optimal integration of the solar photovoltaic-based DG (PV-DG) can play vital roles for enhancing power quality in power systems and reducing their total costs. Allocation of the PV-DG is a strenuous task for researchers especially with system variations or uncertainties. Therefore, several efforts are presented for optimal inclusion of the PV-DG in radial distribution networks (RDNs). Authors in [3] applied a modified ant lion optimization (ALO) for the inclusion of PV-DG in addition to the DSTATCOM functionality with the demand and solar irradiance uncertainties, where the modified ALO version is developed based on spiral and Levy motion. In [4], the equilibrium optimizer (EO) was utilized for determining the optimal ratings of the PV, and the wind turbine (WT) based DGs in microgrids (MGs) for minimizing the overall cost and enhancing power system performance. The lightning-attachment procedure optimizer (LAPO) and equilibrium optimizer (EO) are employed for incorporating the PV-DG and DSTATCOM in RDNs with loading and irradiance variations. However, the DSTATCOM functionality of the PV units is not included in this method.
Another method based on the non-dominated-sorting genetic algorithm III (NSGA-III) has been presented in [5] for the optimal structure selection of PV systems. In [6], the modified sine cosine optimization algorithm (MSCA) has been applied for optimal integrations of multiple DG systems with distribution systems. The power losses, voltage stability, and total system costs have been considered in the optimization process. However, these methods do not consider the multiple functionalities of PV generation systems. Additionally, the fractional Lévy-flight bat optimization algorithm (FLFBA) has been utilized in [7] for determining optimal locations and sizing of DG units and the flexible AC transmission systems (FACTS) in distribution systems with considering the voltage stability index and minimized active as well as reactive power loss. However, no techno-economic considerations are included in the optimization process.
Moreover, the chaotic adaptive inertia weight particle swarm optimization (PSO) is utilized to assign the optimal rating of PV units, DSTATCOM and energy storage system with considering existing uncertainties in loading and in PV generated power [8]. Artificial gorilla troops optimizer (AGTO) is applied to solve the allocation problems of the PV and WT based DGs under uncertainties of loading and output powers from renewable resources to minimize the overall system cost [9]. An efficient framework is presented based on EO for the allocation problem of the renewable based DGs at time varying of the output power and the loading for cost reduction [10]. Furthermore, the second-order conic programming is applied to determine optimal sizes of PV, WT and electric vehicle charging stations (EVCSs) for reducing the power losses and the voltage deviations (VDs) with uncertainties of the EVCSs [10]. The allocation of the DG has been solved in [11] under uncertainties of price, demand and the wind speed for maximizing the profits of the owners of the DG along with costs in the distribution company.
Further, authors in [12] solved the distribution networks expansions planning in the presence of DGs considering the uncertainties of the DGs load growth and the electricity market. A set of optimizer algorithms have been utilized for solving the allocation problem of DGs at uncertainty of the load demand using Monte Carlo simulation for different objective functions [13]. A mixed integer conic programming is employed to determine the optimal placements and ratings of PV, WT, gas turbine, and the energy storage system with uncertainties of loading and the renewable energy resources (RERs) [14]. A two-stage method is presented to solve the allocation problem of the PV units, and the DSTATCOM under the variations of load demands and solar irradiance [15].
S.S. Parihar and N. Malik presented an efficient method for optimal integration of the PV-DG using the PSO at linear and non-linear loads for power loss and harmonic reduction [16]. In [17], the artificial hummingbird algorithm (AHA) was employed for integration of the PV and wind turbine based DG at uncertainty of system for reduction in the total cost, emissions and the voltage deviations. A. Ghaffari et al. applied the crow search algorithm with differential for optimal allocation of the PV and wind turbine based DGs and energy storage system considering the for reducing the flicker and the voltage deviations [18]. The PV-DGs allocations have been determined optimally using a mixed-integer linear programming (MILP) for the hosting capacity at different the operation states [19]. An efficient analytic method has been presented for the coalition formation in a micro-grid, which includes PV system and wind turbine with energy storage system for cost reduction under demand response [20].
On the other side, the PV system consists of PV solar modules, a voltage sourced converter (VSC) and DC link [21]. DSTATCOM is considered as an element among the flexible AC transmission systems (FACTS) devices, which consists of voltage-source converter (VSC) and a DC link. Frequently, they are connected in parallel with the system to provide the reactive power compensation and control the voltage at the point of common coupling (PCC) [22]. The PV system can be employed for injecting reactive power, which is known as the DSTATCOM functionality of the PV system [23]. Very few research discuss the DSTATCOM functionality of the PV units, where in [21] the control modes of the PV system have been discussed at nighttime and at daytime. In the nighttime control mode, the PV system can work as DSTATCOM to inject reactive power to system. Whereas, in the nighttime control mode, there are two modes, including control mode based on active power priority, and the control mode based on reactive power priority. Authors, in [24], presented a control strategy of the PV system at STATCOM functionality based on an adaptive-reweighted zero attracting (RZA) control algorithm for power quality improvement.
The gorilla troops optimization (GTO) is a novel optimizer technique that models the social behaviors of gorillas and their movements in the wild [25]. The GTO has been wildly applied for solving several optimization problems, where the GTO is used for assigning the parameters of the PV modules [26,27]. In [28], M. Abdel-Basset and, R. Mohamed applied the GTO and a modified version of the GTO for assigning the model’s parameter of the proton exchange membrane (PEM) fuel cell model. A fine-tuning using GTO optimizer has been utilized for optimizing the load frequency controller in two-area microgrids using fractional order proportional-integral-derivative (FOPID) controller [29]. The allocation problem of the renewable distributed generators using the GTO in distribution network with time varying load power and generated power from renewable sources is introduced in [9].
From the previous survey, very few research have been introduced to assign the optimal PV locations with optimizing the injected reactive powers through their inverters (DSTATCOM functionality) with time varying loads and the PV output power. The contributions of the paper include:
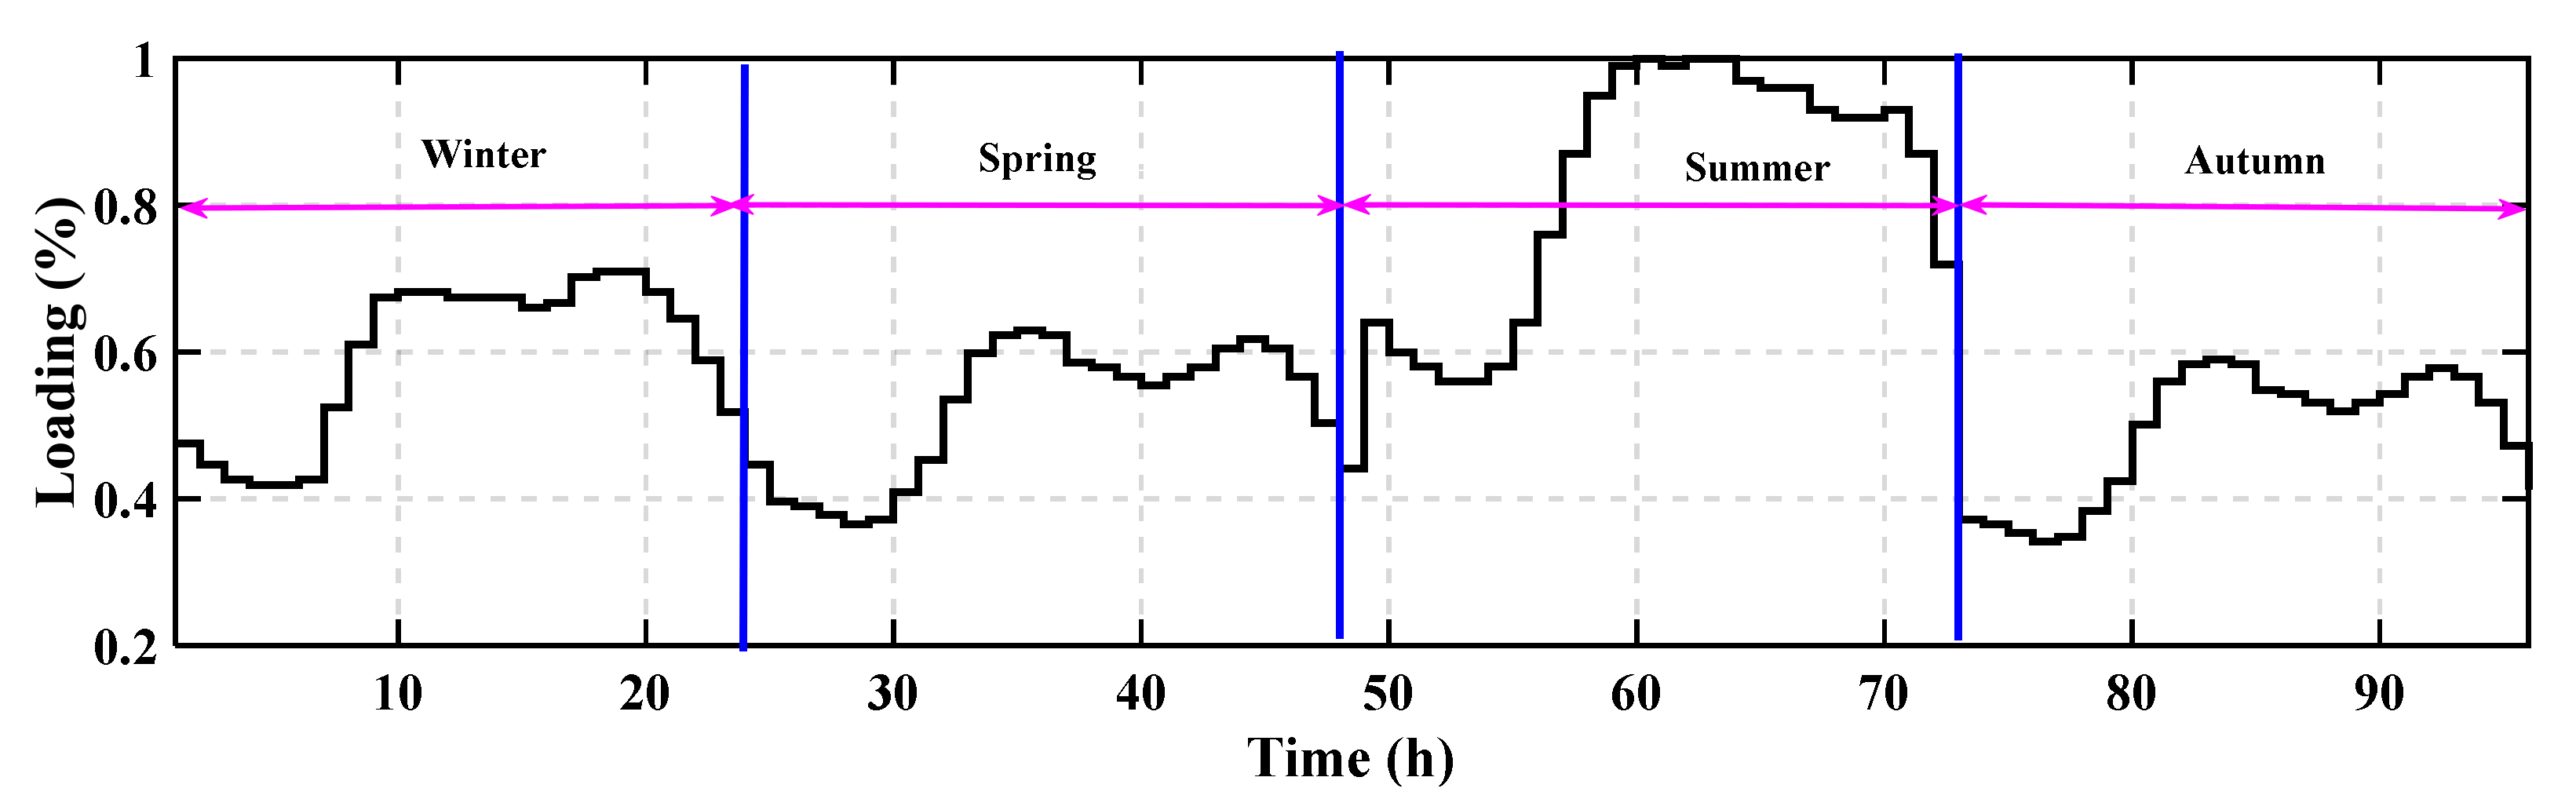
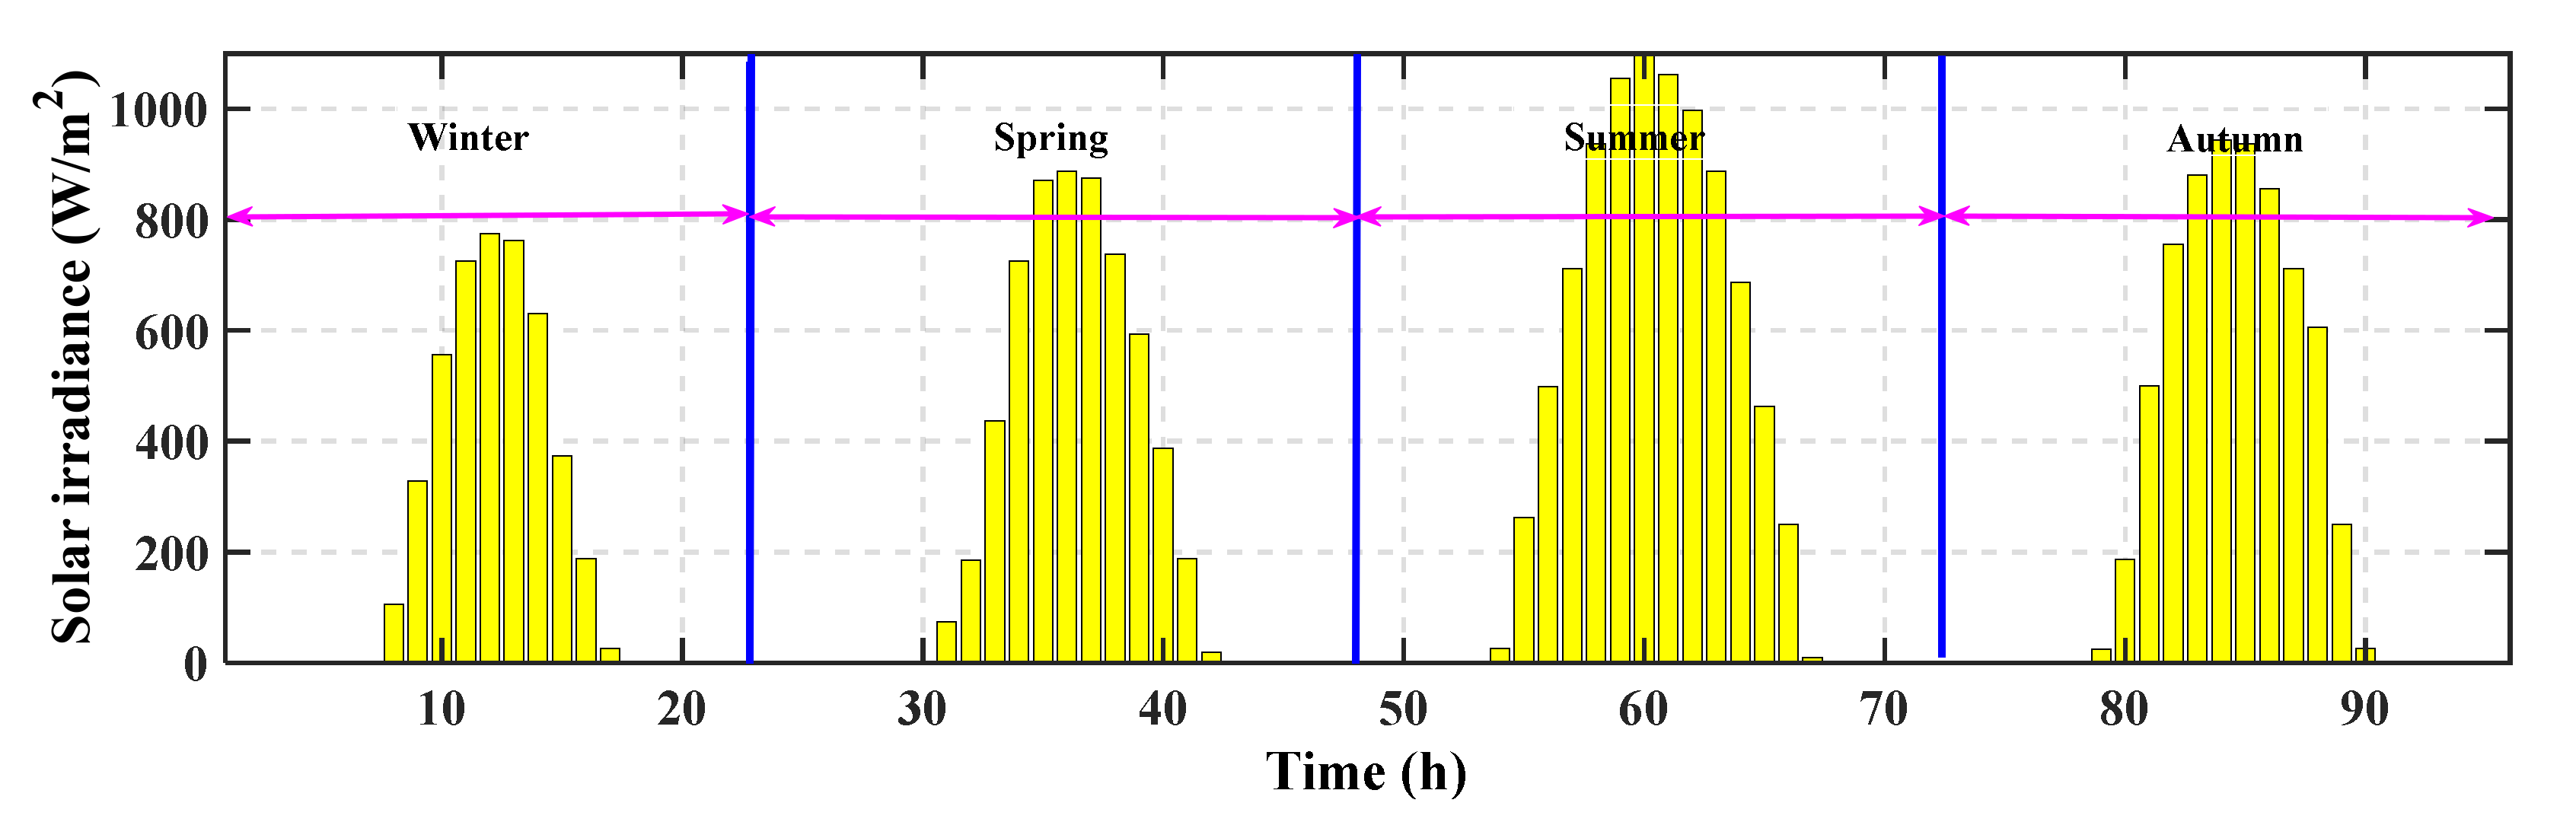
  • Solving PV systems allocation problem with considering the DSTATCOM functionality and the seasonal variation in the demanded loads, and solar irradiance.
  • A new application of the efficient GTO optimizer technique to assign the optimal sites and ratings of the PV units in RDN along with the injected reactive power by these units.
  • Assessment of the optimal integration of the PV units with the DSTATCOM functionality from an economic and technical perspective.
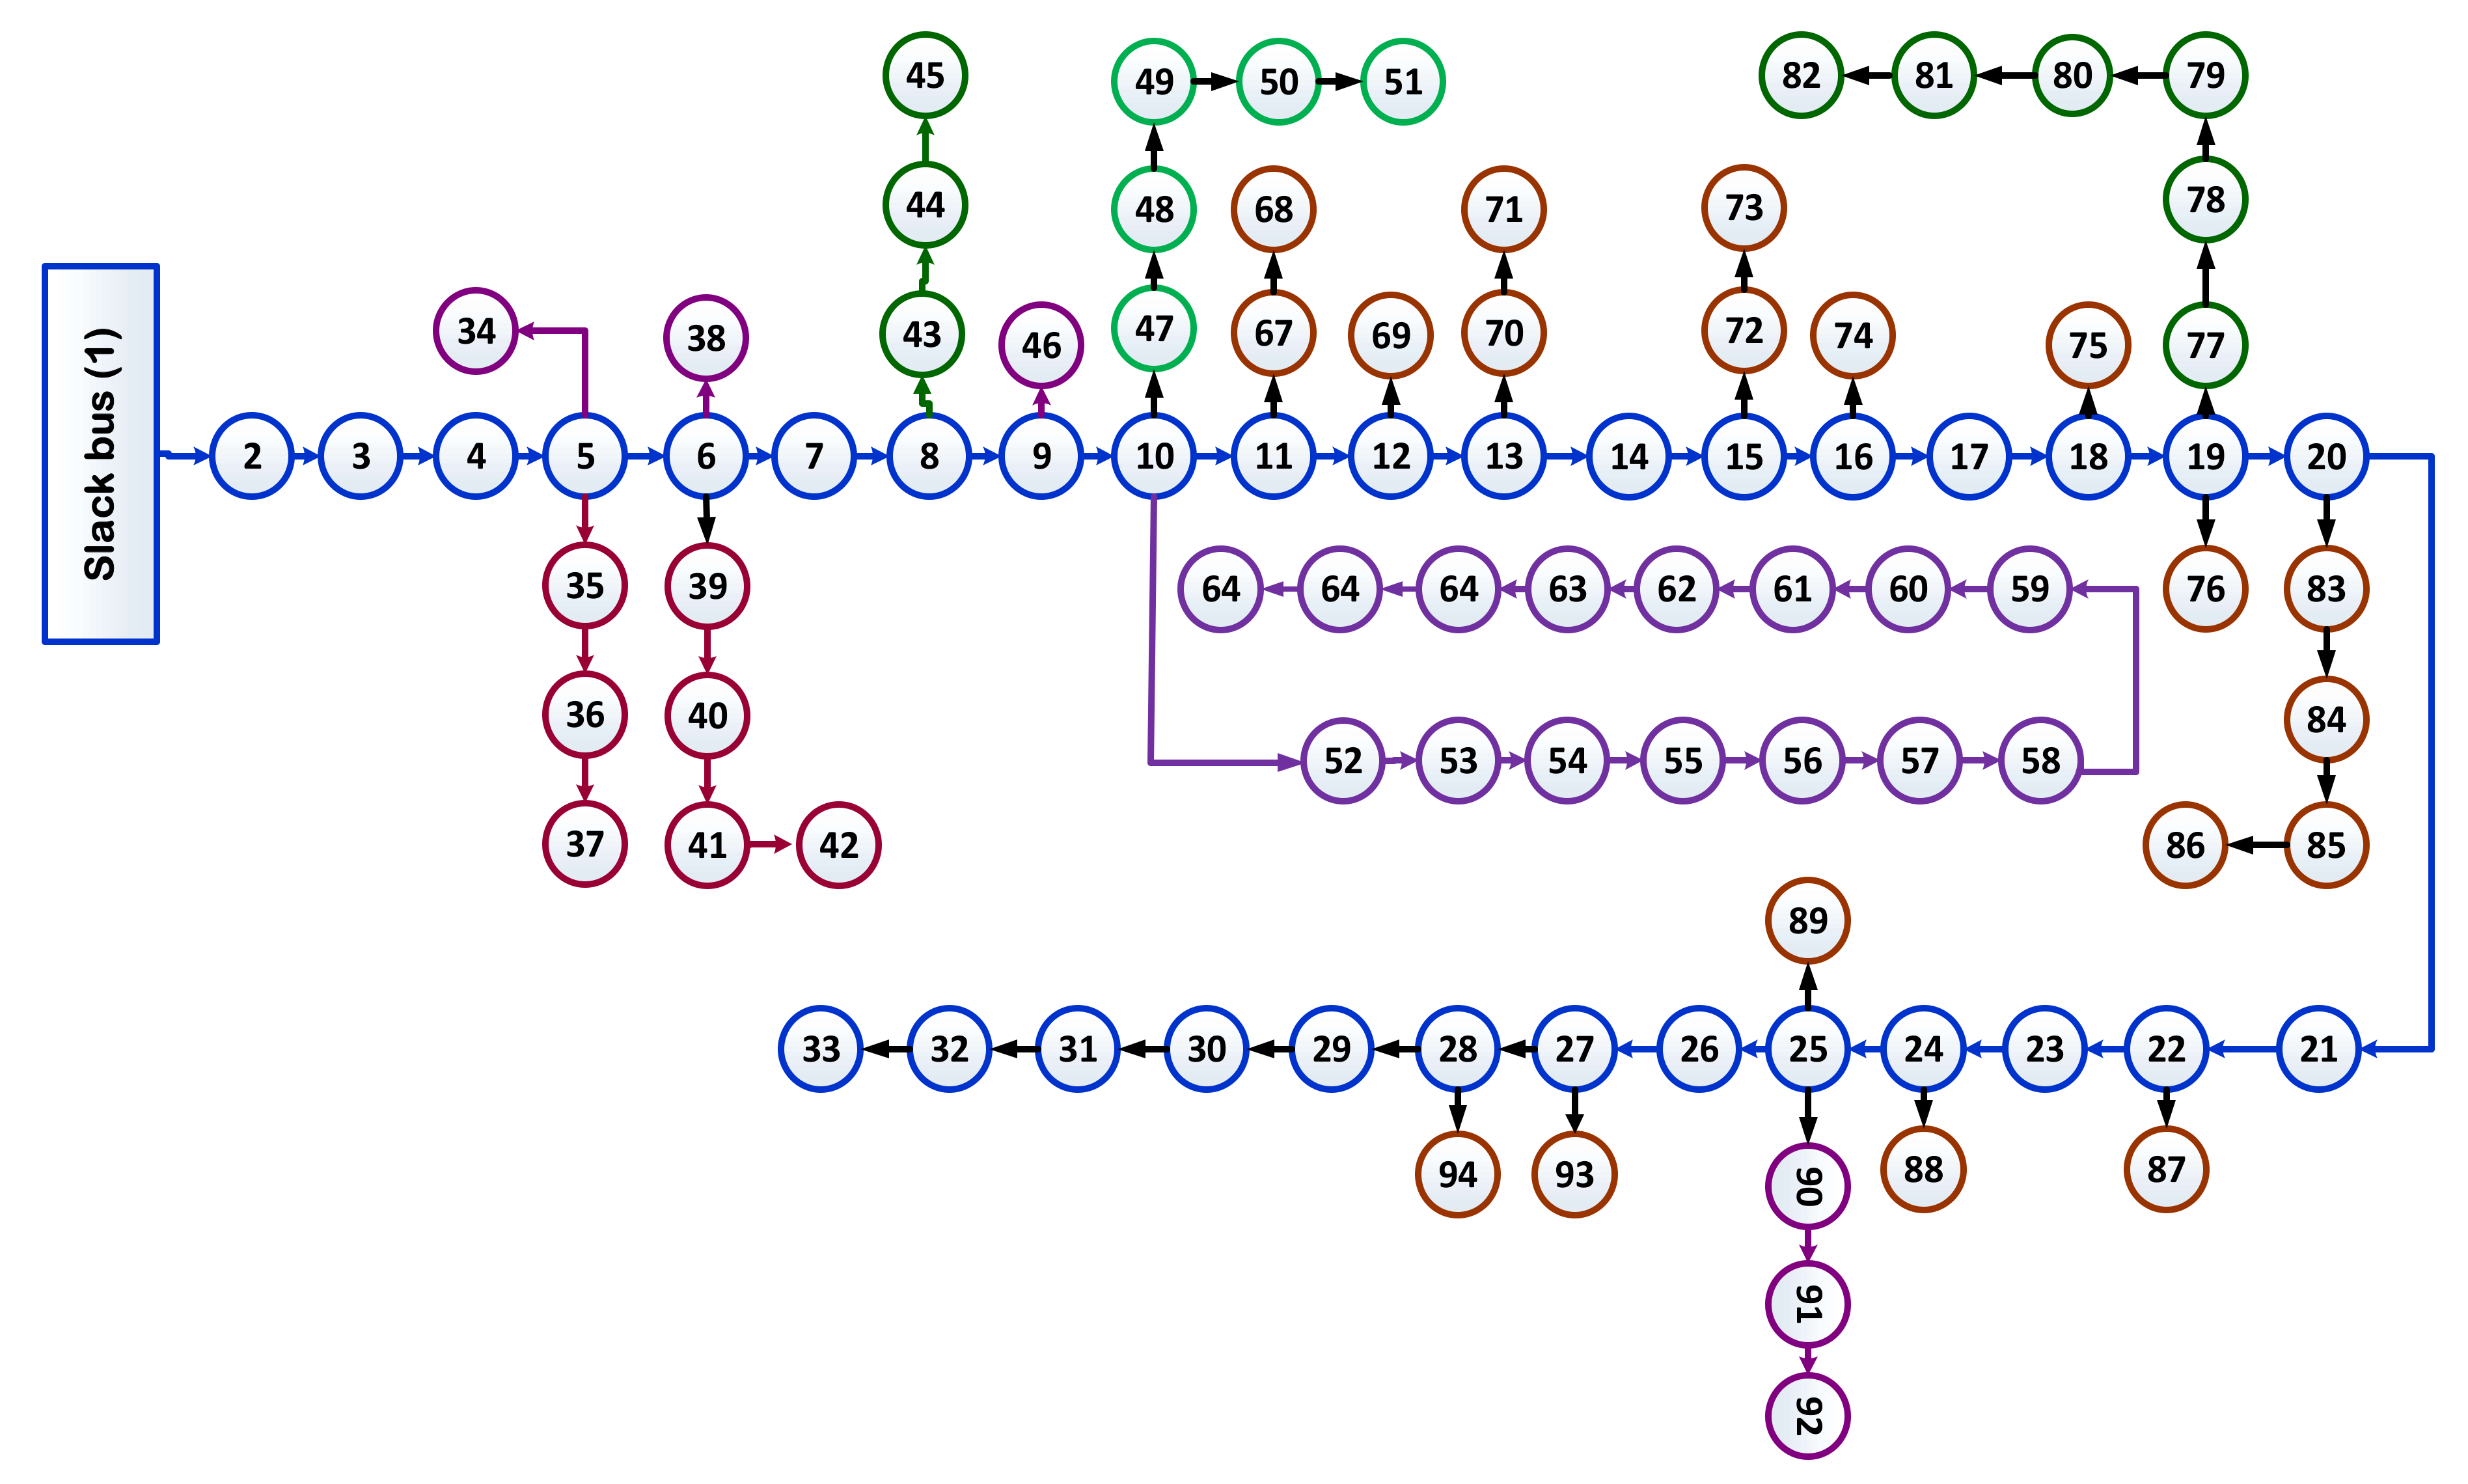
  • The validity and superiority of the proposed method are verified using a large 94 bus power system, and the obtained results are validated through comparisons with the genetic algorithm (GA), and the particle swarm optimization (PSO).

2. Problem Formulation

2.1. Objective Function

In this paper, three objective functions have been optimized with integration of the PV-DG with DSTATCOM functionality, which can be represented as follows:

2.1.1. The Total Annual Cost (TAC) Reduction

The first objective function is the TAC, which includes the costs of the PV system ( C o s t P V ) and the annual costs of the purchased energy from grid ( C o s t G r i d ). It can be formulated as follows, [30]:
T A C = m i n ( C o s t G r i d + C o s t P V )
where,
C o s t G r i d = k G r i d × 91.25 × i = 1 N s h = 1 24 P G r i d ( i , h )  
C o s t P V = C o s t P V F i x e d + C o s t P V V a r i a b l e  
In this paper, the total annual cost is calculated during four seasons (winter, summer, autumn, spring), and each season consists of 91.25 days.   k G r i d denotes to the cost of purchasing energy in $/kWh. N s refers to number of seasons within the year, which equals to 4. P G r i d denotes to the drawn power from grid. C o s t P V F i x e d and C o s t P V V a r i a b l e denote to the fixed and the variable costs of PV systems, which can be calculated as follows:
C o s t P V F i x e d = C R F × C P V × P S  
where, C P V represents the cost of PV unit (in $/kW). P S refers to the rated PV system power. C R F represents the recovery factor of the capital, and is calculated using (5), [30].
C R F = α × ( 1 + α ) β ( 1 + α ) β 1
where α and β are the interest rate with the PV system lifetime. The variable costs of the PV system represent the operational and maintenance cost, which can be calculated as follows:
C o s t P V V a r i a b l e = C O & M × i = 1 N s h = 1 24 P P V ( i , h )  
where, C O & M is the maintenance and operation costs of the PV system. P P V represents the yielded power from PV systems, which can be calculated using (7) [3,30].
P P V = { P S   ( G s 2 G S T D × X c           )       f o r     0 < G s G c P S ( g s G S T D   )             f o r         G c G s   G S T D                 P S                                                       G S T D     G s            
where, G s ,   G S T D , and G c are the actual solar irradiance, the solar irradiance at standard conditions and constant solar irradiance which equals to 150 W/m2 as determined in [31,32], respectively.

2.1.2. The Voltage Deviations (VDs) Reduction

The voltage profile of system can be boosted by decreasing the total VDs, which can be formulated as follows:
T V D s = 91.25 × i = 1 N s h = 1 24 n = 1 N B | V n 1 |
where, T V D s is the total voltage deviations, N B is the number of the nodes in the studied network, and V n is the voltage at bus n .

2.1.3. The Stability Improvement

The stability of the distribution systems can be improved by maximizing the voltage stability index [22]. Summation of the voltage stability index (SVSI) is calculated as follows, [22]:
S V S I = 91.25 × i = 1 N s h = 1 24 n = 1 N B V S I n
where,
V S I n = | V n | 4 4 ( P m n + 1 X n Q n + 1 R n ) 2 4 ( P n + 1 X n + Q n + 1 R n ) | V n | 2
where,   V S I n refers to the voltage stability-index of the nth bus. The above-mentioned three objective functions in this paper are considered as multi-objective function using the weighted objective function as follows:
F = π 1 O b j 1 + π 2 O b j 2 + π 3 O b j 3
where, π 1 , π 2 and π 3 are the weighted factors, where the sum of them equals to 1 as depicted in (12) [33].
| π 1 | + | π 2 | + | π 3 | = 1
The ratio between the objective functions (F1, F2, F3) using the DSTATCOM and the base case can be written as follows:
F 1 = T A C W i t h _ P V T A C b a s e
F 2 = V D s W i t h _ P V V D s b a s e
F 3 = 1 S V S I W i t h _ P V
where, T A C W i t h _ P V and T A C b a s e are the total cost with inclusion PV and at the base case (without PV units). V D s W i t h _ P V and V D s b a s e are the total voltage deviations with PV and at the base case. S V S I W i t h _ P V denotes the total stability index with PV unit.

2.2. System Constraints

2.2.1. The Equality Constraints

The quality constraints include the balanced powers flow in system. In other words, the drawn powers from grid and the generated powers from the PV system should satisfy the power losses and the load demand as follows:
P G + i = 1 N P V P P V , i = i = 1 N T P l o s s , i + i = 1 N B P D , i
Q G + i = 1 N P V Q P V , i = i = 1 N T Q l o s s , i + i = 1 N B Q D , i
where, P G and Q G are the drawn real and reactive power from substation. P D and Q D denote to the real and reactive load power. P P V and Q P V are the active and the reactive generated power from PV unit.

2.2.2. Inequality Constraints
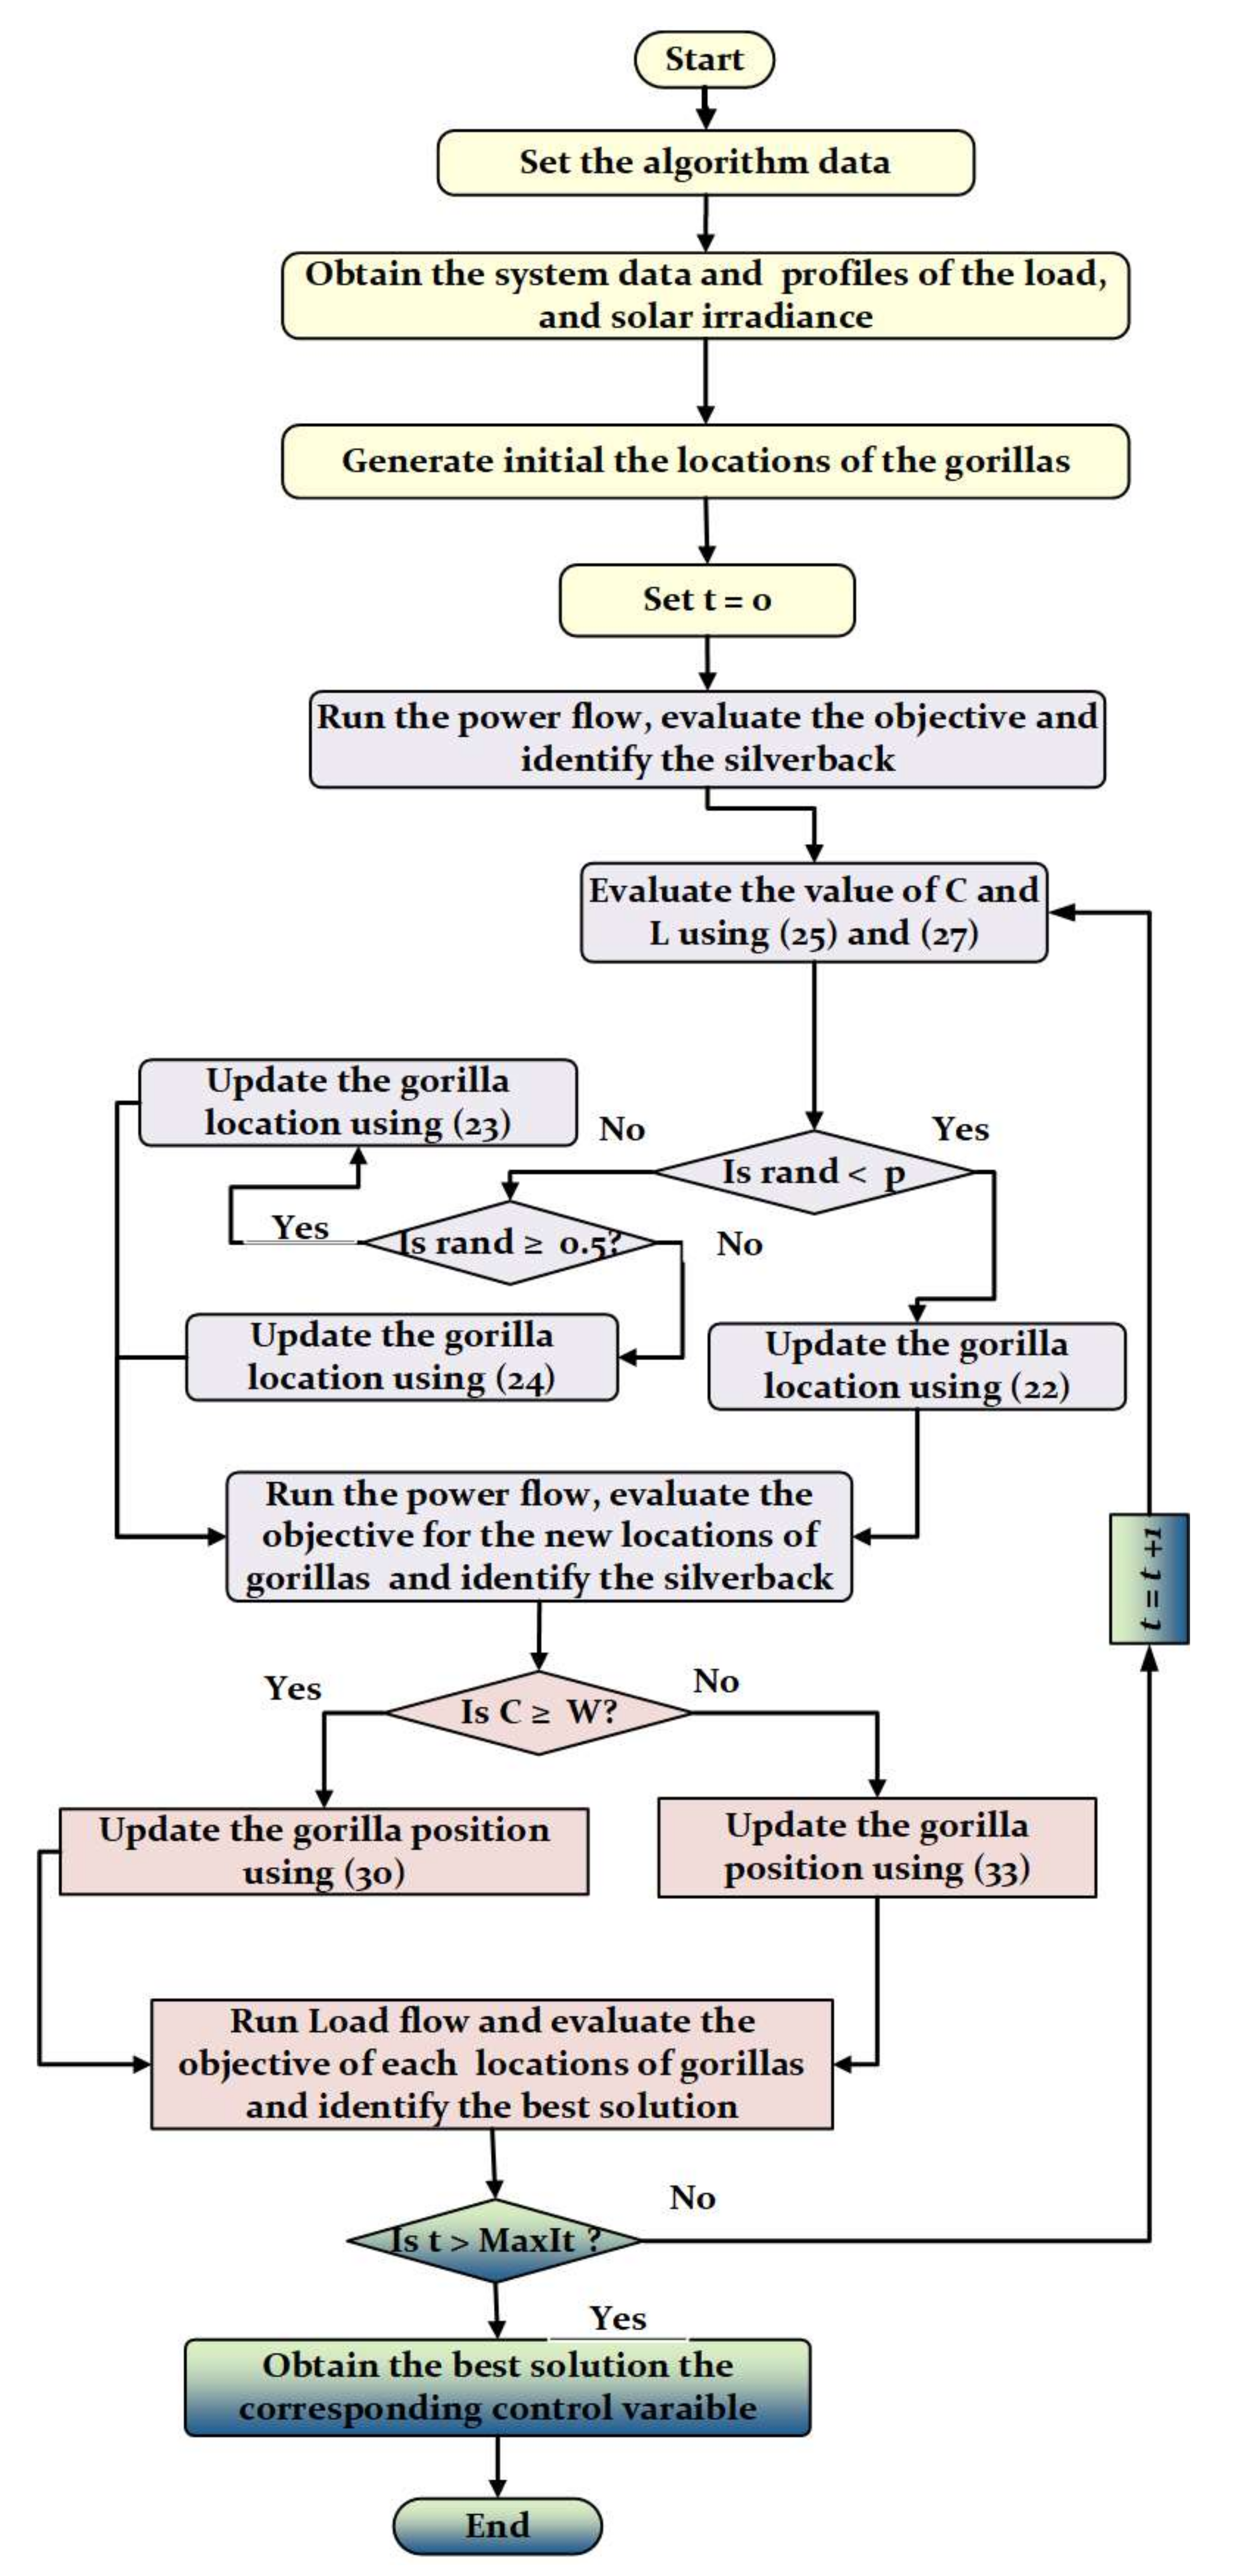
The inequality constraints can be rewritten as follows:
V m i n V i V m a x
I n I m a x , n     n = 1 , 2 , 3 , N T
i = 1 N P V P P V   i = 1 N B P D , i
i = 1 N D S Q P V ,   i i = 1 N B Q D , i
where, V m a x and V m i n are the allowable upper and the lower boundaries for the buses voltages. While, I m a x , n is the maximum allowable current in the nth transmission line.

3. The C Algorithm

The GTO represents a novel optimizer technique that was presented by Abdollahzadeh et al. in 2021 [25]. The GTO simulates social behaviors and the movements of the gorillas in the wild. The gorillas represent sociable animals, which live normally in groups (normally known as the troops). Each of the troops has silverback gorilla that function as a leader for the troop. The troop leader takes important decisions that lead to protect their troop. The other gorilla members in the troop follow their leader. The young-male gorillas (known as black-backs) represent the second order in the hierarchy of each troop. The black-backs follow the silverback, and they provide the backup protection of their group.

The Exploration Phase

The GTO algorithm follows the normal construction phases as in the other existing optimizers, including the exploration phase and the exploitation phase. The exploration phase in the GTO is constructed from three main strategies: the first strategy is based on the gorilla moving towards an unknown site, whereas the second and third strategies rely on the gorilla moving towards another gorilla or towards a known location, respectively. While the exploitation phase includes two different methodologies: the first one is based on the movement with silverbacks, whereas the second one describes the movement of the adult females. In the GTO algorithm, the location of a gorilla is represented by X, whereas the silverback location is represented by GX. In the GTO algorithm, it is supposed that the gorillas are trying to have better resources of their food. Therefore, GX is generated within iterative processes in each of the iterations. Then, it is exchanged in the case of having another solution that possesses better value. Based on the above-mentioned exploration phase in the GTO algorithm with its three main strategies, the mathematical formulations of this phase can be expressed as follows, [25]:
G X ( t + 1 ) = ( U B L B ) × R 1 + L B , rand   < p
G X ( t + 1 ) = ( R 2 C ) × X r ( t ) + L × H ,   rand   0.5
G X ( t + 1 ) = ( i ) L × ( L × ( X ( t ) G X r ( t ) ) + R 3 × ( X ( t ) G X r ( t ) ) ) , rand   < 0.5
where, R 1 , R 2 and R 3 represent random parameters in the range [0–1], and G X represents the candidate solution for update. t denotes to current iteration, whereas r a n d   represents random value in the range between [0–1]. p denotes a predefined value in the range of [0–1]. G X r and X r are the solutions within the population, which are randomly selected. Whereas, other operators can be designed as follows, [25]:
C = F × ( 1 t M a x I t )
F = cos ( 2 × R 4 ) + 1
L = C × l
H = Z × X ( t )
Z = [ C , C ]
where, M a x I t represents the maximum iterations number. R 4 denotes to random number within [0–1], whereas l can take the value between −1 and 1.
From another side, the exploitation phase of the GTO includes two various strategies. The first one relies on the movement of gorilla troops following a silverback gorilla. The second one relies on competitions for the adult females. The male gorillas in each group are fighting together to obtain adult females when silverback ones became week/old. The transition process between the two movements relies on the value of C as in Equation (25) and the predetermined value of W. When C W , the gorillas update their locations through following silverback gorillas as follows, [25]:
G X ( t + 1 ) = L × M × ( X ( t ) X silverback ) + X ( t )
M = 1 N i = 1 N G X i t g 1 8
g = 2 L
where, X silverback   represents the silverback gorilla location. The young male gorillas are fighting to obtain the female gorillas, which is known as a competition for the adult females. When, C < W , locations of the gorillas are updated based on this competition for the adult females, which is expressed as follows, [25]:
G X ( i ) = X silverback   ( X silverback   × Q X ( t ) × Q ) × A
Q = 2 × r 5 1
A = β × E
E = { N 1 ,         rand   0.5 N 2 ,         rand   < 0.5
where, Q mimics impact force, r 5 represents a random number in the range [0–1], and β refers to predefined parameter. When, a n d   0.5 , the value of E will equal random values in the normal distribution, and the dimensions of the problem. In the case that rand is lower than 0.5, E will be equivalent to the random value from the normal distribution. Figure 1 shows the processes of the GTO application for solving the problem of energy management in multi-microgrid systems.

4. Simulation Results

In this section, the proposed GTO is applied to determine the sites and ratings of PV-DG with DSTSTCOM functionality. The simulation code is programmed using MATLAB 2018b software on Core I5 PC 2.50 GHz, 4 GB RAM, 64 bits Windows 10 operating system. The new proposed method is tested on 94 bus system based on real distribution network in Portugal at 15 kV, which includes commercial, industrial, and domestic loads. The obtained results are compared with the genetic algorithm optimizer (GA), and the particle swarm optimizer (PSO) algorithm. The parameters of GTO, GA and the PSO are shown in Table 1. The optimal integration of the PV-DG with DSTSTCOM functionality is tested on large 94 bus distribution network. The configuration of the 94 bus network in shown in Figure 2 and the load demand of this system is 4797 + j2324 kVA while the system data are listed in [34]. It should be noted that the cost parameters in Equations (2)–(6) including k G r i d , C P V , α and β are selected to be 0.096 $/kWh, 770 $/kW, 10% and 20 years [15,35]. The studied cases are presented with hourly variations of the load and the solar irradiance in winter, summer, autumn and spring seasons as depicted in Figure 3 and Figure 4, respectively. Additionally, the system power losses are also shown in Figure 5. Referring to Figure 5, the power losses are varied with the seasonal variations of the load demand where the large power losses are occurred at the summer season.
To evaluate the optimal integration of the PV-DG with and without DSTATCOM functionality, two cases are studied as follows:

4.1. Optimal Integration of the PV-DG without STATCOM Functionality

In this section, the PV-DGs are optimally allocated in system without injecting reactive power by their inverters. Two PV units are incorporated in system where the optimal sizes and sites of these units are founded by GTO, PSO and GA optimization methods. Table 2 lists the obtained results for this case, including the optimal placement and ratings of the PV units, the total annual cost, total energy losses, the total VDs and the total voltage stability index. The optimal sizes of PV units are 3548 kW and 1249 kW, while the optimal locations are at buses 77 and 89, respectively. With optimal integration of the PV units for this case, the total cost is reduced from 2.5659 × 10⁶$ to 2.1899 × 10⁶$, while the TVDs (p.u) is reduced from 4.6320 × 10⁴ to 3.2287 × 10⁴. In addition, the total voltage stability is enhanced from 3.2287 × 10⁴ to 4.6320 × 10⁴ compared to the base case (without DSTATCOM functionality). The variations of the output power of the first and the second PV units are depicted in Figure 6 and Figure 7, respectively. According to Figure 6 and Figure 7, It is perceived that the output power from the first, and the second PV units are changed with the seasonal irradiance variations. From Table 2, the GTO is superior to solve the PV-DGs allocation compared to the PSO and GA in terms of total cost, the total VDs and the total stability index.

4.2. Optimal Integration of the PV-DG with STATCOM Functionality

In this case, the PV-DGs are integrated in system with DSTATCOM functionality. Here, two PV units are incorporated, and the GTO is used to assign optimal ratings, sites of the PV units and the optimal injected reactive powers by these units for each hour. Table 3 shows the obtained results for this case by implementation of the GTO, GA and PSO algorithms. The optimal sizes of PV units are 2946 kW and 1832 kW, while the optimal locations are at buses 53 and 18, respectively. The optimal injective reactive powers by first and second PV units for each hour, which have been determined by GTO, are shown in Figure 8 and Figure 9, respectively. In this case, optimal integration of the PV units with DSTACOM functionality, the total costs are reduced from 2.5659 × 10⁶$ to 2.17985 × 10⁶$, while the TVDs are reduced from 4.6320 × 10⁴ p.u to 1.06312 × 10⁴ p.u. In addition, the summation of the system stability is improved from 6.4856 × 10⁵ p.u to 8.134946 × 10⁵ p.u compared to base case (without PV-DGs).
Figure 8 and Figure 9 show the optimal injected reactive power levels during the day and night which have been determined by application of the proposed optimization techniques. The injected reactive powers aren’t depending upon the solar irradiance and the maximum limit. The injected power has been determined using (21). In other words, the injected reactive power by PV-DGs at any time over the day should be less than the reactive load demand (2323.9 kVar). The output power of the PV-DGs of the first, and the second PV are shown in Figure 10 and Figure 11, respectively. From Figure 10 and Figure 11, the trends of output power of these units follow the variations of the hourly variations of the solar irradiance. Figure 12 shows the power losses at the summer, the winter, the spring and autumn of system. Refereeing to Figure 12, the power losses are reduced with optimal inclusion of the PV and reduced more with optimal inclusion of the PV with DSTATCOM functionality. In addition to that the power losses are reduced incrementally with increasing the output powers of the PV system during daylight hours. Figure 13 shows the seasonal voltage profile for summer, winter, autumn and spring. Referring to Figure 13, the voltage profile is stable, and the voltage magnitudes are within the allowable limits. It worth mentioning here that in case of optimal integration of the PV-DGs without DSTATCOM functionality the payback period and yearly net saving are 9.82 years and 376,000$, respectively. Whereas in case of optimal integration of the PV-DGs without DSTATCOM functionality the payback period and yearly net saving are 9.53 years 386,050$, respectively.

5. Conclusions

In this paper, the optimal sizes and allocation of solar photovoltaic-based DGs (PV-DGs) have been determined, considering the seasonal variation in the electrical load demands and the solar irradiance. The allocation problem of the PV-DGs, with and without DSTATCOM functionality, has been investigated to maximize the utilization of the inverters of the PV systems. The Gorilla troops optimizer (GTO) has been employed to find the best ratings and location of the PV-DGs on 94 bus RDN and the optimal injected reactive powers by the inverters of the PV systems for enhancing the cost reduction, and for the enhancement of the system performance. The simulation results based on the proposed method show that:
  • The optimized integration of the PV-DGs without DSTATCOM functionality can reduce total system costs, and the voltage deviations by 14.65% and 30.3%, respectively, while the total voltage stability was enhanced by 8.18% compared to the base case.
  • The total cost decreased from 2.5659 × 10⁶$ to 2.1899 × 10⁶$, while the TVDs (p.u) were reduced from 4.6320 × 10⁴ to 3.2287 × 10⁴. In addition, the total voltage stability was enhanced from 3.2287 × 10⁴ to 4.6320 × 10⁴ compared to the base case.
  • The total cost decreased from 2.5659 × 10⁶$ to 2.17985 × 10⁶$, while the TVDs were reduced from 4.6320 × 10⁴ p.u to 1.06312 × 10⁴ p.u. In addition, the summation of the system stability was improved from 6.4856 × 10⁵ p.u to 8.134946 × 10⁵ p.u compared to the base case.
The future research works related to the presented subject include studying the optimal allocation of the PV based DGs with the charging stations of the electrical vehicles and with developed methods for modeling of the uncertainty of system.

Author Contributions

Conceptualization, M.E., E.M.A., E.A.M. and A.M.A.E.H.; Data curation, A.A., M.E. and M.A.; Formal analysis, A.A., L.N. and A.M.A.E.H.; Funding acquisition, M.E., L.N., M.A., E.M.A., E.A.M. and H.H.A.; Investigation, A.A., M.E., L.N., E.M.A., E.A.M. and H.H.A.; Methodology, A.A., M.A., E.M.A., E.A.M., H.H.A. and A.M.A.E.H.; Project administration, M.E., E.A.M. and A.M.A.E.H.; Resources, M.A., E.M.A. and H.H.A.; Software, A.A., M.E., L.N., E.A.M. and H.H.A.; Supervision, L.N., M.A., E.A.M. and A.M.A.E.H.; Validation, E.M.A.; writing—original draft, M.E., M.A. and E.A.M.; writing—review & editing, L.N., E.M.A., H.H.A. and A.M.A.E.H. All authors have read and agreed to the published version of the manuscript.

Funding

This research received no external funding.

Conflicts of Interest

The authors declare no conflict of interest.

References

  1. Sun, P.; Teng, Y.; Zhe, C. Multi-objective robust optimization of multi-energy microgrid with waste treatment. Renew. Energy 2021, 178, 1198–1210. [Google Scholar] [CrossRef]
  2. Xiao, D.; Chen, H.; Wei, C.; Bai, X. Statistical measure for risk-seeking stochastic wind power offering strategies in electricity markets. J. Mod. Power Syst. Clean Energy 2021, 1–6. [Google Scholar] [CrossRef]
  3. Oda, E.S.; el Hamed, A.M.A.; Ali, A.; Elbaset, A.A.; el Sattar, M.A.; Ebeed, M. Stochastic optimal planning of distribution system considering integrated photovoltaic-based DG and DSTATCOM under uncertainties of loads and solar irradiance. IEEE Access 2021, 9, 26541–26555. [Google Scholar] [CrossRef]
  4. Ahmed, D.; Ebeed, M.; Ali, A.; Alghamdi, A.S.; Kamel, S. Multi-objective energy management of a micro-grid considering stochastic nature of load and renewable energy resources. Electronics 2021, 10, 403. [Google Scholar] [CrossRef]
  5. Ma, X.; Liu, S.; Liu, H.; Zhao, S. The selection of optimal structure for standalone microgrid based on modeling and optimization of distributed generators. IEEE Access 2022, 10, 40642–40660. [Google Scholar] [CrossRef]
  6. Hassan, A.S.; el Saeed, A.O.; Fahmy, M.B.; Mohamed, A.E. Optimal integration of distributed generation resources in active distribution networks for techno-economic benefits. Energy Rep. 2020, 6, 3462–3471. [Google Scholar] [CrossRef]
  7. Reddy, G.H.; Aditya, N.K.; Sadhan, G.; More, R.; Kshetrimayum, M.S. Optimal sizing and allocation of DG and FACTS device in the distribution system using fractional Lévy flight bat algorithm. IFAC-PapersOnLine 2022, 55, 168–173. [Google Scholar] [CrossRef]
  8. Zellagui, M.; Lasmari, A.; Settoul, S.; El-Bayeh, C.Z.; Chenni, R. Assessment integration of hybrid PV-DSTATCOM-BES-DG system in EDS under uncertainties using chaotic adaptive inertia weight PSO algorithms. In Proceedings of the 2021 12th International Symposium on Advanced Topics in Electrical Engineering (ATEE), Bucharest, Romania, 25–27 March 2021; pp. 1–8. [Google Scholar]
  9. Ramadan, A.; Ebeed, M.; Kamel, S.; Agwa, A.M.; Tostado-Véliz, M. The Probabilistic Optimal Integration of Renewable Distributed Generators Considering the Time-Varying Load Based on an Artificial Gorilla Troops Optimizer. Energies 2022, 15, 1302. [Google Scholar] [CrossRef]
  10. Ramadan, A.; Ebeed, M.; Kamel, S.; Abdelaziz, A.Y.; Alhelou, H.H. Scenario-based stochastic framework for optimal planning of distribution systems including renewable-based dg units. Sustainability 2021, 13, 3566. [Google Scholar] [CrossRef]
  11. Parihar, S.S.; Malik, N. Analysing the impact of optimally allocated solar PV-based DG in harmonics polluted distribution network. Sustain. Energy Technol. Assess. 2022, 49, 101784. [Google Scholar] [CrossRef]
  12. Ramadan, A.; Ebeed, M.; Kamel, S.; Ahmed, E.M.; Tostado-Véliz, M. Optimal allocation of renewable DGs using artificial hummingbird algorithm under uncertainty conditions. Ain Shams Eng. J. 2022, 101872. [Google Scholar] [CrossRef]
  13. Ghaffari, A.; Askarzadeh, A.; Fadaeinedjad, R. Optimal allocation of energy storage systems, wind turbines and photovoltaic systems in distribution network considering flicker mitigation. Appl. Energy 2022, 319, 119253. [Google Scholar] [CrossRef]
  14. Home-Ortiz, J.M.; Melgar-Dominguez, O.D.; Mantovani, J.R.S.; Catalão, J.P. PV hosting capacity assessment in distribution systems considering resilience enhancement. Sustain. Energy Grids Netw. 2022, 32, 100829. [Google Scholar] [CrossRef]
  15. Karimi, H.; Jadid, S. A strategy-based coalition formation model for hybrid wind/PV/FC/MT/DG/battery multi-microgrid systems considering demand response programs. Int. J. Electr. Power Energy Syst. 2022, 136, 107642. [Google Scholar] [CrossRef]
  16. Nikkhah, S.; Rabiee, A. Multi-objective stochastic model for joint optimal allocation of DG units and network reconfiguration from DG owner’s and DisCo’s perspectives. Renew. Energy 2019, 132, 471–485. [Google Scholar]
  17. Hemmati, R.; Hooshmand, R.-A.; Taheri, N. Distribution network expansion planning and DG placement in the presence of uncertainties. Int. J. Electr. Power Energy Syst. 2015, 73, 665–673. [Google Scholar] [CrossRef]
  18. Hemeida, M.G.; Alkhalaf, S.; Senjyu, T.; Ibrahim, A.; Ahmed, M.; Bahaa-Eldin, A.M. Optimal probabilistic location of DGs using Monte Carlo simulation based different bio-inspired algorithms. Ain Shams Eng. J. 2021, 12, 2735–2762. [Google Scholar] [CrossRef]
  19. Home-Ortiz, J.M.; Pourakbari-Kasmaei, M.; Lehtonen, M.; Mantovani, J.R.S. Optimal location-allocation of storage devices and renewable-based DG in distribution systems. Electr. Power Syst. Res. 2019, 172, 11–21. [Google Scholar] [CrossRef]
  20. Abdelsattar, M.; el Hamed, A.M.A.; Elbaset, A.A.; Kamel, S.; Ebeed, M. Optimal integration of photovoltaic and shunt compensator considering irradiance and load changes. Comput. Electr. Eng. 2022, 97, 107658. [Google Scholar] [CrossRef]
  21. Varma, R.K.; Siavashi, E.; Mohan, S.; McMichael-Dennis, J. Grid support benefits of solar PV systems as STATCOM (PV-STATCOM) through converter control: Grid integration challenges of solar PV power systems. IEEE Electrif. Mag. 2021, 9, 50–61. [Google Scholar] [CrossRef]
  22. Ebeed, M.; Kamel, S.; Aleem, S.H.A.; Abdelaziz, A.Y. Optimal allocation of compensators. In Electric Distribution Network Planning; Springer: Singapore, 2018; pp. 321–353. [Google Scholar]
  23. Varma, R.K. Smart Solar PV Inverters with Advanced Grid Support Functionalities; John Wiley & Sons: Hoboken, NJ, USA, 2021. [Google Scholar]
  24. Singh, B.; Kandpal, M.; Hussain, I. Control of grid tied smart PV-DSTATCOM system using an adaptive technique. IEEE Trans. Smart Grid 2016, 9, 3986–3993. [Google Scholar] [CrossRef]
  25. Abdollahzadeh, B.; Gharehchopogh, F.S.; Mirjalili, S. Artificial gorilla troops optimizer: A new nature-inspired metaheuristic algorithm for global optimization problems. Int. J. Intell. Syst. 2021, 36, 5887–5958. [Google Scholar] [CrossRef]
  26. Ginidi, A.; Ghoneim, S.M.; Elsayed, A.; El-Sehiemy, R.; Shaheen, A.; El-Fergany, A. Gorilla troops optimizer for electrically based single and double-diode models of solar photovoltaic systems. Sustainability 2021, 13, 9459. [Google Scholar] [CrossRef]
  27. Abdel-Basset, M.; El-Shahat, D.; Sallam, K.M.; Munasinghe, K. Parameter extraction of photovoltaic models using a memory-based improved gorilla troops optimizer. Energy Convers. Manag. 2022, 252, 115134. [Google Scholar] [CrossRef]
  28. Abdel-Basset, M.; Mohamed, R.; Chang, V. An Efficient Parameter Estimation Algorithm for Proton Exchange Membrane Fuel Cells. Energies 2021, 14, 7115. [Google Scholar] [CrossRef]
  29. Ali, M.; Kotb, H.; Aboras, K.M.; Abbasy, N.H. Design of Cascaded PI-Fractional Order PID Controller for Improving the Frequency Response of Hybrid Microgrid System Using Gorilla Troops Optimizer. IEEE Access 2021, 9, 150715–150732. [Google Scholar] [CrossRef]
  30. Kamel, S.; Ramadan, A.; Ebeed, M.; Nasrat, L.; Ahmed, M.H. Sizing and evaluation analysis of hybrid solar–wind distributed generations in real distribution network considering the uncertainty. In Proceedings of the 2019 International Conference on Computer, Control, Electrical, and Electronics Engineering (ICCCEEE), Khartoum, Sudan, 21–23 September 2019; pp. 1–5. [Google Scholar]
  31. Liang, R.H.; Liao, J.H. A fuzzy-optimization approach for generation scheduling with wind and solar energy systems. IEEE Trans. Power Syst. 2007, 22, 1665–1674. [Google Scholar] [CrossRef]
  32. Ebeed, M.; Aleem, S.H.A. Overview of uncertainties in modern power systems: Uncertainty models and methods. In Uncertainties in Modern Power Systems; Elsevier: Amsterdam, The Netherlands, 2021; pp. 1–34. [Google Scholar]
  33. Ali, E.; Elazim, S.A.; Abdelaziz, A. Ant lion optimization algorithm for renewable distributed generations. Energy 2016, 116, 445–458. [Google Scholar] [CrossRef]
  34. Pires, D.F.; Antunes, C.H.; Martins, A.G. NSGA-II with local search for a multi-objective reactive power compensation problem. Int. J. Electr. Power Energy Syst. 2012, 43, 313–324. [Google Scholar] [CrossRef]
  35. Gampa, S.R.; Das, D. Optimum placement and sizing of DGs considering average hourly variations of load. Int. J. Electr. Power Energy Syst. 2015, 66, 25–40. [Google Scholar] [CrossRef]
  36. Sivanandam, S.; Deepa, S. Genetic algorithms. In Introduction to Genetic Algorithms; Springer: Berlin/Heidelberg, Germany, 2008; pp. 15–37. [Google Scholar]
  37. Mohseni, S.; Brent, A.C.; Burmester, D. A comparison of metaheuristics for the optimal capacity planning of an isolated, battery-less, hydrogen-based micro-grid. Appl. Energy 2020, 259, 114224. [Google Scholar] [CrossRef]
  38. Kennedy, J.; Eberhart, R. Particle swarm optimization. In Proceedings of the 1995 IEEE International Conference on Neural Networks, Perth, Australia, 27 November–1 December 1948; Volume 1, p. 6. [Google Scholar]
Figure 1. Flowchart of GTO application in solving the optimal allocation problem of PV-DGs.
Mathematics 10 02543 g001
Figure 2. The configuration of the 94 bus system.
Mathematics 10 02543 g002
Figure 3. The seasonal load profile.
Mathematics 10 02543 g003
Figure 4. The solar irradiance variations.
Mathematics 10 02543 g004
Figure 5. The power losses of the system.
Mathematics 10 02543 g005
Figure 6. The outputted power from the first unit for case 1.
Mathematics 10 02543 g006
Figure 7. The output power from the second unit for case 1.
Mathematics 10 02543 g007
Figure 8. The reactive power injection from the first PV unit.
Mathematics 10 02543 g008
Figure 9. The reactive power injection from the second PV unit.
Mathematics 10 02543 g009
Figure 10. The outputted power from the first unit for case 2.
Mathematics 10 02543 g010
Figure 11. The outputted power from the second unit for case 2.
Mathematics 10 02543 g011
Figure 12. The power losses of four seasons.
Mathematics 10 02543 g012
Figure 13. System voltages magnitude (a) in Winter, (b) in Spring, (c) in Summer, (d) in Autumn.
Mathematics 10 02543 g013
Table 1. The selected parameters for GTO, GA and PSO.
ParametersAlgorithm
GTOPopulations = 25, Iterations = 100, β = 3 , p = 0.03 , W = 0.8.
GA [36,37]Populations = 25, Iterations = 100, P c r o s s = 0.1 , P M u t a t i o n = 0.9 .
PSO [37,38]Populations = 25, Iterations = 100, C 1 = 2 , C 2 = 2 , ω = 0.7 .
Table 2. The simulation results for case 1.
ItemBase CaseGTOPSOGA
Energy Loses (kWh) 1.1888 × 1069.2212 × 1059.2504 × 1059.2101 × 105
Optimal Location of PV1-772577
Optimal Location of PV2-892094
Optimal size of PV1 (kW)-354814524081
Optimal size of PV2 (kW)-12493331716
TVDs   ( p . u ) 4.6320 × 1043.2287 × 1043.2310 × 1043.2356 × 104
TVSI   ( p . u ) 6.4856 × 1057.0163 × 1057.0271 × 1057.0049 × 105
Purchasing power cost ($)2.5659 × 1061.6649 × 1061.6687 × 1061.6645 × 106
PV Cost ($)-5.2505 × 1055.2342 × 1055.2508 × 105
Total Cost ($)2.5659 × 1042.1899 × 1062.1921 × 1062.1896 × 106
Simulation Time (Sec.) 803.1539.3644.56
Table 3. The simulation results for case 2.
ItemBase CaseGTOPSOGA
Energy Losses   ( kWh ) 1.1888 × 1068.00260 × 1059.8598 × 1058.7572 × 105
Optimal Location of PV1-534283
Optimal Location of PV2-182352
Optimal size of PV1 (kW)-29467301157
Optimal size of PV2 (kW)-183240193635
TVDs   ( p . u ) 4.6320 × 1041.06312 × 1043.2930 × 1048.93986 × 103
TVSI   ( p . u ) 6.4856 × 1058.134946 × 1056.9927 × 1058.07743 × 105
Purchasing power cost ($)2.5659 × 1061.656907 × 1061.6810 × 1061.6624 × 106
PV Cost ($)-5.22943 × 1055.1966 × 1055.2439 × 105
Total Cost ($)2.5659 × 1062.17985 × 1062.2007 × 1062.18682 × 106
Simulation Time (s) 758.96536.0800625.44
Publisher’s Note: MDPI stays neutral with regard to jurisdictional claims in published maps and institutional affiliations.

