1. Introduction
By the beginning of 2020, human beings were conquered by the SARS-CoV-2 virus. That virus caused a pandemic infectious disease called COVID-19. The outbreak of COVID-19 has had a catastrophic impact on global health infrastructure, leading to millions of infected cases and thousands of deaths [
1]. In clinical practice, real-time reverse transcriptase-polymerase chain reaction (RT-PCR) is used as a standard test to detect COVID-19 infection [
2]. However, research studies demonstrated that RT-PCR suffers from high false-positive rates because the clinical practice is strictly impacted by a variety of aspects such as appropriateness of specimen, phase of infection, specimen categories, and specimen conduct, containing sample acquisition time from the inception of COVID-19. Moreover, the fast proliferation of COVID-19 has led to a deficiency of RT-PCR test kits for the discovery of COVID-19. Another obvious shortcoming of this test involves direct interaction between medical staff and patients. This, in turn, made the medical staff more prone to infection, which caused a high death rate in the healthcare community. As a remedy to the above issues, doctors and scholars showed that medical images can be used as an effective tool to detect the presence of COVID-19. X-rays and computed tomography (CT) are broadly used in this respect [
3]. Accordingly, the research moved from manual diagnosis of COVID-19 toward computer-aided diagnosis.
Ultrasound imaging is a non-invasive method that has already begun to replace X-rays in pulmonary disease. There has been a surge in demand for point-of-care ultrasound, which is supported by clinical facts and research findings. The advantages of point-of-care ultrasonography (POCUS) include its low cost, ease of mobility, and bedside convenience for patient safety. It is presently underutilized due to a lack of training options and an appreciation of the research supporting this approach. It was discovered that it enhances conventional diagnostic procedures and the technology is rapidly evolving. For wider use, it was also suggested that POCUS be introduced into urgent and core medicine curricula [
4]. The latest epidemic of the COVID-19 pandemic forced the healthcare community to utilize ultrasound imaging in emergency departments [
5,
6,
7]. Discoveries indicated that ultrasound imaging could help in both identifying COVID-19 cases and following up on their states during the hospitalization phase. Nevertheless, lung ultrasound offers just local pathological information on the status of the lung area. Thus, it is critical to thoroughly specify the necessary volume and distribution of lung regions to be scanned. This way, multi-institutional studies are designed to search for an ideal trade-off between a rapid and precise assessment to be performed [
8]. For COVID-19 diagnosis, a twelve-area methodology was proposed to signify an optimum trade-off between precision, speed, and exam complication [
9]. When it comes to evaluating patients’ states from ultrasound data, both pathological information (i.e., pleural line, consolidations, opacities), and sonographic artifacts (i.e., B-lines and A-lines) come to be significant. Nevertheless, identifying this information and appropriately interpreting it demands extremely experienced doctors. Therefore, to date, lung ultrasound data are not broadly accepted, even though their capacity would be somewhat recommended, especially in the face of urgent requirements occurring in screening patients in the COVID-19 pandemic [
10].
Deep learning (DL) as a subfield of machine learning (ML) was demonstrated as a key enabler for almost all medical image analysis tasks and computer-aided diagnosis systems. In this regard, convolutional neural networks (CNNs) are showing great capability for extracting valuable representations from medical images [
11]. For COVID-19 diagnosis, CNNs are showing great promise in the detection and segmentation of infection and were demonstrated to be very robust tools for achieving many interesting responsibilities, particularly in the realm of image perception. Given an adequate amount of training samples and enough computing power, complex DL could even surpass doctors’ performance on particular diagnosis tasks [
12]. Research efforts are developing in the way of applying CNNs to ultrasound data. However, training data are difficult to obtain, which is a common issue in medical image analysis and makes it challenging to effectively train these complicated models. Unfortunately, the majority of DL solutions for COVID-19 diagnosis are designed as a black-box model, which means that the model just provides us with the final decision without justifying the reason behind it [
13]. In other words, the doctors are unable to interpret the internal working methodology of the DL model, thereby they cannot trust the diagnosis results obtained from the DL model [
14]. Generally speaking, the opaque nature of DL models constrains the ability to integrate them into real-world healthcare applications. These constraints come to be more serious in the case of critical or pandemic diseases.
1.1. Research Gaps
When it comes to the diagnosis of COVID-19 from ultrasound images using DL, many research gaps are encountered, making it challenging to do well in combating COVID-19 either in or after the outbreak. By investigating the recent literature, this study considers the following open gaps:
Efficiency: In clinical practice, the task of detecting COVID-19 from lung ultrasound data (either images or videos) necessitates high experience from doctors. Similarly, DL should be able to effectively model the disease representations from the ultrasound data in such a way that enables discriminating between the manifestations of COVID-19 and other kinds of pneumonia with the lowest possible error rate. The healthcare system does not tolerate any errors, especially in the diagnosis of pandemic diseases, making the accuracy of the model an essential requirement [
15];
Complexity: Deep models are demonstrated as robust tools for learning inherent features and diagnostic cues from medical image analysis. These models usually have a complicated building structure so that they can model different representations from large-sized and multi-dimensional training datasets. This complexity, in turn, necessitates the model training to be performed on powerful and computationally efficient machines, making it challenging to effectively detect COVID-19 from lung ultrasound data. Another challenge to be considered in this respect is that the complex models are unable to do well when trained on limited training data, which is a typical scenario when dealing with COVID-19 lung data [
16,
17];
Opaqueness: As stated above, the deep models are characteristically composed of multiple building blocks and layers with several nonlinear interconnected interactions. Even if one is to inspect all these layers and describe their relations, it is unfeasible to fully comprehend how the neural network came to its decision. Therefore, DL is often considered a ‘black box’. To properly understand how the model made its choice, one would need to examine all of these constituting layers and define their relationships. This is practically infeasible, leading the community to declare the DL model as a “black box” model. There is growing concern that these black boxes might exhibit some unobserved bias in making their decisions [
13,
14,
18]. This can have far-reaching repercussions, especially in medical applications. When it comes to COVID-19 detection, the same problem exists; however, the dangerousness of the disease even after the outbreak means that doctors have no chance to trust such opaque models. Marginal mistakes in the diagnostic decision may cause catastrophic consequences. Explainable artificial intelligence (XAI) is an evolving subfield to provide a good explanation if it gives insight into how a neural network came to its decision and/or can make the decision understandable.
1.2. Contributions
In response to the above challenges and gaps, this work presents a novel DL solution that affords and is interpretable and efficient in the detection of COVID-19 from ultrasound data. The main contributions of this work are pointed out as follows:
First, a lightweight convolutional transformer network for flexible and robust modeling of COVID-19 from ultrasound data is designed, while dissipating the nightmare of “data-hungry” models by being able to effectively learn from scratch and attain high screening performance on small-size data.
Second, two parallel transformer modules are designed with window-based and shifted-window multi-head self-attention layers, respectively, aiming to improve the representational power of the model, while maintaining a few numbers of parameters.
Third, the convolutional patching module is integrated to empower image tokenization to sustain local spatial representations by encoding relationships between patches.
Fourth, a weighted pooling module is presented to get rid of the necessity for class tokens and by scoring the sequential embeddings of the disease representations captured by the transformer modules to better relate information across the input frames.
A gradient activation mapping integrated after-weighted pooling to empower the proposed model visually explains its decided class for a given input frame, which is achieved by highlighting the contribution of different biomarkers in the ultrasound frame.
Finally, an experimental evaluation of the public lung ultrasound dataset demonstrates the ability of the proposed solution to precisely screen COVID-19, while generating a visual explanation for the generated decisions.
1.3. Organization
The remaining part of this work is systematically organized as follows.
Section 2 discusses the literature studies relevant to COVID-19 detection.
Section 3 argues the methodology of the proposed solution. In addition, the experimental setting of this study is discussed in
Section 4. Then, the results, analysis, and findings are given in
Section 5. Finally,
Section 6 concludes this work.
2. Related Work
DL was demonstrated to be effective in a variety of imaging tasks spanning semantic segmentation, object detection, etc. Inspired by these achievements, more recently, DL has been progressively applied in medical applications, such as pneumonia detection, localization, and segmentation from chest X-rays. This in turn shows that DL can be used to help and automate preliminary diagnosis, which is of enormous importance to the medical profession.
2.1. Deep Learning for COVID-19 Screening
The literature contains a lot of studies for the screening of COVID-19 from different modalities of medical images, among them the lung ultrasound gains the least research attention despite its demonstrated promise for screening and follow-up diagnosis. For example, Born et al. [
19] proposed a convolutional model, called POCOVID-net, which is dedicated to identifying COVID-19, healthy, and bacterial pneumonia from lung ultrasound frames and videos. The POCOVID-net was accompanied by a class activation map (CAM) as an interpretability technique for localizing the spatiotemporal pulmonary manifestations, which are regarded as valuable for human-in-the-loop circumstances in medical studies. Similarly, Diaz-Escobar et al. [
20] applied many pre-trained models (i.e., VGG19, InceptionV3, Xception, and ResNet50) to finetune them on lung ultrasound frames to detect COVID-19 and pneumonia patients. Awasthi et al. [
21] presented a lightweight convolutional model, termed Mini-COVIDNet [
21], for detecting COVID-19 from ultrasound images, where the model can be deployed and used in resource-constrained applications making it ideal for a point-of-care situation. The Mini-COVIDNet was trained to optimize focal loss function to lessen the impact of class imbalance. Moreover, Frank et al. [
22] proposed a DL framework that combines domain knowledge into deep networks by feeding anatomical representations and ultrasound artifacts as an extra channel comprising vertical and pleural artifact masks in addition to original lung ultrasonic frames. They claimed that the direct inclusion of this domain knowledge enables the deep networks to achieve different diagnosis tasks using ultrasonic imagery quickly and efficiently. Additionally, the framework was enabled to learn from both convex as well as linear probes and it shows good performance on the COVID-19 severity assessment task, as well as the semantic segmentation model. In addition, Muhammad et al. [
17] proposed screening COVID-19 from ultrasound images using a lightweight convolutional model of consisting of five major building convolutional blocks with a small number of trainable parameters. Then, the feature maps from each block are fused to generate a representation vector to be fed into a fully connected layer (FCL), where the final decision is made.
Moreover, Marco et al. [
23] presented a DL system for screening COVID-19 from ultrasound data using a pre-trained and residual convolutional model, which is trained (using transfer learning and data augmentation techniques) to quantify the severity of infection as well. In another approach, Xue et al. [
24] developed a multimodal approach for assessing the severity of COVID-19 from two types of modality data (ultrasound data and clinical information), where a dual-level supervised multiple-instance learning was applied to combine the zone-associated features and patient-associated representations from heterogeneous training data, hence resulting in discriminatory features. The model aligned the two modalities using a contrastive learning module while maintaining the discriminatory representations of each of them. Furthermore, Roy et al. [
15] proposed a spatial transformer network, that concurrently forecasts the degree of severity of COVID-19 in ultrasound frames and localizes pathological artifacts in a weakly supervised manner. The authors also developed a lightweight technique for the efficient aggregation of scores of frames at the video level.
2.2. Explainable Medical Image Analysis
With the increased acceptance of DL solutions in medical image diagnosis, explainability becomes an inevitable requirement to effectively use these solutions in real-world healthcare. To this end, many studies have recently emphasized developing explainable models for COVID-19 screening. For example, Wu et al. [
25] proposed a multi-task DL framework that jointly classifies COVID-19 and segment infections from a CT scan with the main aim of using the segmentation results to provide an explanation for the screening decisions. In a similar way, Wang et al. [
26] proposed a joint learning framework, called DeepSC-COVID, for the screening and segmentation of COVID-19 lesions from 3D CT scans. In particular, the DeepSC-COVID model is composed of three sub-networks, namely the cross-task feature sub-network, segmentation subnetwork for segmenting 3D COVID-19 lesions, and classification subnetwork for identifying COVID-19, pneumonia, and non-pneumonia cases. The latter one contains a multi-layer visualization method to produce evidential masks that include tiny and imprecise lesions for making the task screening of COVID-19 explainable. During the training of DeepSC-COVID, a task-aware loss was developed based on our visualization method for effective collaboration between classification and segmentation. Though the integration of segmentation and classification tasks in the single model help provide an explainable diagnosis, it makes the model very complex and has a very large number of parameters. In addition, Shi et al. [
27] presented an explainable attention transfer model network to automatically screen COVID-19 from chest X-ray and CT scans, which consisted of a teacher model and a student model. The former models the global representation and uses a deformable attention module to distill the infection lesions to intensify the reaction to lesions and restrain noise in unrelated areas with an extended reception field. Next, an image fusion unit was proposed to integrate attention knowledge transmitted from teacher to student with the necessary representations in the original input. The student model was designed to concentrate on sporadically formed lesion areas to learn discriminatory features. In [
28], the Gradient-weighted CAM (Grad-CAM) algorithm was employed for debugging the convolutional models to provide explainability of its classification decision in chest X-rays.
3. Research Methodology
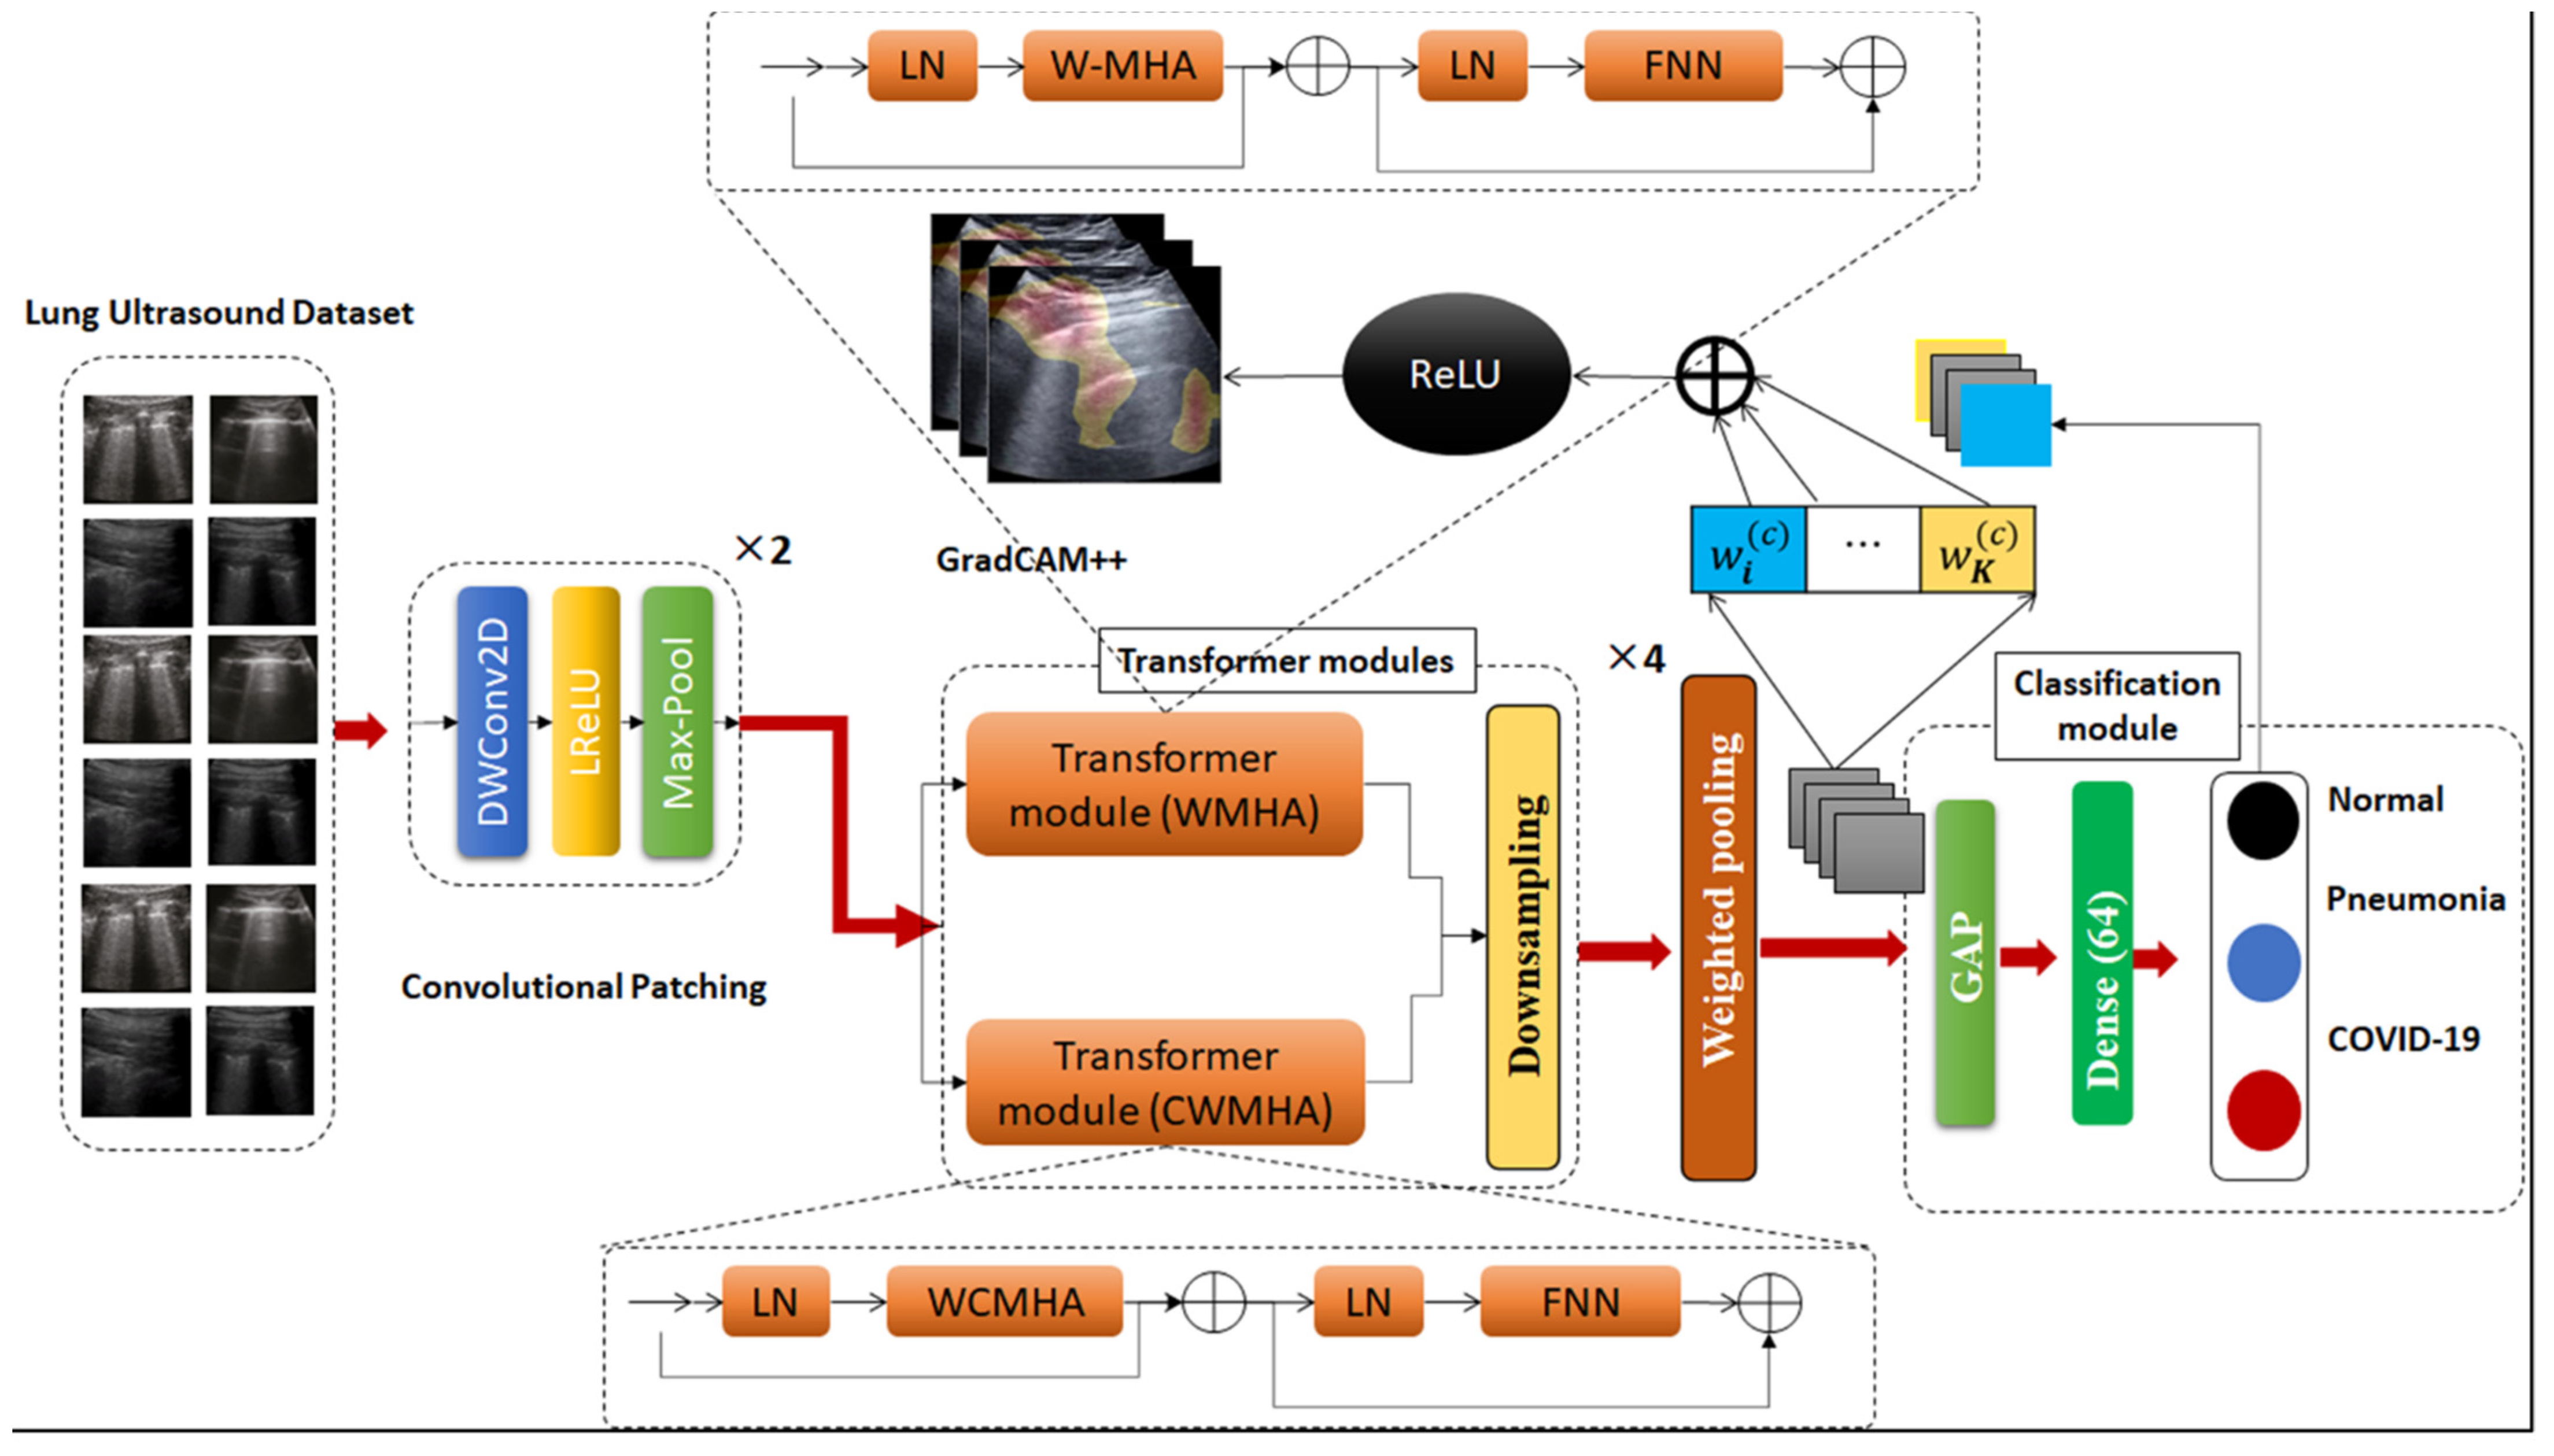
This section introduces and discusses the proposed framework for screening COVID-19 from lung ultrasound data. To obtain a better interpretation of the proposed framework, an illustration of its structural design is presented in
Figure 1. As observed, the proposed framework consists of six main building modules and we are going to dive into the details of each of them in the next subsections.
3.1. Convolutional Patching
The conventual language Transformer was designed to accept input in form of a one-dimensional sequence of token embeddings. This seems inappropriate when dealing with 2D ultrasound frames, therefore the input frame
is reshaped into a sequence of compressed 2D patches
, whereby
represents the spatial dimensions of the original frame,
represents the number of channels,
denotes the spatial dimensions of each patch, and
denotes the number of patches (it is calculated as follows
, denoting the length of the input sequence of Transformer modules. Each of these modules utilizes a fixed size latent vector
, hence, the generated frame patches are mapped to
dimensions through learnable linear projection, as shown in Equation (1).
where the generated output
of this projection can be referred to as patch or token embeddings. The patch embeddings were supplied by one-dimensional position embeddings
to preserve spatial pathological information in ultrasound frames.
To establish an inductive bias in the proposed model, the standard image patching, as well as token embedding, are replaced with a straightforward convolutional module. The design of a convolutional module consists of a depth-wise convolutional layer
activated by LeakyReLU (
) function and followed by a max-pooling layer. In doing so, the above formula can be formulated as:
where the
layer contains a number of
filters, equal to the embedding dimension in Equation (1). Two convolutional modules are stacked to generate convolutional patching. This convolutional patching makes the model more flexible and simpler than the standard vision transformer. In particular, the convolutional modules are introduced to embed the input ultrasound frames into a latent representation, which is more efficient for modeling pathological information in subsequent layers. Variations in the size of image size do not have an effect on the number of parameters but impact the length of the sequence and consequently the required computing. Even though the standard patching operation necessitates that the dimensions of input frames be dividable by the size of the patch. The convolutional modules enabled the model to accept input of various sizes of data with no requirement for clipping or padding as it alleviates the necessity of uniformly partitioning an image into patches. Another advantage of the proposed model lies in the fact that convolution and max pool layer could be overlapping, enabling the sequence length to become increased but conversely, improving screening performance by infusing inductive bias. Obtaining these convolutional patches enables the model to hold the local spatial pathological information eliminating the need for positional embedding as it achieves a very decent performance.
3.2. Transformer Modules
The project sequence of embeddings are then passed to a stacked transformer module. Each of these modules consists of alternating layers of multiheaded self-attention (MHA) and Feed Forward Network (FNN) blocks.
The traditional self-attention (SA) [
29] attention layer is commonly used to calculate the attention score for each head on a global receptive field, leading to quadratic computations in terms of the number of tokens, which makes it inappropriate for ultrasound frames/videos that require a huge set of tokens for modeling pathological information. To address that, window-based or local SA is adopted to calculate SA for local windows, where windows are disposed to uniformly divide the image in a non-overlapping way. Given that the window includes
non-overlapping patches, SA is computed locally within the window.
For each instance in patch embedding
, a weighted summation is calculated for all values
in the sequence. Then, the attention scores are calculated according to pairwise correspondence between two embedding elements and the corresponding query
and key
representations.
where
represents the attention head;
represent the query, key, and value matrices;
denotes the query/key dimension,
represents the number of window patches and
represents the relative position bias [
16].
The MHA is an expansion of the above calculations by calculating the SA for multiple heads concurrently and then concatenating the output of each of them, and later projecting this concatenation in FFN.
Layer norm (LN) is applied at the beginning of each module, while the residual connection is applied to the MHA and FNN layers in each module.
By calculating window-based SA, the computational complexity of a global MHA and a window-based MHA (WMHA) over an image containing
patches are formulated as follows:
where the first formula is quadratic with respect o the number of patches
, and the other formula is linear when
is constant. Therefore, the global SA calculation is mostly unreasonable for a large number of patches, while the local SA is usable. However, local SA does not have connections among windows, limiting its representation power [
16]. As a remedy, the network requires the application of cross-window connectivity while retaining the effective calculation of non-overlapping windows. This is achieved by designing two parallel transformer modules, one uses WMHA and the other use cross-window-based MHA (CWMHA). Mathematically speaking, the flow of information in the first transformer modules could be formulated as follows:
In a similar way, the flow of information in the other transformer module is calculated as below:
Like language models [
30], a trainable embedding was prepended to the sequence of embedded patches
, whose status at the output of the transformer modules (
) serves as the frame/video representation
, as shown in Equation (4).
During either fine-tuning or pre-training, the classification module accompanies the . The classification module is implemented with FNN composed of a single hidden layer.
3.3. Down-Sampling Module
In order to generate a hierarchical representation, the number of tokens is reduced by down-sampling modules, introduced to reduce the number of tokens as the depth of the network increases. In the earlier patch-merging module, the features of each set of g × g neighboring patches are concatenated and then passed to a convolutional 1 × 1 layer. This way, the number of tokens is decreased by a multiple of g × g (i.e., down-sampling), and the dimension of the output is turned into 2C. The same process is applied after each transformed module and by the end, the stacked modules jointly generate a hierarchical representation with the same dimensions as the feature map generated from standard convolutional networks.
3.4. Weighted Pooling
To encode the sequential outcomes into a singular class index, rather than applying a class token (as commonly performed in common transformer networks), the proposed model presents a weighted pooling layer. Simply, the outputs of the transformer modules are pooled over the whole sequence of data because they include appropriate representation across various sections of the ultrasound frames. Mathematically speaking, the sequential pooling operation can be declared as the mapping function
given as:
where
represents the feature maps generated from
-th of the transformer module and
,
,
denote the size of the mini-batch, length of the sequence, and embedding dimension. Hence,
maps are passed to a linear layer with
activation to generate the following:
Following this, the obtained probability scores are used to calculate the pooled output as follows:
The design of weighted pooling enables the model to score the sequential embeddings of latent representations generated from transformer modules and robustly relate data throughout the input data. This behavior is similar to the process of attention to sequential data. This pooling layer can be implemented in either trainable or non-trainable manner; however, the latter case is more efficient for the reason that every embedded patch includes a different quantity of entropy. Accordingly, the network is capable of assigning higher scores to input patches that comprise more pathological information valuable for the screening of pneumonia or of COVID-19. Furthermore, the weighted pooling enables the model to improve by using information from heterogeneous sources.
3.5. Classification Module
Given the output of the weighted pooling, the model calculates the final screening decision in the classification module consisting of two fully connected layers, the first with 64 neurons and containing three units corresponding to three classes, i.e., COVID-19, pneumonia, and normal. The last layer is normally activated with SoftMax activation. The parameters of the model-optimized categorical focal loss (SFL) function [
31] help lessen the impact of class imbalance on the final classification performance.
The hyperparameter enables fine-tuning of the weight of various samples. If , this signifies the categorical cross-entropy. Given a higher value of , a small set of simply categorized ultrasound frames participate in calculating the training loss, while frames belonging to the minority class are assigned a higher weight. represents a balance factor.
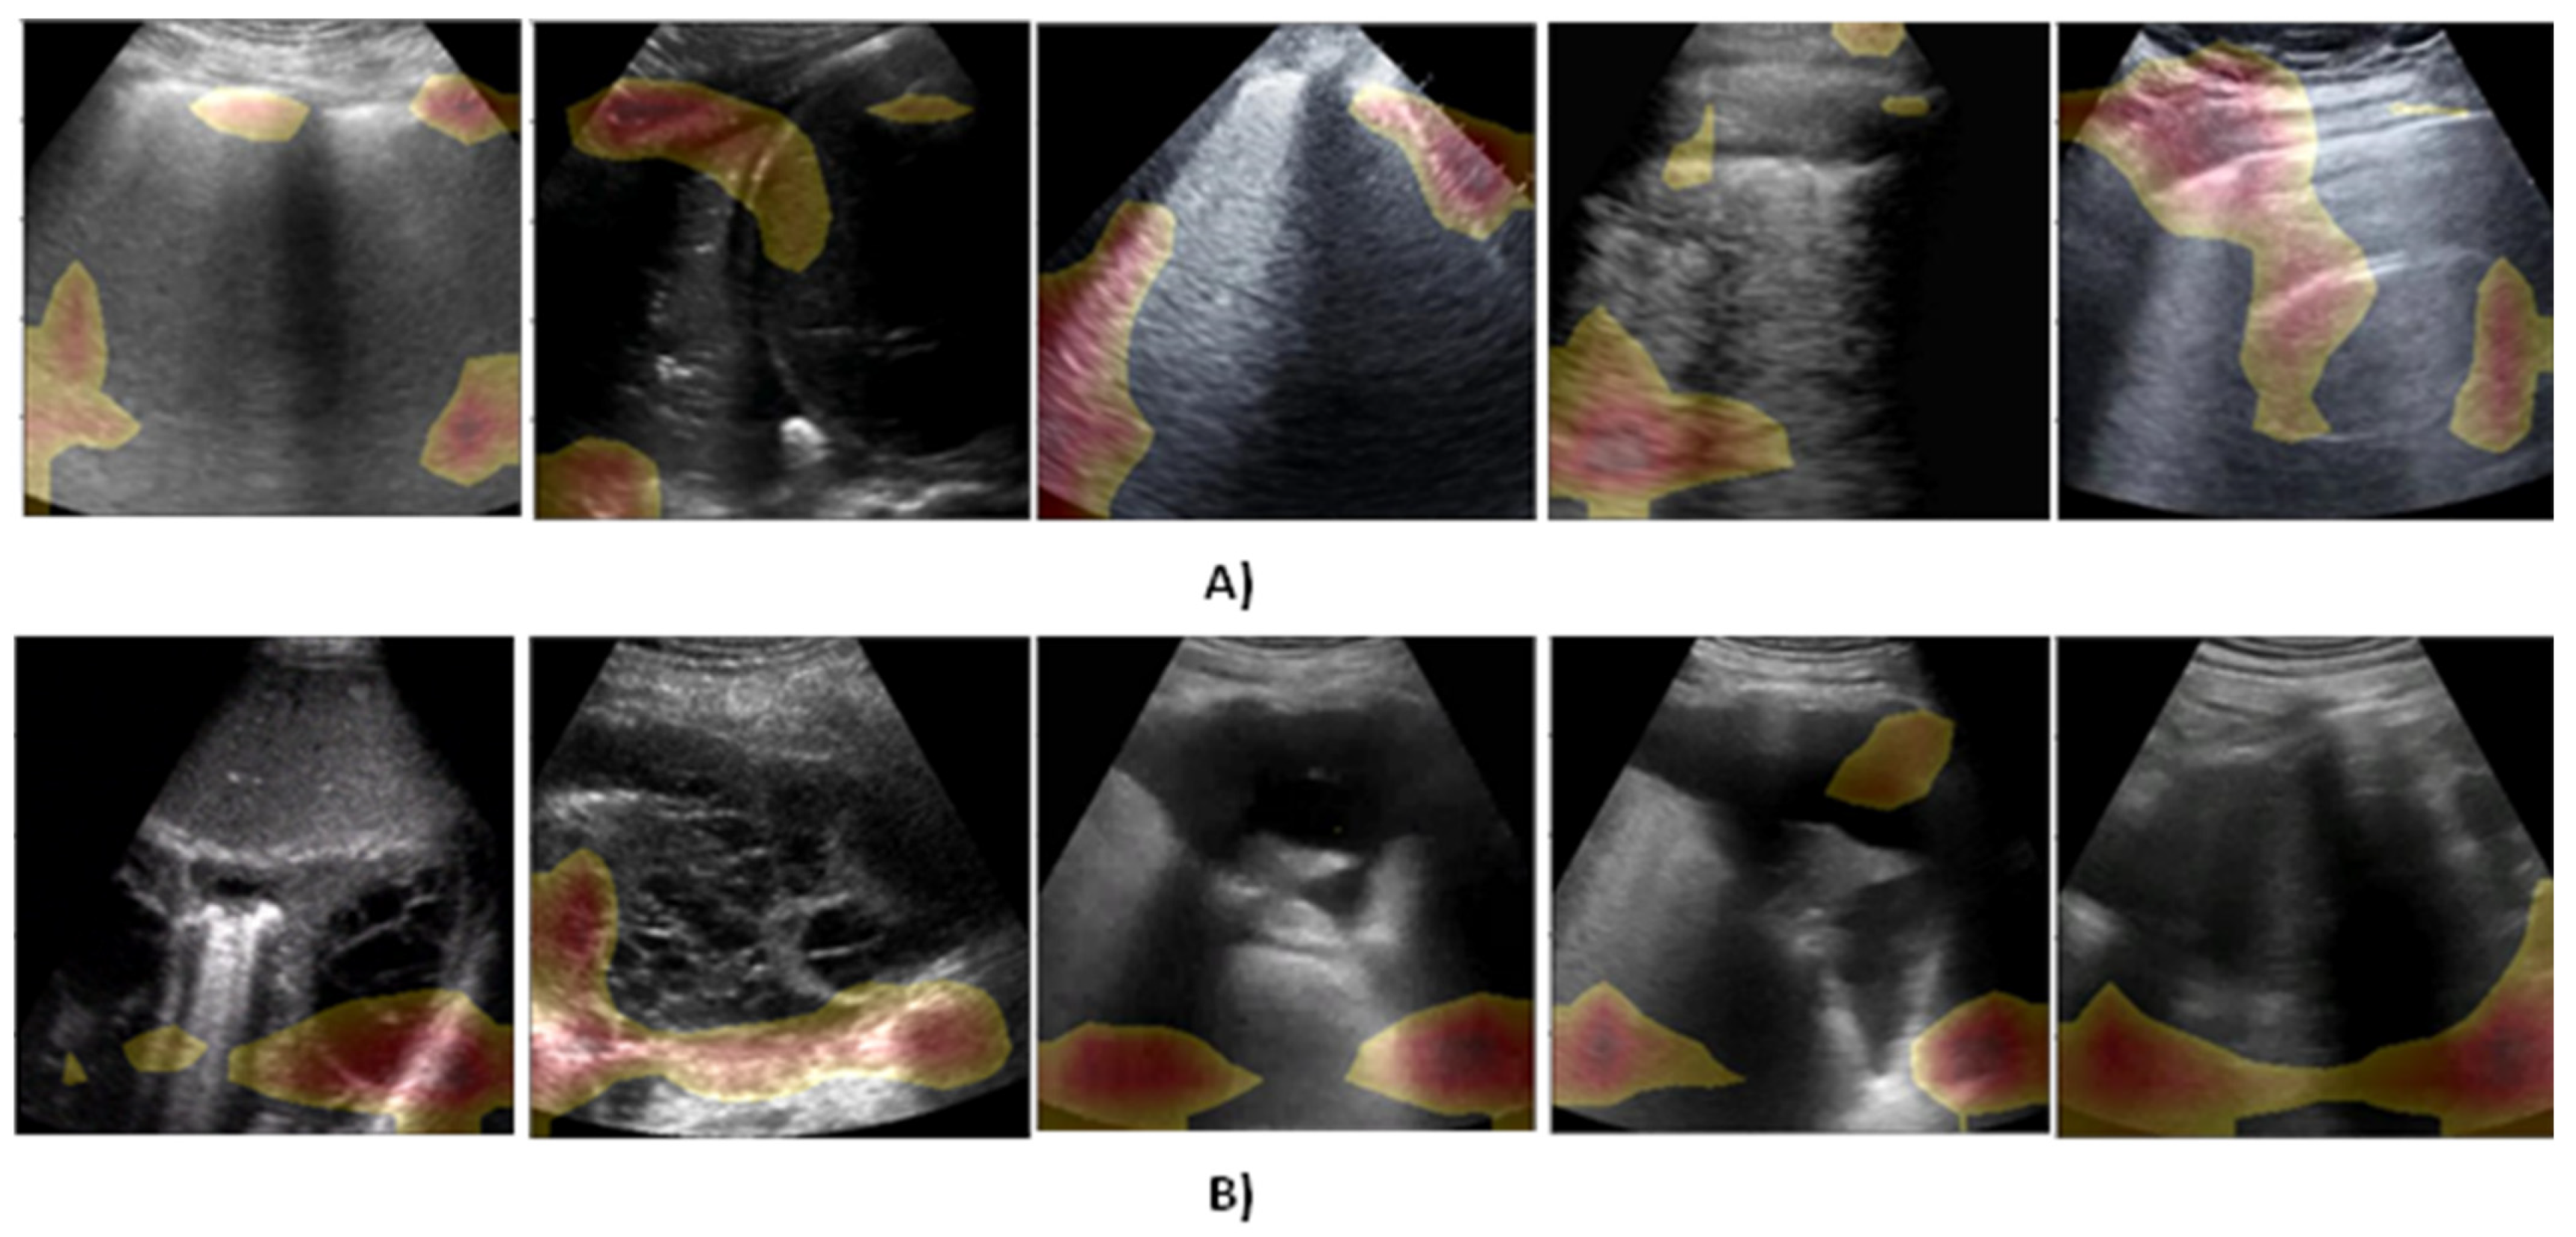
3.6. Explainability Module
When it comes to explaining the DL model, CAM is a popular approach for generating an activation map for every input sample signifying pixel-wise donation to the decision, or disease type in our case. The discriminative ability of CAM stems from the fact that it generates class-aware activation maps offering more analysis at the class level. However, CAM suffers from primary limitations that it adds to the Softmax layer, hence, performing re-training, which might cause the performance to degrade [
32]. Grad-CAM++ [
18] is integrated to calculate activation maps with no modification to the DL model. They also require a weight matrix to bring together feature maps. This could be accomplished by initially estimating the gradient of a given class with respect to each feature map and then applying global average pooling on the derivatives to obtain a weight matrix. This way, Grad-CAM++ prevents adding up additional layers, thereby eliminating performance degradation and re-training problems. The calculation of weights
in Grad-CAM++ can be formulated as follows:
where
represent the model estimated probability for class
immediately prior to the SoftMax layer and
represent weighting factors for class-specific pixel-wise gradients calculated as follows:
where
and
represent the iterators over the same activation map
and were applied to evade disorientation. The final saliency map can be calculated as follows:
where
is the activation of node
in the intended network layer at the location
.
4. Experimental Design
This section defines the design settings of proof-of-concept experiments in terms of implementation setup, evaluation metrics, and the dataset adopted for training and evaluations.
4.1. Implementation Setup
To set up the experimentations in this work, a TensorFlow 2.6 running over Python 3.8 virtual environment is employed for implementing the deep models. All experiments are performed on a Dell workstation armed with RAM (256 GB) and CPU (Intel ® Xe®(R) CPU E5-2670 0@ 2.60 GHz). The training of that models was accelerated by NVIDIA Quadro graphical processing unit (GPU). All the experiments are performed using five-fold cross-validations strategies.
4.2. Evaluation Metrics
For evaluating the detection performance of the proposed method and the competing ones, a set of popular multi-class classification metrics calculated as a function of false positive (FB), false negative (FN), true negative (TN), and true positive (TP) samples are opted for and defined as follows:
Beyond the above metrics, the Area Under the Curve (AUC) is adopted to assess the detection capability of the model.
4.3. Data Description
To train and evaluate the proposed method, a public and open-source LUS dataset is used, which is known as the POCUS dataset. The dataset consists of image and video samples belonging to three classes of infection, namely COVID-19, viral pneumonia, and bacterial pneumonia, in addition to samples from healthy individuals. The dataset contains a total of 261 recordings (202 videos + 59 images) captured from a total of 216 patients with either linear or convex probes. The distribution of samples across different classes is given in more detail in
Table 1. Linear probes have high frequency, leading to a superior resolution that enables improved investigation of irregularities near the pleural line [
22]. However, the linear probe penetrates the lung tissue less than the convex probe, which could make it hard to tell the difference between B-line artifacts (a major lung artifact) and hidden tissue. The images and videos in the POCUS dataset were aggregated from a variety of sources, such as clinical data obtained from academic ultrasound courses, hospitals, scientific publications, public medical repositories, and health-tech corporations. The complete details of different sources of data in the POCUS dataset can be found in reference [
19]. The COVID-19 cases were confirmed by RT-PCR. The dataset is supplemented by a comprehensive metadata file encapsulating the anonymized patient identifier, source URL, source identifier, sex, age, symptoms, pathological manifestations, video frame rate, image resolution, and the total of frames per video. The length and type of videos are a varied (160 ± 144 frames) dataset, whereas they have a frame rate of
Hz. Outstandingly, all samples in the dataset were reported to be revised and confirmed by one medical expert with more than 10 years of clinical experience and an academic instructor.
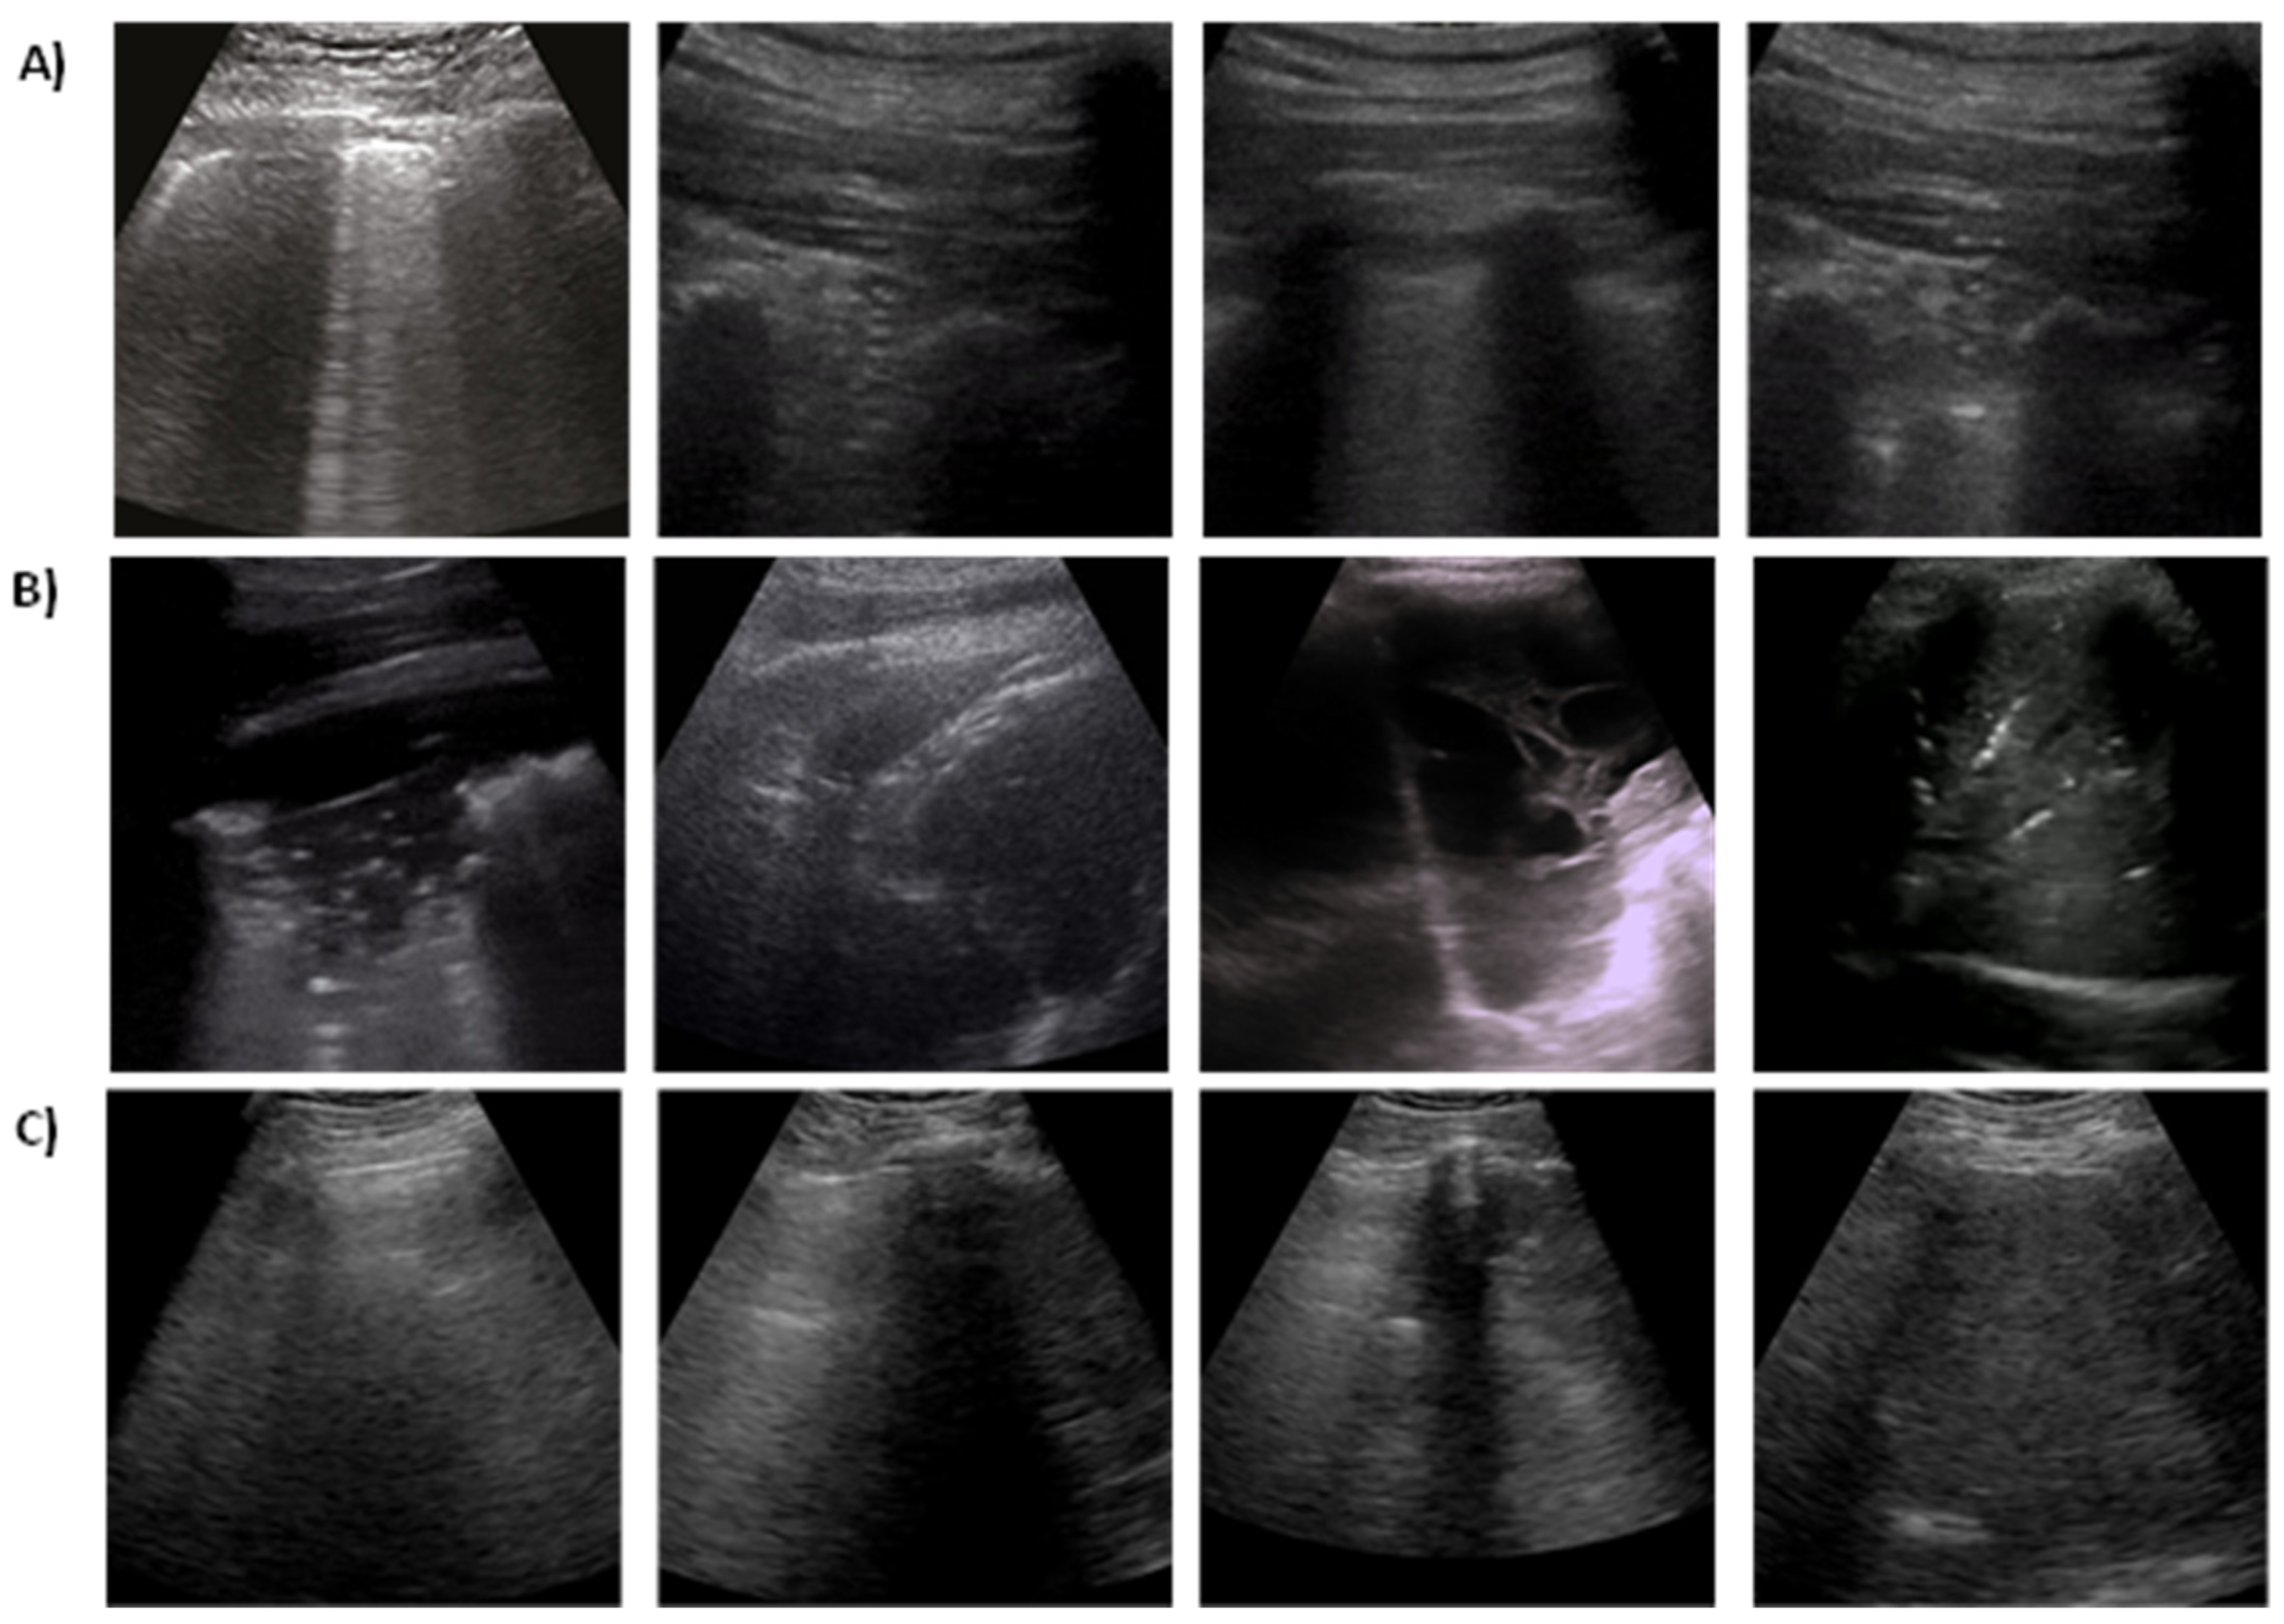
Figure 2 shows some examples of 2D ultrasound frames for COVID-19, pneumonia, and healthy patients.
4.4. Data Preparation
As the usual step in developing a DL solution, data need to be pre-processed before going to the training stage. In this regard, the convex ultrasound probes are used for training models in all experimentations. Owing to the small number of samples belonging to the viral pneumonia class (3 convex videos), the data are pre-processed by eliminating the data of that class and the training is performed using only the other three classes. Moreover, all convex ultrasound samples (179 videos and 53 images) were physically pre-processed by dividing the videos into separate images at a 3 Hz frame rate (i.e., maximum of 30 frames per video) resulting in a dataset comprising a total of 1204 COVID-19 images, 704 bacterial pneumonia images, and 1326 images of normal cases. Moreover, the generated image samples are cropped into a quadratic window, eliminating artifacts, ration bars, and text, and then they are resized into 224 × 224 pixels. Different from hold-out testing data, all the presented stated results in this work are attained from five-fold cross-validation stratified by the count of examples in each class. The image samples were divided at the patient level; therefore, it is guaranteed that the frames of one video are existing only per one-fold and that the number of videos per class is almost the same for all folds. All models were trained to classify images as COVID-19, pneumonia, and non-infected. Furthermore, the data were augmented by applying image flipping, rotations and translations (up to 10%, which in turn differentiate the data and help avoid overfitting).
6. Conclusions and Future Work
This work presents a lightweight and explainable convolutional transformer model for the efficient screening of COVID-19 from ultrasound data. The representation power of the model is further improved by convolutional patching and parallel window-based transformation modules. The findings demonstrate that the proposed solution considerably improves COVID-19 detection performance with high information compactness, meaning that it achieves both efficiency (high detection accuracy) and effectiveness (a small number of trainable parameters). Beyond and above this, the classification decisions obtained from the proposed solution can be visually explained so they can be easily interpreted and trusted by medical staff. These competitive advantages of the proposed solution render it a candidate for improving the quality of ultrasonic diagnosis in smart healthcare systems during and after the pandemic.
This work can be extended in three ways in the future. First, in coping with the sustainable development strategy in Egyptian Vision 2030, the proposed solution will be extended to be provided as a sustainable diagnosis service/system that can be collaboratively trained using ultrasound data from different Egyptian hospitals. By doing so, the Egyptian Ministry of Healthcare will have great management of COVID-19-like pandemics with automated, efficient, interpretable, and effective tools. Second, the proposed solution will be extended to take advantage of 5G and B5G communication to deliver the patients’ data and corresponding diagnosis decisions in real time. This direction will specifically focus on the responsiveness of our system as an essential requirement of the sustainability of the Egyptian healthcare system. Third, the proposed solution will be extended to learn from different modalities of data to improve the quality and functionality of COVID-19 diagnosis in the healthcare system.

 and
and 


