
Strategic Licensing of Green Technologies to a Brown Rival: A Game Theoretical Analysis

School of Economics and Management, Nanjing University of Science and Technology, Nanjing 210094, China
*
Author to whom correspondence should be addressed.
Mathematics 2022, 10(23), 4433; https://0-doi-org.brum.beds.ac.uk/10.3390/math10234433
Submission received: 8 November 2022
/
Revised: 23 November 2022
/
Accepted: 23 November 2022
/
Published: 24 November 2022
(This article belongs to the Special Issue Mathematical Modelling and Optimization of Service Supply Chain)
Abstract
:This paper studies a green manufacturer’s strategic licensing of its green technology to a brown rival under the consideration of the green manufacturer’s environmental concerns. Consumers in the market have green awareness. Adopting the green technology not only helps manufacturers to reduce carbon emissions, but also to increase market sizes. The green manufacturer can choose from three technology licensing strategies, i.e., no licensing (N), royalty licensing (R) or fixed-fee licensing (F). The equilibrium licensing strategy can be derived by comparing the respective payoff after adopting the three strategies. It is found that the green manufacturer should choose fixed-fee licensing strategy when the market size expansion effect is strong, and the competition intensity is moderate; otherwise, the green manufacturer should choose royalty licensing strategy. Furthermore, it is found that when the green manufacturer is more concerned about environmental impacts, it will be more willing to choose fixed-fee licensing strategy, rather than royalty licensing strategy. Through numerical tests, some interesting results are also found. For example, the brown manufacturer might be hurt even if the cost reduction effect of technology licensing is relatively stronger. Moreover, it is found that consumer surplus and social welfare nonmonotonically change with the substitution level. In summary, this research tries to provide some guidelines to the industry and the society on better managing green technology diffusions.
Keywords:
green technology licensing; environmental concern; competition; consumer surplus; social welfareMSC:
91A121. Introduction
With the sustained development of economy, environmental problems, such as energy over consumption or carbon emission, of the industry and the society has increased substantially at the same time. Despite the impacts of the COVID-19 pandemic, the global monthly peak amount of carbon emission rose by 417.2 parts per million in May 2020 [1]. The environmental problems pose a great threat to not only the global ecological environment, but also hinder the health and sustainable development of society and economy. As Pimentel et al., suggested, about 40% of world deaths are caused by environmental degradation [2]. Furthermore, in 2010, the pollution in China cost about USD 227 billion to the Chinese economy, which accounts for 3.5% of the gross domestic production [3]. Developing green economy is becoming a common responsibility of all mankind. Under the advocacy of international organizations and national governments, green and environmental protection have gradually become two major themes of today’s social development.
The deeper problem of sustainable development lies in the change of production mode and business philosophy, which depends on the renewal and iteration of technology and the upgradation of industrial mode to balance economic development and natural environment protection. Many manufacturers are investing in green technologies so that they can produce low-carbon products with greener processes to gain competitive advantages. For example, Lenovo has developed a kind of low-temperature solder manufacturing process which helps to reduce 35% carbon emissions compared to traditional manufacturing processes [4]. In Europe, about 900 firms have spent over EUR 125 billion in low-carbon technology research and development [5]. However, in actual operation, only a few firms have the key technologies of energy conservation or environmental protection. Taking new energy vehicles as an example, the solution to the problem of battery capacity and endurance is the core technology of leading enterprises, and this technical barrier is one of the key factors that affect energy conservation and environmental protection of enterprises.
Licensing of green technologies is a possible way to solve this problem, and it is also a scheme advocated by governments all over the world. In business practice, by green technology licensing, licensees can obtain such technologies, which help them to reduce environmental pollution or energy consumptions, and to achieve their goals of revenue gain and social responsibility improvement at the same time [6]. Furthermore, as licensors, green technology licensing can make up for the early R&D investments and improve the revenues by charging licensing fees.
However, in a competitive environment, although green technology licensing helps to improve environmental performance, it might not always be economically beneficial for the licensors. The reason is that licensing core green technologies might create powerful rivals that cannibalize their initial market shares. Therefore, the research question arises that
- (Q1) When should a manufacturer license the green technology to its rival under the consideration of both economic and environmental benefits?
According to technology licensing practices and theoretical researches, the licensors (the manufacturers who have the green technology) can either offer Royalty contracts or Fixed-fee contract to licensees (the manufacturers who do not have the green technology). In royalty licensing, the licensee (brown manufacturer) should pay a unit fee of all the products that produced by the licensor’s (the green manufacturer’s) technology, while in fixed-fee licensing, the licensee only needs to pay a lump-sum fee to the licensor and obtain the green technology. Therefore, two additional research questions arise that:
- (Q2) If technology licensing becomes an option, how to design the licensing contract, including the contract type (R or F) and licensing fee?
- (Q3) How will technology licensing affect the coopetition relationship between the licensors and licensees?
To answer the above research questions, game theoretical models are established for the three cases. The research findings can be summarized as follows. First, in this paper, it is found that technology licensing is always profitable for the green manufacturer. Second, comparing the two technology licensing contracts of F and R, it is found that higher cost saving effect, market expansion effect or environmental concern will incent the green manufacturer to implement strategy F. Otherwise, it is better for the green manufacturer to choose strategy R. Additionally, it is found that the impacts of competition intensity on the strategy choice is nonmonotonic. Only when competition intensity is moderate, will the green manufacturer implement strategy F; otherwise, for very high or very low level of competition intensity, strategy R will be chosen. Third, the sensitivity results of critical parameters on manufacturers’ payoff, consumer surplus and social welfare are presented. It shows that more intense competition always hurts the green manufacturer, however, it may benefit the brown manufacturer when the technology licensing strategy switches from R to F. It also interesting that the maximum of consumer surplus or social welfare appears for moderate levels of substitution level.
This research aims to provide some guidelines to firms in the green product market about their green technology licensing strategies. The rest of the paper is organized as follows. In Section 2, the relevant prior literature is discussed. Section 3 develops the base model. In Section 4 and Section 5, the manufacturers’ equilibrium decisions and social welfare are analyzed, respectively. Section 6 summarizes the theoretical contributions of this paper. Section 7 concludes the paper, including the managerial implications and future research directions.
2. Literature Review
The research involves three research streams, namely, Coopetition strategies, Technology licensing, and Selling of green products.
2.1. Coopetition Strategies
Coopetition denotes a relationship between entities that compete and cooperate with each other at the same time. It appears in various management fields, such as outsourcing decisions [7,8], strategic alliances [9,10] and supply chain operations [11,12,13]. Take the automobile industry as example, [14,15,16,17] has investigated the external and internal driven forces of the coopetition between FV and NEV under the impacts of dual-credit policy. Among the factors, they demonstrate that the FV’s negative credits pressure acts as the external driven force, while the technology R&D initiatives act as the internal driven force.
In addition, the advantages and disadvantages of coopetition strategies for participating firms, and the optimal choice of coopetition strategy have been investigated by scholars [18]. Venkatesh et al., show that, among three distribution strategies, co-optor strategy performs the best for manufacturers of proprietary component brands [19]. Chen et al., present the impacts of production substitution and interfirm power relationship on the optimal coopetition strategy for two manufacturers [20]. This paper regards horizontal green technology licensing as a type of coopetition between a green manufacturer and a brown one, which is different from the existing literature on coopetition theories.
2.2. Technology Licensing
The Second stream of literature is technology licensing strategies in supply chains. In existing literature, firms often face the trade-off on expected revenues and associated costs when determine whether to license their technologies. On one hand, technology licensing generates a channel of profit of licensing fee, however, on the other hand, licensing its technology will create another competitor and may cannibalize their market shares. How to deal with the trade-off is the main problem for firms when they determine the licensing strategies [21,22]. In the existing literature, an important decision for licensors is to design the technology licensing contracts. The contract types are varied, such as fixed-fee contract, royalty contract or two-part tariff contract. Many scholars have carried out research on the difference between different types of technology licensing contracts. Wang shows that when licensors participate in product competition, the fixed-fee contract is superior to the royalty contract when they have competitive market advantages over licensees [23]. A large number of scholars have done extensive research on the basis of [23] and verified the above conclusions. For example, Faul-Oller extended the product competition model to the price competition model [24]. Wang extended the homogeneous product model to the differentiated product model [25]. Kamien and Tauman established a technology licensing model with multiple licensees [26]. Heywood et al., introduced asymmetric information into the model [27].
In addition, many scholars also considered other factors, such as technology imitation behaviors, technology innovation degree, on the licensing contract design. Rockett studied the optimal technology licensing strategy in duopoly market. He found that in industries where imitation cost is lower and products are easier to imitate, fixed-fee licensing is dominant [28]. Kabiraj shows the impacts of technological innovation degree on the choice of licensing contracts among fixed-fee, royalty and auction [29]. From the above literature, it is found that most of the existing literature focuses on the research of normal technology licensing, while it has not analyzed the environmental benefits that generated by green technologies. Therefore, this paper tries to enrich the existing literature on technology licensing by considering the greenness property of the technology.
2.3. Marketing of Green Products
In recent years, more and more consumers are changing their consumption behaviors when facing the rising environmental issues in society. They are becoming more willing to purchase green products, which encourages firms to produce and sell eco-friendly products. In this stream of literature, scholars mainly concentrate on the studies of green products selling strategies considering consumers’ environmental awareness (CEA), which help to improve firms’ profits and social welfares. Some scholars have introduced consumer preference into the competition model of green and non-green products to study the influence of CEA. For example, Conrad constructed a duopoly model with greenness differentiation to analyze how CEA affects the pricing, product characteristics and market share of competing firms. The results show that the market share of green products increases with the enhancement of CEA. However, as the green products’ production cost increases, the market share will drop [30]. Roberto analyzed the influence of different types of consumers on product sales and environment impacts in a duopoly competition model. It shows that the enhancement of CEA may lead to the increase of non-green products sales, and surprisingly generate negative environmental impacts [31].
In addition, some scholars have studied other aspects of market competition of green products. Zhang et al., analyzed the coordinated pricing strategy of green and brown manufacturers in two production modes: cooperative games and non-cooperative games. The results show that the system performance of a cooperative game is obviously better than that of a non-cooperative game [32]. Zhu and He analyze the impacts of important factors, including green product type, supply chain structure and competition type, on product greenness design [33]. From the above literature, it is found that at present, the literature on market competition of green products mainly focuses on the problems of pricing and quantity decisions, while how green technology licensing affect the competition and cooperation relationship among competing firms and the corresponding decisions has not been studied, which is the focus of this research.
3. Model Formulation
This paper establishes a game model with two competing manufacturers who produce and sell substitutable products in the same market. The key difference between the two manufacturers’ products lies in their levels of production technology. Without loss of generality, it is assumed that Manufacturer 1 has a kind of green technology, while Manufacturer 2 does not have such a technology. This corresponds to the fact that some powerful manufacturers have abundant funds to support the research and development of green technologies, while some small manufacturers’ funds are not enough, and they have no such ability to develop their own green technologies.
The adoption of such a green technology affects the manufacturers in two ways. Firstly, it has impacts on manufacturers’ unit production costs. Adopting green technology may help to save unit production costs. For example, a brown manufacturer needs to pay for carbon emission tax if green technology is not implemented, while a green manufacturer can save such tax payment. Without loss of generality, it is assumed that a manufacturer’s production cost is zero when green technology is implemented, while the production cost is when green technology is not implemented.
Secondly, it has impacts on consumers’ purchasing behaviors. The inverse demand function of manufacturer in the market is formulated as . In the function, is the sales quantity of manufacturer , and represents the substitutability of the two manufacturers’ products [34,35,36,37]. It also denotes the competition intensity between two manufacturers. Higher means higher substitutability or competition intensity of products produced by two manufacturers. The parameter of represents the potential market size for manufacturer . According to the relevant literature, green products have stronger market effect, that is, consumers are more inclined to buy green products than to buy brown products. In this model, adopting green technology generates higher market size, that is, when green technology is not adopted, while when green technology is adopted by manufacturer .
In the market, manufacturer 1 can license the technology to manufacturer 2 to maximize its own payoff. Manufacturer 1 has three choices of licensing.
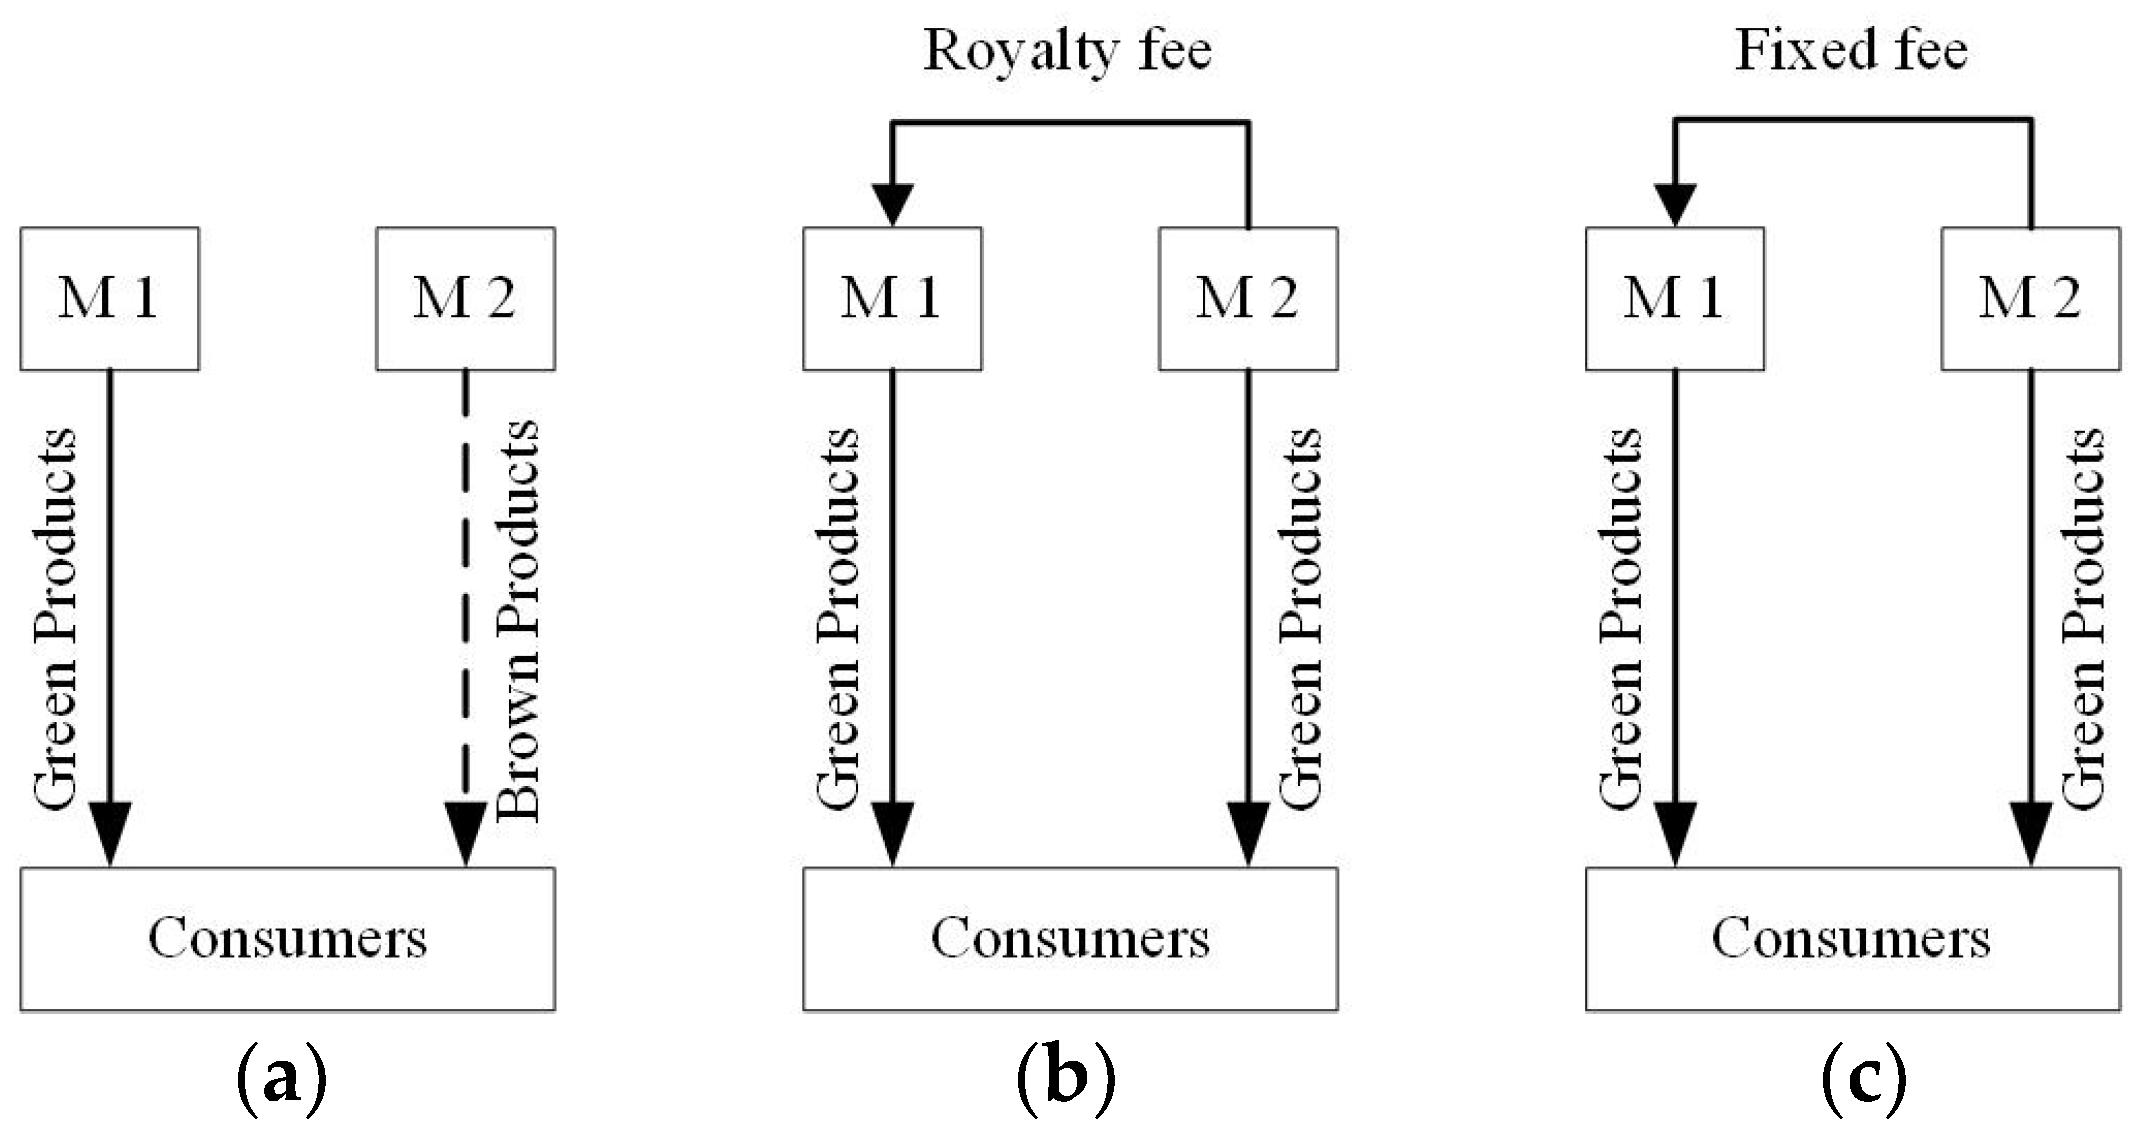
- Firstly, it can choose not to license the technology and maintain its competitiveness of selling green products exclusively. The market sizes for the two manufacturers are . This strategy is denoted as N (a benchmark).
- Secondly, it can license the technology to Manufacturer 2 with a royalty contract. Specifically, with the adoption of a royalty contract, manufacturer 2 should pay a unit fee of to Manufacturer 1 for each sold product that produced by the green technology. The total payment can be expressed as . This strategy is denoted as R.
- Lastly, Manufacturer 1 can also offer a fixed-fee contract to Manufacturer 2. Specifically, Manufacturer 1 only charges a fixed amount of licensing fee , which is independent of the sales quantities. This strategy is denoted as F.
In strategy R and F, manufacturer 2 also enjoys the market size expansion benefit, and the two manufacturers’ market shares can be expressed as . It also enjoys the production reduction benefits, i.e., its production costs drop to zero when green technology is implemented. The supply chain structures for the three cases are shown in Figure 1.
Then, the manufacturers’ payoffs are formulated as follows. Different from previous literature on technology licensing which mainly concentrates on firms’ economic gains, environmental benefits are incorporated into the green manufacturer’s (i.e., manufacturer 1’s) payoff functions. In other words, some leading manufacturers in the industry (such as Tesla) are not only caring about profits, but also about environmental benefits. Therefore, such a dual purpose for Manufacturer 1 is considered in its decision making. However, the brown manufacturer only cares about the maximization of profits, regardless of the environmental benefits.
Then, the environmental impacts of green technology adoption can be measured as follows. Assuming that, a unit green product generates environmental benefits to the whole society, parameter can be treated as the carbon emission reduction amount, or the energy saving amount during the lifecycle of the green products. It can also represent the greenness level of the technology. However, it is assumed that a unit brown product generates zero environmental benefits to the whole society. One may argue that brown products might have negative impacts on the environment. In this paper, to highlight the environmental benefits of green products, the impacts of brown products are normalized to zero for simplicity. In summary, the total environmental impact (positive) can be formulated as , where represents the total quantity of green products that sold to the market in strategy .
Then, Manufacturer 1’s payoff that linked to the environmental benefit is formulated as , . In this formulation, parameter characterized manufacturer 1’s environmental benefit concern level. Furthermore, this formulation denotes that the total environmental payoff is quadratically increasing in the total sales of green products in the whole market (including its rival’s sales quantities). To simplify the analysis and to focus on the analysis on manufacturer 1’s environmental concern, the value of is further normalized to 1. Other values of do not affect the qualitative results in the following analysis. Therefore, the environmental payoff can be simplified as , , which is used in the subsequent sections.
The formulation of both manufacturer’s payoffs in the three scenarios will be expressed and explained in Section 4. The decision sequence of the model as follows:
- First, Manufacturer 1 decides whether to license the green technology to manufacturer 2. If technology licensing is allowed, it further makes decisions on the licensing contract (i.e., royalty or fixed-fee).
- Secondly, the two manufacturers make production and selling decisions at the same time to maximize their own payoffs.
- Lastly, the consumers make purchasing decisions and the market clears.
All the notations throughout the paper are summarized in Table 1.
4. Model Analysis
In this section, first, the two manufacturers’ decisions for the three licensing strategies are analyzed. Second, the equilibrium payoffs are analyzed, and the equilibrium licensing strategy is derived.
4.1. Strategy N: No Licensing
In this strategy, Manufacturer 1 does not license the technology to Manufacturer 2. Therefore, the total sales quantity of green products is . Considering Manufacturer 1’s social responsibility level , the environmental payoff that Manufacturer 1 can gain by selling green products can be formulated as . Considering both the economic and environmental payoffs, the two manufacturers’ payoffs are formulated as follows.
Then, the two manufacturers make quantity decisions of and simultaneously. The results are summarized as follows.
Proposition 1.
When strategy N is adopted,
- (1)
- If , the optimal sales quantities are The corresponding profits are , .
- (2)
- If, the optimal sales quantities are , . The corresponding profits are , . See the proofs in Appendix A.
From Proposition 1, it shows that, in the scenario of technological monopoly, the payoffs of the manufacturers will be jointly influenced by the market size of green products, the substitutability degree of products, the environmental benefit indicator and the production cost . Firstly, it shows the impacts of market size on the equilibrium results. When is relatively small, Manufacturer 2 can enter the market and earn positive profit. However, when is relatively higher, Manufacturer 1 will set a higher sales quantity such that manufacturer 2 cannot enter the market due to its disadvantage of market size. Secondly, it shows that when the competition intensity is relatively small, Manufacturer 2 can enter the market successfully. However, when the competition intensity becomes relatively high, Manufacturer 1 will set a higher sales quantity to drive Manufacturer 2 out of the market. Thirdly, without technology licensing, if Manufacturer 1 is more careful about the environmental payoff, it will set a higher sales quantity to drive Manufacturer 2 out of the market. The reason is that, to maintain a higher level of environmental payoff, Manufacturer 2’s goal is to increase the total sales quantity of green products, while to decrease the quantity of brown products in the market. Therefore, when the parameter of is higher, it will be more aggressive to drive Manufacturer 2 out of the market and achieve higher environmental payoffs. Conversely, when is lower, Manufacturer 1 cares less about the environmental payoffs. Therefore, it gives Manufacturer 2 a chance to enter the market. Lastly, when the brown manufacturer’s production disadvantage is higher, it will be more likely to be driven out of the market when the green manufacturer releases more products to the market, which conforms to intuition.
4.2. Strategy R: Licensing with Royalty Contract
In the case that Manufacturer 1 adopts the royalty licensing strategy, Manufacturer 2 pays a unit fee for its products that using the green technology to Manufacturer 1. At the same time, all the products in the market are green products, and Manufacturer 1’s environmental payoff is not only linked to its own sales quantities, but also linked to Manufacturer 2’s sales quantities. The environmental payoff can be expressed as . Moreover, considering the market size expansion effect, and production cost reduction effect, both manufacturers’ payoff functions are formulated respectively as follow.
Manufacturer 1 first determines the royalty fee . Then, the two manufacturers make quantity decisions of and simultaneously. The results are summarized as follows.
Proposition 2.
When strategy R is adopted,
- (1)
- the optimal royalty fee is .The optimal sales quantities are , .The corresponding profits are , .
- (2)
In Proposition 2, it shows that in the case of royalty licensing, the optimal royalty fee exists, which is determined by the values of market size , substitutability degree and social responsibility level . With simple calculation, it shows that the optimal royalty fee is increasing in and , while decreasing in . This denotes that when the market size expansion effect is strong, or the competition is more intense, Manufacturer 1 is more willing to license the technology to Manufacturer 2 without losing much of its market share, thus protecting its sales profits. However, when the parameter of increases, to induce more production of green products in the market, Manufacturer 1 will set a lower royalty level. In other words, a lower royalty fee reduces Manufacturer 2’s unit product costs and enables Manufacturer 2 to produce more green products, which in turn contributes to Manufacturer 1’s environmental payoffs. Comparing scenario R to scenario N, it is found that both manufacturers’ profits in scenario R are becoming strictly higher. Therefore, it can be concluded that, royalty licensing benefits both manufacturers and result in a “win-win” outcome.
4.3. Strategy F: Licensing with Fixed-Fee Contract
When Manufacturer 1 adopts the fixed-fee licensing strategy, Manufacturer 2 should pay a fixed amount of money to Manufacturer 1, in exchange for the green technology patent. In this scenario, the payment is independent of sales quantities. Like scenario R, in this scenario, all the products in the market will be green and Manufacturer 1’s environmental payoff should be . Moreover, considering the market size expansion effect, both manufacturers’ payoff functions are formulated respectively as follows.
Manufacturers 1 and 2 first negotiate on the determination of the fixed payment . Assuming that, the two manufacturers have equal bargaining power. Then, the two manufacturers make quantity decisions of and simultaneously. The results are summarized as follows.
Proposition 3.
When strategy F is adopted, let
- (1)
- If (Scenario F1), Manufacturer 1’s optimal fixed fee isThe equilibrium quantities are .The corresponding profits are .
- (2)
- If (Scenario F2), Manufacturer 1’s optimal fixed fee is .The equilibrium quantities are .The corresponding profits are , .
- (3)
- and . See the proofs in Appendix C.
In Proposition 3, it shows that under the strategy of fixed-fee licensing, there are also two situations. Specifically, when , and are small, Manufacturer 1 will set a lower fee and Manufacturer 2 can earn positive profit. However, when , and are relatively high, Manufacturer 1 becomes more powerful, and it will set a higher fee to extract more benefits of technology licensing. Therefore, Manufacturer 2’s profit becomes lower. Notice that in the two situations, the two manufacturers have the same level of sales quantity, while the licensor’s profit is higher than the licensee’s profit because of the transferring of a fixed amount of licensing fee. Comparing scenario F with scenario N, it is found that both manufacturers’ profits in scenario F are becoming higher than those in scenario N. Therefore, it can be concluded that, fixed-fee licensing benefits both manufacturers and results in a “win-win” outcome.
4.4. The Equilibrium Licensing Strategy
From the above analysis, it shows that technology licensing will always bring more profits to enterprises. This section will compare the payoffs of Manufacturer 1 under royalty licensing and fixed fee licensing to derive the equilibrium licensing strategy. (1) when strategy R is selected, the profits of Manufacturer 1 should satisfy . (2) When strategy F is selected, the profits of Manufacturer 1 should satisfy . By comparing the profits, the following proposition can be obtained.
Proposition 4.
(The equilibrium licensing strategy)
- (1)
- When and , or , the equilibrium licensing strategy is R.
- (2)
- When and , the equilibrium licensing strategy is F.
Proposition 4 shows that the choice of the optimal licensing strategy of the green technology depends on the market share , the substitutability degree , the production cost and the social responsibility . The decision region is depicted in Figure 2. It can be seen from the figure that the region can be divided into three parts which are shaped by different ranges of parameters. For all the values of parameters, Manufacturer 1 can always earn higher profit when licensing technology, in comparison to no licensing. Therefore, strategy N does not exist in equilibrium. Manufacturer 1’s can either choose to implement strategy F or strategy R.
First, when the substitutability of products is very high (), the equilibrium licensing strategy is royalty licensing (strategy R) for all the values of . The reasons are as follows. When the technology is licensed to Manufacturer 2, Manufacturer 1’s market size advantage disappears. If the substitutability level is high enough, in strategy F, the two manufacturers involve in direct competition in the final market, and this will hurt the benefits of Manufacturer 1. However, different to strategy F, strategy R makes the competition less fierce. In strategy R, the manufacturer has more power to directly control manufacturer 2’s production cost and its sales quantities. Although in strategy R there would be losses caused by double marginalization effect, it is compensated by the gain due to the eased competition. Therefore, in this condition, Manufacturer 1 would always choose strategy R. This conclusion is also in line with real life cases. For example, in highly competitive industries such as high-tech electronic software products and new energy vehicles, most of the related licensing strategies such as chip technology and battery technology are royalty licensing.
Secondly, when the substitutability of products is not high (), the decision region of optimal licensing strategy will be divided into three parts based on different values of potential market share A. When the potential market size of green products is very small, the optimal strategy is royalty licensing. On one hand, when A is small, Manufacturer 1’s profit increase under strategy F is not high, while royalty licensing can effectively defend the market share cannibalization from Manufacturer 2. Therefore, when A is relatively small, royalty licensing is preferred by Manufacturer 1. When the market size is large, enterprises will choose the fixed-fee licensing strategy. In this region, the market size expansion effect is strong while the competition effect is weak. The demand erosion effect of Manufacturer 2 to Manufacturer 1 is not strong. In this region, when fixed-fee licensing is adopted, the total supply chain efficiency will increase in comparison to royalty licensing (which generate double marginalization effect). Therefore, choosing the fixed-fee licensing strategy is more beneficial for manufacturer 1. At the same time, under this strategy, the output of both enterprises will be increased, which will also have a positive effect on environmental benefits and overall social welfare. Interestingly, combining (1) and (2), it is found that the impacts of substitution level on strategy choice is non-monotonic. When fixing the market size increment level , the strategy switches from R to F, then back to R.
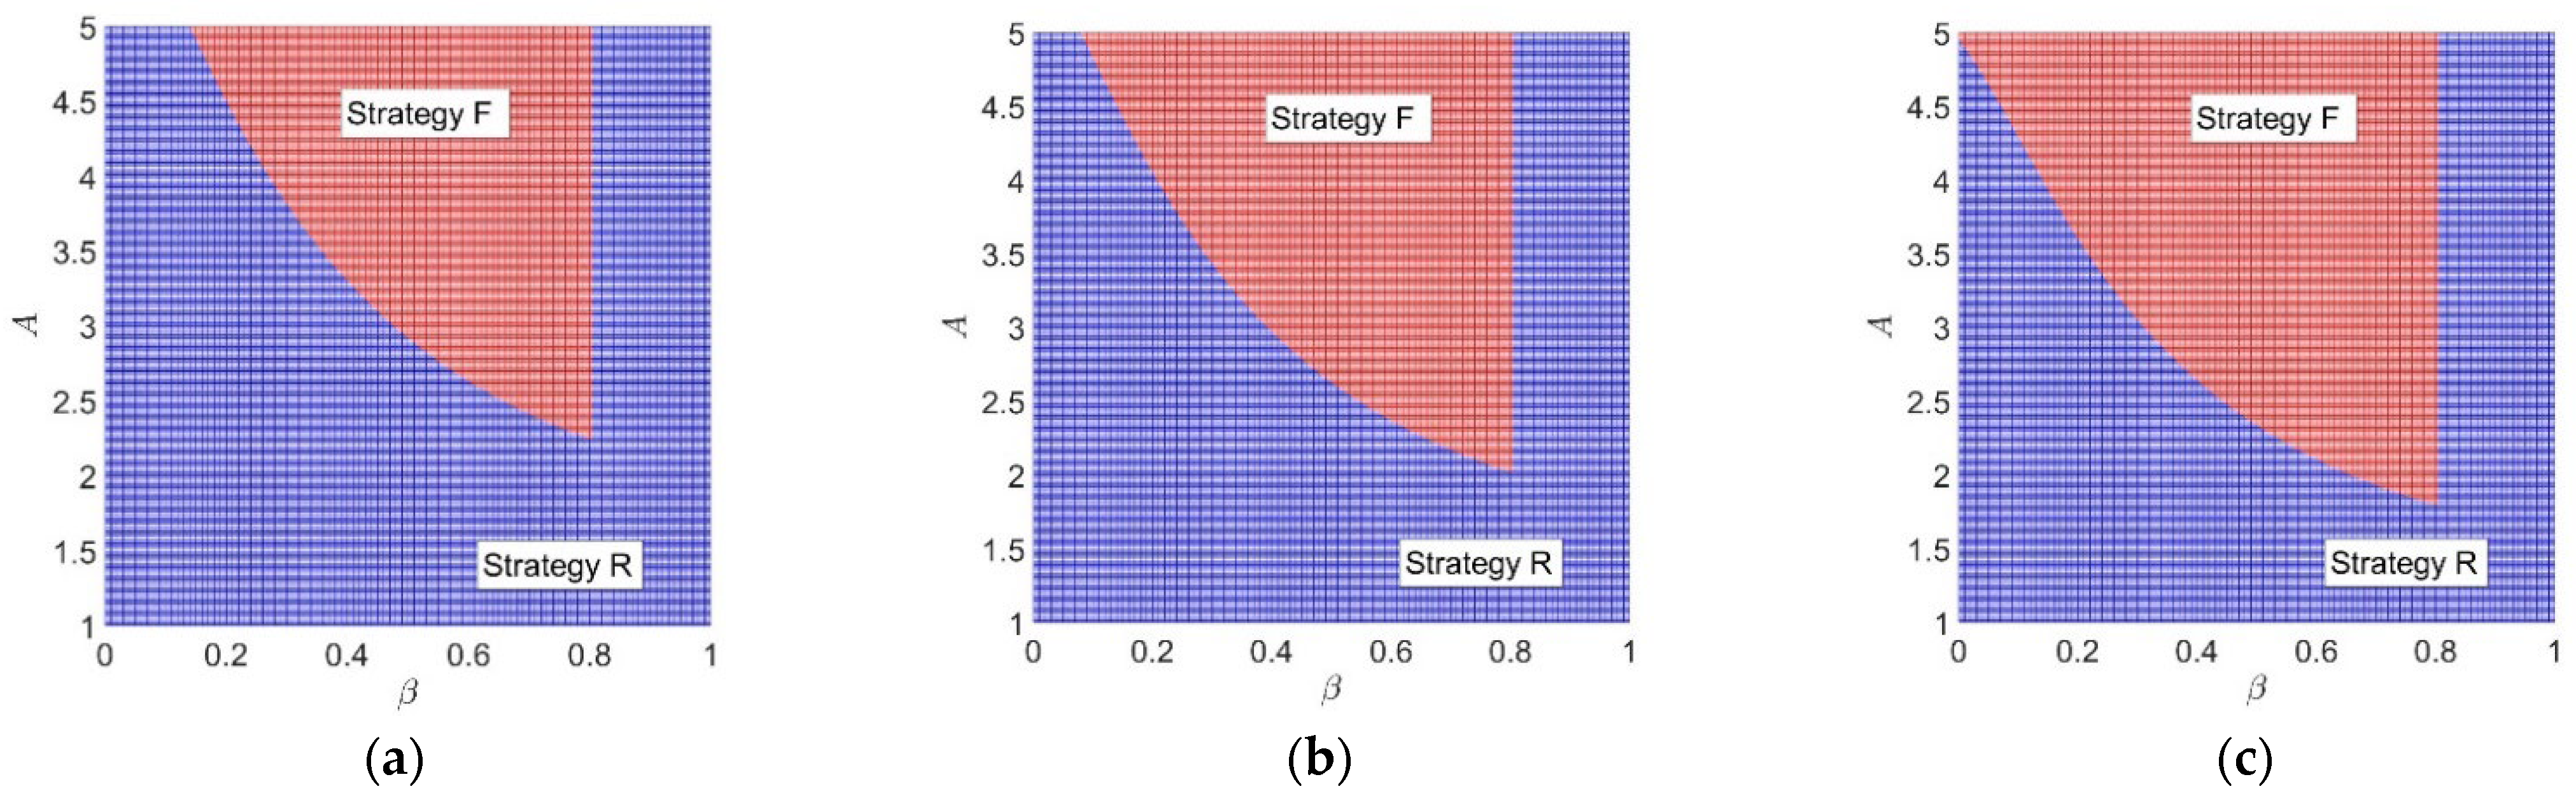
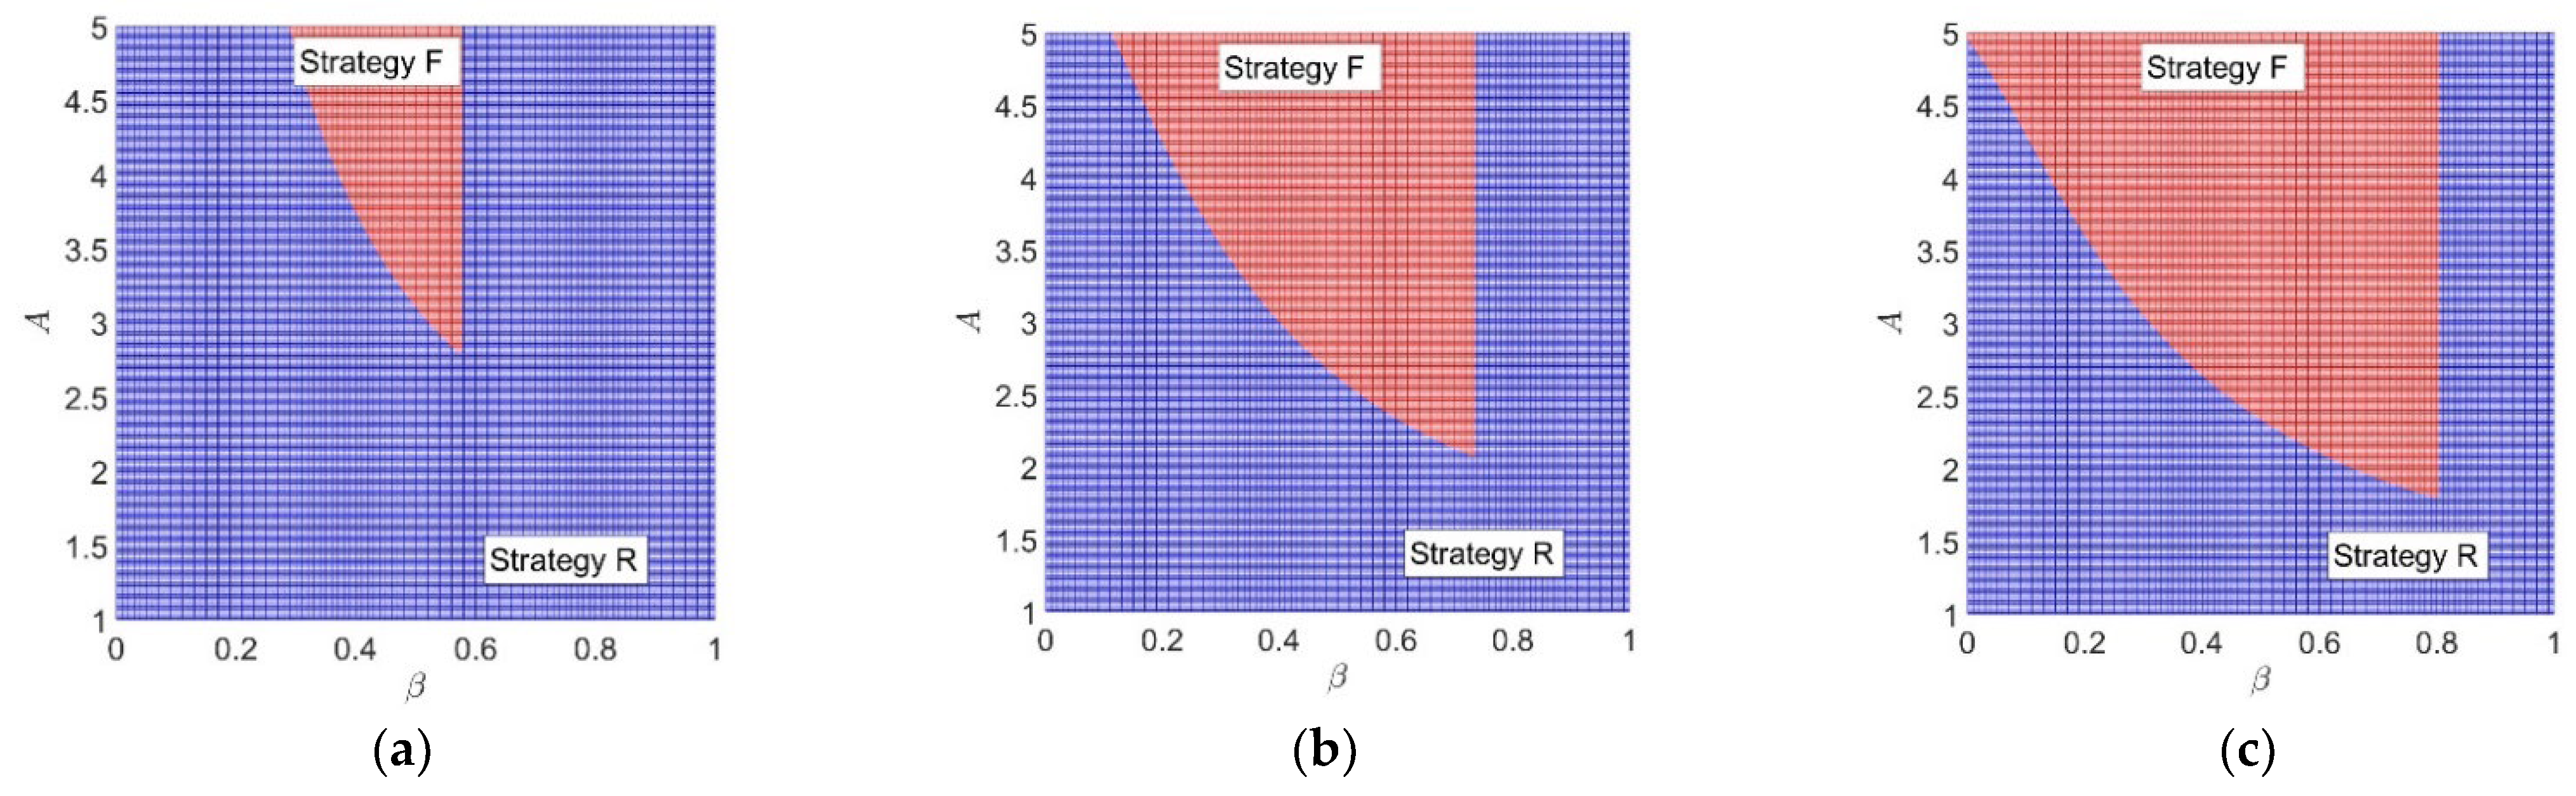
Lastly, it can be seen from Figure 3 and Figure 4 about the impacts of and on the decision regions. It is found that the shape of the decision region will not be affected by the level of and the production cost reduction , but the size of the regions will change with the two parameters. A higher level of social responsibility weakens manufacturer 1’s incentive to choose royalty licensing, while strengthen the incentive to choose fixed-fee licensing. This corresponds to the above analysis that fixed-fee licensing helps to achieve higher sales quantities of green products and achieve higher environmental payoffs for Manufacturer 1. Therefore, when Manufacturer 1 is more concerned about the environmental payoffs, fixed-fee licensing becomes more attractive. Moreover, when the cost saving effect is relatively strong, Manufacturer 1 becomes more willing to implement strategy F. From the results in Proposition 3, it can be observed that both parties’ payoffs rise in . Therefore, when becomes higher, both manufacturers can benefit more from technology licensing, which makes strategy F more attractive for manufacturer 1.
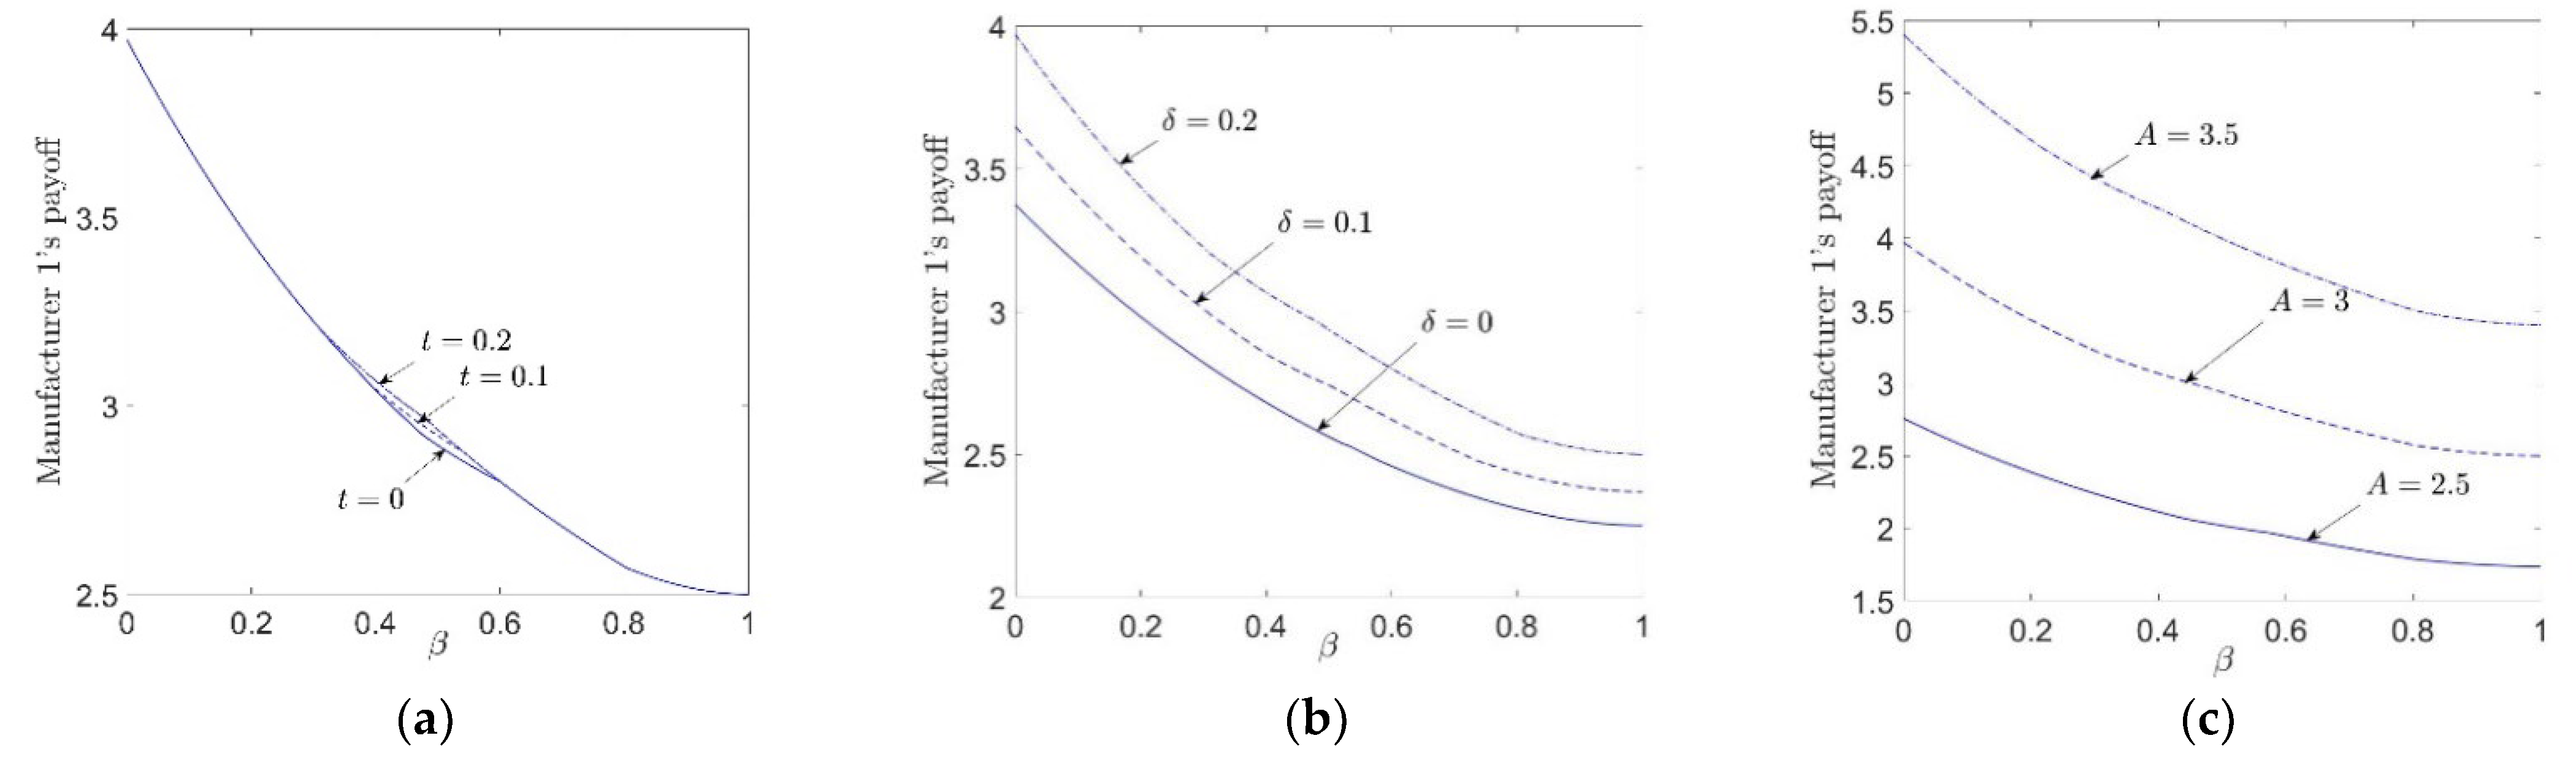
To better illustrate the impacts of critical parameters, several numerical experiments are conducted, which are shown in Figure 5.
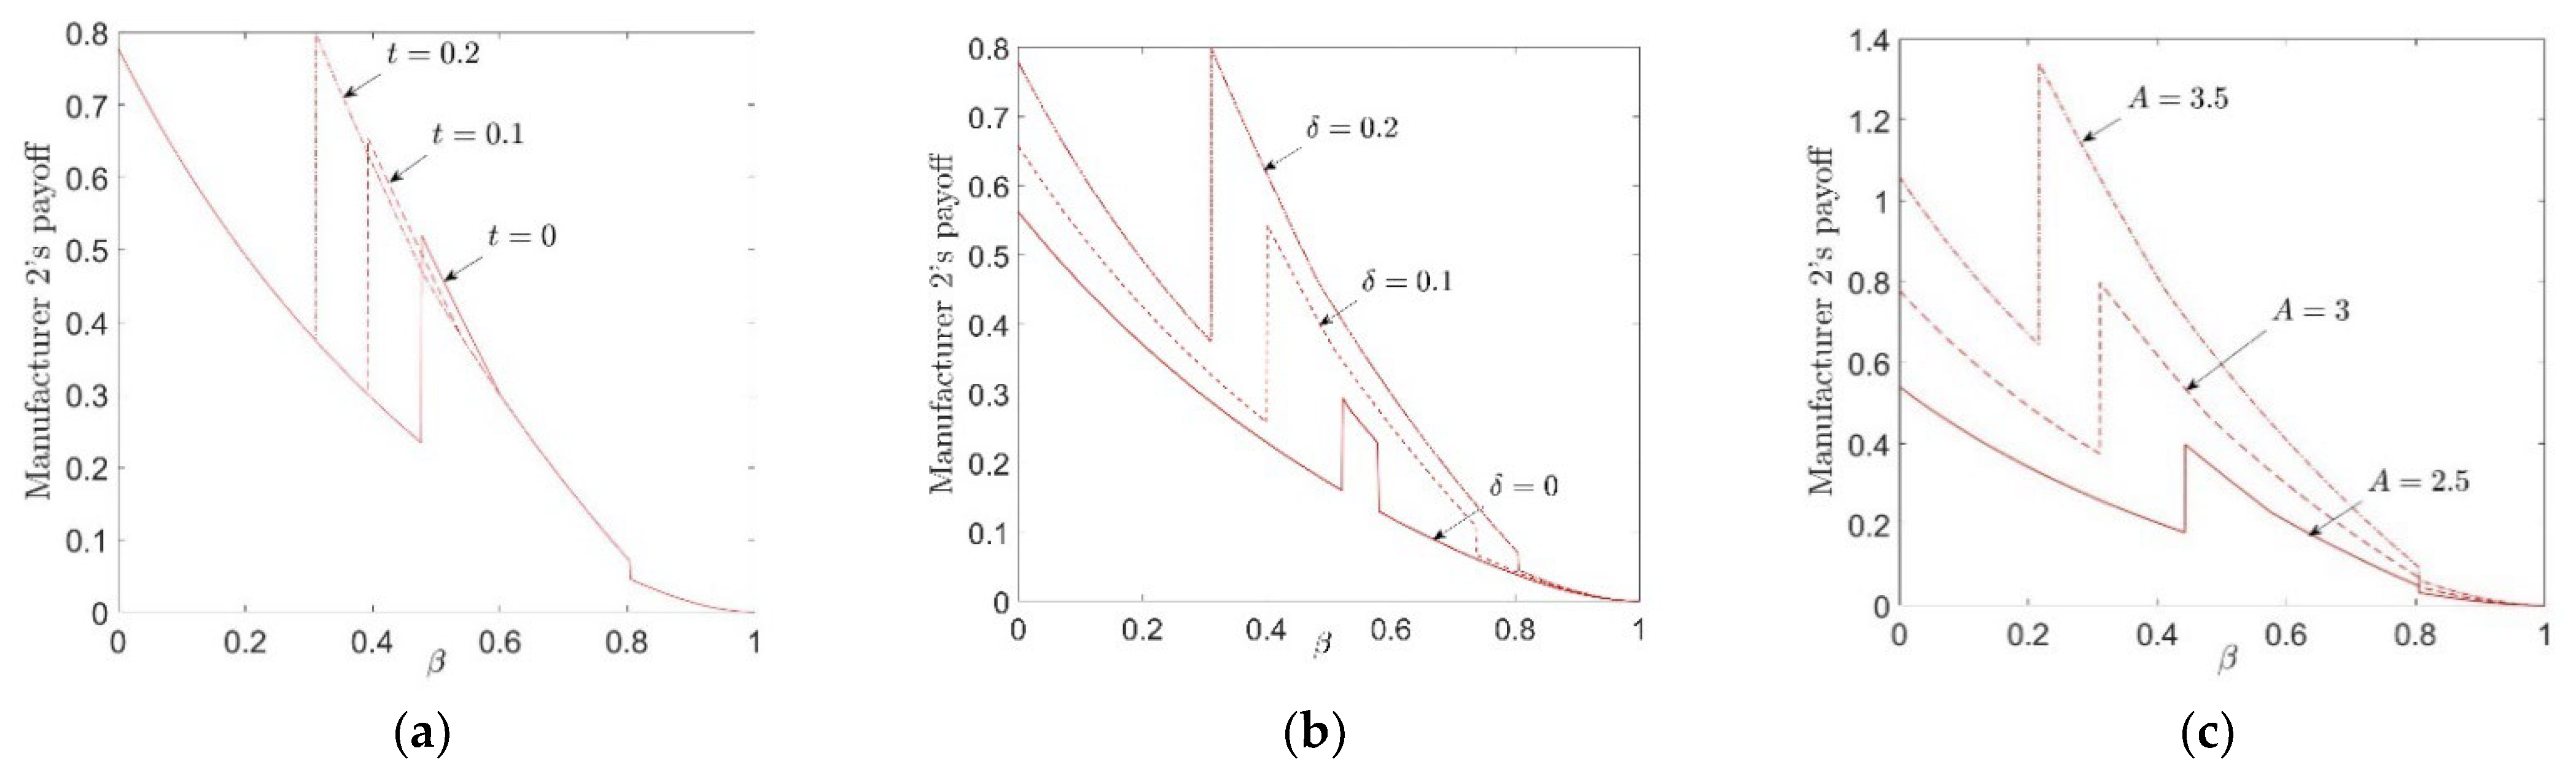
Observation 1.
(Impacts of , , and on payoffs)
In the equilibrium results,
- (1)
- Manufacturer 1’s payoff always decreases in , while increases in , and .
- (2)
- Manufacturer 2’s payoff increases in and , while can nonmonotonically change with and .
First, it is shown in Figure 5 and Figure 6 that Manufacturer 1’s payoff always decreases in the substitution level . This conforms to intuition that intense competition always hurts Manufacturer 1’s benefit. However, it is also presented that a manufacturer’s payoff is nonmonotonic in . When the strategy switches from R to F, a sudden rise appears. This provides an interesting result that Manufacturer 2 can benefit from the intensified competition when its competitor can switch the technology licensing strategy. Second, it shows the impacts of on the two manufacturers’ payoff in Figure 5a and Figure 6a. It shows that manufacturer 1’s payoff is weakly increasing in , while Manufacturer 2’s payoff can be nonmonotonic in . This indicates that Manufacturer 1 can always benefit from the cost reduction effect generated by technology licensing. However, Manufacturer 2 does not always benefit from the cost reduction effect. Last, as one has expected, both manufacturers’ payoffs increase in parameters and which are shown in Figure 5b,c and Figure 6b,c. It is straightforward that Manufacturer 1’s payoff increases when its environmental benefit concern rises. Then, when it is more concerned about the environmental benefit, it will be more willing to license the green technology and achieve higher sales quantities of green products in the whole market. This enables Manufacturer 2 to obtain such technology much easier (with lower license fee) and to generate higher payoff. Furthermore, it can be explained with similar reasons that higher market share will induce Manufacturer 1’s technology licensing, thus benefit both manufacturers.
5. Welfare Implications
Following previous research of [34,35,36,37], social welfare can be formulated as follows. The social welfare consists of three parts, namely
The three parts on the right side of the formula represent: (i) consumer surplus, (ii) payoff (including economic benefits and environmental benefits) of Manufacturer 1, and (iii) payoff of Manufacturer 2, respectively. Following [34,35,36,37], and knowing the sales quantities, the consumer surplus can be formulated as
Under different licensing strategies, the expressions of social welfare are also different. Through calculation, social welfare for the two strategies can be expressed respectively as follows.
Proposition 5.
- (1)
- When strategy R is adopted, the total social welfare in equilibrium is
- (2)
- When strategy F is adopted, the total social welfare in equilibrium is
- (3)
The expressions of CS and SW are presented in Proposition 4(1) and (2). Then, comparing CS and SW in the two cases, it is found that fixed fee licensing always generates higher CS and SW. The reason is as follows. When strategy F is adopted, the sales quantities are not dependent on the lump sum licensing fee, and the two manufacturers only have horizontal competition. However, in strategy R, the sales quantities are affected by the royalty licensing fee, and the two manufacturers have both horizontal and vertical competition. Comparing to strategy F, the existence of double marginalization effect in strategy R reduces the final sales quantities of the green products. Therefore, the total profits and environmental payoff in strategy R are lower than that in strategy F, which further result in lower consumer surplus and social welfare.
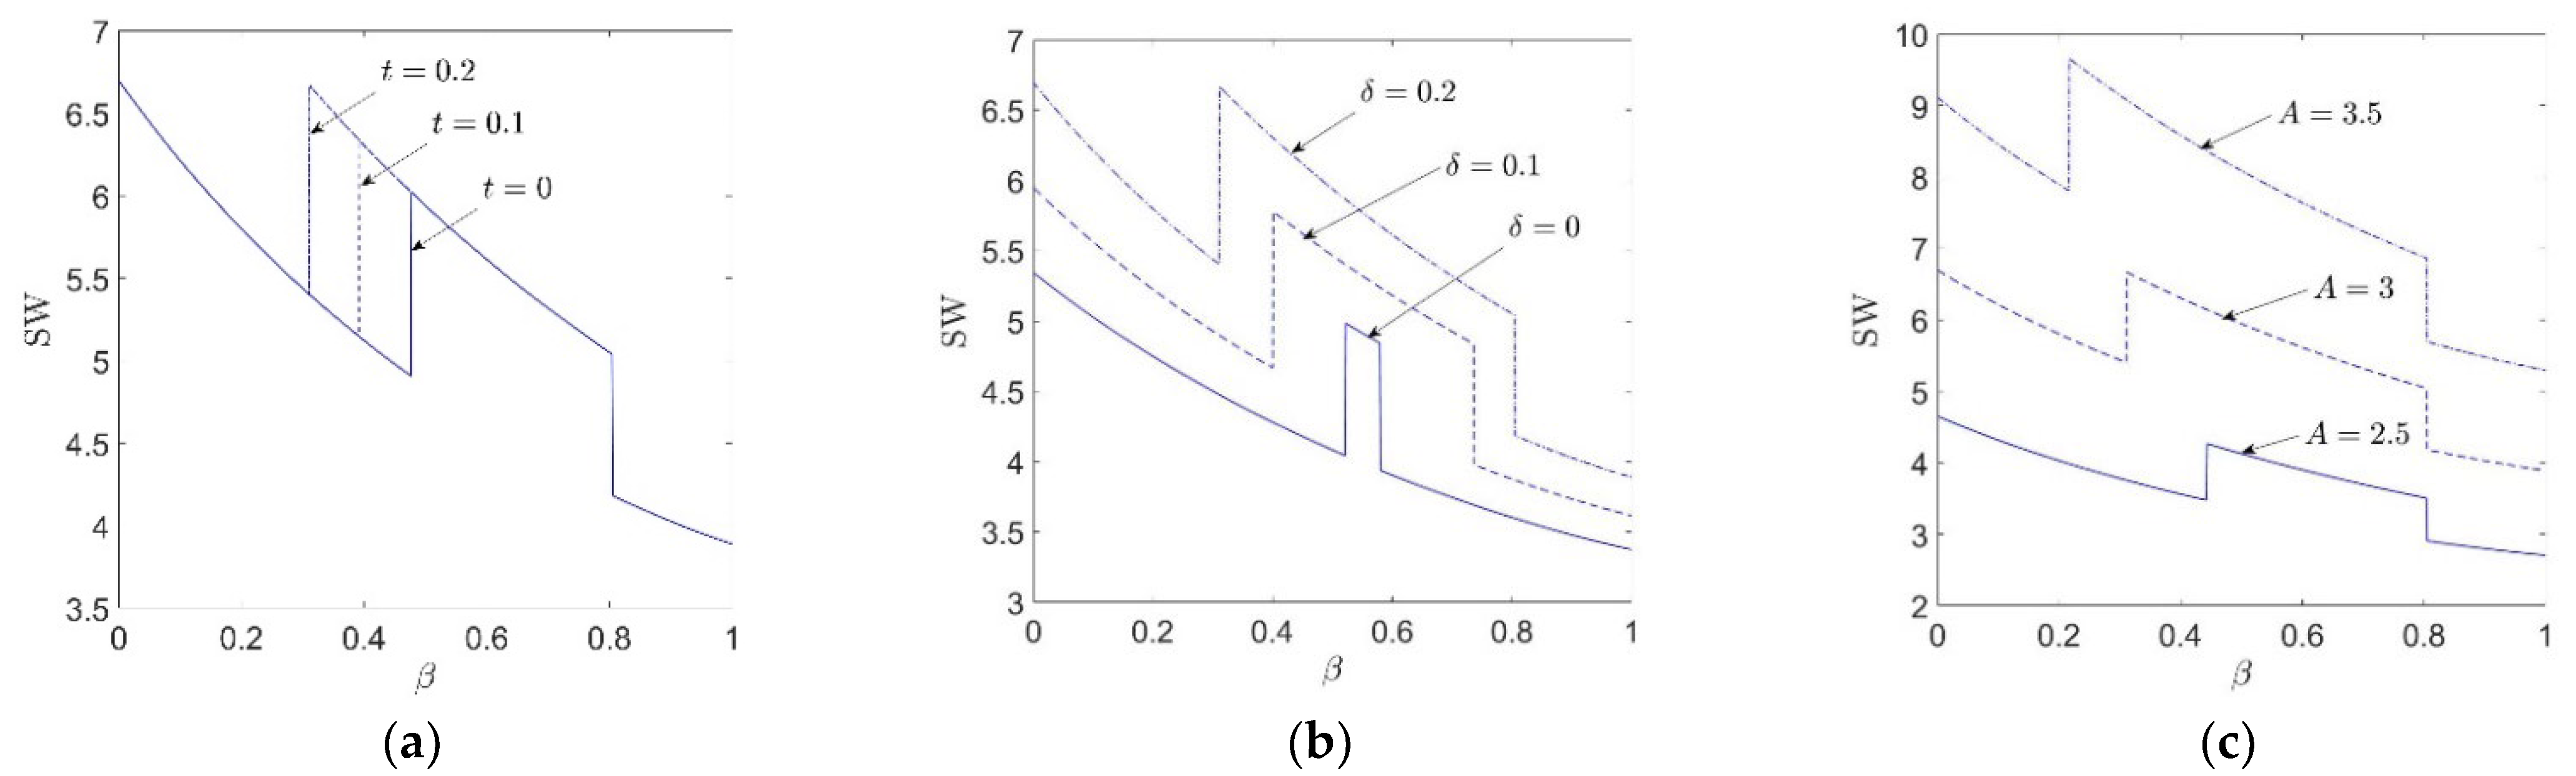
Next, the impacts of critical parameters on CS and SW are illustrated using numerical experiments, which are shown in Figure 6. The results are summarized in Observation 2.
Observation 2.
(Impacts of , , and on SW and CS)
- (1)
- CS and SW increases in , and ;
- (2)
- CS and SW changes nonmonotonically in .
In Observation 2, it first presents the impacts of parameters , and on consumer surplus and social welfare in Figure 7 and Figure 8. It shows that both CS and SW increase in the three parameters. The results are straightforward, because higher and always generate higher profits for the two manufacturers, and higher stimulates technology licensing and results in higher environmental benefits.
Then, it shows the impacts of product substitution level on CS and SW. Interestingly, it is found that both CS and SW are nonmonotonic in . CS or SW experiences a sudden jump when the equilibrium strategy switches from R to F; then experiences a sudden drop when the equilibrium strategy switches from F to R. This provides a counterintuitive result that intense competition does not always benefit consumers and the society in a coopetition environment.
6. Theoretical Contributions
This research contributes to the existing literature in three aspects.
First, this paper contributes to the research of coopetition in supply chain management by incorporating horizontal green technology licensing strategies into the quantity and product greenness competition models. In existing research, coopetition between supply chain members mainly refers to outsourcing decisions in supply chains [7,8], strategic alliance formation [9,10], or coopetitive investments in quality or product greenness [11,12,13]. However, the notion that green technology licensing as a coopetative strategy between brown and green firms is seldom studied the existing literature. Therefore, this paper contributes to the theory of coopetition in supply chains. In the model analysis, we have highlighted the economical and environmental impacts of such coopetition.
Second, this paper has enriched the existing literature on technology licensing by considering the greenness property of the technology. In previous literature, researchers have considered various factors in technology licensing, such as product differentiation between licensors and licensees [25], multiple competition firms [25], imitation behaviours of technology [28], innovation degree of the technology [29], etc. However, none of them have realized the importance of factor of technology’s green property. This paper fills this gap and has established new technology licensing models to study the new technology licensing problem. Additionally, some interesting and meaningful results concerning the technology’s green property are also provided. These results not only contribute to firms’ economic benefits (which is the focus of the existing literature), but also contribute to welfare implications (which provides important implications to the consumers and the governments).
Last, this paper has investigated how green technology licensing affect the selling strategies under competition. In the existing literature on green product selling, investing in greenness improvement is a good way to earn larger market coverage and more profits [32,33]. However, most of them focus on the cases that firms invest in greenness improvement by themselves. This paper provides a new way for firms to improve their product greenness, that is purchasing green technology license from green firms, which can avoid highly risky and expensive R&D of green technologies.
7. Conclusions
Green technology is becoming a driven force of sustainable development for the industry and society. In this paper, a green technology licensing problem between two manufacturers under the consideration of the licensor’s environmental concerns is studied. Managerial implications and limitations and future research directions are presented as follows.
7.1. Managerial Implications
The managerial implications are as follows. First, in this model, it is found that the green manufacturer should always license its green technology to its rival with appropriate licensing contract design. Second, by comparing the two licensing contracts, i.e., royalty licensing and fixed-fee licensing, the equilibrium licensing strategy is obtained, which is shaped by critical factors in the model. It shows that higher cost saving effect, market expansion effect or environmental concern will incent the green manufacturer to implement strategy F. However, it shows that the impacts of product substitution on strategy choice is nonmonotonic. Specifically, only when the substitution level is moderate, the green manufacturer will implement strategy F; otherwise, for very high or very low level of substitution level, strategy R will be chosen. Third, it shows the sensitivity analysis results of critical parameters on manufacturers’ payoff, consumer surplus and social welfare. Several interesting findings are presented. For example, more intense competition always hurts the green manufacturer, however, may benefit the brown manufacturer when the technology licensing strategy switches from R to F. Moreover, it is found that the maximum of consumer surplus or social welfare appears for moderate level of substitution level, which is counterintuitive.
7.2. Limitations and Future Research Directions
This paper has several limitations, which can be relaxed in future research. First, the production cost for the green manufacturer is not considered. In the future, the impacts of positive production cost on competing manufacturers’ green technology licensing decisions can be further studied. Second, this paper only considers about two competing manufacturers. In the future, a more generalized case with multiple competing manufacturers can be studied, which is more realistic in business practice. Third, the formulation of the green technology licensor’s environmental payoff is only linked to the green products. In the future, more generalized formulations of the environmental payoff can be considered. For example, in addition to the positive payoff incurred by green products, the negative payoff incurred by brown products could also be considered. Fourth, in the model, this paper has only considered the royalty and fixed fee licensing contract. In the future, other contracts can be considered in this model, such as revenue sharing, profit sharing and two-part tariff, etc. Fifth, in this paper, there exists one version of green technology. However, in real business, a licensor may have multiple versions of green technology. How will the adoption of each version of green technology alter the competition between the two firms and which one should be licensed to the brown firm is worth studying. Last, in this paper, the two manufacturers sell the products directly to the consumers. In the future research, we can extend the one-echelon supply chains to multiple-echelon supply chains. Therefore, how vertical and horizontal competition jointly affect manufacturers’ technology licensing strategies needs to be carefully investigated in the future.
Author Contributions
Conceptualization, H.H.; methodology, validation, formal analysis, investigation, L.L. and Y.Y.; resources, writing—original draft preparation, writing—review and editing, visualization, H.H. and X.W.; supervision, H.H.; project administration, funding acquisition, H.H. All authors have read and agreed to the published version of the manuscript.
Funding
This work is supported by the National Natural Science Foundation of China (No. 72101117) and the Natural Science Foundation of Jiangsu Province (No. BK20200485).
Data Availability Statement
Not applicable.
Conflicts of Interest
The authors declare no conflict of interest.
Appendix A
Proof of Proposition 1.
Solve the first order derivatives of
it can obtain the results of
Comparing the results, it is found that the results exist iff . However, when , which is not a reasonable solution. Therefore, when , manufacturer 2 cannot enter the market. By setting , and solve the problem of manufacturer 1, . Substituting the results into the payoff functions, we obtain the results in Proposition 1. □
Appendix B
Proof of Proposition 2.
Solve the first order derivatives of
it can obtain the response functions of
Substitute the response functions into the payoff functions, it obtains
Then, manufacturer 1 determine the optimal royalty fee to maximize the payoff. Solving the first order derivative of
it obtains the optimal licensing royalty fee as
Substituting the royalty fee into the above functions it obtains the equilibrium sales quantities and profits, which are summarized in Proposition 2. □
Appendix C
Proof of Proposition 3.
Solving the first order derivatives of
it obtains the two manufacturers’ sales quantities as
Substitute the sales quantities into the payoff functions,
From the expressions of , manufacturer 1’s payoff function increases in , however it should be constrained such that manufacturer 2 is profitable, i.e., . Therefore, the two manufacturers negotiate on the optimal . According to the Nash bargaining model, the problem is to solve the target function of . In the function, denotes the bargaining power of manufacturer 1. In this model, it is assumed that the two manufacturers have equal bargaining power, i.e., .
Consider the first scenario of , and maximize the target function, it obtains the optimal fixed licensing fee as
Then, consider the second scenario of and maximizing the target function, it obtains the optimal fixed licensing fee as
Substitute into the payoff functions, the results can be obtained in Proposition 3. □
Appendix D
Proof of Proposition 4.
The equilibrium is obtained by comparing the payoffs in the three strategies
- (1)
- when , the conditions that manufacturer 1 choose royalty contract areSolving the above inequalities, it obtains , where
- (2)
- when , the conditions that manufacturer 1 chooses royalty contract areSolving the above inequalities, it obtains , where is solved by the equation of .In summary, the condition that manufacturer 1 choose strategy R isFollowing a similar fashion, it concludes that (1) strategy N is never optimal; (2) the condition that manufacturer 1 choose strategy R isTherefore, the results can be obtained in Proposition 4. □
Appendix E
Proof of Proposition 5.
When strategy R is adopted, substitute the results in Proposition 2 into the social welfare function of
it obtains
Likewise, substitute the results in Proposition 3 into the social welfare functions,
it obtains
The results are shown in Proposition 5.
Then, compare the value of CS and SW of the two strategies.
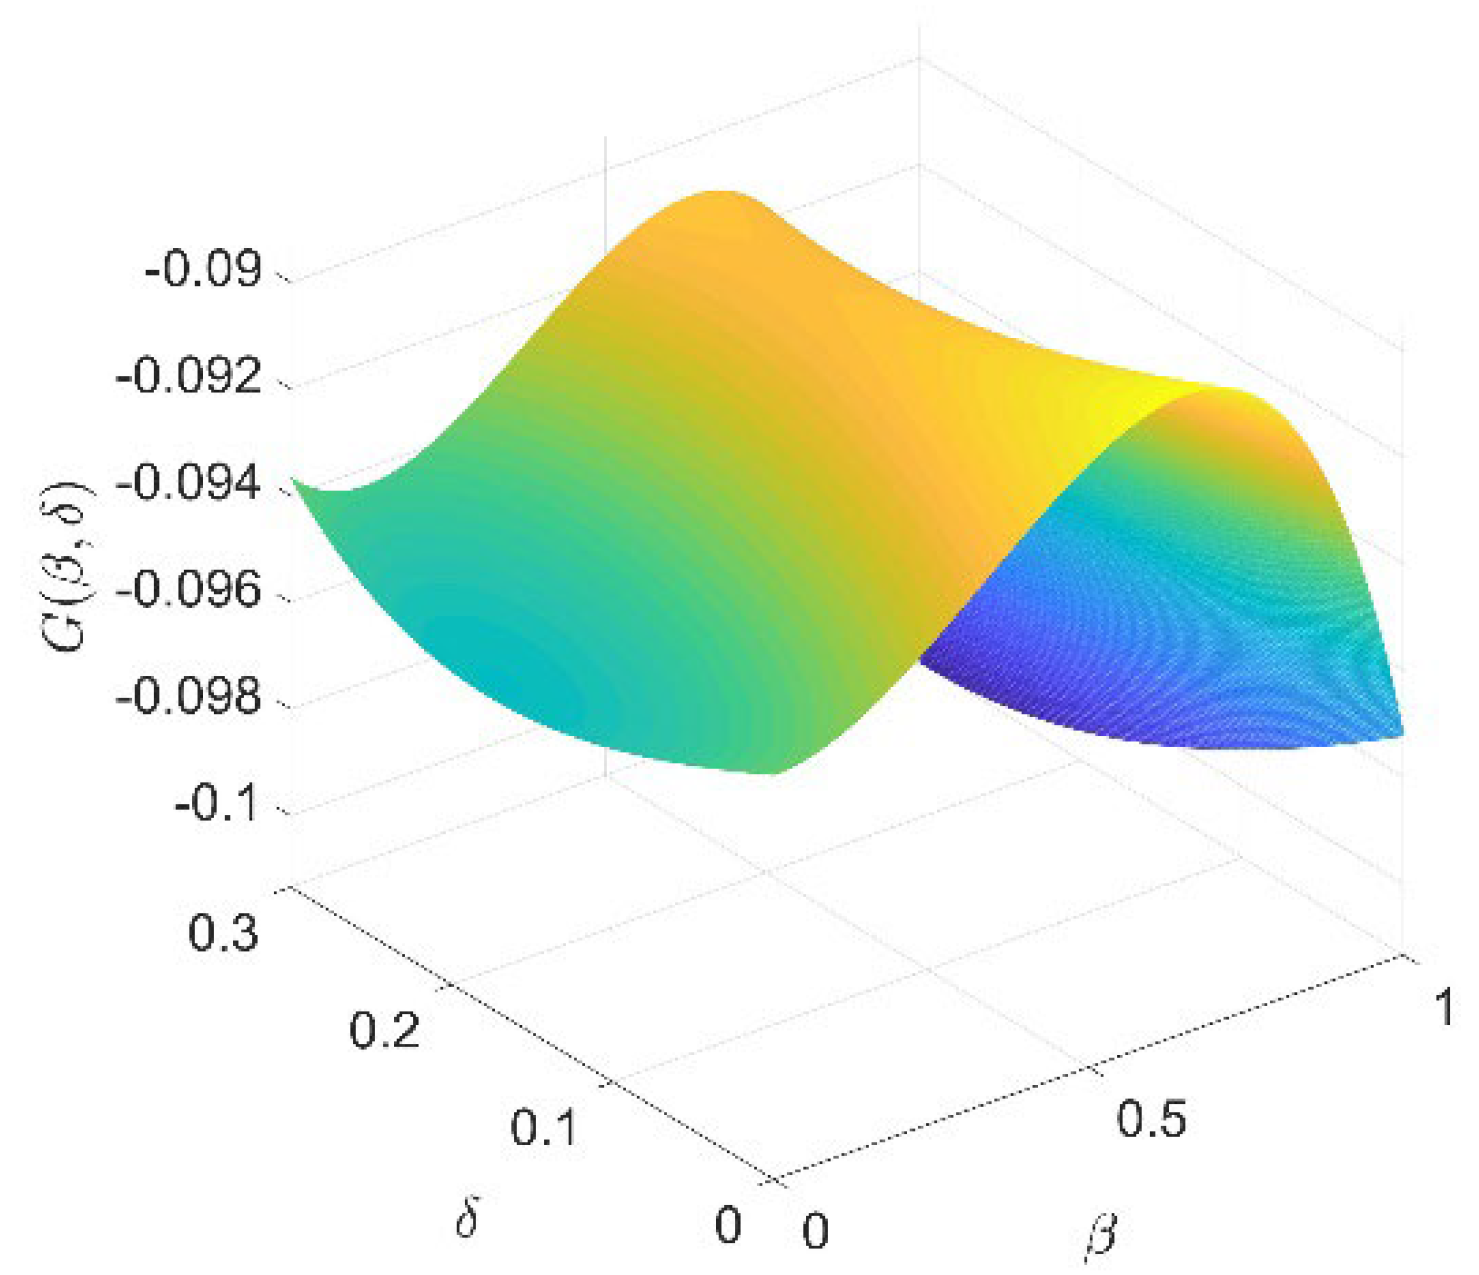
Let . Then, . Then, it only needs to prove for all the available values of and . Here, using the numerical method to testify all the values of and , which is shown in Figure A1 as follows. It shows that is always satisfied, therefore, holds. Follow the same fashion, can be proved. □
Figure A1.
with respect to and .

References
- Guardian, T. Atmospheric CO2 Levels Rise Sharply Despite COVID-19 Lockdowns. 2020. Available online: https://www.theguardian.com/environment/2020/jun/04/atmospheric-co2-levels-rise-sharply-despite-covid-19-lockdowns (accessed on 7 November 2022).
- Pimentel, D.; Cooperstein, S.; Randell, H.; Filiberto, D.; Sorrentino, S.; Kaye, B.; Nicklin, C.; Yagi, J.; Brian, J.; O’Hern, J.; et al. Ecology of increasing diseases: Population growth and environ- mental degradation. Hum. Ecol. 2007, 35, 653–668. [Google Scholar] [CrossRef] [PubMed]
- Larmer, B. What Does It Take to Stop Accepting Pollution as the Price of Progress? The New York Times Magazine, 23 January 2018. [Google Scholar]
- Lenovo Newsroom. LenovoTM Announces Breakthrough, Innovative PC Manufacturing Process. 2017. Available online: http://news.lenovo.com/news-releases/lenovo-announces-breakthrough-innovative-pc-manufacturing-process.htm (accessed on 7 November 2022).
- Bailey, B.; Yeo, J.; Koh, S.; Ferguson, A. Doubling Down: Europe’s Low-Carbon Investment Opportunity. 2020. Available online: https://www.oliverwyman.com/our-expertise/insights/2020/feb/doublingdown.html (accessed on 7 November 2022).
- Chen, X.; Wang, X.; Xia, Y. Low-carbon technology transfer between rival firms under cap-and-trade policies. IISE Trans. 2020, 54, 105–121. [Google Scholar] [CrossRef]
- Chen, Y.; Shum, S.; Xiao, W. Should an OEM retain sourcing when outsourcing to a competing CM? Prod. Oper. Manag. 2019, 28, 1446–1464. [Google Scholar] [CrossRef]
- Yan, Y.C.; Zhao, R.Q.; Lan, Y.F. Moving sequence preference in coopetition outsourcing supply chain: Consensus or conflict. Int. J. Prod. Econ. 2019, 208, 221–240. [Google Scholar] [CrossRef]
- Rai, R.K. A coopetition-based approach to value creation in interfirm alliances construction of a measure and examination of its psychometric properties. J. Manag. 2016, 42, 1663–1699. [Google Scholar]
- Bello, D.C.; Katsikeas, C.S.; Robson, M.J. Does accommodating a self-serving partner in an international marketing alliance pay off? J. Mark. 2010, 74, 77–93. [Google Scholar] [CrossRef]
- Ge, Z.H.; Hu, Q.Y.; Xia, Y.S. Firms’ R&D cooperation behavior in a supply chain. Prod. Oper. Manag. 2014, 23, 599–609. [Google Scholar]
- Wilhelm, M.M. Managing coopetition through horizontal supply chain relations: Linking dyadic and network levels of analysis. J. Oper. Manag. 2011, 29, 663–676. [Google Scholar] [CrossRef]
- Chen, P.P.; Zhao, R.Q.; Yan, Y.C.; Li, X. Promotional pricing and online business model choice in the presence of retail competition. Omega 2020, 94, 102085. [Google Scholar] [CrossRef]
- Bengtsson, M.; Raza-Ullah, T. A systematic review of research on coopetition: Toward a multilevel understanding. Ind. Marking Manag. 2016, 57, 23–39. [Google Scholar] [CrossRef]
- Ritala, A.; Golnam, A.; Wegmann, A. Coopetition-based business models: The case of amazon.com. Ind. Marking Manag. 2014, 43, 236–249. [Google Scholar] [CrossRef]
- Gnyawali, D.R.; Park, B.J.R. Co-opetition between giants: Collaboration with competitors for technological innovation. Res. Policy 2011, 40, 650–663. [Google Scholar] [CrossRef]
- Yin, P.Z.; Chu, J.F.; Wu, J. A DEA-based two-stage network approach for hotel performance analysis: An internal cooperation perspective. Omega 2020, 93, 102035. [Google Scholar] [CrossRef]
- Xu, Y.; Gurnani, H.; Desiraju, R. Strategic supply chain structure design for a proprietary component manufacturer. Prod. Oper. Manag. 2010, 19, 371–389. [Google Scholar] [CrossRef]
- Venkatesh, R.; Chintagunta, P.; Mahajan, V. Research note: Sole entrant, co-optor, or component supplier: Optimal end-product strategies for manufacturers of proprietary component brands. Manag. Sci. 2006, 52, 613–622. [Google Scholar] [CrossRef] [Green Version]
- Chen, X.; Wang, X.J.; Xia, Y.S. Production coopetition strategies for competing manufacturers that produce partially substitutable products. Prod. Oper. Manag. 2019, 28, 1446–1464. [Google Scholar] [CrossRef]
- Aulakh, P.S.; Jiang, M.S.; Pan, Y. International technology licensing: Monopoly rents, transaction costs and exclusive rights. J. Int. Bus. Stud. 2010, 41, 587–605. [Google Scholar] [CrossRef]
- Khoury, T.A.; Pleggenkuhle-Miles, E.G.; Walter, J. Experiential learning, bargaining power, and exclusivity in technology licensing. J. Manag. 2019, 45, 1193–1224. [Google Scholar] [CrossRef]
- Wang, X.H. Fee versus royalty licensing in a Cournot duopoly model. Econ. Lett. 1998, 60, 55–62. [Google Scholar] [CrossRef]
- Faul-Oller, R.; Sandonis, J. Welfare reducing licensing. Games Econ. Behav. 2002, 41, 192–205. [Google Scholar] [CrossRef]
- Wang, X.H. Fee versus royalty licensing in a differentiated Cournot duopoly. J. Econ. Bus. 2002, 54, 253–266. [Google Scholar] [CrossRef]
- Kamien, M.; Tauman, Y. Patent licensing: The inside story. Manch. Sch. 2002, 70, 7–15. [Google Scholar] [CrossRef]
- Heywood, J.S.; Li, J.; Ye, G. Per unit vs. ad valorem royalties under asymmetric information. Int. J. Ind. Organ. 2014, 37, 38–46. [Google Scholar] [CrossRef]
- Rockett, K.E. Choosing the competition and patent licensing. RAND J. Econ. 1990, 21, 161–172. [Google Scholar] [CrossRef]
- Kabiraj, T. Patent licensing in a leadership structure. Manch. Sch. 2004, 72, 188–205. [Google Scholar] [CrossRef] [Green Version]
- Conrad, K. Price competition and product differentiation when consumers care for the environment. Environ. Resour. Econ. 2005, 31, 1–19. [Google Scholar] [CrossRef]
- Roberto, R. Environmental product differentiation and environmental awareness. Environ. Resour. Econ. 2007, 36, 237–254. [Google Scholar]
- Zhang, C.; Wang, H.; Ren, M. Research on pricing and coordination strategy of green supply chain under hybrid production mode. Comput. Ind. Eng. 2014, 72, 24–31. [Google Scholar] [CrossRef]
- Zhu, W.; He, Y. Green product design in supply chains under competition. Eur. J. Oper. Res. 2017, 258, 165–180. [Google Scholar] [CrossRef]
- Cai, G. Channel selection and coordination in dual-channel supply chains. J. Retail. 2010, 86, 22–36. [Google Scholar] [CrossRef]
- Liu, B.; Cai, G.; Tsay, A.A. Advertising in asymmetric competing supply chains. Prod. Oper. Manag. 2014, 23, 1845–1858. [Google Scholar] [CrossRef]
- Wu, H.; Cai, G.; Chen, J.; Sheu, C. Online manufacturer referral to heterogeneous retailers. Prod. Oper. Manag. 2015, 24, 1768–1782. [Google Scholar] [CrossRef]
- Chen, J.; Liang, L.; Yao, D.; Sun, S. Price and quality decisions in dual-channel supply chains. Eur. J. Oper. Res. 2017, 259, 935–948. [Google Scholar] [CrossRef]
Figure 1.
Supply chain structures. (a) Strategy N; (b) Strategy R; (c) Strategy F.

Figure 2.
The decision region of technology licensing strategy.

Figure 3.
Impacts of on the decision region when . (a) ; (b) ; (c) .

Figure 4.
Impacts of on the decision region when . (a) ; (b) ; (c) .

Figure 5.
Impacts of and (a) (b) (c) on Manufacturer 1’s payoffs.

Figure 6.
Impacts of and (a) (b) (c) on Manufacturer 2’s payoffs.

Figure 7.
Impacts of and (a) (b) (c) on CS.

Figure 8.
Impacts of and (a) (b) (c) on SW.


Table 1.
Notations.
| Notations | Meanings |
|---|---|
| , denotes no licensing, royalty licensing and fixed-fee licensing. | |
| , denotes Manufacturer 1 and Manufacturer 2. | |
| Substitution level of the two products, . | |
| Environmental benefit generated by unit green product, normalized to 1. | |
| Manufacturer 1’s environmental concern level. | |
| Manufacturer production quantity under licensing strategy . | |
| Total production quantity of green products under licensing strategy . | |
| Manufacturer 1’s market share, . | |
| Manufacturer 2’s market share. for , for . | |
| Manufacturer selling price under licensing strategy . | |
| Royalty fee charged by Manufacturer 1 to Manufacturer 2 when . | |
| Fixed fee charged by Manufacturer 1 to Manufacturer 2 when . | |
| Manufacturer ’s payoff under strategy . | |
| Social welfare under strategy . | |
| Environmental payoff under strategy , . | |
| Customer surplus under strategy . |
Publisher’s Note: MDPI stays neutral with regard to jurisdictional claims in published maps and institutional affiliations. |
© 2022 by the authors. Licensee MDPI, Basel, Switzerland. This article is an open access article distributed under the terms and conditions of the Creative Commons Attribution (CC BY) license (https://creativecommons.org/licenses/by/4.0/).
Share and Cite
MDPI and ACS Style
Liu, L.; Yuan, Y.; Wang, X.; Huang, H. Strategic Licensing of Green Technologies to a Brown Rival: A Game Theoretical Analysis. Mathematics 2022, 10, 4433. https://0-doi-org.brum.beds.ac.uk/10.3390/math10234433
AMA Style
Liu L, Yuan Y, Wang X, Huang H. Strategic Licensing of Green Technologies to a Brown Rival: A Game Theoretical Analysis. Mathematics. 2022; 10(23):4433. https://0-doi-org.brum.beds.ac.uk/10.3390/math10234433
Chicago/Turabian StyleLiu, Liu, Ying Yuan, Xiaoya Wang, and Hongfu Huang. 2022. "Strategic Licensing of Green Technologies to a Brown Rival: A Game Theoretical Analysis" Mathematics 10, no. 23: 4433. https://0-doi-org.brum.beds.ac.uk/10.3390/math10234433
Note that from the first issue of 2016, this journal uses article numbers instead of page numbers. See further details here.