1. Introduction
Systemic banking crises are very destructive. Whether it is an emerging country or a developed country, when faced with a systemic banking crisis, government departments are required to actively respond [
1]. Failure to issue early warning signals in a timely and accurate manner and activate macro-prudential policy tools may bring huge losses to a country’s finance, the economy, and even society as a whole [
2,
3]. The 2022 Nobel Prize in Economics was awarded to Ben S. Bernanke, Douglas W. Diamond, and Philip H. Dybvig for their outstanding contributions to the study of banking and financial crises [
4]. Therefore, an early warning system that can accurately predict systemic banking crises is crucial.
This study adopts the systemic banking crises database II in Laeven and Valencia [
3], and following them we defined a banking crisis: “Signs of a serious financial crisis in the banking system, and important banking policy intervention measures are taken in response to major losses in the banking system.” This study focuses on systemic banking crises because sovereign debt and currency crises usually coincide with or follow bank crises [
3]. The crisis time of the database is 1970–2017, so the last prediction time of this study is 2017.
The Group of Twenty (G20) members represent around 85% of the world’s economic output, two-thirds of the global population, and 75% of international trade [
5,
6]. Considering the complexity of the European Union member states, this study does not include the European Union in the scope of the study. The following G20 only represents the 19 countries after the European Union is excluded.
Combining the direction of sustainable development, this study considers Environmental, Social, and Governance (ESG) indicators. ESG refers to how companies and investors integrate environmental, social, and governance issues into their business models [
7]. A healthy ESG score can reduce a business’ risk [
8,
9,
10].
ESG can be extended from the individual economic level to the national macroeconomic level. In 2015, the United Nations identified Sustainable Development Goals to promote the increase in ESG [
11]. There is a strong relationship between ESG and financial risk, and increased ESG risk leads to increased credit risk and sovereign debt risk [
12,
13,
14,
15]. To our knowledge, there are no studies on the relationship between ESG and systemic banking crises, and this study fills the gap.
Systematic bank risk warning models have gradually shifted from statistical to deep learning models. Considering neural networks have internal relationships that are difficult to explain, Huang et al. [
16] selected the financial index that affects systemic banking crises in early warning with logistic regression. Beutel, List, and von Schweinitz [
2] found that the logit (logistic regression) model was better than machine learning models (ANN, artificial neural networks; SVM, support vector machines; KNN, k-nearest-neighbors; DT, decision trees) in recursive out-of-sample because the performance of cross-validation and hyperparameter selection to solve the overfitting problem was overestimated. Tölö [
17] argues that even with panel data, predictions in Logit and machine learning models are almost entirely based on cross-sections of variables. He found LSTM in Recurrent Neural Network (RNN) produces coherent predictions that outperform logit, at the same time as solving overfitting with a country-by-country cross-validation, and proved that hyperparameter is not important. However, he did not consider the impact of feature selection with different timesteps on the crisis.
There are three main differences between this study and previous studies: firstly, we use a Fisher score (FS) [
18] for feature (variable) selection, which can reduce the computational complexity and enhance the model training speed and prediction performance; secondly, we use interpretable multivariate long-short-term memory (IMV-LSTM) [
19] to capture the dynamic changes of different variables in the time series, which enhances the prediction performance and interpretability of the model; finally, we use focal loss (FL) [
20] as the loss function to solve the class imbalance problem of the crisis.
This study uses the FS-FL-IMV-LSTM hybrid model to establish an early warning system that can predict systemic banking crises one year in advance. This study takes the period from 1993 to 2017 (including the 1997 Asian financial crisis, the 2007–2008 global financial crisis, etc.). The objectives of this study are as follows:
This study explores the impact of ESG on systemic banking crises.
This research uses IMV-LSTM to build an early warning model that can predict systemic banking crises one year in advance and can explain the importance of different features in different years.
We added the focal loss commonly used in machine vision to solve the problem of class imbalance and difficult classification, and proved the feasibility.
As a theoretical contribution, we explore the impact of ESG and systemic banking crises. We found that for unbalanced data, such as systemic banking crises, the combination of Fisher score, Focal loss, and IMV-LSTM can achieve very good results.
In terms of application value, we have established an early warning system that can predict crises one year in advance. In the test set, our model can accurately identify the occurrence of each crisis, government departments can use it to regulate macroeconomic policies, and financial institutions and investors can predict risk-taking.
The paper is organized as follows.
Section 2 reviews the literature on systemic banking crises.
Section 3 presents the feature selection and model architecture.
Section 4 presents experimental results on the importance of different features for systemic banking crises at different timesteps. Finally,
Section 5 presents the conclusions and shortcomings of this paper.
2. Literature Review
Financial crises are divided into four types: currency crises, sudden stops, foreign and domestic debt crises, and banking crises [
1]. Sovereign debt and currency crises usually coincide with or follow bank crises [
3]. This study follows the same definition adopted in Laeven and Valencia [
3] for systemic banking crises, reproduced below for convenience: “Signs of a serious financial crisis in the banking system, and important banking policy intervention measures are taken in response to major losses in the banking system.”
Prior literature studies early warning systems for systemic banking crises, which are mainly divided into two categories: statistical methods (signal extraction approach, probit, logit, etc.) and machine learning (ANN, SVM, KNN, etc.). Demirguc-Kunt and Detragiache [
21] proposed multinomial logit and Davis and Karim [
22] considered that multinomial logit was more applicable to multiple countries than the signal extraction approach, and many studies used this method [
23,
24,
25,
26]. Nakatani [
27] used the probit model. The recent literature considered that machine learning is more accurate than traditionally employed methods, Dabrowski et al. [
28] considered dynamic Bayesian networks to be better than the signal extraction approach and logit, Samitas et al. [
29] found SVM was better than logistic regression, DT, KNN, discriminant analysis, and ensemble classifiers, Wang et al. [
30] considered random forest experts voting was the best in machine learning and better than logit. However, Beutel, List, and von Schweinitz [
2] found logit was better than machine learning (ANN, SVM, KNN, and DT) in recursive out-of-sample because the performance of cross-validation and hyperparameter selection to solve the overfitting problem was overestimated. Tölö [
17] considered that although traditionally employed methods and machine learning use panel data, the forecast is almost entirely based on variable cross-sections, and he found that LSTM generated half fewer false alarms than logit, and proved that hyperparameter is not important.
Considering that a systemic banking crisis is a rare event (also known as skewed data or class imbalance data), we use the Fisher score and focal loss to address it. The main reason for the class imbalance problem is that the difference in the number of categories is too large, which affects the model. At present, the main solutions are data-driven and algorithm-driven [
31,
32]. Data-driven includes over-sampling (increasing the minority category), under-sampling (reducing the majority category), and dynamic sampling (combining the former two) [
31]. Data-driven will change the data’s original structure, and the other is algorithm-driven, including a new loss function, cost-sensitive learning, threshold method, etc. [
32]. Focal loss [
20] is a modified version of the cross-entropy function for class-imbalanced data, originally used in computer vision, but also in other fields. Focal loss can not only solve the class imbalance problem but also solve the hard classification problem. Feature selection is an approach often overlooked in dealing with class imbalance problems [
31]. Tölö [
17] had tried permuting each feature, which would have increased the computational cost substantially. For class imbalance problems, feature selection is also one of the commonly used methods [
31]. Fisher score can filter irrelevant features, select relevant features, save computation, and improve model performance. Maldonado et al. [
33] used the combination of the Fisher score and support vector machine to deal with class imbalance data and achieved better results. Therefore, we added feature selection and chose the Fisher score.
We extend ESG from the individual economic level to the national macroeconomic level. ESG is a method for evaluating a company’s operating policies and actions, focusing on their impact on the environment, society, and corporate governance. [
7]. National-level ESG is an assessment of a country’s environmental, social, and governance status, which can help to understand the country’s sustainable development level. Good ESG ratings can reduce sovereign borrowing costs [
12] and mitigate sovereign credit risk [
13].
We use the ESG risk score from countryrisk.io. This database includes the ESG risk scores of countries around the world from 1990 to the 2023, and even estimates ESG risk scores for the next few years. The ESG risk score is based on the sovereign risk score, adding risk factors that measure the health of a sovereign’s environment, social system strength, and quality of governance [
34]. The risk sections consist of these 12 parts: economic growth prospects; institutions and governance; monetary stability; fiscal solvency and public debt; sovereign liquidity; external debt sustainability; private sector strength; climate change and renewable energy; biodiversity; education; health, food insecurity, and poverty; and the labor market, social safety nets, and equality. Dan and Tiron-Tudor [
35], Daniel Francois [
36], and Hassan and Meyer [
37] have used this database for other studies.
Based on the above literature, the research hypotheses are as follows:
Hypothesis 1. The higher the ESG risk score, the greater the likelihood of a systemic banking crisis.
3. Methodology
How to determine whether systemic banking crises will occur is very important. We chose the IMF Economic Review systemic banking crises database II [
3] for 2020. This database draws on 151 systemic banking crises episodes around the globe from 1970 to 2017. This study establishes an early warning system for systemic banking crises., the research object is G20, and the research period is from 1993 to 2017.
The research object is G20 because it has an important influence on the global economy. The G20 members represent around 85% of the world’s economic output, two-thirds of the global population, and 75% of international trade [
5]. The G20 comprises 19 countries (Argentina, Australia, Brazil, Canada, China, France, Germany, India, Indonesia, Italy, Japan, Republic of Korea, Mexico, Russia, Saudi Arabia, South Africa, Turkey, UK, and United States) and the European Union. Considering the complexity of the European Union member states, this study does not include the European Union in the scope of the study.
This study takes the period from 1993 to 2017, including the 1997 Asian financial crisis, the 2007–2008 global financial crisis, etc. Since our model uses the systemic banking crises database II [
3], which includes systemic banking crises from 1970–2017, our research period is 2017 at the latest. Due to the difficulty of collecting old data, especially in developing countries, we ended up collecting data after 1993.
The research architecture is shown in
Figure 1, there are three main characteristics. Firstly, feature selection can improve the training speed and prediction accuracy of the model, and we choose the Fisher score because of its advantages of small computational effort and high accuracy. Secondly, IMV-LSTM model is a dynamic model that can calculate multiple time series simultaneously, which is more accurate and explanatory compared with LSTM. Finally, considering that crises are rare events, we solve the class imbalance problem by focal loss without changing the data structure.
3.1. Crisis Indicator
This study uses the systemic banking crises database II [
3]. In this study, the occurrence of systemic banking crises is defined as 1, and the absence of occurrence is defined as 0. To better predict, we lead
by one year and mark it as
[
17,
30]. The year of the systemic banking crisis is shown in
Table 1, and its formula is as follows:
where
represents different countries and
represents different years if a systemic banking crisis occurs,
takes 1, otherwise 0. In other words, we use the independent variable of the 4 years before year
to predict the dependent variable of the
year.
3.2. Early Warning Features
Macroeconomic variables can measure the overall economic trend of a country. This study uses ESG risk scores (ESG) where higher scores indicate greater ESG risk, real GDP annual growth rate (GDPGR), consumer price inflation (CPI), unemployment rate (UR), house price indicator (HP) which was 100 in 2010, current account balance divided by GDP (CABGDP), gross capital formation divided by GDP (GCFGDP), net foreign direct investment inflows divided by GDP (FDIGDP), and gross domestic savings divided by GDP (GDSGDP) are suitable features for predicting systemic banking crises [
2,
17,
21,
23,
38]. The specific definitions and sources of early warning features are shown in
Table 2.
ESG is the risk score of environmental, social, and governance, where higher scores indicate greater ESG risk. The ESG risk score is based on the sovereign risk score, adding risk factors that measure the health of a sovereign’s environment, social system strength, and quality of governance. We use the indicators from the countryrisk.io database [
34], consisting of the following 12 determinants: (1) economic growth prospects, (2) institutions and governance, (3) monetary stability, (4) fiscal solvency and public debt, (5) sovereign liquidity, (6) external debt sustainability, (7) private sector strength, (8) climate change and renewable energy, (9) biodiversity, (10) education, (11) heath, food insecurity, and poverty, and (12) labor market, social safety nets, and equality. To our knowledge, no one has used ESG as a dependent variable to explore its relationship with systemic banking crises, Dan and Tiron-Tudor [
35] have used this database for other studies.
GDPGR is the annual growth rate of real gross domestic product (GDP), which reflects the growth rate of a country’s economic size and wealth and is an important macroeconomic indicator. GDPGR is often used as an indicator to predict systemic banking crises [
2,
17,
23,
26].
CPI is the consumer price index, which reflects the change in the price level of consumer goods and services related to people’s life. CPI is an important indicator of inflation and an important macroeconomic indicator. CPI is often used as an indicator to predict systemic banking crisis [
2,
23].
UR is the unemployment rate, which is the number of people in the labor force who are still not working out of the total number of employed people who meet the conditions of employment and measures the amount of idle labor capacity [
26].
HP is the index of housing prices, which refers to the market value of occupied land during the time period. The average property price for each country in 2010 is 100, and the price of housing at other times is calculated on that scale. HP is often used as an indicator to predict systemic banking crises [
2,
17].
CABGDP, GCFGDP, FDIGDP, and GDSGDP are the values of Current Account Balance, Gross Capital Formation, Net Foreign Direct Investment Inflows, and Gross Domestic Savings divided by GDP, respectively. This eliminates the influence of different countries’ background factors in this indicator and is often used as a predictor of systemic banking crises [
2,
17,
21,
23,
38].
3.3. Fisher Score
The purpose of feature selection is to reduce the number of features needed to train the model, thus reducing the computational complexity and increasing the model’s training speed and prediction accuracy.
A Fisher score is a feature selection algorithm for supervised learning, which can retain highly relevant features and filter redundant features. The Fisher score (
FS) principle is that the characteristics of samples of the same category are similar, and its formula is as follows [
39]:
where
represents feature and
represents class,
means number in class
,
and
represent the mean and standard deviation of the
class of the
feature, respectively, and
is the mean of samples corresponding to the class
.
3.4. Interpretable Multi-Variable Long Short-Term Memory
Interpretable Multi-Variable Long Short-Term Memory (IMV-LSTM) is a dynamic model based on the attention mechanism, which can be computed for time series data by combining multiple time periods, which enhances the prediction performance and interpretability of the model. Tölö [
17] considered that statistical models and machine learning models both have drawbacks in predictions based on cross-sectional data, and LSTM is a dynamic model that can really take the effect of data time series into account. IMV-LSTM adds an attention mechanism to the LSTM to improve the accuracy of the model and the interpretability of the effect of different timestep variables on the results [
19].
Recurrent Neural Networks (RNNs) are very suitable for processing time series data and can combine multiple temporal features for dynamic crisis prediction [
17,
40]. However, when the number of time steps of the recurrent neural network is small or large, there will be problems of gradient disappearance and gradient explosion. The Long Short-Term Memory (LSTM) proposed by Hochreiter and Schmidhuber [
41] can solve its gradient disappearance and gradient explosion problems well by adding input gate, forget gate, and output gate to RNN.
Interpretable Multivariate Long Short-Term Memory (IMV-LSTM) has better interpretability compared with LSTM [
19]. Compared with Tölö [
17], which calculates the impact of features in LSTM on the crisis through Shapley value, IMV-LSTM can not only calculate the feature contribution, but also analyze the driving factors for the crisis at different times. IMV-LSTM is a probabilistic mixture-based training method with an attention mechanism, which can learn the importance of parameters, features, and time at the same time. Compared with LSTM, the IMV-LSTM formulation is updated as follows:
where
means hidden state update,
is the hidden state matrix of the previous time step,
is input-to-hidden transition,
represents the product of two tensors,
is Hadamard (element-wise) product,
and
are updated according to the hidden state of the previous step and the new input, respectively.
3.5. Focal Loss
Focal loss (
) is an algorithm that can solve the class imbalance problem without changing the data. The class imbalance problem was solved by over-sampling or under-sampling the data, which by its nature changes the data structure. Lin, Goyal, Girshick, He, and Dollár [
20] proposed focal loss in the field of computational vision, which can solve this problem without changing the data, has good generalization, and has been used in several fields.
The cross entropy (
) is a commonly used binary classification loss function, and its formula is as follows [
20]:
where
represents the estimated probability for class
.
loss is difficult to deal with the class imbalance problem, and Balanced Cross Entropy (
) loss is a commonly used solution, the formula is as follows:
which introduces a weighting factor
for class
and a weighting factor
for the other class,
can be set as a hyperparameter.
Although a solves the class imbalance problem, it cannot distinguish between easy-to-classify and hard-to-classify samples for training. Focal loss down weights easy examples to focus training on hard-to-classify examples, the formula is as follows [
20]:
where
and
are hyperparameters,
deals with class imbalanced samples, and
deals with hard-to-classify samples.
4. Results
4.1. Data Split and Hyperparameter Setting
This research is done using python 3.7.10 based on PyTorch [
42] and scikit-learn [
43] framework, and the code refers to GitHub [
39,
44,
45,
46,
47] and scikit-learn API [
48].
Considering that cross-validation will overestimate the performance of machine learning models [
2,
49], We split the data between the training dataset (including the Asian financial crises) and the test dataset (including the subprime mortgage crisis) with a ratio of 5:5.
The final hyperparameters of FL-IMV-LSTM are set as follows: time steps = 4, batch size = 1, neuron = 16, epochs = 50, optimizer is Adam, learning rate = 0.0001; the loss function is focal loss, where gamma is 2 and alpha is 0.97 (is approximately equal to the probability of not having a crisis).
4.2. Descriptive Statistics
We lead y (LY) by one year for forecasting. Therefore, FY is for 1994–2017 and the other variables are for 1993–2016, for a total of 24 years for 19 countries.
Table 3 indicates Descriptive statistics. The mean value of FY is 0.0351, indicating that the probability of a systemic banking crisis in 24 years in 19 countries is about 3.51%, which is a rare event (also known as class imbalance problem).
A larger ESG indicates a higher ESG risk, with a mean ESG of 0.3088 and a standard deviation of 0.1479, indicating that the average ESG risk is low across 19 countries over 24 years and varies widely across countries.
The CPI has a mean value of 0.1843 and a standard deviation of 1.3956. This indicates that inflation is generally large across countries and varies widely across countries. The mean value of HP is 0.8118 and the standard deviation is 0.3156, indicating that there is also a large variation in house prices across countries. The mean value of CABGDP is 0.0022 and the standard deviation is 0.0487, indicating that the current account balance as a percentage of GDP does not vary much between countries. The mean value of UR is 0.0806 and the standard deviation is 0.0526, indicating an average unemployment rate of about 8. 06% for the 19 countries over 24 years.
Figure 2 shows the ESG risk score of G20 countries in 2022, arranged in descending order (Due to the war in Russia, Russia’s ESG risk score in 2022 has not been updated, and Russia’s ESG risk score in 2021 is shown in the figure). The greater the ESG risk scores, the greater the ESG risk of the country in 2022. The ESG risks of Brazil, India, South Africa, and Argentina are all very high in 2022. Germany has the lowest ESG risk, followed by Australia.
Table 4 represents the ESG risk score before a systemic banking crisis,
represents the year of the crisis, and
represents one year before the crisis. Since our model predicts whether a systemic banking crisis will occur in the fifth year based on the data of the previous four years, the number of crises actually predicted will be less than that in
Table 1.
4.3. Feature Selection
We use the Fisher score for feature selection. The principle is that features of the same category are similar and features of different categories are different. Finally, we choose a score greater than 0.001 as the model feature variable. Finally, we select CPI, HP, ESG, CABGDP, and UR; exclude FDIGDP, GDPGR, GCFGDP, and GDSGDP, as in
Table 5.
4.4. Prediction Performance
4.4.1. Confusion Matrix Metric Description
Classification tasks are often evaluated by confusion matrices, including true positive (TP), true negative (TN), false positive (FP), and false negative (FN), as
Table 6. TP and TN indicate correct predictions, where TP indicates that both the prediction and the actual are positive, and TN indicates that both the prediction and the actual are negative. FP and FN denote incorrect predictions, where FP indicates that the prediction is positive but actually negative, and FN indicates that the prediction is negative but actually positive.
The class imbalance problem should not only focus on Accuracy but also on Recall, Precision, and F1-score, formulas and examples are shown in
Table 7.
Area Under the Curve (AUC) is a common metric that can be used to evaluate the performance of different classification models. The higher the AUC, the better the predictive power of the model.
4.4.2. Comparison of Model Prediction Performance
Table 5 shows that among the 200 samples in the test set, we successfully predicted the occurrence of six systemic banking crises, 125 did not occur, and no crisis was missed.
Our proposed FS-FL-IMV-LSTM can successfully predict every systemic banking crisis one year in advance, as shown in
Table 7. The accuracy of this model is 0.6550, indicating an overall accuracy rate of 65.5%, which is in the middle to upper range. However, systemic banking crises are rare events that can bring huge losses if they are not warned in advance, so it is more important to focus on recall. The recall of this model is 1, indicating the ability to provide 100% early warning of systemic banking crises one year in advance. The AUC of this model is 0.8153, which also gets a substantial improvement compared with other models. Both Precision and F1 also outperformed the other models.
Table 8 represents the performance evaluation of each model prediction. The other models (The first six machine learning models) have high accuracy but 0 recall, even if the class weight is set to balance, this means that it is impossible to accurately predict the crisis. FL-IMV-LSTM, although recall reaches 100%, can accurately predict crises. However, the accuracy rate is too low, only reaching 3%, and almost all the data are predicted to have a crisis.
Figure 3 represents that FS-FL-IMV-LSTM’s AUC is 0.8149, significantly higher than the chance level.
Our proposed FS-FL-IMV-LSTM outperforms other models in terms of overall performance and practical use.
4.5. Interpretation
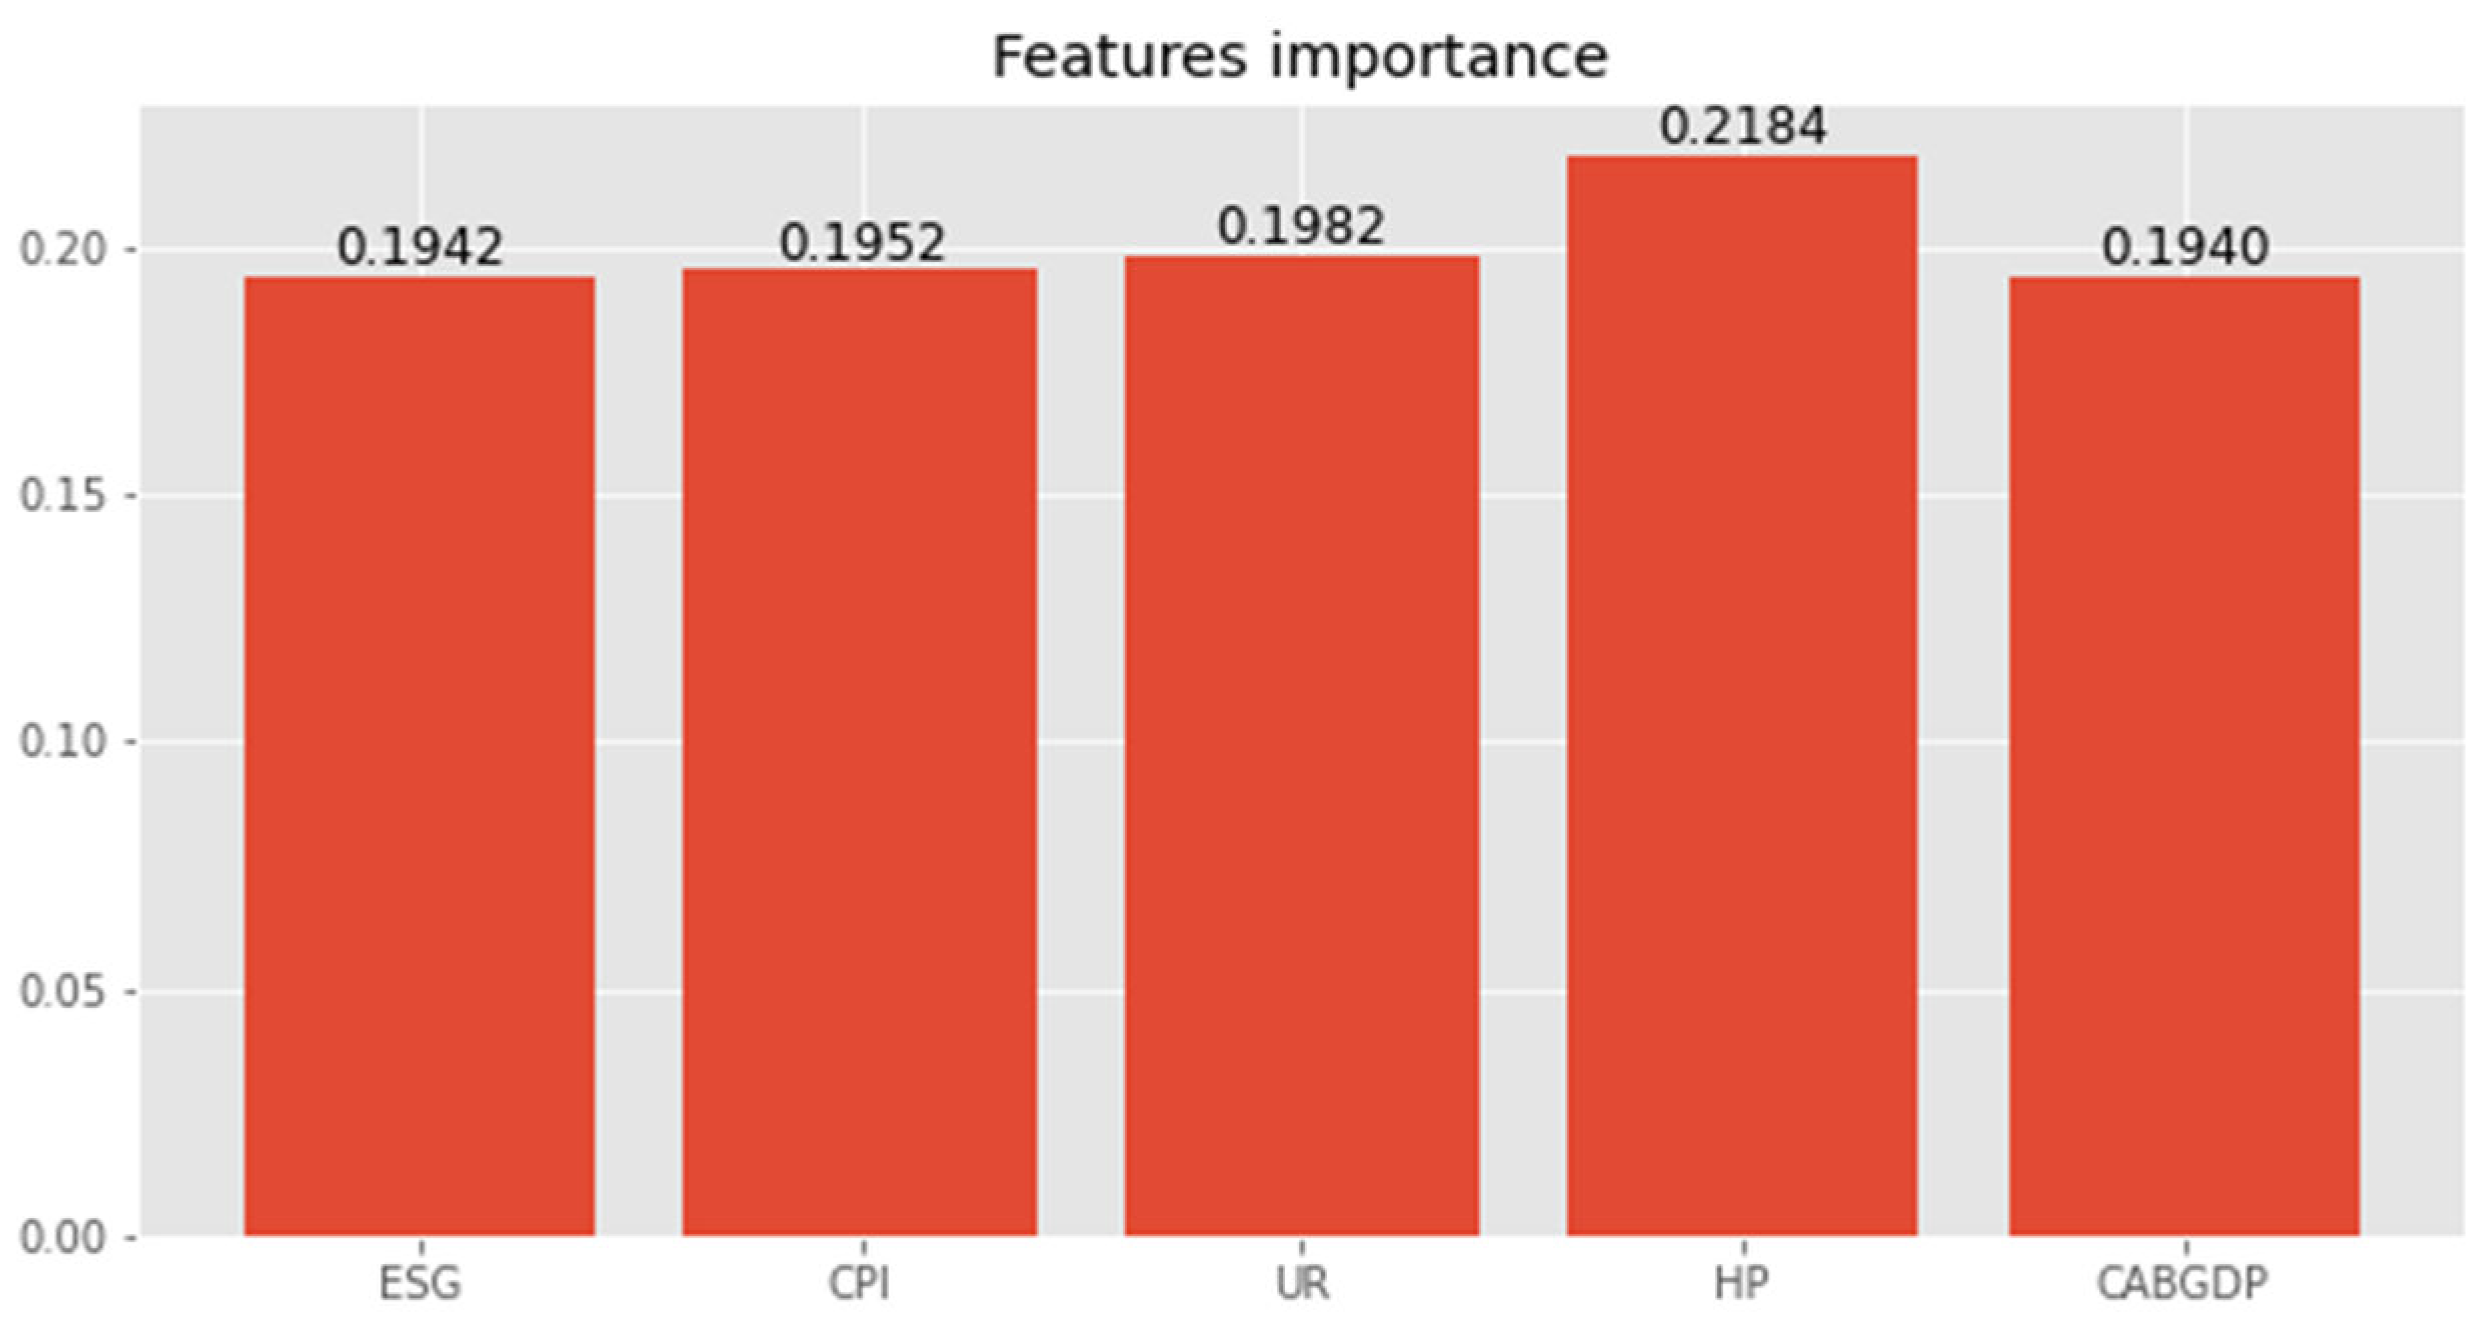
Figure 4 represents the importance of variables in crisis forecasting. Where HP is 0.2148, the largest share, indicating the greatest importance of house prices for predicting the crisis. The importance of the other variables ranged from 0.1940 to 0.1982, and there was no particularly large difference.
It is worth mentioning that the importance of ESG reaches 0.1942, indicating that, among these five variables, ESG has an impact of 19.42% on predicting systemic banking crises. Therefore, we believe that the country-level Environment, Social, and Governance variables can predict systemic banking crises, which is consistent with Hypothesis 1. The higher the ESG risk score, the greater the likelihood of a systemic banking crisis.
Since the ESG risk score is based on the sovereign risk score and incorporates risk factors such as environmental health status, social system strength, and governance quality, we believe that this indicator reflects the country’s macroeconomic situation to a certain extent, so the ESG risk score is important for the future and has significant implications whether or not a systemic banking crisis occurs.
Figure 5 represents the importance of each variable at different timesteps, with colors closer to yellow indicating a more significant contribution to the prediction.
The importance of each timestep of ESG is about 0.25, indicating that whether a systemic banking crisis will occur in the fifth year, the contribution of ESG in the first four years is equal.
Regarding whether there will be a systemic banking crisis in the fifth year, the importance of CPI in the timesteps of year is 0.2419, year is 0.2475, year is 0.2528, and year is 0.2578, indicating that for the first four years the impact of China’s Consumer Price Index on the systemic banking crisis is increasing year by year.
The importance of UR, HP, and CABGDP at each time step is almost the same, all around 25%, indicating whether there will be a systemic banking crisis in the fifth year, and the contribution of UR, HP, and CABGDP in the first four years is equal.
Compared with Tölö’s [
17] use of the Shapley value to analyze the importance of variables in LSTM, IMV-LSTM can analyze the impact of different variables on each timestep in the model.
5. Conclusions
This study collates data from 1993 to 2017 for G20 countries, uses the FS-FL-IMV-LSTM model to establish an early warning system that can successfully predict every systemic banking crisis one year in advance, and explores the relationship between ESG and systemic banking risks.
The theoretical contribution of this study is to fill in the blank of whether ESG affects the systemic banking crisis and the importance of different variables to the crisis at different timesteps. We find that ESG has a significant impact on systemic banking crises, consistent with Hypothesis 1. The higher the ESG risk score, the greater the likelihood of a systemic banking crisis. We find that ESG, the inflation rate, the unemployment rate, house price, and the ratio of the current account balance to GDP all affect the occurrence of systemic banking crises. It is worth noting that inflation in the year before the crisis had a greater impact than in the four years preceding the crisis. We believe that the ESG risk score is a sovereign risk score that incorporates ESG, which can reflect the country’s macroeconomics to a certain extent and can predict systemic banking crises. We also found that when dealing with class imbalance, adding feature selection and focal loss to the deep learning model can achieve better results.
The practical contribution of this study is that it achieved a 100% recall rate on the test set, which means that every crisis was predicted by our early warning system (FS-FL-IMV-LSTM). We hope that this early warning system, which can be predicted one year in advance, can be used as a reference for government departments, financial industry regulators, and researchers to reduce the major losses caused by systemic banking crises.
However, this study has not obtained how much impact the changes of different variables at different times will have on the probability of crisis occurrence. This study fails to divide ESG into three parts, which are studied from the aspects of the environment, society, and management.
The occurrence of a systemic banking crisis has a significant impact on the economy and society. We hope this research can make some contributions to theoretical and practical research.


