Article

Computational Model of Noradrenaline Modulation of Astrocyte Responses to Synaptic Activity

1
Department of Theoretical Physics, Kursk State University, Radishcheva St. 33, 305000 Kursk, Russia
2
Department of Biophysics, Biological Faculty, Lomonosov Moscow State University, Leninskie Gory St. 1/24, 119234 Moscow, Russia
3
Department of Molecular Neurobiology, Institute of Bioorganic Chemistry RAS, GSP-7, Miklukho-Maklay St. 16/10, 117997 Moscow, Russia
4
Department of Optics and Biophotonics, Saratov State University, Astrakhanskaya St. 83, 410012 Saratov, Russia
*
Author to whom correspondence should be addressed.
Submission received: 29 December 2022 / Revised: 20 January 2023 / Accepted: 21 January 2023 / Published: 26 January 2023

Abstract

:
The mathematical modeling of synaptically connected neuronal networks is an established instrument for gaining insights into dynamics of neuronal ensembles and information processing in the nervous system. Recently, calcium signaling in astrocytes—glial cells controlling local tissue metabolism and synapse homeostasis—and its corresponding downstream effect on synaptic plasticity and neuromodulation appeared in the limelight of modeling studies. Here, we used mechanism-based mathematical modeling to disentangle signaling pathways and feedback loops in the astrocytic calcium response to noradrenaline, an important neuromodulator marking periods of heightened alertness and arousal. The proposed model is based on an experiment-based 2D representation of astrocyte morphology, discrete random glutamate synapses with placement probability defined by the morphology pattern, and spatially heterogeneous noradrenaline sources, reflecting axonal varicosities of the adrenergic axons. Both glutamate and noradrenaline drive Ca 2 + dynamics in the astrocyte in an additive or synergistic manner. Our simulations replicate the global activation of astrocytes by noradrenaline and predict the generation of high-frequency Ca 2 + waves in a dose-dependent manner and the preferred Ca 2 + wave origination near noradrenaline release sites if they colocalise with high-density clusters of glutamate synapses. We tested positive feedback loops between noradrenaline release and glutamate spillover directly or mediated by gliotransmitter release from the activated astrocyte. The simulations suggest that the coupled stochastic drive by glutamate and noradrenaline release converges on the graded modulation of the IP 3 level, which is translated into whole-cell Ca 2 + waves of different frequencies. Thus, the proposed approach is supported by experimental data and can be used to address situations inaccessible directly by experiment, and is a starting point for a more detailed model that includes other signaling mechanisms providing negative feedback.

1. Introduction

Mathematical models of synaptically connected neurons represent only one facet of information processing in the real nervous system. It has now been established that a variety of extra-synaptic connections play an equally important role, and are mediated both by other cell types and by the diffusion of neurotransmitters in the intercellular space [1,2,3,4].
In particular, network dynamics of the cerebral cortex are not controlled exclusively by neurons: the other equally abundant non-neuronal cells of the cortex— astrocytes—take the lead in many regulatory aspects. The broad spectrum of astrocyte functions has been intensively studied over the past two decades [4,5,6,7]. Astrocytes are involved both in the synaptic transmission itself (as a part of the so-called tripartite synapse [8,9,10]) and in providing the neurons with energy in the form of metabolic substrates, forming neurovascular units (NVU) [11,12,13].
The tripartite synapse concept in modeling studies was pioneered by Nadkarni and Jung [14,15]. A number of modeling studies are devoted to simulating the main functions of NVU [16,17,18,19], or the role of astrocytes in brain functions [20,21]. In these studies, the coupling pathways are described as sets of one or more ODEs for each compartment. The development of such models was largely stimulated by attempts to understand the mechanisms of the formation of extreme states of the nervous tissue that occur during spreading cortical depression, migraine with aura, and brain injuries. [22,23,24,25]. In these cases, the state of neurons and astrocytes changes dramatically. However, by now, it has been established that NVU is also sensitive to quite moderate physiologically normal changes in neuronal activity, such as the transition between sleep and wakefulness [26,27,28,29].
It should be noted that models in the form of a set of point ODEs are insufficient for an adequate description of physiological mechanisms that underlie the observed phenomena, even within the framework of one single NVU.
Specifically, the complex morphology of the astrocyte and the spatial pattern of synaptic terminals form a spatially heterogeneous structure, creating a wide variety of spatiotemporal patterns of activity [30,31,32].
Earlier, we proposed an approach toward the construction of mathematical models that takes into account this heterogeneity [33]. The complex morphology of an astrocyte is simulated by a parameter set on a two-dimensional grid, the value of which reflects the ratio of intracellular and extracellular volumes, which, in turn, determines local dynamics attributed to a given location. The proposed approach has been successfully applied to simulate the network dynamics of astrocytes [34].
In this paper, we extended this approach to the next, more complex level of this type of model. Namely, we aimed at developing a computational workbench to adequately describe the noradrenaline (NA) effect on astrocyte calcium dynamics. NA is released throughout the central nervous system as a general neuromodulator linked to vigilance and exploratory behavior. Marked astrocytic calcium responses to NA have been observed; for example, during locomotion [35]. Even larger-scale changes in NA levels accompany the transition from sleep to wakefulness [27,36]. The study of the interaction between NA-based signaling and the NVU is important; in particular, for understanding the characteristics of the intercellular volume regulation, which is considered as the key factor for the removal of harmful metabolites from the brain parenchyma and thus is directly related to the risk of neurodegenerative diseases [27,37,38].
Our modeling study is based on current still-far-from-complete knowledge of the action of NA on synapses and astrocytes; in particular, on (1) experimental data where, in the presence of NA, the astrocyte becomes more sensitive to perisynaptic glutamate (Glu), responding with bursts of calcium activity to more weak synapse activity [35], and (2) GANE (“glutamate amplifies noradrenergic effects”) hypothesis [39]. Proposed mechanisms underlying GANE are justified at the behavioral level as a way to quickly shift attention to important events. At the cellular level, the authors of [39] suggested specific pathways that may provide the desired effect by creating a positive feedback between synapse activity and the local release of NA.
The simulation of these mechanisms requires a mathematical model with an adequate spatial structure. The essential features of our model are (1) a detailed 2D representation of the astrocyte morphlogy based on experimental data, (2) a spatially and temporally randomized definition of activity in excitatory synaptic terminals, and (3) a spatially heterogeneous NA profile, including both diffuse-level and localized sources.
Our simulation results corroborate and complete the published experimental data. At the same time, the constructed model allows for testing situations that are difficult or impossible to reproduce or control experimentally. In this regard, we present simulation results that reproduce the GANE mechanism and show the stability of the entire system (synapse, astrocyte, source of NA) in the presence of the new positive feedback loops.

2. The Model

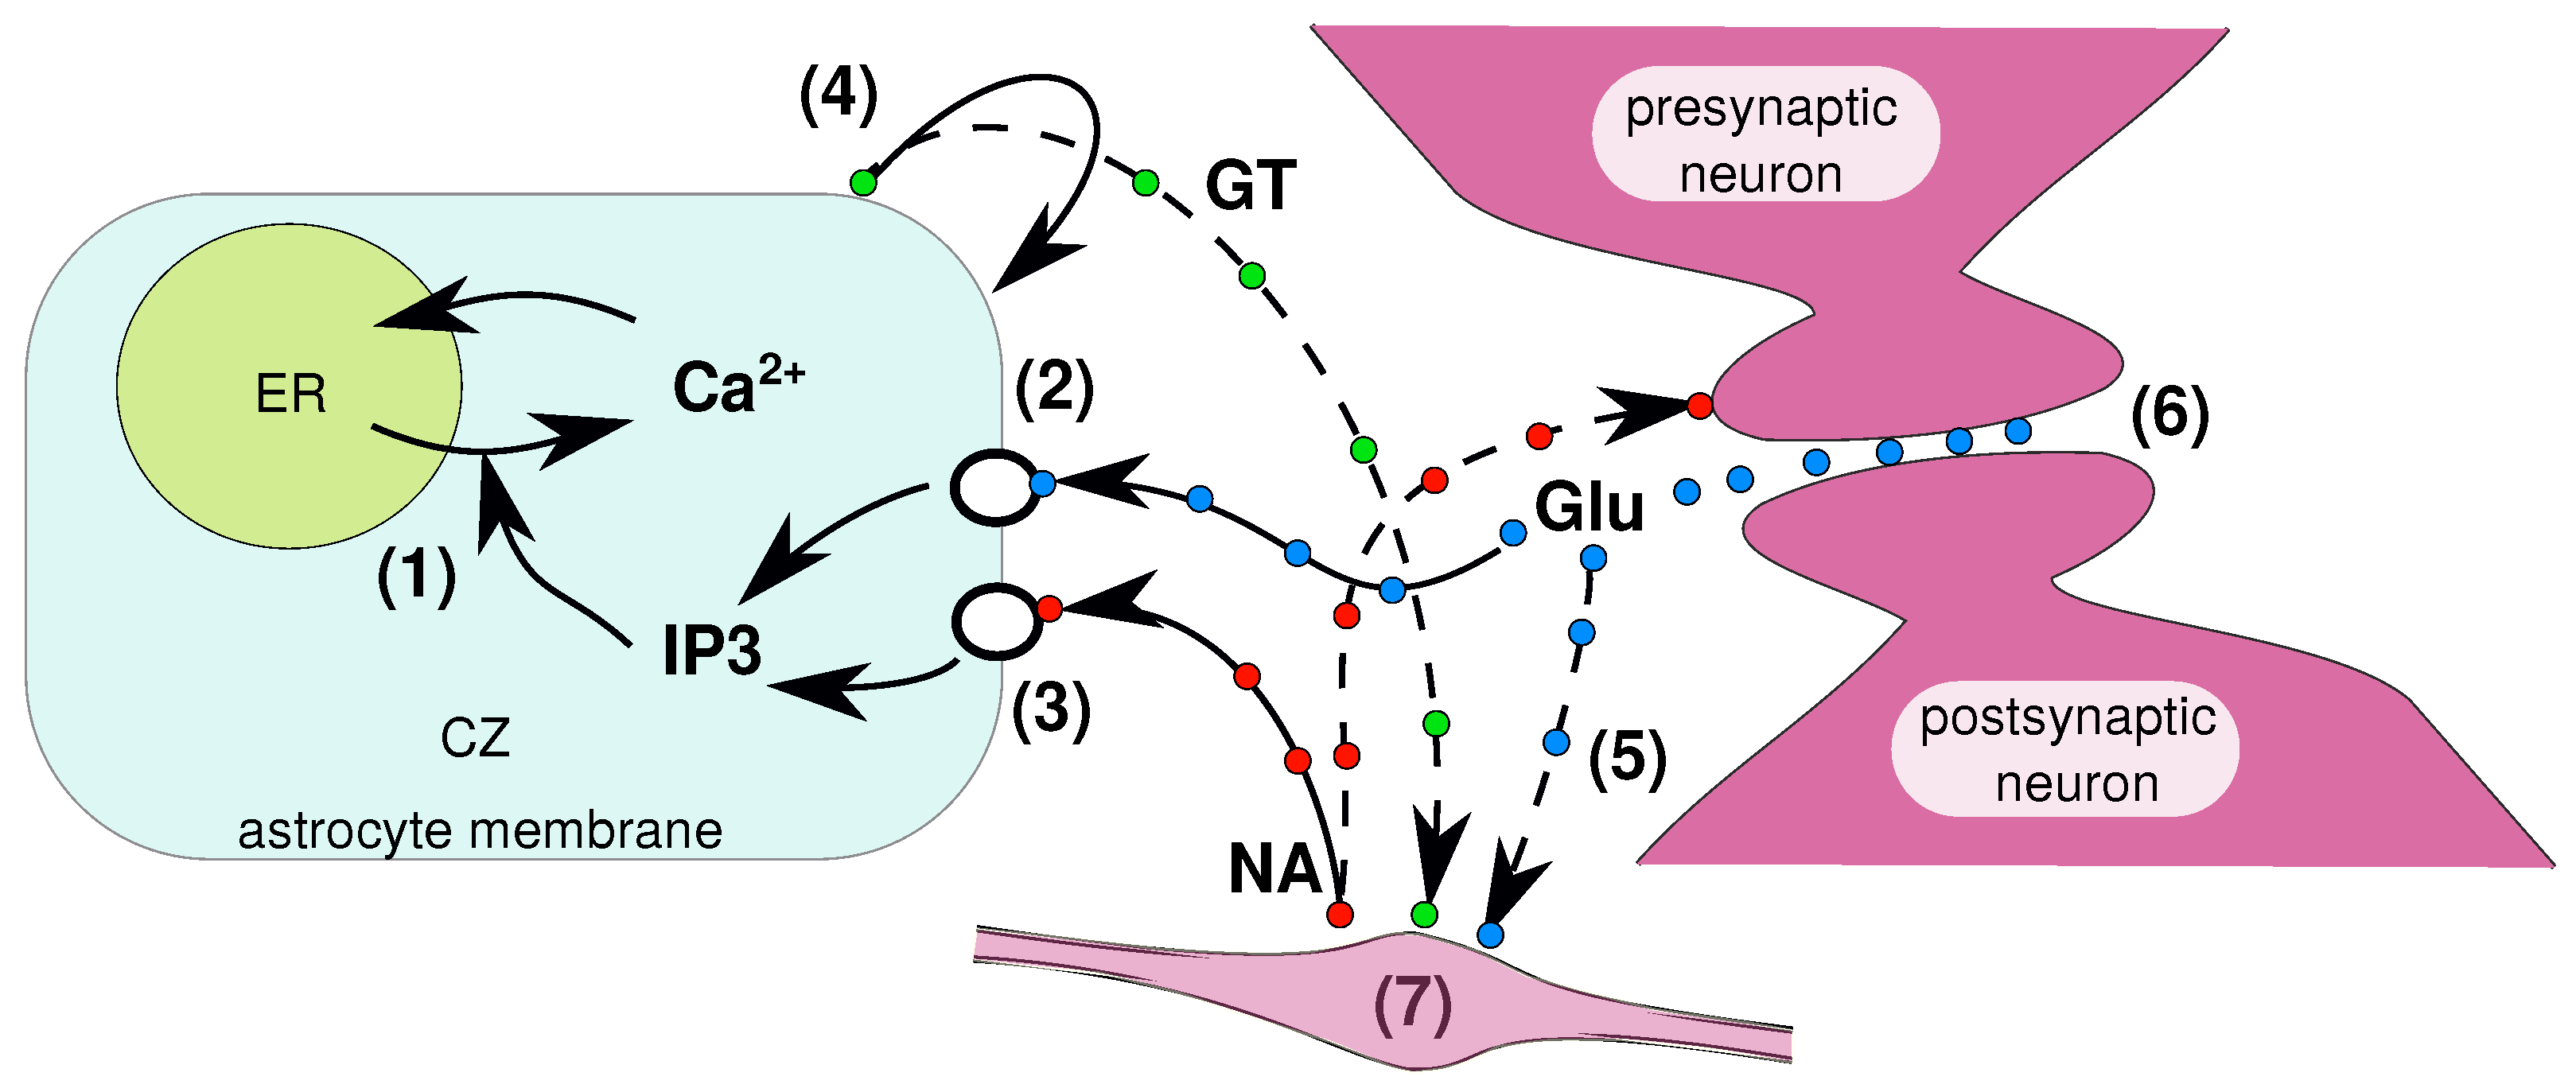
2.1. Pathways to Be Modeled

The modeled physiological mechanisms are illustrated in Figure 1. Unlike neurons, astrocytes are not electrically excitable and do not generate electrical impulses [40]. Instead, the universal response to a variety of stimuli is a calcium spike generated by its release from internal stores. Therefore, the core of the model is the calcium subsystem (1). Its activation is possible through various mechanisms, including direct calcium influx through the plasma membrane or indirectly by the activation of G-protein-coupled receptors (GPCRs) via the generation of the intracellular messenger inositol trisphosphate IP 3 [41,42]. We implemented exactly these mechanisms of astrocyte activation, including direct Ca 2 + entry via the plasma membran and, G-protein-coupled receptors for the neurotransmitter Glu (2) and the neurotransmitter NA (3). The activation of calcium dynamics, in turn, triggers many processes in the astrocyte, including the release of gliotransmitters (4), which may affect both the astrocyte itself and the pre- and postsynaptic terminals of neurons.
According to [39], when the synapse (6) is close to a point source of NA, spillover Glu released during synaptic activity also has a stimulatory effect on axonal varicosites (7), increasing the probability of NA release. The scheme presented above does not look particularly complicated. However, Figure 1 does not provide an account of the spatial organization of interaction pathways, which is a crucial part of our study. We discuss this below.

2.2. Topological Issues and AVF Approach

Astrocytes tile the brain parenchyma, forming spatial domains of 40–60 μ m in diameter with little overlap between the neighboring cells. The term “astrocyte” or “star-shaped” cell reflects their structure under some labeling techinques: a small soma with a few major branches, further ramified into daughter branches of several orders. More detailed data, obtained with electron microscopy or genetically encoded fluorescent reporters, indicate that a significant part of the astrocytic domain volume is made up of fine processes, forming a “veil” around larger processes (gray area in Figure 2a).
This observation is crucial to our model design because the size of the processes and hence surface-to-volume ratio (SVR) define the relative input of the different cellular mechanisms that describe calcium dynamics. In this setting, excitable calcium dynamics in the form of an IP 3 -mediated Ca 2 + release from the endoplasmic reticulum (ER) are not observed in thin processes because there is no ER due to their small size. On the other hand, thin processes have a much larger membrane area per unit volume and therefore dominate the overall production of I P 3 . Thus, astrocytic calcium dynamics are a spatially distributed process. This fact can be taken into account in the mathematical model in various ways. A straightforward way is to model the 3D structure of the processes and corresponding mechanisms explicitly. This path is followed by [30] Savtchenko et al. It is realistic but extremely complex and computationally heavy.
In [33], we proposed a simpler approach, illustrated in Figure 2. We built spatial templates for the astrocyte models based on fluorescent confocal 3D stacks of hippocampal astrocytes [43]. After resampling and flattening along the Z-axis by max-projection, the images were used to map the spatial distribution of the “astrocyte volume fraction” (AVF) parameter, which varied from zero if there were no astrocyte processes in the image pixel to one in the pixels corresponding to the cell body or thick processes (Figure 2b).
Figure 2. (a,b) AVF-based approach used to define intracellular mechanisms of Ca 2 + dynamics on the basis of the complex morphology of an astrocyte. (a)—An experimental image of an astrocyte from the cell-centered database [44]; (b)—the resulting 2D spatial AVF map. (c,d) Definition of synapse seeding. (c)—Synapse density within astrocytic domain as a function of local AVF follows normal distribution as suggested by experimental data [45]; (d)—example of the spatial pattern of synaptic terminals if drawn from the described distribution determined by local AVF values for small (0.05, left) and high (0.5, right) values of Ω s y n .
Mathematics 11 00628 g002
The proposed approach is described in detail in [33] and has been successfully applied to modeling the network dynamics of astrocytes in [34]. In this work, we used the AVF map to define (i) the spatial distribution of intracellular calcium dynamics; (ii) the local density of synaptic terminals; (iii) the location of NA sources. To distinguish the location of synaptic terminals from the sources of NA, we used different shades of the green channel; see the code and .gif files in Supplementary Materials.

2.3. Randomly Seeded Synapses

The concept of a tripartite synapse is based on the idea that a part of the glutamate neurotransmitter released during synaptic activity escapes the synaptic cleft and interacts with receptors on nearby astrocyte processes in parallel to its uptake by astrocycic glutamate transporters. In the [33] model, synaptic activity was modeled as a Poisson process. In fact, each pixel of the template was considered as a potential synapse and, accordingly, a source of Glu. However, this is a strong simplification of a more complex phenomenon, because the arrangement of synapses in space is known to depend on the morphology of the astrocyte.
The total density of synapses in the rodent cortex is estimated as 1–2 synapses/ μ m 3 . The size of a single synapse can be estimated based on the fact that the average contact area of the membranes of pre- and postsynaptic neurons is estimated as 0.05 μ m 2 [46,47]. This number roughly corresponds to one pixel of the spatial grid of the template that we used. However, astrocyte activation occurs in the area adjacent to the synapse, so the “effective” area of the synapse can be considered equal to 2 × 2 pixels (≈0.5 μ m 2 ).
The algorithm for arranging synapses on the computational grid is as follows (see also [48]):
1.
We set the synaptic density to Ω s y n ( 0 , 1 ) . This parameter reflects the maximum synapse coverage density in relative units.
2.
The local density of astrocyte synaptic coverage at each point depends on AVF and, according to [45], can be approximated by a Gaussian distribution. Figure 2c shows f ( x ) as a Gaussian curve centered at 0.5 with a standard deviation of 0.2.
3.
The probability P s y n of spawning a synapse at each point ( x , y ) of the spatial template is given as
P s y n ( x , y ) = Ω s y n · f ( AVF ( x , y ) ) .
4.
Finally, we use the defined probability P s y n ( x , y ) to randomly pick the pixels where the synapses are located; then, these sites are enlarged to a 2 × 2 shape to match the effective area of our synapse representation.
Two examples of the synaptic spatial patterns resulting from the application of the described algorithm are shown in Figure 2d.
Because our model does not use explicit neurons, we used a Poisson process to approximate the temporal dynamics in each synapse, which is an established way to model neuronal spiking statistics [49,50]. In this case, the release of Glu in each synapse is described by the equation:
d [ Glu ] d t = [ Glu ] a m b [ Glu ] τ G l u + r G l u ξ p G l u ( t ) + G l u d i f f ,
where [ Glu ] a m b is the basal concentration of Glu, [ Glu ] is its current concentration, and τ G l u is the time constant of Glu clearance. G l u d i f f describes the diffusion flow of Glu between neighboring grid pixels. The term r G l u ξ p G l u ( t ) stands for the amount of Glu released at the current time step:
ξ p G l u = 1 , i f c p G l u r a n d ( ) , 0 , i f c p G l u < r a n d ( ) ,
where r a n d ( ) is a random variable uniformly distributed in the interval ( 0 , 1 ) and c p G l u is the Glu release rate. In our work, in the most general case, it depends on the constant and NA concentration [ N A ] :
c p G l u = p s y n ( 1 + r G N [ N A ] ) .

2.4. Noradrenaline Pathways

The main source of NA in the cortex and other structures of the brain are the axons projecting from the brainstem nucleus locus coeruleus (LC). Unlike excitatory and inhibitory synapses of the local circuits, NA release sites do not have corresponding postsynapses, but form varicosites along the axon, releasing NA to intercellular space. As the very first approximation, one can consider that multiple axons of LC neurons provide some diffuse concentration of NA depending on the current level of LC activity. At the same time, in the presence of NA, the astrocyte becomes more sensitive to perisynaptic Glu [35]. At this level of modeling, the question is only how to include NA in the description of Glu-dependent I P 3 generation, which we discuss in the next section.
However, there is a well-founded hypothesis [39], according to which, the release of NA in separate locations (varicosites) increases with the activity of nearby synaptic terminals. Our model is well suited to realizing this relationship. Accordingly, we represent the source of NA as a combination of its diffuse level and release from several discrete locations. There being little experimental data on the real density of NA-releasing varicosities in the cortex, we limited ourselves to manually adding one to five NA-releasing point sources to the computational grid.
The description of the temporal dynamics of NA is similar to the equations given above for Glu, with a similar meaning of the quantities: In the most general case, in our model, NA dynamics depend on glutamate Glu and gliotransmitter Gt concentrations:
d [ NA ] d t = J N A + [ NA ] a m b [ NA ] τ N A + N A d i f f ,
J N A = r N A + r N G ( [ Glu ] [ Glu ] a m b ) + r N G t ( [ Gt ] [ Gt ] a m b ) ,
where r N A takes a positive value within the selected time interval during the simulation and is set to zero elsewhere. The dependence on current Glu concentration r N G ( [ Glu ] [ Glu ] a m b ) was added according to [39] in its simplest form. Similarly, the term r N G t ( [ Gt ] [ Gt ] a m b ) describes the dependency on gliotransmitter.
Thus, in our work, we assumed that the intensity of the NA inflow depends on the current concentrations of gliotransmitter and Glu and neglected other interactions for simplicity.

2.5. Calcium Dynamics

Below, we give a summary of the equations of local calcium dynamics with brief commentary and explain in more detail only the new elements. This part of the model has been largely described in [33]. The cytosolic calcium concentration in the astrocyte is denoted as [ Ca 2 + ] c and follows the equation:
d [ Ca 2 + ] c d t = ( 1 S V R ( A V F ( x , y ) ) ) J E R + S V R ( A V F ( x , y ) ) J p m + C a d i f f .
For each point of the computational grid, the dimensionless parameter SVR is determined. This allows us to match different AVF values to corresponding SVR parameter values in every point of the spatial template by assuming an S-shaped relation between AVF and SVR. Thus, SVR is minimal in the soma and increases towards peripheral parts of an astrocyte. Because we worked with a two-dimensional template, which is a projection of a three-dimensional shape, the central part of the cell is a projection of not only the soma, but also of thin branches and leaflets located along the projection axis. In this regard, we limited the minimum value of SVR to a non-zero value S V R m i n = 0.1 :
S V R ( A V F ( x , y ) ) = max ( 0.1 , ( 1 + e 10 ( A V F ( x , y ) 0.5 ) ) 1 ) ,
where m a x ( ) takes the value of the largest of the arguments.
Next, we list the flows included in Equation (5) (a detailed description of each of them is presented in [33]):
J E R = J I P 3 + J leak J pump ,
J I P 3 = c 1 v 1 m 3 l 3 h 3 ( [ Ca 2 + ] E R [ Ca 2 + ] c ) ,
J leak = c 1 v 2 ( [ Ca 2 + ] E R [ Ca 2 + ] c ) ,
J pump = v 3 [ Ca 2 + ] c 2 [ Ca 2 + ] c 2 + k 3 2 ,
J p m = J i n J out ,
J in = v 5 + v 6 [ IP 3 ] 2 [ IP 3 ] 2 + k 2 2 ,
J out = k 1 [ Ca 2 + ] c .
Calcium dynamics in the endoplasmic reticulum are described in the equation for the variable [ Ca 2 + ] E R
d [ Ca 2 + ] E R d t = 1 S V R ( A V F ( x , y ) ) c 1 J E R .
The next equation defines the inositol trisphosphate (IP 3 ) concentration [ IP 3 ] in the cytosol:
d [ IP 3 ] d t = S V R ( A V F ( x , y ) ) ( I Δ + I G l u + I N A ) [ IP 3 ] [ IP 3 ] r e s t τ r + [ IP 3 ] d i f f .
Here, J Δ stands for a calcium-dependent IP 3 production mechanism, mediated by phospholipases PLC β and PLC δ :
J Δ = v 4 [ Ca 2 + ] c + ( 1 α ) k 4 [ Ca 2 + ] c + k 4 .
The Glu-dependent IP 3 production is described by Michaelis – Menten-like behavior. We use the term r N A G l u [ NA ] to introduce the influence of NA on this process:
I G l u = v G l u 1 + r N A G l u [ NA ] [ Glu ] 0.3 [ Glu ] 0.3 + k G l u 0.3 .
The NA-dependent IP 3 production is also described by Michaelis – Menten-like behavior:
I N A = v N A [ N A ] 0.3 [ N A ] 0.3 + k N A 0.3 ,
In Equation (18), the noradrenaline impact on I P 3 production is controlled by v N A and r N A parameters, whose various combinations allow us to change the properties of the N A pathway. Namely, choosing r N A = 0 , v N A 0 gives an independent (additive) action of N A on the production of I P 3 , whereas, when choosing r N A 0 , v N A = 0 , we are modeling an increased sensitivity to Glu.
We additionally consider the equation for gliotransmitter dynamics:
d [ Gt ] d t = S V R ( A V F ( x , y ) ) k g t 1 + k M / [ Ca 2 + ] c 2 [ Gt ] a m b [ Gt ] τ g t + G t d i f f ,
where [ Gt ] is the concentration of abstract gliotransmitter, with the resting state value [ Gt ] r e s t . The first term of the equation describes Michaelis – Menten-like gliotransmitter behavior with the parameters k g t and k M . Like earlier, we rely on the assumption that gliotransmitter dynamics differ in different structural parts of the astrocyte cell (soma with thick processes, thin processes, and leaflets) and describe the structural profile of the cell regions using the surface-to-volume ratio parameter S V R ( A V F ( x , y ) ) , including it as a factor in the first term of the equation. It follows that gliotransmitter release is almost non-existent in the soma and thick processes, since there are no synaptic sites and the input of the plasma membrane mechanisms is minimal, whereas, in the areas representing thin branches and leaflets, the number of synapses is maximal, implying the highest probability of gliotransmitter release.
The diffusion of principal variables is simulated in terms of the finite-element approximation of the concentration flows between the neighboring pixels:
Z d i f f ( x , y ) = D Z ( n b Z i , j 4 Z x , y ) ,
where n b denotes all combinations of ( i , j ) that are adjacent to location ( x , y ) and Z is one of the variables [Ca 2 + ], [ I P 3 ], [ N A ], [ G l u ], and [ G t ].
The model also includes an inactivation gate variable h for the variable [ I P 3 ] (see Ca 2 + current J I P 3 via IP 3 receptors in Equation (7):
d h d t = h h τ h .
In addition, flows include the following functions:
m = [ IP 3 ] [ IP 3 ] + d 1 , l = [ Ca 2 + ] c [ Ca 2 + ] c + d 5 , h = Q 2 Q 2 + [ Ca 2 + ] c , τ h = 1 ( a 2 ( Q 2 + [ Ca 2 + ] c ) ) ,
where
Q 2 = d 2 [ IP 3 ] + d 1 [ IP 3 ] + d 3 .
The model parameters that we changed during our further numerical simulations are collected in Table 1. The specific parameter combinations used in each figure are provided in the corresponding captions. The parameters that we did not change can be found in Table 2. The program code for the numerical solution, as well as the software part for numerical research, can be found in Supplementary Materials.

3. Simulation Results

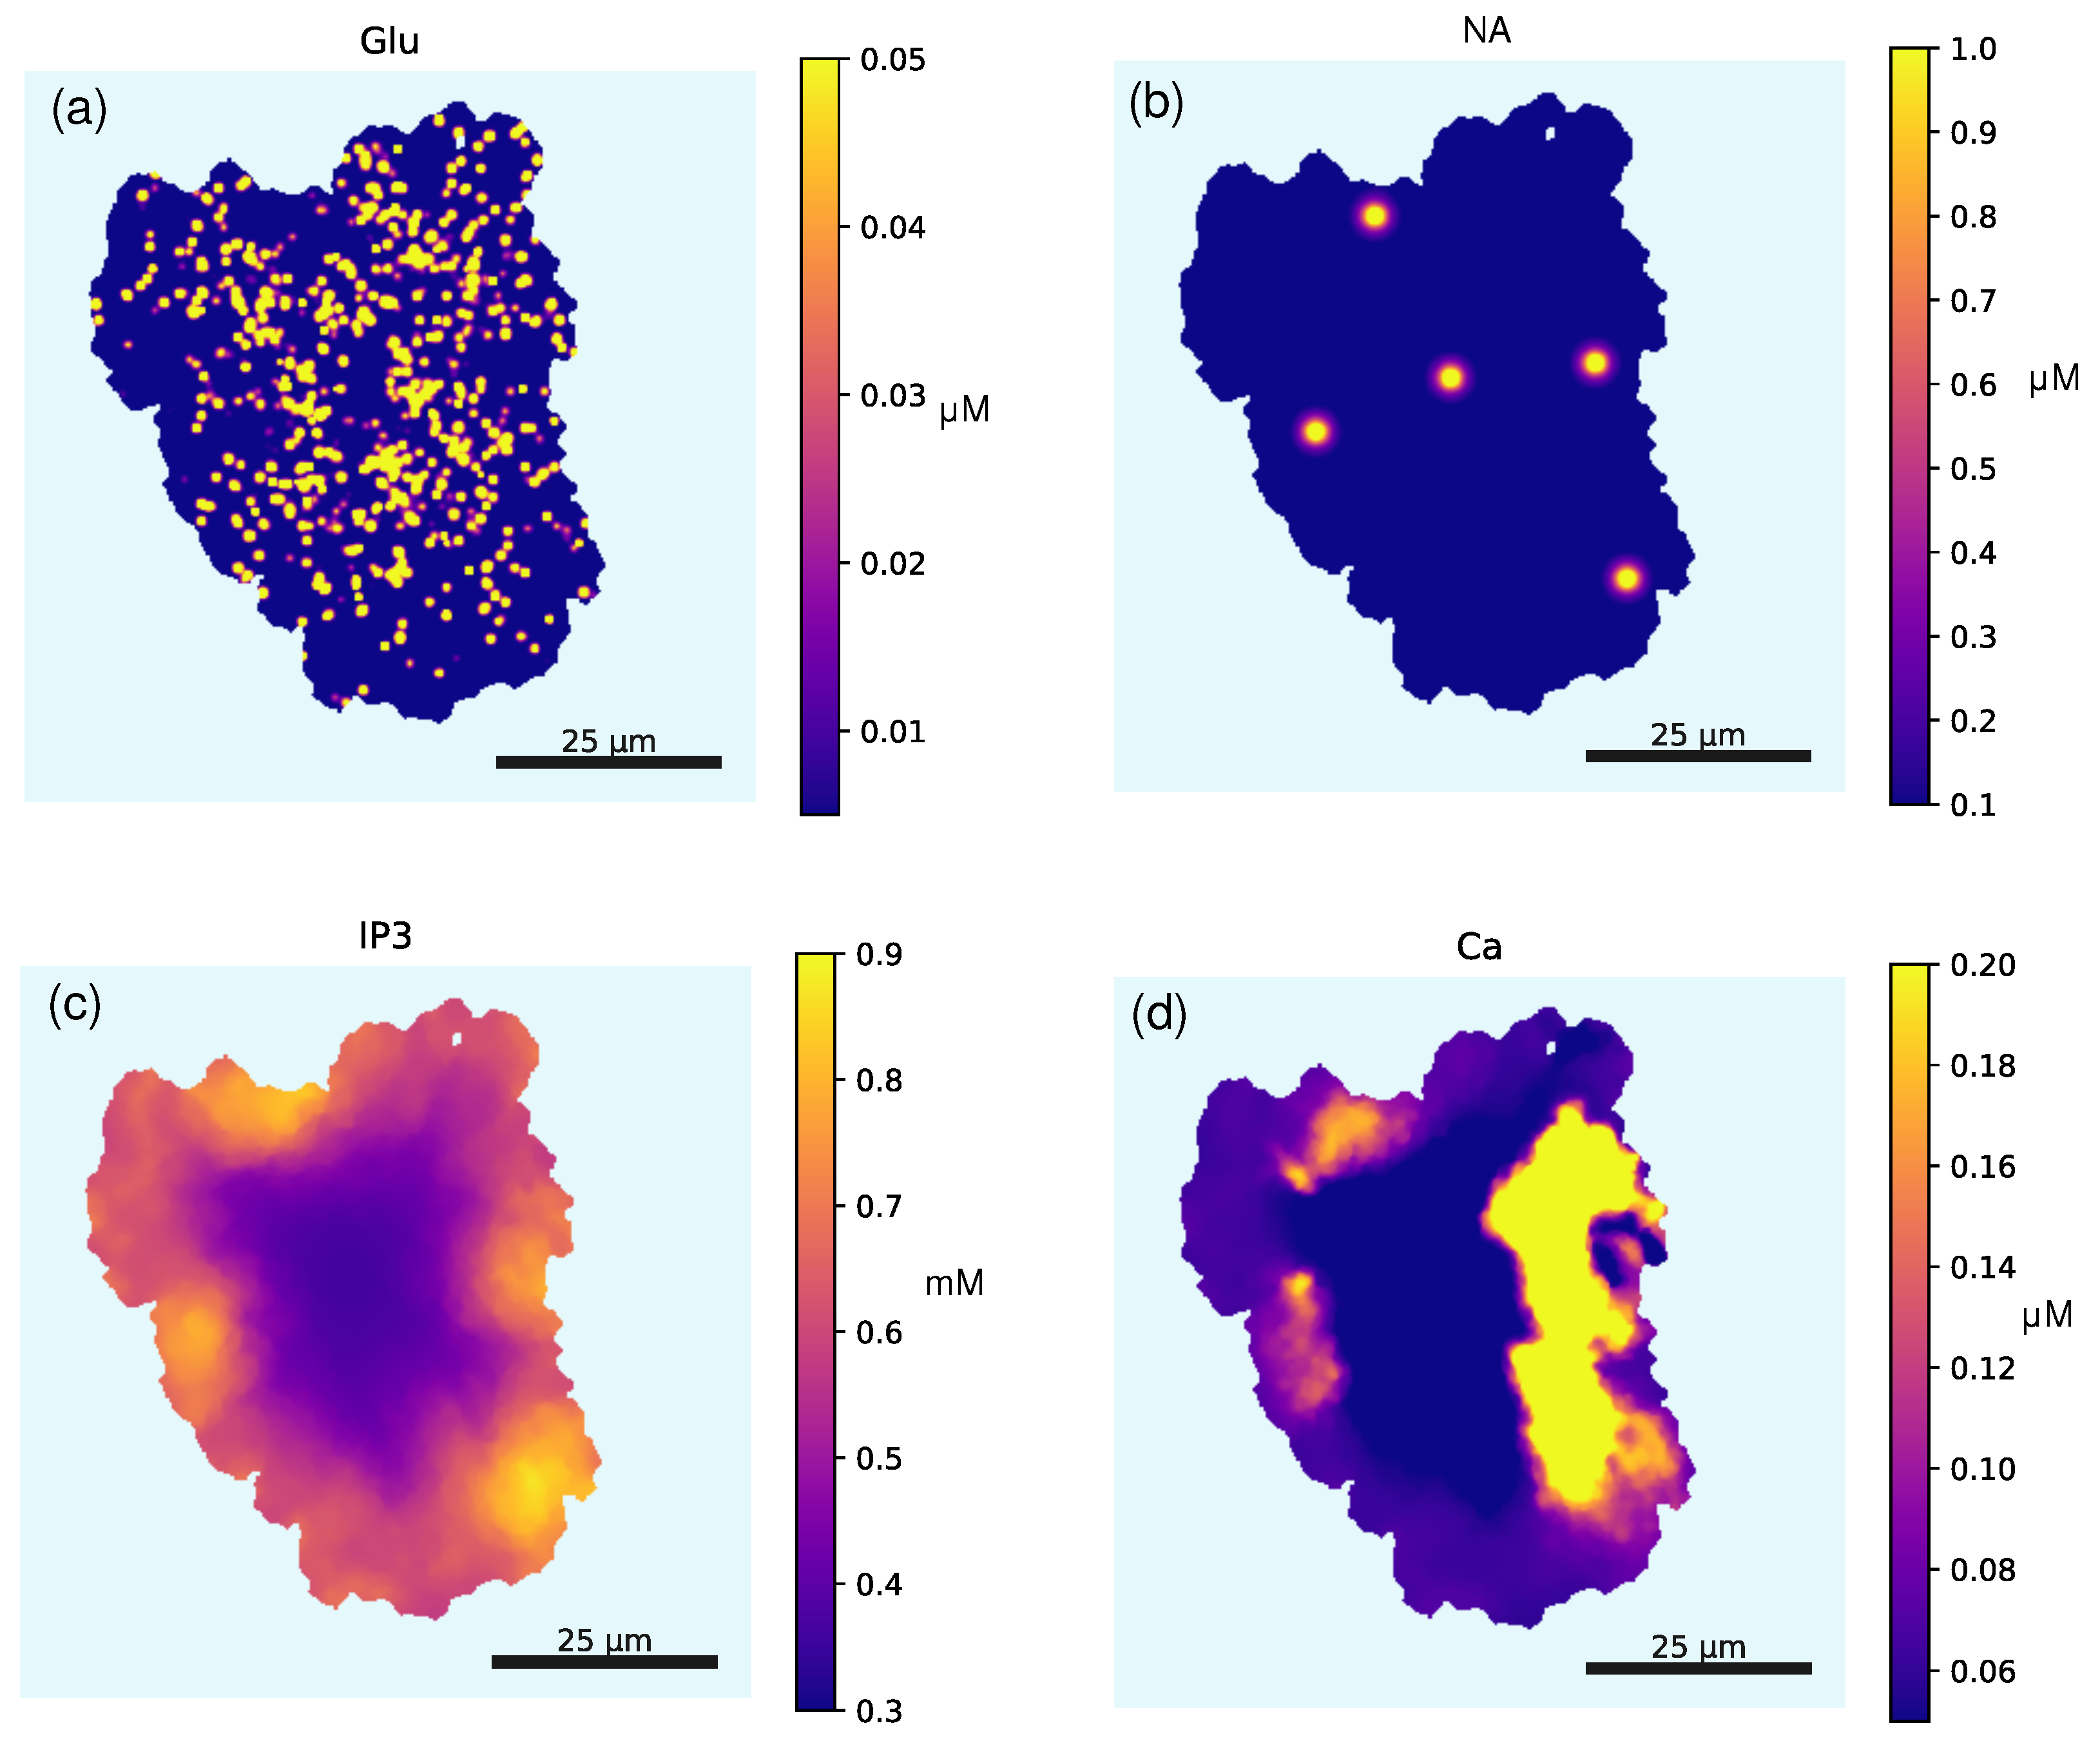
3.1. Dynamics Overview

Figure 3 provides typical instantaneous spatial profiles for the principal variables of the model with parameters as reported in Table 1 and Table 2. In particular, the synapse density is Ω s y n = 0.2 and synaptic drive level p s y n is 0.5 , which leads to a dispersed granular spatial pattern of Glu point sources with little overlap (see Figure 3a). Under these conditions, Glu remains spatially confined within domains of approximately 2 μ M, equivalent to ≈4 px of the in silico spatial template, in accordance with physiological data and supporting the correctness of the choice of diffusion parameters. In the case of NA, we could not base our model on any particular experimental spatial pattern. Instead, to reflect the volume signaling nature of NA, we used a combination of several point sources with a larger spread, corresponding to individual noradrenergic presynapses, and a meanfield ambient level N A a m b (Figure 3b). Thus, NA spillover spots are larger than the corresponding spots of extracellular Glu, which, in principle, allows for their overlap, which is important for GANE hypothesis.
IP 3 production provides a positive feedback loop for Ca 2 + release from ER. IP 3 production is stimulated by both Glu and NA via a classical GPCR-based pathway (G-protein-coupled receptors) and is higher at higher SVR regions, which leads to a heterogeneous IP 3 profile (Figure 3c) dropping from the periphery, where thin processes are abundant to the central somatic region. Finally, the Ca 2 + signaling readout in the form of nascent waves of elevated Ca 2 + levels is shown in Figure 3d. A more pronounced wave is formed over the region, with both a higher density of Glu sources and NA release sites. This wave is likely to expand over the whole astrocytic domain because it has already invaded regions with a higher AVF (large ER-rich branches) and thus there is greater amplification from the calcium-induced calcium release (CICR) mechanism. In contrast, the two less prominent excited areas are likely to remain spatially confined and will gradually decay. In fact, such localized events are the most frequent, following a distribution that we have previously shown to match experimental data [33]. In summary, the model displays spatiotemporal dynamics reflected in the astrocyte calcium activity, consistent with experimental data. Next, we introduce and explore the NA-based modulation of the observed Ca 2 + and IP 3 dynamics.

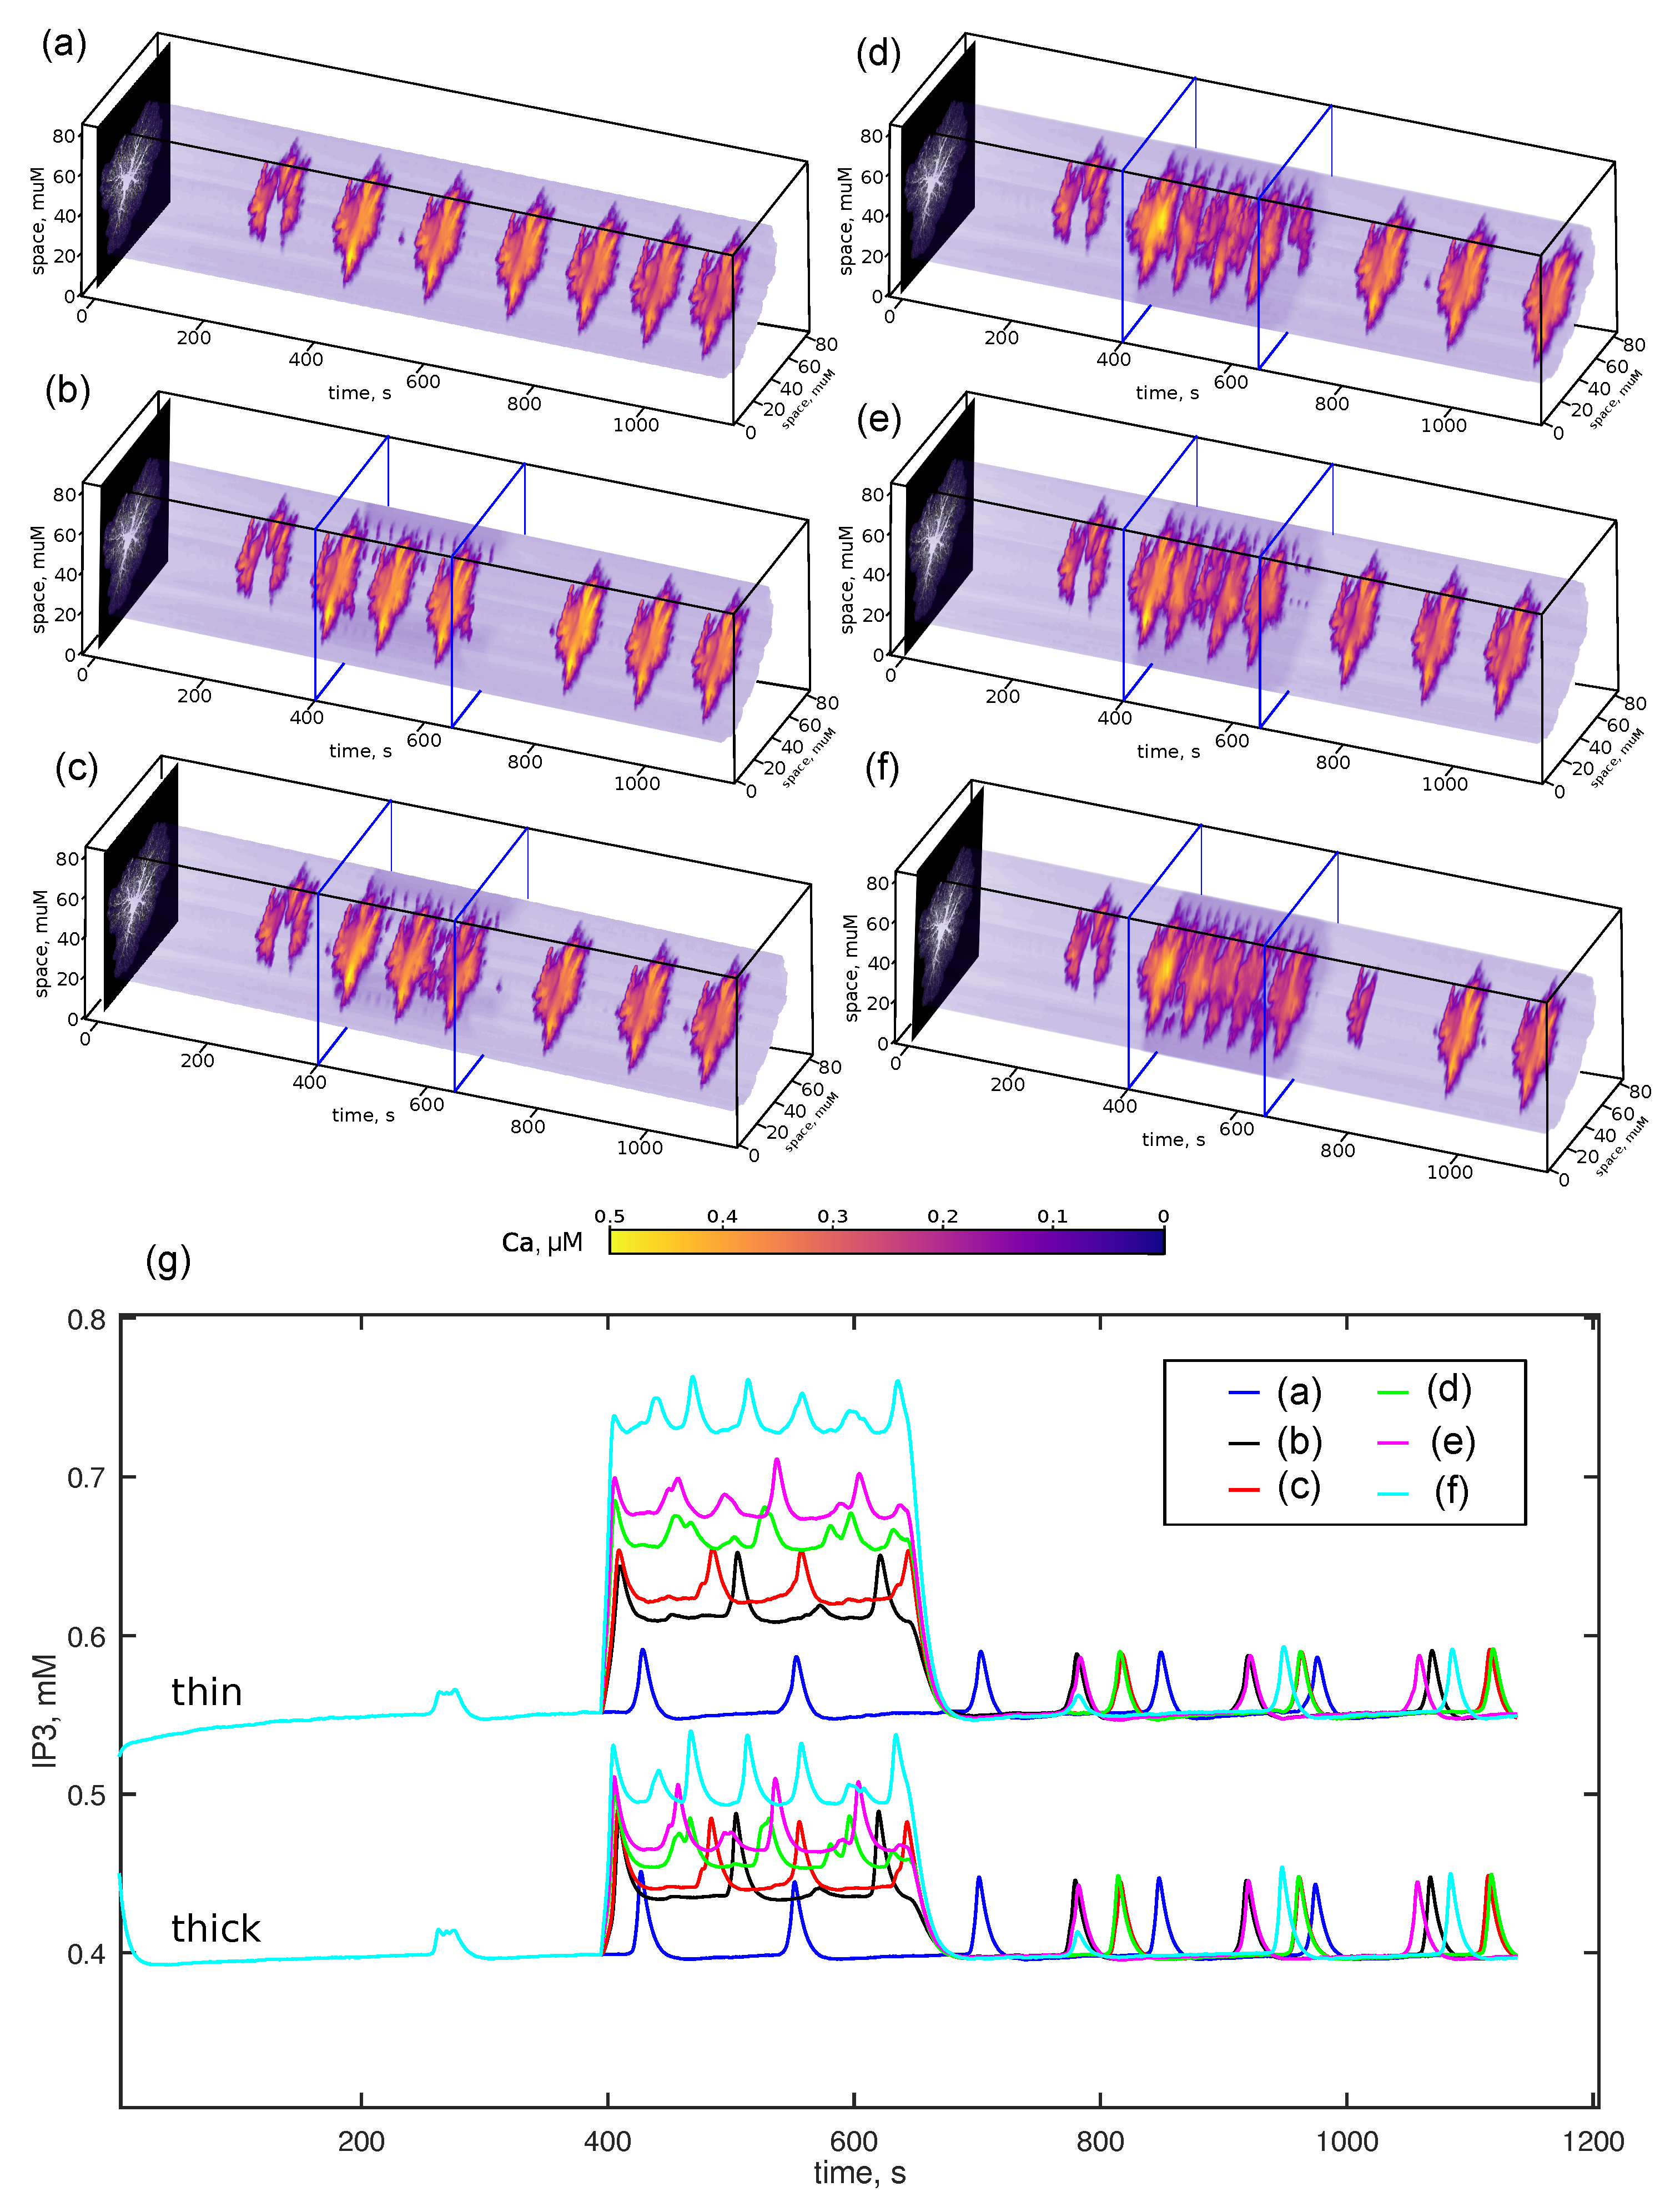
3.2. Short Noradrenaline Surges Raise Gain of Astrocyte Responses to Glutamate

Due to its role of a major arousal-linked neuromodulator in the central nervous system (CNS), NA levels can change under different contexts, including a long-term high-amplitude rise during the transition from sleep to wakefulness [27,36] or rapid surges during locomotion and increased alertness [35]. We note that the sleep–wakefulness transition is less accessible to modeling because it is accompanied by dramatic changes in the ionic composition of the interstitial fluid and cell volume [26]. On the other hand, NA elevations accompanying locomotion bouts and exploratory activity typically last less than a minute and seem easier to reproduce in a simulation. In our simulations below, we used a single 250 s long episode of NA release, which is longer than a normal rodent locomotion bout, but is required for a detailed description of the activity pattern at high NA levels.
Both α 1 adrenoreceptors and mGluR 5 (metabotropic glutamate receptor) glutamate receptors on astrocytic membrane interact with G q G-protein, leading to the activation of PLC β (phospholipase) and production of IP 3 . To compare the additive and cooperative interaction of NA and Glu, we ran simulations for different interaction mechanisms with a “frozen” spatiotemporal stochastic Glu drive. This allowed us to separate the effect of the NA to Glu interaction characteristics from stochastic variations in the observed dynamics. Finally, we focused on the general net Ca 2 + and IP 3 dynamics, which are physiologically relevant for the whole astrocytic domain rather than on microdomain Ca 2 + activity. Specifically, we evaluated mean IP 3 traces averaged over thin and thick astrocytic processes separately, as well as spatiotemporal profiles of the calcium waves engulfing the whole astrocyte domain as an aggregate indicator of the astrocyte activation.
Without NA release, the model is in the regime of the spontaneous quasi-regular generation of whole-cell Ca 2 + waves (Figure 4 (a)—Ca 2 + profiles, (g)—IP 3 traces). As discussed earlier in [51], this regularity emerges due to the interaction between spatial heterogeneity and refractoriness: in the spatially irregular morphology of an astrocyte, there will inevitably be found a site for which wave initiation is the most facilitated, while the refractory interval of the calcium oscillator fixes this site as the noise-driven pacemaker.
We next examined the NA effect under different conditions and Glu interaction variants, as shown in Figure 4 (see also Table 1):
  • (b)— r N A = 0 , v N A 0 , corresponding to the additive effect of N A and Glu on IP 3 production;
  • (c)— r N A 0 , v N A = 0 corresponding to cooperative interaction, increasing sensitivity to Glu;;
  • (d)–(f)—additive NA effect combined with volume NA increases, simulated by setting NA a m b to 0.005 , 0.01 , and 0.05   μ m, respectively.
For all cases except that shown in (a), the NA release started at t = 400 s and ended at t = 650 s.
Both additive and cooperative NA mechanisms, as well as the 10-fold range in NA a m b , lead to a qualitatively similar response to NA: the frequency of Ca 2 + waves increases during the period of its application, whereas, directly after it, the activity is silenced, causing an extended delay to the next spontaneous Ca 2 + wave. Responses under the different simulated conditions can be compared in Figure 4g, where the curves for the mean IP 3 concentration averaged over thin (top) and thick (bottom) process regions are shown. In all cases, NA causes an immediate rise in the IP 3 level and a birth of the calcium wave, an effect known as “phase resetting” [52], abound in biological oscillators. The effect further unravels as a sustained generation of Ca 2 + waves at a high frequency, defined by the reached IP 3 level, which, in turn, depends on NA. Interestingly, ambient stimulation by increased NA a m b was associated with a less regular Ca 2 + wave pattern, which can be explained by the conjecture that a spatially uniform stimulation increases the odds of multiple new locations becoming the wave initiation hotspots.
In summary, observing only the Ca 2 + dynamics (which experiments are commonly limited to) is insufficient for the separation between the two alternative NA mechanisms, namely the additive contribution to the IP 3 production, panel (b), and the multiplicative one, increasing the gain of the mGluR-dependent pathway (the “synergism” hypothesis, panel (c)). We provide an interpretation of this result in terms of noise-induced dynamics in the Discussion.

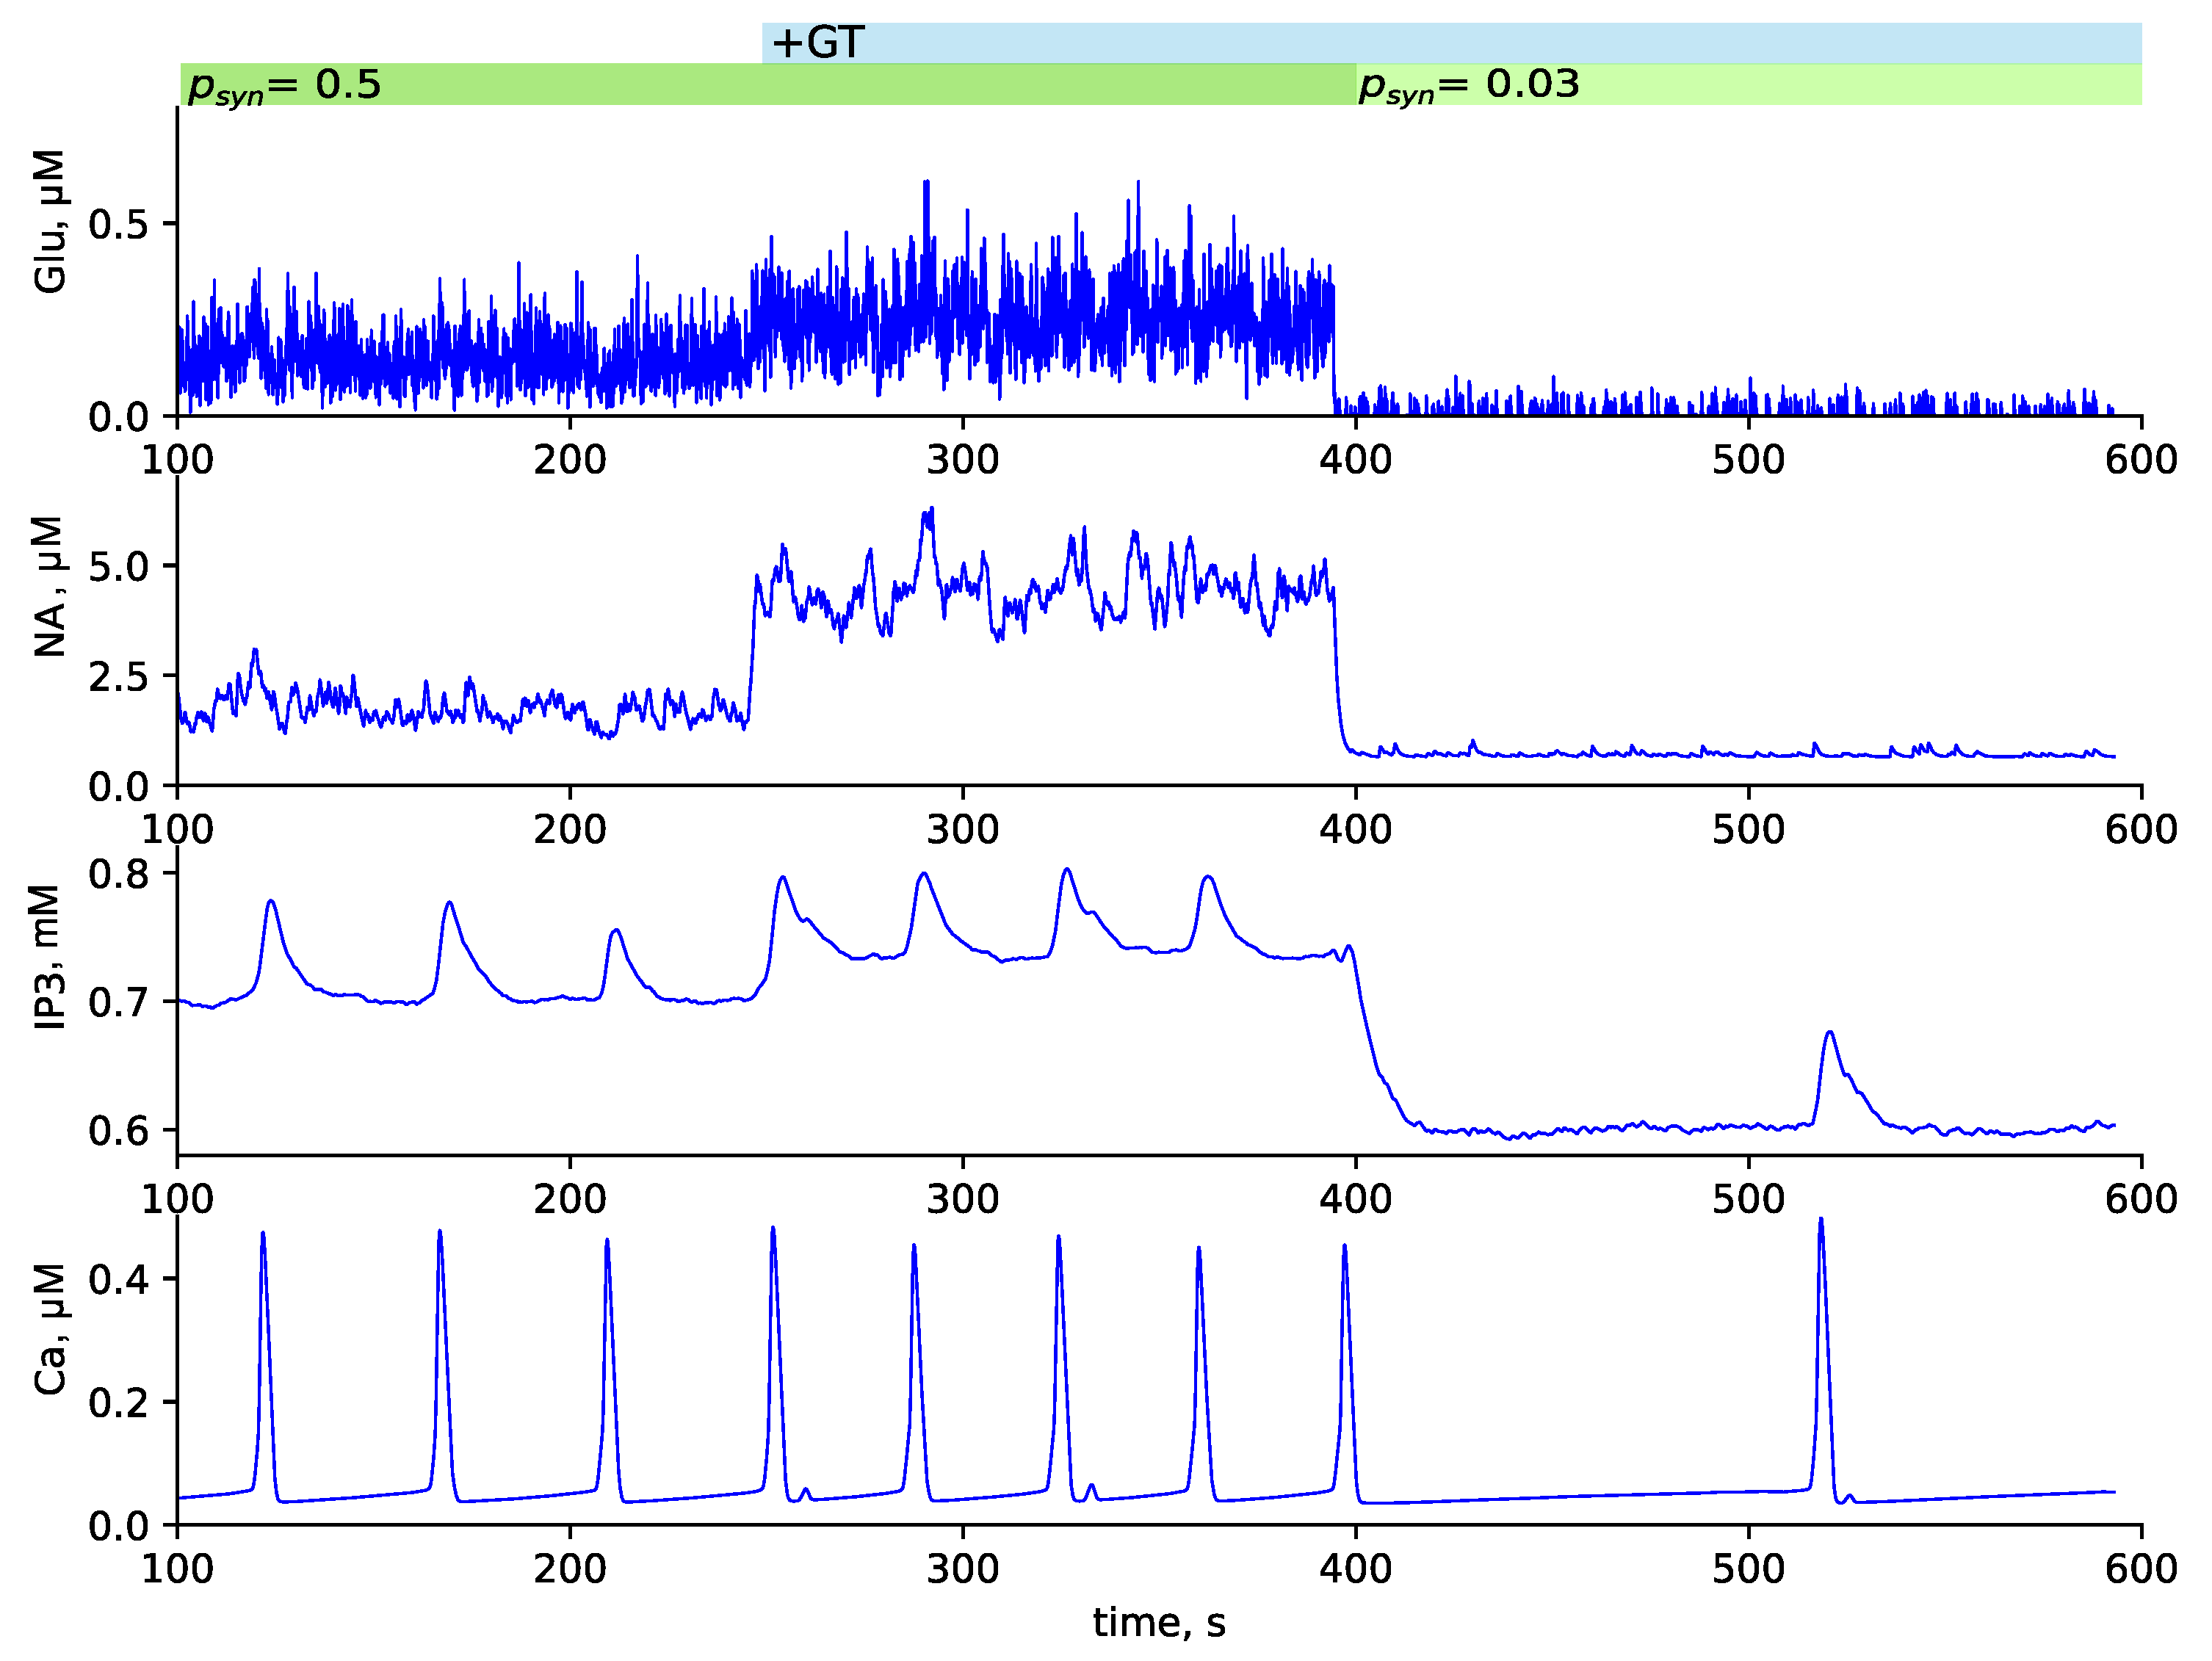
3.3. Testing GANE Hypothesis

We next turned to testing the viability of the GANE (“glutamate amplifies noradrenergic effects”, [39]) hypothesis, which postulates synergism between Glu and NA and sums up to the increased NA release probability in the vicinity of the spots with high glutamatergic activity, while NA, in turn, positively modulates neuronal excitability. One of the proposed mechanisms for the NA release facilitation includes the simultaneous activation of axonal N-methyl-D-aspartate (NMDA) receptors (on noradrenergic axons) by spillover glutamate from synapses and D-serine released by NA-acivated astrocytes as a gliotransmitter (Gt). Another hypothesis links local NMDA receptor activation to nitric oxide synthesis and its interaction with NA release sites [53]. Considered together, these pathways form a double positive feedback loop, which can sharply inflate noradrenergic effects in a given location.
Rather than directly modeling the details of NMDA kinetics or presynaptic plasticity, we implemented the core GANE idea at the simplest possible level by introducing, in Equation (4), the terms r N G ( [ Glu ] [ Glu ] a m b ) and r N G t ( [ Gt ] [ Gt ] a m b ) , describing Glu and gliotransmitter effects, respectively, and allowing for independent neuronal and astrocytic inputs. In turn, the NA effect is added to (1). Due to the lack of experimental data on r N G , r N G t , and r G N , we interpreted them as free parameters and chose them guided by their degree of impact on model dynamics. Specifically, we supposed that, taken separately, each of the pathways has the capacity to increase NA or Glu release efficiency by two-fold at most.
Figure 5a shows a spatiotemporal profile of a single Ca 2 + wave originating near one of the NA release sites, marked with a red dot in the morphology portrait. The locations of all five NA release sites are shown as horizontal bars in the 3D graph. To explore details of the Glu-NA interaction in our model, it is reasonable to focus on the dynamics at the point of NA release nearest to the Ca 2 + wave initiation site. Graphs of the relevant model variables are shown in Figure 5b–e, where the line color encodes the combination of GANE pathways used as indicated in the legend. In short, we turned on the interaction loops one by one and observed dynamics when NA signaling is active ( r N A = 1 ). When only Glu facilitation by NA was considered (NA⟶Glu), only a minor effect on IP 3 and Ca 2 + dynamics was observed (compare blue and magenta lines), whereas no significant changes to Ca 2 + wave frequency could be seen ( 0.2 % difference in period with regard to simple NA action case). Switching on the facilitation of NA release by Glu (Glu⟶NA, green curve) converts the constant NA level to a stochastic process with a moderately higher IP 3 level and an increased Ca 2 + wave frequency (the period becomes shorter by 6.0 %). The maximal effect is reached when both pathways are turned on (Glu⟷NA). This results in a significantly higher Glu concentration level and larger fluctuations in NA, which both converge to raise IP 3 to a much higher concentration and higher Ca 2 + wave frequency (period shorter by 13.5 %). Thus, the combination of the two feedback loops on Glu and NA release has the most physiologically relevant effect.
To fulfill all three GANE mechanisms, it remains to add Ca 2 + -dependent gliotransmitter release from the astrocyte. This is shown in Figure 6, which shows local trajectories of the model variables in the “Glu⟷NA” case under active NA release ( r N A = 1 ). Gliotransmitter action, switched on at t = 250 s, leads to a steep rise in NA levels with more pronounced fluctuations, a higher Glu level, and a further increase in Ca 2 + wave frequency.
At t = 400 s, we reduced the p s y n parameter 15-fold to roughly reproduce potential negative feedback on Glu release by, e.g., NA action on G i -coupled α 2 adrenoreceptors or ATP release by astrocytes acting on interneuronal P2X receptors. This led to an abrupt drop in Glu, NA, and IP 3 levels, leading to a dramatic decrease in Ca 2 + activity and a large delay until the next Ca 2 + wave. This result suggests Glu fluctuations as being the key driver in the GANE system.
Summarizing, we demonstrated a proof-of-concept implementation of the GANE hypothesis proposed by Mather et al. [39]. This implementation is based on the local positive interaction between NA, Glu, and gliotrasnmitter, and relies on the spatial heterogeneity of the astrocyte, providing for hotspots of facilitated Ca 2 + wave initiation.

4. Discussion

Our main goal in this study was to propose a computational workbench that we developed for the simulation of the complex signaling pathways involving the Glu-Astro-NA triangle; that is, the NA release from LC axons, its interaction with local glutamatergic signaling at synapses, and the modulation of astrocyte calcium signaling. Below, we interpret the simulation results in light of existing experimental evidence and reviews.

4.1. Noradrenaline and Glu: Synergy or Independent Effects?

Both Glu and NA activate Gq-coupled receptors on the astrocyte membrane, thus participating in the same IP 3 production pathway and downstream Ca 2 + signaling, justifying an independent additive inclusion of NA in the corresponding equations. At the same time, Paukert and co-authors report experimental evidence for the synergistic enhancement of astrocyte sensitivity to local circuit activity [35]. In modeling terms, synergism can be interpreted as a multiplicative term in the IP 3 production equation. We tested both independent and nonlinear cases of the NA effect on astrocytic Ca 2 + and came to the conclusion that both cases lead to a qualitatively similar result.
The molecular foundations for the possible cooperation between NA- and Glu-dependent pathways of astrocyte activation are not very clear. One possible mechanism for a synergistic ligand binding could be if mGluR and α 1 receptors made complexes in the plasma membrane, which would promote synergy in ligand binding. However, the experimental evidence for this possibility is scarce, though cross-talk between different GPCR pathways has been reported [54]. At the same time, Glu and NA both control the IP 3 level, which drives the excitable dynamical system: the Ca 2 + oscillator. From a nonlinear dynamics viewpoint, it is enough to lower the threshold (or equivalently raise the baseline of a forcing signal) of a nonlinear excitable system a little to “enhance sensitivity” to a noise input. Undoubtedly, there are some differences between the effects of lowering the threshold and increasing the power of the noise input, but they are mostly limited to details of local spike generation statistics and are probably not as important for whole-cell Ca 2 + waves, the timing of which is mainly dominated by the refractory interval and is essentially explained by the coherent resonance effect [55,56].

4.2. Comparison between Spatially Confined and Volume NA Signal

In contrast to glutamatergic and GABAergic synapses, NA is released from varicosities on the LC axons directly into neuropil without clear postsynaptic structures and thus is proposed to participate in “volume transmission” [57], sending broadband signals to multiple cellular targets. This poses the question of if a mean-field approach with the global NA level as a parameter or individual point sources of NA with an account of its diffusion and uptake is the optimal way to implement NA signaling in the model. We tested both the local NA release from a fixed number of confined sites and global NA level modulation. This seemingly minor adjustment in the implementation in fact underlies a major difference in the physical amount of NA in the tissue, because sustaining the elevated ambient levels requires the release of many more NA molecules. In fact, this global release turns out to be redundant from the Ca 2 + dynamics viewpoint, as it leads to an only moderate effect on the model behavior. The main difference between the mean-field and discrete NA sources is the higher frequency of whole-cell Ca 2 + waves due to a higher IP 3 level under a uniform NA level. We conclude that, while the mean-field NA is a viable simplification, spatially segregated NA sources can provide a more flexible setting, allowing us to uncover sweet spots for the NA release, where it can interact with the astrocyte optimally. More experimental data—for example, using genetically encoded NA sensors [58]—will be required to establish the NA release and spread spatial profiles reliably.

4.3. GANE Mechanism Seems to Be Viable at Microscopic Scale

As mentioned in the Introduction, the GANE hypothesis has been originally suggested in the behavioral context in such terms as vigilance and alertness [39]. Here, we tested molecular mechanisms proposed in the same publication as underlying this hypothesis. To this end, we modeled some relevant signaling pathways as simple linear relationships. This can be justified if Glu, NA, and gliotransmitter concentrations remain within a relatively narrow range. At the same time, linear couplings that form the positive feedback loop are the most “dangerous” in the sense of the model structural stability as dynamical system. In our particular case, we believe that the model dynamics remain stable due to the Poissonian nature of the Glu noise input, which guarantees its spontaneous intermittence and prevents the dynamical system from being self-locked in the excited state.
As a limitation of our study, we can mention that we have not addressed the problem of lateral inhibition in the regions surrounding the area of heightened local circuit activity.
This effect is well-grounded at the behavioral level, and its cellular mechanisms are relatively well understood. At the same time, it is not entirely clear if the inhibition also take place within the activity hotspot and what the spatial parameters of this mechanism are. Additional negative feedback mechanisms can also take place, such as the astrocytic release of ATP, linked to high levels of interneuron activity, after its degradation to adenosine can downregulate the NA release from axonal varicosities by activating A 1 receptors [59,60]. At the same time, a higher concentration of NA can activate G i -coupled α 2 adrenoreceptors, serving a break in the positive feedback loop as well. We regard all of these as open questions for the future work.

4.4. Additional Considerations

The literature and modeling results suggest an intriguing pattern of unexpectedly periodic and reproducible whole-cell Ca 2 + waves. Earlier, we showed in a modeling study that the complex irregular morphology of the astrocyte leads to certain scenarios of wave initiation, which, once realized, become self-sustained due to the refractoriness of the IP 3 -based Ca 2 + dynamics [51]. This effect is also observed at the astrocyte network scale [33,34]. Adding an irregular synapse spatial pattern to the morphology reshapes the stable wave initiation sites, now drawing them nearer to synapse clusters. In turn, point sources of NA, if placed near enough (approximately 2 μ m) to synapses, become trigger points of astrocytic Ca 2 + waves during the aroused state, accompanied by NA release. Thus, we observed two modes of repeatable wave patterns: one during background spontaneous local circuit activity, defined by the combination of irregular astrocyte morphology and stochastic synapse placement, and one corresponding to NA release during heightened vigilance or exploratory activity, defined by NA release sites interacting with the synapse pattern. This prediction looks important in the context of the interpretation of the experimentally observed Ca 2 + activity patterns in astrocytes.

5. Conclusions

Here, we proposed a modeling instrument for the computational simulation of a group of neuromodulation phenomena involving NA, excitatory synapse activity, and the astrocyte. In contrast to popular neuronal models, our approach focused on extrasynaptic signaling pathways and took into account the complex astrocyte morphology. Effectively, we addressed signaling processes in the neuropil, which stages the spatial dimension of the model as equally important to the temporal dynamics of the system.
Paradoxically, the match between the irregular spatial structure of the astrocyte and excitation by random spatiotemporal synaptic activity leads to quite stereotyped astrocyte responses. This effect emerges because the randomly scattered synapses turn out to have an unequal effect on the astrocyte, determined by the local astrocyte structure. Moreover, the emerging leading synapse locations tend to win additional weight due to the refractoriness of the system after the whole-cell calcium wave generation.
This effect becomes even further enhanced when the noradrenaline effect is added to the model. In general, calcium increases in response to noradrenaline are expected a priori, as this directly follows from the model equations. Less trivially, however, the concrete spatial pattern of noradrenaline release sites crucially determines the net amount needed for a potentiation of glutamate synapses. Finally, this line of thought was continued by a computational test of the synergistic effect of glutamate and noradrenaline on astrocytic Ca 2 + signaling, as proposed by the GANE hypothesis. Our simulations corroborate the viability of the GANE and demonstrate the capacity of our modeling framework to reproduce the main physiological effects of GANE.
Summing up, our study shows that the modeling paradigm of the astrocytic calcium dynamics can be fundamentally different from the paradigm of neuronal excitability in that the astrocyte does not support such an efficient spatial summation of stimuli as the one that takes place in the neuronal dendritic tree. Instead, the decisive role is played by one or more ‘winner” hot-spots, which frame the global properties of the whole-cell calcium waves. This observation substantiates a reduction in the model to a few compartments, inviting the possibility of scaling up the framework for an efficient modeling of astrocytic networks. We consider this result to be important and to open prospects for future research.

Supplementary Materials

The following supporting information can be downloaded at: https://0-doi-org.brum.beds.ac.uk/10.5281/zenodo.7568869: program code for the implementation of the model: model realisation using NVIDIA CUDA and Jupyter notebook to run the program and analyze the results of the solution.

Author Contributions

Conceptualization, D.P., A.B. and A.V.; methodology, A.B., A.V. and D.P.; software and numeric simulation, A.K., D.V. and A.V.; writing—original draft preparation, D.P. and A.V.; writing—review and editing, A.B., D.P., D.V. and A.V.; visualization, A.V.; project administration and funding acquisition, D.P. All authors have read and agreed to the published version of the manuscript.

Funding

This research was funded by the Russian Foundation for Basic Research, grant #19-515-55016 (Section 2.4 and Section 3.3), by the Russian Science Foundation, project #21-74-00095 (Section 2.3 and Section 3.2), and by the government of the Russian Federation, project #075-15-2022-1094 (Section 2.2 and Section 3.1).

Data Availability Statement

Not applicable.

Acknowledgments

A.B. acknowledges support from the Interdisciplinary Scientific and Educational School of Moscow University “Molecular Technologies of the Living Systems and Synthetic Biology”.

Conflicts of Interest

The authors declare no conflict of interest.

Abbreviations

The following abbreviations are used in this manuscript:
NVUneurovascular unit
AVFastrocyte volume fraction
SVRsurface–volume ratio
GANEglutamate amplifies noradrenergic effects
ERendoplasmic reticulum
LCLocus Coeruleus
I P 3 inositol trisphosphate
Gluglutamate
NAnoradrenaline
Gtgliotransmitter
NMDAN-methyl-D-aspartate
GPCRG-protein-coupled receptors

References

  1. Agnati, L.; Zoli, M.; Strömberg, I.; Fuxe, K. Intercellular communication in the brain: Wiring versus volume transmission. Neuroscience 1995, 69, 711–726. [Google Scholar] [CrossRef] [PubMed]
  2. Sykova, E.; Nicholson, C. Diffusion in brain extracellular space. Physiol. Rev. 2008, 88, 1277–1340. [Google Scholar] [CrossRef] [PubMed] [Green Version]
  3. Sykova, E. Extrasynaptic volume transmission and diffusion parameters of the extracellular space. Neuroscience 2004, 129, 861–876. [Google Scholar] [CrossRef] [PubMed]
  4. Semyanov, A.; Verkhratsky, A. Astrocytic processes: From tripartite synapses to the active milieu. Trends Neurosci. 2021, 44, 781–792. [Google Scholar] [CrossRef] [PubMed]
  5. Araque, A.; Carmignoto, G.; Haydon, P.G. Dynamic signaling between astrocytes and neurons. Annu. Rev. Physiol. 2001, 63, 795–813. [Google Scholar] [CrossRef] [PubMed] [Green Version]
  6. Volterra, A.; Meldolesi, J. Astrocytes, from brain glue to communication elements: The revolution continues. Nat. Rev. Neurosci. 2005, 6, 626–640. [Google Scholar] [CrossRef]
  7. Parpura, V.; Verkhratsky, A. Astrocytes revisited: Concise historic outlook on glutamate homeostasis and signaling. Croat. Med. J. 2012, 53, 518–528. [Google Scholar] [CrossRef] [Green Version]
  8. Volterra, A.; Magistretti, P.; Haydon, P. The Tripartite Synapse: Glia in Synaptic Transmission; Oxford University Press: Oxford, UK, 2002. [Google Scholar]
  9. Rose, C.R.; Chatton, J.Y. Astrocyte sodium signaling and neuro-metabolic coupling in the brain. Neuroscience 2016, 323, 121–134. [Google Scholar] [CrossRef] [Green Version]
  10. Araque, A.; Carmignoto, G.; Haydon, P.G.; Oliet, S.H.; Robitaille, R.; Volterra, A. Gliotransmitters travel in time and space. Neuron 2014, 81, 728–739. [Google Scholar] [CrossRef] [Green Version]
  11. Muoio, V.; Persson, P.; Sendeski, M. The neurovascular unit—Concept review. Acta Physiol. 2014, 210, 790–798. [Google Scholar] [CrossRef]
  12. Iadecola, C. The neurovascular unit coming of age: A journey through neurovascular coupling in health and disease. Neuron 2017, 96, 17–42. [Google Scholar] [CrossRef] [Green Version]
  13. Schaeffer, S.; Iadecola, C. Revisiting the neurovascular unit. Nat. Neurosci. 2021, 24, 1198–1209. [Google Scholar] [CrossRef]
  14. Nadkarni, S.; Jung, P. Dressed neurons: Modeling neural-glial interactions. Phys. Biol. 2004, 1, 35–41. [Google Scholar] [CrossRef]
  15. Nadkarni, S.; Jung, P. Modeling synaptic transmission of the tripartite synapse. Phys. Biol. 2007, 4, 1. [Google Scholar] [CrossRef]
  16. Farr, H.; David, T. Models of neurovascular coupling via potassium and EET signalling. J. Theor. Biol. 2011, 286, 13–23. [Google Scholar] [CrossRef]
  17. Dormanns, K.; Brown, R.; David, T. The role of nitric oxide in neurovascular coupling. J. Theor. Biol. 2016, 394, 1–17. [Google Scholar] [CrossRef]
  18. Kenny, A.; Plank, M.J.; David, T. The role of astrocytic calcium and TRPV4 channels in neurovascular coupling. J. Comput. Neurosci. 2018, 44, 97–114. [Google Scholar] [CrossRef]
  19. Mathias, E.J.; Kenny, A.; Plank, M.J.; David, T. Integrated models of neurovascular coupling and BOLD signals: Responses for varying neural activations. NeuroImage 2018, 174, 69–86. [Google Scholar] [CrossRef]
  20. Gordleeva, S.Y.; Tsybina, Y.A.; Krivonosov, M.I.; Ivanchenko, M.V.; Zaikin, A.A.; Kazantsev, V.B.; Gorban, A.N. Modeling working memory in a spiking neuron network accompanied by astrocytes. Front. Cell. Neurosci. 2021, 15, 631485. [Google Scholar] [CrossRef]
  21. Tsybina, Y.; Kastalskiy, I.; Krivonosov, M.; Zaikin, A.; Kazantsev, V.; Gorban, A.N.; Gordleeva, S. Astrocytes mediate analogous memory in a multi-layer neuron–astrocyte network. Neural Comput. Appl. 2022, 34, 9147–9160. [Google Scholar] [CrossRef]
  22. Ayata, C.; Lauritzen, M. Spreading depression, spreading depolarizations, and the cerebral vasculature. Physiol. Rev. 2015, 95, 953–993. [Google Scholar] [CrossRef] [Green Version]
  23. Dahlem, M.A.; Graf, R.; Strong, A.J.; Dreier, J.P.; Dahlem, Y.A.; Sieber, M.; Hanke, W.; Podoll, K.; Schöll, E. Two-dimensional wave patterns of spreading depolarization: Retracting, re-entrant, and stationary waves. Phys. D Nonlinear Phenom. 2010, 239, 889–903. [Google Scholar] [CrossRef] [Green Version]
  24. Postnov, D.; Postnov, D.; Schimansky-Geier, L. Self-terminating wave patterns and self-organized pacemakers in a phenomenological model of spreading depression. Brain Res. 2012, 1434, 200–211. [Google Scholar] [CrossRef] [PubMed]
  25. Verisokin, A.Y.; Verveyko, D.; Postnov, D. Turing-like structures in a functional model of cortical spreading depression. Phys. Rev. E 2017, 96, 062409. [Google Scholar] [CrossRef] [PubMed]
  26. Ding, F.; O’Donnell, J.; Xu, Q.; Kang, N.; Goldman, N.; Nedergaard, M. Changes in the composition of brain interstitial ions control the sleep-wake cycle. Science 2016, 352, 550–555. [Google Scholar] [CrossRef] [Green Version]
  27. O’Donnell, J.; Ding, F.; Nedergaard, M. Distinct functional states of astrocytes during sleep and wakefulness: Is norepinephrine the master regulator? Curr. Sleep Med. Rep. 2015, 1, 1–8. [Google Scholar] [CrossRef] [Green Version]
  28. Ingiosi, A.M.; Frank, M.G. Goodnight, astrocyte: Waking up to astroglial mechanisms in sleep. FEBS J. 2022. [Google Scholar] [CrossRef]
  29. Haydon, P.G. Astrocytes and the modulation of sleep. Curr. Opin. Neurobiol. 2017, 44, 28–33. [Google Scholar] [CrossRef]
  30. Savtchenko, L.P.; Bard, L.; Jensen, T.P.; Reynolds, J.P.; Kraev, I.; Medvedev, N.; Stewart, M.G.; Henneberger, C.; Rusakov, D.A. Disentangling astroglial physiology with a realistic cell model in silico. Nat. Commun. 2018, 9, 3554. [Google Scholar] [CrossRef]
  31. Matyash, V.; Kettenmann, H. Heterogeneity in astrocyte morphology and physiology. Brain Res. Rev. 2010, 63, 2–10. [Google Scholar] [CrossRef]
  32. Khakh, B.S.; Sofroniew, M.V. Diversity of astrocyte functions and phenotypes in neural circuits. Nat. Neurosci. 2015, 18, 942–952. [Google Scholar] [CrossRef]
  33. Verisokin, A.; Verveyko, D.; Postnov, D.; Brazhe, A. Modeling of Astrocyte Networks: Toward Realistic Topology and Dynamics. Front. Cell. Neurosci. 2021, 15, 50. [Google Scholar] [CrossRef]
  34. Verveyko, D.V.; Verisokin, A.Y.; Postnov, D.E.; Brazhe, A.R. Connectivity promotes repeatable activation patterns in the model of astrocytic networks. Eur. Phys. J. Plus 2021, 136, 732. [Google Scholar] [CrossRef]
  35. Paukert, M.; Agarwal, A.; Cha, J.; Doze, V.A.; Kang, J.U.; Bergles, D.E. Norepinephrine controls astroglial responsiveness to local circuit activity. Neuron 2014, 82, 1263–1270. [Google Scholar] [CrossRef] [Green Version]
  36. Ingiosi, A.M.; Frank, M.G. Noradrenergic Signaling in Astrocytes Influences Mammalian Sleep Homeostasis. Clocks Sleep 2022, 4, 332–345. [Google Scholar] [CrossRef]
  37. Mander, B.A.; Winer, J.R.; Jagust, W.J.; Walker, M.P. Sleep: A novel mechanistic pathway, biomarker, and treatment target in the pathology of Alzheimer’s disease? Trends Neurosci. 2016, 39, 552–566. [Google Scholar] [CrossRef] [Green Version]
  38. Semyachkina-Glushkovskaya, O.; Postnov, D.; Penzel, T.; Kurths, J. Sleep as a novel biomarker and a promising therapeutic target for cerebral small vessel disease: A review focusing on Alzheimer’s disease and the blood-brain barrier. Int. J. Mol. Sci. 2020, 21, 6293. [Google Scholar] [CrossRef]
  39. Mather, M.; Clewett, D.; Sakaki, M.; Harley, C.W. Norepinephrine ignites local hotspots of neuronal excitation: How arousal amplifies selectivity in perception and memory. Behav. Brain Sci. 2016, 39. [Google Scholar] [CrossRef] [Green Version]
  40. Kimelberg, H.K.; Norenberg, M.D. Astrocytes. Sci. Am. 1989, 260, 66–77. [Google Scholar] [CrossRef]
  41. Keener, J.; Sneyd, J. Mathematical Physiology 1: Cellular Physiology; Springer: New York, NY, USA, 2009; Volume 2. [Google Scholar]
  42. Houart, G.; Dupont, G.; Goldbeter, A. Bursting, chaos and birhythmicity originating from self-modulation of the inositol 1, 4, 5-trisphosphate signal in a model for intracellular Ca2+ oscillations. Bull. Math. Biol. 1999, 61, 507–530. [Google Scholar] [CrossRef]
  43. Bushong, E.A.; Martone, M.E.; Ellisman, M.H. Maturation of astrocyte morphology and the establishment of astrocyte domains during postnatal hippocampal development. Int. J. Dev. Neurosci. 2004, 22, 73–86. [Google Scholar] [CrossRef]
  44. Martone, M.E.; Zhang, S.; Gupta, A.; Qian, X.; He, H.; Price, D.L.; Wong, M.; Santini, S.; Ellisman, M.H. The cell-centered database. Neuroinformatics 2003, 1, 379–395. [Google Scholar] [CrossRef] [PubMed]
  45. Héja, L.; Szabó, Z.; Péter, M.; Kardos, J. Spontaneous Ca2+ Fluctuations Arise in Thin Astrocytic Processes With Real 3D Geometry. Front. Cell. Neurosci. 2021, 15, 617989. [Google Scholar] [CrossRef] [PubMed]
  46. Genoud, C.; Knott, G.W.; Sakata, K.; Lu, B.; Welker, E. Altered synapse formation in the adult somatosensory cortex of brain-derived neurotrophic factor heterozygote mice. J. Neurosci. 2004, 24, 2394–2400. [Google Scholar] [CrossRef] [PubMed] [Green Version]
  47. Santuy, A.; Tomás-Roca, L.; Rodríguez, J.R.; González-Soriano, J.; Zhu, F.; Qiu, Z.; Grant, S.; DeFelipe, J.; Merchan-Perez, A. Estimation of the number of synapses in the hippocampus and brain-wide by volume electron microscopy and genetic labeling. Sci. Rep. 2020, 10, 14014. [Google Scholar] [CrossRef]
  48. Verisokin, A.; Kirsanov, A.; Verveyko, D.; Postnov, D.; Brazhe, A. Poppy-seeding synapses within astrocytic domains: The role of synaptic spatial patterns in the astrocyte-neuron communication. In Proceedings of the Computational Biophysics and Nanobiophotonics; Postnov, D.E., Khlebtsov, B.N., Eds.; International Society for Optics and Photonics, SPIE: Bellingham, WA, USA, 2022; Volume 12194, p. 121940A. [Google Scholar] [CrossRef]
  49. Moreno-Bote, R. Poisson-like spiking in circuits with probabilistic synapses. PLoS Comput. Biol. 2014, 10, e1003522. [Google Scholar] [CrossRef] [Green Version]
  50. Burkitt, A.N. A review of the integrate-and-fire neuron model: II. Inhomogeneous synaptic input and network properties. Biol. Cybern. 2006, 95, 97–112. [Google Scholar] [CrossRef]
  51. Brazhe, A.R.; Postnov, D.E.; Sosnovtseva, O. Astrocyte calcium signaling: Interplay between structural and dynamical patterns. Chaos 2018, 28, 106320. [Google Scholar] [CrossRef]
  52. Tass, P.A. Phase Resetting in Medicine and Biology: Stochastic Modelling and Data Analysis; Springer Science & Business Media: Berlin/Heidelberg, Germany, 2007. [Google Scholar]
  53. Gray, S.R.; Ye, L.; Ye, J.Y.; Paukert, M. Noradrenergic terminal short-term potentiation enables modality-selective integration of sensory input and vigilance state. Sci. Adv. 2021, 7, eabk1378. [Google Scholar] [CrossRef]
  54. Ryzhov, S.; Goldstein, A.E.; Biaggioni, I.; Feoktistov, I. Cross-talk between G(s)- and G(q)-coupled pathways in regulation of interleukin-4 by A(2B) adenosine receptors in human mast cells. Mol. Pharmacol. 2006, 70, 727–735. [Google Scholar] [CrossRef]
  55. Pikovsky, A.S.; Kurths, J. Coherence resonance in a noise-driven excitable system. Phys. Rev. Lett. 1997, 78, 775. [Google Scholar] [CrossRef] [Green Version]
  56. Perc, M. Spatial coherence resonance in excitable media. Phys. Rev. E 2005, 72, 016207. [Google Scholar] [CrossRef] [Green Version]
  57. Fuxe, K.; Agnati, L.F.; Marcoli, M.; Borroto-Escuela, D.O. Volume Transmission in Central Dopamine and Noradrenaline Neurons and Its Astroglial Targets. Neurochem. Res. 2015, 40, 2600–2614. [Google Scholar] [CrossRef]
  58. Feng, J.; Zhang, C.; Lischinsky, J.E.; Jing, M.; Zhou, J.; Wang, H.; Zhang, Y.; Dong, A.; Wu, Z.; Wu, H.; et al. A Genetically Encoded Fluorescent Sensor for Rapid and Specific In Vivo Detection of Norepinephrine. Neuron 2019, 102, 745–761.e8. [Google Scholar] [CrossRef]
  59. Wahis, J.; Holt, M.G. Astrocytes, Noradrenaline, α1-Adrenoreceptors, and Neuromodulation: Evidence and Unanswered Questions. Front. Cell. Neurosci. 2021, 15, 645691. [Google Scholar] [CrossRef]
  60. Covelo, A.; Araque, A. Neuronal activity determines distinct gliotransmitter release from a single astrocyte. Elife 2018, 7, e32237. [Google Scholar] [CrossRef]
Figure 1. Modeled mechanisms. (1)—Calcium subsystem, including the processes of exchange between the cytosol (CZ) and the internal stores ER of the cell; (2)—Glu receptors; (3)—NA receptors; (4)—gliotransmitter (Gt) release; (5)—intercellular space; (6)—synapse; (7)—varicosites on the axon of an adrenergic neuron releasing NA. GANE pathways are shown with dashed lines.
Mathematics 11 00628 g001
Figure 3. Instantaneous spatial profiles of the principal model variables. Color-coded patterns in panels (a), (b), (c), (d) show snapshots of G l u , N A , I P 3 , and Ca 2 + , respectively. Parameter set 1 was used.
Mathematics 11 00628 g003
Figure 4. NA effect on astrocytic Ca 2 + under the following cases: (a)—no NA release; (b)—additive action of NA; (c)—cooperative action of NA, facilitating Glu-dependent IP 3 production; (df)—additive action combined with volume NA increase at NA a m b = 0.005 , 0.01 , 0.05 μ m, respectively. The blue frames in 3D panels indicate the onset and end times of NA release; (g)—averaged IP 3 time courses for the simulations shown in the panels (af). The upper and lower groups of curves represent IP 3 concentrations averaged over thin and thick astrocyte processes, respectively. Parameter set 2 was used.
Mathematics 11 00628 g004
Figure 5. Testing GANE pathways. (a) Calcium wave initiated near one of the NA release cites, marked with a red dot. (b,c)—NA release is amplified by the reciprocal coupling with Glu spillover from nearby synapses; (d,e)—reciprocal coupling between Glu and NA provides increased I P 3 level (d) and facilitates calcium oscillations (e). Blue lines: no interaction between NA and Glu; green: Glu facilitates NA release; magenta: NA enhances Glu release probability; red: both feedback loops are turned on. Parameter set 3 was used.
Mathematics 11 00628 g005
Figure 6. Testing GANE pathways. Gliotransmitter effect (switched on at t = 250 s) with subsequent reduction in synaptic drive at t = 400 s. Parameter set 4 was used.
Mathematics 11 00628 g006
Table 1. Model parameters specific to described simulation runs.
ParameterSet 1Set 2Set 3Set 4Description
r N A , μ Ms 1 10; 10; 11NA influx in some points
r N G , s 1 500; 500; 5050Glu influence on NA dynamics
r N A G l u , μ M 1 00; 100Synergetic dependence on NA of the Glu-dependent IP3 production
r N G t , s 1 0000; 5Gt influence on NA dynamics
r G N , μ M 1 0000.5NA influence on the probability of Glu release
v N A , μ M s 1 0.10; 0.10.10.1rate of IP3 production through NA
[ NA ] a m b , μ M00–0.0100NA ambient
p s y n , Hz0.50.50.50.0(3); 0.5Glu release probability from synapses (number of events per unit time)
Table 2. Basic set of model parameters.
ParameterValueDescription
c 1 0.185ER/cytosolic volume ratio
v 1 6.0 s 1 Maximum Ca 2 + channel flux
d 1 0.13 μ MDissociation constant for IP 3
d 5 0.082 μ MCa 2 + activation constant
v 2 0.11 s 1 Ca 2 + leak constant
v 3 2.2 μ M/sMaximum Ca 2 + uptake
k 1 1.0 s 1 Rate constant of Ca 2 + extrusion
v 5 0.01 μ M/sRate of Ca 2 + leak across plasma membrane
v 6 0.2 μ M/sMaximal rate of activation-dependent Ca 2 + influx
k 2 1.0 μ MHalf-saturation constant for agonist-dependent Ca 2 + entry
k 3 0.1 μ MActivation constant for Ca 2 + -pump
v 4 0.25 μ M/sMaximal rate of IP 3 production
k 4 1.1 μ MDissociation constant for Ca 2 + stimulation of IP 3 production
k G l u 0.78 μ M/sDissociation constant for Glu stimulation of IP 3 production
d 2 1.049 μ MDissociation constant for Ca 2 + inhibition
k N A 0.8 μ Ms 1 Dissociation constant of NA stimulation of IP3
k M 0.1 μ Ms 1 Dissociation constant of Ca 2 + stimulation of Gt
v G l u 0.1 μ M/sRate of IP 3 production through Glu
τ r 7.143 sRate constant for loss of IP 3
[ I P 3 ] r e s t 0.16 μ MSteady-state IP 3
[ G t ] a m b 0 μ MSteady-state Gt
d 3 0.943 μ MReceptor dissociation constant for IP 3
a 2 0.14 μ Ms 1 Ca 2 + inhibition constant
C a d i f f 1.0 μ Ms 1 Diffusion coefficient for Ca 2 +
IP3 d i f f 10.0 μ Ms 1 Diffusion coefficient for IP 3
N A d i f f 0.4 μ Ms 1 Diffusion coefficient for NA
G l u d i f f 0.1 μ Ms 1 Diffusion coefficient for Glu
G t d i f f 0.1 μ Ms 1 Diffusion coefficient for Gt
k G t 0.1 μ Ms 1 Gt production rate through Ca 2 +
τ G t 15 sGt loss rate constant
τ N A 1.8 sNA loss rate constant
Disclaimer/Publisher’s Note: The statements, opinions and data contained in all publications are solely those of the individual author(s) and contributor(s) and not of MDPI and/or the editor(s). MDPI and/or the editor(s) disclaim responsibility for any injury to people or property resulting from any ideas, methods, instructions or products referred to in the content.

