
BAE: Anomaly Detection Algorithm Based on Clustering and Autoencoder


Software College, Northeastern University, Shenyang 110169, China
*
Author to whom correspondence should be addressed.
Mathematics 2023, 11(15), 3398; https://0-doi-org.brum.beds.ac.uk/10.3390/math11153398
Submission received: 29 June 2023
/
Revised: 18 July 2023
/
Accepted: 2 August 2023
/
Published: 3 August 2023
(This article belongs to the Special Issue Artificial Intelligence and Machine Learning Based Methods and Applications)
Abstract
:In this paper, we propose an outlier-detection algorithm for detecting network traffic anomalies based on a clustering algorithm and an autoencoder model. The BIRCH clustering algorithm is employed as the pre-algorithm of the autoencoder to pre-classify datasets with complex data distribution characteristics, while the autoencoder model is used to detect outliers based on a threshold. The proposed BIRCH-Autoencoder (BAE) algorithm has been tested on four network security datasets, KDDCUP99, UNSW-NB15, CICIDS2017, and NSL-KDD, and compared with representative algorithms. The BAE algorithm achieved average F-scores of 96.160, 81.132, and 91.424 on the KDDCUP99, UNSW-NB15, and CICIDS2017 datasets, respectively. These experimental results demonstrate that the proposed approach can effectively and accurately detect anomalous data.
1. Introduction
In recent years, internet applications and services have become widely used. However, the open structure and lack of supervision of the internet have created a deteriorating network security environment, making it easier for attacks to occur. Hackers can have varied motivations, such as political, financial, or intellectual, which makes detection even more challenging [1]. Distributed Denial-of-Service (DDoS) is one such aggressive and threatening invasion of online servers that mainly has two attack methods [2]: one is sending packets to exploit software vulnerabilities of the target host, rendering it unable to provide service, and the other involves sending large amounts of useless network traffic to flood the target host with an attack on its service resources. This paper discusses flooding attacks as an anomaly-detection example in the following sections.
Autoencoder is a novel method based on anomaly detection, which can find the best subspace to capture the nonlinear correlation between features by using a neural network. In addition, it can effectively reduce the false positive rate. The Common Autoencoders include the Denoising Autoencoder (DAE) [3], Sparse Autoencoder (SAE) [4], Variational Autoencoder (VAE) [5], Stacked Convolutional Autoencoders (SCAE) [6], and so on. These different types of Autoencoders are widely used in the intrusion-detection field [7,8,9]. However, The traffic from different sources usually has different characteristics when an attack occurs. This traffic with different data distributions has a negative effect on training deep learning models. Most anomaly-detection models do not preprocess these data, but directly use them to detect abnormal traffic, which leads to defects in accuracy. In addition, the data used for anomaly detection is usually imbalanced, which also hinders the performance of anomaly-based detection, and there are few studies focusing on this question in the research community [1].
The contribution of this algorithm is to propose an anomaly-detection algorithm that can automatically pre-classify and independently detect anomalies based on the pre-classification results. The algorithm uses the BIRCH algorithm to pre-classify traffic and the Autoencoder technique to detect anomaly traffic. The experimental results obtained from analyzing real network traffic datasets show that the algorithm outperforms others in terms of detection performance.
The remaining parts of this paper are structured as follows. Section 2 introduces the application scenario of the algorithm proposed in this paper. Section 3 discuss the related research work on anomaly-detection methods. In Section 4, we introduce the process of data preprocessing, and the principle of BIRCH and Autoencoder are introduced in detail, with the idea of combining BIRCH with Autoencoder to detect traffic. In Section 5, we execute the experiments based on KDDCUP99, UNSW-NB15, CICIDS2017, and NSL-KDD to verify the proposed algorithm. We conclude our work in Section 6.
2. Application of Algorithm
Intrusion-detection systems usually rely on sufficient servers and bandwidth resources to defend against flooding attacks. And the poor interaction between detection and defense phases has always been a challenge because the packets’ validity discrimination calculation has high time complexity and is difficult. At the same time, even if the detection system can filter out a certain proportion of attack traffic, how to guarantee the legal access of potential legitimate users to target systems or resources during the attack is still challenging.
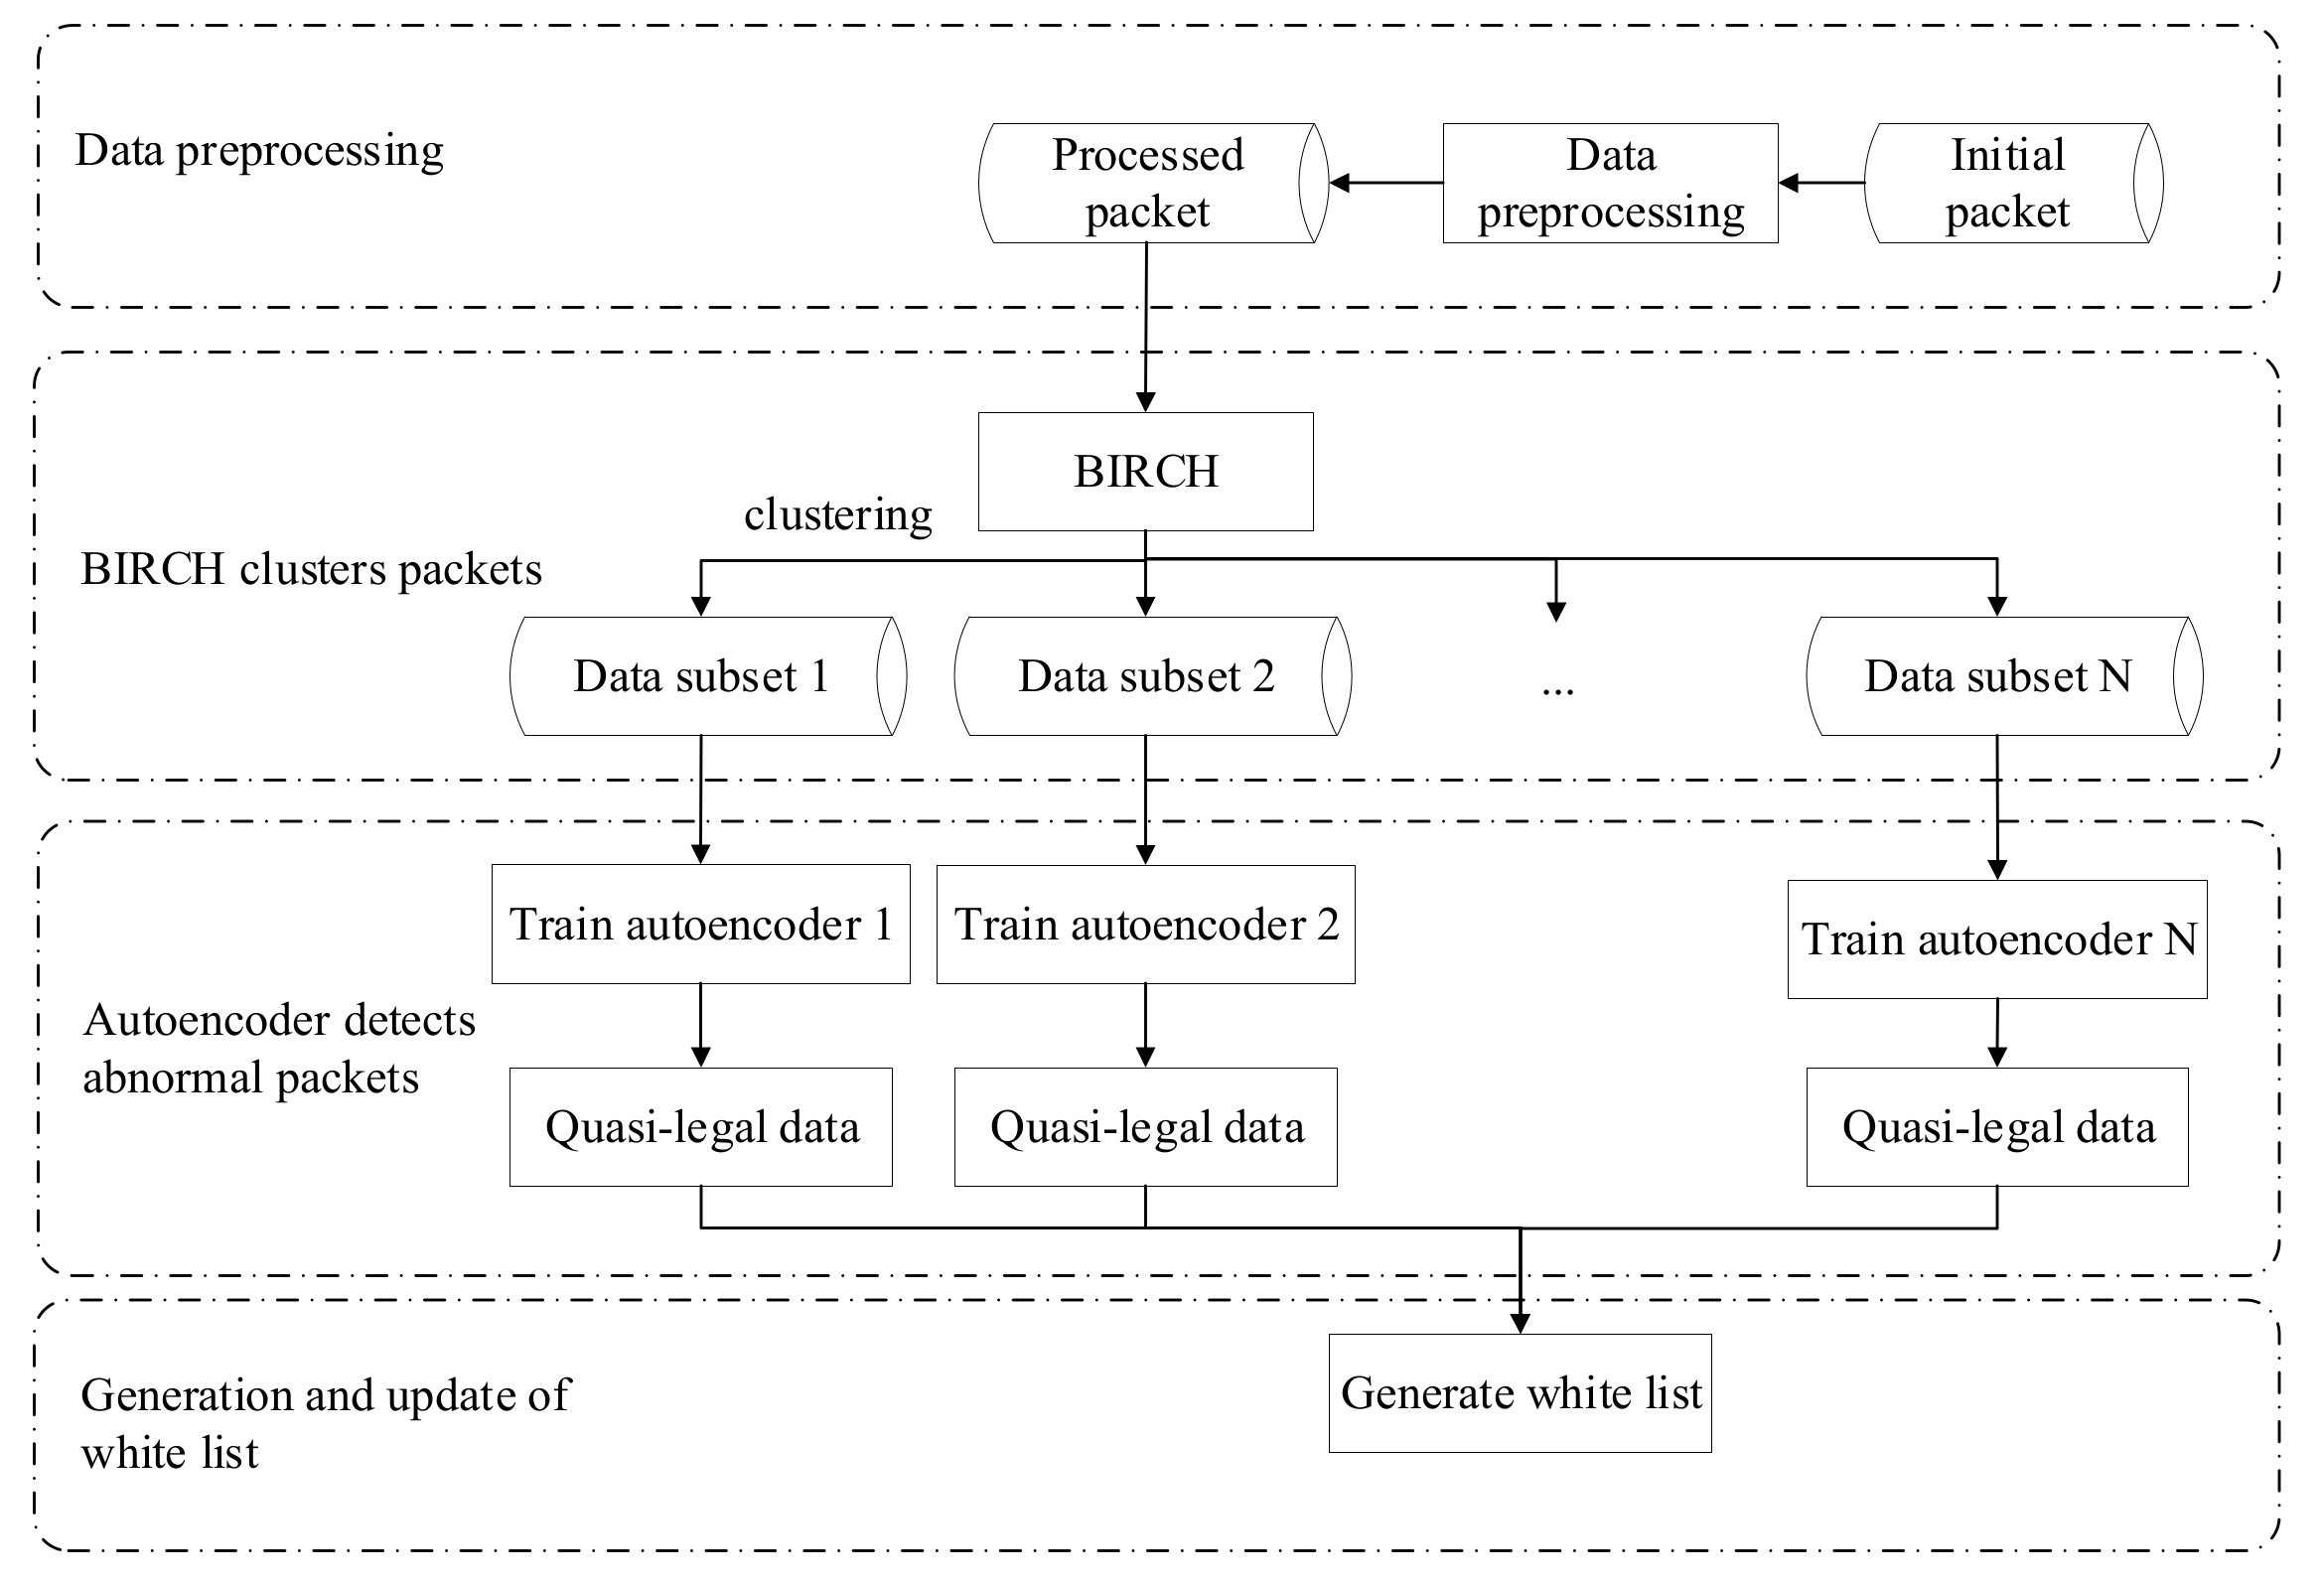
When the protected host receives network traffic packets, the intrusion detection system can distinguish whether the intrusion occurs through the techniques of the packet regular filtering, the signature detection filtering of the packet stream, and the content-customized filtering of the packets. The output of these discrimination techniques is “quasi-legal” data composed of filtered packets. The proposed algorithm will execute anomaly detection on network packets during an attack. Because the legal data flow is far less than attacking data flow, the anomaly detection operation will be able to filter out the legal packets as outliers. And a “whitelist” will be established based on these selected packets’ IP addresses to protect legal access to the system. This mechanism (see Figure 1) assumes that packets from the same legal sources are legal. The proposed intrusion-detection framework adopts the strategy of active-defense, which can reduce the requirement of the cooperation among detection and defense mechanisms and improve the compatibility of intrusion-detection methods in different network environments. In addition, the update mechanism based on “white list” can ensure the normal access of legitimate sources, thus ensuring the real-time monitoring of attacks and the communication requirements of legitimate users.
3. Related Works
Broadly speaking, traditional threshold-based DDoS detection methods are applications of anomaly detection. Anomaly detection represents the data by finding the correlation between data features and trying to map data to the optimal subspace. Through mapping, the process of data mapping to subspace, the data with a large reconstruction error is identified as abnormal data, comparing it to the majority of samples [8]. Principal Component Analysis (PCA) can be used for threshold-based outlier detection. Lakhina et al. [10] used the PCA algorithm to separate the high-dimensional space occupied by a set of network traffic measurements into disjoint subspaces corresponding to normal and anomaly network conditions and performed outlier detection on the subspaces. Yang et al. [11] and Zhu et al. [12] used different methods to detect anomalies by using reconstruction errors. In research history, Local Outlier Factor Algorithm (LOF) [13], PSO-BP [14], and the Intrusion-detection method using Online Sequence Extreme Learning Machine (OS-ELM) [15] have all used reconstruction error as the threshold for anomaly detection.
In practical applications, input features are typically nonlinear. Therefore, nonlinear methods, such as Autoencoders, are becoming a trending approach for analyzing network traffic data. To better capture the nonlinear correlation between features, Chen et al. [8] used a convolution Autoencoder with a smaller number of parameters to execute dimension reduction. Similarly, Shaikh et al. [16] proposed a deep learning framework for intrusion detection that utilized an Autoencoder and recurrent neural network (RNN). Fan et al. [17] proposed a dual automatic encoder (AnomalyDAE) framework for anomaly detection that captured the complex interactive information between the network structure and node attributes.
As deep learning advances, there are more and more algorithms and frameworks being developed to solve anomaly detection issues. Engly et al. [1] aimed to solve the issues of imbalanced data and ineffective features by using imbalance correction and feature selection. They conducted experiments on Random Forests, Neural Networks, and Gradient-Boosting Machines and found that the best detection performance could be achieved by an ensemble with two neural networks and a Gradient-Boosting Machine. Li et al. [18] focused on improving the detection accuracy of malicious nodes through an intrusion sensitivity-based trust management model and a supervised approach that employed machine learning techniques.
Autoencoder-based anomaly detection has also been applied to other fields. Azzalini et al. [19] proposed a minimally supervised method for detecting anomalies in autonomous robots using deep learning. Kolberg et al. [20] developed a novel presentation attack detection (PAD) method for fingerprint-based biometric authentication systems. Finally, Meng et al. attempted to develop a trust-based intrusion detection mechanism for a wireless sensor network (WSN) using Bayesian modeling.
As we can see, machine learning, particularly deep learning, has been extensively utilized in the field of anomaly-detection research. Researchers are currently exploring the use of different structural neural networks to satisfy specific data characteristics. Despite these efforts, most anomaly-detection methods still possess drawbacks with regards to false positives and inaccuracies.
4. Methods
4.1. Overall Framework of Proposed Method
This paper introduces an algorithm for detecting anomalies based on multiple thresholds. To determine the threshold for classifying traffic data as normal or anomalous, we train independent Autoencoders for each different network traffic, and each Autoencoder has its own unique threshold that depends on the specific classification result.
Since the performance of the threshold-based anomaly detection algorithm is greatly affected by the type of network traffic data used for model training [21], the data structure can impact anomaly detection, and changes in data distribution can decrease algorithm performance [22]. We propose the use of the BIRCH-Autoencoder (BAE) approach to pre-classify the training data and group network traffic packets with similar data structures. An Autoencoder is then trained for each subgroup, with the number of Autoencoders corresponding to the number of subgroups. This approach ensures that the models accurately describe the characteristics of network traffic and can handle complex data-distribution scenarios.
4.2. BIRCH for Data Pre-Classification
Balanced Iterative Reducing and Clustering Using Hierarchies (BIRCH) is an algorithm for clustering large datasets with limited memory resources [23], while minimizing the I/O cost by scanning datasets only once. BIRCH defines a cluster using Cluster Features (CFs) and represents the hierarchical architecture of clusters using a CF tree. This technique enables BIRCH to achieve fast and scalable clustering in large and even stream databases.
The CF and CF tree is the core methods of BIRCH. A CF is a triple-including clustering information, which is also additive. The definition of the additivity of CF is as follows:
Definition 1.
Suppose that is the cluster of N d-dimensional data points, where i = 1, 2, …, N, the cluster’s CF vector is defined as a triple: CF = (N, L), where N is the number of data points, L is the linear sum of the data points, i.e., and SS is the square sum of the N data points, i.e., .
Definition 2.
Suppose that and are the two disjoint clusters’ CF vectors, which makes .
The use of CF in BIRCH offers two key advantages: it significantly reduces the amount of storage space needed for data and enables efficient calculations of all clustering decision indexes.
Definition 3.
Suppose that is the cluster of N d-dimensional data points, where i = 1, 2, …, N, is the centroid of the cluster, R is the radius of the cluster, and D is the diameter of the cluster, they are defined in Equations (1), (2) and (3), respectively.
The CF tree is a balanced tree with two parameters: branching factor B and threshold T. Each non-leaf node contains a maximum of B entries in the form of , where . The is a pointer to the i-th child node, and is the CF of the subcluster represented by this child node. A leaf node contains at most nL entries, each of the forms , where . All entries in a leaf node must satisfy a threshold requirement. The size of the tree is determined by T, where the tree becomes smaller as T increases.
The BIRCH algorithm is employed as a pre-classification technique for the processed dataset prior to Autoencoder utilization. The number of clusters is specified to segment the processed dataset into distinct subsets based on unique clustering features, which are subsequently labeled with cluster tags for seamless Autoencoder anomaly detection.
4.3. Autoencoder for Anomaly Detection
The Autoencoder is a neural network algorithm that extracts hierarchical features from unlabeled data, aiming to reduce the dimensionality of high-dimensional input data. It achieves this by obtaining a low-dimensional vector representation of the original data and then reconstructing it back to the same dimension as the input data through the decoding process. This technique is useful for tasks, such as dimensionality reduction and data compression. An Autoencoder consists of the Encoder, Decoder, and Hidden Layer.
Definition 4.
Encoder. The Encoder is used for dimensionality reduction of high-dimensional features, which compresses the given input data to a specified dimension, which is equal to the number of neurons in the hidden layer.
The mapping between coded input data and implicit representation is expressed by Equation (4).
is the input vector. represents the encoder weight matrix with size , and b is a bias vector of dimensionality . is a nonlinear activate function, generally a sigmoid logic function, and its expression is given in Equation (5).
Definition 5.
Decoder. the Decoder is used for data reconstruction, which can be regarded as the inverse process of the Encoder. The low-dimensional data representation of the hidden layer is decoded to the size of the original vector space.
The mapping function of above decoder is given in Equation (6).
The process of training the Autoencoder is to find the minimum average reconstruction error on the given input data and the output data reduced and reconstructed by the Autoencoder. This reconstruction error is defined by Equation (7).
Specifically, the Autoencoder can compress the original input data and set the parameters and weights in the neural network according to the optimized reconstruction error. Ideally, this encoding will learn and describe the potential attributes of the input data. In this paper, the following functions (Equation (8)) are used to calculate the minimized average reconstruction error, and the L is the reconstruction error defined by Equation (7).
After training the auto-encoder, the test data can be inputted into this model, and the anomaly data or normal data can be distinguished by the threshold division of the reconstruction error, as shown in Equation (9), where L is the reconstruction error defined by Equation (7). is the output error after inputting the test Packet into the outlier mining algorithm.
For datasets labeled with different cluster labels, train an Autoencoder for them, and use this Autoencoder to calculate the reconstruction error, which can be used to detect the attack data.
After training, the dataset for testing is used as the input of the model, and the reconstruction error is used as the anomaly score. When the calculation error of the dataset for testing is greater than the threshold, it is identified as anomaly data or normal data.
5. Experimental Analysis
In this section, Logistic Regression, SVM, and Decision Tree are compared to BAE, with the Autoencoder utilized for pre-classification to showcase the performance of various algorithms in the detection task. The Accuracy, Recall, Precision, and F-score are employed for the evaluation, and comparative experiments are conducted on four datasets: KDDCUP99 [24], UNSW-NB15 [25], CICIDS2017 [26], and NSL-KDD [27].
5.1. Datasets
In this paper, KDDCUP99, UNSW-NB15, CICIDS2017, and NSL-KDD are used for experiments. These datasets contain both up-to-date common attacks and typical attacks that happened in history. Three of the datasets (KDDCUP99, UNSW-NB15, and CICIDS2017) are unique, as they do not overlap. Somehow, the KDDCUP99 and NSL-KDD can be seen as different resolutions of the same set of data. Typically, intrusion-detection datasets are usually confidential to the public. In order for our model to acquire sufficient knowledge about abnormal network traffic, we have made every effort to gather a comprehensive collection of commonly used open-resource datasets. Here are some further details on the datasets:
- UNSW-NB15: The original network packet of the UNSW-NB15 dataset is a public security dataset, including normal network traffic data and network attack data created in the network-wide laboratory of the Australian Cyber Security Centre (ACCS) using the IXIA PerfectStorm tool.
- CICIDS 2017: the CICIDS 2017 dataset is a network security dataset released by the Canadian Institute for Cybersecurity (CIC) in 2018. It collects data of various network attacks through the mounted network terminal.
- NSL-KDD: NSL-KDD is a suggested dataset to solve some inherent problems of the KDDCUP99 dataset.
5.2. Experiments
The dataset originally consisted of non-normalized data that contained zeros or characters in both the important and secondary features. This directly impacted the calculation of the clustering features and the generation of the clustering feature tree in BIRCH. To address this issue, the Min-Max normalization technique [30] and One-hot methodology were employed in this paper.
Normalize the numerical data in the dataset, linearly transform the original data, and map the data between [0, 1]. The transformation function is given in Equation (10).
For the character data in the dataset, the one-hot encoder is used to “binarize” the character data. Through the preprocessing of data, we can obtain a numerical and normalized dataset. At the same time, our research only focuses on DDoS attacks. Therefore, we select data with attack types of DDoS and DoS and Normal from different datasets and conduct subsequent experiments based on the data.
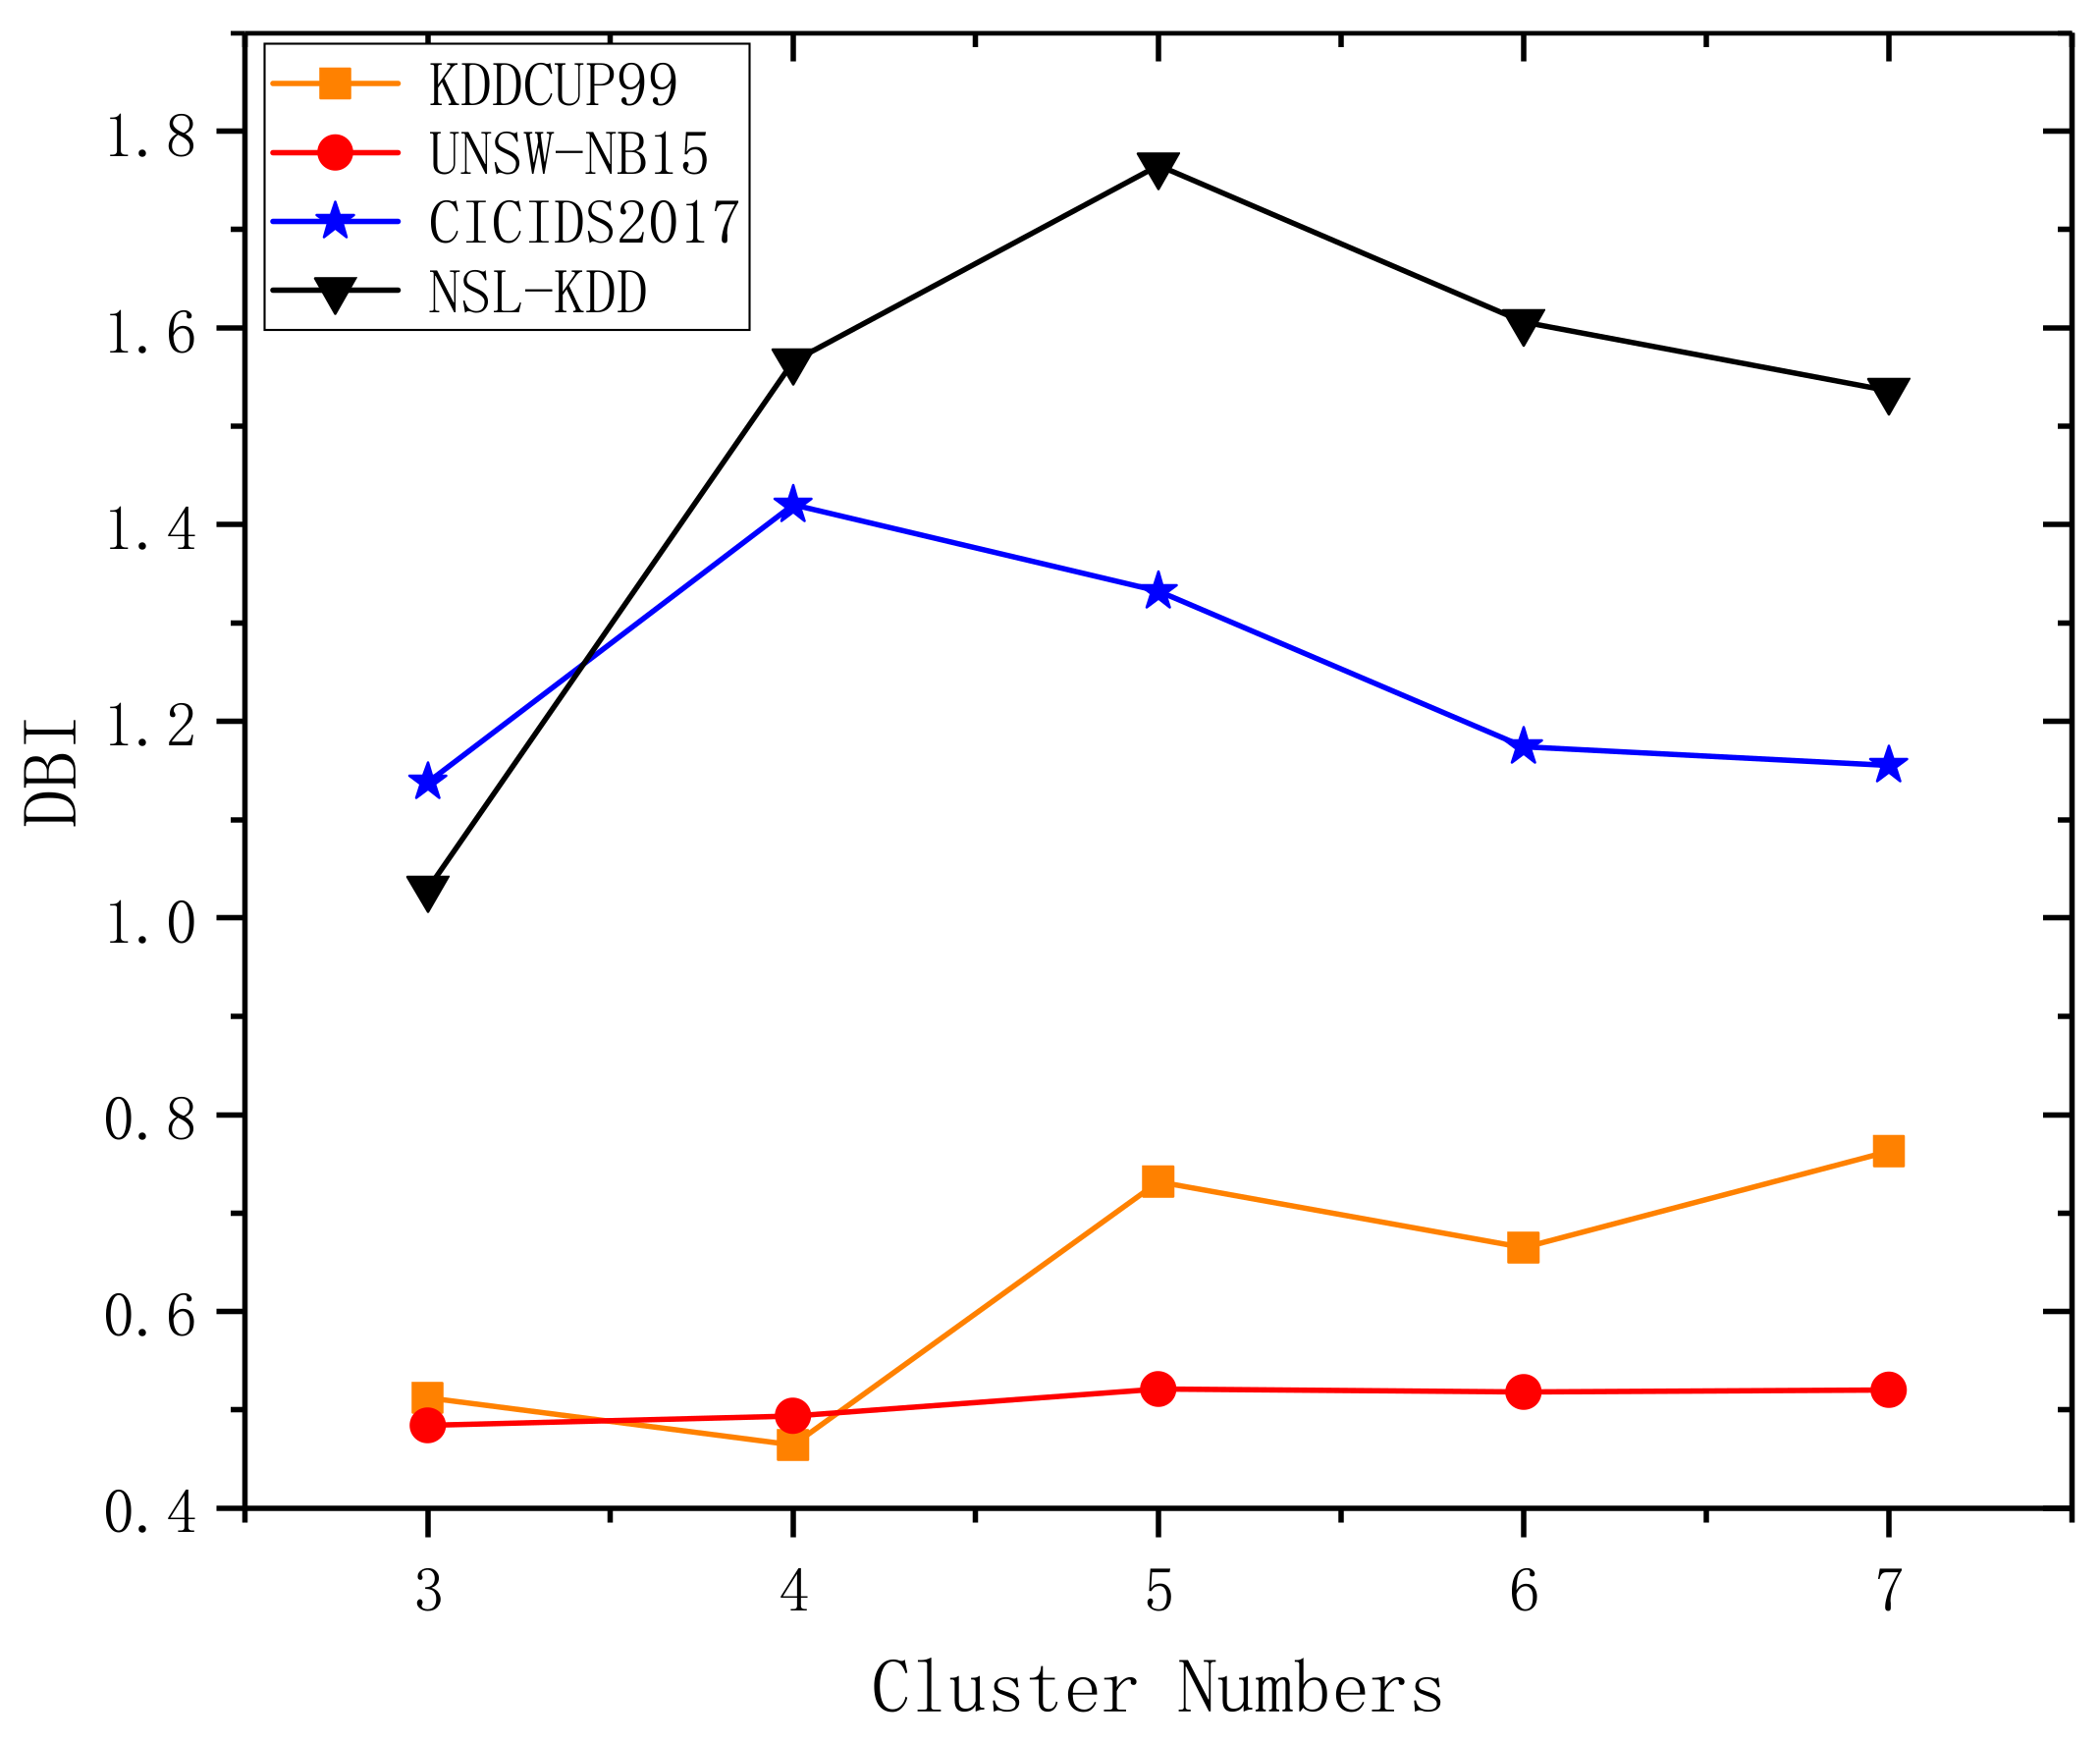
Firstly, the BIRCH is used to pre-classify all the data to obtain data subsets with different data characteristics, and these data subsets are used as new training data to be inputted into the corresponding Autoencoder model. In this paper, the Davies–Bouldin index (DBI) [31] is used to determine the number of clusters. This indicator is defined by Equation (11).
where is the average distance from each point in the cluster to the centroid of the cluster, is the distance between the centroid of the cluster and the centroid of the cluster , and n is the number of clusters.
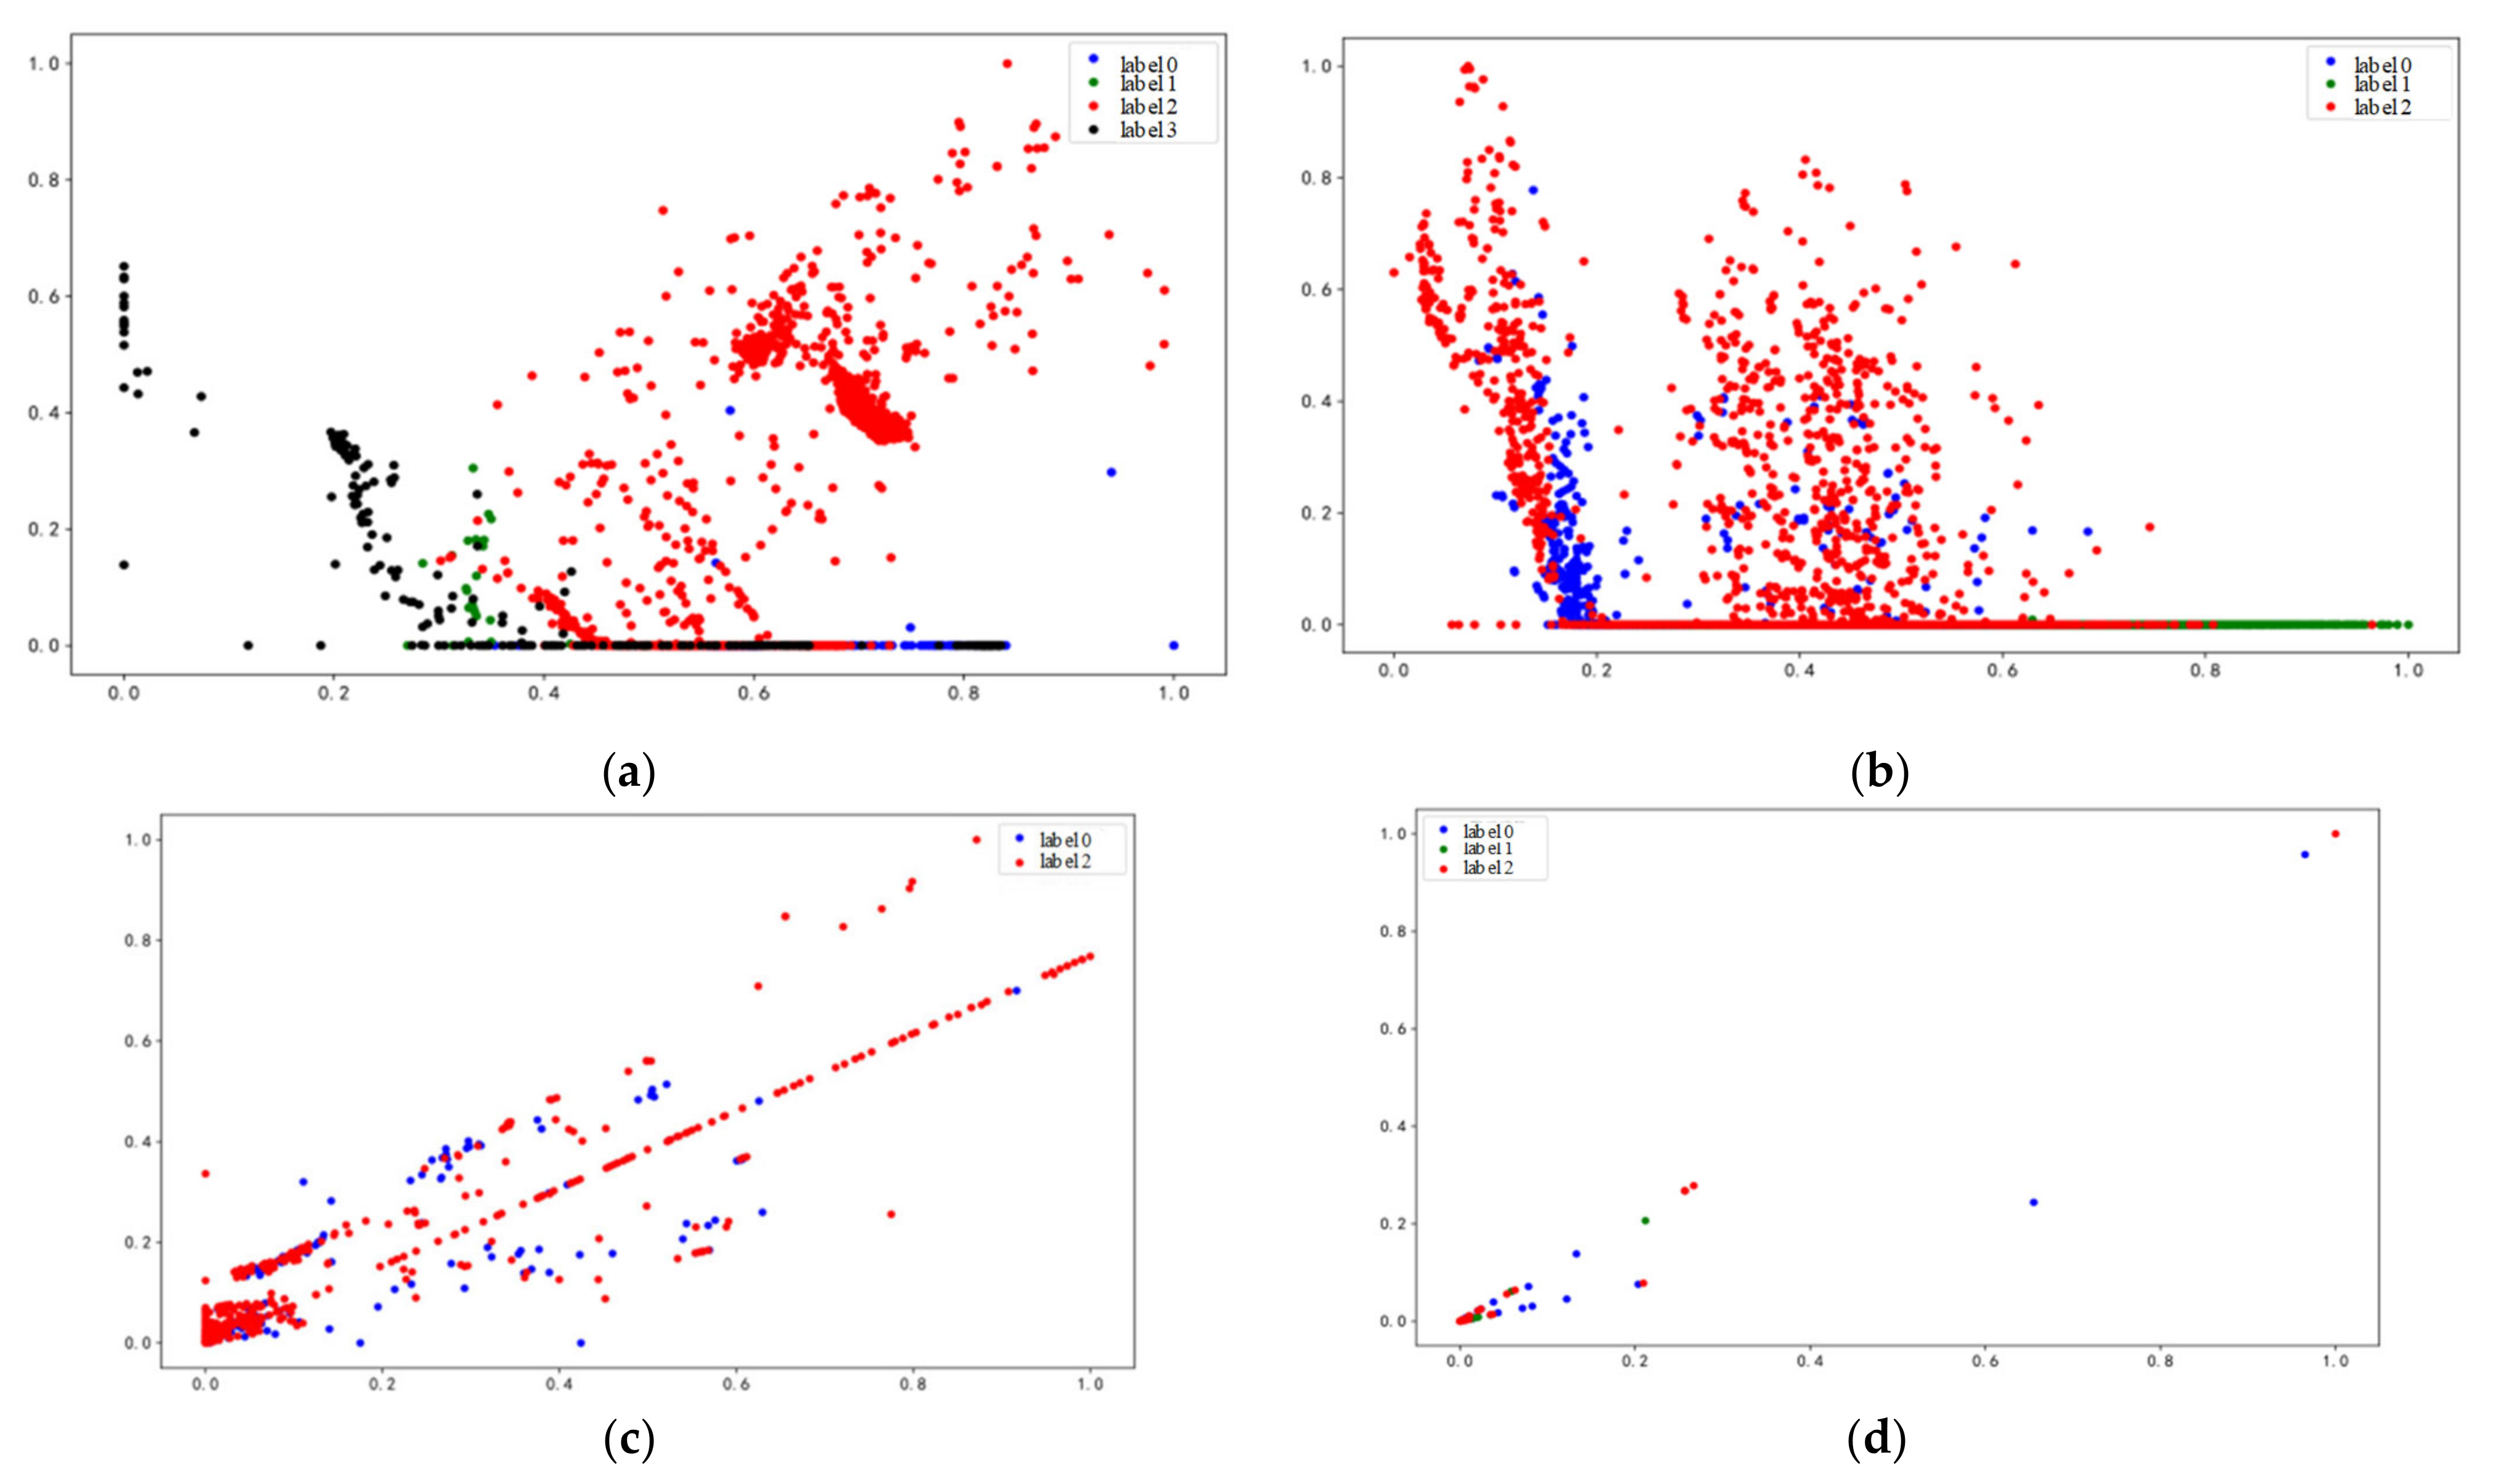
The DBI index reflects the average degree of “similarity” among clusters. A DBI value closer to 0 indicates a more favorable clustering effect. In Figure 2, different cluster numbers were tested, and the DBI scores demonstrate that the optimal number of clusters for the KDDCUP99 dataset in this experiment is 4, while the UNSW-NB15 and CICIDS2017 datasets require 3 clusters. In all cases, a smaller DBI translates to a better clustering effect. Figure 3 illustrates the clustering effect diagram.
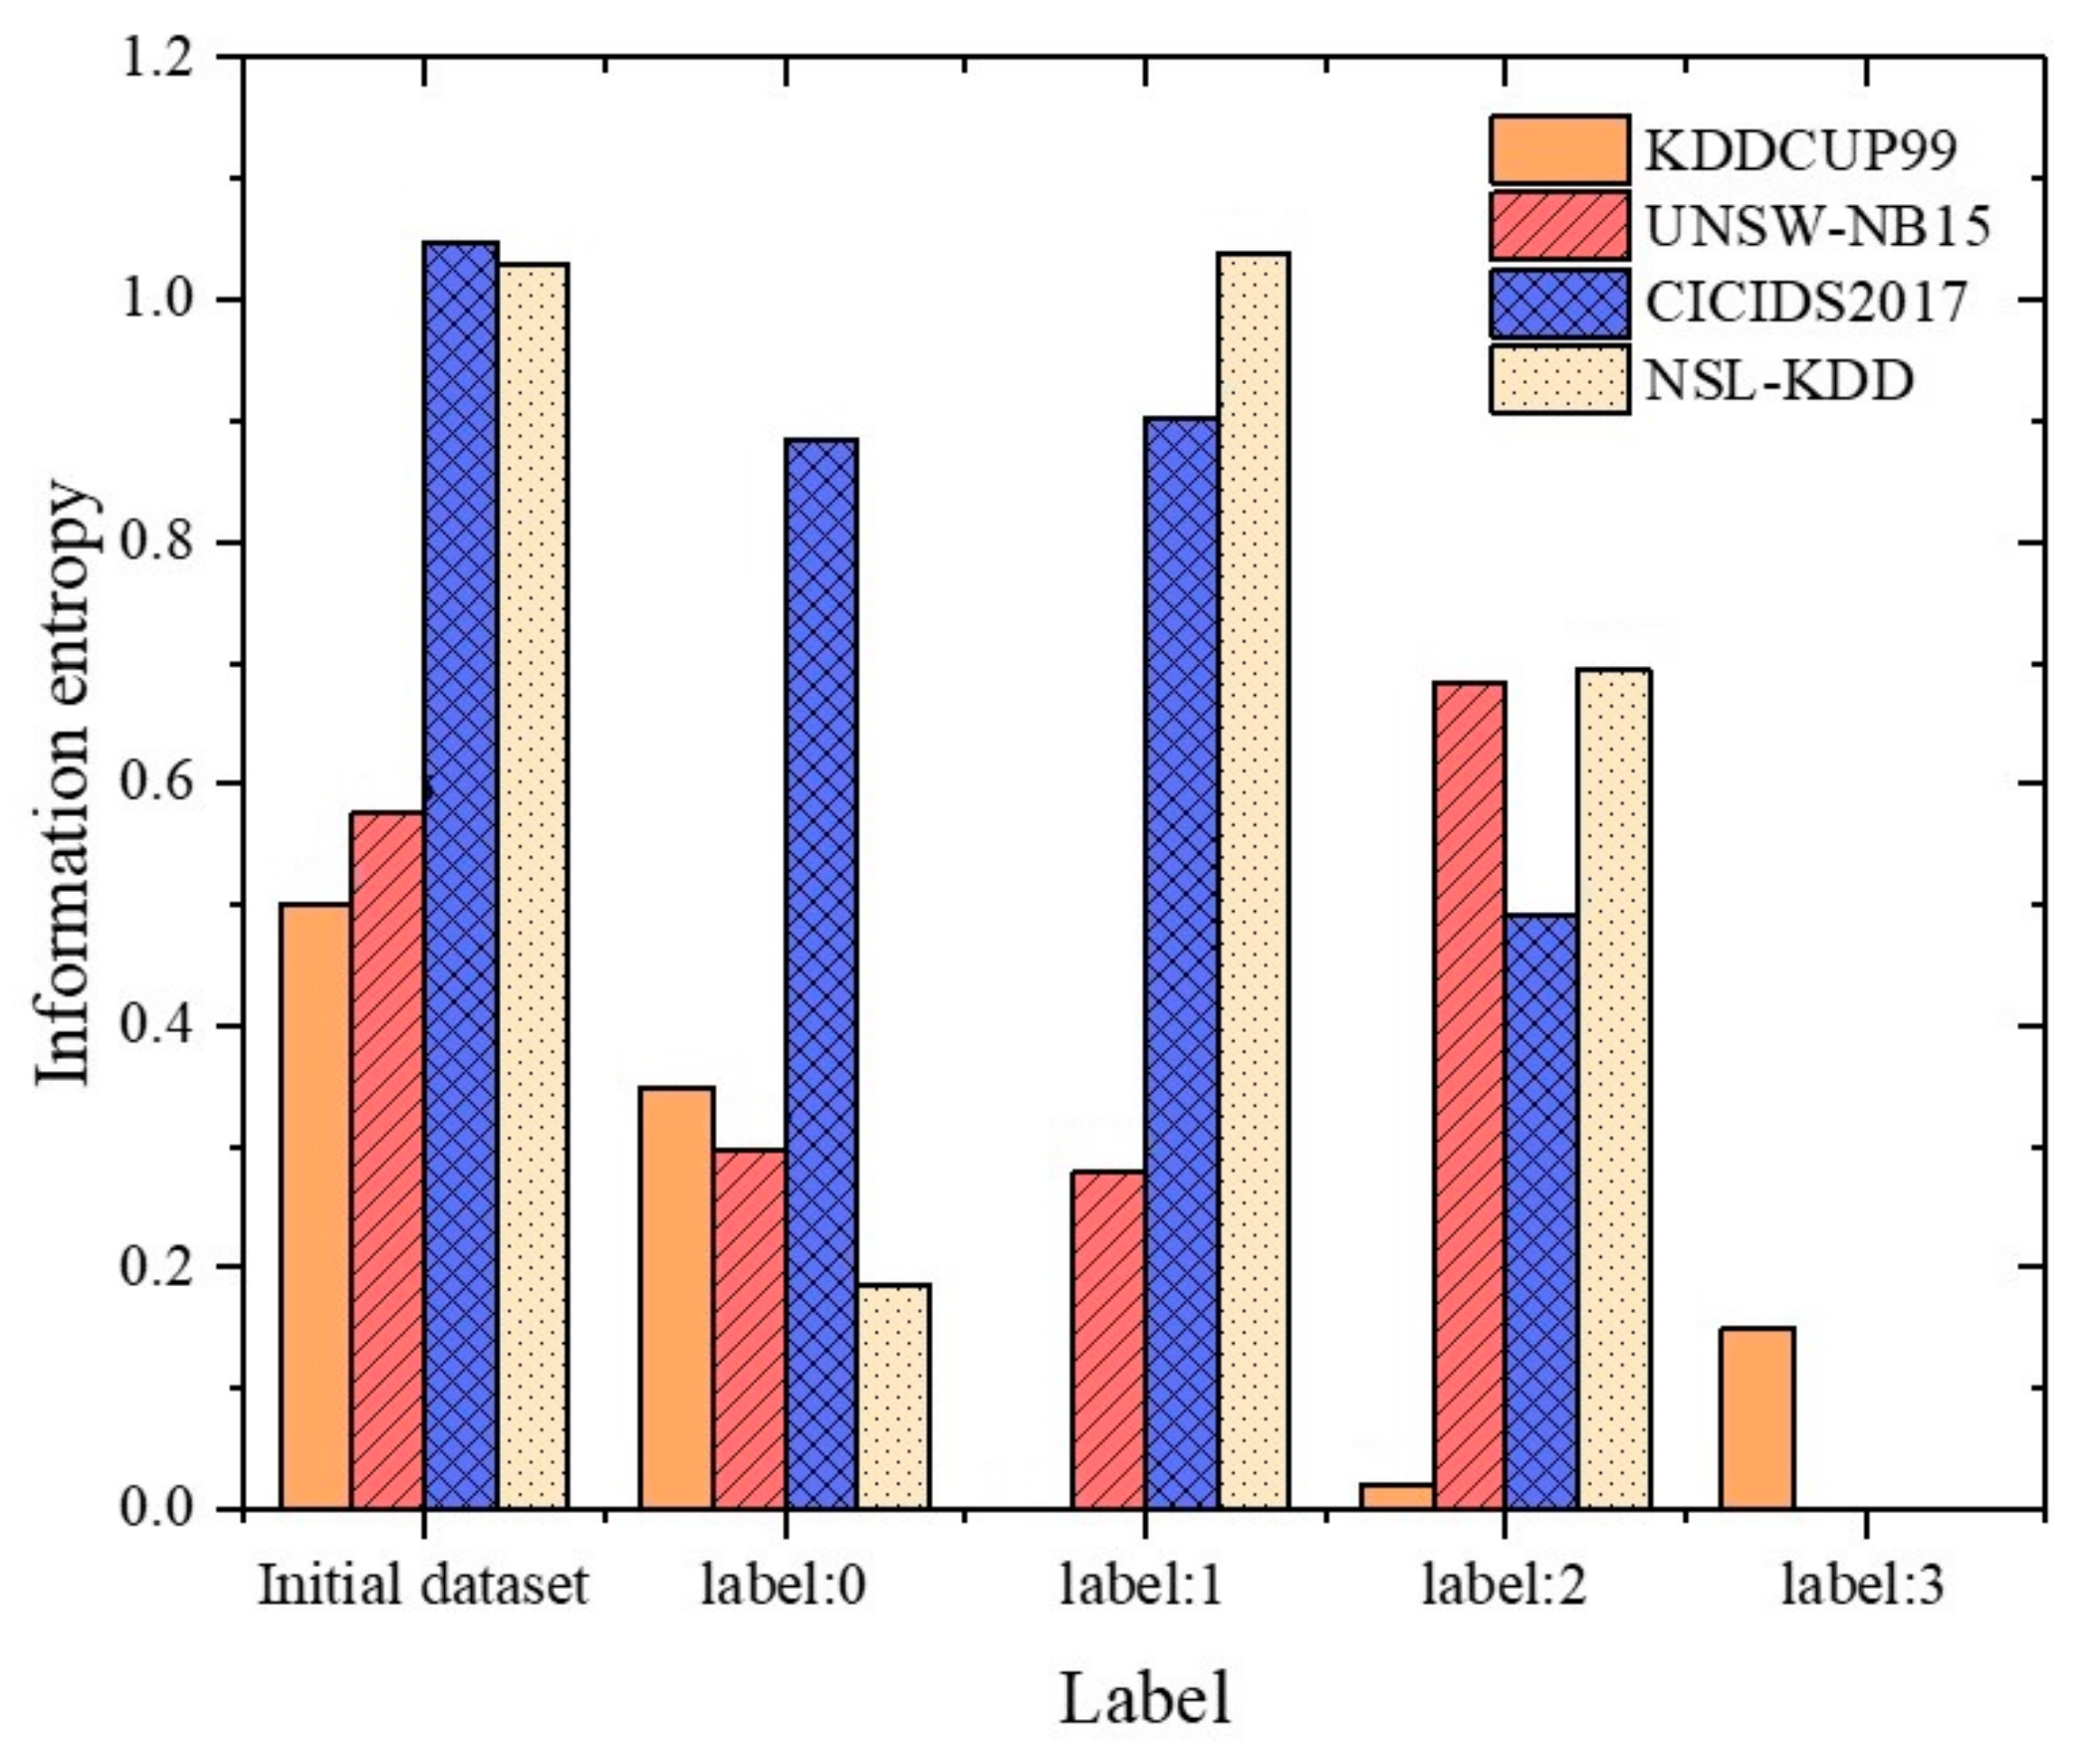
To demonstrate the impact of BIRCH on datasets with varied data distribution characteristics, this paper employs information entropy to depict the internal order degree of the datasets. The higher the level of order in a dataset, the lower its information entropy would be. The entropy values of the original datasets of KDDCUP99, UNSW-NB15, CICIDS2017, and NSL-KDD, without any prior classification, are 0.499, 0.576, 1.048, and 1.029, respectively. These values indicate that the original datasets have low levels of data order, which implies that they exhibit complex data distribution characteristics.
After pre-classifying the datasets using BIRCH (see Figure 4), the information entropy of the different datasets decreases, which minimizes the impact of irregular data on anomaly detection. During the experiment, we observed that the information entropy of the data subset with cluster label 2 in the UNSW-NB15 dataset (0.683) and the data subset with cluster label 1 in the NSL-KDD dataset (1.037) was higher than that of the original dataset. By analyzing different types of data subsets based on information entropy, we found that subsets with significantly different quantities of normal and abnormal data tend to have lower information entropy. Conversely, subsets with different or roughly equal quantities of both types of data often have information entropy close to or greater than that of the original dataset. This is due to the calculation formula for information entropy. In our experiment, only two out of the thirteen data subsets had slightly higher information entropy compared to the original dataset. Therefore, the experimental results suggest that the BIRCH algorithm can improve the organization of data to some extent. Furthermore, in these two specific data subsets, the performance of anomaly detection was relatively better, indicating that the BIRCH algorithm excels in clustering data with similar characteristics, even though it may not accurately distinguish between different types of data during the clustering process.
In the training of the Autoencoder, the pre-classified subset is used as input data to train the Autoencoder. The Autoencoder is used to minimize the average reconstruction error. Using this reconstruction error, normal data and anomaly data can be classified.
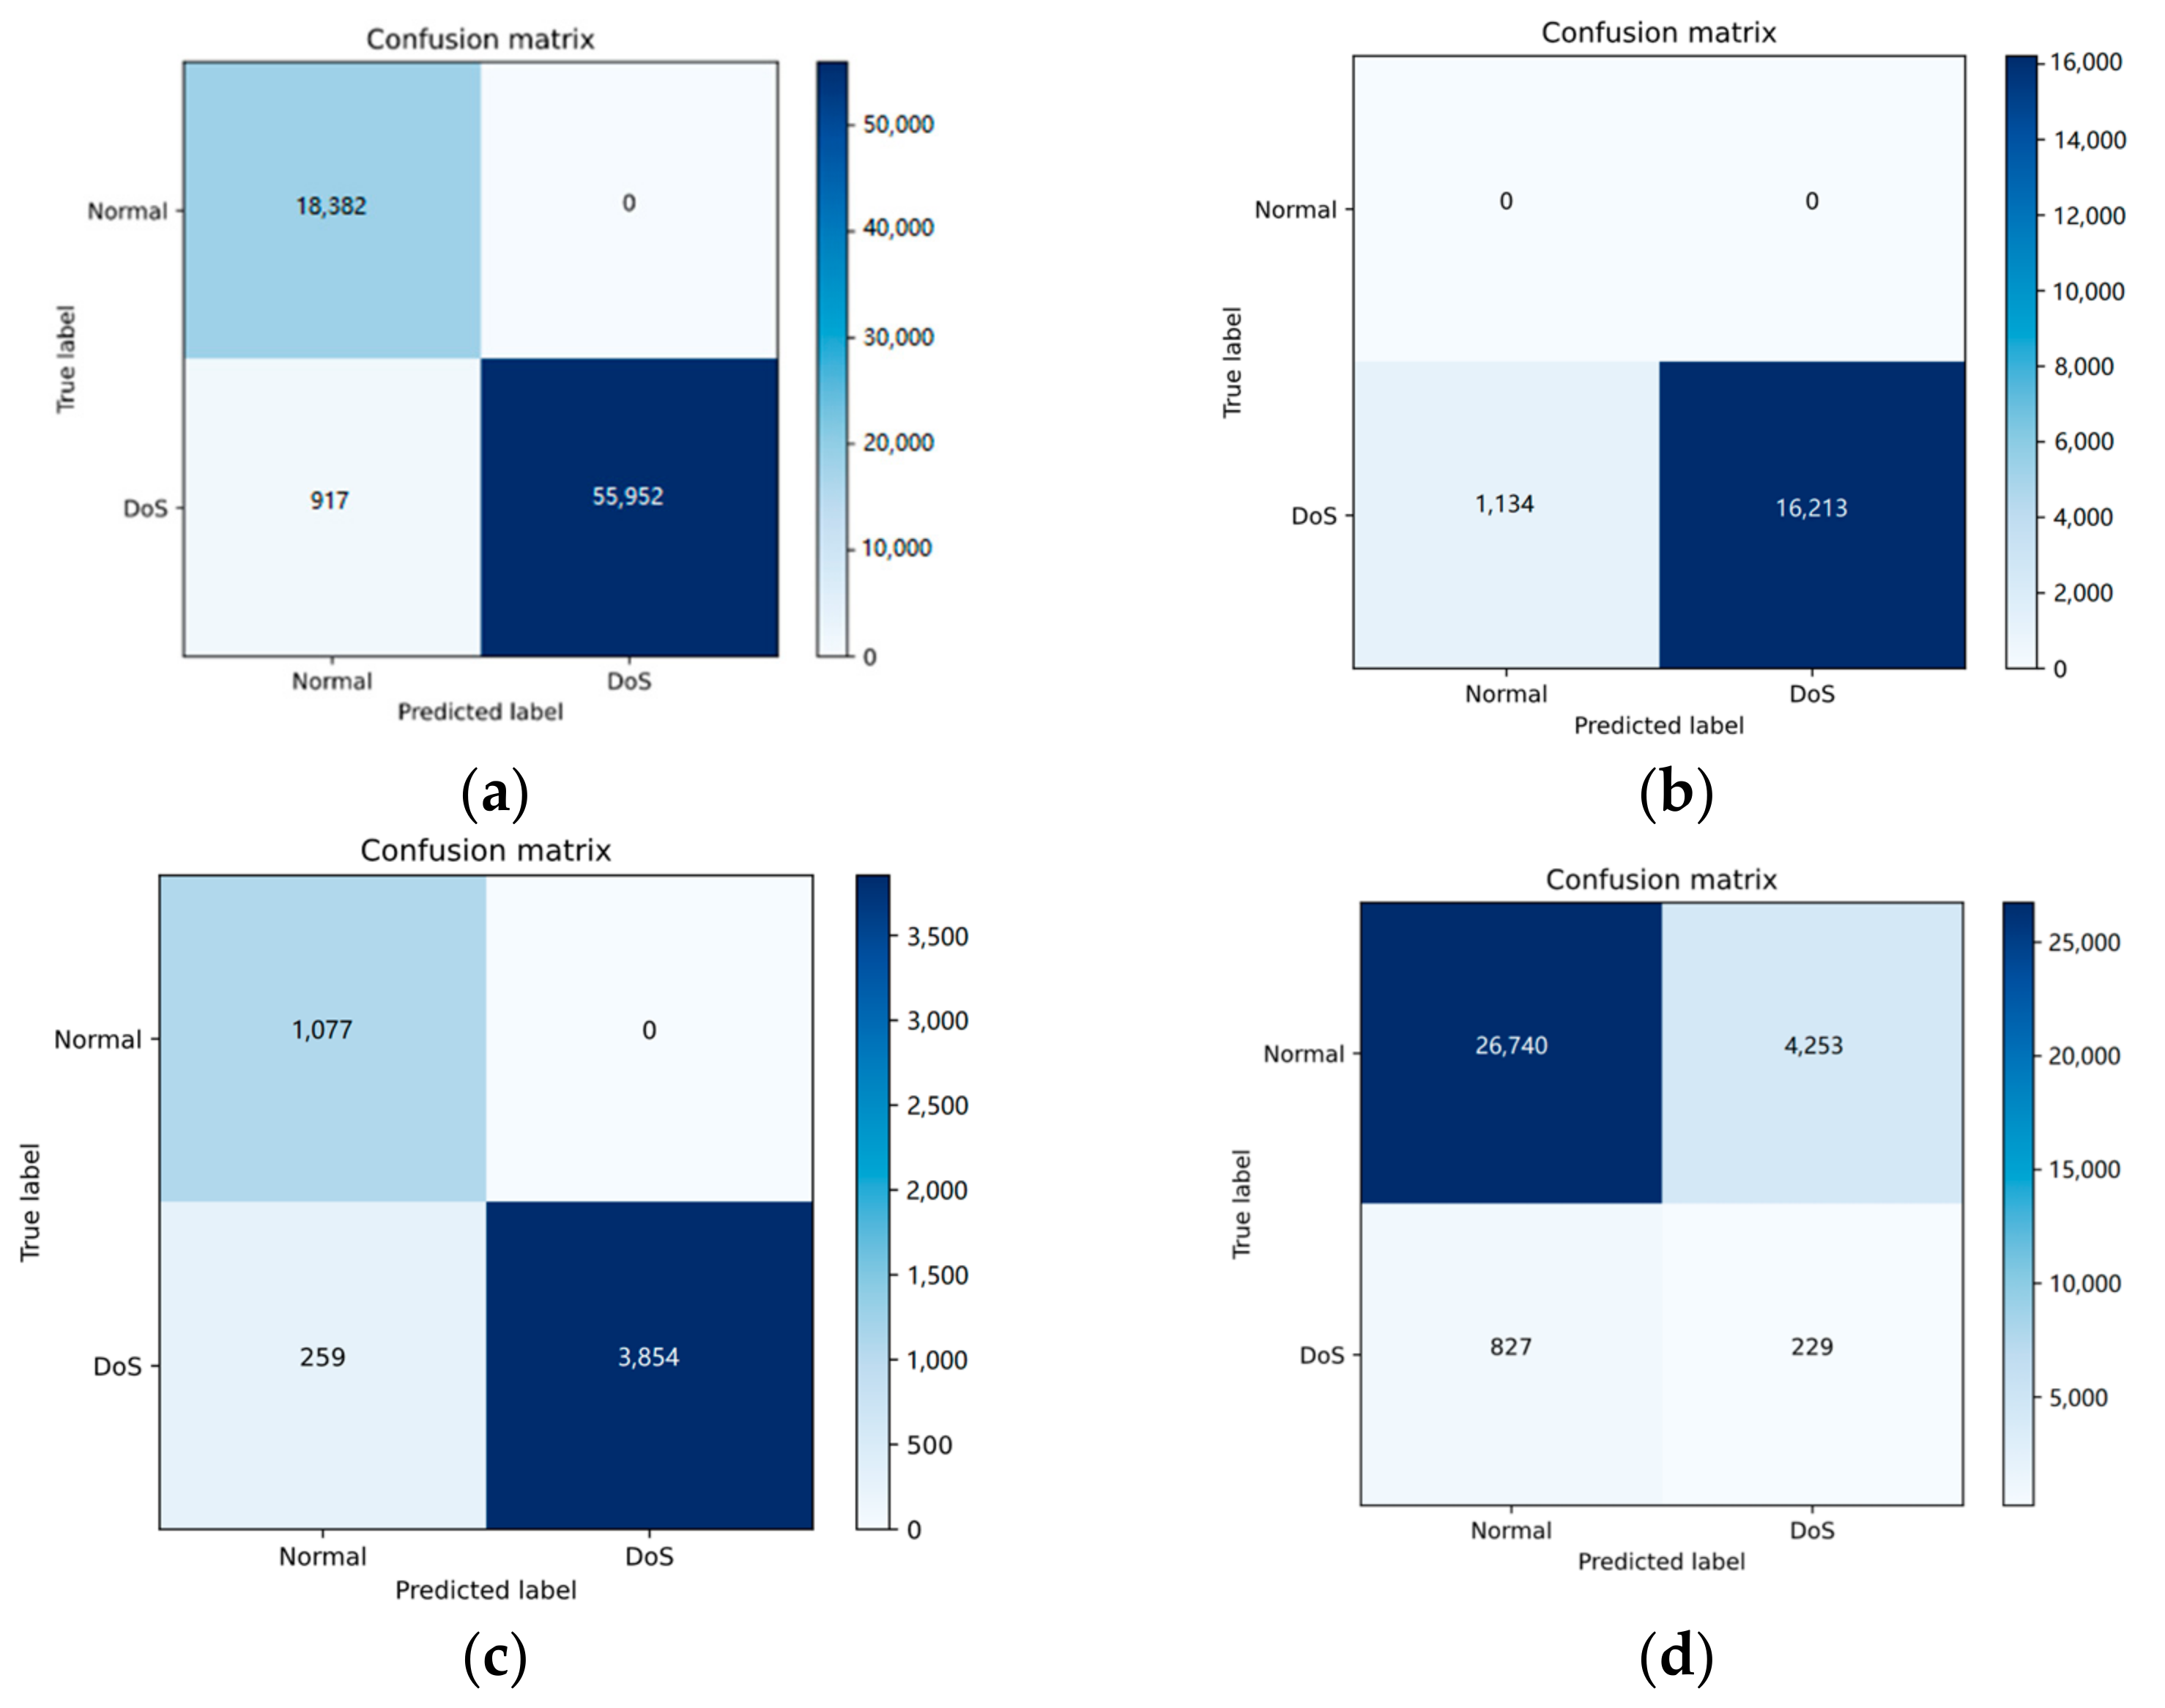
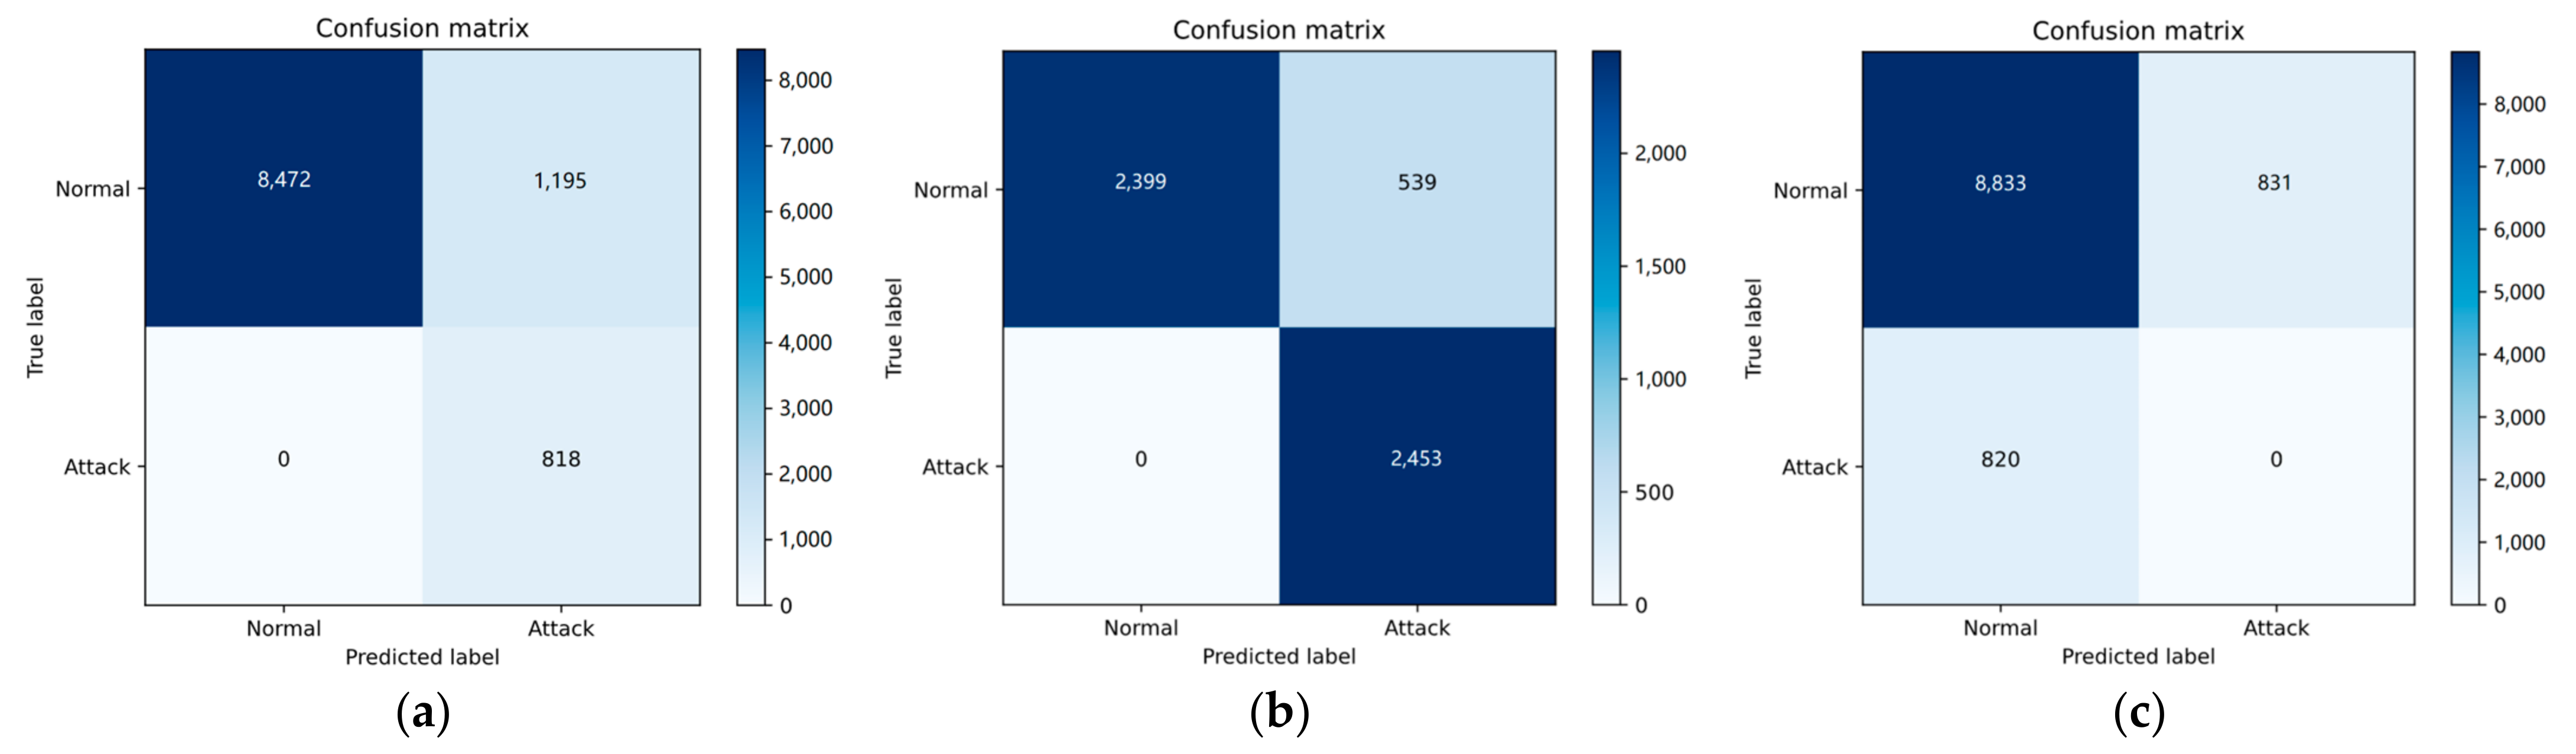
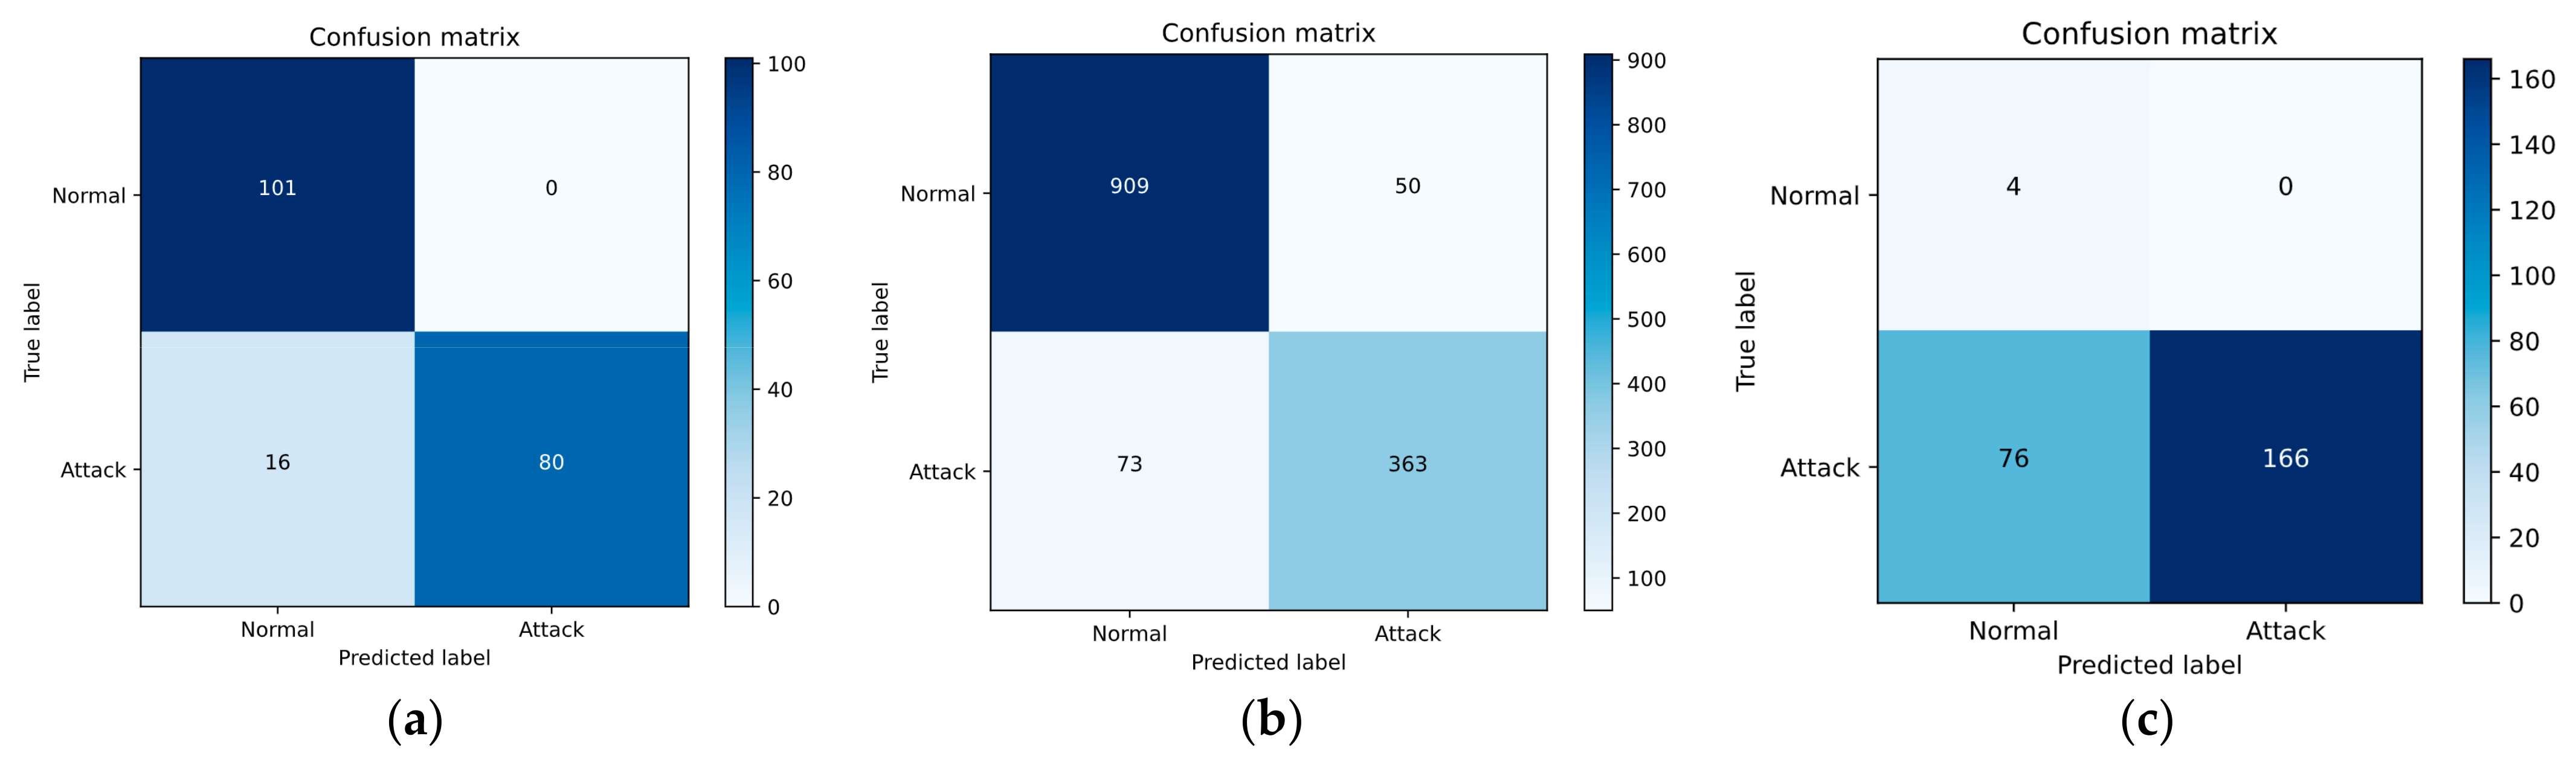
In the testing of the Autoencoder, the test data is inputted into the Autoencoder, and the reconstruction error is used as the anomaly score. We stack two 8-layer convolution neural networks to build the Autoencoder and took a rectified linear unit (ReLU) activation function. The regularization coefficient of our L2 regularization is 10 × 10−5. When the loss of data in the test set is greater than this threshold, it will be classified as normal data. Table 1, Table 2, Table 3 and Table 4 show the experimental results based on different datasets. And Figure 5, Figure 6 and Figure 7 show are the corresponding confusion matrices, which show more details on the experimental results.
In Table 1, the experimental results show that, compared with Logistic Regression, SVM, and Decision Tree, the BAE achieves better results in the accuracy, precision, and F-score. As we noticed, BAE’s recall based on KDDCUP99 is 6% lower than SVM and the Decision Tree, but its accuracy and precision and F-score are much higher than SVM and the Decision Tree (up to 9%). For intrusion-detection tasks, informally, precision is the fraction of all detected anomalies that are real anomalies, whereas recall is the fraction of all real anomalies that are successfully detected. For real-world implementation, a higher false detection rate (low precision) will lead to poor user experience. Since BAE’s average recall is more than 90%, we believe that trading a little bit recall for precision is a better choice. Compared with the Autoencoder without pre-classification, BAE has significantly improved the accuracy, recall rate, and F-score. The experimental results show that using BIRCH to pre-classify data can improve the evaluation indexes, and the architecture of BIRCH combined with the Autoencoder can obtain a better anomaly-detection effect. The experiments on the UNSW-NB15, CICIDS2017, and NSL-KDD also prove that the proposed method is effective. Using DBI to determine the optimal cluster number of UNSW-NB15, CICIDS2017, and NSL-KDD, values are all 3.
Results in Table 2 show that, compared with the logistic regression algorithm, SVM algorithm, and decision tree algorithm, the BAE algorithm performed slightly better in terms of the recall rate, precision rate, and F-score, but slightly worse in terms of accuracy. When comparing the experiments without pre-classification and directly using the proposed Autoencoder model in this paper with the experiments using pre-classification and the proposed Autoencoder model in this paper, the accuracy decreased by 5.415%, the precision rate decreased by 28.542%, and the F-score decreased by 18.434%.
Results in Table 3 show that the average accuracy of anomaly-detection experiments based on different data subsets is 92.580%. Compared with the logistic regression algorithm, SVM algorithm, and decision tree algorithm, the BAE algorithm performed better in terms of accuracy. When comparing the experiments with and without pre-classification using the proposed Autoencoder model in this paper, the accuracy decreased by 2.732%, the recall rate decreased by 3.055%, the precision rate decreased by 5.731%, and the F-score decreased by 4.233%.
In Table 2, Table 3 and Table 4, the experimental results demonstrate that BAE outperforms Logistic Regression, SVM, and the Decision Tree in terms of recall, precision, and F-score when processing UNSW-NB15, but slightly underperforms in accuracy. For CICIDS2017, BAE achieves higher accuracy. In NSL-KDD, BAE has a higher accuracy than Logistic Regression and SVM, but slightly lower accuracy than the Decision Tree. Across these four datasets, BAE achieves significant improvements in accuracy, precision, and F-score when compared to the Autoencoder without pre-classification. Also, as we can see from Figure 5, Figure 6 and Figure 7, the confusion matrices maintain consistency with the corresponding experimental statistical results.
Based on the aforementioned results, BAE combined with BIRCH and the Autoencoder exhibits varying performance based on different datasets. However, overall, it results in better anomaly-detection outcomes.
6. Conclusions
In this work, we proposed an anomaly-detection algorithm called the BAE algorithm. BAE utilizes BIRCH as the pre-algorithm for the anomaly-detection algorithm based on the Autoencoder. BIRCH is effective in diminishing the impact of datasets with complex data distribution characteristics on the threshold for anomaly detection. Using DBI, the optimal cluster number for a data subset is selected based on the best clustering effect, and the corresponding Autoencoder is trained on the data subset outputted by BIRCH. The Autoencoder is often regarded as the core algorithm in intrusion-detection systems due to its potential to detect anomalous traffic. The model can compute the threshold by determining the disparity between input and output data and recognize legal and anomalous packets through the threshold. The proposed BAE algorithm has been validated experimentally using the KDDCUP99, UNSW-NB15, CICIDS2017, and NSL-KDD datasets. These experiments demonstrate the effective and accurate detection of anomalies in unlabeled data using the algorithm. In this research, optimizing the running efficiency of BAE was not a focus, and the computational complexity of the algorithm is not sufficiently low. In the future, we will put more effort into improving its running efficiency. Additionally, since BAE is a framework-like algorithm, alternative classic pre-classification algorithms can be used, and more advanced Autoencoders can be employed to replace the current one in order to achieve better performance.
Author Contributions
Conceptualization, D.W. and D.C.; methodology, D.W.; software, M.N.; validation, D.W. and D.C.; formal analysis, D.W. and M.N.; investigation, M.N.; resources, D.W.; data curation, M.N.; writing—original draft preparation, M.N.; writing—review and editing, D.W.; visualization, M.N.; supervision, D.C.; project administration, D.W.; funding acquisition, D.W. and D.C. All authors have read and agreed to the published version of the manuscript.
Funding
This work was supported in part by Science and Technology Plan Project of Liaoning Province (No. 2022-KF-11-04), in part by the Fundamental Research Funds for the Central Universities under Grant N2217002, in part by the Applied Basic Research Project of Liaoning Province under Grant 2023JH2/101300185, and in part by the Key Technologies Research and Development Program of Liaoning Province in China under Grant 2021JH1/10400079.
Data Availability Statement
All relevant data are within the manuscript.
Acknowledgments
We thank the anonymous reviewers for their careful reading and valuable comments, which were all valuable and helpful for revising and improving our paper, as well as for providing important guiding significance to our research.
Conflicts of Interest
The authors declare no conflict of interest.
References
- Engly, A.H.; Larsen, A.R.; Meng, W. Evaluation of Anomaly-Based Intrusion Detection with Combined Imbalance Correction and Feature Selection. In Proceedings of the International Conference on Network and System Security, Melbourne, Australia, 25–27 November 2020; pp. 277–291. [Google Scholar]
- Hussain, A.; Heidemann, J.; Papadopoulos, C. A framework for classifying denial of service attacks. In Proceedings of the 2003 Conference on Applications, Technologies, Architectures, and Protocols for Computer Communications, Karlsruhe, Germany, 25–29 August 2003; pp. 99–110. [Google Scholar]
- Vincent, P.; Larochelle, H.; Lajoie, I.; Bengio, Y.; Manzagol, P.-A.; Bottou, L. Stacked denoising autoencoders: Learning useful representations in a deep network with a local denoising criterion. J. Mach. Learn. Res. 2010, 11, 3371–3408. [Google Scholar]
- Al-Qatf, M.; Lasheng, Y.; Al-Habib, M.; Al-Sabahi, K. Deep learning approach combining sparse autoencoder with SVM for network intrusion detection. IEEE Access 2018, 6, 52843–52856. [Google Scholar] [CrossRef]
- Kingma, D.P.; Welling, M. Auto-encoding variational bayes. arXiv 2013, arXiv:1312.6114 2013. [Google Scholar]
- Masci, J.; Meier, U.; Cireşan, D.; Schmidhuber, J. Stacked convolutional auto-encoders for hierarchical feature extraction. In Lecture Notes in Computer Science, Proceedings of International Conference on Artificial Neural Networks, Espoo, Finland, 14–17 June 2011; Springer: Berlin/Heidelberg, Germany, 2011; pp. 52–59. [Google Scholar]
- Park, S.; Seo, S.; Kim, J. Network intrusion detection using stacked denoising autoencoder. Adv. Sci. Lett. 2017, 23, 9907–9911. [Google Scholar] [CrossRef]
- Chen, Z.; Yeo, C.K.; Lee, B.S.; Lau, C.T. Autoencoder-based network anomaly detection. In Proceedings of the 2018 Wireless Telecommunications Symposium (WTS), Phoenix, AZ, USA, 17–20 April 2018; pp. 1–5. [Google Scholar]
- Shone, N.; Ngoc, T.N.; Phai, V.D.; Shi, Q. A deep learning approach to network intrusion detection. IEEE Trans. Emerg. Top. Comput. Intell. 2018, 2, 41–50. [Google Scholar] [CrossRef] [Green Version]
- Lakhina, A.; Crovella, M.; Diot, C. Diagnosing network-wide traffic anomalies. ACM SIGCOMM Comput. Commun. Rev. 2004, 34, 219–230. [Google Scholar] [CrossRef] [Green Version]
- Yang, S.; Zhang, R.; Nie, F.; Li, X. Unsupervised feature selection based on reconstruction error minimization. In Proceedings of the ICASSP 2019–2019 IEEE International Conference on Acoustics, Speech and Signal Processing (ICASSP), Brighton, UK, 12–17 May 2019; pp. 2107–2111. [Google Scholar]
- Zhu, Q.-H.; Yang, Y.-B. Subspace clustering via seeking neighbors with minimum reconstruction error. Pattern Recognit. Lett. 2018, 115, 66–73. [Google Scholar] [CrossRef]
- Auskalnis, J.; Paulauskas, N.; Baskys, A. Application of local outlier factor algorithm to detect anomalies in computer network. Elektron. Elektrotechnika 2018, 24, 96–99. [Google Scholar] [CrossRef] [Green Version]
- Shen, X.; Zhang, J. Research of intrusion detection based on the BP networks and the improved PSO algorithm. Comput. Eng. Sci. 2010, 32, 34–36. [Google Scholar]
- Li, Y.; Qiu, R.; Jing, S. Intrusion detection system using Online Sequence Extreme Learning Machine (OS-ELM) in advanced metering infrastructure of smart grid. PLoS ONE 2018, 13, e0192216. [Google Scholar] [CrossRef] [PubMed] [Green Version]
- Shaikh, R.A.; Shashikala, S. An Autoencoder and LSTM based Intrusion Detection approach against Denial of service attacks. In Proceedings of the 2019 1st International Conference on Advances in Information Technology (ICAIT), Chikmagalur, India, 24–27 July 2019; pp. 406–410. [Google Scholar]
- Fan, H.; Zhang, F.; Li, Z. AnomalyDAE: Dual autoencoder for anomaly detection on attributed networks. In Proceedings of the ICASSP 2020—2020 IEEE International Conference on Acoustics, Speech and Signal Processing (ICASSP), Barcelona, Spain, 4–8 May 2020; pp. 5685–5689. [Google Scholar]
- Li, W.; Meng, W.; Kwok, L.-F.; Horace, H. Enhancing collaborative intrusion detection networks against insider attacks using supervised intrusion sensitivity-based trust management model. J. Netw. Comput. Appl. 2017, 77, 135–145. [Google Scholar] [CrossRef]
- Azzalini, D.; Bonali, L.; Amigoni, F. A Minimally Supervised Approach Based on Variational Autoencoders for Anomaly Detection in Autonomous Robots. IEEE Robot. Autom. Lett. 2021, 6, 2985–2992. [Google Scholar] [CrossRef]
- Kolberg, J.; Grimmer, M.; Gomez-Barrero, M.; Busch, C. Anomaly detection with convolutional autoencoders for fingerprint presentation attack detection. IEEE Trans. Biom. Behav. Identity Sci. 2021, 3, 190–202. [Google Scholar] [CrossRef]
- Tan, Z.; Jamdagni, A.; He, X.; Nanda, P.; Liu, R.P. A System for Denial-of-Service Attack Detection Based on Multivariate Correlation Analysis. IEEE Trans. Parallel Distrib. Syst. 2014, 25, 447–456. [Google Scholar] [CrossRef]
- Maxion, R.A.; Tan, K.M. Benchmarking anomaly-based detection systems. In Proceedings of the International Conference on Dependable Systems and Networks, DSN, New York, NY, USA, 25–28 June 2000; pp. 623–630. [Google Scholar]
- Zhang, T.; Ramakrishnan, R.; Livny, M. BIRCH: An efficient data clustering method for very large databases. ACM Sigmod Rec. 1996, 25, 103–114. [Google Scholar] [CrossRef]
- Siddique, K.; Akhtar, Z.; Khan, F.A.; Kim, Y. KDD Cup 99 data sets: A perspective on the role of data sets in network intrusion detection research. Computer 2019, 52, 41–51. [Google Scholar] [CrossRef]
- Moustafa, N.; Slay, J. UNSW-NB15: A comprehensive data set for network intrusion detection systems (UNSW-NB15 network data set). In Proceedings of the 2015 Military Communications and Information Systems Conference (MilCIS), Canberra, Australia, 10–12 November 2015; pp. 1–6. [Google Scholar]
- Sharafaldin, I.; Lashkari, A.H.; Ghorbani, A.A. Toward generating a new intrusion detection dataset and intrusion traffic characterization. In Proceedings of the ICISSP, Funchal, Madeira, Portugal, 22–24 January 2018; pp. 108–116. [Google Scholar]
- Revathi, S.; Malathi, A. A detailed analysis on NSL-KDD dataset using various machine learning techniques for intrusion detection. Int. J. Eng. Res. Technol. 2013, 2, 1848–1853. [Google Scholar]
- Tavallaee, M.; Bagheri, E.; Lu, W.; Ghorbani, A.A. A detailed analysis of the KDD CUP 99 data set. In Proceedings of the IEEE International Conference on Computational Intelligence for Security & Defense Applications 2009, Ottawa, ON, Canada, 8–10 July 2009. [Google Scholar]
- Datahub. Kddcup99. Available online: https://datahub.io/machine-learning/kddcup99 (accessed on 18 July 2023).
- Ihsan, Z.; Idris, M.Y.; Abdullah, A.H. Attribute normalization techniques and performance of intrusion classifiers: A comparative analysis. Life Sci. J. 2013, 10, 2568–2576. [Google Scholar]
- Davies, D.L.; Bouldin, D.W. A cluster separation measure. IEEE Trans. Pattern Anal. Mach. Intell. 1979, 2, 224–227. [Google Scholar] [CrossRef]
Figure 1.
The framework of active-defense.

Figure 2.
DBI under different cluster numbers in different datasets.

Figure 3.
Scatter graph of clustering effect. Clustering effect of KDDCUP99. (a) UNSW-NB15; (b) CICIDS2017; (c) NSL-KDD; (d) datasets using BIRCH and PCA are used in dimensionality reduction.
Figure 3.
Scatter graph of clustering effect. Clustering effect of KDDCUP99. (a) UNSW-NB15; (b) CICIDS2017; (c) NSL-KDD; (d) datasets using BIRCH and PCA are used in dimensionality reduction.

Figure 4.
Information entropy of data subsets based on different datasets. KDDCUP99 (with label: ), UNSW-NB15 (with label: ), CICIDS2017 (with label: ), = 0, 1, 2…. This represents subsets of data with different cluster labels.
Figure 4.
Information entropy of data subsets based on different datasets. KDDCUP99 (with label: ), UNSW-NB15 (with label: ), CICIDS2017 (with label: ), = 0, 1, 2…. This represents subsets of data with different cluster labels.

Figure 5.
Confusion matrices of BAE algorithms’ outcomes based on KDDCUP99. (a) label: 0; (b) label: 1; (c) label: 2; (d) label: 3.
Figure 5.
Confusion matrices of BAE algorithms’ outcomes based on KDDCUP99. (a) label: 0; (b) label: 1; (c) label: 2; (d) label: 3.

Figure 6.
Confusion matrices of BAE algorithms’ outcomes based on UNSW-NB15. (a) label: 0; (b) label: 1; (c) label: 2.
Figure 6.
Confusion matrices of BAE algorithms’ outcomes based on UNSW-NB15. (a) label: 0; (b) label: 1; (c) label: 2.

Figure 7.
Confusion matrices of BAE algorithms’ outcomes based on CICIDS2017. (a) label: 0; (b) label: 1; (c) label: 2.
Figure 7.
Confusion matrices of BAE algorithms’ outcomes based on CICIDS2017. (a) label: 0; (b) label: 1; (c) label: 2.


Table 1.
Comparison of evaluation metrics of data subsets with different cluster labels. The metrics of subsets are averaged as the metrics of the whole dataset, which is compared with the traditional algorithm. BAE (with label: ), = 0, 1, 2, 3 means that the BAE proposed in this paper is used to process the data subsets of different cluster labels of KDDCUP99.
| Methods | Accuracy (%) | Recall (%) | Precision (%) | F-Score (%) |
|---|---|---|---|---|
| Logistic Regression | 93.892 | 88.204 | 96.884 | 92.340 |
| SVM | 92.472 | 99.897 | 84.781 | 91.72 |
| Decision Tree | 95.302 | 99.929 | 89.933 | 94.668 |
| Autoencoder | 81.140 | 76.490 | 100.00 | 86.679 |
| BAE (with label:0) | 99.329 | 99.245 | 100.00 | 99.621 |
| BAE (with label:1) | 93.207 | 93.205 | 100.00 | 96.483 |
| BAE (with label:2) | 94.590 | 94.572 | 100.00 | 97.210 |
| BAE (with label:3) | 96.705 | 86.277 | 97.000 | 91.324 |
| BAE (average) | 95.958 | 93.325 | 99.250 | 96.160 |
Table 2.
Results of each algorithm based on the UNSW-NB15 dataset. BAE (with label: ), = 0, 1, 2 means that the BAE is used to process the subsets of different cluster labels of UNSW-NB15.
Table 2.
Results of each algorithm based on the UNSW-NB15 dataset. BAE (with label: ), = 0, 1, 2 means that the BAE is used to process the subsets of different cluster labels of UNSW-NB15.
| Methods | Accuracy (%) | Recall (%) | Precision (%) | F-Score (%) |
|---|---|---|---|---|
| Logistic Regression | 89.516 | 80.438 | 62.031 | 70.046 |
| SVM | 90.755 | 70.117 | 69.492 | 69.803 |
| Decision Tree | 89.708 | 85.419 | 61.73 | 71.668 |
| Auto-encoder | 82.204 | 100.00 | 45.665 | 62.698 |
| BAE (with label:0) | 88.603 | 100.00 | 40.636 | 57.789 |
| BAE (with label:1) | 90.002 | 100.00 | 81.985 | 90.101 |
| BAE (with label:2) | 84.252 | 91.401 | 100.00 | 95.507 |
| BAE (average) | 87.619 | 97.137 | 74.207 | 81.132 |
Table 3.
Results of each algorithm based on the CICIDS2017 dataset. BAE (with label: ), = 0, 1, 2 means that the BAE is used to process the subsets of different cluster labels of CICIDS2017.
Table 3.
Results of each algorithm based on the CICIDS2017 dataset. BAE (with label: ), = 0, 1, 2 means that the BAE is used to process the subsets of different cluster labels of CICIDS2017.
| Methods | Accuracy (%) | Recall (%) | Precision (%) | F-Score (%) |
|---|---|---|---|---|
| Logistic Regression | 89.888 | 95.499 | 88.204 | 91.707 |
| SVM | 88.312 | 89.537 | 90.406 | 89.969 |
| Decision Tree | 90.254 | 85.276 | 97.194 | 91.107 |
| Auto-encoder | 89.848 | 83.236 | 91.541 | 87.191 |
| BAE (with label:0) | 89.716 | 88.260 | 99.996 | 93.762 |
| BAE (with label:1) | 95.171 | 86.702 | 93.269 | 89.866 |
| BAE (with label:2) | 92.854 | 83.911 | 98.551 | 90.643 |
| BAE (average) | 92.580 | 86.291 | 97.272 | 91.424 |
Table 4.
Results of each algorithm based on the NSL-KDD dataset. BAE (with label: ), = 0, 1, 2 means that the BAE is used to process the subsets of different cluster labels of NSL-KDD.
Table 4.
Results of each algorithm based on the NSL-KDD dataset. BAE (with label: ), = 0, 1, 2 means that the BAE is used to process the subsets of different cluster labels of NSL-KDD.
| Methods | Accuracy (%) | Recall (%) | Precision (%) | F-Score (%) |
|---|---|---|---|---|
| Logistic Regression | 84.428 | 100.0 | 78.473 | 87.938 |
| SVM | 81.915 | 69.860 | 97.599 | 81.432 |
| Decision Tree | 92.932 | 89.494 | 97.872 | 93.496 |
| Auto-encoder | 74.421 | 83.864 | 64.486 | 72.910 |
| BAE (with label:0) | 95.160 | 96.561 | 98.457 | 97.499 |
| BAE (with label:1) | 86.838 | 82.958 | 100.0 | 90.685 |
| BAE (with label:2) | 81.644 | 84.639 | 70.977 | 77.208 |
| BAE (average) | 87.880 | 88.053 | 89.811 | 88.464 |
Disclaimer/Publisher’s Note: The statements, opinions and data contained in all publications are solely those of the individual author(s) and contributor(s) and not of MDPI and/or the editor(s). MDPI and/or the editor(s) disclaim responsibility for any injury to people or property resulting from any ideas, methods, instructions or products referred to in the content. |
© 2023 by the authors. Licensee MDPI, Basel, Switzerland. This article is an open access article distributed under the terms and conditions of the Creative Commons Attribution (CC BY) license (https://creativecommons.org/licenses/by/4.0/).
Share and Cite
MDPI and ACS Style
Wang, D.; Nie, M.; Chen, D. BAE: Anomaly Detection Algorithm Based on Clustering and Autoencoder. Mathematics 2023, 11, 3398. https://0-doi-org.brum.beds.ac.uk/10.3390/math11153398
AMA Style
Wang D, Nie M, Chen D. BAE: Anomaly Detection Algorithm Based on Clustering and Autoencoder. Mathematics. 2023; 11(15):3398. https://0-doi-org.brum.beds.ac.uk/10.3390/math11153398
Chicago/Turabian StyleWang, Dongqi, Mingshuo Nie, and Dongming Chen. 2023. "BAE: Anomaly Detection Algorithm Based on Clustering and Autoencoder" Mathematics 11, no. 15: 3398. https://0-doi-org.brum.beds.ac.uk/10.3390/math11153398
Note that from the first issue of 2016, this journal uses article numbers instead of page numbers. See further details here.