Article

Automated Classification of Agricultural Species through Parallel Artificial Multiple Intelligence System–Ensemble Deep Learning

by
Keartisak Sriprateep
1,
Surajet Khonjun
2,*,
Paulina Golinska-Dawson
3,
Rapeepan Pitakaso
2,
Peerawat Luesak
4,
Thanatkij Srichok
2,
Somphop Chiaranai
2,
Sarayut Gonwirat
5 and
Budsaba Buakum
6
1
Manufacturing and Materials Research Unit (MMR), Department of Manufacturing Engineering, Faculty of Engineering, Maha Sarakham University, Maha Sarakham 44150, Thailand
2
Artificial Intelligence Optimization SMART Laboratory, Industrial Engineering Department, Faculty of Engineering, Ubon Ratchathani University, Ubon Ratchathani 34190, Thailand
3
Institute of Logistics, Poznan University of Technology, Jacka Rychlewskiego 2 Street, 60-965 Poznan, Poland
4
Department of Industrial Engineering, Faculty of Engineering, Rajamangala University of Technology Lanna, Chiang Rai 57120, Thailand
5
Department of Computer Engineering and Automation, Kalasin University, Kalasin 46000, Thailand
6
Department of Horticulture, Faculty of Agriculture, Ubon Ratchathani University, Ubon Ratchathani 34190, Thailand
*
Author to whom correspondence should be addressed.
Submission received: 20 December 2023 / Revised: 15 January 2024 / Accepted: 20 January 2024 / Published: 22 January 2024

Abstract

:
The classification of certain agricultural species poses a formidable challenge due to their inherent resemblance and the absence of dependable visual discriminators. The accurate identification of these plants holds substantial importance in industries such as cosmetics, pharmaceuticals, and herbal medicine, where the optimization of essential compound yields and product quality is paramount. In response to this challenge, we have devised an automated classification system based on deep learning principles, designed to achieve precision and efficiency in species classification. Our approach leverages a diverse dataset encompassing various cultivars and employs the Parallel Artificial Multiple Intelligence System–Ensemble Deep Learning model (P-AMIS-E). This model integrates ensemble image segmentation techniques, including U-Net and Mask-R-CNN, alongside image augmentation and convolutional neural network (CNN) architectures such as SqueezeNet, ShuffleNetv2 1.0x, MobileNetV3, and InceptionV1. The culmination of these elements results in the P-AMIS-E model, enhanced by an Artificial Multiple Intelligence System (AMIS) for decision fusion, ultimately achieving an impressive accuracy rate of 98.41%. This accuracy notably surpasses the performance of existing methods, such as ResNet-101 and Xception, which attain 93.74% accuracy on the testing dataset. Moreover, when applied to an unseen dataset, the P-AMIS-E model demonstrates a substantial advantage, yielding accuracy rates ranging from 4.45% to 31.16% higher than those of the compared methods. It is worth highlighting that our heterogeneous ensemble approach consistently outperforms both single large models and homogeneous ensemble methods, achieving an average improvement of 13.45%. This paper provides a case study focused on the Centella Asiatica Urban (CAU) cultivar to exemplify the practical application of our approach. By integrating image segmentation, augmentation, and decision fusion, we have significantly enhanced accuracy and efficiency. This research holds theoretical implications for the advancement of deep learning techniques in image classification tasks while also offering practical benefits for industries reliant on precise species identification.

1. Introduction

The Centella Asiatica Urban (CAU) cultivar holds paramount significance within the realms of agriculture and pharmaceutics, owing to its heterogeneous characteristics and specialized cultivation prerequisites. Particularly in regions like Thailand, a myriad of CAU cultivars exhibit diverse levels of resilience to pests and diseases, coupled with variations in the concentration of vital compounds. Such variability necessitates be-spoke cultivation practices to maximize the yield of these essential compounds and to ensure the highest standard of product quality. This underscores the critical need for an accurate and precise classification of CAU cultivars, thereby providing a compelling rationale for our research [1,2].
Historically, the domain of automated plant classification has been predominantly centered around disease detection and the identification of general species, employing methodologies such as Multi-Layer Perceptron (MLP), the k-Nearest Neighbor (k-NN) algorithm, and stacked autoencoders. While these approaches have proven efficacious in certain scenarios, they are notably deficient in their capacity to accurately classify specific cultivars such as CAU. This limitation primarily stems from their inability to discern the intricate nuances and complex attributes that are unique to various CAU cultivars, resulting in inefficiencies and inaccuracies in classification processes [3,4].
In an endeavor to surmount these challenges, our research introduces the innovative Parallel-Artificial Multiple Intelligence System-Ensemble (P-AMIS-E) model, a cutting-edge, deep learning-based classification system. The P-AMIS-E model adeptly amalgamates an array of ensemble image segmentation techniques, including U-Net and Mask R-CNN, with image augmentation and diverse Convolutional Neural Network (CNN) architectures. This synergy enhances the accuracy and efficiency of classification, enabling a more detailed and nuanced analysis of the unique characteristics inherent to CAU cultivars [5,6,7].
In an endeavor to surmount these challenges, our research introduces the innovative Parallel Artificial Multiple Intelligence System–Ensemble (P-AMIS-E) model, a cutting-edge, deep-learning-based classification system. The P-AMIS-E model adeptly amalgamates an array of ensemble image segmentation techniques, including U-Net and Mask R-CNN, with image augmentation and diverse convolutional neural network (CNN) architectures. This synergy enhances the accuracy and efficiency of classification, enabling a more detailed and nuanced analysis of the unique characteristics inherent to CAU cultivars [8].
This study introduces the Parallel-Artificial Multiple Intelligence System-Ensemble Deep Learning model (P-AMIS-E), marking a significant advancement in the field of agricultural species classification, specifically targeting the complex identification of Centella Asiatica Urban (CAU) cultivars. The P-AMIS-E model’s novelty lies in its unique blend of cutting-edge deep learning techniques, which include:
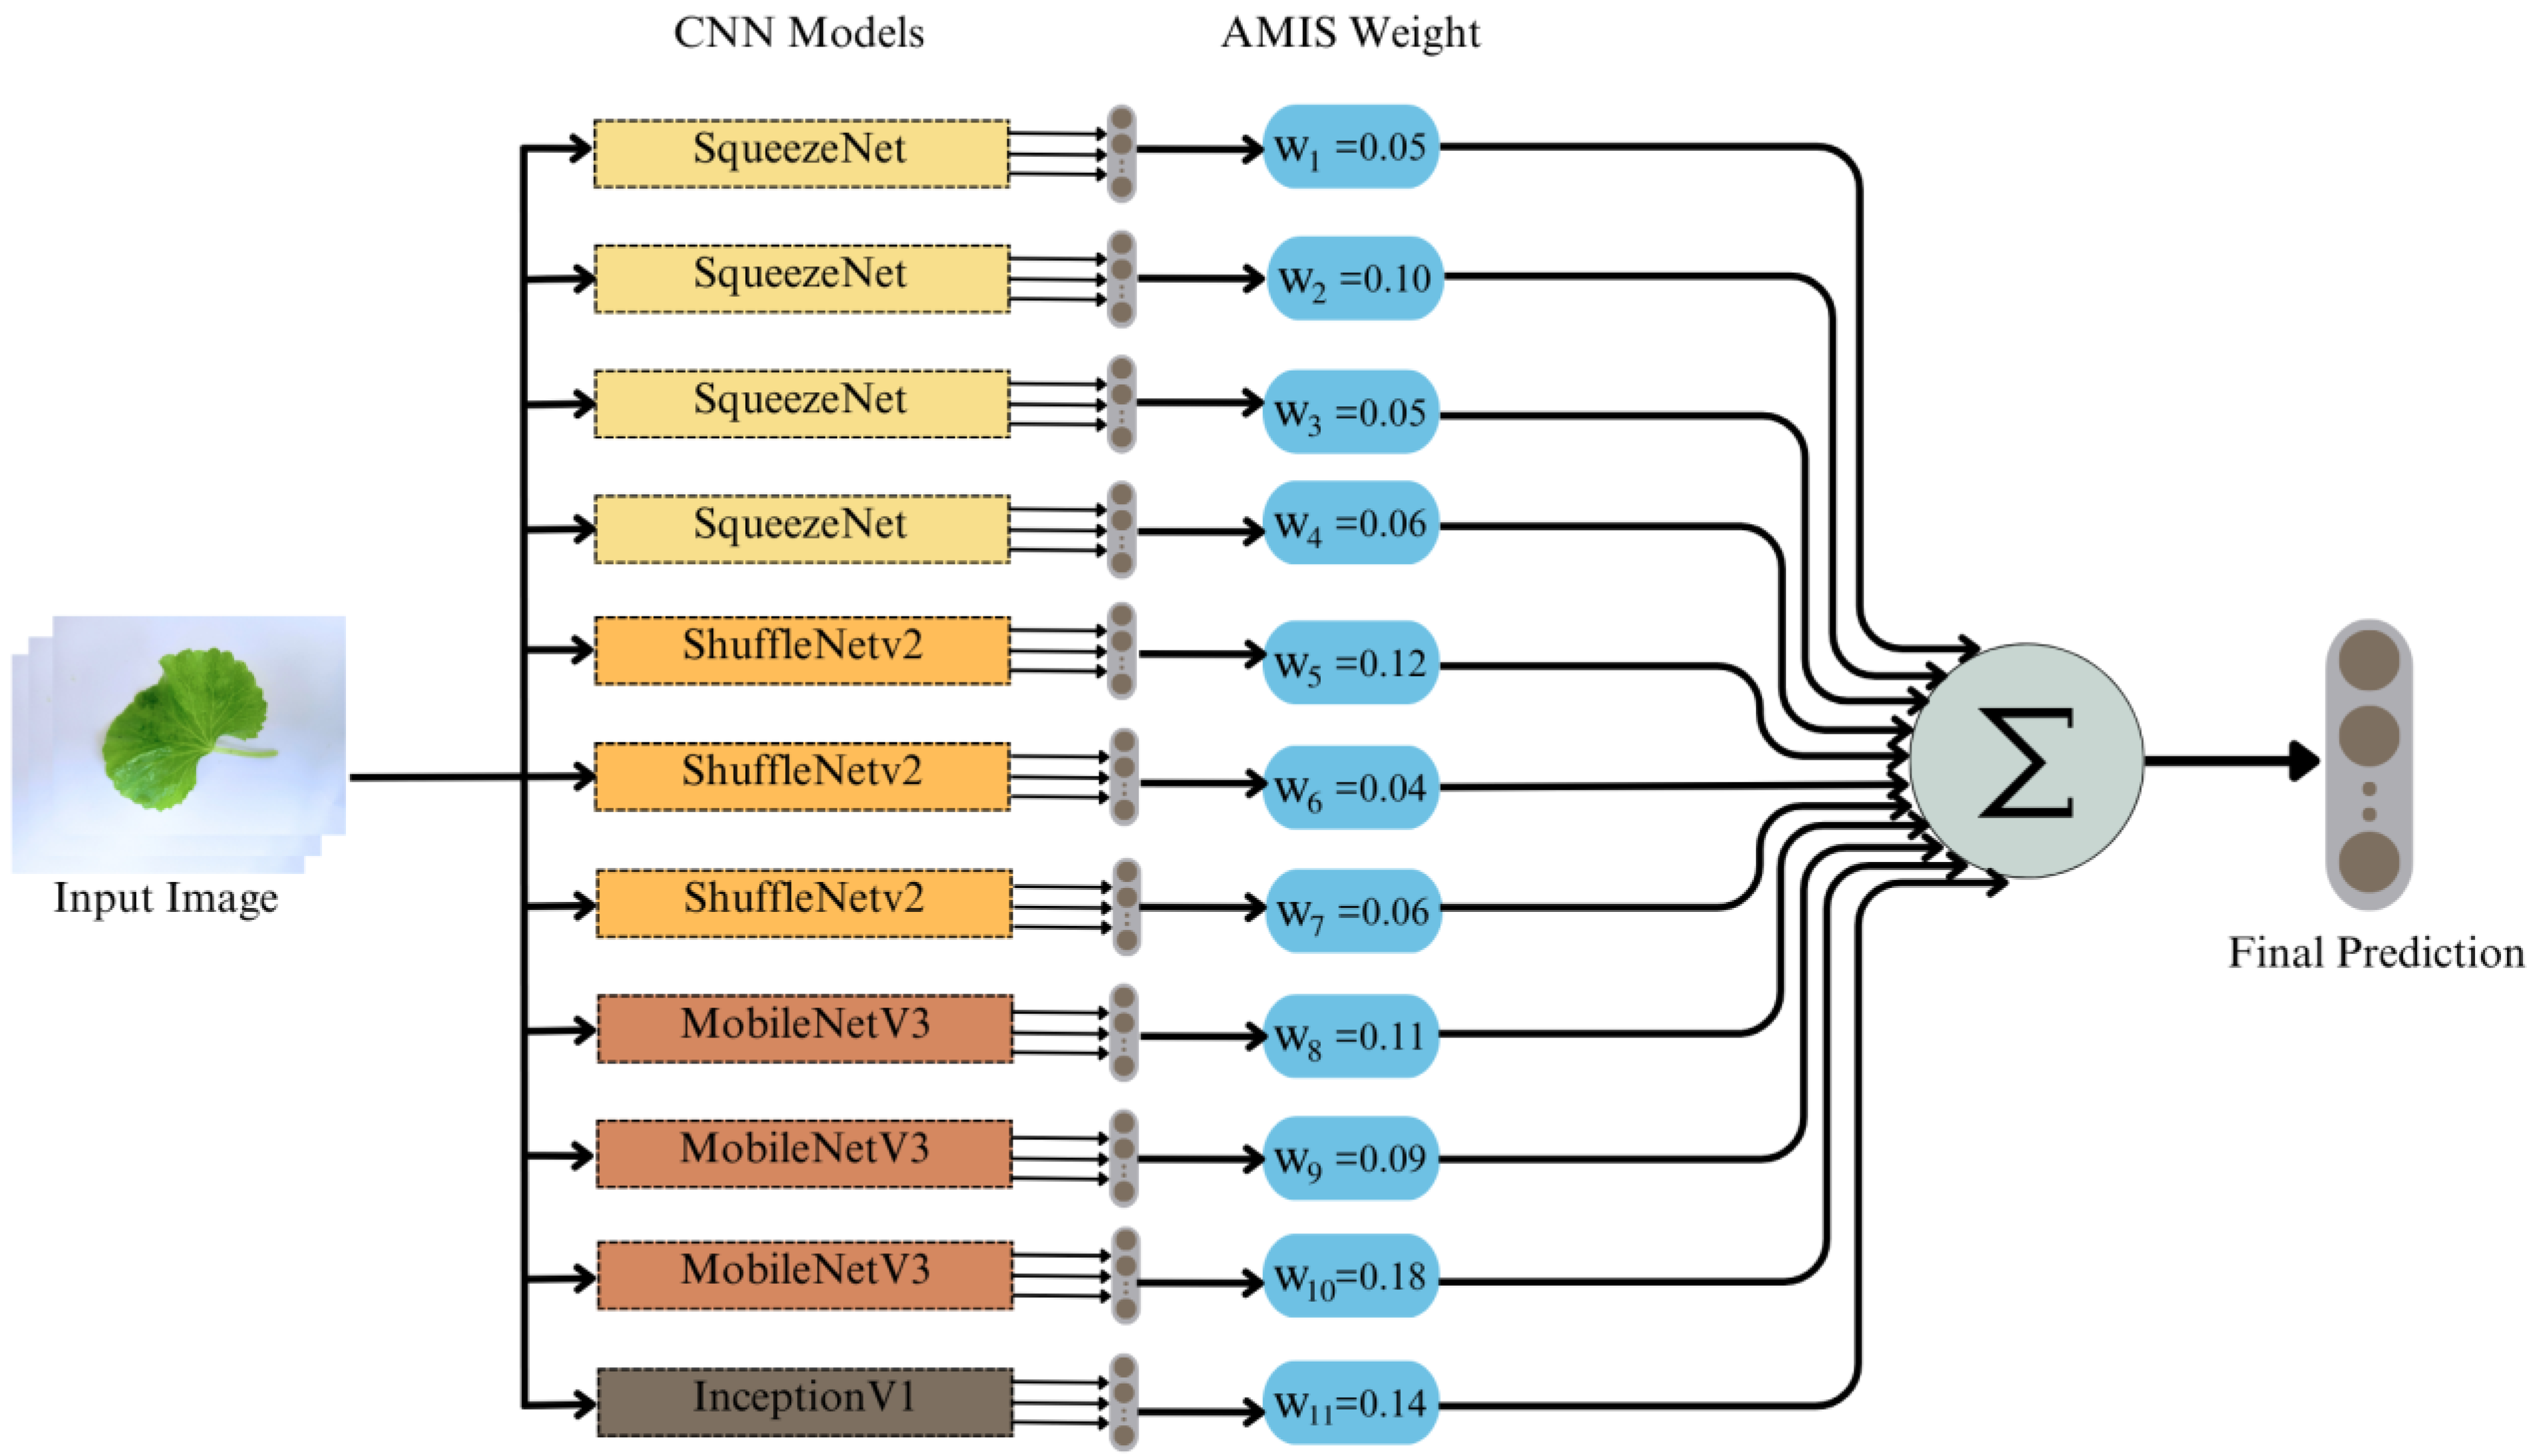
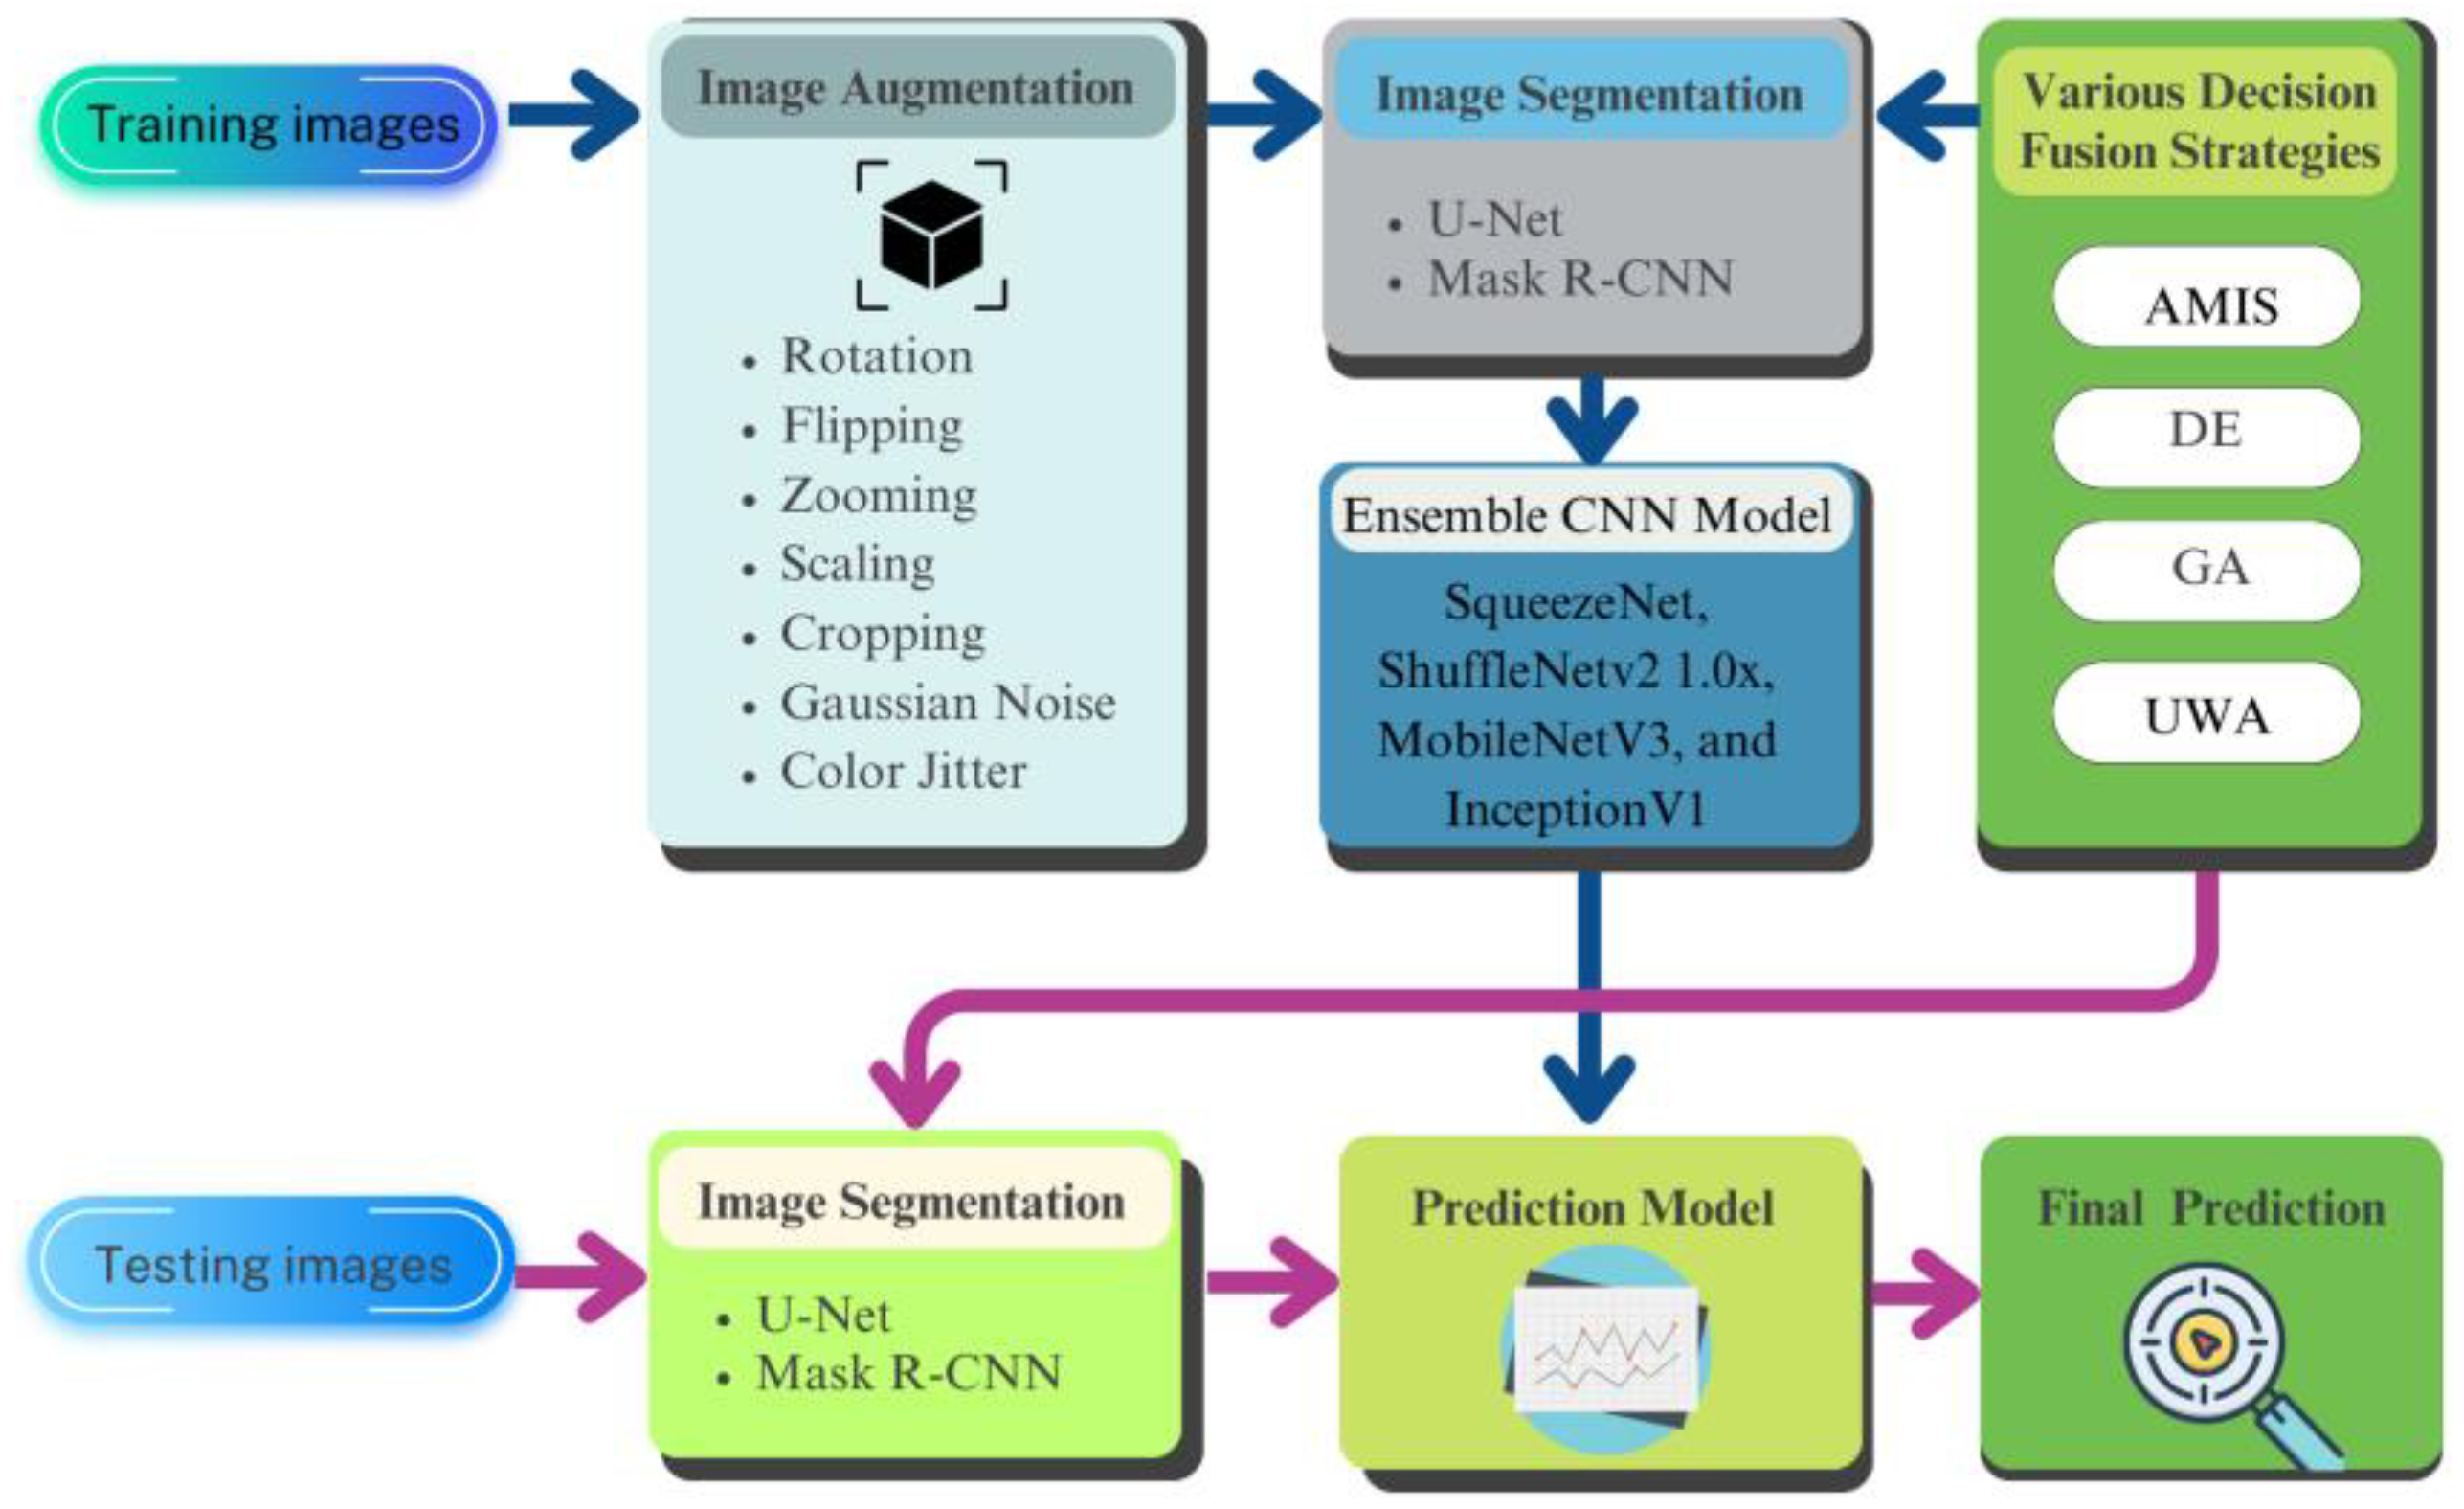
  • We present the Ensemble of Convolutional Neural Network (CNN) Architectures: Integrating various CNN architectures like SqueezeNet, ShuffleNetv2 1.0x, MobileNetV3, and InceptionV1, our model robustly tackles the intricacies in cultivar classification while minimizing overfitting.
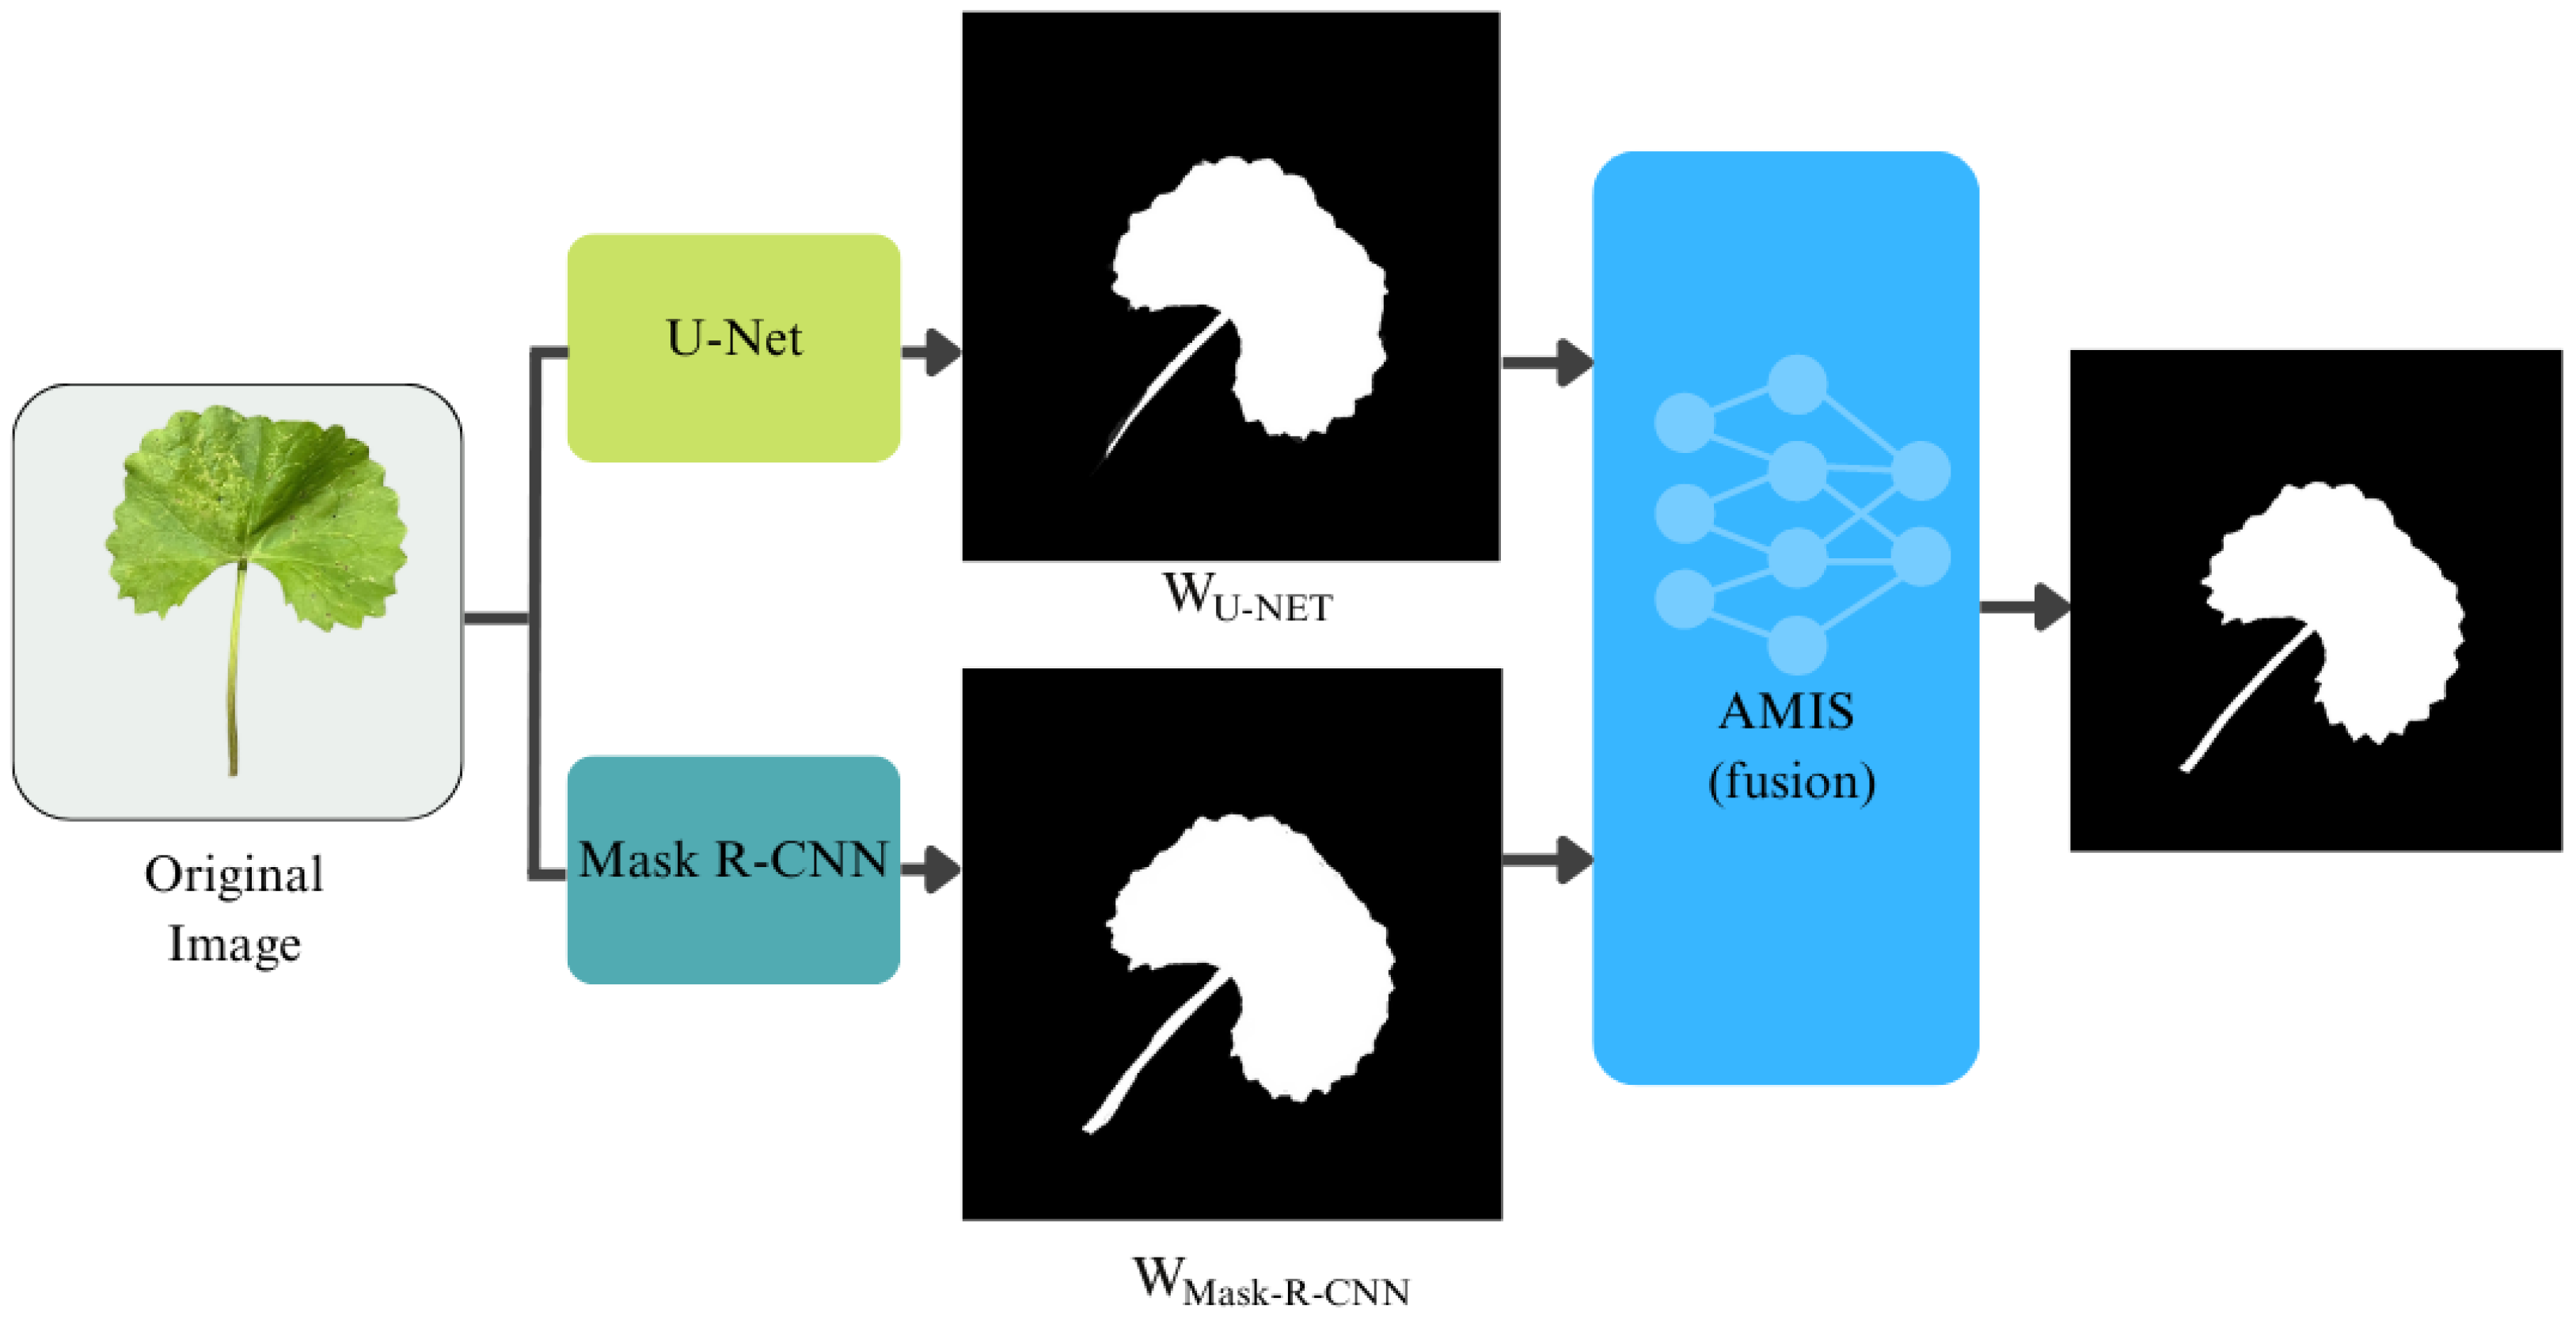
  • Advanced Image Segmentation Techniques: Employing a combination of U-net and Mask-R-CNN segmentation methods, the model achieves a precise and detailed analysis of CAU cultivars, enhancing classification accuracy.
  • Innovative Use of an Artificial Multiple Intelligence System (AMIS): The adaptation of AMIS for decision fusion in the P-AMIS-E model optimizes the classification accuracy.
  • Practical and Theoretical Implications: The model has significant implications for the agricultural and pharmaceutical industries, where precise species identification is key. Additionally, it contributes to the theoretical advancement of deep learning in image classification, setting new standards for real-world applications.
These contributions underscore the study’s importance in bridging the gap in automated plant classification, particularly for complex cultivars like CAU, and advancing deep learning methodologies in practical and theoretical domains.
The structure of the article is meticulously organized as follows: Section 2 delves into the related literature, Section 3 elucidates the research methodology employed, Section 4 delineates the computational results obtained, Section 5 engages in a comprehensive discussion of the research findings, and finally, Section 6 culminates with the conclusion and offers perspectives on future research directions.

2. Related Literature

In this section, we endeavor to compartmentalize the literature review into three distinct components: (1) an examination of the rationale behind the classification of the CAU cultivar, (2) a comprehensive assessment of the deep learning methodologies employed in the classification of plant science data, and (3) an in-depth analysis of the decision fusion strategies utilized in ensemble-based deep learning models.

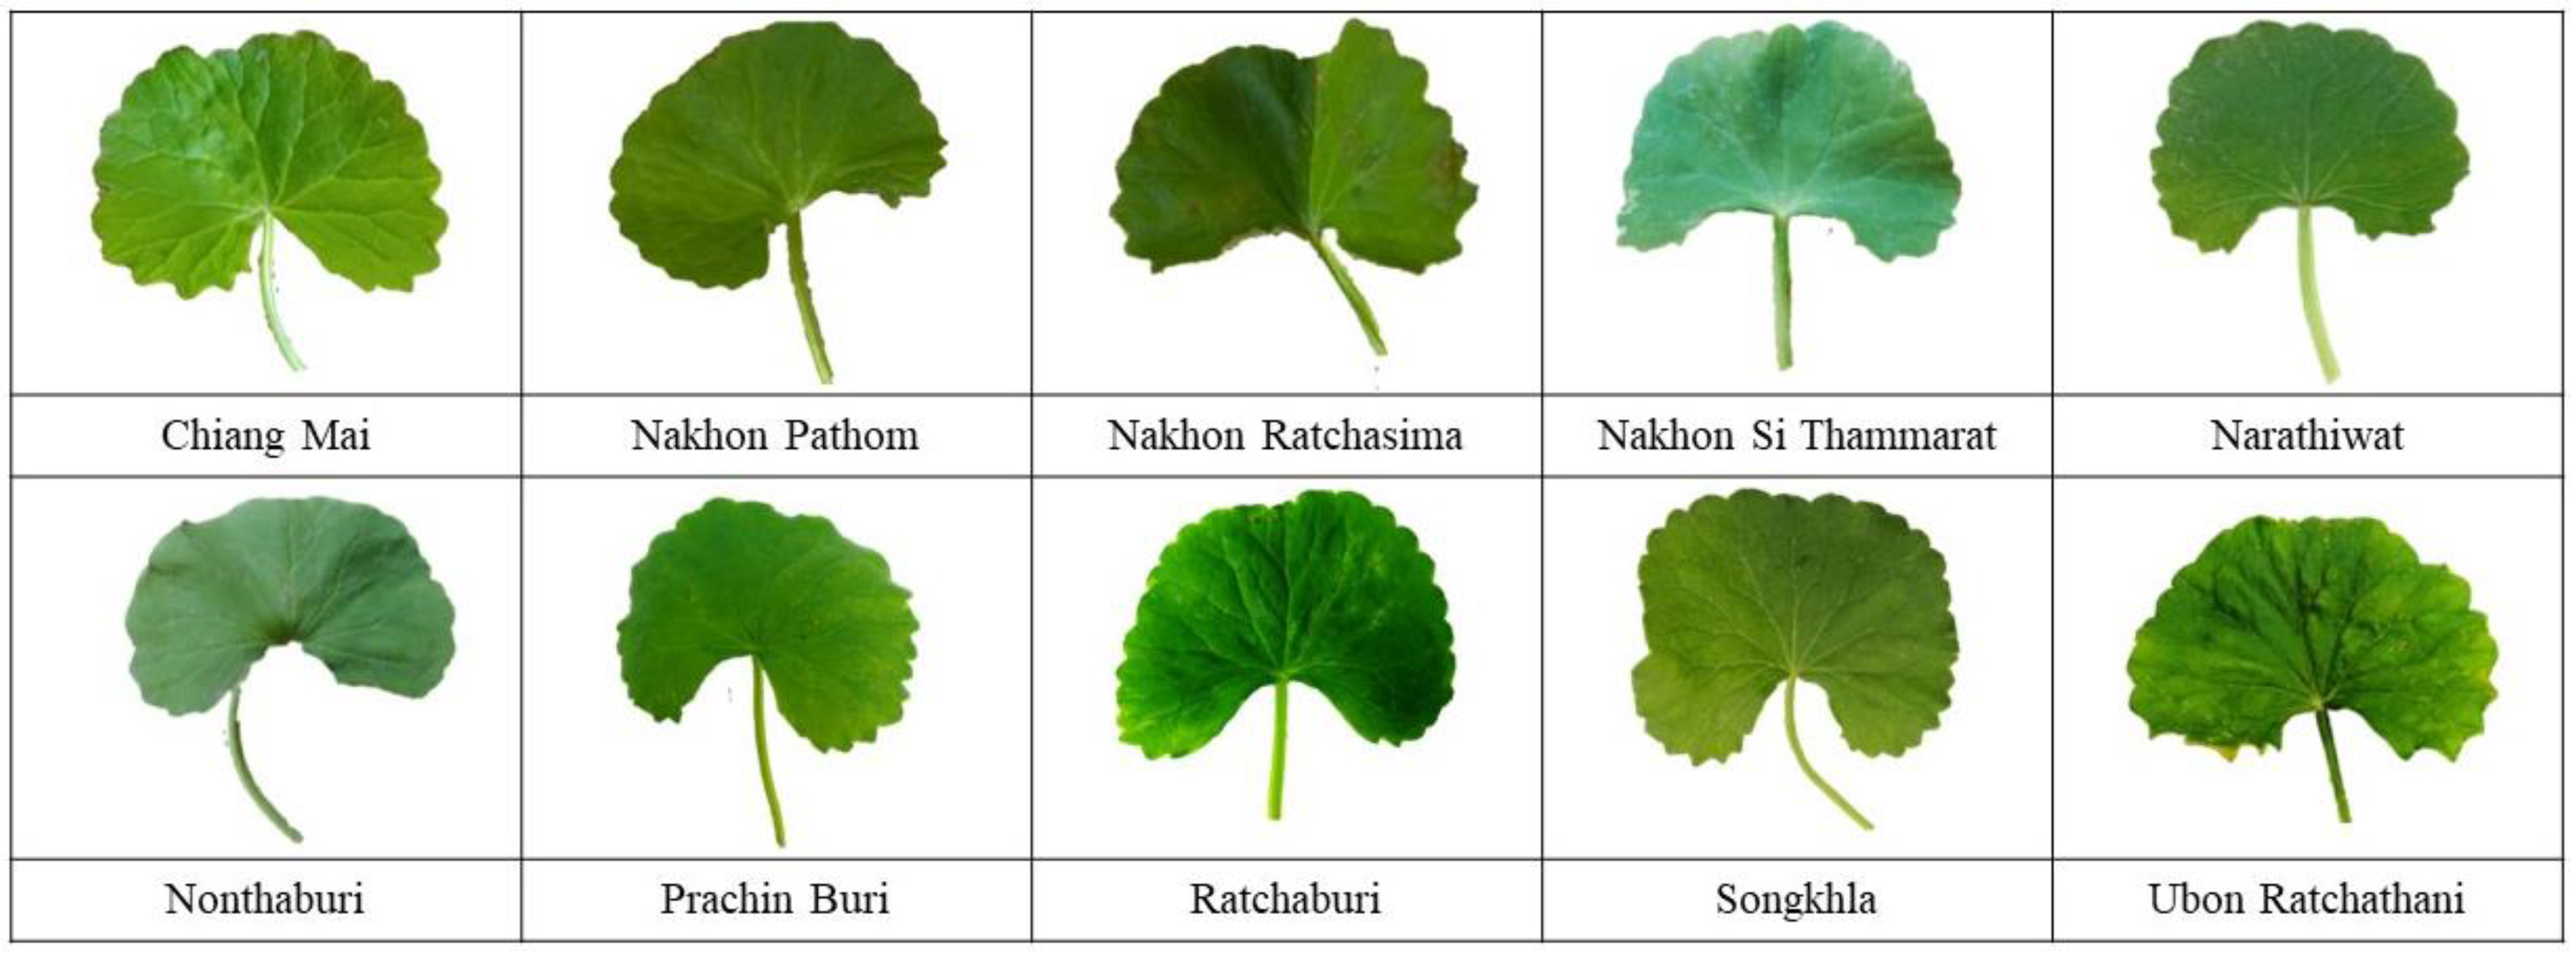
2.1. Cultivar Differentiation in CAU

Accurate cultivar differentiation in Centella Asiatica (Linn.) Urban (CAU) holds critical significance for several compelling reasons. First, it serves as the foundation for distinguishing various species within the Centella genus, such as Centella cordifolia and Centella erecta, which exhibit distinct morphological and genetic characteristics [1]. This differentiation enables a deeper exploration of the chemical composition and pharmacological properties unique to each species. Variations in the triterpene glycosides, phenolics, and antioxidant capacity among different Centella species have been documented [2]. Understanding these differences is pivotal for medicinal development and the formulation of herbal products.
Furthermore, precise cultivar differentiation plays a pivotal role in the authentic identification of CAU. In Indian systems of medicine, CAU is renowned for its memory-enhancing and nervine-disorder-treating properties [9,10]. Ensuring the authenticity of CAU cultivars is crucial for advancing scientific research, medicinal development, and quality control standards in the herbal product industry.
The impact of cultivar differentiation in CAU extends to the realm of quality control in medical product manufacturing. Distinct CAU cultivars have been found to exhibit variations in macroscopic and histomorpho-diagnostic profiles, as well as the triterpenoid content and yield. These variations have implications for the pharmacognostic characterization and regulatory aspects of quality control measures for crude drugs. Additionally, the choice of cultivar can influence the biotechnological production of centellosides, the bioactive compounds in CAU. Research has demonstrated that polyploidy induction can enhance the medicinal value of CAU, resulting in higher yields and triterpenoid contents [11]. Hence, a comprehensive understanding of cultivar differentiation in CAU is indispensable for ensuring the consistent and high-quality production of medicinal products derived from this plant [12,13].
Moreover, CAU cultivars have exhibited phenotypic plasticity, enabling them to thrive in diverse environmental conditions [14]. Extensive studies have shed light on the plant’s growth behavior, revealing that certain soil types, such as sandy and humus soil, are conducive to rapid propagation [15]. Additionally, challenges related to weed growth, with Cyperus rotundus L. being a prominent weed species in Centella plantations, have been identified [1]. The remarkable adaptability of CAU to varying environmental conditions has made it a valuable asset in ethnomedicinal healthcare systems [16]. Furthermore, the germination of CAU seeds has been linked to the color of the pericarp, indicating different stages of seed development [17]. In summary, the cultivation and growth of CAU are influenced by a multitude of factors, encompassing the soil type, weed control, and seed development stage.
Distinguishing among different CAU cultivars based solely on their appearance presents a complex and challenging endeavor [18]. Experts face difficulties owing to morphological similarities, inconsistent phenotypic expressions, natural hybridization events, regional naming variations, and the absence of standardized identification systems [19]. Addressing these challenges necessitates collaborative efforts among botanists, horticulturists, geneticists, and traditional practitioners in developing comprehensive databases and analytical tools. By doing so, experts can overcome these obstacles and contribute to the preservation and advancement of CAU cultivation and utilization. The development of a rapid and accurate CAU cultivar classification system may prove indispensable in overcoming these challenges, offering significant benefits to the agricultural community, particularly in the realm of CAU classification.

2.2. Deep Learning Models for Plant Image Classification

Deep learning methodologies have revolutionized the field of plant sciences, particularly in automated image classification. These advanced techniques have significantly enhanced plant classification systems, providing precise tools for identifying and categorizing plant diseases. This progress has had a positive impact on crop productivity and quality. Among the standout models are convolutional neural networks (CNNs), MnasNet, SqueezeNet, and ShuffleNetv2. These models have shown exceptional performance in image classification, especially in detecting plant diseases.
Building on these advancements, recent methods, like the one introduced by Chen et al., 2022 [20], have taken a leap forward. Their study unveils the Dual-Path Mixed-Domain Residual Threshold Network (DP-MRTN), a novel approach for bearing fault diagnosis in noisy environments. This model skillfully combines channel and spatial attention mechanisms, a residual structure, a soft threshold function, and dilated convolution. This synergy allows the network to effectively select crucial features without the need for separate denoising algorithms. The DP-MRTN method has been proven to significantly enhance the accuracy of fault diagnosis in noisy conditions, achieving over 99% accuracy in various noise scenarios. It surpasses traditional deep learning techniques, offering a more robust solution for monitoring mechanical equipment in challenging environments.
However, despite these successes, there is still a research gap in applying models like Augmented MnasNet, SqueezeNet, and ShuffleNetv2 to CAU cultivar classification. To bridge this gap, ensemble deep learning techniques have come to the forefront as a promising approach. These techniques improve accuracy, mitigate overfitting, and increase robustness. Moreover, the integration of metaheuristic algorithms such as differential evolution, particle swarm optimization, and genetic algorithms into decision fusion strategies is poised to further boost the effectiveness of ensemble models.
Our study focuses on developing an ensemble deep learning classification model by harmonizing efficient CNN architectures with advanced image segmentation methods and metaheuristic-based decision fusion strategies. This approach aims to significantly improve accuracy and reliability in CAU cultivar classification, thus bridging the existing research gap. The diverse characteristics and cultivation requirements of the Centella Asiatica (Linn.) Urban (CAU) cultivar make it an ideal case study. In Thailand, the varying resistance of CAU cultivars to diseases and pests, along with differences in essential compound concentrations, necessitates tailored cultivation techniques for an optimal yield and product quality [16,21,22]. Additionally, the divergence in agronomic traits among CAU cultivars based on their growth region emphasizes the need for rapid and precise classification to inform cultivation practices [17,23,24].
Deep learning models have exhibited impressive performances across various plant image classification domains, including disease identification and flower species recognition [25]. Notably, models like VGG-Net and the Inception module excel in plant disease identification, while techniques like 3-D CNN and CNN with ConvLSTM layers have enhanced plant accession classification through the integration of spatial and temporal data for improved accuracy [26]. DenseNet121 has also proved effective in accurately classifying flower species [27]. These studies collectively underscore the effectiveness of deep learning models in plant image classification, often achieving accuracy rates exceeding 94%.
Among the standout models in plant classification research are MnasNet, SqueezeNet, and ShuffleNetV2. These models have demonstrated their prowess in various applications. For instance, SqueezeNet achieved a remarkable 96% accuracy rate in citrus fruit disease classification, and ShuffleNetV2 demonstrated efficient low-power image classification for edge computing [28,29]. Furthermore, Patil utilized a support vector machine (SVM) classifier in combination with various features for plant identification, achieving an overall accuracy of 78% [30]. Additionally, Heredia explored the application of deep learning models like ResNet50 in large-scale biodiversity monitoring, noting substantial accuracy improvements over existing methods [31,32].
MnasNet, SqueezeNet, and ShuffleNetv2 each offer unique advantages in plant classification. MnasNet, being a lightweight neural network, achieves a high accuracy with a minimal computational cost [33]. SqueezeNet, another compact model, excels in rapid image processing on edge devices while maintaining a high accuracy. ShuffleNetv2, known for its multihop lightwave network, leverages optical interconnection to enhance rapid packet communication, thus reducing fiber cabling congestion and enabling modular growth [34,35]. These models exemplify the potential of efficient and effective deep learning models across various applications, including computer vision and natural language processing.
Ensemble deep learning models play a critical role in improving disease detection and pest recognition accuracy in plant classification by combining the strengths of multiple models for enhanced generalization [36,37,38,39]. Deep ensemble models, which merge deep learning with ensemble learning, exhibit remarkable generalization performance, holding great potential for transforming plant recognition systems. Deep ensemble neural networks (DENNs) have even surpassed state-of-the-art pre-trained models in plant disease detection [39]. Additionally, model compression techniques, such as pruning and quantization, have successfully reduced the computational demands of deep learning models in plant seedling classification without significant accuracy loss [40]. Despite the advantages and high accuracy of models like MnasNet, SqueezeNet, and ShuffleNetv2, the application of ensemble deep learning in these contexts remains an underexplored area of research. Our study aims to develop a CAU cultivar classification system by harnessing ensemble deep learning with these models, ultimately advancing plant classification and contributing to the development of robust plant recognition systems.
In addition to deep learning models, preprocessing techniques such as image segmentation and augmentation play a crucial role in plant classification systems. Methods like U-Net and R-Net segmentation have found successful application in various plant science contexts [41]. For example, 3D U-Net has been used to segment root and soil volumes in MRI scans, enhancing the signal-to-noise ratio and resolution. Another study leveraged a U-Net-based CNN for segmenting root images from rhizotrons, yielding strong correlations with manual annotations. Additionally, an EncU-Net model, based on U-Net architecture, achieved over 90% success in lesion segmentation in dermoscopic images, demonstrating the efficacy of these segmentation methods in plant science [16].

2.3. Decision Fusion Strategy in Ensemble Deep Learning

In ensemble deep learning, decision fusion strategies play a pivotal role in enhancing the generalization performance by combining the decisions of multiple models. These strategies encompass static fusion and dynamic fusion methods. Static fusion assumes uniform capabilities among agents or disregards agents with subpar performance, whereas dynamic fusion adapts to the competence of each base agent on test states. A dynamic fusion method for deep reinforcement learning, for instance, measures base agent performance on validation states and adjusts agent weights based on their performance and similarity to new states [42]. Decision-level fusion methods have found applications in diverse domains, including COVID-19 patient health prediction through calibrated ensemble classifiers employing a soft voting technique [43]. In target recognition tasks, an ensemble-learning-based information fusion model has improved the recognition abilities of distributed sensors [44]. Ensemble learning frameworks have also enhanced cooperative spectrum sensing in cognitive radio systems, utilizing convolutional neural networks and fusion strategies for global decision making [45].
Metaheuristic techniques like swarm intelligence (SI) and evolutionary computing (EC) have effectively optimized deep neural networks (DNNs) in various tasks [46]. They excel in generating optimal hyperparameters and structures for DNNs when dealing with extensive datasets [47]. Ensemble learning has further been applied to enhance sentiment analysis [48], text classification [49], and epileptic seizure prediction [50]. For instance, a stacking ensemble approach boosted accuracy in sentiment analysis by leveraging the strengths of different deep models.
Artificial multiple intelligences systems (AMISs) were initially proposed by Pitakaso et al. [8] to streamline the agricultural product flow from Thailand to neighboring countries. Subsequently, an AMIS was employed to determine optimal weights for ensemble deep learning models in classifying various medical images [51,52]. Recently, an AMIS was utilized to optimize ensemble classification models in two stages, combining different image segmentation methods and CNN architectures. This double ensemble model outperformed traditional fusion methods like unweighted averages and majority voting, yielding outstanding accuracy.
In this research, AMIS will combine two segmentation methods and three CNN architectures for CAU cultivar classification. However, modifications are required, as the original AMIS used in [53] cannot be directly applied. New improvement methods are introduced, and adjustments to the probability function for selecting improvement methods will be made.

3. Research Methods

The proposed research entails the creation and deployment of an automated classification system for CAU species utilizing the parallel AMIS ensemble model (P-AMIS-E). Initially, diverse CAU species will be collected and photographed to constitute the training and testing datasets. Subsequently, the P-AMIS-E model will be developed, trained, and tested on this dataset, aiming to enhance species classification accuracy and efficiency while minimizing manual intervention. The model’s performance will be assessed and analyzed in subsequent sections of this paper.

3.1. Dataset Preparation

The Centella Asiatica Urban (CAU) specimens were gathered from diverse production sources. The study encompassed five distinct CAU cultivars, specifically Rayong, Chachoengsao, Nakhon Pathom, Ubon Ratchathani, and Prachin Buri. Each of these cultivars underwent uniform cultivation conditions and care procedures for a duration of 12 weeks. Fresh leaf samples from all cultivars were meticulously collected and photographed against a white background to ensure consistency.
The dataset was subsequently partitioned into two subsets: CALU-1 and CALU-2. The CALU-1 dataset served as the training and testing set for the model, while the CALU-2 dataset remained unseen and was reserved for validation purposes. The total number of images present in both datasets is detailed in Table 1.
Based on the data presented in Table 1, CALU-1 was split into two subsets, namely, the train dataset (80%) and the test dataset (20%). The CALU-1 dataset contained a total of 3240 images, whereas CALU-2 consisted of 3591 images and was only utilized to evaluate the effectiveness of the proposed method. Examples of all five types of Centella asiatica (L.) Urban from both datasets are shown in Figure 1.

3.2. Develop the P-AMIS-E

The development of the P-AMIS-E comprised four steps: (1) image augmentation, (2) the ensemble of two types of image segmentation, (3) the ensemble of various types of CNN architectures, and (4) the application of AMIS as the decision fusion strategy. The workflow diagram of the P-AMIS-E is shown in Figure 2.
In accordance with Figure 2, the proposed methodology was initiated by inputting the training images into the image segmentation methods. Subsequently, the training images underwent processing within the ‘ensemble image segmentation procedure’. During this stage, the Adaptive Metaheuristic-based Image Segmentation (AMIS) served as the decision fusion strategy for the proposed model. Following this step in the diagram, the images were input into the ensemble convolutional neural network (CNN) model, culminating in the final prediction. For the testing dataset, the images were directed straight to the image segmentation procedure, utilizing the model previously trained on the training dataset to predict the ultimate class of each image. To elucidate the proposed algorithm, we provide a stepwise explanation in the following subsections.

3.2.1. Image Augmentation

To enhance the performance of an automated classification model for CAU species, a variety of image augmentation techniques were employed, including rotation (at angles of 90, 180, and 270 degrees), flipping (both horizontally and vertically), zooming at different scales, cropping to focus on specific plant parts, adding Gaussian noise for varying pixel intensity and lighting condition simulation, color jitter for random adjustments in brightness, contrast, saturation, and hue, and shearing to skew the original images and improve perspective recognition.
Through the application of these augmentation techniques, the diversity of the training dataset was increased, leading to the improved performance of the classification model. The augmented dataset was then utilized to train the model, resulting in high accuracy and robustness in recognizing CAU species [54,55,56].

3.2.2. Image Segmentation

This study employed two image segmentation methods, U-Net and Mask R-CNN, to segment the important features of the CAU’s leaf. U-Net was chosen for leaf segmentation due to its suitability for images with limited training data, particularly in medical image analysis [57,58]. The U-Net architecture consists of an encoder network and a decoder network connected by a bottleneck layer. The encoder network captures contextual information, while the decoder network generates the segmentation mask. U-Net has been successful in various image segmentation tasks, including the segmentation of organs, tumors, and blood vessels in medical imaging, and other segmentation tasks such as satellite and microscopy image segmentation. The success of U-Net is attributed to several factors, including the use of skip connections that recover spatial information, its relative light weight and efficiency, and its adaptability to different segmentation tasks and datasets.
Mask R-CNN is a state-of-the-art deep learning algorithm that performs object detection and instance segmentation simultaneously. It extends Faster R-CNN by adding a parallel branch for predicting segmentation masks. Mask R-CNN outputs a set of bounding boxes, class labels, and segmentation masks to precisely segment objects at the pixel level. A small convolutional neural network produces the mask for each region proposal generated by the object detection branch [59,60]. Mask R-CNN’s versatility and effectiveness make it useful in various computer vision applications, such as autonomous vehicles, medical image analysis, and robotics, as it performs both object detection and instance segmentation simultaneously.
The segmentation of images of the CAU’s leaf will be conducted through the utilization of two distinct methodologies: U-Net and Mask-R-CNN. Subsequently, the outcomes derived from these two approaches will be amalgamated to yield a unified solution, employing an Artificial Multiple Intelligence System (AMIS). The framework depicting the ensemble segmentation is visually depicted in Figure 3.
The proposed approach involves the integration of two diverse image segmentation methods, namely, U-Net and Mask-R-CNN, to form a unified solution. This fusion will be achieved through the optimization of weights assigned to the outcomes obtained from U-Net and Mask-R-CNN networks.
Z = i = 1 I W i Y i
The segmentation solution is formulated through the utilization of Equation (1), where Y i represents the outcome derived from segmentation method I, W i denotes the weight assigned to each method obtained from the AMIS, and Z represents the ultimate predictive value of the AMIS-ensemble segmentation. The AMIS algorithm will be explained in Section 3.2.4.

3.2.3. Ensemble the CNN Models

To establish an Automated Classification model for CAU species based on a convolutional neural network (CNN) architecture, it is imperative to choose a suitable model that encompasses precision and efficiency. In this investigation, we explore a series of compact yet impactful CNN architectures as candidates for this purpose.
We elaborate on our innovative ensemble Convolutional Neural Network (CNN) model, specifically engineered for the classification of the Centella Asiatica Urban (CAU) cultivar. A key aspect of this model is its adherence to a strict size constraint, remaining under 80 MB to facilitate deployment in fast-response environments. This is achieved through the integration of a series of lightweight yet proficient CNN architectures within an ensemble framework.
The ensemble configuration encompasses an ensemble of nine distinct neural network architectures, comprising four instances of SqueezeNet models, each approximately 5 MB in size, three ShuffleNetv2 1.0x models, with an individual model size of approximately 6 MB, one Inception v1 model, occupying an approximate space of 20 MB, and three MobileNetV3 models, each weighing approximately 6 MB. In aggregate, the ensemble model consumes a total storage space of 77 MB. The selection of these models was grounded in their efficiency and capacity to conduct a nuanced analysis of the input data, which, in the context of our research, encompasses diverse imagery of CAU cultivars. For more comprehensive details regarding these architectural choices, refer to references [61,62,63,64].
Central to our ensemble model is the application of an Artificial Multiple Intelligence System (AMIS) in the decision fusion layer. This innovative strategy leverages the strengths of each model in the ensemble, utilizing AMIS to intelligently integrate their individual predictions. The AMIS approach in the decision fusion layer assesses the outputs from the SqueezeNet, ShuffleNetv2, Inception v1, and MobileNetV3 models, considering each model’s confidence and accuracy to formulate a final classification decision.
The diagram (Figure 4) depicts this ensemble architecture, illustrating the individual data processing paths of the CNN models and their convergence at the AMIS-based decision fusion layer. This layer is the linchpin of our ensemble model, where the combined intelligence and analytical power of the individual models are synthesized to achieve an optimal balance between accuracy and computational efficiency.
Through the AMIS in the decision fusion layer, our ensemble model not only ensures a comprehensive and nuanced analysis of CAU cultivars but also maintains the agility and responsiveness essential for real-time classification applications. This unique integration of multiple CNN architectures with the AMIS-driven decision fusion represents a significant advancement in agricultural species classification, particularly in environments where the speed and model size are critical constraints.
This refined approach to decision fusion within our ensemble model exemplifies the practical application of advanced AI techniques in agricultural settings. It marks a significant step forward in addressing the challenges of accurate CAU cultivar classification while adhering to the constraints of fast-response applications and model efficiency.
To test the effectiveness of the proposed model, we will compare the method with the homogenous SqueezeNet, the ShuffleNetv2 1.0x model, and MobileNetV3 and the state-of-the-art single model which has a size of 80–120 MB, ResNet-101 (102 MB) [65], Xception (88 MB) [66], NASNet-A Mobile (84 MB) [67], and MobileNetV3-Large (113 MB) [64] to be fairly compared to the proposed model. Details of the proposed and compared methods are shown in Table 2.
According to the data presented in Table 2, our proposed model will undergo a comparative analysis with diverse methodologies, encompassing both individual large models and homogeneous ensemble models, with model sizes ranging from 80 to 113 MB. To facilitate a fair comparison, all methods will be re-implemented based on the conceptual frameworks provided in the references. Subsequently, comprehensive testing of these methods will be conducted on the established dataset.

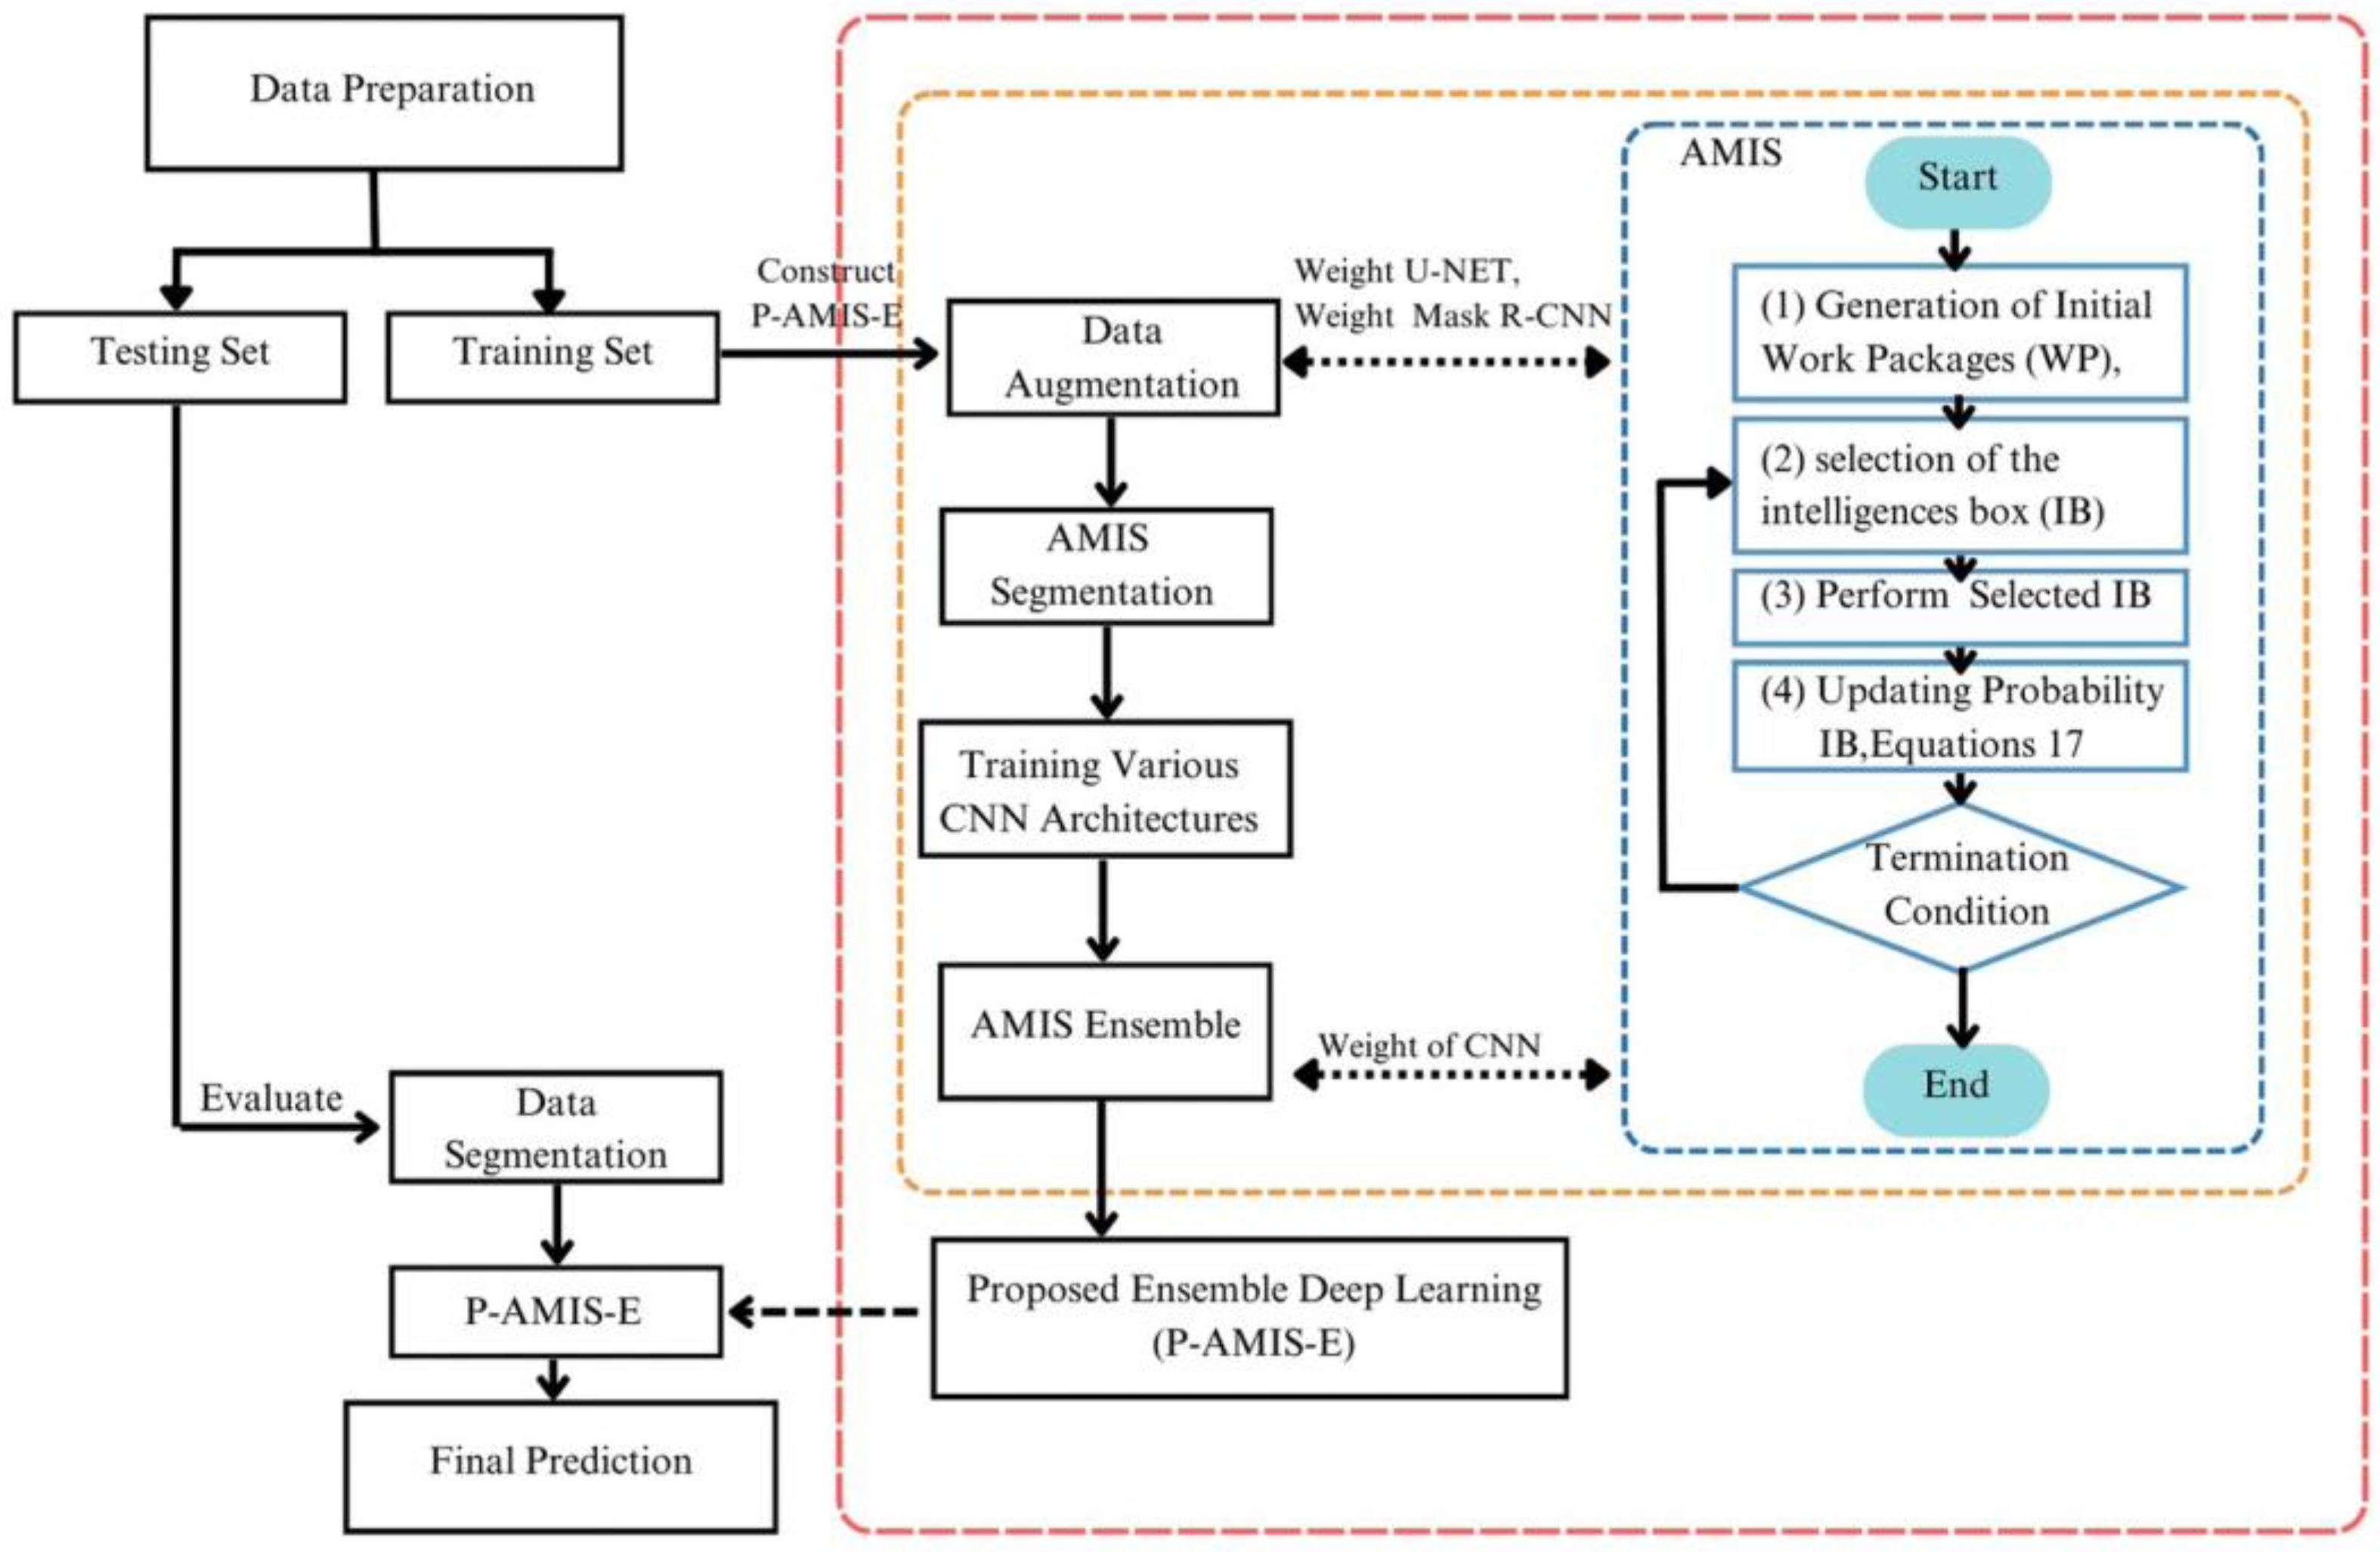
3.2.4. Parallel-AMIS-Ensemble Model (P-AMIS-E)

AMIS decision fusion strategies will be used in two parts of the proposed model parallelly. Figure 5 demonstrates the parallel-AMIS-ensemble model used in this study.
Figure 5 demonstrates the synergistic application of U-Net and Mask R-CNN for the segmentation of Centella Asiatica Urban (CAU) leaf imagery. U-Net’s encoder–decoder architecture is particularly adept at processing images with sparse data, a scenario prevalent in medical image analysis. Characterized by skip connections, U-Net’s design adeptly recovers spatial information, thereby augmenting its efficiency and versatility across a spectrum of segmentation tasks. Complementing U-Net, Mask R-CNN, an advanced iteration of Faster R-CNN, incorporates a parallel branch dedicated to predicting segmentation masks alongside object detection. This results in meticulously detailed pixel-level segmentation, encompassing bounding boxes, class labels, and masks, all produced by a succinct convolutional network. Mask R-CNN’s bifunctional capability renders it a highly adaptable tool in a variety of contexts, including autonomous vehicles, medical imaging, and robotics.
The fusion of U-Net and Mask R-CNN, as depicted in Figure 5, capitalizes on the distinct strengths of each method, culminating in a comprehensive solution adept at navigating the intricacies of CAU leaf segmentation. The integration process utilizes an Artificial Multiple Intelligence System (AMIS) to merge the results from both segmentation techniques, thereby significantly enhancing the precision of cultivar classification.
In the P-AMIS-E model, the journey begins with the initial image, intended to discern various CAU cultivars. This image is subjected to dual segmentation techniques—U-Net and Mask-R-CNN—whose outputs are subsequently unified within the AMIS ensemble framework. Following segmentation, geometric image augmentation is applied, preparing the segmented images for analysis by four distinct CNN architectures: SqueezeNet, ShuffleNetv2 1.0x, MobileNetV3, and InceptionV1.
Each CNN architecture contributes a unique perspective, yielding four separate predictions in every iteration. The P-AMIS-E model synthesizes these individual insights into a singular, cohesive prediction using the AMIS framework. Thus, the Parallel-Artificial Multiple-Intelligence System-Ensemble (P-AMIS-E) model emerges as the culmination of this intricate and multifaceted approach, standing as a testament to the power of integrated artificial intelligence in the realm of plant cultivar classification.
The AMIS framework consists of four key stages, namely, (1) the generation of initial work packages (WP), (2) the selection of the intelligences box (IB) by the WP, (3) the performance of the improvement procedure utilizing the selected IB, (4) updating heuristics information, and (5) the iterative repetition of steps (2) to (4) until the termination conditions are satisfied.
In our investigation, we have adopted a customized adaptation of the Artificial Multiple Intelligence Systems (AMIS) as the favored technique for decision fusion, effectively employed in both image segmentation and the integration of Convolutional Neural Network (CNN) architectures. The conceptual foundation of AMIS was originally put forth by Pitakaso et al. [8]. This study builds upon the AMIS model proposed by the aforementioned author, which was designed to optimize the transborder agricultural production logistic network in the north-eastern region of Thailand.
The AMIS framework consists of a coherent sequence of five steps, encompassing (1) the generation of the initial set of work packages (WPs), (2) the selection of the preferred intelligent box (IB) by the WPs, (3) the implementation of the improvement method by the WPs using the selected IB, (4) the updating of heuristics information, and (5) the iterative execution of steps (2) through (4) until the predefined termination conditions are met.
The utilization of AMIS shall be applied to ascertain the most favorable weighting scheme for amalgamating dissimilar solution types acquired from a variety of segmentation methods and architectures. This specific approach will be juxtaposed with alternative decision fusion strategies—notably, the unweighted average model (UWM), along with the adapted differential evolution algorithm (DE) proposed by Kabanikhin [68], and the modified Genetic algorithm (GA) proposed by S. Yang & Collings [69]. By employing this comparative analysis, we aim to discern the efficacy and superiority of AMIS in enhancing the fusion of diverse solutions, thereby contributing to advancements in the field of segmentation methodologies and architectural integration.
The unweighted average model (UWA) is characterized by its equitable distribution of weight across each prediction value ( Y i j ) , where ‘i’ denotes the CNN label and ‘j’ indicates the prediction class, a representation applicable to segmented image classes, denoted by 0 or 1. The fusion process of the UWA is governed by Equation (2), while AMIS, DE, and GA employ Equation (3) to compute the final weight. Here, Y i j signifies the predicted value of CNN ‘i’ for class ‘j’ prior to the application of both equations.
Subsequently, upon merging multiple CNN results, V j is utilized to categorize class ‘j’, with each CNN ‘i’ assigned a weight ( W i ) based on the total number of CNNs or segmentation methods (I) and the number of classes (J). This methodology ensures a comprehensive and systematic approach to determining the final weights and achieving an effective fusion of diverse CNN outputs, thereby contributing to the enhanced classification performance and segmentation results in our study.
V j = i = 1 I Y i j I
V j = i = 1 I W i Y i j
In this investigation, AMIS, DE, and GA were employed to ascertain the optimal value of W i in the given scenario. The unweighted average decision fusion strategy (UWA) presents a straightforward and computationally efficient approach for integrating ensemble deep learning models. UWA distributes equal weights to each CNN, which facilitates the ease of implementation and interpretation. However, UWA’s limitation lies in its lack of optimization capabilities, impeding its ability to finely tune the ensemble performance.
On the other hand, Differential Evolution (DE) exhibits robust global search capabilities, rendering it suitable for addressing intricate optimization problems, particularly those characterized by noisy landscapes. DE adapts adeptly to multimodal search spaces; nevertheless, it may converge at a slower pace and necessitate greater memory resources due to its population-based approach.
In contrast, the Genetic Algorithm (GA) strikes a harmonious balance between exploration and exploitation, enabling faster convergence. Nonetheless, GA’s performance may be sensitive to parameter settings, and it may encounter challenges in highly complex landscapes. Each of these methods, with their unique strengths and limitations, contributes to the diversification of decision fusion approaches, offering valuable insights into optimizing ensemble performance for deep learning models. AMIS can be explained stepwise as follows.
  • Generate the Initial Work Package
In this section, we undertake the generation of WPs at random, where each WP is characterized by dimensions of 1 × D, with ‘D’ representing the number of image segmentation methods or the CNN architectures under consideration. To initiate this process, we employ a real number for the first track, uniformly and randomly generated within the interval of 0 and 1, as governed by Equation (4).
X k i 1   = U 0,1
Within this context, the notation X k i 1 pertains to the specific value within WP ‘k’ at element ‘i’ during the first iteration. Here, ‘i’ denotes the count of available CNN/segmented methods, while ‘k’ signifies the predetermined number of WPs. Moreover, alongside the primary set of WPs, two supplementary sets, denoted as the best work package (BWP) and random work package (RWP), were also stochastically generated during the initial iteration.
B W P k i 1 = U 0,1
R W P k i 1 = U 0,1
Within the provided context, B W P k i t denotes the set comprising the best solutions acquired from the initial iteration up to iteration ‘t’, whereas R W P k i t is a randomly selected set determined by a specific formula. During the inaugural iteration, both B W P k i t   and R W P k i t were generated randomly utilizing Equations (5) and (6), respectively. Subsequently, Equation (7) was employed to update X k i t , whereby the value of X k i t in iteration ‘t + 1’ is derived from the value of X k i t in iteration ‘t’, employing a selected Improvement Box (IB) operator. For instance, an illustrative track with D = 5 is as follows: {0.11, 0.28, 0.19, 0.94, 0.75}. This WP’s value will undergo recalculation to obtain the value of W i , entailing further steps in the iterative process.
P k i = X k i i = 1 i X k i
Equation (8) has been adapted to address the variability arising from the presence of ‘k’ number of WPs. To this end, C k j is employed for classifying class ‘j’ based on WP ‘k’, while P k i represents the weight associated with the CNN/segmentation method ‘i’ utilizing values from WP ‘k’.
C k j = i = 1 I P k i Y i j
  • Perform WP Improvement Procedures
The work packages (WPs) undergo iterative execution, wherein the enhancement of solutions is achieved through the application of intelligence boxes (IBs). In this study, we adopt a selection of IBs, specifically differential evolution (DE)-inspired variants, namely, DEI-I, DEI-II, and DEI-III, along with additional methods, such as random crossover (RC), single-bit mutation inspired (SMI), SWAP, restart (RT), and scaling factors (SF). Each of these methods is incorporated using formulaic expressions, as provided in Equations (9) through (16), respectively. These IBs collectively contribute to the systematic improvement of solutions, thereby enhancing the efficacy of our approach in the research domain.
X k i t = X r 1 i t 1 + F 1 ( X r 2 i t 1 X r 3 i t 1 )
X k i t = X r 1 i t 1 + F 1 X r 2 i t 1 X r 3 i t 1 + F 2 X r 4 i t 1 X r 5 i t 1
X k i t = X r 1 i t 1 + F 1 B i g b e s t X r i t 1 + F 2 ( X r 2 i t 1 X r 3 i t 1 )
X k i t = X k i t 1 i f   R k i C R R k i t 1   o t h e r w i s e
X k i t = X k i t 1 i f   R k i C R X r 1 i t 1   o t h e r w i s e
X k i t = B i g b e s t + F 1 X r 1 i t 1 X r i t 1 + F 2 ( X r 2 i t 1 X r 3 i t 1 )
X k i t = R k i
X k i t = X k i t 1 i f   R k i C R R k i X k i t 1 o t h e r w i s e
The set of randomly selected work packages, denoted as r1, r2, r3, r4, and r5, excludes work package ‘k’. Furthermore, R k i t   represents a randomly generated number corresponding to work package ‘k’ at position ‘i’ during iteration ‘k’, and R k i denotes a random number corresponding to work package ‘k’ at position ‘i’. The crossover rate (CR) is set to 0.7, determining the frequency of crossover operations during the simulation.
The notation B i g b e s t designates the best work package found thus far in the simulation. These defined parameters and notations play pivotal roles in facilitating the comprehensive exploration and optimization of work packages during the simulation process.
In the process of IB selection, each WP has the liberty to choose an IB in the current iteration, without being bound by the IB chosen in the last or prior iterations. However, the likelihood of selecting each IB may vary, being either reduced or increased based on the quality of solutions generated using that particular IB. The probability function governing the selection of IB ‘b’ in iteration ‘t’ is described by Equation (17). Within this equation, when the parameter ‘F’ is assigned a value of 0.4, ‘ A b t ’ denotes the average solution quality derived from all tracks that have hitherto chosen IB ‘b’, iteration ‘t’. A t 1 b e s t signifies the average solution quality of tracks that have previously selected the ‘best’ information bit, which is determined by its highest average accuracy. ρ denotes the constant number which is set to “20”. Additionally, ‘ N b t 1 ’ represents the count of tracks that have selected IB ‘p’ up to the current iteration. The parameter I b t 1 ’ increases by 1 if IB ‘b’ contains the best work package, ‘ B i g b e s t ’, otherwise it remains unchanged. The constant parameter ‘K’ has been set to 30, and Q is defined as the constant number which is set to 100. It is noteworthy that all predefined parameters have been meticulously established through the preliminary tests conducted during the course of this research, ensuring their appropriateness for the optimization process.
P b t = F N b t 1 + ( 1 F ) A b t 1 + K I b t 1 + ρ Q | A b t 1 A t 1 b e s t | b = 1 B F N b t 1 + ( 1 F ) A b t 1 + K I b t 1 + ρ Q | A b t 1 A t 1 b e s t | |
Equation (17) serves as a probability function that guides the selection of ‘IB’, denoted as ‘b’, during iteration ‘t’. This equation derives from four distinct components, each drawing from historical data related to the performance of various ‘IBs’. These components collectively inform the likelihood of selecting ‘IB’ ‘b’ based on its past performance.
The first component quantifies how frequently ‘IB’ ‘b’ has been chosen in previous iterations. This metric reflects the popularity of ‘IB’ ‘b’ among the selection process and implies that more frequently selected ‘IBs’ might have the potential to yield superior solutions. The second component in Equation (17) calculates the average value of the ‘objective function’ associated with ‘IB’ ‘b’. This component provides insights into the typical performance level of ‘IB’ ‘b’.
The third component counts the instances where ‘IB’ ‘b’ has consistently outperformed all other ‘IBs’ in the same iteration. This highlights ‘IB’ ‘b’s ability to consistently find the best solutions. The final component considers the difference between the average solution value of ‘IB’ ‘b’ and the ‘best IB’. It introduces an additional dimension to the evaluation process.
Once these components are combined in Equation (17) to compute the probability of selecting ‘IB’ ‘b’, a roulette wheel selection method will be employed for the subsequent step. This roulette wheel selection ensures that ‘WP’ (Worker Package) selects ‘IB’ based on their respective probabilities. Higher probabilities will correspond to a greater chance of selection, favoring ‘IBs’ that have consistently demonstrated superior performance in comparison to others. In summary, Equation (17) and the roulette wheel selection method work in tandem to choose the most promising ‘IB’ based on their historical performance, fostering a dynamic and adaptive selection process.
In each iteration, it is imperative to update the values of several parameters in response to the prevailing conditions. These essential factors encompass R k i ,   R k i t ,   N b t , A b t , B i g b e s t , and I b t 1 . Subsequently, the selection of IB, the performance on the selected IB, and the updating of the probability of the IB are executed iteratively until a specified termination condition is satisfied, such as a predetermined computational time limit or a prescribed number of iterations. This iterative process ensures the progressive refinement and convergence of the algorithm, ultimately leading to the attainment of reliable and optimized results within the specified constraints.

3.3. Performance Measurement Matric and the Comparison Methods

Performance metrics play a pivotal role in assessing the efficacy of deep learning models, providing valuable insights into their performance on specific tasks and guiding informed decisions for researchers and practitioners. Notably, accuracy stands as a fundamental metric, measuring the proportion of correctly classified instances relative to the total dataset size and offering an overarching measure of correctness. In Section 3.2.4, we will undertake a comprehensive performance evaluation, comparing the efficacy of all individual models and homogeneous ensemble models. Additionally, we will implement the Vision Transformer (ViT) approach, as presented by [70], to provide a benchmark for assessing the performance of our proposed model.
In parallel, precision endeavors to minimize false positives by gauging the ratio of true positive predictions to the total predicted positive instances. Conversely, the recall, synonymous with sensitivity or the true positive rate, proves indispensable when reducing false negatives, capturing the ratio of true positive predictions to the total actual positive instances. The contribution to model evaluation includes the F1-score, which effectively balances precision and recall, especially when handling imbalanced class distributions. The calculations for the accuracy, precision, recall, and F1 score can be calculated using Equations (18)–(21).
A c c u r a c y = n T P + n T N n T P + n P N + n F P + n F N
P r e c i s i o n = n T P n T P + n F P
R e c a l l = n T P n T P + n F N
F 1 - score = 2 n T P 2 n T P + n F P + n F N
where n T P is the number of true positives, n T N is the number of true negatives, n F P is the number of false positives, and n F N is the number of false negatives.
In addition to accuracy, the area under the receiver operating characteristic (ROC) curve (AUC) is a crucial performance metric, especially for binary classification tasks. The ROC curve illustrates the trade-off between the true positive rate and false positive rate, with the AUC representing the area under this curve. Higher AUC values indicate a superior model performance, making it a valuable tool for comparing different models. These metrics together provide a comprehensive understanding of the strengths and weaknesses of the deep learning model, which is essential for model selection and optimization. The function used to calculate ‘AUC’ in our experiment can be found at ‘https://scikit-learn.org/stable/modules/geneated/sklearn.merics.roc_auc_score.html’ Accepted date (15 January 2024).
This study sets forth to explore the efficacy of two decision fusion strategies: the “unweighted average” (UWA) approach, which uniformly amalgamates individual classifier outputs [52], and a tailored artificial multiple intelligence system (AMIS) [8]. AMIS incorporates the differential evolution algorithm (DE) [51], and genetic algorithm (GA) [53] to optimize the weights assigned to each classifier, seeking to enhance the performance of the ensemble classifier.
In summary, the proposed method can be condensed into algorithmic form, as depicted in Algorithm 1.
Algorithm 1: Construction of the Parallel-Artificial Multiple Intelligence System-Ensemble Deep Learning model (P-AMIS-E)
Input:Image training set, list the number of each type of CNN architecture.
Step (1) Generate new images with data augmentation on the training set, including the method: rotation, flipping, zooming, cropping,
Gaussian noise, shearing lighting simulation, brightness, contrast, saturation, and hue.
Step (2) Construct the AMIS-ensemble segmentation.
-
Training U-Net and Mask-R-CNN networks.
-
Optimize U-net and Mask-R-CNN weights using AMIS in Algorithm 1, whose objective is to minimize segmentation loss.
Step (3) Segment images in Step (1) using AMIS-ensemble segmentation in Step (2).
Step (4) Construct and train each CNN in the list, and number each type of CNN architecture with a segmented image set in Step (3).
Step (5) Construct the AMIS-ensemble CNN.
-
Predict   the   CNN   output   Y k j ,   with   the   CNN   index   k   and   class   j ,   of all CNNs in Step (4) from the input segmented image set in Step (3).
-
Optimize   CNN   weights   using   AMIS ,   whose   objective   is   to   maximize   the   accuracy   rate   on   the   prediction   output   Y k j of all CNNs.
Output:AMIS-ensemble CNN with an optimal weight.
The analysis will utilize Gradient-weighted Class Activation Mapping (Grad-CAM) to elucidate the decision-making process of the AI across different classes within the classification model. Grad-CAM, a technique enhancing the transparency of convolutional neural network-based models, achieves this by visualizing essential input regions for predicting specific classes. The method employs gradients originating from the target concept, like a classification class, within the final convolutional layer to create a coarse localization map that highlights significant image areas for concept prediction. Regarding the computation of neuron importance weights α k c , we define f k ( x , y ) as the activation of unit ‘k’ in the last convolutional layer at spatial location ( x , y ) . We calculate the gradient of the score for class ‘c’ (prior to softmax), denoted as y c , with respect to these features f k . The gradient undergoes global-average pooling over width and height dimensions (indexed by x and y) to obtain α k c , as determined by Equation (22).
α k c = 1 Z x y y c f k ( x , y )
Let Z denote the number of pixels in the feature map and y c f k ( x , y ) represent the gradient. Concerning the Grad-CAM heatmap L G r a d C A M c , it is derived as a weighted summation of feature maps, subsequently subjected to a ReLU activation, as outlined in Equation (23). The incorporation of ReLU activation ensures the visualization of features that positively impact the class of interest while disregarding negative contributions.
L G r a d C A M c = R e L U ( k α k c f k )
Visualization involves normalizing the heatmap L G r a d C A M c , which is subsequently superimposed onto the input image. This visualization approach reveals the crucial regions within the input image that are instrumental in predicting class ‘c’. The utilization of Grad-CAM enables the acquisition of a visual elucidation for the convolutional neural network’s decision-making process, emphasizing the distinctive image areas employed by the model in class identification.

4. Computational Result

In this investigation, two distinct computing resources were harnessed to facilitate the development and testing of our algorithm. During the training phase, we availed the computational capabilities of Google Collaboratory, which granted access to an NVIDIA Tesla V100 boasting 16 GB of RAM and commensurate specifications. This arrangement proved instrumental in training our model on a robust computing resource, well equipped to manage the taxing computational requirements inherent to our algorithm.
For the evaluation of the proposed model’s performance, we conducted simulations on a separate computing system, equipped with two Intel Xeon-2.30GHz CPUs, 52 GB of RAM, and a Tesla K80 GPU with 16 GB of GPU RAM. The meticulous selection of this computing system was based on its ability to proficiently handle the computational demands entailed by our simulation process, thus affording us the opportunity to meticulously assess the model’s performance. By leveraging these two distinct and high-performance computing platforms, we attained the precision and dependability required to achieve accurate and reliable outcomes throughout our study. The algorithmic and model parameter configurations are presented within Table 3 for reference.
The experimentation phase was partitioned into three distinct groups, with the experimental framework visually depicted in Figure 6. In the initial group, various combinations of the proposed methods were rigorously tested to ascertain the optimal performing combination. Subsequently, the second group undertook a comprehensive evaluation of our proposed method, in contrast to state-of-the-art approaches, utilizing the best combination of methods identified in the initial group while focusing on the CALU-1 dataset.
To gauge the efficacy and generalizability of the proposed method, the third group assessed its performance on an unseen dataset, CALU-2. This methodological division allowed for a systematic and meticulous evaluation of the proposed approach while also facilitating a rigorous comparison with existing state-of-the-art methods.
The illustrative framework depicted in Figure 6 served as a clear roadmap for guiding the experiment’s progression, enabling the achievement of reliable and reproducible results. By adopting this well-structured experimental design, we could confidently examine the efficacy of our proposed method and draw meaningful comparisons with the existing state-of-the-art techniques.

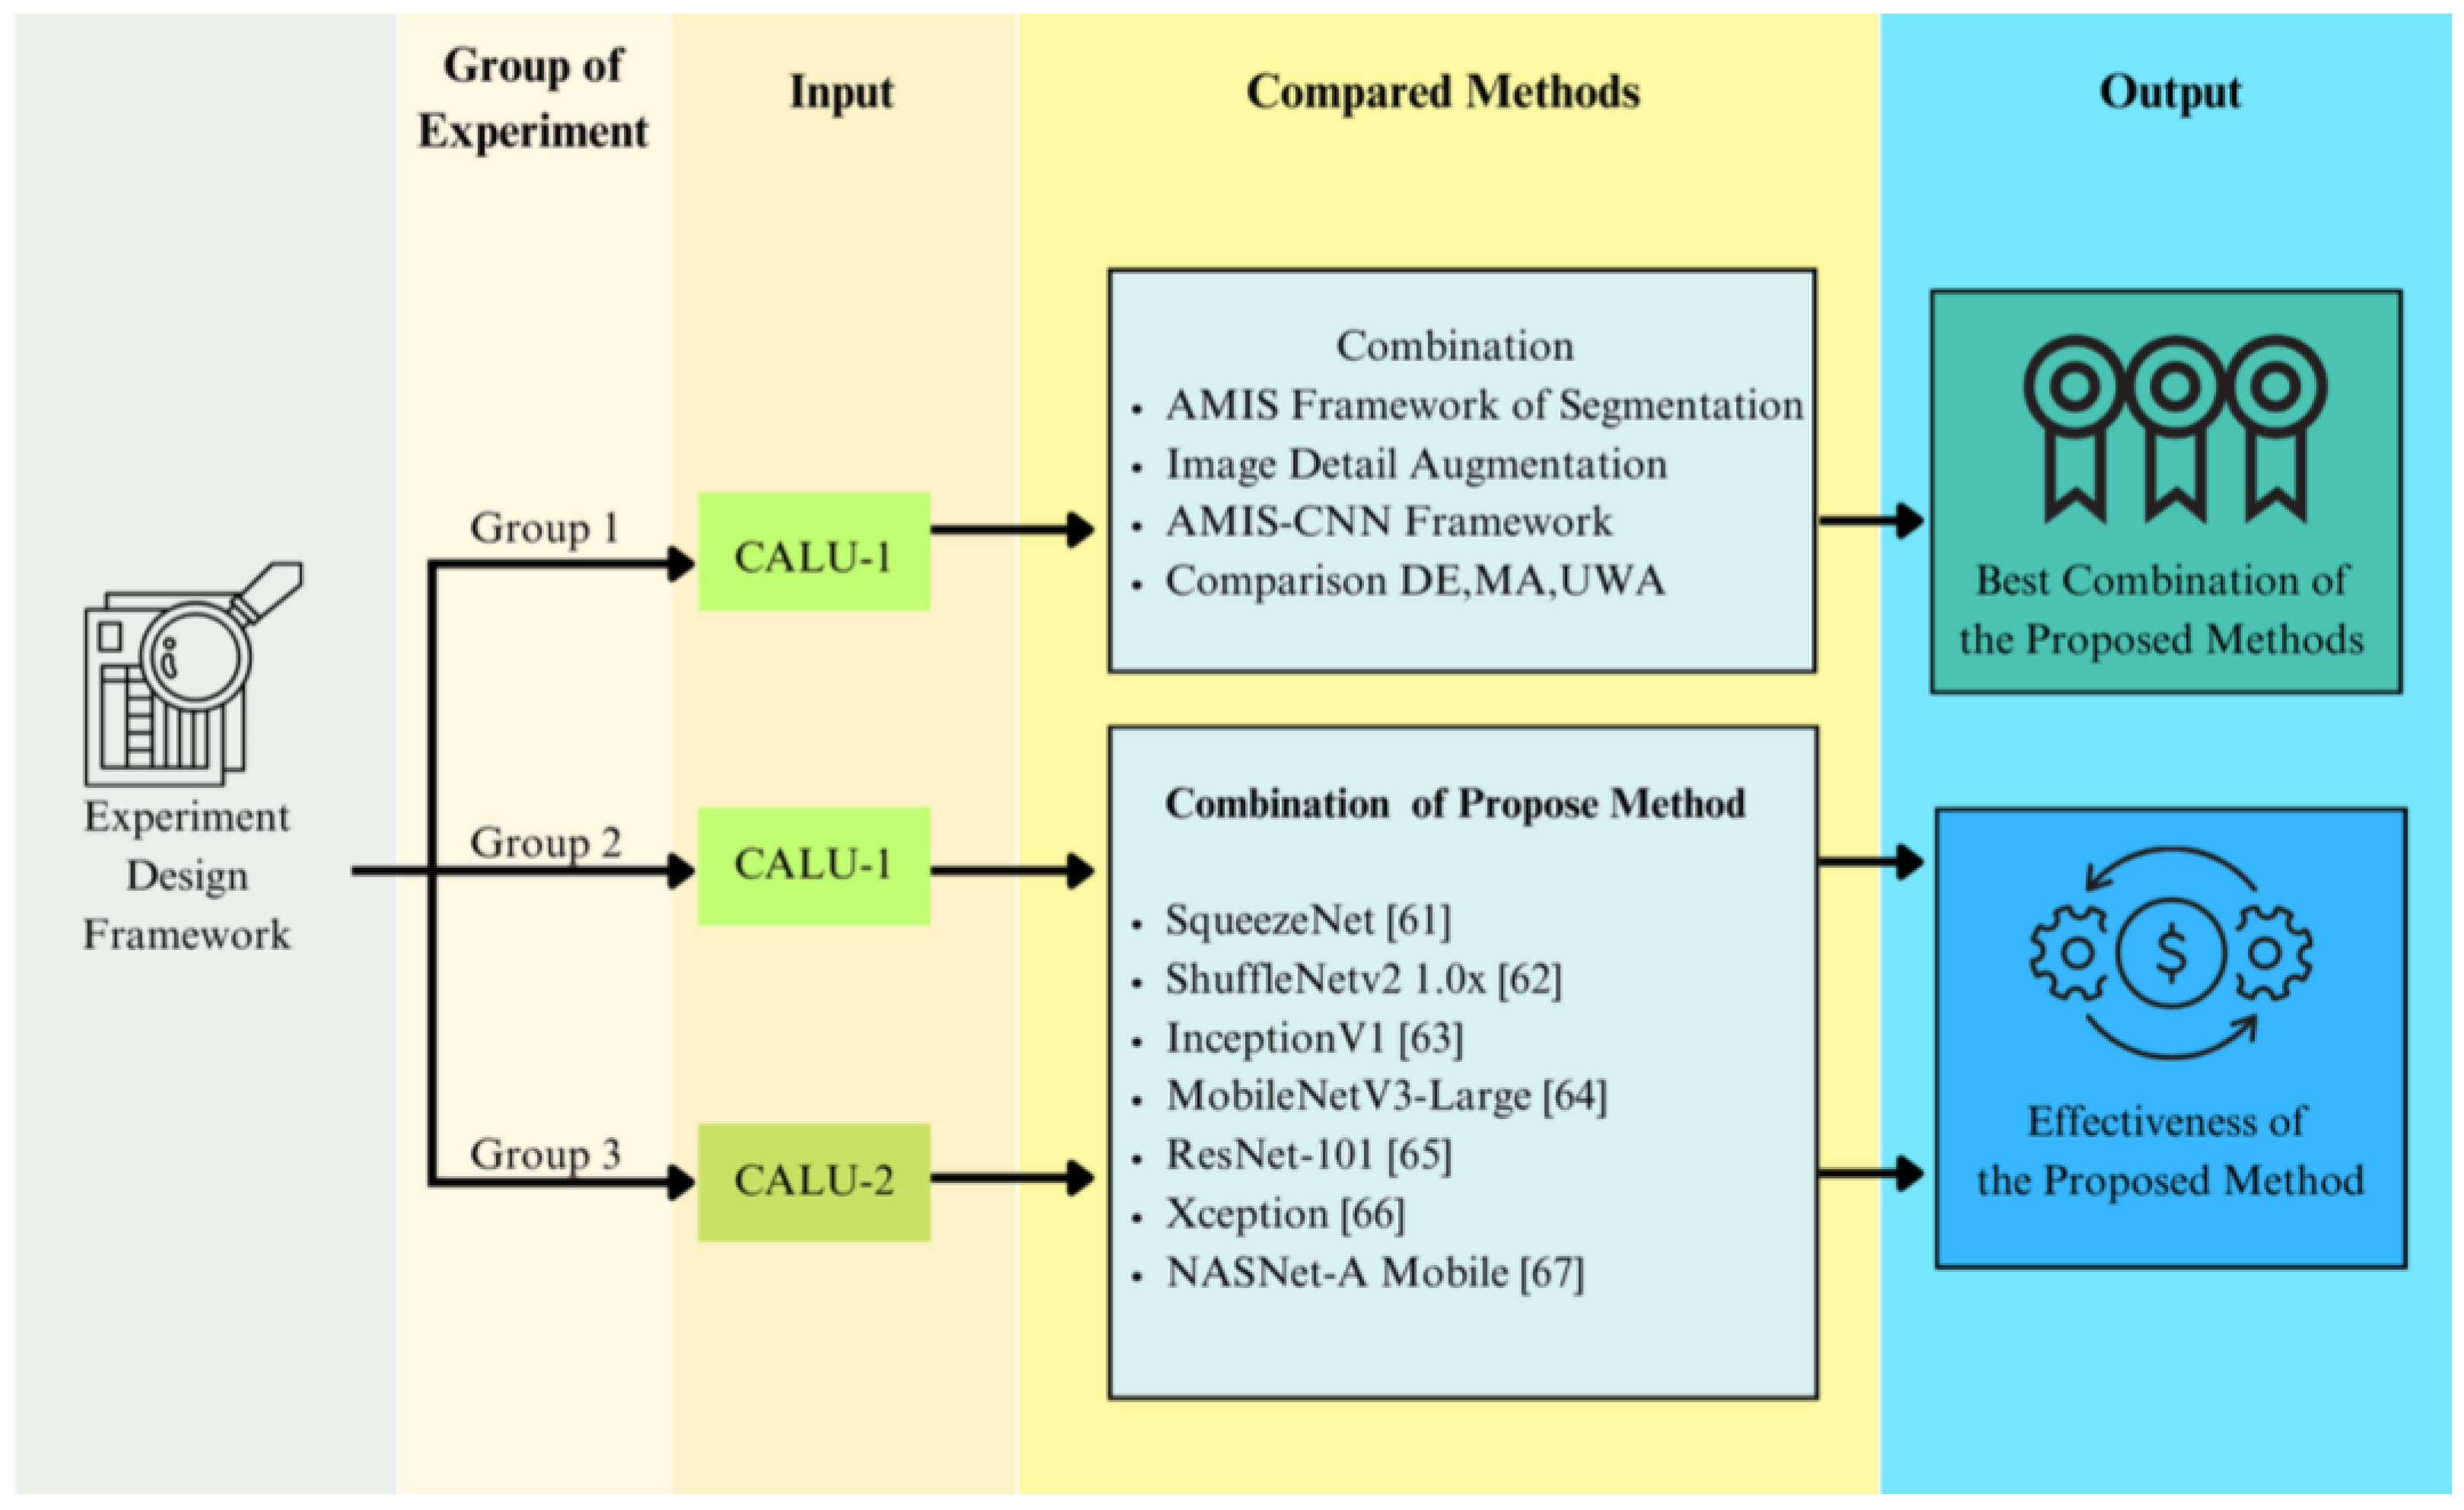
4.1. Unveiling the Optimal Combination of Diverse Model Configurations

As delineated in our research methodology, we leveraged two distinct image segmentation methods—specifically, the Mask R-CNN and U-Net methods, along with an ensemble of these two methods, achieved through four decision fusion strategies: the unweighted average (UWA), differential evolution algorithm (DE), genetic algorithm (GA), and modified artificial multiple intelligence system (AMIS). Additionally, we incorporated one type of image augmentation method into the experimentation. Consequently, the entire experimentation encompassed a total of 32 distinct experimental configurations, meticulously summarized in Table 4.
Then, we use CALU-1 to test the effectiveness of the proposed model and reveal the best combination of the various elements of the proposed model; the computational result is shown in Table 5. When comparing different methods of classification, it is essential to carefully select performance measures that align with the goals and requirements of the study. While the choice of performance measures may vary depending on the specific application, several commonly used measures are available for evaluating the classification performance. These measures include the accuracy, precision, recall, F1 score, and ROC curve and AUC. Accuracy represents the proportion of correctly classified instances, while precision measures the proportion of true positives among all positive predictions. Recall, on the other hand, represents the proportion of true positives among all actual positive instances. The F1 score combines precision and recall into a single measure that provides a balanced evaluation of both metrics. Finally, the ROC curve and AUC are measures of the trade-off between the true positive rate and false positive rate at various thresholds. The result of 12 experiments is shown in Table 5, and the conclusion of the benefit of using different elements of the proposed method is shown in Table 6.
The findings from our experimental study, as presented in Table 6, reveal that the ensemble segmentation method, incorporating both Mask R-CNN and U-Net, demonstrates a notably higher accuracy compared to models that omit segmentation. The improvement in accuracy is by an average of 13.69% and 10.98% when compared to models employing Mask R-CNN and U-Net individually, respectively. Additionally, the results align with Precision, Recall, F1-Score, and AUC as evaluation metrics.
Furthermore, the computational analysis shows that models with image augmentation yield a superior quality by 2.54% compared to those without it. Among the decision fusion strategies utilized, AMIS stands out with a higher quality, outperforming DE, GA, and UWA by average margins of 1.83%, 3.65%, and 4.62%, respectively.
As a result, the most optimal combination of models comprises ensemble segmentation, image augmentation, and the adoption of AMIS as the decision fusion strategy. This model will serve as the benchmark to compare against state-of-the-art methods in the subsequent section.

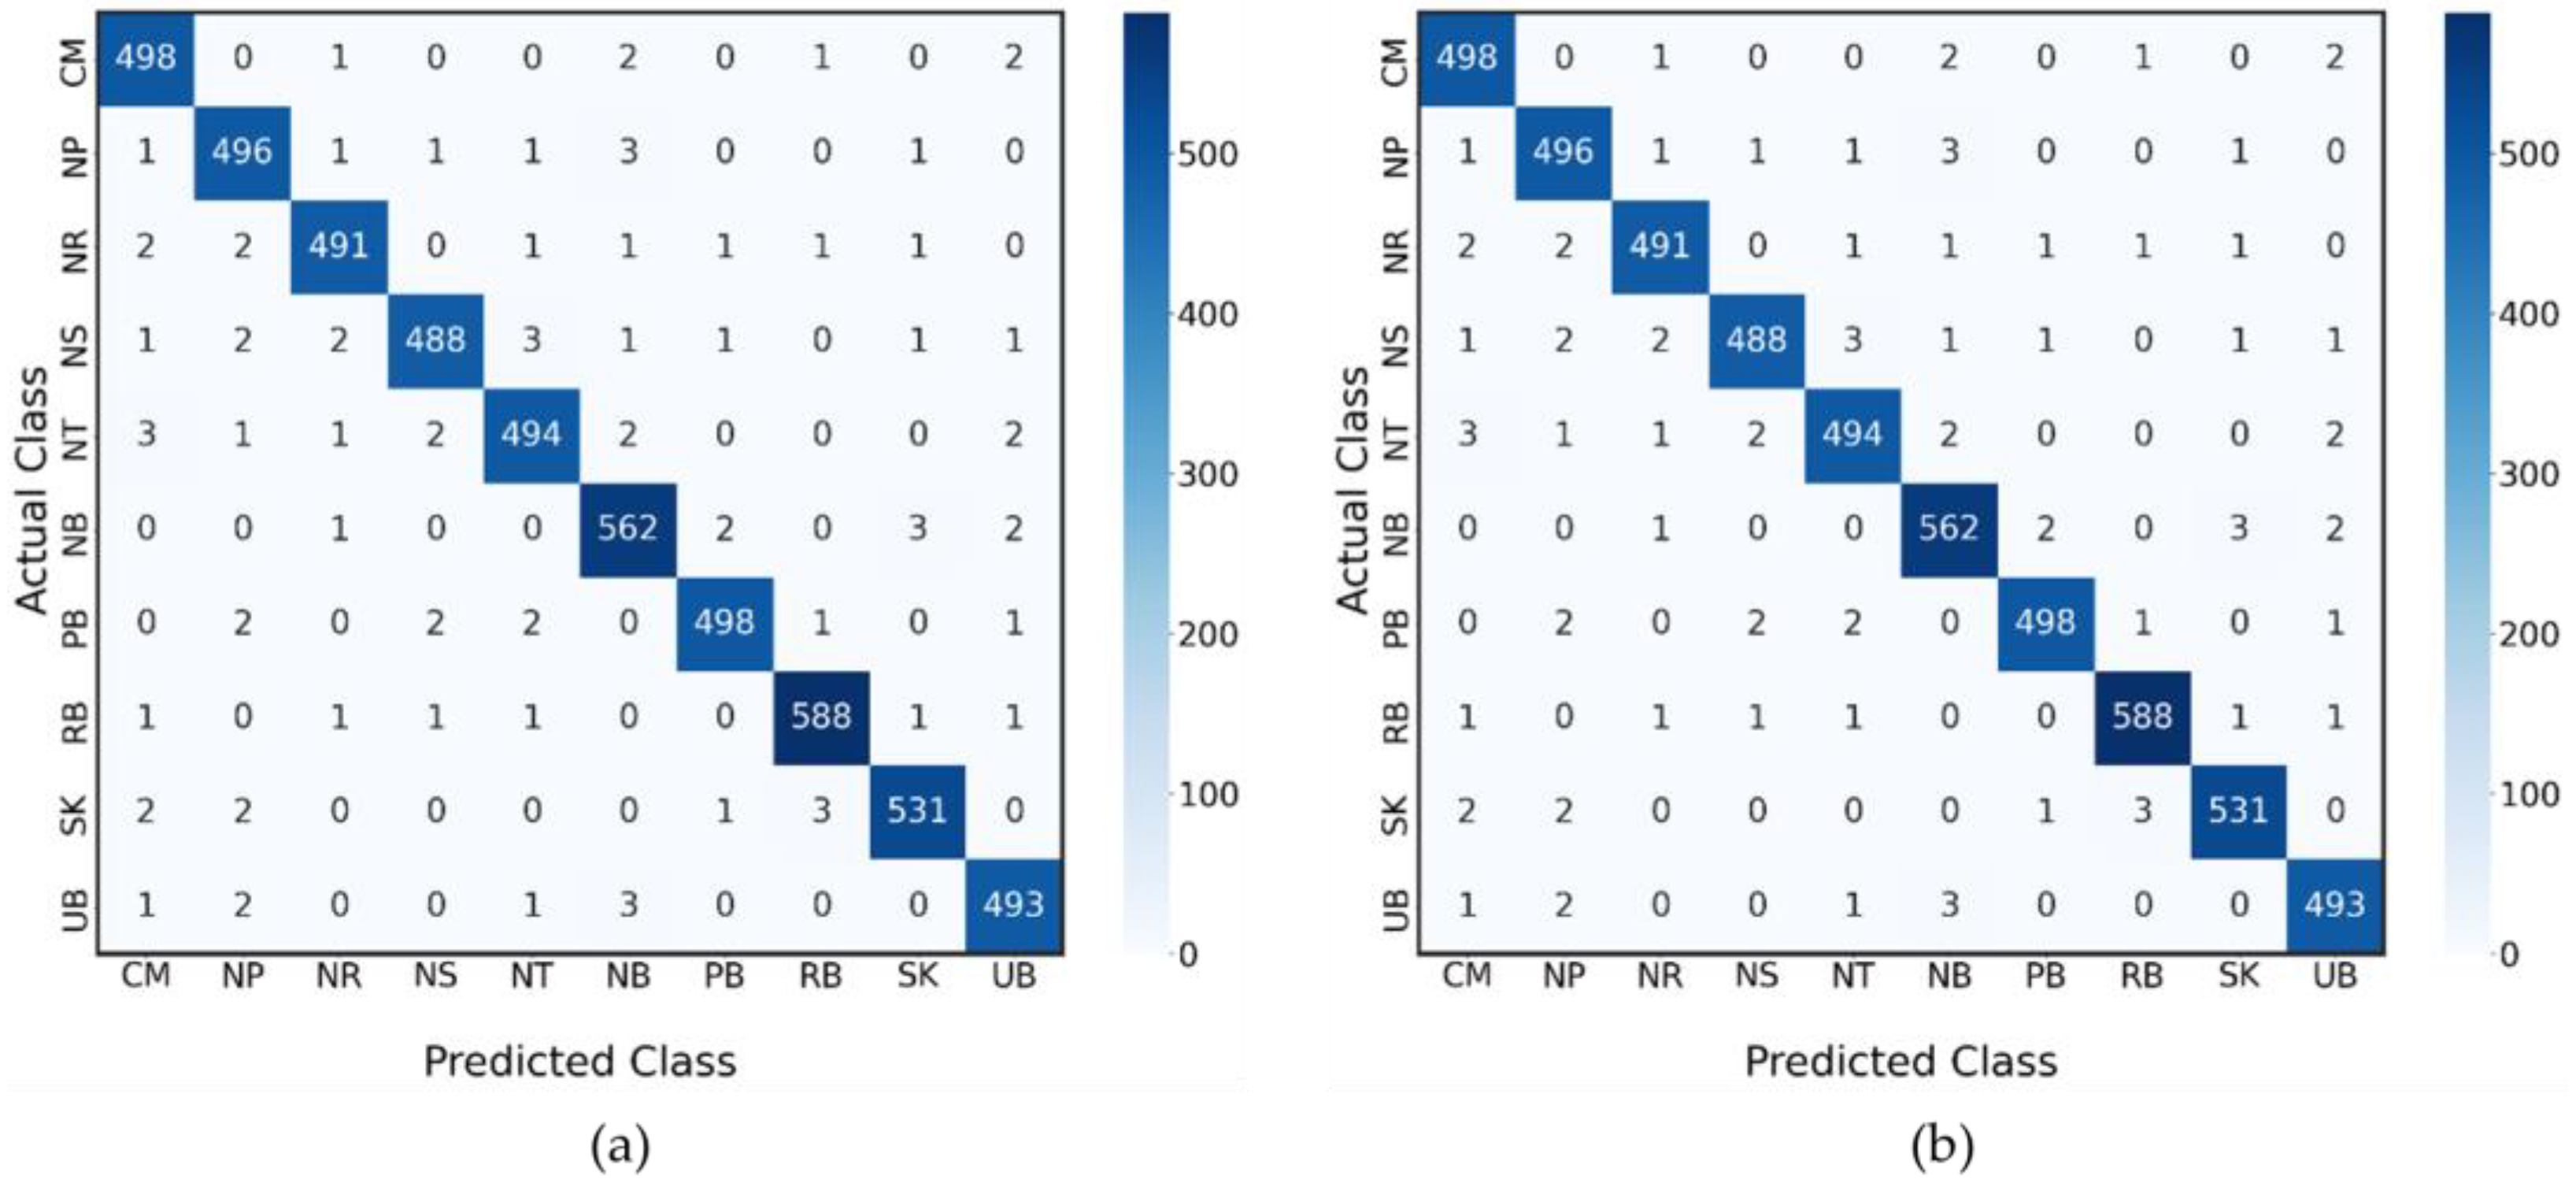
4.2. A Comparative Analysis of the Proposed Model against State-of-the-Art Methods Using the CALU-1 Dataset

The experimental dataset employed in this study is denoted as CALU-1, consisting of a total of 15,525 images. The dataset was meticulously partitioned into two distinct groups: 10,303 images were allocated for the training procedure, while the remaining 5222 images were earmarked for testing both the proposed models and the compared methods. To assess the performance of the models comprehensively, essential performance metrics such as the AUC, precision, accuracy, recall, and F1-score were employed. The results of this comprehensive evaluation are succinctly presented in Table 7.
Table 7 presents the comprehensive performance evaluation of various deep learning methods on the CALU-1 dataset, utilizing five essential performance metrics: Accuracy, Precision, Recall, F1-score, and AUC (Area Under the Curve). Each row in the table corresponds to a specific deep learning architecture, while the columns represent the respective performance metric values for each method.
Among the evaluated methods are well-established architectures such as ViT, ResNet-101, Xception, NASNet-A Mobile, MobileNetV3-Large, SqueezeNet, ShuffleNetv2 1.0x, MobileNetV3, and InceptionV1. Additionally, the table incorporates the results of the proposed methods, which were designed and tested during the present study.
Upon the analysis of the results, noteworthy observations emerged. First and foremost, the proposed methods demonstrate superior performance across all performance metrics, surpassing all other architectures in the evaluation. With an accuracy of 98.41%, the proposed methods achieve an impressive level of correct classification. Moreover, their precision of 97.82% indicates a highly effective ability to minimize false positive predictions.
Further, the recall rate of 97.99% highlights the proposed methods’ proficiency in capturing actual positive instances accurately. The proposed methods also achieve a remarkable F1-score of 99.61%, signifying an exceptional balance between precision and recall.
Finally, the proposed methods exhibit an outstanding AUC value of 98.39%, showcasing their excellent discriminative power and overall performance in comparison to other state-of-the-art methods. These results robustly validate the efficacy and superiority of the proposed methods for image segmentation tasks on the CALU-1 dataset, emphasizing their significance in advancing the field of deep learning and image analysis.

4.3. Comparative Analysis of the Proposed Model against State-of-the-Art Methods Using the Unseen CALU-2 Dataset

All proposed methods have been tested with CALU-2, which is the unseen dataset that has 5308 images. The result of the experiment is shown in Table 8.
Table 8 provides a comprehensive comparison of various deep learning models, evaluating their performance metrics on the CALU-2 dataset. These models fall into three categories: single models, homogeneous ensembles, and our proposed heterogeneous ensemble.
Starting with the single models, ViT, ResNet-101, Xception, NASNet-A Mobile, and MobileNetV3-Large are notable for their substantial sizes, ranging from 84 MB to 113 MB. They exhibit commendable accuracy, scoring between 88.7% and 92.6%. However, their training times are significantly high, particularly ResNet-101, which takes 62.48 min. The testing time per image varies from 0.48 to 1.34 s, with Mo-bileNetV3-Large being the fastest. While these single models offer respectable accuracy, their size and extensive training times may constrain their applicability.
Turning to SqueezeNet, ShuffleNetv2 1.0x, MobileNetV3, and InceptionV1, we encounter a diverse set of single models, characterized by their relatively lightweight sizes (ranging from 5 MB to 20 MB). These models, despite their compactness, achieve competitive accuracy scores, all surpassing the 75% mark. Notably, they present trade-offs between accuracy and computational efficiency. For instance, SqueezeNet delivers 76.2% accuracy, alongside a remarkably brief 5.44 min of training time and a swift 0.10 s of testing per image. In contrast, InceptionV1 achieves the highest single-model accuracy at 79.4%. However, it necessitates a longer training period (15.7 min) and 0.20 s for image testing. These single models cater to various application requirements, allowing users to choose the optimal trade-off between accuracy and computational resources.
Transitioning to the homogeneous ensemble models, which include SqueezeNet, ShuffleNetv2 1.0x, MobileNetV3, and InceptionV1, we notice their unification of models of the same type. These homogeneous ensembles collectively achieve remarkable accuracy, averaging around 94%. This accuracy surge represents a significant improvement over their individual single models, highlighting the advantages of ensemble learning. However, this gain in accuracy coincides with lengthier training periods, ranging from 37.58 to 44.19 min—substantially longer than those of single models. Nevertheless, the testing times remain relatively efficient, ranging from 0.44 to 0.48 s per image. These homogeneous ensembles excel in scenarios prioritizing maximum accuracy, even at the expense of increased training times.
In contrast, our proposed heterogeneous ensemble method, which amalgamates diverse models, including SqueezeNet, ShuffleNetv2 1.0x, MobileNetV3, and InceptionV1, emerges with an outstanding accuracy of 98.5%. Notably, this remarkable accuracy is attained with significantly shorter training durations, as low as 34.59 min, alongside efficient testing times of 0.34 s per image. This underscores the potency of leveraging diverse model architectures within ensemble learning. The proposed heterogeneous ensemble not only outperforms homogeneous ensembles in terms of accuracy but also maintains efficiency in both training and testing.
In summary, our proposed heterogeneous ensemble method excels in terms of accuracy and computational efficiency when compared to both single models and homogeneous ensembles. This underscores the advantage of harnessing diverse model architectures to achieve exceptional accuracy while optimizing computational resources, making it a compelling approach for image classification tasks, such as CAU cultivar classification.
To conduct a thorough analysis of ‘explainable AI’, we will utilize Figure 7a,b and Figure 8 to showcase the confusion matrix and the Heatmap GradCAM for both the CALU-1 and CALU-2 datasets. This approach aims to provide insights into the decision-making processes of artificial intelligence.
Figure 7 presents the confusion matrices for two distinct models, CALU-1 and CALU-2, applied to the classification of various regions based on their unique agricultural cultivars. The axes of each matrix represent the predicted classes (horizontal axis) and the actual classes (vertical axis) corresponding to different regions in Thailand. Each entry in the matrices denotes the number of instances that a region’s cultivar, represented by its abbreviation, was predicted to be of a certain class versus its true class. The diagonal cells, highlighted by the greater numbers, indicate the number of correct predictions for each region, where the model’s prediction aligns with the actual class. Off-diagonal cells represent misclassifications, where the predicted class does not match the actual class. The regions are denoted by their initials: CM for Chiang Mai, NP for Nakhon Pathom, NR for Nakhon Ratchasima, NS for Nakhon Si Thammarat, NT for Narathiwat, NB for Nonthaburi, PB for Prachin Buri, RB for Ratchaburi, SK for Songkhla, and UB for Ubon Ratchathani. The matrices offer a visual and quantitative analysis of the model’s performance across different regional cultivars, with a clear emphasis on the model’s accuracy and areas where the classification performance could be improved.
Figure 7a,b illustrates the confusion matrix obtained from the proposed model’s classification outcomes. It is evident that the Ubon Ratchathani cultivar exhibits the highest accuracy when compared to other cultivars from CALU-1 and CALU-2. However, the Narathiwat cultivar demonstrates the highest degree of misclassification for CALU-1 and CALU-2. This can be attributed to the fact that the Narathiwat Cultivar shares leaf characteristics that closely resemble those of other cultivars such as NP, NB, and PB. Notably, the discrepancies primarily arise from subtle variations in size and certain aspects of outward appearance among these cultivars.
To elucidate the underlying reasons for the variations in accuracy across different cultivars, a meticulous analysis is warranted. In this regard, the Heatmap GradCAM technique serves as an insightful tool for expounding upon the distinctive classification outcomes. As evidenced in Figure 8, the GradCAM visualization sheds light on the discriminative regions exploited by the AI model when categorizing diverse leaf types within varying cultivars. It becomes apparent that the Ubon Ratchathani cultivar is predominantly assessed based on features situated toward the center of the leaf’s surface. In contrast, the Prachin Buri cultivar places greater reliance on attributes located along the leaf’s periphery. This reliance on distinct regions is notably prevalent among certain cultivars where the curvature of the leaf’s edge diverges, prompting a strategic shift in classification emphasis. Furthermore, the classification decision-making process is notably influenced by the leaf’s size, as evidenced by the conspicuously reddened regions depicted in the heatmap. This characteristic is most pronounced in cultivars boasting larger leaf dimensions, including CM, NP, and NR.
In the next experiment, we will test the datasets CALU-1 and CALU-2 by splitting the datasets into k-folds to validate the datasets. We will use three and five folds of the test datasets and test for the result obtained from using different groups of trained datasets. The results are shown in Table 9.
Upon scrutinizing the performance of the “Proposed Methods” in relation to alternative methodologies across the CALU-1 and CALU-2 datasets, several salient observations come to light. Concerning accuracy, the “Proposed Methods” consistently provide competitive outcomes. In CALU-1, their achievements manifest as accuracy rates of 93.21% and 97.14% through the utilization of threefold and fivefold cross-validation paradigms, correspondingly. These figures situate the “Proposed Methods” in close juxtaposition to distinguished techniques such as “MobileNetV3” and “InceptionV1.” This ability to achieve a competitive accuracy is also shown in CALU-2, thereby corroborating the robustness of the proposed approach.
Advancing to the realm of precision, the “Proposed Methods” perpetually transcend their counterparts. Within CALU-1, they yield precision metrics of 96.81% and 97.11% in conjunction with threefold and fivefold cross-validation sequences, individually. Evident here is their significant ability to accurately discern positive instances. These successful outcomes also reflect those of CALU-2, where the “Proposed Methods” exhibit precision metrics of 96.81% and 97.11%.
Delving into the domain of recall, the “Proposed Methods” exhibit commendable results across both datasets. For CALU-1, their recall achieves maximum values of 96.06% and 96.47% by virtue of threefold and fivefold cross-validation regimes, respectively. This ability to identify positive instances is in accordance with the results observed for CALU-2, where the recall rates reached 96.06% and 96.47%.
Additionally, the “Proposed Methods” exhibit effective results in terms of precision and recall, achieving elevated F1-scores. For CALU-1, F1-scores of 97.18% and 98.14% (for threefold and fivefold, respectively) demonstrate their ability to achieve a symbiotic balance among these dual metrics. This is also reflected in the F1-scores found for CALU-2, achieving values of 97.18% and 98.14%.
In terms of discerning between the categorical classes, the “Proposed Methods” demonstrate consistent AUC values. This indicates their ability to discern between positive and negative instances. With AUC values reaching 97.41% and 98.48% for the threefold and fivefold cross-validation modalities within CALU-1, and similar values also being found for CALU-2, the superiority of the proposed approach is demonstrated.
Furthermore, the resilience exhibited by the “Proposed Methods” across both datasets is palpable, as evidenced by their meager standard deviations. These serve to uphold the premise of a dependable and consistent comportment of the model.
In a contextual juxtaposition of threefold and fivefold cross-validation, a discernible constant trend ensues. While both methodologies render commendable performances, the dominion of fivefold cross-validation precipitates marginally elevated precision, recall, F1-Score, and AUC values. This underscores the enhanced capability imparted by a greater multitude of folds in encapsulating subtle intricacies and affording a more granular evaluation of the model’s performance.
In the ensuing experimental phase, we shall undertake an assessment of the proposed model’s performance, employing a dataset amalgamated from CALU-1 and CALU-2. Notably, these datasets deviate from the conventional white background, introducing a degree of environmental heterogeneity. The principal objective of this experiment resides in gauging the robustness of the aforementioned model across a spectrum of diverse scenarios.
Furthermore, our investigation will extend to the exploration of variance within the standard fusion strategies. Specifically, we will juxtapose the conventional majority voting and unweighted averaging approaches with our novel AMIS fusion technique. The dataset under consideration comprises a total of 343 images representing class CM, 340 images for NP, 338 images for NR, 346 images for NS, 350 images for NT, 339 images for NB, 350 images for PB, 351 images for RB, 355 images for SK, and 351 images for UB. It is noteworthy that all of these images feature backgrounds that deviate from the standard white backdrop. In aggregate, our dataset comprises 3463 images, which collectively constitute the testing dataset denoted as CALU-3G.
This dataset is herein referred to as CALU-3G for the sake of clarity and reference. Subsequently, the computational results derived from this evaluation are presented in Table 10. These results will be subject to further analysis and serve as a basis for comparative assessment.
The analysis of the performance evaluation results on the CALU-3G dataset, as presented in Table 10, offers significant insights into the model’s efficacy in classifying Centella Asiatica Urban (CAU) cultivars against varying backgrounds. Notably, the CALU-3G dataset, composed solely of images with normal (non-white) backgrounds, presents a more challenging classification environment compared to the CALU-1 and CALU-2 datasets, which included both white and normal backgrounds. This complexity in the CALU-3G dataset is likely due to the increased background noise and variation, potentially impacting the models’ ability to accurately identify relevant features.
Upon comparing the models’ performance across these datasets, it becomes evident that the proposed models demonstrate a robust adaptability to background variations. However, the superior performance metrics observed in the CALU-3G dataset indicate an enhanced ability of the models to handle more complex, real-world scenarios, where background noise is prevalent. This robustness is crucial for practical applications in agricultural species classification, where diverse environmental conditions are the norm.
Further, examining the impact of different decision fusion strategies in the proposed model sheds light on their relative effectiveness. The strategies employed include majority voting, unweighted average, and AMIS (Artificial Multiple Intelligence System). The performance of majority voting and unweighted average strategies on the CALU-3G dataset is remarkably similar across key metrics like accuracy, precision, recall, F1-score, and AUC. This similarity could suggest a balanced contribution from each model in the ensemble, leading to comparable outcomes for these fusion methods.
In contrast, the AMIS strategy significantly outperforms the other strategies, achieving notable improvements in all performance metrics, including a remarkable accuracy of 98.4% and an F1-score of 98.8%. This superior performance can be attributed to AMIS’s dynamic optimization of weights based on individual model performances, enabling a more effective integration of outputs. The marked improvement with AMIS highlights its capability to handle complex datasets like CALU-3G, reinforcing the value of advanced decision fusion techniques in agricultural species classification, especially under challenging conditions.
In conclusion, the analysis underscores the importance of considering background variability in model development and the efficacy of sophisticated decision fusion strategies like AMIS in enhancing classification performance in complex scenarios.

5. Discussion

In the ensuing section, we shall expound upon the rationale underpinning the juxtaposition of our findings with extant research and methodologies. The ensuing discourse will be delineated across three dimensions, namely, (1) progressions in the automated differentiation of Centella asiatica (L.) urban cultivars to augment agricultural practices and facilitate the quality control of medicinal products; (2) an evaluative examination aimed at the augmentation of Centella asiatica (L.) urban cultivar classification through the implementation of a parallel-AMIS-ensemble model; and (3) a comparative analysis of decision fusion strategies within the purview of metaheuristic optimization.

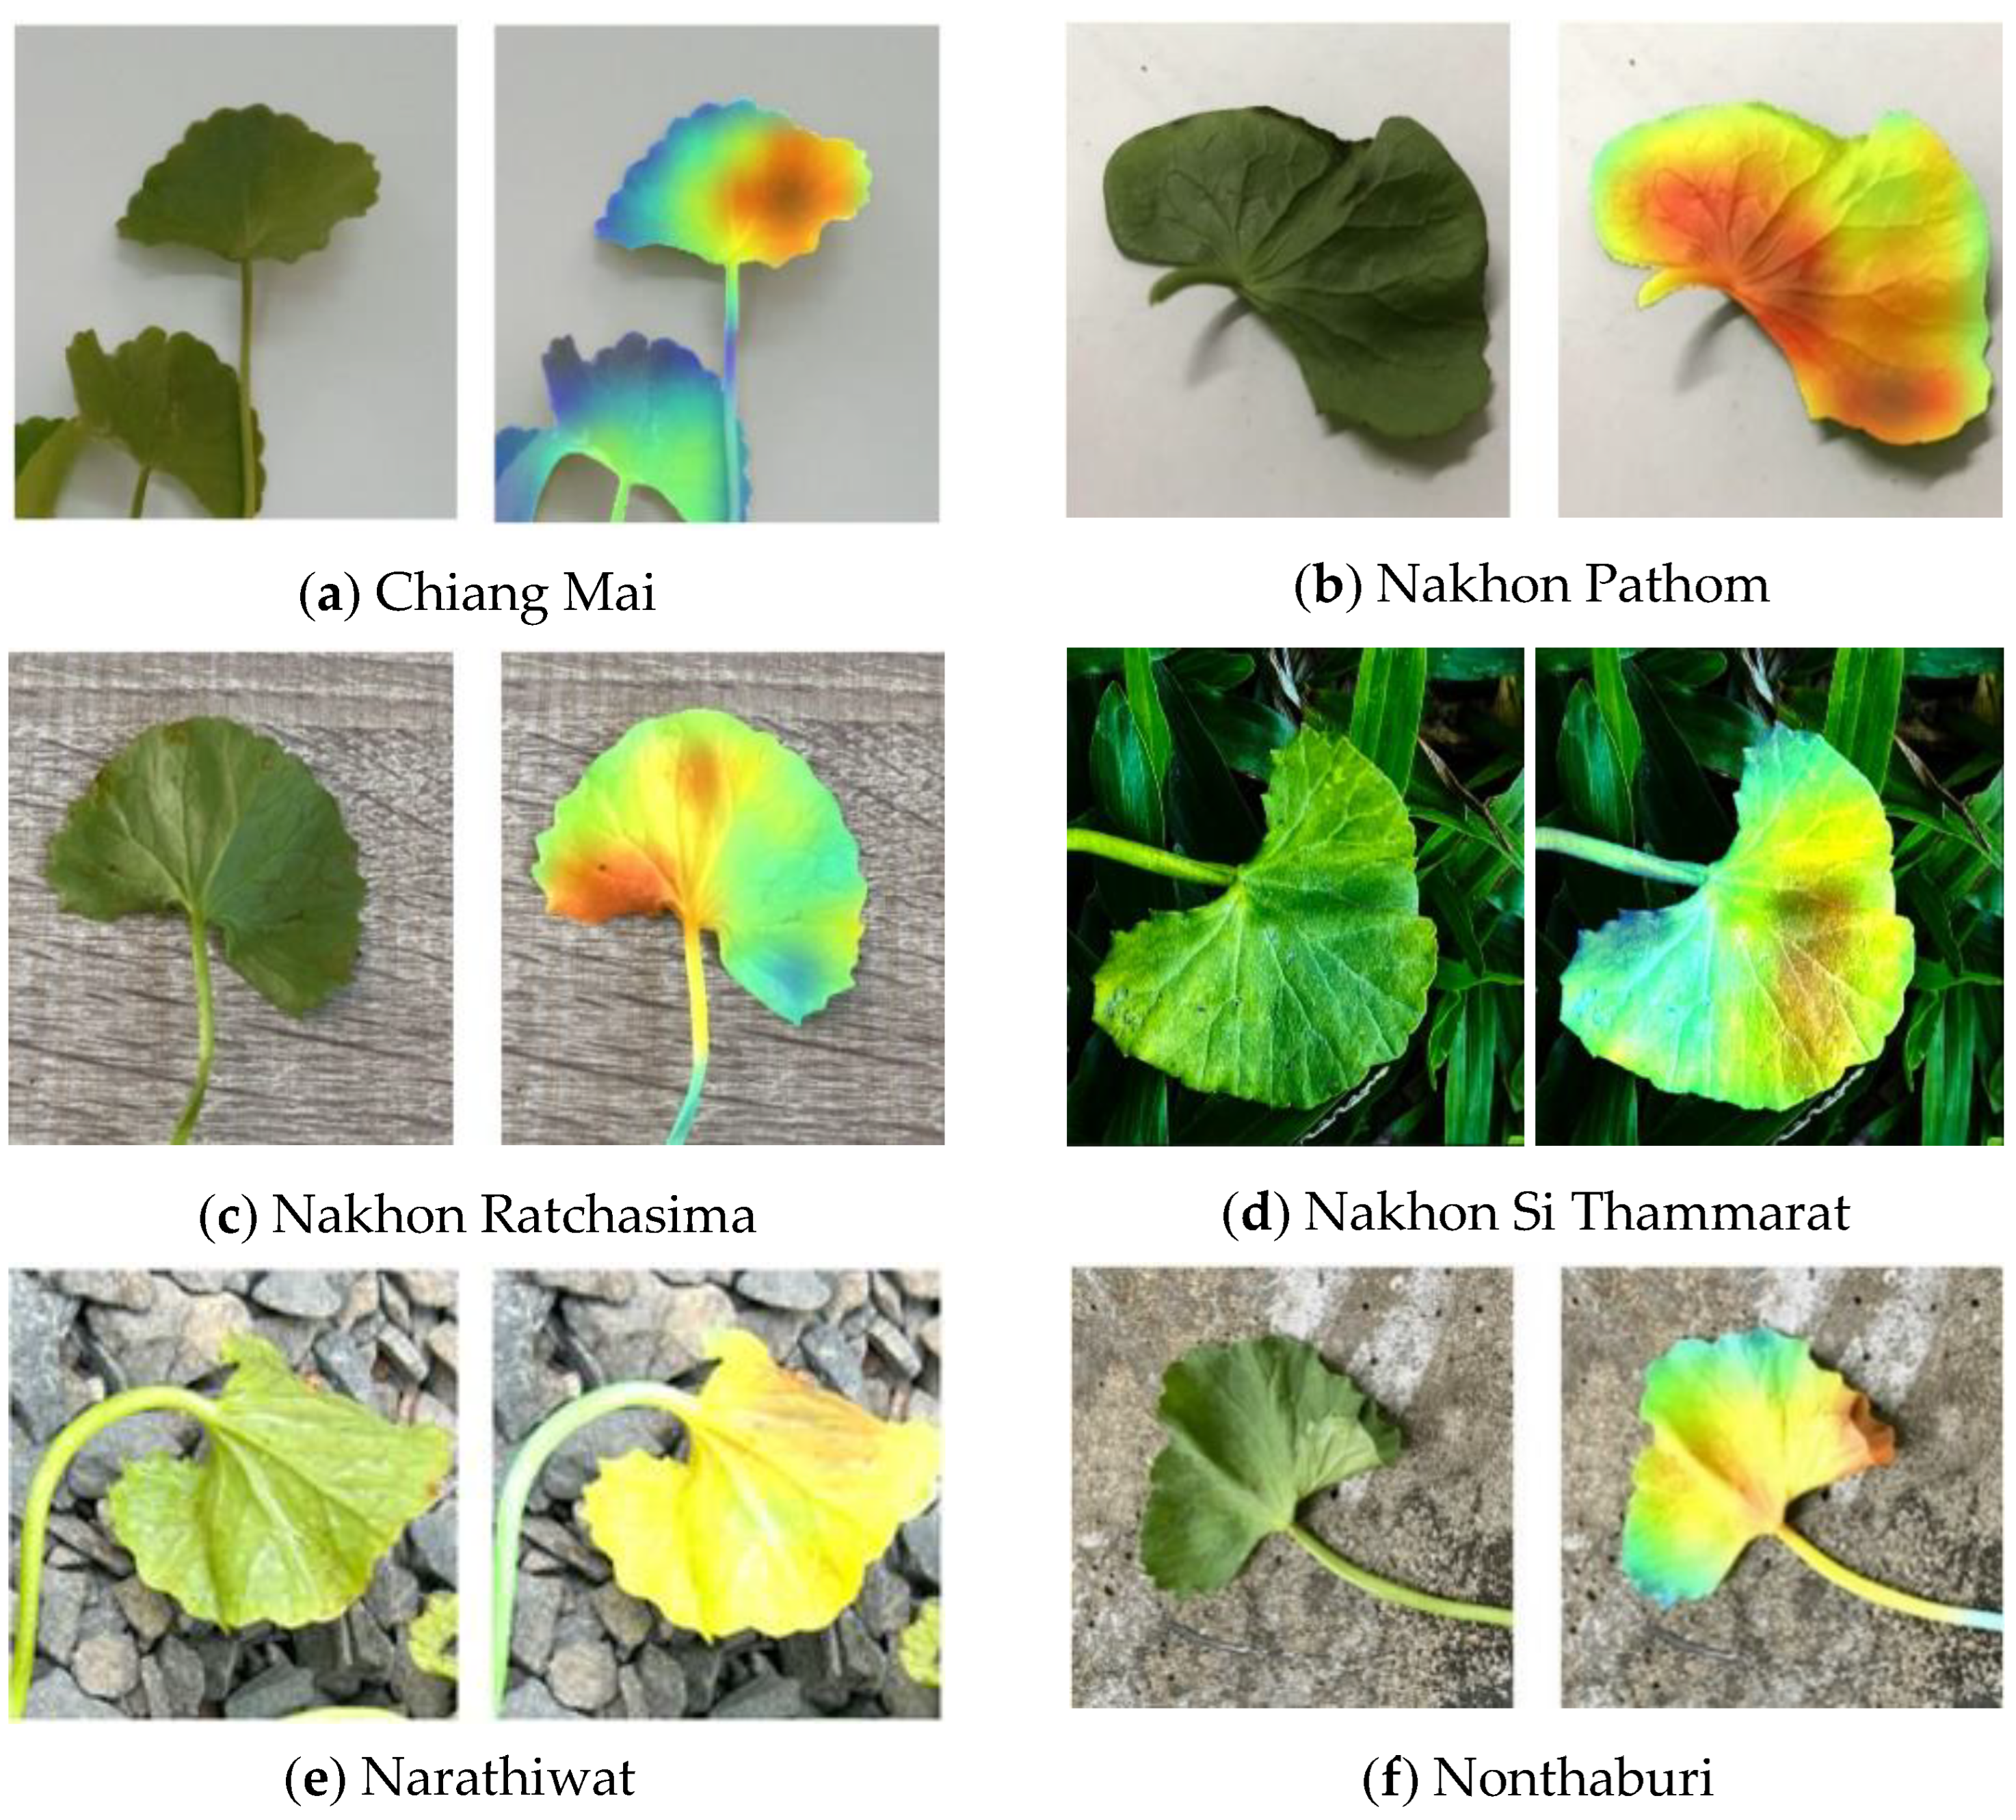
5.1. Advancements in the Automated Cultivar Differentiation of Centella asiatica (L.) Urban for Enhanced Agricultural Practices and Medicinal Product Quality Control

Studies by Novianti [17] and Raj [23] have identified variations in agronomic traits among Centella asiatica (L.) Urban (CAU) cultivars based on their growth regions, resulting in diverse shapes and attributes, potentially leading to varying essential substances. However, the expert differentiation of CAU cultivars remains challenging, with misclassification risking improper treatment cultivations and compromising the quality control of medical product production [21,22]. To address this gap, the research aims to develop an automated CAU cultivar classification system with high precision, achieving an impressive 98.41 percent accuracy.
The proposed model for automated cultivar differentiation in CAU yields highly promising results, surpassing existing methods in the literature by a significant margin [4,5,6,7]. Its efficacy and robustness are evident in the swift processing time of only 0.34 s per image, enabling the accurate identification of CAU cultivars. This expeditious and accurate classification empowers farmers to promptly adjust treatment cultivations, optimizing the plant production yield and ensuring superior essential compound yields and product quality [21,22].
The main finding of this research lies in the successful development of an automated CAU cultivar classification system with remarkable accuracy and efficiency. Precisely predicting cultivar types with 98.41 percent accuracy represents a significant advancement in plant classification. This underscores the potential of deep learning techniques, particularly the proposed ensemble of convolutional neural networks, for solving complex classification tasks in plant sciences. The application of this model can revolutionize CAU cultivar identification, leading to enhanced agricultural practices and consistent medicinal product manufacturing.
Academically, this research contributes to botanical classification and taxonomy by accurately differentiating CAU cultivars, enriching the understanding of genetic diversity and morphological characteristics within the Centella genus. Additionally, advancements in pharmacology are evident through in-depth studies of the chemical composition and pharmacological properties of different CAU species, benefiting medicinal development and herbal product formulation.
From a policy perspective, the high accuracy and efficiency of the proposed model hold immense value for pharmaceutical and agricultural industries. Quality control in medicinal product manufacturing can be greatly enhanced through precise cultivar differentiation, ensuring the consistent and high-quality production of medicinal products derived from CAU. This preserves the integrity of traditional medicine and strengthens healthcare systems. Moreover, in agriculture, the automated classification system empowers farmers to optimize plant production yields through precise cultivar identification, resulting in improved agricultural practices.
The research underscores the potential of deep learning models, such as convolutional neural networks, in addressing complex challenges in plant sciences. Policymakers in the agricultural and healthcare sectors can promote the adoption of automated systems to enhance productivity, sustainability, and quality assurance in herb production and medicinal product manufacturing. Ultimately, this research paves the way for advancements in agricultural practices and medical product quality control, presenting valuable implications for both academia and policy-making domains.

5.2. Enhancing CAU Cultivar Classification through the Parallel-AMIS-Ensemble Model: A Comparative Study

In this research, a novel approach, the parallel-AMIS-ensemble model, was proposed to handle the CAU cultivar classification system. The model incorporates two segmentation methods, U-Net and Mask-R-CNN, and four distinct CNN architectures, namely, SqueezeNet, ShuffleNetv2 1.0x, MobileNetV3, and InceptionV1, to form the ensemble CNN model. The computational results demonstrate a remarkable classification accuracy of 98.41%. Notably, the ensemble image segmentation method and the ensemble CNN architectures contributed significantly to 13.69% and 4.62% increases in accuracy, respectively.
The main finding of this study is the successful implementation of the parallel-AMIS-ensemble model for CAU cultivar classification, achieving an impressive accuracy of 98.41%. This result surpasses existing approaches in the literature, such as the VGGNet and Inception module, 3-D CNN, CNN with ConvLSTM layers, DenseNet121, SVM, and ResNet50, which exhibited accuracies ranging from 78% to 96% [25,26,27,29,31,32]. The superiority of the proposed model is evident, with a considerable 5.32% to 23.08% accuracy improvement compared to the existing methods. The use of parallel-AMIS-ensemble significantly enhances the solution quality for CAU cultivar classification, showcasing its potential for addressing complex problems in plant sciences.
The academic implications of this research lie in the advancement of automated cultivar classification using the parallel-AMIS-ensemble model. By incorporating multiple segmentation methods and CNN architectures, the proposed model represents a significant step forward in image-based plant classification tasks. This approach can be applied not only to CAU cultivar classification but also to other similar problems in plant sciences, contributing to the broader field of botanical classification and taxonomy.
From a policy perspective, the successful implementation of the parallel-AMIS-ensemble model has practical implications for the agriculture and pharmaceutical industries. In agriculture, accurate cultivar classification empowers farmers with valuable insights into plant growth and optimal treatment practices. The increased accuracy of the proposed model ensures more precise cultivation treatments, enhancing agricultural productivity and sustainable crop management.
In the pharmaceutical industry, precise cultivar classification is crucial for medicinal product manufacturing and quality control. The high accuracy of the parallel-AMIS-ensemble model ensures the consistent and reliable production of medicinal products derived from CAU, supporting the integrity of traditional medicine and enhancing healthcare systems.
This research contributes to the advancement of automated cultivar classification and highlights the potential of ensemble models in addressing complex challenges in plant sciences. Policymakers in the agricultural and healthcare sectors can leverage the insights from this research to promote the adoption of advanced technologies and automated systems, fostering productivity, sustainability, and quality assurance in herb production and medicinal product manufacturing.
The employment of large models in deep learning, particularly in the context of agricultural species classification, presents a juxtaposition of computational complexity and enhanced performance. While these models, including the Parallel-Artificial Multiple Intelligence System-Ensemble (P-AMIS-E) utilized in our study, offer superior accuracy and sophisticated capabilities, their size and complexity warrant a thorough consideration of their impact on the research.
First, large models typically require substantial computational resources for training and inference. This demand can pose challenges in terms of accessibility and feasibility, particularly in resource-constrained environments. In our study, while the P-AMIS-E model demonstrates high accuracy in classifying the Centella Asiatica Urban (CAU) cultivar, it inherently necessitates significant computational power, a factor that could limit its applicability in settings with limited technical infrastructure.
Moreover, the complexity of large models can also affect their interpretability and transparency. As these models become more intricate, understanding the rationale behind their decisions becomes increasingly challenging. This lack of transparency can be a crucial factor in fields where explainability is essential, such as in medical or pharmaceutical applications. In our research, we acknowledge this complexity and advocate for ongoing efforts to enhance the interpretability of such models without compromising their performance.
Despite these challenges, the benefits of large models in achieving high accuracy and handling complex tasks are undeniable. The P-AMIS-E model’s capability to accurately classify the CAU cultivar is a testament to the effectiveness of these models in handling nuanced and detailed tasks, which smaller models might not handle as efficiently. This effectiveness is particularly vital in the context of our research, where precision in classification directly influences the quality and efficacy of products in the cosmetics, pharmaceutical, and herbal medicine industries.
In conclusion, while the use of large models in our research offers significant advantages in terms of accuracy and capability, it is crucial to balance these benefits with considerations of computational demand, interpretability, and practical applicability. Future research directions might include optimizing these large models to reduce their computational footprint while maintaining their accuracy or developing hybrid approaches that combine the strengths of both large and smaller models.

5.3. A Comparative Study of Decision Fusion Strategies in Metaheuristic Optimization

Besides the use of ensemble image segmentation and the ensemble CNN’s architectures, one of the key successes of the P-AMIS-E is the decision fusion strategy, which is used to combine different entities together to obtain the solution for the prediction model.
In our experimental results, AMIS exhibited superior performance compared to other decision fusion strategies, including DE (Differential Evolution), GA (Genetic Algorithm), and UAW (Unweighted Average), in terms of solution quality. AMIS achieved a maximum improvement of 4.62% over the mentioned methods. This significant enhancement can be attributed to AMIS’s effective improvement method, which incorporates a diverse range of heuristics and metaheuristics. As a result, AMIS demonstrates both exploration and exploitation search behavior, enabling it to explore wider solution spaces and conduct intensive searches in specific scenarios. Additionally, AMIS incorporates a restart procedure, allowing it to escape from local optima when necessary [51,52,53].
The main finding of this research is the clear superiority of AMIS as a decision fusion strategy compared to simpler methods proposed in the literature, such as majority voting, swarm intelligences, and unweighted average [42,44,45,46]. AMIS’s comprehensive set of heuristics and metaheuristics equips it with the ability to seek better solutions effectively. Through extensive experimentation, AMIS consistently outperforms other approaches, highlighting its potential as a highly effective decision fusion strategy.
From an academic perspective, this research contributes to the advancement of decision fusion strategies, particularly with the introduction of AMIS. The integration of diverse heuristics and metaheuristics enriches the field of metaheuristic optimization, enhancing the capabilities of such strategies in tackling complex problem spaces and achieving better solutions. This study provides valuable insights for researchers and practitioners involved in optimization and computational intelligence domains.
On a policy level, the superior performance of AMIS in terms of solution quality has practical implications for various industries. The adoption of AMIS as a decision fusion strategy can lead to improved outcomes in real-world applications. Policymakers in sectors reliant on optimization processes, such as supply chain management, logistics, and resource allocation, can consider implementing AMIS to enhance decision-making processes and achieve more efficient and effective solutions.

5.4. Key Contributions of the P-AMIS-E Model

Our research makes several pivotal contributions to the field of agricultural species classification, particularly in the context of using deep learning methodologies. These contributions are multifaceted, addressing both theoretical advancements and practical applications.
Innovative Integration of Deep Learning Techniques: At the core of our contributions is the development of the Parallel-Artificial Multiple Intelligence System-Ensemble (P-AMIS-E) model. This model uniquely combines advanced image segmentation methods (U-net, Mask-R-CNN) with a variety of CNN architectures (SqueezeNet, ShuffleNetv2 1.0x, MobileNetV3, InceptionV1). This integration allows for the nuanced processing of visual data, crucial for distinguishing between species with highly similar appearances. The model’s ability to analyze subtle visual differences provides a significant leap forward from traditional classification methods.
Enhanced Accuracy and Efficiency in Classification: Our model achieves a remarkable classification accuracy of 98.41%, which is a notable improvement over existing models such as ResNet-101 and Xception, which have an accuracy of 93.74%. This heightened accuracy is crucial in fields such as pharmaceuticals, cosmetics, and herbal medicine, where the precise identification of species directly impacts product quality and efficacy.
Effective Use of Limited Data: Addressing the common challenge of data scarcity in agricultural contexts, our model efficiently utilizes image augmentation techniques. This approach allows the model to train effectively on smaller datasets, overcoming a significant barrier faced by many existing classification systems.
Adaptability and Robustness through AMIS Decision Fusion: The use of AMIS decision fusion in our model enhances its adaptability to different species and environmental conditions. This robustness is particularly advantageous for agricultural applications, where variability is a constant.
Balancing Computational Efficiency with Accuracy: We have optimized the P-AMIS-E model to ensure that it remains computationally efficient without compromising on accuracy. This optimization makes the model accessible and practical for use in various settings, including those with limited computational resources.
Theoretical and Practical Implications: Theoretically, our study advances the understanding of how deep learning techniques can be effectively applied to image classification tasks in agriculture. Practically, it offers a tool that can be directly employed in industries that rely on accurate species identification, thereby having a tangible impact on the quality of products and services in these sectors.
In summary, our research contributes to the field of agricultural species classification by providing an advanced, accurate, and adaptable model. The P-AMIS-E model represents a significant advancement in the application of deep learning techniques to real-world challenges in agriculture. These contributions are expected to have a lasting impact on both the academic study of machine learning in agriculture and its practical application in related industries.

5.5. Advantages of the Model and Research Limitations

First, the uniqueness of our approach lies in the integration of advanced deep learning techniques, specifically designed for the complex task of classifying agricultural species, like the Centella Asiatica Urban (CAU) cultivar. While classification problems in machine learning are indeed common, the challenge intensifies when dealing with highly similar species, where conventional classification models often fall short. Our method, employing the Parallel-Artificial Multiple Intelligence System-Ensemble (P-AMIS-E) model, offers a nuanced solution that is tailored to address these specific challenges.
One of the key advantages of our approach is its remarkable accuracy, which at 98.41%, is significantly higher than that achieved by traditional models such as ResNet-101 and Xception, which stand at 93.74%. This heightened accuracy is crucial in industries such as pharmaceuticals and cosmetics, where the precise identification of species has direct implications for product quality and efficacy.
Furthermore, our method demonstrates an enhanced ability to process and classify images with limited data availability, a common hurdle in agricultural classification. The use of ensemble image segmentation techniques, like U-Net and Mask R-CNN, alongside a range of CNN architectures, contributes to this improved performance. By leveraging these advanced techniques, our model effectively addresses the limitations of data scarcity often encountered in this domain.
Additionally, the incorporation of the AMIS decision fusion strategy in the P-AMIS-E model is a novel aspect of our study. This strategy synergistically combines the outputs of various deep learning models, resulting in a more robust and reliable classification system. This integrated approach is particularly beneficial in handling the variability and complexity inherent in species like the CAU cultivar.
Our research offers a sophisticated solution to a complex classification problem, characterized by high accuracy, efficiency in handling limited data scenarios, and robustness through an innovative ensemble approach. These attributes distinguish our study within the realm of classification problems, particularly in the context of agricultural species classification. We believe that these enhancements and the specific focus on CAU cultivar classification significantly contribute to both the theoretical and practical advancements in this field.
A critical examination of existing agricultural species classification models reveals several limitations that our research addresses. Traditional models often falter in differentiating species with similar visual features, leading to classification inaccuracies, particularly in closely related cultivars. Another significant challenge is the dependence on large datasets for training, which is impractical in many agricultural contexts. Additionally, the rigidity of conventional systems limits their adaptability to diverse species and environmental conditions. Lastly, the high computational demands of advanced models pose restrictions in resource-limited settings.
Our study introduces the Parallel-Artificial Multiple Intelligence System-Ensemble (P-AMIS-E) model as a solution to these prevalent issues. The P-AMIS-E model’s integration of U-net and Mask-R-CNN for image segmentation, combined with various CNN architectures, enables it to accurately classify species with closely resembling features. This model overcomes the data limitation challenge by effectively utilizing image augmentation techniques, allowing for efficient learning from limited datasets. Furthermore, the incorporation of ensemble learning and AMIS decision fusion enhances the model’s adaptability and robustness, making it versatile across different agricultural scenarios. Importantly, we have optimized the model to balance computational efficiency with accuracy, ensuring its applicability in diverse settings, including those with constrained computational resources. Through these innovations, our research not only advances the theoretical framework of deep learning in image classification tasks but also provides practical solutions to the agricultural industry’s need for precise species identification.

6. Conclusions and Outlook

In this research, we developed an innovative method for the precise differentiation and categorization of plant species, with a particular focus on herbs and plants exhibiting multiple varieties. These plant varieties possess distinct characteristics, varying quantities of essential compounds, and divergent cultivation requirements. The accurate and precise classification of plant varieties plays a pivotal role in optimizing cultivation, production planning, and quality control processes, ultimately enhancing efficiency in product development and management.
The classification of Centella Asiatica Urban (CAU) cultivars presents a formidable challenge due to the striking similarity between species and the absence of reliable visual features for differentiation. This challenge assumes paramount importance in industries such as pharmaceuticals, cosmetics, and herbal medicine, where precise species identification is vital to ensuring product quality and safety. To address this intricate task, we conducted comprehensive research aimed at developing an automated classification system grounded in deep learning techniques capable of accurately and efficiently classifying CAU species.
Our research methodology entailed the assembly of a diverse and extensive dataset comprising Centella Asiatica Urban (CAU) cultivars. Subsequently, we constructed a robust automated classification system employing the Parallel Artificial Multiple Intelligence System–Ensemble Deep Learning model (P-AMIS-E). This sophisticated model integrated ensemble image segmentation techniques, specifically U-Net and Mask-R-CNN, alongside image augmentation and an ensemble of convolutional neural network (CNN) architectures, including SqueezeNet, ShuffleNetv2 1.0x, MobileNetV3, and InceptionV1. The hallmark of our model was its utilization of the Artificial Multiple Intelligence System (AMIS) as a decision fusion strategy, significantly augmenting the accuracy and efficiency.
Our results are emblematic of the model’s remarkable performance. The P-AMIS-E model achieved an astounding accuracy rate of 98.41%, signifying a substantial advancement compared to state-of-the-art methods. Notably, existing methods such as ResNet-101, Xception, NASNet-A Mobile, and MobileNetV3-Large attained an accuracy rate of 93.74% on the testing dataset. Moreover, the P-AMIS-E model exhibited a substantial advantage when applied to an unseen dataset, yielding accuracy rates ranging from 4.45% to 31.16% higher than those achieved by the compared methods.
In summary, our research introduces a pioneering approach to the precise classification of plant species, with a particular emphasis on CAU cultivars. The integration of ensemble image segmentation techniques, image augmentation, and decision fusion within the deep learning framework has yielded remarkable improvements in accuracy and efficiency. These findings carry profound implications for the evolution of deep learning techniques in the realm of image classification. We recommend further exploration of the potential of ensemble deep learning models, coupled with continued investigations into the optimal amalgamation of image segmentation, image augmentation, and decision fusion strategies. Additionally, expanding the dataset to encompass a broader range of CAU species and exploring the potential of transfer learning to enhance the model’s performance on new species represent promising avenues for future research.

Author Contributions

K.S.: conceptualization, methodology. B.B.: validation. P.G.-D.: formal analysis, writing the original draft. S.G.: software. R.P.: supervision, writing—review and editing. T.S. and S.C.: resources. P.L.: conceptualization. S.K.: funding acquisition, conceptualization, writing—review and editing. All authors have read and agreed to the published version of the manuscript.

Funding

This research project was financially supported by Mahasarakham University.

Data Availability Statement

Data will be made available on request.

Conflicts of Interest

The authors declare no conflicts of interest.

References

  1. Susanti, D.; Safrina, D.; Wijaya, N.R. Weed’s Vegetation Analysis of Centella (Centella asiatica L. Urban) Plantations. Caraka Tani J. Sustain. Agric. 2021, 36, 110. [Google Scholar] [CrossRef]
  2. Jamil, S.S.; Nizami, Q.; Salam, M. Centella asiatica (Linn.) Urban—A Review. CSIR 2007, 6, 158–170. [Google Scholar]
  3. Prabavathi, S.; Kanmani, P. Plant Leaf Disease Detection and Classification Using Optimized CNN Model. IJRTE 2021, 9, 233–238. [Google Scholar] [CrossRef]
  4. Yang, M.-M.; Nayeem, A.; Shen, L.-L. Plant Classification Based on Stacked Autoencoder. In Proceedings of the 2017 IEEE 2nd Information Technology, Networking, Electronic and Automation Control Conference (ITNEC), Chengdu, China, 15–17 December 2017; IEEE: Piscataway, NJ, USA, 2017; pp. 1082–1086. [Google Scholar]
  5. Chen, J.; Yin, H.; Zhang, D. A Self-Adaptive Classification Method for Plant Disease Detection Using GMDH-Logistic Model. Sustain. Comput. Inform. Syst. 2020, 28, 100415. [Google Scholar] [CrossRef]
  6. Pacifico, L.D.S.; Macario, V.; Oliveira, J.F.L. Plant Classification Using Artificial Neural Networks. In Proceedings of the 2018 International Joint Conference on Neural Networks (IJCNN), Rio de Janeiro, Brazil, 8–13 July 2018; IEEE: Piscataway, NJ, USA, 2018; pp. 1–6. [Google Scholar]
  7. Britto, L.F.S.; Pacifico, L.D.S. Plant Classification Using Weighted K-NN Variants. In Proceedings of the Anais do XV Encontro Nacional de Inteligência Artificial e Computacional (ENIAC 2018), São Paulo, Brazil, 22–25 October 2018; Sociedade Brasileira de Computação—SBC: Porto Alegre, Brazil, 2018; pp. 58–69. [Google Scholar]
  8. Pitakaso, R.; Nanthasamroeng, N.; Srichok, T.; Khonjun, S.; Weerayuth, N.; Kotmongkol, T.; Pornprasert, P.; Pranet, K. A Novel Artificial Multiple Intelligence System (AMIS) for Agricultural Product Transborder Logistics Network Design in the Greater Mekong Subregion (GMS). Computation 2022, 10, 126. [Google Scholar] [CrossRef]
  9. Chandrika, U.G.; Prasad Kumara, P.A.A.S. Chapter Four—Gotu Kola (Centella asiatica): Nutritional Properties and Plausible Health Benefits. Adv. Food Nutr. Res. 2015, 76, 125–157. [Google Scholar] [CrossRef]
  10. Shin, H.Y.; Kim, H.; Jung, S.; Jeong, E.-J.; Lee, K.-H.; Bae, Y.-J.; Suh, H.J.; Jang, K.-I.; Yu, K.-W. Interrelationship Between Secondary Metabolites and Antioxidant Capacities of Centella asiatica Using Bivariate and Multivariate Correlation Analyses. Appl. Biol. Chem. 2021, 64, 82. [Google Scholar] [CrossRef]
  11. Sudhakaran, M.V. Botanical Pharmacognosy of Centella asiatica (Linn.) Urban. Pharmacogn. J. 2017, 9, 546–558. [Google Scholar] [CrossRef]
  12. Prasad, A.; Mathur, A.; Mathur, A. Advances and Emerging Research Trends for Modulation of Centelloside Biosynthesis in Centella asiatica (L.) Urban—A Review. Ind. Crops Prod. 2019, 141, 111768. [Google Scholar] [CrossRef]
  13. Thong-on, W.; Arimatsu, P.; Pitiporn, S.; Soonthornchareonnon, N.; Prathanturarug, S. Field Evaluation of in Vitro-Induced Tetraploid and Diploid Centella asiatica (L.) Urban. J. Nat. Med. 2014, 68, 267–273. [Google Scholar] [CrossRef] [PubMed]
  14. Devkota, A.; Jha, P.K. Phenotypic Plasticity of Centella asiatica (L.) Urb. Growing in Different Habitats of Nepal. Trop. Plant Res. 2019, 6, 1–7. [Google Scholar] [CrossRef]
  15. Patel, D. Growth Pattern Study on Centella asiatica (L.) Urban in Herbal Garden. Int. J. Herb. Med. 2015, 3, 9–12. [Google Scholar]
  16. Biswas, D.; Mandal, S.; Chatterjee Saha, S.; Tudu, C.K.; Nandy, S.; Batiha, G.E.; Shekhawat, M.S.; Pandey, D.K.; Dey, A. Ethnobotany, Phytochemistry, Pharmacology, and Toxicity of Centella asiatica (L.) Urban: A Comprehensive Review. Phytother. Res. 2021, 35, 6624–6654. [Google Scholar] [CrossRef]
  17. Novianti, C.; Purbaningsih, S.; Salamah, A. The Effect of Different Pericarp Color on Seed Germination of Centella asiatica (L.) Urban. AIP Conf. Proc. 2016, 1729, 020064. [Google Scholar]
  18. Alqahtani, A.; Cho, J.-L.; Wong, K.H.; Li, K.M.; Razmovski-Naumovski, V.; Li, G.Q. Differentiation of Three Centella Species in Australia as Inferred from Morphological Characteristics, ISSR Molecular Fingerprinting and Phytochemical Composition. Front. Plant Sci. 2017, 8, 1980. [Google Scholar] [CrossRef]
  19. Singh, J.; Singh Sangwan, R.; Gupta, S.; Saxena, S.; Sangwan, N.S. Profiling of Triterpenoid Saponin Content Variation in Different Chemotypic Accessions of Centella asiatica L. Plant Genet. Resour. 2015, 13, 176–179. [Google Scholar] [CrossRef]
  20. Chen, Y.; Zhang, D.; Zhang, H.; Wang, Q.-G. Dual-Path Mixed-Domain Residual Threshold Networks for Bearing Fault Diagnosis. IEEE Trans. Ind. Electron. 2022, 69, 13462–13472. [Google Scholar] [CrossRef]
  21. Azizi, M.M.F.; Lau, H.Y.; Abu-Bakar, N. Integration of Advanced Technologies for Plant Variety and Cultivar Identification. J. Biosci. 2021, 46, 91. [Google Scholar] [CrossRef]
  22. Legner, N.; Meinen, C.; Rauber, R. Root Differentiation of Agricultural Plant Cultivars and Proveniences Using FTIR Spectroscopy. Front. Plant Sci. 2018, 9, 748. [Google Scholar] [CrossRef]
  23. Raj, T.L.; Vanila, D.; Ganthi, S. Comparative Pharmacognostical Studies on Genuine, Commercial and Adulterant Samples of Centella asiatica (L.) Urban. Res. Rev. J. Pharmacol. 2013, 3, 6–9. [Google Scholar]
  24. Srivastava, S.; Verma, S.; Gupta, A.; Rajan, S.; Rawat, A. Studies on Chemotypic Variation in Centella asiatica (L.) Urban from Nilgiri Range of India. J. Planar Chromatogr. Mod. TLC 2014, 27, 454–459. [Google Scholar] [CrossRef]
  25. Bhargavi, D.; Narayana, C.L.; Ramana, K.V. Plant Disease Identification by Using Deep Learning Models. J. Emerg. Technol. Innov. Res. 2021, 8, b150–b157. [Google Scholar]
  26. Smetanin, A.; Uzhinskiy, A.; Ososkov, G.; Goncharov, P.; Nechaevskiy, A. Deep Learning Methods for the Plant Disease Detection Platform. AIP Conf. Proc. 2021, 2377, 060006. [Google Scholar]
  27. Barbedo, J.G.A. Deep Learning Applied to Plant Pathology: The Problem of Data Representativeness. Trop. Plant Pathol. 2021, 47, 85–94. [Google Scholar] [CrossRef]
  28. Khan, E.; Rehman, M.Z.U.; Ahmed, F.; Khan, M.A. Classification of Diseases in Citrus Fruits Using SqueezeNet. In Proceedings of the 2021 International Conference on Applied and Engineering Mathematics (ICAEM), Taxila, Pakistan, 30–31 August 2021; IEEE: Piscataway, NJ, USA, 2021; pp. 67–72. [Google Scholar]
  29. Ran, H.; Wen, S.; Wang, S.; Cao, Y.; Zhou, P.; Huang, T. Memristor-Based Edge Computing of ShuffleNetV2 for Image Classification. IEEE Trans. Comput.-Aided Des. Integr. Circuits Syst. 2021, 40, 1701–1710. [Google Scholar] [CrossRef]
  30. Imanov, E.; Alzouhbi, A.K. Machine Learning Comparative Analysis for Plant Classification. In Proceedings of the 13th International Conference on Theory and Application of Fuzzy Systems and Soft Computing—ICAFS-2018, Warsaw, Poland, 27–28 August 2018; Aliev, R.A., Kacprzyk, J., Pedrycz, W., Jamshidi, M., Sadikoglu, F.M., Eds.; Springer International Publishing: Cham, Switzerland, 2019; Volume 896, pp. 586–593. [Google Scholar]
  31. Nandyal, S.; Patil, B.; Pattanshetty, A. Plant Classification Using SVM Classifier. In Proceedings of the Third International Conference on Computational Intelligence and Information Technology (CIIT 2013), Mumbai, India, 18–19 October 2013; Institution of Engineering and Technology: Stevenage, UK, 2013; pp. 519–523. [Google Scholar]
  32. Xu, Z.; Hu, J.; Zheng, K.; Yan, L.; Wang, C.; Zhou, X. Fusion Shuffle Light Detector. In Proceedings of the 2021 16th International Conference on Computer Science & Education (ICCSE), Lancaster, UK, 17–21 August 2021; IEEE: Piscataway, NJ, USA, 2021; pp. 718–721. [Google Scholar]
  33. Liu, Y.; Li, Z.; Chen, X.; Gong, G.; Lu, H. Improving the Accuracy of SqueezeNet with Negligible Extra Computational Cost. In Proceedings of the 2020 International Conference on High Performance Big Data and Intelligent Systems (HPBD&IS), Shenzhen, China, 23 May 2020; IEEE: Piscataway, NJ, USA, 2022; pp. 1–6. [Google Scholar]
  34. Karol, M.J. Optical Interconnection Using ShuffleNet Multihop Networks in Multi-Connected Ring Topologies. In Proceedings of the Symposium proceedings on Communications Architectures and Protocols, Stanford, CA, USA, 16–18 August 1988; ACM: New York, NY, USA, 1988; pp. 25–34. [Google Scholar]
  35. Yang, M.; Ma, T.; Tian, Q.; Tian, Y.; Al-Dhelaan, A.; Al-Dhelaan, M. Aggregated Squeeze-and-Excitation Transformations for Densely Connected Convolutional Networks. Vis. Comput. 2022, 38, 2661–2674. [Google Scholar] [CrossRef]
  36. Keh, S.S. Semi-Supervised Noisy Student Pre-Training on EfficientNet Architectures for Plant Pathology Classification. arXiv 2020, arXiv:2012.00332. [Google Scholar]
  37. Khanramaki, M.; Askari Asli-Ardeh, E.; Kozegar, E. Citrus Pests Classification Using an Ensemble of Deep Learning Models. Comput. Electron. Agric. 2021, 186, 106192. [Google Scholar] [CrossRef]
  38. Mokeev, V. An Ensemble of Learning Machine Models for Plant Recognition. In Proceedings of the Analysis of Images, Social Networks and Texts, Kazan, Russia, 17–19 July 2019; Van Der Aalst, W.M.P., Batagelj, V., Ignatov, D.I., Khachay, M., Kuskova, V., Kutuzov, A., Kuznetsov, S.O., Lomazova, I.A., Loukachevitch, N., Napoli, A., et al., Eds.; Springer International Publishing: Cham, Switzerland, 2020; Volume 1086, pp. 256–262. [Google Scholar]
  39. Vallabhajosyula, S.; Sistla, V.; Kolli, V.K.K. Transfer Learning-Based Deep Ensemble Neural Network for Plant Leaf Disease Detection. J. Plant Dis. Prot. 2022, 129, 545–558. [Google Scholar] [CrossRef]
  40. Fountsop, A.N.; Ebongue Kedieng Fendji, J.L.; Atemkeng, M. Deep Learning Models Compression for Agricultural Plants. Appl. Sci. 2020, 10, 6866. [Google Scholar] [CrossRef]
  41. Javaid, A.; Gurmet, R.; Sharma, N. Centella asiatica (L.) Urban: A Predominantly Self-Pollinated Herbal Perennial Plant of Family Apiaceae. Vegetos Int. J. Plant Res. Biotechnol. 2018, 31, 53. [Google Scholar] [CrossRef]
  42. Ganaie, M.A.; Hu, M.; Tanveer, M.; Suganthan, P.N. Ensemble Deep Learning: A Review. Eng. Appl. Artif. Intell. 2022, 115, 105151. [Google Scholar] [CrossRef]
  43. Chan, P.P.K.; Xiao, M.; Qin, X.; Kees, N. Dynamic Fusion for Ensemble of Deep Q-Network. Int. J. Mach. Learn. Cybern. 2021, 12, 1031–1040. [Google Scholar] [CrossRef]
  44. Gumaei, A.; Ismail, W.N.; Rafiul Hassan, M.; Hassan, M.M.; Mohamed, E.; Alelaiwi, A.; Fortino, G. A Decision-Level Fusion Method for COVID-19 Patient Health Prediction. Big Data Res. 2022, 27, 100287. [Google Scholar] [CrossRef]
  45. Xu, J.; Li, L.; Ji, M. Ensemble Learning Based Multi-Source Information Fusion. In Proceedings of the 2019 International Conference on Image and Video Processing, and Artificial Intelligence, Shanghai, China, 23–25 November 2019; Su, R., Ed.; SPIE: Bellingham, WA, USA, 2019; p. 81. [Google Scholar]
  46. Mohammed, A.; Kora, R. An Effective Ensemble Deep Learning Framework for Text Classification. J. King Saud Univ. Comput. Inf. Sci. 2022, 34, 8825–8837. [Google Scholar] [CrossRef]
  47. Mohammadi, A.; Shaverizade, A. Ensemble Deep Learning for Aspect-Based Sentiment Analysis. IJNAA 2021, 12, 29–38. [Google Scholar] [CrossRef]
  48. Salal, Y.K.; Abdullaev, S.M. Deep Learning Based Ensemble Approach to Predict Student Academic Performance: Case Study. In Proceedings of the 2020 3rd International Conference on Intelligent Sustainable Systems (ICISS), Thoothukudi, India, 3–5 December 2020; IEEE: Piscataway, NJ, USA, 2020; pp. 191–198. [Google Scholar]
  49. Abd Elaziz, M.; Dahou, A.; Abualigah, L.; Yu, L.; Alshinwan, M.; Khasawneh, A.M.; Lu, S. Advanced Metaheuristic Optimization Techniques in Applications of Deep Neural Networks: A Review. Neural Comput. Appl. 2021, 33, 14079–14099. [Google Scholar] [CrossRef]
  50. Muhammad Usman, S.; Khalid, S.; Bashir, S. A Deep Learning Based Ensemble Learning Method for Epileptic Seizure Prediction. Comput. Biol. Med. 2021, 136, 104710. [Google Scholar] [CrossRef]
  51. Prasitpuriprecha, C.; Jantama, S.S.; Preeprem, T.; Pitakaso, R.; Srichok, T.; Khonjun, S.; Weerayuth, N.; Gonwirat, S.; Enkvetchakul, P.; Kaewta, C.; et al. Drug-Resistant Tuberculosis Treatment Recommendation, and Multi-Class Tuberculosis Detection and Classification Using Ensemble Deep Learning-Based System. Pharmaceuticals 2022, 16, 13. [Google Scholar] [CrossRef]
  52. Prasitpuriprecha, C.; Pitakaso, R.; Gonwirat, S.; Enkvetchakul, P.; Preeprem, T.; Jantama, S.S.; Kaewta, C.; Weerayuth, N.; Srichok, T.; Khonjun, S.; et al. Embedded AMIS-Deep Learning with Dialog-Based Object Query System for Multi-Class Tuberculosis Drug Response Classification. Diagnostics 2022, 12, 2980. [Google Scholar] [CrossRef]
  53. Sethanan, K.; Pitakaso, R.; Srichok, T.; Khonjun, S.; Thannipat, P.; Wanram, S.; Boonmee, C.; Gonwirat, S.; Enkvetchakul, P.; Kaewta, C. Double AMIS-Ensemble Deep Learning for Skin Cancer Classification Expert Systems with Applications. Expert Syst. Appl. 2023, 234, 121047. [Google Scholar] [CrossRef]
  54. Alomar, K.; Aysel, H.I.; Cai, X. Data Augmentation in Classification and Segmentation: A Survey and New Strategies. J. Imaging 2023, 9, 46. [Google Scholar] [CrossRef] [PubMed]
  55. Altalak, M.; Ammad Uddin, M.; Alajmi, A.; Rizg, A. Smart Agriculture Applications Using Deep Learning Technologies: A Survey. Appl. Sci. 2022, 12, 5919. [Google Scholar] [CrossRef]
  56. Yang, M.; Ding, S. Algorithm for Appearance Simulation of Plant Diseases Based on Symptom Classification. Front. Plant Sci. 2022, 13, 935157. [Google Scholar] [CrossRef] [PubMed]
  57. Ronneberger, O.; Fischer, P.; Brox, T. U-Net: Convolutional Networks for Biomedical Image Segmentation. In Proceedings of the Medical Image Computing and Computer-Assisted Intervention–MICCAI 2015: 18th International Conference, Munich, Germany, 5–9 October 2015; pp. 234–241. [Google Scholar]
  58. Zhang, S.; Zhang, C. Modified U-Net for Plant Diseased Leaf Image Segmentation. Comput. Electron. Agric. 2023, 204, 107511. [Google Scholar] [CrossRef]
  59. He, K.; Gkioxari, G.; Dollar, P.; Girshick, R. Mask R-CNN. In Proceedings of the 2017 IEEE International Conference on Computer Vision (ICCV), Venice, Italy, 22–29 October 2017; IEEE: Piscataway, NJ, USA, 2017; pp. 2980–2988. [Google Scholar]
  60. Mu, X.; He, L.; Heinemann, P.; Schupp, J.; Karkee, M. Mask R-CNN Based Apple Flower Detection and King Flower Identification for Precision Pollination. Smart Agric. Technol. 2023, 4, 100151. [Google Scholar] [CrossRef]
  61. Li, M.; He, L.; Lei, C.; Gong, Y. Fine-Grained Image Classification Model Based on Improved SqueezeNet. In Proceedings of the 2021 IEEE 5th Advanced Information Technology, Electronic and Automation Control Conference (IAEAC), Chongqing, China, 12–14 March 2021; IEEE: Piscataway, NJ, USA, 2021; pp. 393–399. [Google Scholar]
  62. Ghosh, S.; Mondal, M.J.; Sen, S.; Chatterjee, S.; Kar Roy, N.; Patnaik, S. A Novel Approach to Detect and Classify Fruits Using ShuffleNet V2. In Proceedings of the 2020 IEEE Applied Signal Processing Conference (ASPCON), Kolkata, India, 7–9 October 2020; IEEE: Piscataway, NJ, USA, 2020; pp. 163–167. [Google Scholar]
  63. Ozsariyildiz, S.; Tolman, F. First Experiences with an Inception Support Modeller for the Building and Construction Industry. In Proceedings of the Eighth International Conference on Durability of Building Materials and Components, Vancouver, BC, Canada, 30 May–3 June 1999; pp. 2234–2245. [Google Scholar]
  64. Hussain, A.; Barua, B.; Osman, A.; Abozariba, R.; Asyhari, A.T. Performance of MobileNetV3 Transfer Learning on Handheld Device-Based Real-Time Tree Species Identification. In Proceedings of the 2021 26th International Conference on Automation and Computing (ICAC), Portsmouth, UK, 2–4 September 2021; IEEE: Piscataway, NJ, USA, 2021; pp. 1–6. [Google Scholar]
  65. Ghosal, P.; Nandanwar, L.; Kanchan, S.; Bhadra, A.; Chakraborty, J.; Nandi, D. Brain Tumor Classification Using ResNet-101 Based Squeeze and Excitation Deep Neural Network. In Proceedings of the 2019 Second International Conference on Advanced Computational and Communication Paradigms (ICACCP), Gangtok, India, 25–28 February 2019; IEEE: Piscataway, NJ, USA, 2019; pp. 1–6. [Google Scholar]
  66. Zhang, Y.; Liao, J.; Ran, M.; Li, X.; Wang, S.; Liu, L. ST-Xception: A Depthwise Separable Convolution Network for Military Sign Language Recognition. In Proceedings of the 2020 IEEE International Conference on Systems, Man, and Cybernetics (SMC), Toronto, ON, Canada, 11–14 October 2020; IEEE: Piscataway, NJ, USA, 2020; pp. 3200–3205. [Google Scholar]
  67. Cakmak, M.; Tenekeci, M.E. Melanoma Detection from Dermoscopy Images Using Nasnet Mobile with Transfer Learning. In Proceedings of the 2021 29th Signal Processing and Communications Applications Conference (SIU), Istanbul, Turkey, 9–11 June 2021; IEEE: Piscataway, NJ, USA, 2021; pp. 1–4. [Google Scholar]
  68. Kabanikhin, S.; Krivorotko, O.; Bektemessov, Z.; Bektemessov, M.; Zhang, S. Differential Evolution Algorithm of Solving an Inverse Problem for the Spatial Solow Mathematical Model. J. Inverse Ill-Posed Probl. 2020, 28, 761–774. [Google Scholar] [CrossRef]
  69. Yang, S.; Collings, P.J. The Genetic Algorithm: Using Biology to Compute Liquid Crystal Director Configurations. Crystals 2020, 10, 1041. [Google Scholar] [CrossRef]
  70. Fu, X.; Ma, Q.; Yang, F.; Zhang, C.; Zhao, X.; Chang, F.; Han, L. Crop Pest Image Recognition Based on the Improved ViT Method. Inf. Process. Agric. 2023, in press. [CrossRef]
Figure 1. Example of all types of Centella asiatica (L.) urban from both datasets.
Mathematics 12 00351 g001
Figure 2. Workflow diagram of the proposed method.
Mathematics 12 00351 g002
Figure 3. AMIS-ensemble segmentation.
Mathematics 12 00351 g003
Figure 4. Proposed ensemble architecture.
Mathematics 12 00351 g004
Figure 5. Framework of P-AMIS-E.
Mathematics 12 00351 g005
Figure 6. Experimental design framework.
Mathematics 12 00351 g006
Figure 7. Confusion matrices for the classification of agricultural cultivars across various regions in Thailand using the models CALU-1 (a) and CALU-2 (b). The horizontal axis represents the predicted classifications, and the vertical axis represents the actual classifications, with the regions denoted by the following abbreviations: CM (Chiang Mai), NP (Nakhon Pathom), NR (Nakhon Ratchasima), NS (Nakhon Si Thammarat), NT (Narathiwat), NB (Nonthaburi), PB (Prachin Buri), RB (Ratchaburi), SK (Songkhla), and UB (Ubon Ratchathani). The number within each cell reflects the count of predictions made by the respective model for each actual-predicted pair, with the main diagonal showing the number of correct predictions per region.
Mathematics 12 00351 g007
Figure 8. The Heatmap GradCam of leaf classification employing the proposed model.
Mathematics 12 00351 g008aMathematics 12 00351 g008b
Table 1. Detail of the datasets in CALU-1 and CALU-2.
CALU-1CALU-2
CMNPNRNSNTNBPBRBSKUBCMNPNRNSNTNBPBRBSKUB
Training set1005108910001000100710001056105610901000----------
Testing set504504500500505570506594539500500502500541528500575594568500
Total1509159315001500151215701562165016291500500502500541528500575594568500
Note: Chiang Mai: (CM), Nakhon Pathom: (NP), Nakhon Ratchasima: (NR), Nakhon Si Thammarat: (NS), Narathiwat: (NT), Nonthaburi: (NB), Prachin Buri: (PB), Ratchaburi: (RB), Songkhla: (SK), Ubon Ratchathani; (UB).
Table 2. List of the proposed method’s details.
MethodsNumber of CNNsHomogenous (Ho)/Heterogenous (He)/
Single Model (Single)
Total Size
ResNet-101 [65]1Single102
Xception [66]1Single88
NASNet-A Mobile [67]1Single84
MobileNetV3-Large [64]1Single113
SqueezeNet [61]16Homogenous80
ShuffleNetv2 1.0x [62]14Homogenous84
MobileNetV3 [64]14Homogenous84
InceptionV1 [63]4Homogenous80
Proposed Methods11Heterogenous77
Table 3. Model parameter configurations.
CNN HyperparametersMetaheuristics (GA, DE, and AMIS) Hyperparameters
Number of CNN epochs of a single model100 Number   of   populations   ( N W P )100
Number of CNN epochs in an ensemble30 Number   of   iterations   ( G )100
CNN optimizerAdam Crossover   rate   of   DE   and   AMIS   ( C R )0.3
Learning rate0.0001Mutation rate of DE 0.07
Batch size32 First   Scaling   Factor   of   DE   ( F )   and   AMIS   ( F 1 )1.67
Image size331 × 331 Sec ond   Scaling   Factor   of   AMIS   ( F 2 )1.2
Table 4. The design of an experiment to reveal the best combination of the model’s elements.
No.SegmentationAugmentationDecision Fusion Strategies
No
Segmentation
Mask
R-CNN
U-NetEnsemble
Segmentation
No
Augmentation
With
Augmentation
AMISDEGAUWA
1-------
2-------
3------
4-------
5-------
6-------
7-------
8-------
9-------
10-------
11-------
12-------
13-------
14-------
15-------
16-------
17-------
18-------
19-------
20-------
21-------
22-------
23------
24-------
25-------
26-------
27-------
28-------
29-------
30-------
31-------
32-------
Table 5. Result of the tested run for CALU-1.
No.AccuracyPrecisionRecallF1-ScoreAUC
182.1482.4082.4082.8182.15
282.7981.6481.6181.9680.88
381.7581.3380.3580.2180.43
479.2979.6579.5779.5779.45
583.2583.4283.7083.6983.22
684.5983.6883.7184.5284.65
782.1682.1782.3583.6883.23
880.4880.1480.1080.9580.45
985.8885.2585.9785.4885.82
1083.5583.7583.5283.4383.97
1182.5181.5682.7382.7382.76
1283.7880.1883.6483.4782.31
1386.1484.4086.4086.8186.15
1484.7984.6484.6184.9684.88
1581.7581.3380.3580.2181.43
1682.2981.6581.5798.5781.45
1788.2588.4288.7088.6988.22
1885.5985.6885.7185.5285.65
1984.1684.1784.3584.6885.23
2083.4883.1483.1083.9583.45
2189.8889.2589.9789.4889.82
2287.5587.7587.5287.4387.97
2386.5186.5686.7386.7386.76
2484.7884.1884.6484.4784.31
2593.1493.4093.4093.8193.15
2690.7990.6490.6190.9690.88
2790.3590.3390.3590.2189.43
2888.2988.6588.5788.5788.45
2998.5498.5798.7198.8398.95
3096.9196.6296.4896.5296.21
3194.1694.1794.3594.6895.15
3292.4892.1492.1092.9592.42
Table 6. Conclusion of the benefit of using different elements of the proposed methods.
No.SegmentationAugmentationDecision Fusion Strategies
No
Segmentation
Mask
R-CNN
U-NetEnsembleNo
Augmentation
With AugmentationAMISDEGAUWA
Accuracy82.0683.8486.2893.0885.3687.2788.4087.0785.4284.36
Precision81.8082.8586.1493.0785.0186.9288.1486.8085.2083.72
Recall81.7283.6086.3493.0785.2987.0888.6586.7285.2084.16
F1-score82.1785.7186.3793.3285.3888.4188.7086.9185.3986.56
AUC81.8183.6086.4393.0885.1487.3288.4486.8985.5584.04
Table 7. Comparative performance analysis of diverse methodologies on the CALU-1 dataset.
MethodsAccuracyPrecisionRecallF1-ScoreAUC
ViT [70]91.3289.1990.4890.8591.52
ResNet-101 [65]88.3884.1986.2987.4289.01
Xception [66]89.2788.4089.8988.7290.29
NASNet-A Mobile [67]91.6391.8389.7490.2191.96
MobileNetV3-Large [64]92.5192.1790.9791.3591.38
SqueezeNet [61]93.2193.3794.1393.7394.41
ShuffleNetv2 1.0x [62]94.3693.7394.0994.2794.83
MobileNetV3 [64]94.7293.9694.6494.9395.97
InceptionV1 [63]95.0594.1894.7995.4895.99
Proposed Methods98.4197.8297.9999.6198.39
Table 8. Result of the classification model using CALU-2.
MethodsNumber of
CNNs
Homogenous (Ho)/Heterogenous (He)/
Single Model (Single)
Total
Size
Training Time (Minutes)Testing Time
(Second/
Image)
AccuracyPrecisionRecallF1-ScoreAUC
ViT [70]1Single --90.2489.5388.4889.0190.45
ResNet-101 [65]1Single10262.480.8388.784.685.887.989.5
Xception [66]1Single8847.590.4890.188.190.788.889.7
NASNet-A Mobile [67]1Single8445.320.4992.692.189.889.791.8
MobileNetV3-Large [64]1Single11367.551.3492.692.690.891.491.7
SqueezeNet [61]1Single55.440.1076.275.975.575.876.9
ShuffleNetv2 1.0x [62]1Single65.980.1276.876.876.277.177.3
MobileNetV3 [64]1Single66.010.1375.174.875.674.975.6
InceptionV1 [63]1Single2015.70.2079.478.979.279.179.8
SqueezeNet [61]16Homogenous8039.030.4492.893.694.193.593.9
ShuffleNetv2 1.0x [62]14Homogenous8444.190.4894.293.994.194.694.8
MobileNetV3 [64]14Homogenous8443.950.4794.194.795.395.395.5
InceptionV1 [63]4Homogenous8037.580.4494.394.895.595.695.7
Proposed Methods11Heterogenous7734.590.3498.597.597.499.097.7
Table 9. K-fold validation result using three and five as the k of the datasets CALU-1 and CALU-2.
CALU-1
3-cv5-cv
MethodsAccuracyPrecisionRecallF1-ScoreAUCAccuracyPrecisionRecallF1-ScoreAUC
ViT [70]91.19 ± 1.5789.01 ± 2.3990.13 ± 0.9991.04 ± 1.2392.02 ± 1.6191.32 ± 1.2489.19 ± 1.4590.48 ± 1.0290.85 ± 1.2491.52 ± 2.49
ResNet-101 [65]81.49 ± 2.7383.04 ± 1.9683.73 ± 1.8486.24 ± 2.4088.18 ± 1.4482.38 ± 2.1883.99 ± 2.3984.59 ± 2.5786.53 ± 1.7788.41 ± 0.85
Xception [66]82.95 ± 1.0586.39 ± 1.8387.39 ± 1.6887.19 ± 2.1989.22 ± 1.0582.27 ± 1.4787.18 ± 2.3188.45 ± 1.4987.69 ± 1.8489.37 ± 0.34
NASNet-A Mobile [67]87.83 ± 1.8689.15 ± 2.1788.12 ± 1.0688.05 ± 1.8389.29 ± 1.8288.33 ± 1.4990.42 ± 2.0988.38 ± 1.3588.78 ± 1.4889.84 ± 0.93
MobileNetV3-Large [64]89.24 ± 1.3290.86 ± 1.1989.07 ± 2.5189.48 ± 1.7889.94 ± 1.0190.18 ± 0.8791.03 ± 1.5689.42 ± 1.5890.37 ± 1.3190.68 ± 1.19
SqueezeNet [61]91.49 ± 1.9391.83 ± 1.6891.92 ± 1.9492.03 ± 1.5192.38 ± 2.4992.05 ± 1.3192.15 ± 1.3992.63 ± 1.6192.59 ± 0.9393.15 ± 1.43
ShuffleNetv2 1.0x [62]92.84 ± 2.0192.16 ± 1.1592.14 ± 1.5392.58 ± 1.5892.75 ± 2.1893.36 ± 2.1892.54 ± 1.4292.89 ± 1.1493.18 ± 0.5893.41 ± 0.84
MobileNetV3 [64]93.81 ± 1.1991.85 ± 2.1293.08 ± 1.7492.71 ± 1.0694.19 ± 1.4294.34 ± 1.3492.09 ± 1.9093.62 ± 0.9893.32 ± 1.3195.03 ± 2.44
InceptionV1 [63]93.75 ± 1.5893.11 ± 1.1193.27 ± 1.8593.72 ± 2.4993.93 ± 1.8694.18 ± 1.7493.74 ± 1.3593.88 ± 1.1994.46 ± 1.5895.27 ± 1.31
Proposed Methods93.46 ± 1.0497.20 ± 0.5896.74 ± 0.6997.89 ± 1.3198.15 ± 0.4797.47 ± 1.3197.43 ± 1.3197.10 ± 0.8498.31 ± 0.7498.83 ± 0.84
CALU-2
3-cv5-cv
MethodsAccuracyPrecisionRecallF1-ScoreAUCAccuracyPrecisionRecallF1-ScoreAUC
ViT [70]89.31 ± 1.1488.48 ± 1.9589.11 ± 1.2788.30 ± 1.6489.94 ± 1.3890.15 ± 1.6588.94 ± 1.9688.23 ± 1.8789.01 ± 1.4890.45 ± 1.76
ResNet-101 [65]80.98 ± 1.8482.76 ± 2.1483.18 ± 1.7385.78 ± 1.8387.11 ± 1.9182.08 ± 2.0483.41 ± 1.5883.81 ± 1.9386.31 ± 1.9687.59 ± 1.28
Xception [66]82.47 ± 1.2786.19 ± 1.1887.01 ± 1.1886.39 ± 1.9188.35 ± 1.1881.89 ± 1.9786.84 ± 2.1988.19 ± 1.0187.54 ± 2.1488.93 ± 1.92
NASNet-A Mobile [67]86.81 ± 1.5389.28 ± 2.0587.27 ± 1.8487.74 ± 1.1988.38 ± 1.7987.18 ± 1.6390.07 ± 1.1788.07 ± 1.2888.18 ± 2.1689.04 ± 0.84
MobileNetV3-Large [64]89.07 ± 1.9490.21 ± 1.5788.41 ± 2.0188.79 ± 1.2889.15 ± 1.9389.49 ± 1.5890.68 ± 2.4889.28 ± 1.8490.25 ± 1.9690.18 ± 1.48
SqueezeNet [61]91.04 ± 1.1891.43 ± 1.1891.26 ± 1.9391.48 ± 1.1192.08 ± 2.0091.79 ± 1.0891.82 ± 0.5892.17 ± 1.9392.05 ± 1.1592.76 ± 1.92
ShuffleNetv2 1.0x [62]92.18 ± 1.8591.78 ± 1.0591.68 ± 1.2792.06 ± 1.9692.01 ± 1.8492.85 ± 2.0092.14 ± 1.0592.53 ± 1.0893.01 ± 1.3993.06 ± 1.53
MobileNetV3 [64]93.29 ± 1.5391.04 ± 2.0892.37 ± 1.8692.51 ± 1.7993.75 ± 1.4894.09 ± 1.1891.30 ± 1.8893.08 ± 1.3493.15 ± 1.8895.88 ± 1.92
InceptionV1 [63]93.18 ± 1.5792.16 ± 1.8992.83 ± 1.1993.04 ± 2.0493.41 ± 1.1994.01 ± 1.3193.08 ± 1.1993.14 ± 1.8394.19 ± 2.9395.08 ± 2.90
Proposed Methods93.21 ± 1.8196.81 ± 0.8596.06 ± 0.9497.18 ± 1.1597.41 ± 0.9797.14 ± 1.0497.11 ± 1.0896.47 ± 0.7698.14 ± 1.1598.48 ± 0.63
Table 10. Performance Evaluation of the Proposed Model on the CALU-3G Dataset.
MethodsAccuracyPrecisionRecallF1-ScoreAUC
ViT [70]90.189.588.488.990.4
ResNet-101 [65]88.684.685.787.789.3
Xception [66]90.187.990.688.789.7
NASNet-A Mobile [67]92.592.089.789.791.7
MobileNetV3-Large [64]92.592.590.791.491.7
SqueezeNet [61]76.275.775.575.876.9
ShuffleNetv2 1.0x [62]76.776.776.177.077.3
MobileNetV3 [64]75.074.775.474.975.5
InceptionV1 [63]79.378.879.278.979.7
SqueezeNet [61]92.893.494.193.593.7
ShuffleNetv2 1.0x [62]94.193.994.194.694.6
MobileNetV3 [64]94.094.595.295.295.4
InceptionV1 [63]94.294.795.595.595.5
Proposed Methods (Majority Voting)94.394.895.895.895.2
Proposed Methods (Unweighted Average)94.394.795.695.594.9
Proposed Methods (AMIS)98.497.597.298.897.6
Disclaimer/Publisher’s Note: The statements, opinions and data contained in all publications are solely those of the individual author(s) and contributor(s) and not of MDPI and/or the editor(s). MDPI and/or the editor(s) disclaim responsibility for any injury to people or property resulting from any ideas, methods, instructions or products referred to in the content.

