

Antiangiogenic Therapy Efficacy Can Be Tumor-Size Dependent, as Mathematical Modeling Suggests

Division of Theoretical Physics, P.N. Lebedev Physical Institute of the Russian Academy of Sciences, 53 Leninskiy Prospekt, 119991 Moscow, Russia
*
Author to whom correspondence should be addressed.
†
Current address: Division of Mathematical Oncology and Computational Systems Biology, City of Hope, Duarte, CA 91010, USA.
Mathematics 2024, 12(2), 353; https://0-doi-org.brum.beds.ac.uk/10.3390/math12020353
Submission received: 14 December 2023
/
Revised: 15 January 2024
/
Accepted: 18 January 2024
/
Published: 22 January 2024
(This article belongs to the Special Issue Mathematical Modeling and Analysis of Problems in Ecology, Epidemiology and Oncology)
Abstract
:Antiangiogenic therapy (AAT) is an indirect oncological modality that is aimed at the disruption of cancer cell nutrient supply. Invasive tumors have been shown to possess inherent resistance to this treatment, while compactly growing benign tumors react to it by shrinking. It is generally accepted that AAT by itself is not curative. This study presents a mathematical model of non-invasive tumor growth with a physiologically justified account of microvasculature alteration and the biomechanical aspects of importance during tumor growth and AAT. In the untreated setting, the model reproduces tumor growth with saturation, where the maximum tumor volume depends on the level of angiogenesis. The outcomes of the AAT simulations depend on the tumor size at the moment of treatment initiation. If it is close to the stable size of an avascular tumor grown in the absence of angiogenesis, then the tumor is rapidly stabilized by AAT. The treatment of large tumors is accompanied by the displacement of normal tissue due to tumor shrinkage. During this, microvasculature undergoes distortion, the degree of which depends on the displacement distance. As it affects tumor nutrient supply, the stable size of a tumor that undergoes AAT negatively correlates with its size at the beginning of treatment. For sufficiently large initial tumors, the long-term survival of tumor cells is compromised by competition with normal cells for the severely limited inflow of nutrients, which makes AAT effectively curative.
1. Introduction
1.1. Biological Background
Cancer currently remains a major cause of morbidity and mortality worldwide [1]. New methods for its treatment, as a rule, have limited efficacy, target only a narrow range of cancer types, and have limited availability to the general public due to their high cost. Therefore, an important challenge in oncology is the optimization of the types of anticancer therapy that are already introduced into clinical practice.
Standard and long-established types of anticancer treatment, such as chemotherapy and radiotherapy, lead to the eradication of actively proliferating cells subject to therapeutic action. The non-selectivity of these treatments inevitably leads to the damage of healthy cells that are reached by chemotherapeutic drugs or are traversed by radiation beams. Recently, a group of radically different anticancer modalities has emerged that perform indirect interference with the mechanisms sustaining the existence of cancer as a complex organ embedded in a host organism [2]. Prominent examples of such approaches are immunotherapy and antiangiogenic therapy. Immunotherapy is an umbrella term for a group of medical interventions aimed at the disruption of the ability of cancer cells to evade immune surveillance [3]. The goal of antiangiogenic therapy (AAT) is breaking the process of tumor angiogenesis, i.e., the formation of blood vessels (in particular, capillaries that provide nutrient exchange [4]). These therapies are not devoid of side-effects, which are, nevertheless, usually more moderate and affect other organs than the standard treatments.
Enabling the process of tumor angiogenesis is a crucial step in cancer progression. In its absence, tumors generally cannot grow beyond the size of 1–2 mm [5]. Further tumor growth is restricted by limited nutrient supply from capillaries located in normal tissues that are pushed away by a growing tumor mass. Thus, an avascular tumor eventually reaches a stable state in which the ongoing proliferation of its cells in the tumor periphery is compensated for by the death of nutrient-deprived cells in its core.
One way for the tumor cells to overcome nutrient deficiency is to invade nearby tissues and co-opt existing capillaries. Enabling invasion is a crucial hallmark of malignant tumors [6]. However, it is a complex process that requires the accumulation of a sufficient number of cell mutations [7]. Since the overall frequency of mutations correlates with the rate of tumor cell divisions, acquiring an invasive phenotype is a long process for small tumors. Angiogenic switching is a faster process that generally manifests itself while a tumor is still benign and lacks invasive properties.
In healthy tissues the process of angiogenesis takes place, e.g., during wound healing, and it leads to an ordered vascular system, finely tuned for each organ. Tumor cells, however, produce angiogenic molecules excessively, which results in the formation of chaotically organized and highly permeable capillary networks. AAT neutralizes the action of angiogenic molecules. This leads to the cessation of the formation of new capillaries, the normalization of the structure of already formed tumor capillaries [8], the further normalization of the density of the capillary network [9], and the alleviation of tumor-associated edema [10].
The restriction of nutrient supply caused by AAT limits the growth of tumors and can yield their shrinkage but generally does not lead to a tumor being cured. This provides ground for the use of AAT in combination with other modalities. In clinical practice, AAT is generally paired with chemotherapy (CT) [11]. There are multiple factors that influence the efficacy of AAT by itself and in combination with CT. In particular, AAT entails the reduced inflow of chemotherapeutic drugs into a tumor, which was observed experimentally [12,13]. This renders the problem of the optimization of AAT-based treatments in clinical practice, which is a highly nontrivial task. Its solution is heavily compromised by the impossibility of testing all the feasible treatment alterations due to logistical and ethical reasons.
1.2. Mathematical Background
A methodology that can point at the potential biomarkers of treatment efficacy and that can significantly narrow down the range of potentially effective therapeutic protocols is mechanistic mathematical modeling. It envisions the tumor and its microenvironment as a single complex system that, contrary to a real-life situation, can be reproduced under a broad variation of parameters and treatment approaches.
Several methods exist for modeling tumor growth when taking into account angiogenesis and AAT. The simplest method relies on the system of ordinary differential equations. The models of this kind generally include an equation for the logistic growth of the tumor volume, with its maximum value being a variable that is dependent on the concentration of the antiangiogenic drug [14]. Although such phenomenological models can be convenient for preclinical and clinical studies, they clearly represent oversimplifications that omit spatial aspects and neglect many of the physiological processes that can influence treatment outcomes.
The most popular approach for modeling angiogenesis and AAT is agent-based modeling, which involves a detailed reproduction of capillary networks and, as is frequently the case, explicit consideration of blood flow maps [15,16]. Such models can provide elegant visualizations of microvasculature remodeling and can yield useful insights. However, they require significant computational costs, which increase with tumor size. That crucially limits the practical use of such models. Up to date, they have not been used to simulate an entire course of AAT.
The use of continuous, spatially distributed models based on partial differential equations can provide a compromise between computational cost and physiological validity [17,18]. Although such models are unable to reproduce the microscopic aspects of a capillary network, they allow for the consideration of the crucial dynamic features of tumor microvasculature under unperturbed tumor growth and under the course of therapy. However, the related models presented nowadays in the literature focus on invasive tumors, and they ignore the biomechanical aspects crucial for the reproduction of tumor response to alterations in microvasculature.
On the other hand, there exists a sufficient amount of modeling studies devoted to the biomechanical aspects accompanying tumor growth and treatment, which do not account for dynamically changing tumor microvasculature. In particular, consideration of interstitial fluid dynamics and their influence on drug delivery is a well-researched problem in the case of static tumors [19,20,21]. In the case of a dynamic tumor that can both grow and shrink during therapy, a physiologically correct approach to modeling is the simultaneous account of the stress arising in the solid phase of the tissue (cells and extracellular matrix) along with the dynamics of the interstitial fluid since they are closely interrelated. In particular, the deformation of the solid component of the tissue affects fluid flow, while the outflow of fluid from the tumor leads to its shrinkage and to the alleviation of stress exerted by the surrounding normal tissue.
The related works that account for solid stress using mathematical modeling are less numerous. The methods used range from relatively simple to complex. The complex methods are generally adapted from the area of solid mechanics, based on the multiplicative decomposition of the tissue strain gradient tensor into components corresponding to different physical processes [22,23]. The use of such methods is associated with great computational costs but is justified, e.g., if any quantitative agreement with the experimental results is pursued. For qualitative studies, however, a more practical approach is the use of simpler methods that regard tumors as a liquid-like or linearly elastic medium [24,25]. Such methods have been repeatedly proven to be able to qualitatively reproduce experimental observations, e.g., the decrease in maximum tumor size with the increase in applied external pressure [26] and the oozing of liquid from a large tumor due to the elevated pressure in its core [27].
1.3. Current Study
The current study simultaneously considers both the alterations in microvasculature and the evolution of biomechanical aspects during tumor growth and AAT. To the best of our knowledge, this is the first work of this kind to provide simulations of the entire course of AAT. This study is based on our previous works on the mathematical modeling of tumor angiogenesis and AAT [28,29,30] and on our works focused on the biomechanical properties of tumors and normal tissues [31,32,33,34].
Section 2 introduces the mathematical model, providing its crucial assumptions, equations, parameters, and aspects of numerical solving. The model is implemented in C++ computational code (with the use of Dev-C++, version 5.11), which can be downloaded from the Supplementary Materials section. The results are presented in Section 3. Section 3.1 considers free tumor growth with and without angiogenesis. The model reproduced the layered structures of proliferating, quiescent, and dead tumor cells, which are characteristic of non-invasive tumors that yield growth when under saturation. The maximum tumor volume increases with the initiation of angiogenesis. Section 3.2 is devoted to modeling AAT and shows that its effect depends on the tumor size at the moment of its administration. Small tumors are quickly stabilized by AAT, while the treatment of sufficiently large tumors is accompanied by the displacement of normal tissue due to tumor shrinkage, which causes the rupture of capillaries and, thus, effectively provides an additional decrease in tumor nutrient supply. To the best of our knowledge, such qualitative outcomes have not been shown previously in the literature. Section 3.3 is devoted to the study of the combination of AAT with chemotherapy. Its results suggest that the delay of AAT administration within this combination can compromise the potential curative effect of the treatment. Section 4 finalizes this study with an overview of the main results and a discussion of their clinical significance, as well as the future scope of our work.
2. Model
2.1. Equations
The investigated model is presented in the system of Equation (1). It has nine partial differential equations controlling the dynamics of spatially distributed variables. Each of them depends on one spatial co-ordinate, r, and a temporal co-ordinate, t. The block scheme of the main model interactions is presented in Figure 1. For a detailed description of the interactions of the model, we refer the readers to our previous work [33]. The crucial model aspects are as follows.
The model reproduces the spherically symmetric growth of a non-invasive tumor within a normal tissue. Under sufficient levels of glucose, g, tumor cells maintain the proliferative state, , in which their number grows exponentially. Cells use interstitial fluid, f, as the mass source. In the absence of glucose, they transit reversibly to the quiescent state, , under which nutrient deficiency tumor cells die; this is reflected by their transition into the dead state, m. In this, they gradually degrade and transform into interstitial fluid.
The tumor cells are surrounded by normal cells, h, and they collectively constitute the porous solid phase fraction of the tissue, denoted as . The interstitial fluid represents its second phase, which is capable of viscous flow through the pores within the solid fraction. The tissue is assumed to be saturated and incompressible, which implies that the total density of the cells and fluid together remains constant.
The rate of cell proliferation is influenced by both local glucose level and local solid stress, denoted as . The solid stress function is built on the assumption that the volume fraction of cells correlates with the average distance between them [35]. When the cell fraction is at its normal value (), the interactions among cells result in zero solid stress. Cells in close proximity tend to repel each other, while cells at a distance tend to attract. With increasing distance, the interaction strength eventually vanishes.
|
proliferating tumor cells: | ||
|
quiescent tumor cells: | ||
|
normal cells: | ||
|
dead tumor cells: | ||
|
interstitial fluid: | ||
| VEGF: | ||
|
normal capillaries: | (1) | |
|
abnormal capillaries: | ||
| glucose: | ||
| where | ||
| solid stress: |
Interstitial fluid enters the tissue from capillaries, two types of which are taken into account: normal, , and abnormal, . Abnormal capillaries possess increased permeability to fluid and glucose due to the influence of vascular endothelial growth factor (VEGF) v. It is produced by nutrient-deprived quiescent cells. It also stimulates the formation of new capillaries in the abnormal state. At low VEGF concentrations, capillaries normalize, which implies a decrease in their permeability. Normalized excessive capillaries tend to return to their basal physiological density, which reflects the process of the pruning of microvasculature in healthy tissues. Interstitial fluid drains into the lymphatic system, which is not considered explicitly but is assumed to have a density proportional to that of normal cells. Consequently, the lymphatic capillaries are absent within the tumor. Blood capillaries degrade within the tumor due to implicit factors, such as rupture caused by their displacement and due to biochemical reasons [36].
We model the action of AAT as having the maximum theoretically possible efficacy. When the treatment begins, all the present VEGF is implied to become immediately bound to the antiangiogenic drug and, therefore, is neutralized. The following normalization of microvasculature, however, is not immediate. The dynamics of the accompanying processes happen at physiologically justified rates, as described above.
2.2. Parameters
The parameters of the model were determined based on the outcomes of the experiments (of different types) presented in the literature (if available) or estimated in order to reproduce the well-established features accompanying tumor growth. The basic set of parameters is provided in Table 1, where the following normalization parameters were used to obtain their model values: 1 h for time; cm for length; cells/mL for maximum cell density; mol/mL for VEGF concentration; 100 cm/cm for capillary surface area density; 1 mg/mL for glucose concentration. The choice of the majority of model parameters is justified in our work [33].
2.3. Numerical Solving
During the numerical simulation of Equation (1), intercellular fluid, f, was not explicitly taken into account, given the conservation law . The kinetic, diffusion, and advection equations for the other variables were solved sequentially at each time step. The explicit Euler method was employed to solve the kinetic equations. The use of this straightforward approach is justified by the relatively small time steps that guide the solving of advective equations. For the diffusion equations, the implicit Crank–Nicholson scheme was implemented. These classical methods are described, e.g., in [51]. In order to solve the advective equations, the conservative flux-corrected transport algorithm (incorporating an implicit antidiffusion stage) was used [52]. However, this method introduces a minor amount of uncorrectable diffusion, leading to the artificial invasion of normal tissue by the tumor. A similar challenge arises in modeling the normal tissue boundary. In order to address this issue, two additional floating points were introduced on the computational grid, marking the positions of the tumor-normal tissue interface and the normal tissue boundary. The co-ordinates of these points were computed by ensuring the conservation of total cell volume when solving advection equations at each time step.
The following initial conditions were used, which represent a spherical section of normal tissue of an initial radius of mm, with a small spherical colony of tumor cells that have a radius of mm and are located in its center at :
Here, is the steady state value for the fraction of cells. It is only slightly smaller than , which corresponds to a minor stretching of the network of interconnected cells due to the pressure of the surrounding fluid. The following boundary conditions were used, where is the changing radius of the tumor, and is the changing outer radius of normal tissue:
There are two separate advective motions in this model: denotes the absolute velocity of the fluid, and denotes the velocity of the solid phase. By summing up the equations of the dynamics of all cells and assuming both flow velocities to be zero at , Equation (4) is obtained. This was used to define advective velocities during numerical solution.
3. Results
3.1. Free Tumor Growth with and without Angiogenesis
Figure 2 compares the cases of free tumor growth with and without the initiation of angiogenesis under the same values of model parameters, as presented in Table 1. Initially, the tumor consists entirely of proliferating cells, with their number growing exponentially. However, within a few hours, some tumor cells start experiencing a deficiency of nutrients, which are supplied to the tumor mass from surrounding capillaries that are pushed away by the expanding tumor. Consequently, tumor growth slows down, and the tumor obtains a layered structure. Its inner core becomes predominantly occupied by quiescent cells, and the outer rim by proliferating cells. This structure is characteristic of tumor spheroids in experimental settings and non-invasive tumors in vivo. As the total number of tumor cells keeps increasing, the further exacerbation of nutrient deficiency results in the appearance of dead cells in the tumor core. Their degradation turns them into a viscous liquid, which, from a modeling point of view, is indistinguishable from the rest of the interstitial fluid. The decrease in the number of tumor cells in the central part of the tumor implies the stretching of the solid phase of the tumor tissue. This, in accordance with the biomechanical terms in Equation (1), underlies the elevated fluid pressure in the tumor core compared to the surrounding normal tissue. Therefore, fluid oozes from the tumor mass, contributing to a further decrease in its growth rate. When the total rates of tumor cell proliferation and death equate, the tumor reaches a stable state.
In the case without angiogenesis, the avascular tumor growth stops at ≈1 mm in radius. This is consistent with clinical observations [5]. In the presence of angiogenesis, the formation of new capillaries is stimulated by VEGF secreted by quiescent tumor cells. Capillaries influenced by VEGF have greater permeability, which, along with the increase in microvascular density, contributes to the increased inflow of glucose to the tumor. The vascularized tumor has a larger pool of proliferating cells, which means that a greater total rate of outflow of dead cells is required to compensate for it, yielding a stable tumor. In the considered simulation, the corresponding maximum tumor radius is ≈5.6 mm. This model is restricted, with consideration given to a homogeneous, nonmutating tumor. In a more realistic scenario, further tumor growth would be ensured, in particular, by the continuous selection of cells that proliferate faster and are more tolerant to nutrient deficiency and the initiation of tumor cell invasion into surrounding tissue accompanied by the co-opting of capillaries located there.
Despite the variety of considered physiological processes and the nontrivial pattern of the distribution of the model variables produced by this model, on a higher level of consideration, the simulations of free tumor growth provide quite classical S-shaped growth curves [53]. Such curves by themselves can be qualitatively reproduced by much simpler models based on a few ordinary differential equations. In the corresponding models, the dependence of tumor growth on angiogenesis is generally reproduced via the introduction of the dependence of maximum tumor volume on the amount of secreted proangiogenic signals [14]. In such simpler approaches, the cessation of angiogenesis results in the gradual decrease in tumor volume down to the value corresponding to the case of the initially avascular tumor. The current model, however, yields a more intricate pattern of tumor response to AAT, as discussed in further sections.
3.2. Antiangiogenic Therapy Beginning at Different Moments of Tumor Growth
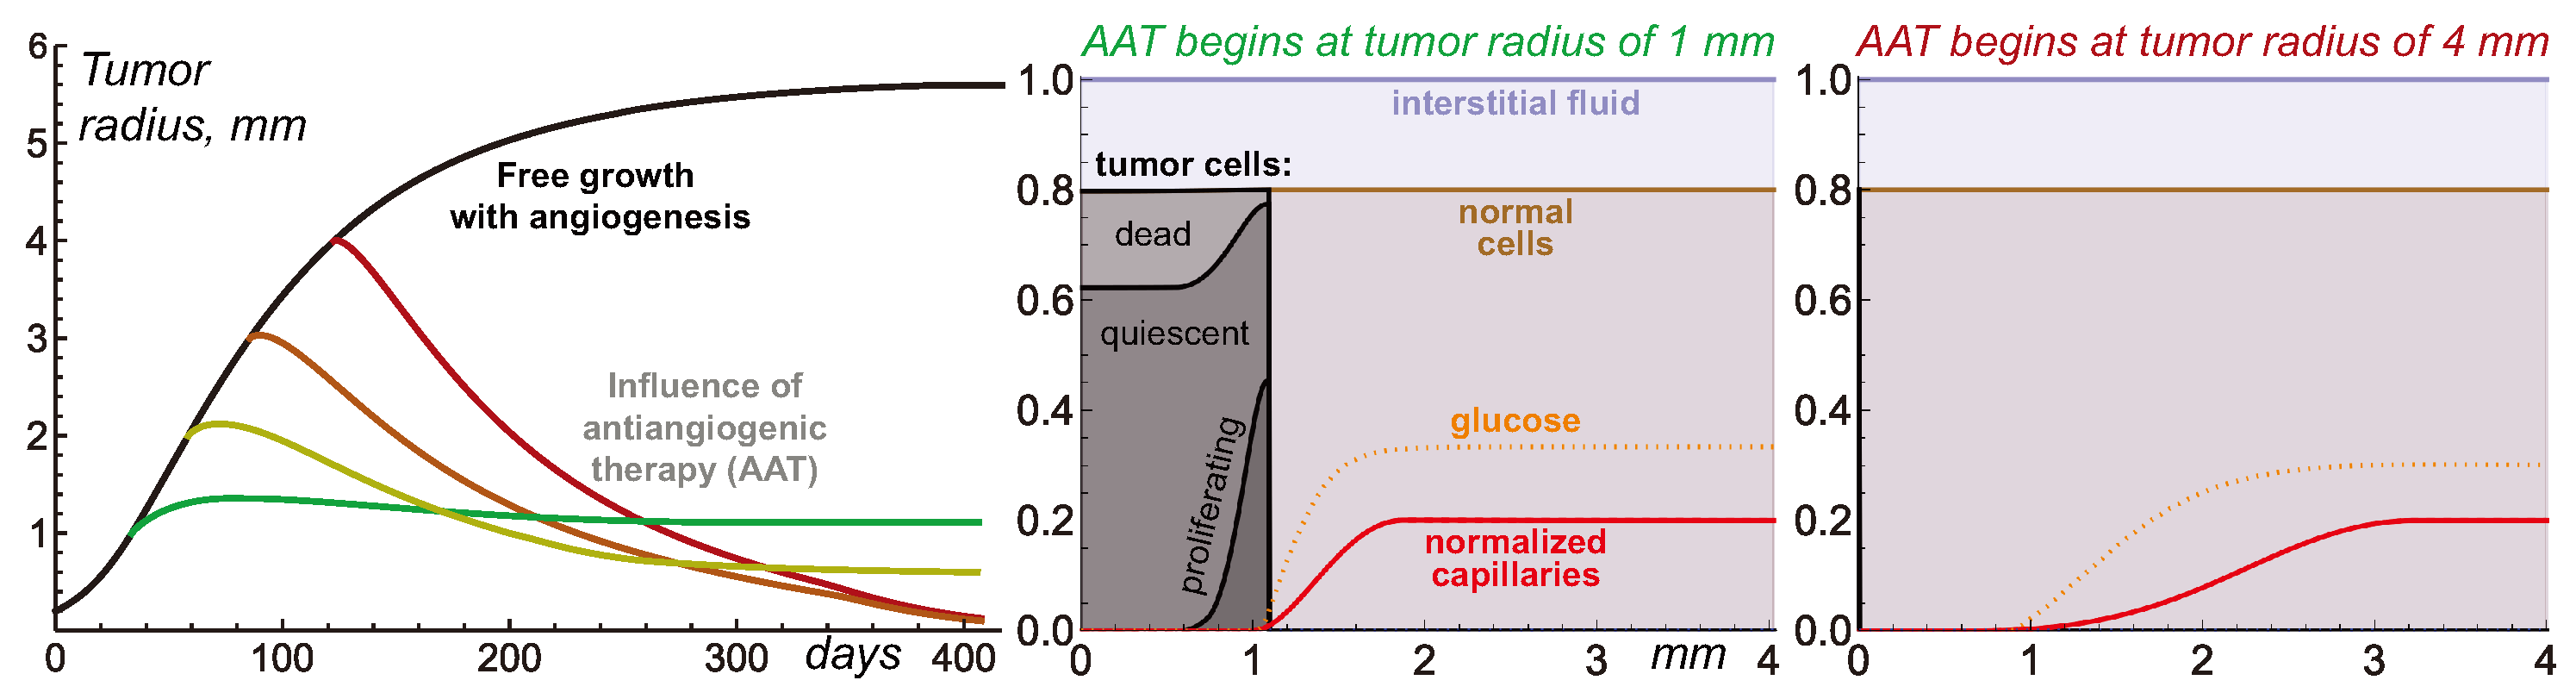
Figure 3 illustrates the nontrivial nature of tumor response to AAT under the variation in tumor radius at which the treatments begin. The elimination of VEGF for the 1 mm tumor yields its quick growth saturation. The capillary system that undergoes degradation within the tumor volume, normalization, and pruning is eventually stabilized with a slightly greater total amount of capillaries than in the case of the avascular tumor. Therefore, it can support the existence of a stable tumor slightly greater than 1 mm in radius.
AAT performed for larger tumors does not result in tumor stabilization at this radius. For a 2 mm tumor, the treatment yields a final tumor radius of 0.6 mm. For 3 mm and 4 mm tumors, their sizes steadily decrease through the simulations, tending toward negligible values. From the modeling point of view, although the tumor always has some finite radius, the interpretation of such qualitative results may imply the complete cure of the tumor.
The reasons behind this nontrivial pattern of tumor response to AAT lie in the processes accompanying tumor shrinkage and the consequent remodeling of displaced normal tissue and microvasculature. In the case of a small vascularized tumor, the displacement of the capillary system is only minor. Therefore, the final tumor size is almost not affected by the physiological processes that happen along with tissue displacement. From the general mathematical point of view, the system state right before the antiangiogenic treatment is, by itself, close to the stable state that would be achieved in the absence of angiogenesis. Thus, the treatment imposes only a comparably small perturbation to tumor dynamics.
In contrast, large vascularized tumors have evolved to states that are significantly different from the stable state of an initially avascular tumor. The rapid normalization of microvessel structure and density in response to the elimination of VEGF entails a quick decrease in the total volume of proliferative tumor cells that can be sustained by microvasculature. In a short period, the overall tumor cell proliferation rate becomes unable to compensate for the rate of ongoing loss of tumor volume due to the outflow of dead cell remnants. As the difference between the absolute rates of these processes keeps increasing, the tumor undergoes rapid shrinkage.
The displacement of the interface between the tumor and normal tissue pulls the normal cells and microvasculature towards the center of the tumor, which is in accordance with the advection terms presented in Equation (1). The spherical geometry of the system means that this forced motion of capillaries is more active in the regions with greater curvature, i.e., near the tumor. As the normalized capillary system undergoes rupture and pruning, its overall volume continuously decreases. Eventually, the microvasculature system ends up in a state in which its density is close to its initial value at the outer side of the normal tissue, but it falls down to negligible values towards the tumor surface. The total volume of a stable microvasculature depends on the degree of its displacement and remodeling that it has undergone in response to treatment. Therefore, initially, larger tumors end up having smaller volumes of surrounding microvasculature.
The stable volume of a tumor that can be supported by the nutrient supply from the resulting microvasculature depends not only on the total volume of the latter but also on its configuration within the normal tissue. The pool of normal cells represents the active consumers of nutrients and, therefore, the competitors of tumor cells. Large gaps between the tumor surface and the areas with physiologically normal capillary density are detrimental to tumor size since the nutrients that are supplied from the capillaries and that diffuse toward the tumor undergo active consumption by normal cells. In extreme cases, the level of glucose entering the tumor rim is, by itself, not sufficient to ensure tumor cell survival, which results in a steady decrease in tumor volume down to negligible values.
Overall, the complexity of the intertwined physiological processes results in the observed hysteresis effect, in which the final state of the tumor after AAT depends on the previous history of tumor progression.
3.3. Combining Antiangiogenic Therapy with Chemotherapy
The above-described nature of tumor response to the cessation of angiogenesis should also affect the combined types of treatment involving AAT. Previously, we hypothesized that in combination with chemotherapy (CT), the delay of administration of the antiangiogenic drug can be beneficial when compared to the case of the simultaneous initiation of CT and AAT. The rationale behind this hypothesis was that such an approach could exploit the increased permeability of the angiogenic capillary network in the peritumoral region, which is in contrast to the normalized network that forms as a result of AAT. Thus, it should ensure the enhanced penetration of the cytotoxic agent into the tumor. The account for the biomechanical properties of the tissues, however, suggests that the alternation of the scheduling of combined AAT and CT may yield more nontrivial consequences.
In order to illustrate this idea, let’s consider an augmented version of the model expressed by Equations (1)–(4), which also considers the intravenous injections of chemotherapeutic drugs. Equation (5) lists the additional terms introduced in the model to account for the chemotherapeutic drug and its action. Chemotherapy is assumed to affect only proliferating cells. One newly introduced partial differential equation governs the distribution of chemotherapeutic agents in the tissue, and a new ordinary differential equation governs its temporal dynamics in blood.
|
proliferating tumor cells: | (5) | |
|
dead tumor cells: | ||
|
chemotherapeutic agent in tissue: | ||
|
chemotherapeutic agent in blood: |
The term “drug injections” represents the external control that increases the concentration of a chemotherapeutic drug in the blood by a normalized unit at designated moments. In this work, we simulate a protocol with injections separated by 3-week intervals. The beginning of CT takes place when a tumor achieves a 4 mm radius.
Additional model parameters are presented in Table 2. The estimation of the parameters related to the chemotherapeutic agent was performed using our approach presented previously in [33]. We refer the reader to it for the corresponding details. Here, we consider a chemotherapeutic agent with a 5 nm hydrodynamic radius. It is well-known that substances with a low-molecular weight move through the pores in capillary walls via diffusion, while the process of advection dominates for high-molecular-weight agents [54]. The same reasoning applies to their movement through the tissue. Both diffusion and advection physiological processes are accounted for herein. The sensitivity of cells to the drug corresponds to a moderate CT, which, by itself, can not eradicate the tumor.
The following initial and boundary conditions were used for the chemotherapeutic drug:
Figure 4 illustrates the tumor dynamics in the resulting system under the treatment of a relatively large tumor using CT, AAT, and their combination, with AAT taking place at different moments. Chemotherapy by itself results in significant tumor shrinkage, which, however, is followed by tumor regrowth after the treatment is halted. The case of mono-AAT has already been demonstrated above, and it effectively results in the eradication of the tumor.
The combination of CT and AAT starting simultaneously leads to the faster shrinkage of the tumor than mono-AAT. This happens because the tumor cells, in this case, are subject not only to a similar depletion of nutrients but also to direct cytotoxic action. However, the case of mono-CT initially leads to even faster tumor shrinkage. This reflects the above-mentioned fact that the normalization of capillaries results in a reduced decrease in cytotoxic agents in the tumor. In the case of the high-molecular-weight chemotherapeutic agent considered herein, this reduction is very well pronounced and is eventually reflected in these high-level tumor growth curves. However, in the long term, the combination of simultaneously initiated CT and AAT proves to be more efficient than mono-CT due to the eventual critical shortage of nutrient supply to the tumor as their competition with normal cells exacerbates under capillary network scarcity.
A delay to the beginning of AAT within its combination with CT ensures the faster initial shrinkage of the tumor. The seeming benefit of such an approach, nevertheless, is deceptive. At the moment of the third and fifth injections of the chemotherapeutic drug, the tumors have radii of ≈1.9 mm and ≈0.7 mm, respectively. In accordance with the simulations presented in the previous section, the AAT initiated for such tumors results in their stabilization at small but notable sizes. Thus, the delay in AAT administration in combination with CT compromises the potential curative effect of the treatment.
4. Conclusions and Discussion
4.1. Overview of Main Results
This paper presented a mathematical modeling study of the non-invasive solid tumor response to antiangiogenic therapy (AAT), taking into account the biomechanical aspects. The tumor in the considered model represents a compact object embedded in normal tissue. An increase in tumor volume and the displacement of normal tissue are ensured by the gradients of solid stress that arise due to tumor cell proliferation. The tumor pushes microvasculature away during its growth, compromising its own supply of nutrients, which are necessary for cell proliferation and survival. The degradation and outflow of dead cells eventually compensate for tumor proliferation, yielding tumor growth stabilization.
The initiation of angiogenesis by tumor cells experiencing metabolic stress results in the augmentation of microvasculature permeability and surface area. The resulting abnormal microvasculature can support the existence of larger stable tumors.
Simulations of AAT show that the outcome of the elimination of proangiogenic factors depends on the proximity of the current tumor size to the size of the stable avascular tumor grown without the initiation of angiogenesis. For a tumor with close size, AAT yields a minor perturbation to its dynamics and leads to its rapid stabilization. For larger tumors, however, the quick fall in nutrient supply significantly affects their dynamics. The domination of outflow of dead cell mass over cell proliferation causes the displacement of the interface between the tumor and the normal tissue, which pulls the normal cells and microvasculature towards the core of the tumor. As the capillary system undergoes rupture and pruning during this movement, the system eventually stabilizes at notably decreased volumes regarding the capillary system, the density of which falls toward the tumor surface. The degree of distortion of microvasculature depends on the distance of its displacement. Therefore, the stable sizes of tumors that underwent AAT negatively correlate with their sizes at the beginning of AAT. For sufficiently large initial tumors, the destruction of microvasculature is so crucial that, eventually, it is able to support the survival of not only normal but non-normal tumor cells. Thus, in such cases, AAT is effectively curative as long as it blocks all the possible mechanisms of angiogenesis.
4.2. Clinical Significance
The idea that AAT can be curative is an intriguing outcome of this study; however, to the best of our knowledge, there are no clinical cases supporting it. The very possibility of obtaining such confirmation is significantly compromised by the fact that AAT is rarely used in the mono regime. It is generally combined with other modalities, including the surgical removal of the tumor after its shrinkage caused by AAT. Moreover, the model used herein assumes compactly growing benign tumors, while invasive tumors have been shown on numerous occasions to possess inherent resistance to AAT due to the ability of motile cancer cells to actively escape nutrient-deficient regions [55]. Therefore, for invasive tumors, the possibility of the curative effect of AAT seems highly unlikely. It should also be noted that, in reality, other signaling molecules (other than VEGF) can be involved in the stimulation of microvessel growth, although they are generally assumed to be much less important. Further aid from experimental and clinical researchers can shed light on the possibility of the validation of the concept of curative AAT.
4.3. Future Prospects
The designed approach considers the physiological processes accompanying the dynamics of a tumor and its microenvironment during AAT in detail. It largely determines the efficacy of the delivery of concomitantly administrated drugs to the tumor. The consideration of tissue as a porous biphasic media with solid and liquid components is crucial for a physiologically adequate reproduction of the dynamics of high-molecular-weight drugs, which is dominated by advective motion. This study provides example simulations of AAT combined with chemotherapy (CT). One of the qualitative outcomes of administrating AAT simultaneously with CT, as suggested by the modeling, is the notable reduction in the inflow of the chemotherapeutic drug into the tumor, which compromises initial tumor shrinkage. Given these intriguing results, we will use the developed model as the basis for future studies on the optimization of combined types of antitumor therapy with the use of antiangiogenic drugs.
The results of this work were obtained by using simulations of a spherically symmetric tumor, which effectively renders the model one-dimensional and, thus, drastically reduces computational complexity. Such an approach facilitates the ability to simulate the long-term behavior of a tumor and its microenvironment in response to treatment, thus making the reconstruction of this behavior during the entire course of a prolonged treatment practically feasible. The obtained qualitative results are expected to be preserved under sufficiently moderate perturbations of spherical symmetry in a more realistic three-dimensional setting. Nevertheless, conducting the three-dimensional modeling study, especially based on patient imaging data, represents an intriguing future prospect. Such work, in particular, would allow for exploring the limits of the applicability of the results for tumors of varying sizes and shapes.
Supplementary Materials
The C++ computational code can be downloaded at: https://0-www-mdpi-com.brum.beds.ac.uk/article/10.3390/math12020353/s1.
Author Contributions
Conceptualization, M.K. and A.K.; methodology, M.K. and A.K.; software, M.K.; investigation, M.K.; writing—original draft preparation, M.K.; writing—review and editing, M.K. and A.K.; visualization, M.K.; supervision, A.K.; funding acquisition, M.K. and A.K. All authors have read and agreed to the published version of the manuscript.
Funding
This work is supported by the Russian Science Foundation under grant 22-21-00835.
Data Availability Statement
The data presented in this study are available on request from the corresponding author.
Conflicts of Interest
The authors declare no conflicts of interest.
Abbreviations
The following abbreviations are used in this manuscript:
| CT | chemotherapy |
| AAT | antiangiogenic therapy |
| VEGF | vascular endothelial growth factor |
References
- Siegel, R.L.; Miller, K.D.; Wagle, N.S.; Jemal, A. Cancer statistics, 2023. CA Cancer J. Clin. 2023, 73, 17–48. [Google Scholar] [CrossRef] [PubMed]
- Hanahan, D.; Weinberg, R.A. Hallmarks of cancer: The next generation. Cell 2011, 144, 646–674. [Google Scholar] [CrossRef] [PubMed]
- Chen, D.S.; Mellman, I. Oncology meets immunology: The cancer-immunity cycle. Immunity 2013, 39, 1–10. [Google Scholar] [CrossRef] [PubMed]
- Jayson, G.C.; Kerbel, R.; Ellis, L.M.; Harris, A.L. Antiangiogenic therapy in oncology: Current status and future directions. Lancet 2016, 388, 518–529. [Google Scholar] [CrossRef] [PubMed]
- Naumov, G.N.; Akslen, L.A.; Folkman, J. Role of angiogenesis in human tumor dormancy: Animal models of the angiogenic switch. Cell Cycle 2006, 5, 1779–1787. [Google Scholar] [CrossRef] [PubMed]
- Lazebnik, Y. What are the hallmarks of cancer? Nat. Rev. Cancer 2010, 10, 232–233. [Google Scholar] [CrossRef]
- Kalluri, R.; Weinberg, R.A. The basics of epithelial-mesenchymal transition. J. Clin. Investig. 2009, 119, 1420–1428. [Google Scholar] [CrossRef] [PubMed]
- Gee, M.S.; Procopio, W.N.; Makonnen, S.; Feldman, M.D.; Yeilding, N.M.; Lee, W.M. Tumor vessel development and maturation impose limits on the effectiveness of anti-vascular therapy. Am. J. Pathol. 2003, 162, 183–193. [Google Scholar] [CrossRef]
- Yuan, F.; Chen, Y.; Dellian, M.; Safabakhsh, N.; Ferrara, N.; Jain, R.K. Time-dependent vascular regression and permeability changes in established human tumor xenografts induced by an anti-vascular endothelial growth factor/vascular permeability factor antibody. Proc. Natl. Acad. Sci. USA 1996, 93, 14765–14770. [Google Scholar] [CrossRef]
- Jain, R.K.; Di Tomaso, E.; Duda, D.G.; Loeffler, J.S.; Sorensen, A.G.; Batchelor, T.T. Angiogenesis in brain tumours. Nat. Rev. Neurosci. 2007, 8, 610–622. [Google Scholar] [CrossRef]
- Garcia, J.; Hurwitz, H.I.; Sandler, A.B.; Miles, D.; Coleman, R.L.; Deurloo, R.; Chinot, O.L. Bevacizumab (Avastin®) in cancer treatment: A review of 15 years of clinical experience and future outlook. Cancer Treat. Rev. 2020, 86, 102017. [Google Scholar] [CrossRef] [PubMed]
- Claes, A.; Wesseling, P.; Jeuken, J.; Maass, C.; Heerschap, A.; Leenders, W.P. Antiangiogenic compounds interfere with chemotherapy of brain tumors due to vessel normalization. Mol. Cancer Ther. 2008, 7, 71–78. [Google Scholar] [CrossRef] [PubMed]
- Ma, J.; Pulfer, S.; Li, S.; Chu, J.; Reed, K.; Gallo, J.M. Pharmacodynamic-mediated reduction of temozolomide tumor concentrations by the angiogenesis inhibitor TNP-470. Cancer Res. 2001, 61, 5491–5498. [Google Scholar] [PubMed]
- Hahnfeldt, P.; Panigrahy, D.; Folkman, J.; Hlatky, L. Tumor development under angiogenic signaling: A dynamical theory of tumor growth, treatment response, and postvascular dormancy. Cancer Res. 1999, 59, 4770–4775. [Google Scholar] [PubMed]
- McDougall, S.R.; Anderson, A.R.; Chaplain, M.A. Mathematical modelling of dynamic adaptive tumour-induced angiogenesis: Clinical implications and therapeutic targeting strategies. J. Theor. Biol. 2006, 241, 564–589. [Google Scholar] [CrossRef] [PubMed]
- Stéphanou, A.; McDougall, S.R.; Anderson, A.R.; Chaplain, M.A. Mathematical modelling of the influence of blood rheological properties upon adaptative tumour-induced angiogenesis. Math. Comput. Model. 2006, 44, 96–123. [Google Scholar] [CrossRef]
- Swanson, K.R.; Rockne, R.C.; Claridge, J.; Chaplain, M.A.; Alvord Jr, E.C.; Anderson, A.R. Quantifying the role of angiogenesis in malignant progression of gliomas: In silico modeling integrates imaging and histology. Cancer Res. 2011, 71, 7366–7375. [Google Scholar] [CrossRef]
- Alfonso, J.C.L.; Köhn-Luque, A.; Stylianopoulos, T.; Feuerhake, F.; Deutsch, A.; Hatzikirou, H. Why one-size-fits-all vaso-modulatory interventions fail to control glioma invasion: In silico insights. Sci. Rep. 2016, 6, 37283. [Google Scholar] [CrossRef]
- Welter, M.; Rieger, H. Interstitial fluid flow and drug delivery in vascularized tumors: A computational model. PLoS ONE 2013, 8, e70395. [Google Scholar] [CrossRef]
- Steuperaert, M.; Debbaut, C.; Carlier, C.; De Wever, O.; Descamps, B.; Vanhove, C.; Ceelen, W.; Segers, P. A 3D CFD model of the interstitial fluid pressure and drug distribution in heterogeneous tumor nodules during intraperitoneal chemotherapy. Drug Deliv. 2019, 26, 404–415. [Google Scholar] [CrossRef]
- Zhan, W. Convection enhanced delivery of anti-angiogenic and cytotoxic agents in combination therapy against brain tumour. Eur. J. Pharm. Sci. 2020, 141, 105094. [Google Scholar] [CrossRef] [PubMed]
- Stylianopoulos, T.; Martin, J.D.; Snuderl, M.; Mpekris, F.; Jain, S.R.; Jain, R.K. Coevolution of solid stress and interstitial fluid pressure in tumors during Pprogression: Implications for vascular collapse evolution of solid and fluid stresses in tumors. Cancer Res. 2013, 73, 3833–3841. [Google Scholar] [CrossRef]
- Preziosi, L.; Ambrosi, D.; Verdier, C. An elasto-visco-plastic model of cell aggregates. J. Theor. Biol. 2010, 262, 35–47. [Google Scholar] [CrossRef] [PubMed]
- Byrne, H.M.; King, J.R.; McElwain, D.S.; Preziosi, L. A two-phase model of solid tumour growth. Appl. Math. Lett. 2003, 16, 567–573. [Google Scholar] [CrossRef]
- Franks, S.; King, J. Interactions between a uniformly proliferating tumour and its surroundings: Stability analysis for variable material properties. Int. J. Eng. Sci. 2009, 47, 1182–1192. [Google Scholar] [CrossRef]
- Byrne, H.; Preziosi, L. Modelling solid tumour growth using the theory of mixtures. Math. Med. Biol. J. IMA 2003, 20, 341–366. [Google Scholar] [CrossRef]
- Jain, R.K.; Tong, R.T.; Munn, L.L. Effect of vascular normalization by antiangiogenic therapy on interstitial hypertension, peritumor edema, and lymphatic metastasis: Insights from a mathematical model. Cancer Res. 2007, 67, 2729–2735. [Google Scholar] [CrossRef]
- Kolobov, A.; Kuznetsov, M. Investigation of the effects of angiogenesis on tumor growth using a mathematical model. Biophysics 2015, 60, 449–456. [Google Scholar] [CrossRef]
- Kuznetsov, M.; Kolobov, A. Optimization of Combined Antitumor Chemotherapy with Bevacizumab by Means of Mathematical Modeling. In Trends in Biomathematics: Modeling, Optimization and Computational Problems: Selected Works from the BIOMAT Consortium Lectures, Moscow 2017; Springer: Cham, Switzerland, 2018; pp. 347–363. [Google Scholar]
- Kuznetsov, M. Mathematical modeling shows that the response of a solid tumor to antiangiogenic therapy depends on the type of growth. Mathematics 2020, 8, 760. [Google Scholar] [CrossRef]
- Kuznetsov, M. Combined influence of nutrient supply level and tissue mechanical properties on benign tumor growth as revealed by mathematical modeling. Mathematics 2021, 9, 2213. [Google Scholar] [CrossRef]
- Kuznetsov, M.; Kolobov, A. Agent-Based Model for Studying the Effects of Solid Stress and Nutrient Supply on Tumor Growth. Mathematics 2023, 11, 1900. [Google Scholar] [CrossRef]
- Kuznetsov, M.; Kolobov, A. Optimization of size of nanosensitizers for antitumor radiotherapy using mathematical modeling. Int. J. Mol. Sci. 2023, 24, 11806. [Google Scholar] [CrossRef] [PubMed]
- Kuznetsov, M.; Kolobov, A. Mathematical modelling for spatial optimization of irradiation during proton radiotherapy with nanosensitizers. Russ. J. Numer. Anal. Math. Model. 2023, 38, 303–321. [Google Scholar] [CrossRef]
- Mascheroni, P.; Stigliano, C.; Carfagna, M.; Boso, D.P.; Preziosi, L.; Decuzzi, P.; Schrefler, B.A. Predicting the growth of glioblastoma multiforme spheroids using a multiphase porous media model. Biomech. Model. Mechanobiol. 2016, 15, 1215–1228. [Google Scholar] [CrossRef]
- Holash, J.; Maisonpierre, P.; Compton, D.; Boland, P.; Alexander, C.; Zagzag, D.; Yancopoulos, G.; Wiegand, S. Vessel cooption, regression, and growth in tumors mediated by angiopoietins and VEGF. Science 1999, 284, 1994–1998. [Google Scholar] [CrossRef]
- Freyer, J.; Sutherland, R. A reduction in the in situ rates of oxygen and glucose consumption of cells in EMT6/Ro spheroids during growth. J. Cell. Physiol. 1985, 124, 516–524. [Google Scholar] [CrossRef] [PubMed]
- Izuishi, K.; Kato, K.; Ogura, T.; Kinoshita, T.; Esumi, H. Remarkable tolerance of tumor cells to nutrient deprivation: Possible new biochemical target for cancer therapy. Cancer Res. 2000, 60, 6201–6207. [Google Scholar] [PubMed]
- Netti, P.A.; Berk, D.A.; Swartz, M.A.; Grodzinsky, A.J.; Jain, R.K. Role of extracellular matrix assembly in interstitial transport in solid tumors. Cancer Res. 2000, 60, 2497–2503. [Google Scholar]
- Kelm, J.M.; Sanchez-Bustamante, C.D.; Ehler, E.; Hoerstrup, S.P.; Djonov, V.; Ittner, L.; Fussenegger, M. VEGF profiling and angiogenesis in human microtissues. J. Biotechnol. 2005, 118, 213–229. [Google Scholar] [CrossRef]
- Mac Gabhann, F.; Popel, A.S. Interactions of VEGF isoforms with VEGFR-1, VEGFR-2, and neuropilin in vivo: A computational model of human skeletal muscle. Am. J. Physiol.-Heart Circ. Physiol. 2007, 292, H459–H474. [Google Scholar] [CrossRef]
- Köhn-Luque, A.; De Back, W.; Yamaguchi, Y.; Yoshimura, K.; Herrero, M.; Miura, T. Dynamics of VEGF matrix-retention in vascular network patterning. Phys. Biol. 2013, 10, 066007. [Google Scholar] [CrossRef] [PubMed]
- Dickson, P.V.; Hamner, J.B.; Sims, T.L.; Fraga, C.H.; Ng, C.Y.; Rajasekeran, S.; Hagedorn, N.L.; McCarville, M.B.; Stewart, C.F.; Davidoff, A.M. Bevacizumab-induced transient remodeling of the vasculature in neuroblastoma xenografts results in improved delivery and efficacy of systemically administered chemotherapy. Clin. Cancer Res. 2007, 13, 3942–3950. [Google Scholar] [CrossRef] [PubMed]
- Stamatelos, S.K.; Kim, E.; Pathak, A.P.; Popel, A.S. A bioimage informatics based reconstruction of breast tumor microvasculature with computational blood flow predictions. Microvasc. Res. 2014, 91, 8–21. [Google Scholar] [CrossRef]
- Dings, R.P.; Loren, M.; Heun, H.; McNiel, E.; Griffioen, A.W.; Mayo, K.H.; Griffin, R.J. Scheduling of radiation with angiogenesis inhibitors Anginex and Avastin improves therapeutic outcome via vessel normalization. Clin. Cancer Res. 2007, 13, 3395–3402. [Google Scholar] [CrossRef] [PubMed]
- Casciari, J.; Sotirchos, S.; Sutherland, R. Mathematical modelling of microenvironment and growth in EMT6/Ro multicellular tumour spheroids. Cell Prolif. 1992, 25, 1–22. [Google Scholar] [CrossRef] [PubMed]
- Clough, G.; Smaje, L. Exchange area and surface properties of the microvasculature of the rabbit submandibular gland following duct ligation. J. Physiol. 1984, 354, 445–456. [Google Scholar] [CrossRef] [PubMed]
- Kuznetsov, M.B.; Kolobov, A.V. Transient alleviation of tumor hypoxia during first days of antiangiogenic therapy as a result of therapy-induced alterations in nutrient supply and tumor metabolism—Analysis by mathematical modeling. J. Theor. Biol. 2018, 451, 86–100. [Google Scholar] [CrossRef] [PubMed]
- Baker, P.G.; Mottram, R. Metabolism of exercising and resting human skeletal muscle, in the post-prandial and fasting states. Clin. Sci. 1973, 44, 479–491. [Google Scholar] [CrossRef]
- Tuchin, V.; Bashkatov, A.; Genina, E.; Sinichkin, Y.P.; Lakodina, N. In vivo investigation of the immersion-liquid-induced human skin clearing dynamics. Tech. Phys. Lett. 2001, 27, 489–490. [Google Scholar] [CrossRef]
- Press, W.H.; Teukolsky, S.A.; Vetterling, W.T.; Flannery, B.P. Numerical Recipes, 3rd Edition: The Art of Scientific Computing; Cambridge University Press: Cambridge, UK, 2007. [Google Scholar]
- Boris, J.P.; Book, D.L. Flux-corrected transport. I. SHASTA, a fluid transport algorithm that works. J. Comput. Phys. 1973, 11, 38–69. [Google Scholar] [CrossRef]
- Kuznetsov, M.; Clairambault, J.; Volpert, V. Improving cancer treatments via dynamical biophysical models. Phys. Life Rev. 2021, 39, 1–48. [Google Scholar] [CrossRef] [PubMed]
- Herring, N.; Paterson, D.J. Levick’s Introduction to Cardiovascular Physiology; CRC Press: Boca Raton, FL, USA, 2018. [Google Scholar]
- Bergers, G.; Hanahan, D. Modes of resistance to anti-angiogenic therapy. Nat. Rev. Cancer 2008, 8, 592–603. [Google Scholar] [CrossRef] [PubMed]
Figure 1.
Scheme of the main interactions of the model governed by Equation (1). The green arrows denote the stimulating interactions, the red lines show the inhibiting interactions, and the white arrows correspond to the transitions of the variables.
Figure 1.
Scheme of the main interactions of the model governed by Equation (1). The green arrows denote the stimulating interactions, the red lines show the inhibiting interactions, and the white arrows correspond to the transitions of the variables.

Figure 2.
Left: tumor growth curves produced by Equations (1)–(4) with and without angiogenesis. Middle and Right: distributions of model variables for these simulations. The values of the variables for glucose, VEGF, and capillaries are renormalized for better visualization.
Figure 2.
Left: tumor growth curves produced by Equations (1)–(4) with and without angiogenesis. Middle and Right: distributions of model variables for these simulations. The values of the variables for glucose, VEGF, and capillaries are renormalized for better visualization.

Figure 3.
Left: tumor growth curves produced by Equations (1)–(4) under free tumor growth and with antiangiogenic therapy (AAT) starting at four different moments. Middle and Right: stable distributions of model variables for the simulations of AAT starting when the tumor reaches 1 mm and 4 mm in radius. The values of the variables for glucose and capillaries are renormalized for better visualization.

Figure 4.
Tumor growth curves produced by Equations (1)–(6) under free tumor growth, antiangiogenic therapy (AAT), chemotherapy (CT), and their combination, with AAT starting at the times of the different injections of the chemotherapeutic drug.
Figure 4.
Tumor growth curves produced by Equations (1)–(6) under free tumor growth, antiangiogenic therapy (AAT), chemotherapy (CT), and their combination, with AAT starting at the times of the different injections of the chemotherapeutic drug.


Table 1.
Model parameters.
| Parameter | Description | Value | Based on |
|---|---|---|---|
| Cells: | |||
| B | maximum rate of cell proliferation | 0.01 | [37] |
| critical stress for cell proliferation | 15 | [35] | |
| smoothing parameter of Heaviside function | 500 | [33] | |
| rate of death by starvation | 0.003 | [33,38] | |
| critical level of glucose for survival | 0.001 | [33] | |
| M | rate of degradation of dead cells | 0.01 | [33] |
| Stress: | |||
| k | solid stress coefficient | 500 | [33] |
| minimum fraction of interacting cells | 0.3 | [26] | |
| initial fraction of cells | 0.8 | [26] | |
| Interstitial fluid: | |||
| hydraulic conductivity of normal capillaries | 0.1 | [22] | |
| hydraulic conductivity of abnormal capillaries | 0.22 | [33] | |
| fluid pressure in capillaries | 4 | [22] | |
| hydraulic conductivity of lymphatic capillaries | 1300 | [22] | |
| lymph pressure | 0 | [22] | |
| K | tissue hydraulic conductivity | 0.1 | [39] |
| VEGF: | |||
| secretion rate | 1 | [40] | |
| internalization rate | 1 | [41] | |
| degradation rate | 0.01 | [42] | |
| diffusion coefficient | 21 | [42] | |
| Capillaries: | |||
| R | maximum rate of angiogenesis | 0.008 | [43] |
| maximum surface area density | 5 | [43] | |
| characteristic degradation rate | 0.03 | [43,44] | |
| coefficient of degradation in the tumor core | 2 | [43,44] | |
| normalization rate | 0.1 | [45] | |
| denormalization rate | 0.1 | [45] | |
| pruning rate | 0.002 | [45] | |
| Michaelis constant for VEGF action | 0.001 | [33] | |
| coefficient of active movement | 0.03 | [43,44] | |
| Glucose: | |||
| Michaelis constant for consumption | 0.01 | [46] | |
| permeability of normal capillaries | 4 | [47] | |
| permeability of abnormal capillaries | 10 | [48] | |
| parameter of consumption by proliferating cells | 1200 | [37] | |
| rate of consumption by normal tissue | 0.5 | [49] | |
| diffusion coefficient | 100 | [50] | |
Table 2.
Additional parameters of the model, accounting for chemotherapy.
| Parameter | Description | Value |
|---|---|---|
| Cells: | ||
| sensitivity to chemotherapeutic agent | 0.05 | |
| Chemotherapeutic agent: | ||
| fraction of available pore cross-section area, normal capillaries | 0.09 | |
| fraction of available pore cross-section area, abnormal capillaries | 0.58 | |
| diffusive permeability, normal capillaries | 0.007 | |
| diffusive permeability, abnormal capillaries | 0.25 | |
| diffusion coefficient | 13 | |
| clearance rate | 0.0015 | |
Disclaimer/Publisher’s Note: The statements, opinions and data contained in all publications are solely those of the individual author(s) and contributor(s) and not of MDPI and/or the editor(s). MDPI and/or the editor(s) disclaim responsibility for any injury to people or property resulting from any ideas, methods, instructions or products referred to in the content. |
© 2024 by the authors. Licensee MDPI, Basel, Switzerland. This article is an open access article distributed under the terms and conditions of the Creative Commons Attribution (CC BY) license (https://creativecommons.org/licenses/by/4.0/).
Share and Cite
MDPI and ACS Style
Kuznetsov, M.; Kolobov, A. Antiangiogenic Therapy Efficacy Can Be Tumor-Size Dependent, as Mathematical Modeling Suggests. Mathematics 2024, 12, 353. https://0-doi-org.brum.beds.ac.uk/10.3390/math12020353
AMA Style
Kuznetsov M, Kolobov A. Antiangiogenic Therapy Efficacy Can Be Tumor-Size Dependent, as Mathematical Modeling Suggests. Mathematics. 2024; 12(2):353. https://0-doi-org.brum.beds.ac.uk/10.3390/math12020353
Chicago/Turabian StyleKuznetsov, Maxim, and Andrey Kolobov. 2024. "Antiangiogenic Therapy Efficacy Can Be Tumor-Size Dependent, as Mathematical Modeling Suggests" Mathematics 12, no. 2: 353. https://0-doi-org.brum.beds.ac.uk/10.3390/math12020353
Note that from the first issue of 2016, this journal uses article numbers instead of page numbers. See further details here.