1. Introduction
In high speed vehicle impacts the role of the structure is of uttermost importance, in that it must absorb as much energy as possible. The structure includes elements with a well defined stiffness and is designed to deform under impact so that the kinetic energy is transformed into plastic deformation. A proper design allows for a controlled deceleration, limiting the maximum acceleration values, all of which help to guarantee the survival probability for the passengers.
Formula Student cars are created and managed by teams of engineering students all over the world, modifying and improving the cars year after year. The FS 2017–2018 rules [
1] define design conditions for a list of car components, in particular concerning the Energy Absorption system. This system must include an Impact Attenuator and an Anti-Intrusion Plate. This study focuses on an Impact Attenuator structure designed for a racing car under the Formula Student (FS) regulations.
The FS rules require that the dynamic response of the Energy Absorption system should be such that, for a 300 kg car impacting into a rigid barrier at 7 m/s speed, the acceleration peak cannot exceed the value 40 g, and the acceleration mean value must be below 20 g. The absorbed energy must be of at least 7350 J and permanent deformation cannot exceed the value of 25 mm.
Some Energy Absorber systems for FS cars are studied in different works. There are single and multiple thin-wall cell designs [
2]; aluminum honeycomb structures [
3] and mixed aluminum structures with a honeycomb core and a sheet cover [
4,
5]. Due to the weight limitations for the FS cars, there are proposals to include composites [
6,
7], and alternative materials [
8]. This work considers the simplest case of an Impact Attenuator, built with aluminum sheets welded together.
Impact Attenuators are tested under different conditions: static conditions [
3,
7], dynamical tests [
4,
6], and also fully installed in a car [
5]. In the case studied, the test was carried out in a drop-tower, where only the attenuator was present (without any of the tubes from the chassis). Since the regulation requires a relevant part of the chassis to be present, we first construct a model that is validated with the results from the test. Then, we complete that model with part of the chassis, now complying with the regulation standards, to check if the energy absorption requirements established in the regulation are fulfilled.
To construct a model able to accurately reproduce the real behavior of the material, the plastic behavior is considered. This is usually the case in the simulation of this type of structures [
9]. The novelty presented in this work is the addition of weld characteristics and weld failure to the absorber model. The welding is continuous and it is studied considering it as a discrete connection between nodes. Detailed models are rather common for spot-welded parts due to its generalized use in the automotive industry.
However, continuous welding is almost always disregarded for parts evaluated with explicit simulation [
9,
10]. For the simulation of the plates in spot-welds, Cheng [
11] compared the performance of shell elements with purely three-dimensional elements, finding that the stress field in two-dimensional (2D) models and three-dimensional (3D) models were quite similar, even in the prediction of through-thickness stress. For the simulation of the spot-weld, it is usually proposed a one-dimensional (1D) model [
12,
13,
14]. Xiang [
15] compared 16 spot-weld models (1D, 2D and 3D) and drew two main conclusions. On the one hand, 1D rigid-bar models where accurate enough once the spot-weld model represent the dimension of the real spot-welds. On the other hand, rigid-node spot weld models were suitable for crash analysis when there is no spot-weld failure due to its least modeling effort. Therefore, the simplest models can describe the results accurately enough.
Almost always authors deal with Finite Element (FE) models under static conditions [
11,
15,
16,
17] and with no spot-weld failure [
16,
17]. Only a few works deal with spot-weld failure including true separation between nodes: authors in [
13] consider a single non-linear spring under static conditions; in [
12] is proposed a single spring where a damage function is defined but validated only with low strain rate tests. Literature where spot-weld failure definition is included in impact test is scarce [
18,
19,
20]. In this work, we deal with weld failure in impact tests including a continuum welding type.
The proposed approach is different from usual works on fatigue failure described according to elastic laws or even non-linear approximations, which are only valid for static analysis. The novelty of the model presented here is based on the discretization of a continuum welding and its application to an impact problem, where the qualitatively results of the weld failure are reproduced.
Concerning the welding process, FE models enable virtual examination of the welding process [
21] where the thermal cycle causes residual stresses and structural distortion of the affected parts. A review of different FE methods applied to welding processes is done by Marques et al. in [
22]. The goal of some of the methods is evaluating residual stresses in welded joints [
23,
24], or inherent deformations due to thermal effects [
25,
26].
The control of imperfections is a major concern in mechanical systems [
27], and in the presented case of this work the control of residual deformations is crucial because these deformations strongly define the buckling onset of thin-walled structures [
28,
29]. The structure may include defaults made in purpose to trigger the proper folding pattern [
30,
31] and consequently the proper behavior of the simulation. In a previous work [
28] some of the present authors discussed the influence of the position of a deformation trigger in the folding pattern, and also tested the influence of weakened welded regions on the acceleration profile. In this new work, an improved definition of the welding model is used, reaching more accurate results once compared to experimental results.
The paper is structured as follows. In
Section 2, the mathematical problem is properly defined and its numerical resolution is briefly commented. Then, we study two different models. First, in
Section 3, we evaluate the attenuator in isolation, in the conditions that an experimental test was carried. Second, the attenuator together with the front part of the chassis is simulated, in order to reproduce the conditions required by the regulation for this type of test. This is shown in
Section 4. Finally, some conclusions are presented in
Section 5.
2. Mathematical Model and Numerical Resolution
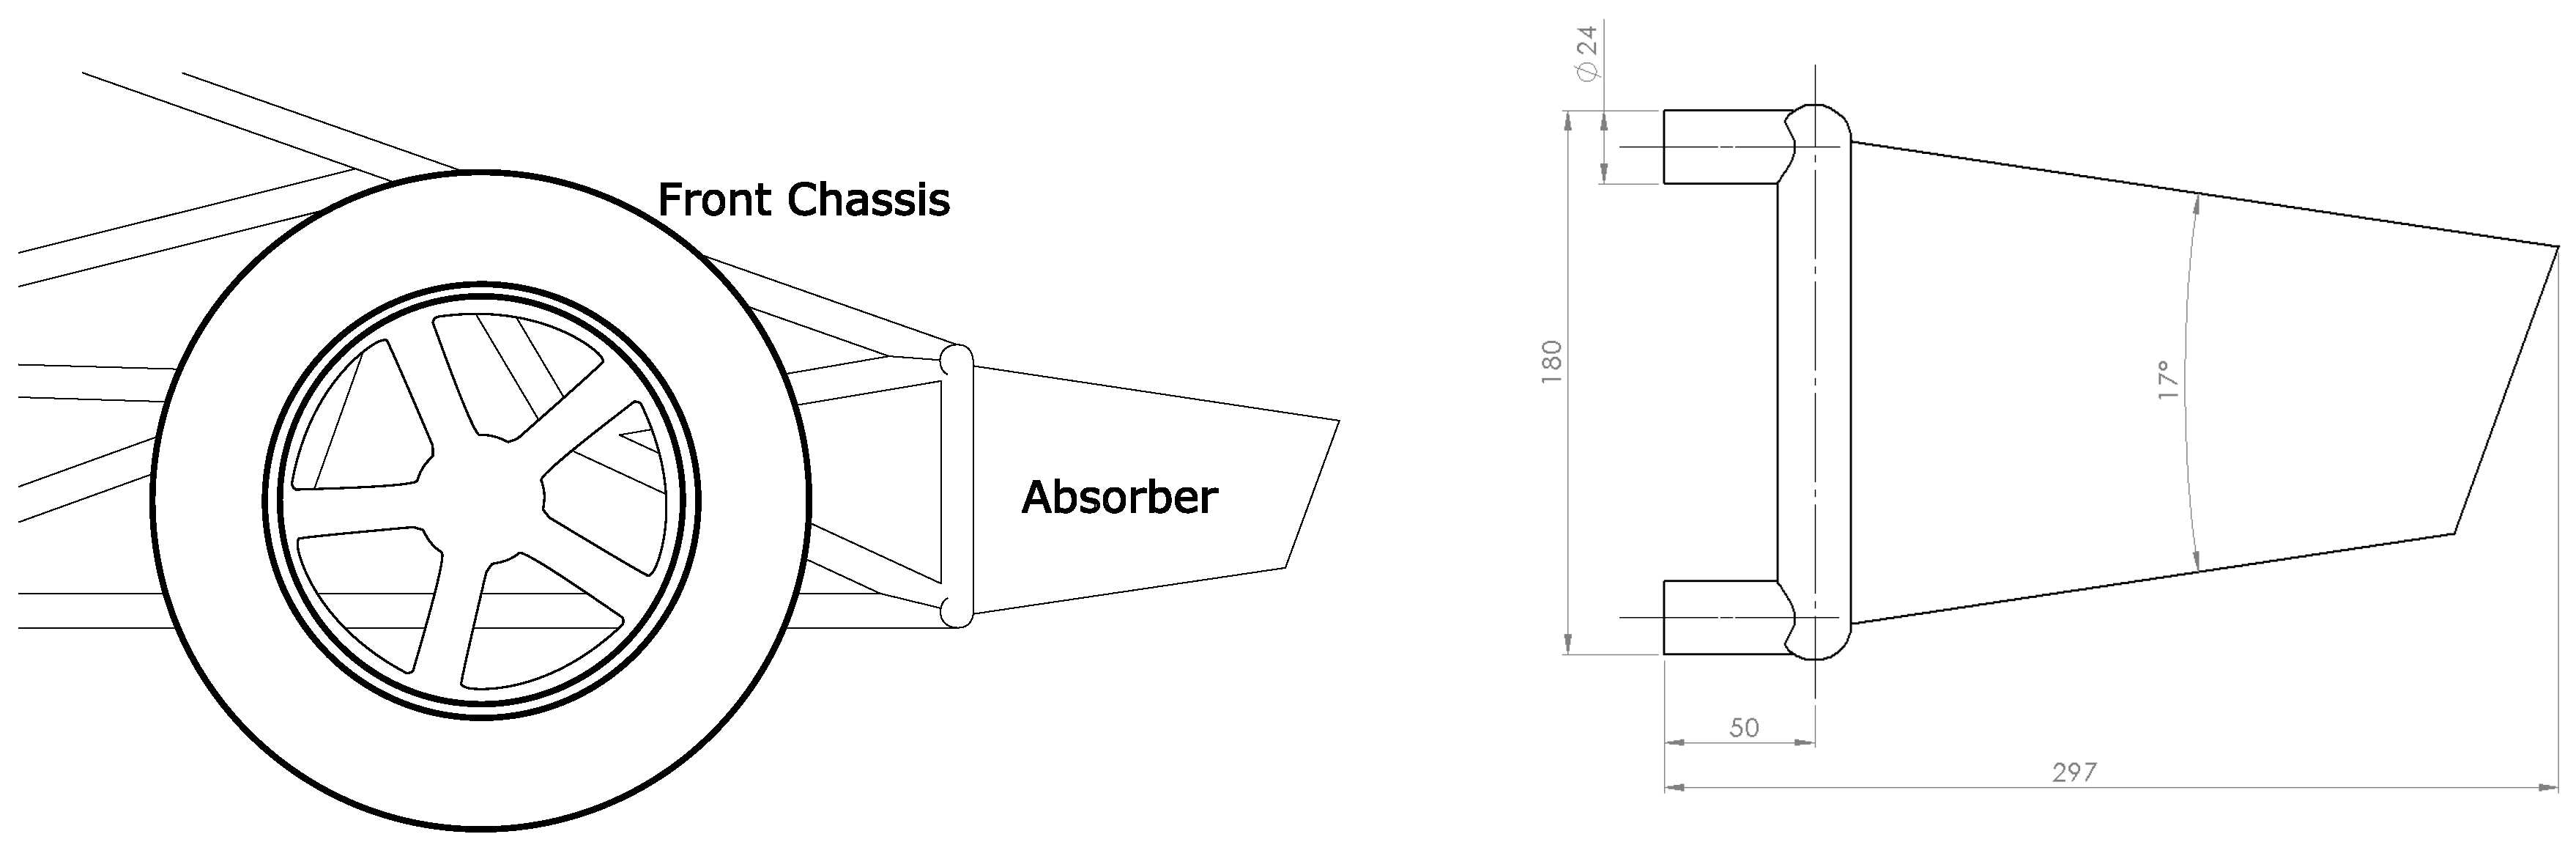
In this section we provide the mathematical description of the mechanical problem, as well as some important details about the numerical resolution using the finite element method. The three-dimensional geometry of the energy attenuator is obtained from the real test. It consists of a truncated pyramid with rectangular basis and inscribed within an envelope with a prescribed size (see
Figure 1). The material model as well as the model used in the welded parts are described next. However, the boundary conditions are detailed, for each particular case, in the following sections.
2.1. Plasticity
In order to define the material behavior for the attenuator, we used the classical definition of an elasto-plastic material with isotropic hardening. This avoids the Bauschinger effect when dealing with large deformations [
32]. The material behaves as isotropic linear elastic until the yield condition is fulfilled. To define the yield condition the classical von Mises criterion is used (see [
33] for details). This criterion is mainly based on the deviatoric stress tensor, so its definition is made according to the following equation:
where
represents the second invariant of the deviatoric stress tensor, and
states a dependence of the elastic yield stress on the constitutive parameters which defines the material hardening. In our case, we used the following expression:
Here, , and denote the constant elastic limit, the tangent modulus at time and the equivalent plastic strain (computed according to the von Mises criterion), respectively.
The deviatoric stress tensor is obtained through the decomposition of the full stress tensor into this deviatoric component
p, and the volumetric one
:
Then, the second invariant is computed according to its definition:
Therefore, according to the previously detailed yield criterion, there are two possibilities for the
value. If
, the von Mises criterion is fulfilled, and therefore the material is yielding, while if
the material behaves as linear elastic. In the case of
, the yielding behavior has to be governed, so a flow rule must be defined. It is generally written in terms of a plastic potential function. Since an incremental formulation is applied, we use the plastic potential to derive the plastic strain increment in the following form:
where
is a positive scalar of proportionality,
is the plastic potential and the flow rule is governed by its gradient in terms of stress:
Considering that expression
defines a surface in the stress domain, the flow rule equations suggest that yielding is produced in a normal direction to such surface. In addition, in this case we assume an associative flow rule, therefore the expression for
is exactly the same as for
. Finally, these definitions are used together with the constitutive relation to derive the stress increment as a function of strain increments:
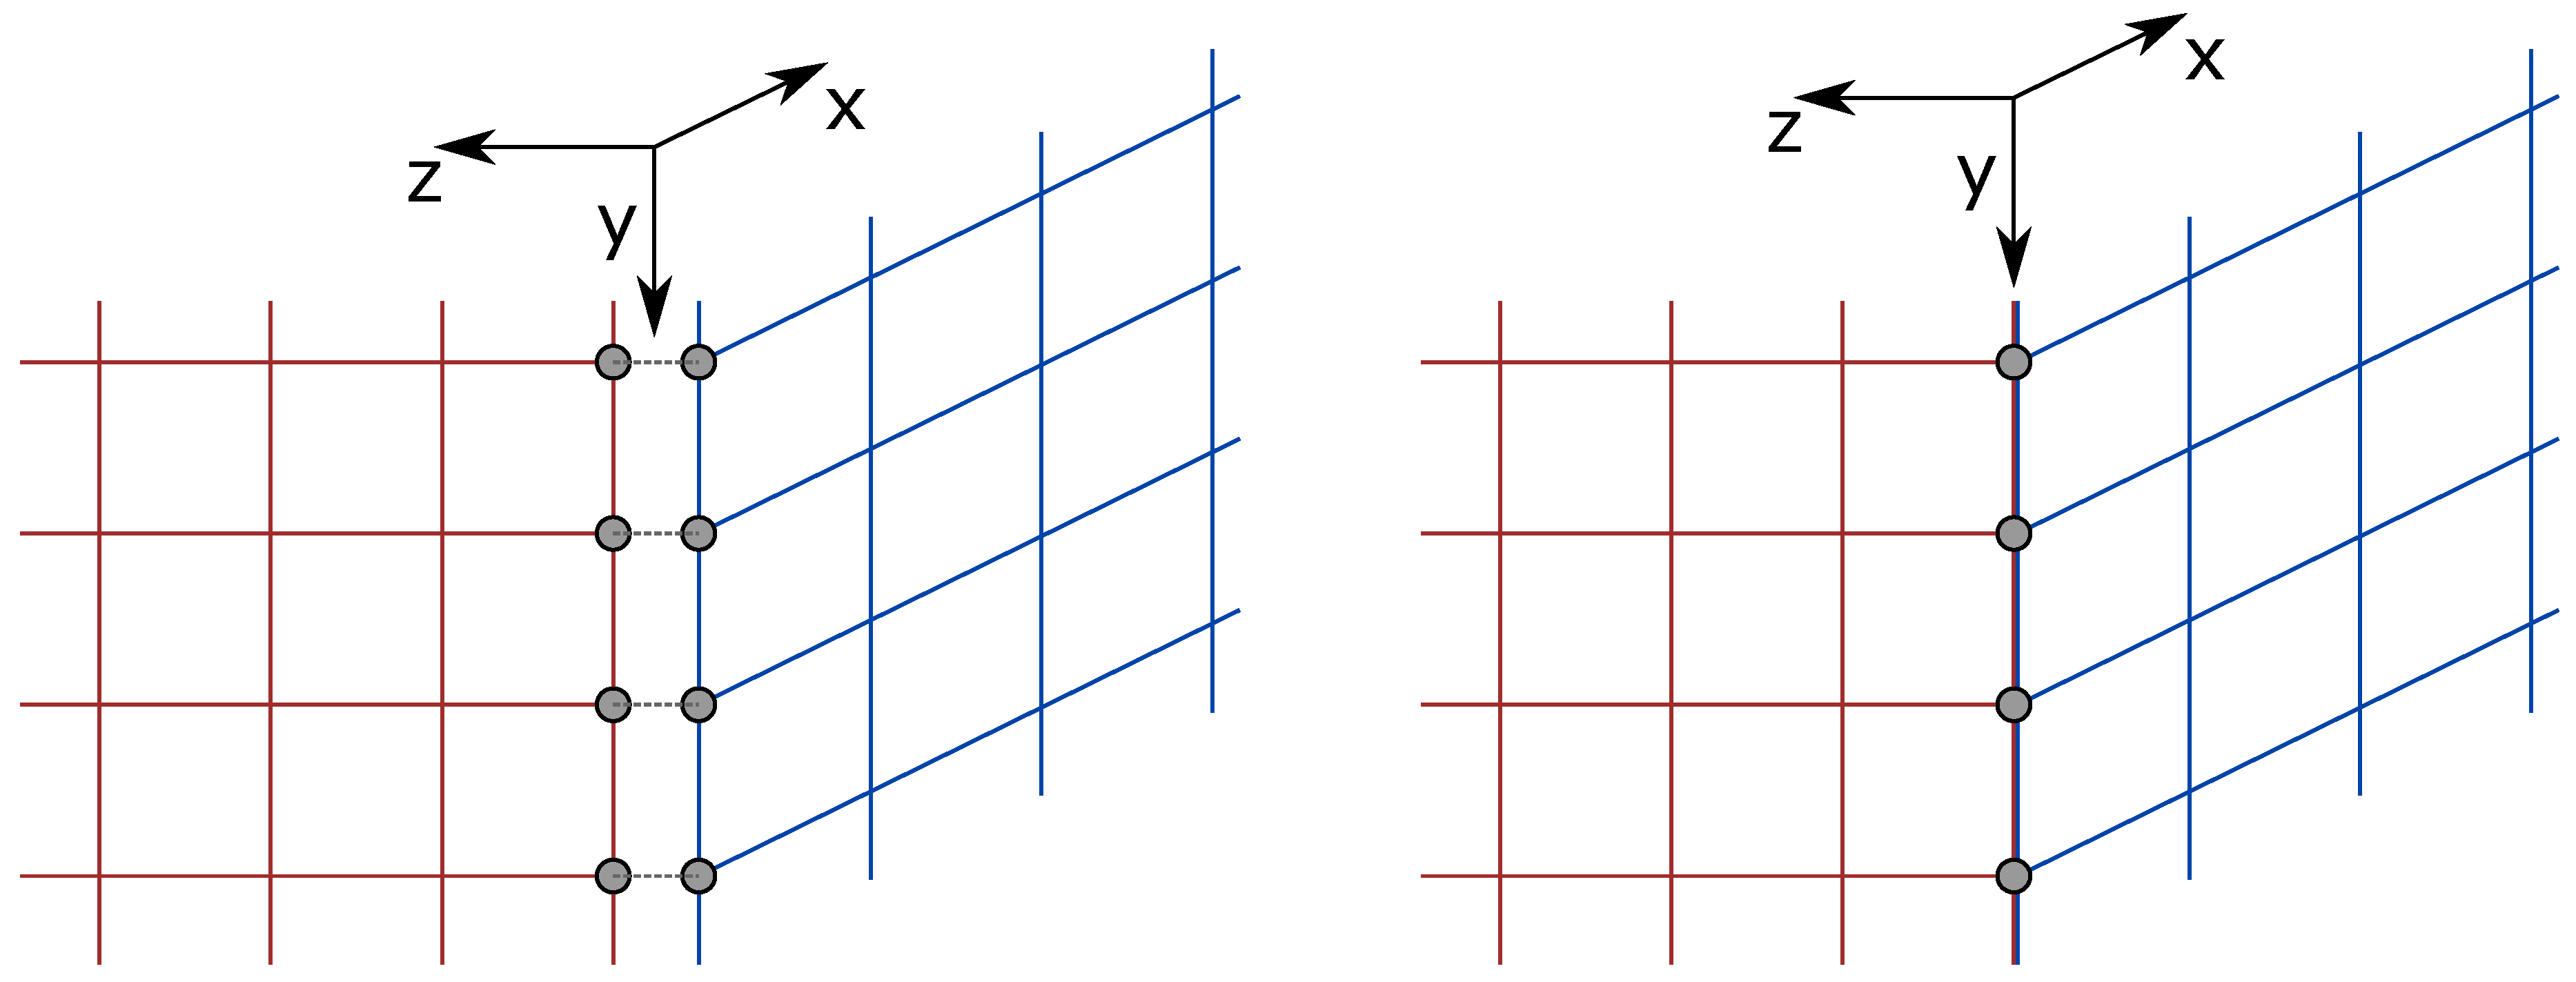
2.2. Weld
To simulate the welding behavior, a discrete definition of the weld joint is used. We assume that the side plates that compose the attenuator are welded together. To perform such definition, the (conforming) nodes of adjacent parts are taken by pairs; each pair is perfectly joined using a rigid body with the geometry of a weld fillet and, in each computation cycle, the stress-state of such body is updated. If the stress fulfills the following criterion, the welding joint fails and the corresponding nodes are free to separate:
where
is the normal stress,
is the shear stress through the local direction
,
is the shear stress through the local direction
and
is a given parameter related to the welding strength. To evaluate such criterion, a local coordinate system has to be defined. To illustrate how the nodes of two different parts are connected and how the local coordinate system is defined, an example is shown in
Figure 2.
The same definitions and procedures are applied to each pair of nodes that are welded together. Therefore, the continuous weld filled in the actual attenuator is approximated as a finite number of node’s pairs joined with a breakable join that is supposed to be able to reproduce the real weld behavior.
2.3. Spatial Discretization
The nonlinear problem described above is solved numerically and implemented using the commercial code LS-DYNA, a well suited program for strongly nonlinear materials and large deformations. The program implements the Finite Element Method to solve the problem.
In this case, since the attenuator is composed of metal sheets with a relative low thickness, we have decided to use three-dimensional quadrilateral shell elements with four nodes. Elements are fully integrated and five layers are used across thickness to increase the accuracy of the integration process.
2.4. Temporal Discretizaton
The problem studied in this paper is a transient problem, therefore it is needed to perform also a temporal discretization. Impact problems are relatively fast studies with strong non-linearities and large deformations. As a consequence, an explicit integration scheme is the most suitable method to solve them.
LS-DYNA uses explicit dynamic schemes to perform time integration of the solids mechanics equations (in particular, the central difference method is employed). The main drawback of these explicit methods is that they are potentially unstable, therefore the time step is computed in each cycle using the Courant-Friedrichs-Levy (CFL) criterion [
34]. In addition, a safety factor of 0.9 is applied over the time step computed using the CFL criterion in order to ensure the stability of the method.
For each time step, the computation begins with the deformation of the nodes (data provided by the previous step or the initial conditions), producing a strain in the elements, and therefore, a stress-state that depends on the material’s constitutive law. As a consequence, internal forces applied over the nodes can be computed and, in addition, external forces from boundary conditions, contacts and volumetric forces must be taken into account to calculate the total nodal forces. Finally, acceleration is obtained by dividing each nodal force by the corresponding nodal mass and, using the explicit integration scheme, velocity and displacement are computed. This procedure is then repeated for each time step until the final time is achieved.
3. Validation Case: Comparison with an Experimental Test
This model is constructed to reproduce an experimental test that was performed with the real attenuator. The details of the simulation model and experimental test are given below.
A general overview of the methodology is shown in
Figure 3, left panel. As can be seen there, from the CAD geometry we define both mesh and boundary conditions of the finite element model. Then, the numerical resolution of the resulting nonlinear discrete problem is implemented using LS-DYNA package by using an iterative scheme. Once the convergence is achieved, a comparison with the experimental data is performed. On the contrary, the mesh is refined and the procedure starts again.
The geometry of the attenuator consists of a truncated pyramid with rectangular base. The top of the pyramid is not flat but in a slight angle, and their dimensions are specified in
Figure 1. Complying with the SAE-Formula regulations, the dimensions of the attenuator are within an envelope of
mm
; the angles are also restricted. A three-dimensional view is also shown in
Figure 4. The material for this part is a sheet of aluminum alloy (EN AW 5083-O) with a thickness of 2.5 mm (see
Table 1 for details). As stated in the previous section, its plastic behavior is considered.
The lateral walls are all welded together. The properties for this weld are the fillet width, which is set to 3 mm, and the fillet length computed as the length of the edge divided by the number of elements in that edge (it varies from 5.3 to 4.5 mm). The thickness for the weld is the same as for the plate. Finally, the strength of the union is considered 260 MPa, according to [
35].
3.1. Real Test
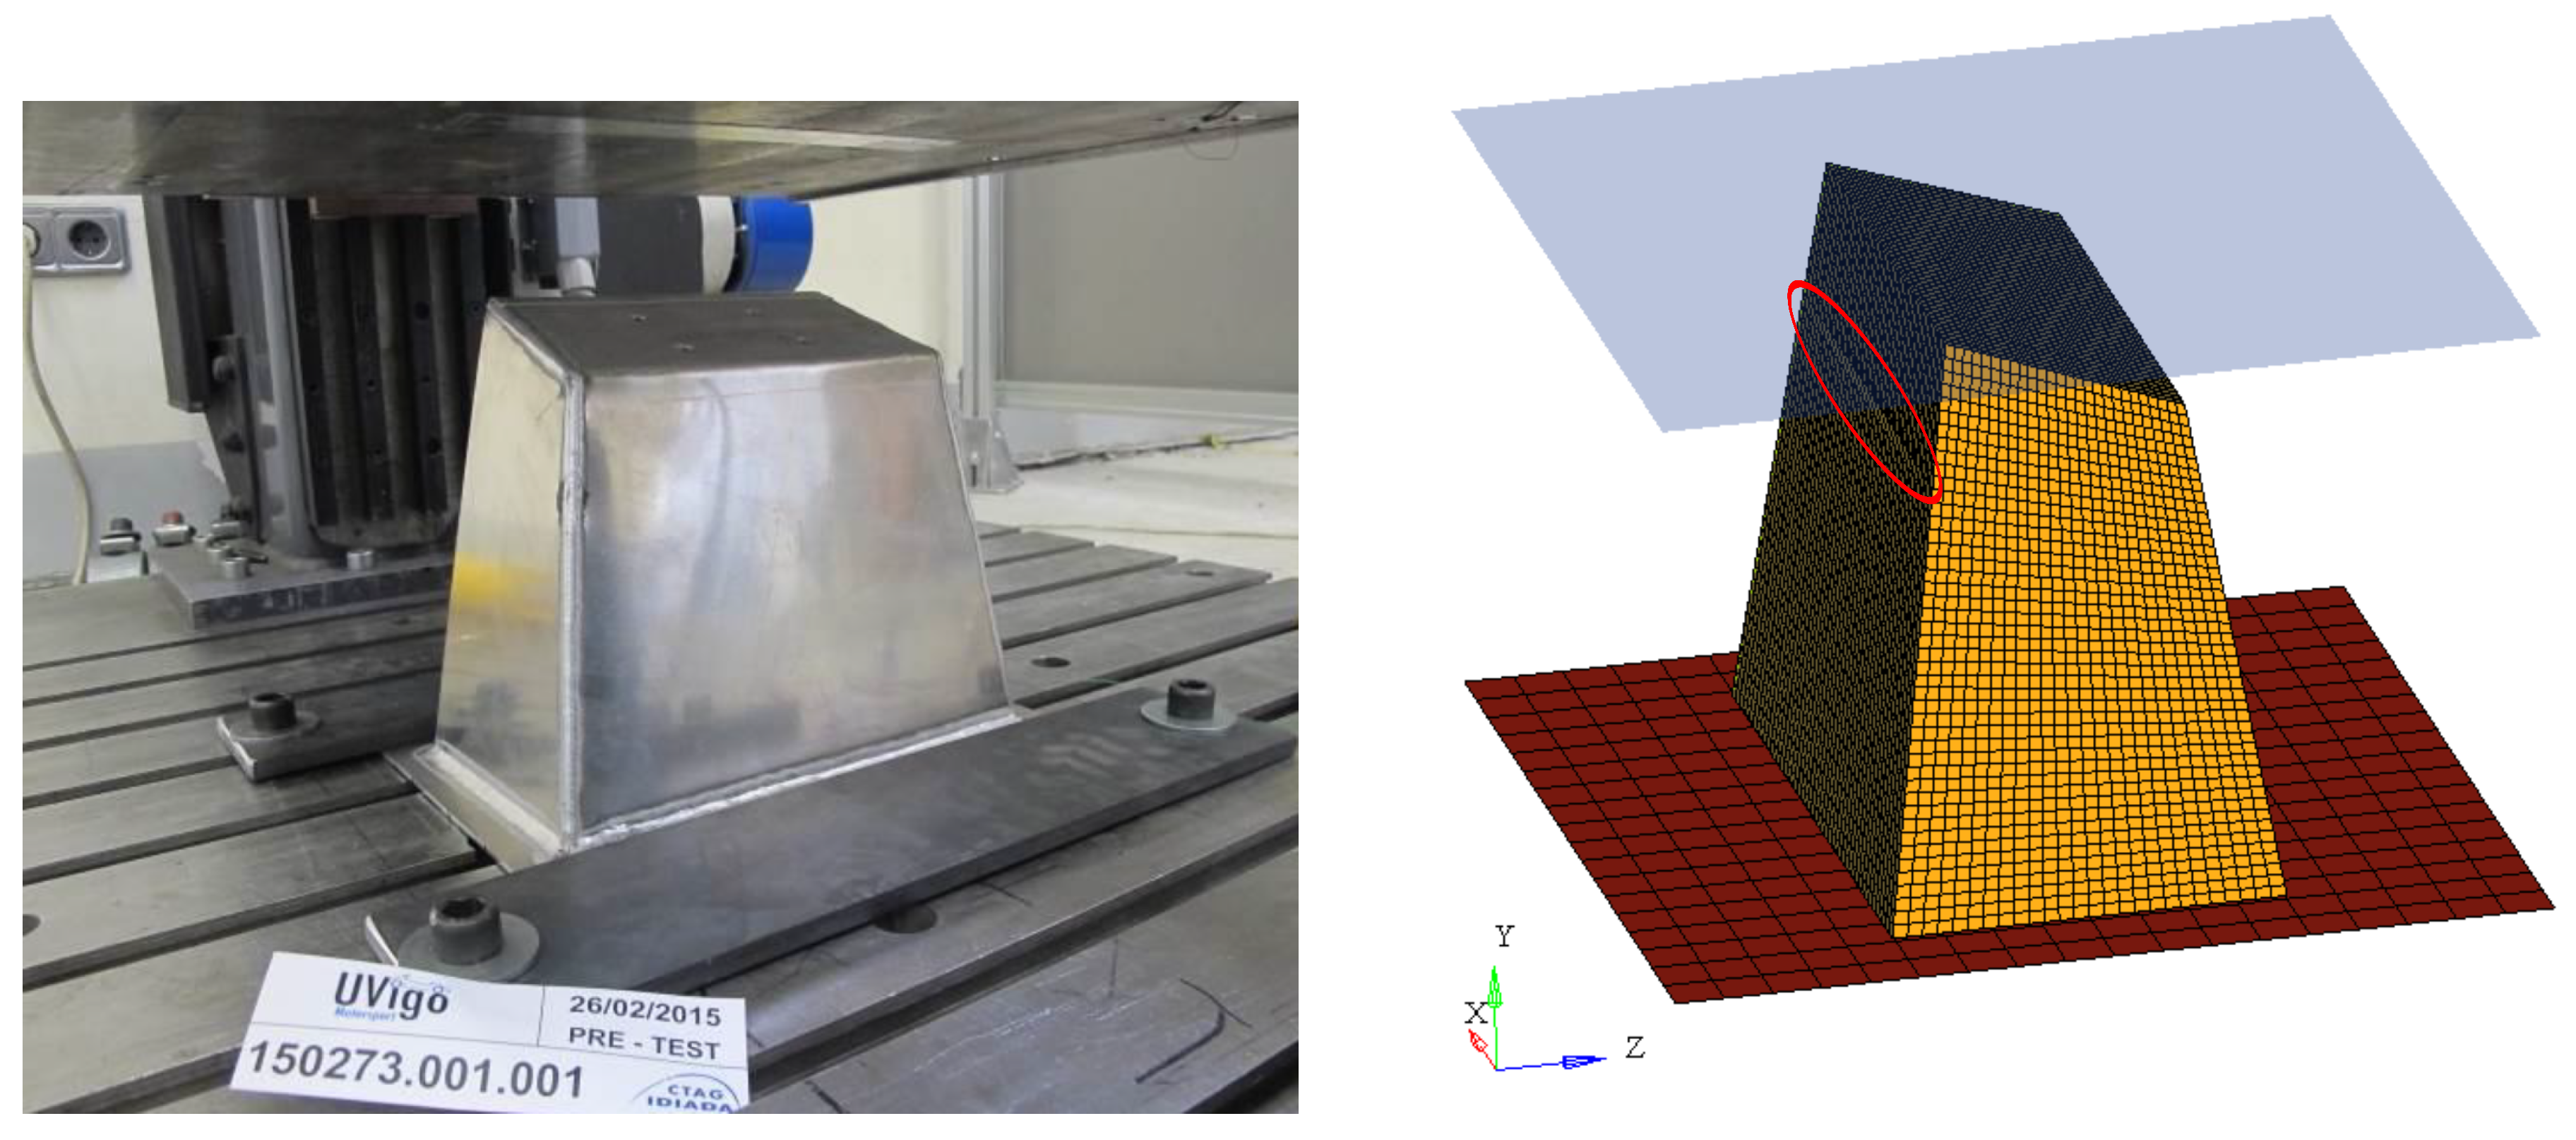
The attenuator was tested in a drop tower, allowing a direct comparison with the computed results. The test was performed at CTAG-IDIADA Safety Technology in Spain. As specified in the applicable regulation, a block with a weight of 348 kg was dropped from 2.13 m into the attenuator (reaching a velocity of 6.47 m/s before the impact). To obtain the measurements, a high speed camera (1000 FPS) recorded the test, and an accelerometer (Kyowa Electronic Instruments) was installed on the impact block. The raw data from the accelerometer was analyzed with a Channel Filter Class CFC-60 (100 Hz) following the regulation SAE-J211 (see the raw data in
Section 3.3). The attenuator was fixed to the floor on its base and the impact block advanced in the vertical direction. An image of the experimental setup is shown in
Figure 4 (left panel).
3.2. Finite Element Model
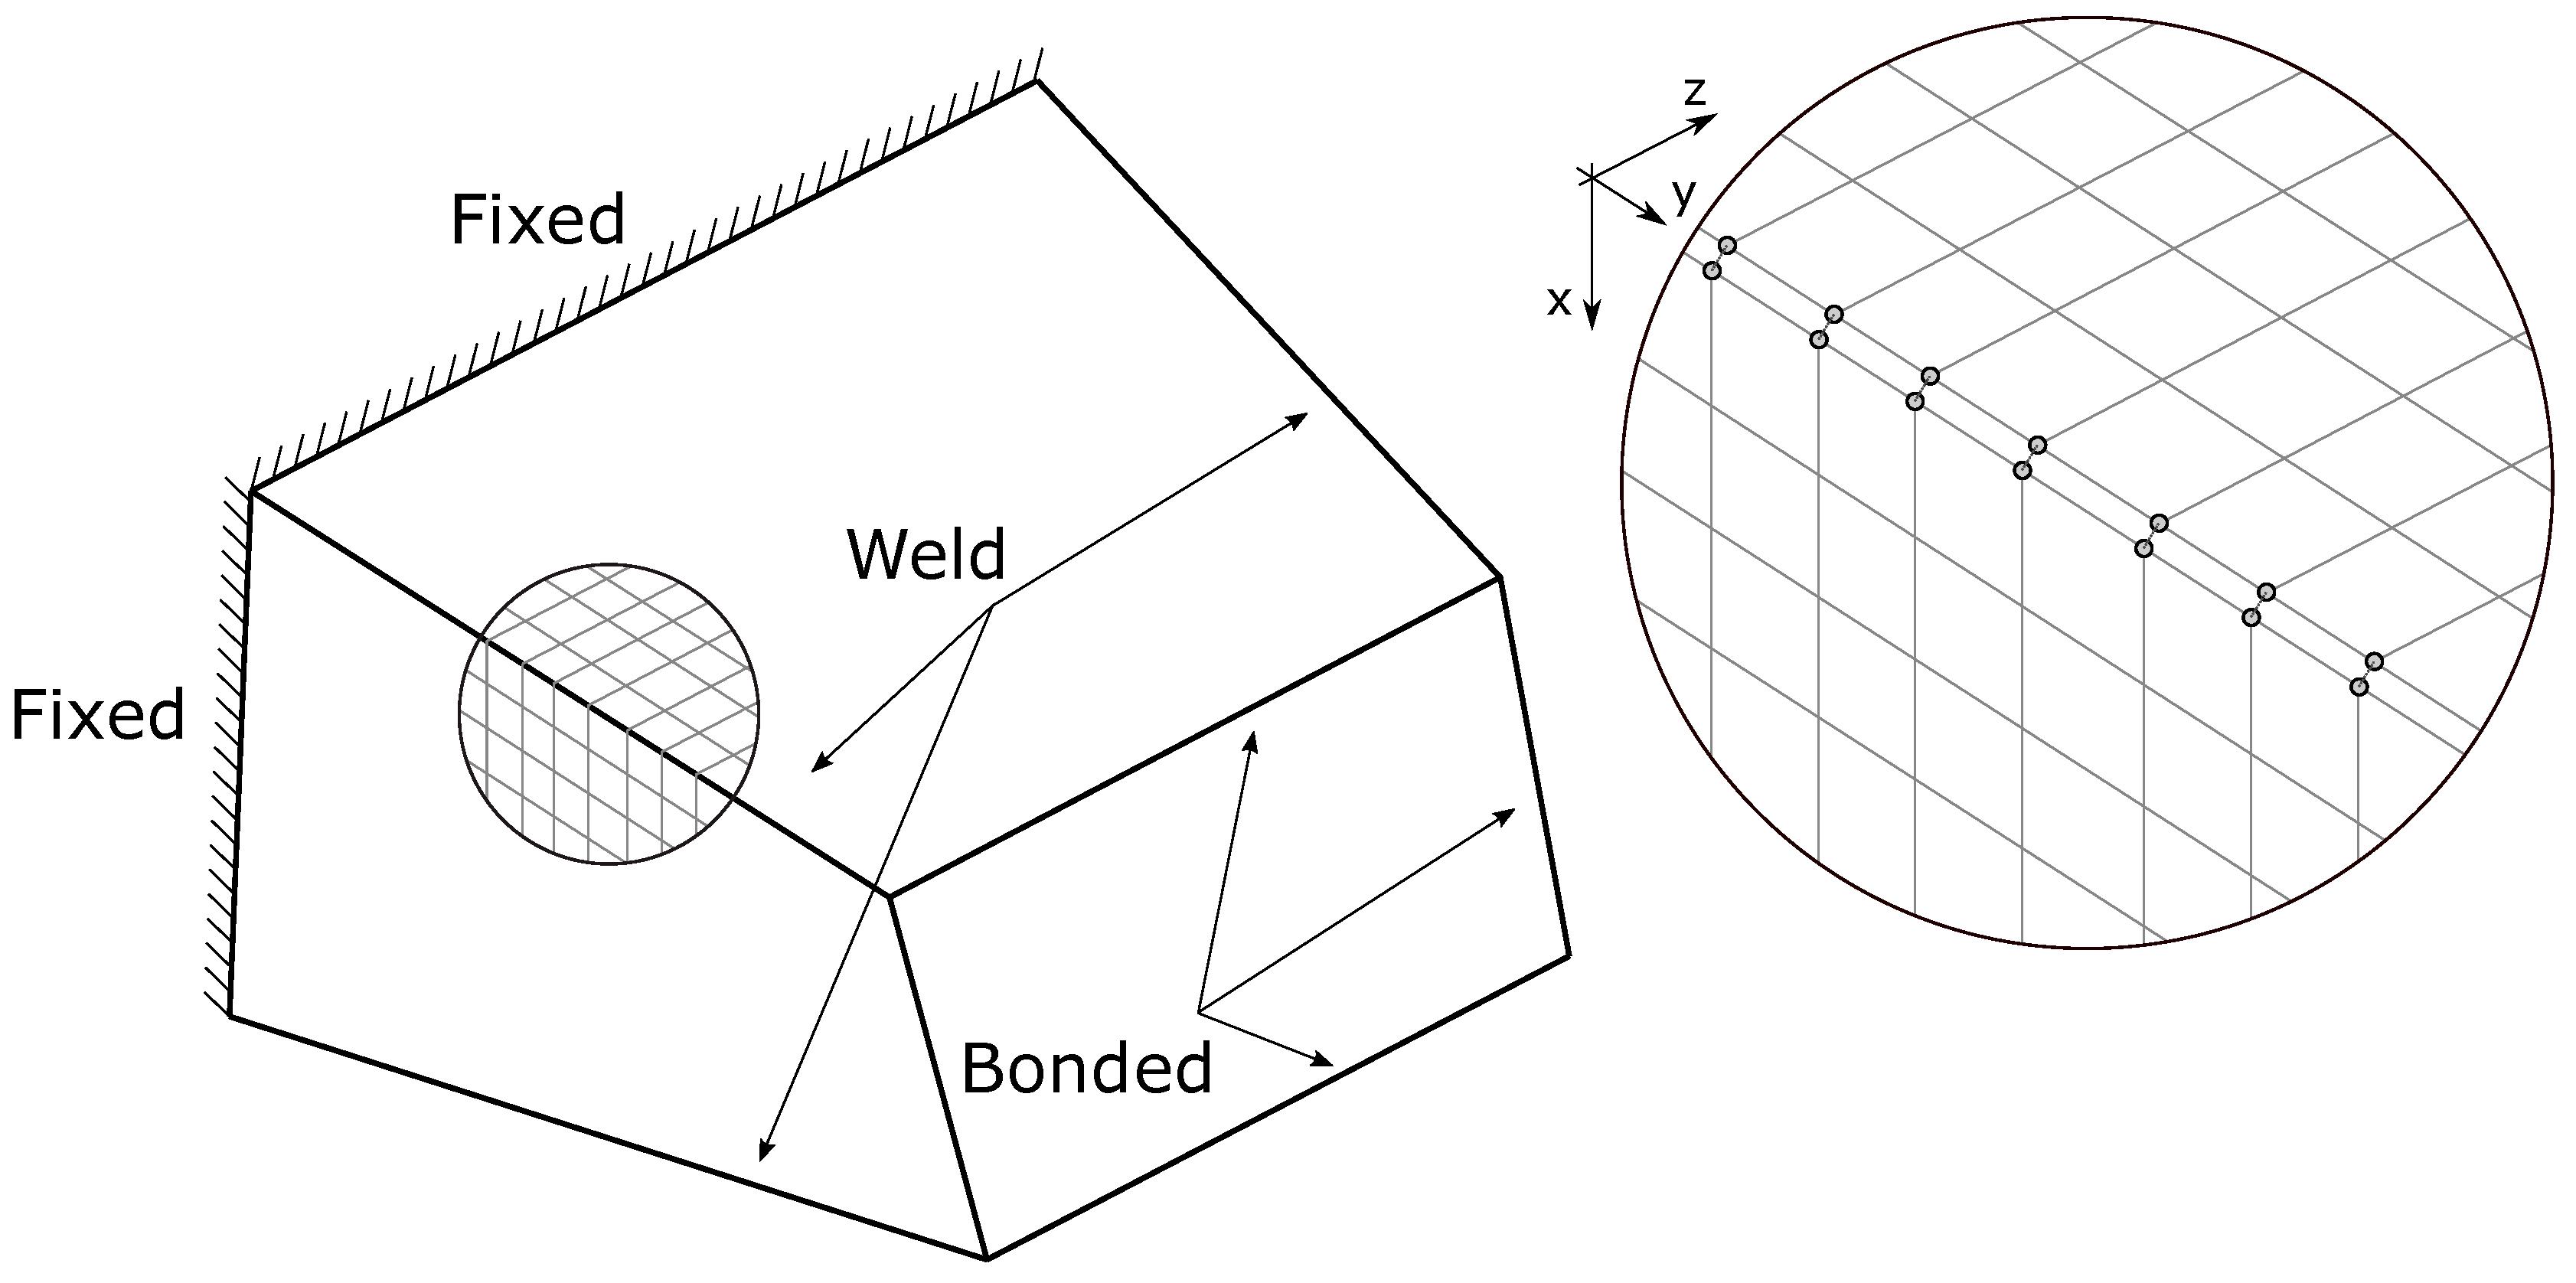
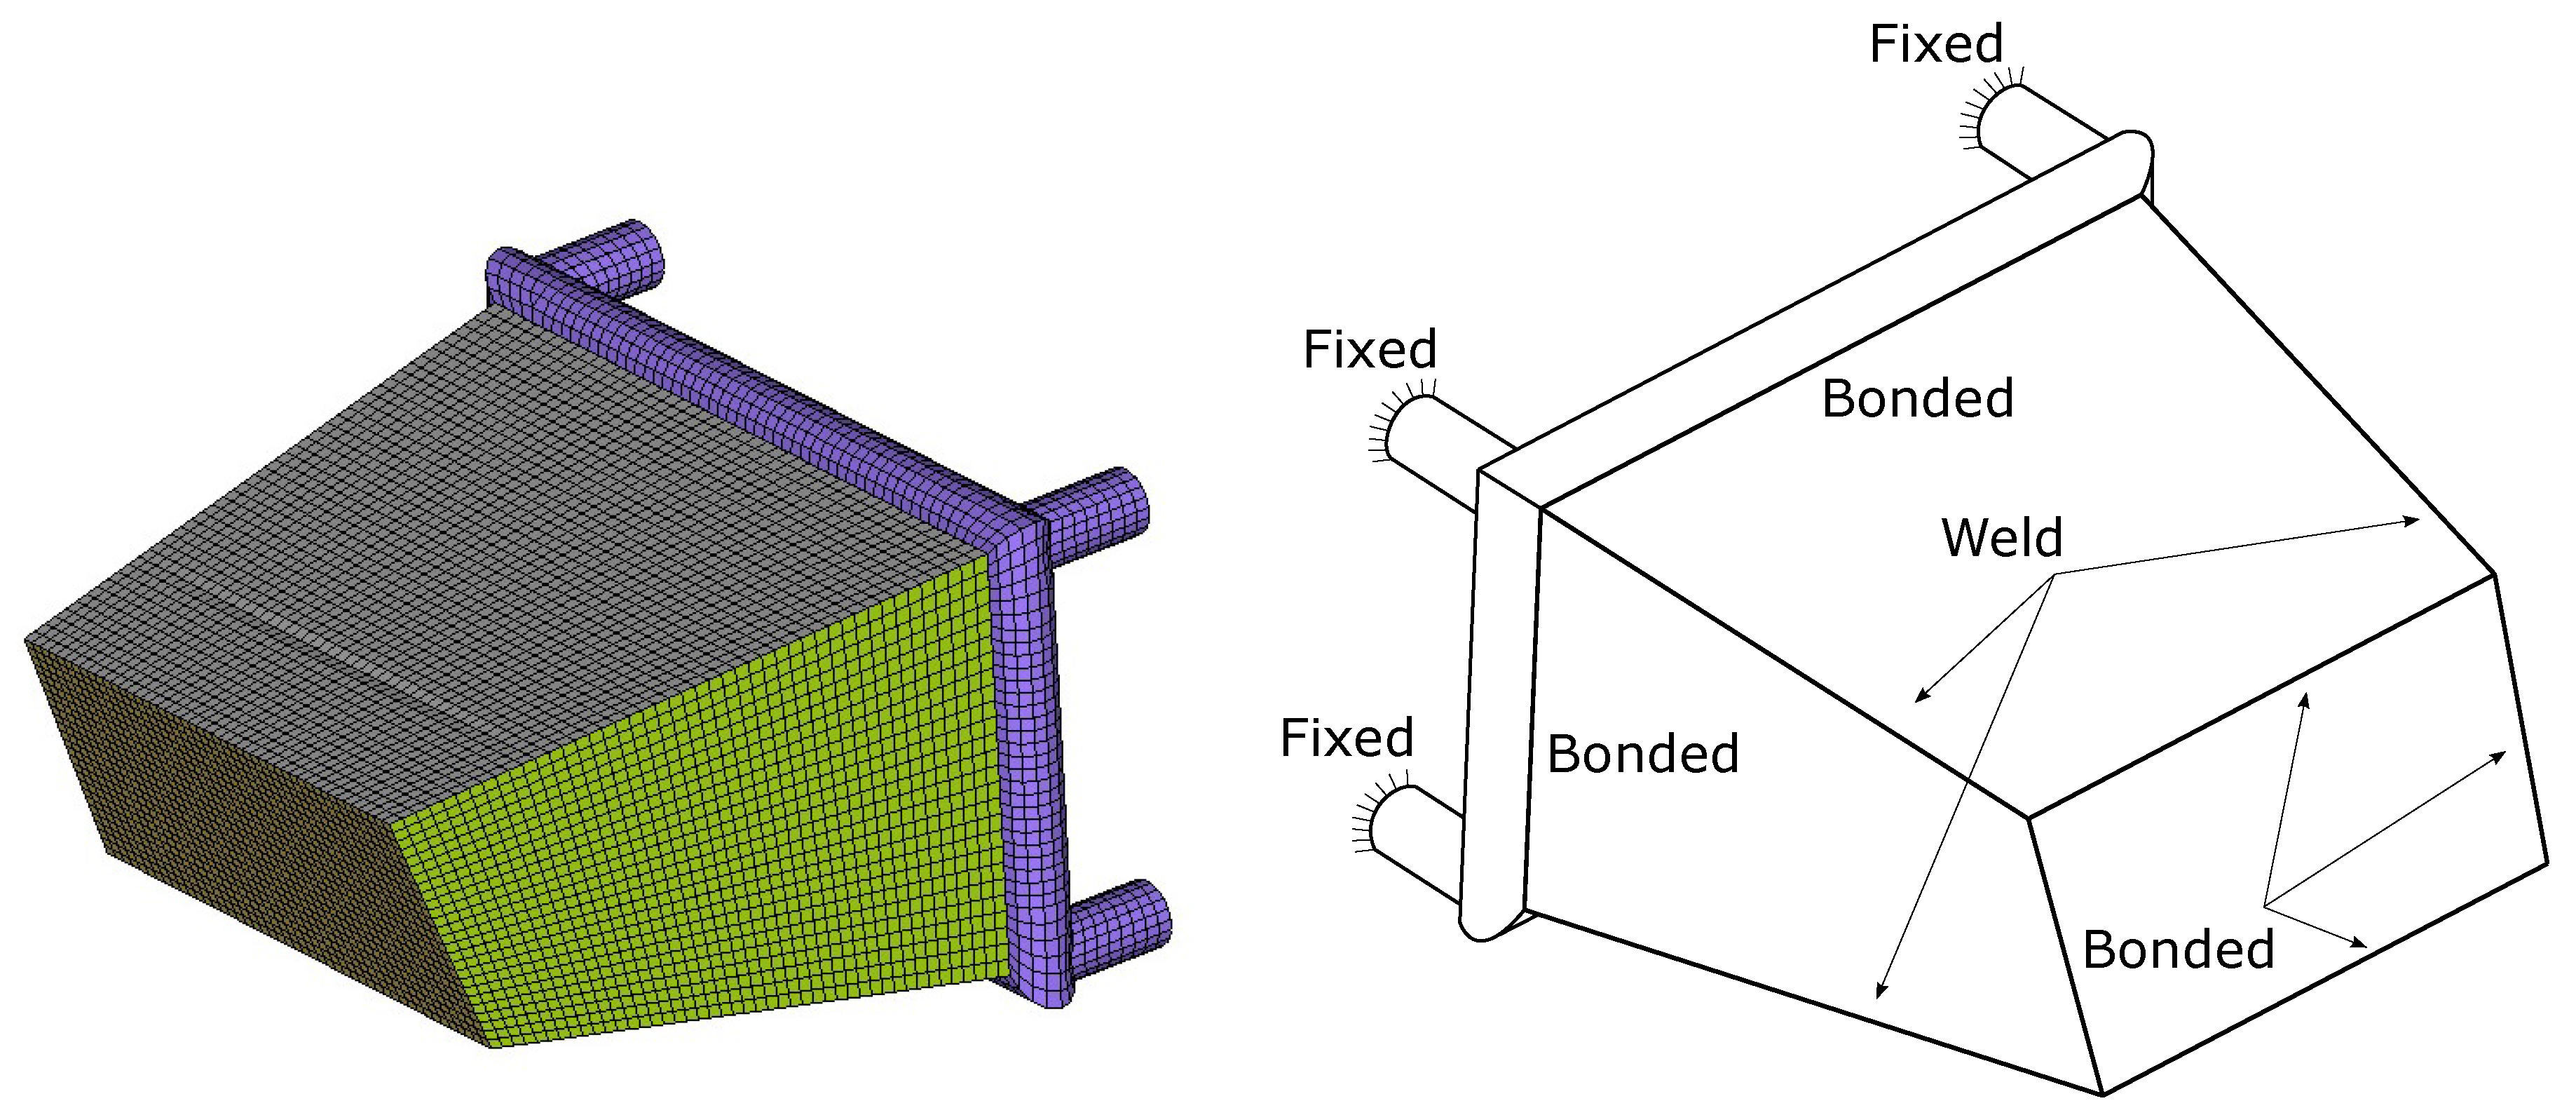
To reproduce the test conditions, the attenuator in the model is fixed on its base. The impact block is modeled as a rigid body that advances to the attenuator and becomes in contact at the impact velocity. It is depicted in
Figure 4, on the right panel, as a translucent blue surface. The welded and bonded walls are indicated in
Figure 5, as well as a detail of the mesh in a welded edge. To study the influence of the welding two cases are simulated. The formulation for weld failure was defined in the previous section.
Regarding the mesh shown in
Figure 4 (right panel), all the elements are defined as shells, and the discretization is made with quadrilateral elements (
quad 4). We study several mesh sizes, in order to observe its convergence. This analysis is detailed in the results section. Bonded elements with nonconforming meshes are imposed as Multi-Point Constraint (MPC) boundary conditions with restricted rotations [
36]. The contact with the impact block as well as the self-contact among the walls are modeled using a penalty formulation (see [
37]).
To be able to reproduce the folding pattern in the real test, an initial small deformation is introduced (highlighted in
Figure 4, right panel). This small defect (a deviation of the mesh nodes to the inside of the part) is located at 3/4 of the height and follows a cosine shape with one peak that will allow to reproduce the initial fold in the buckling pattern [
29,
38].
3.3. Results
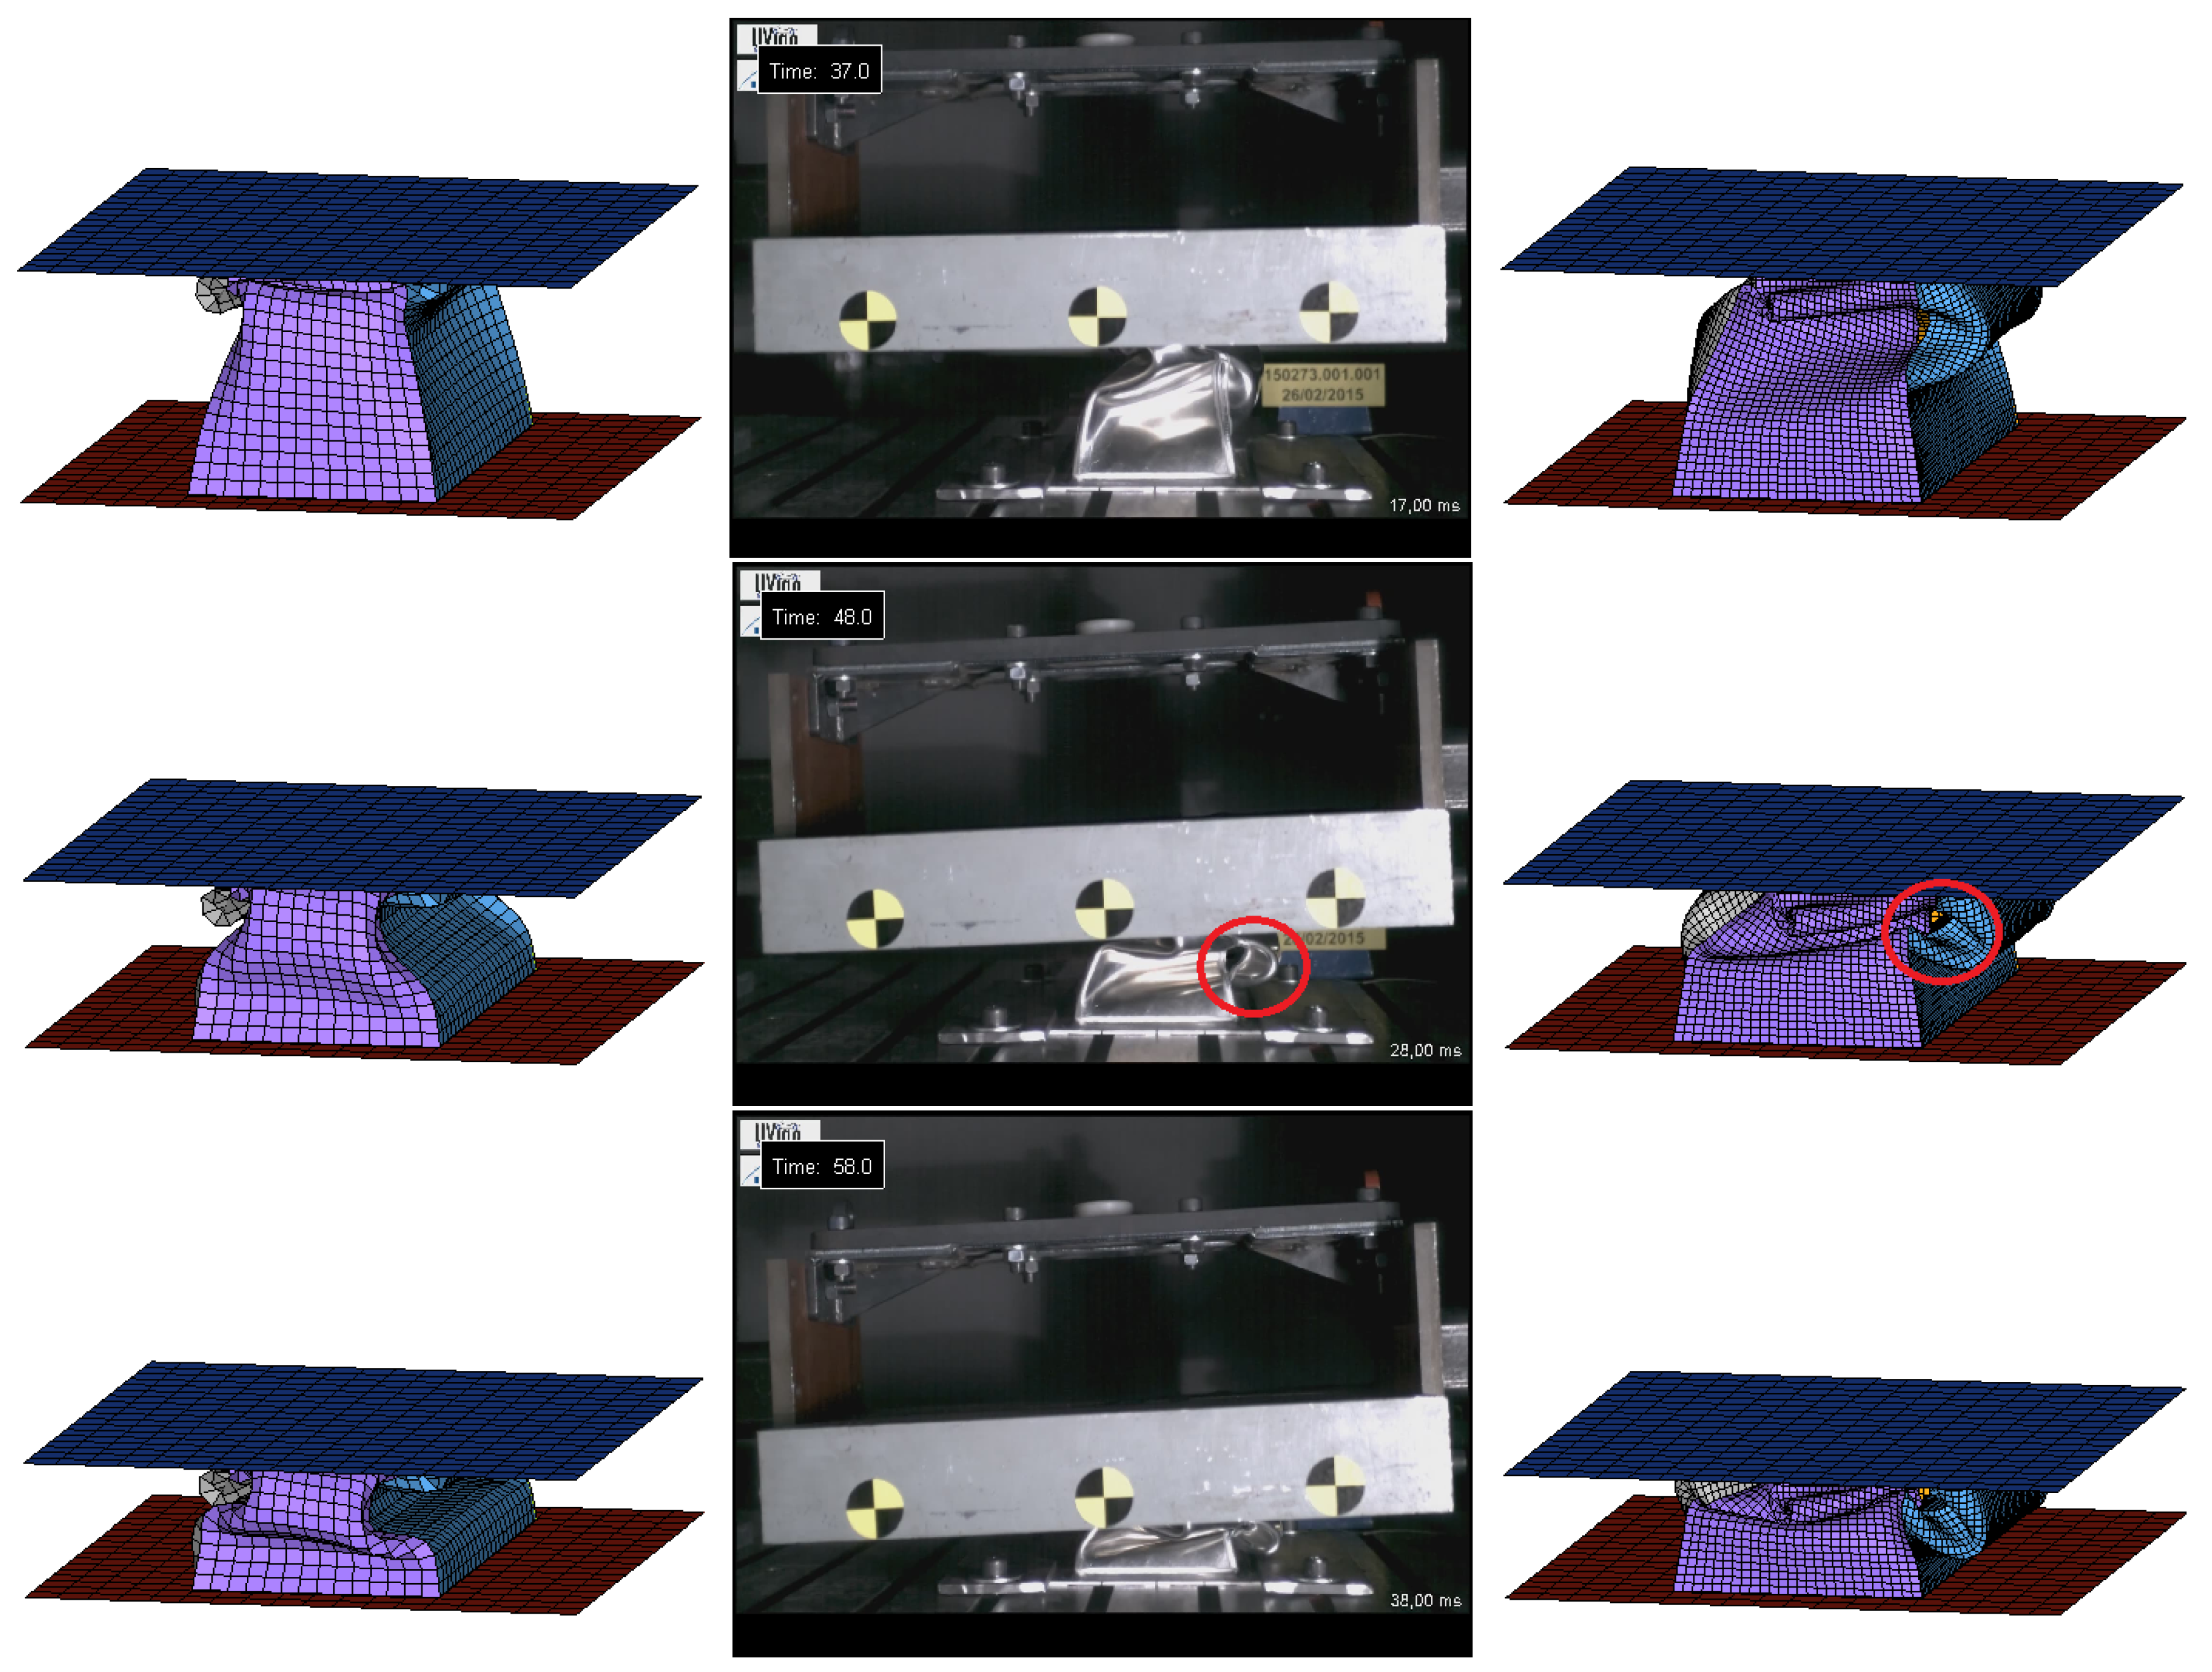
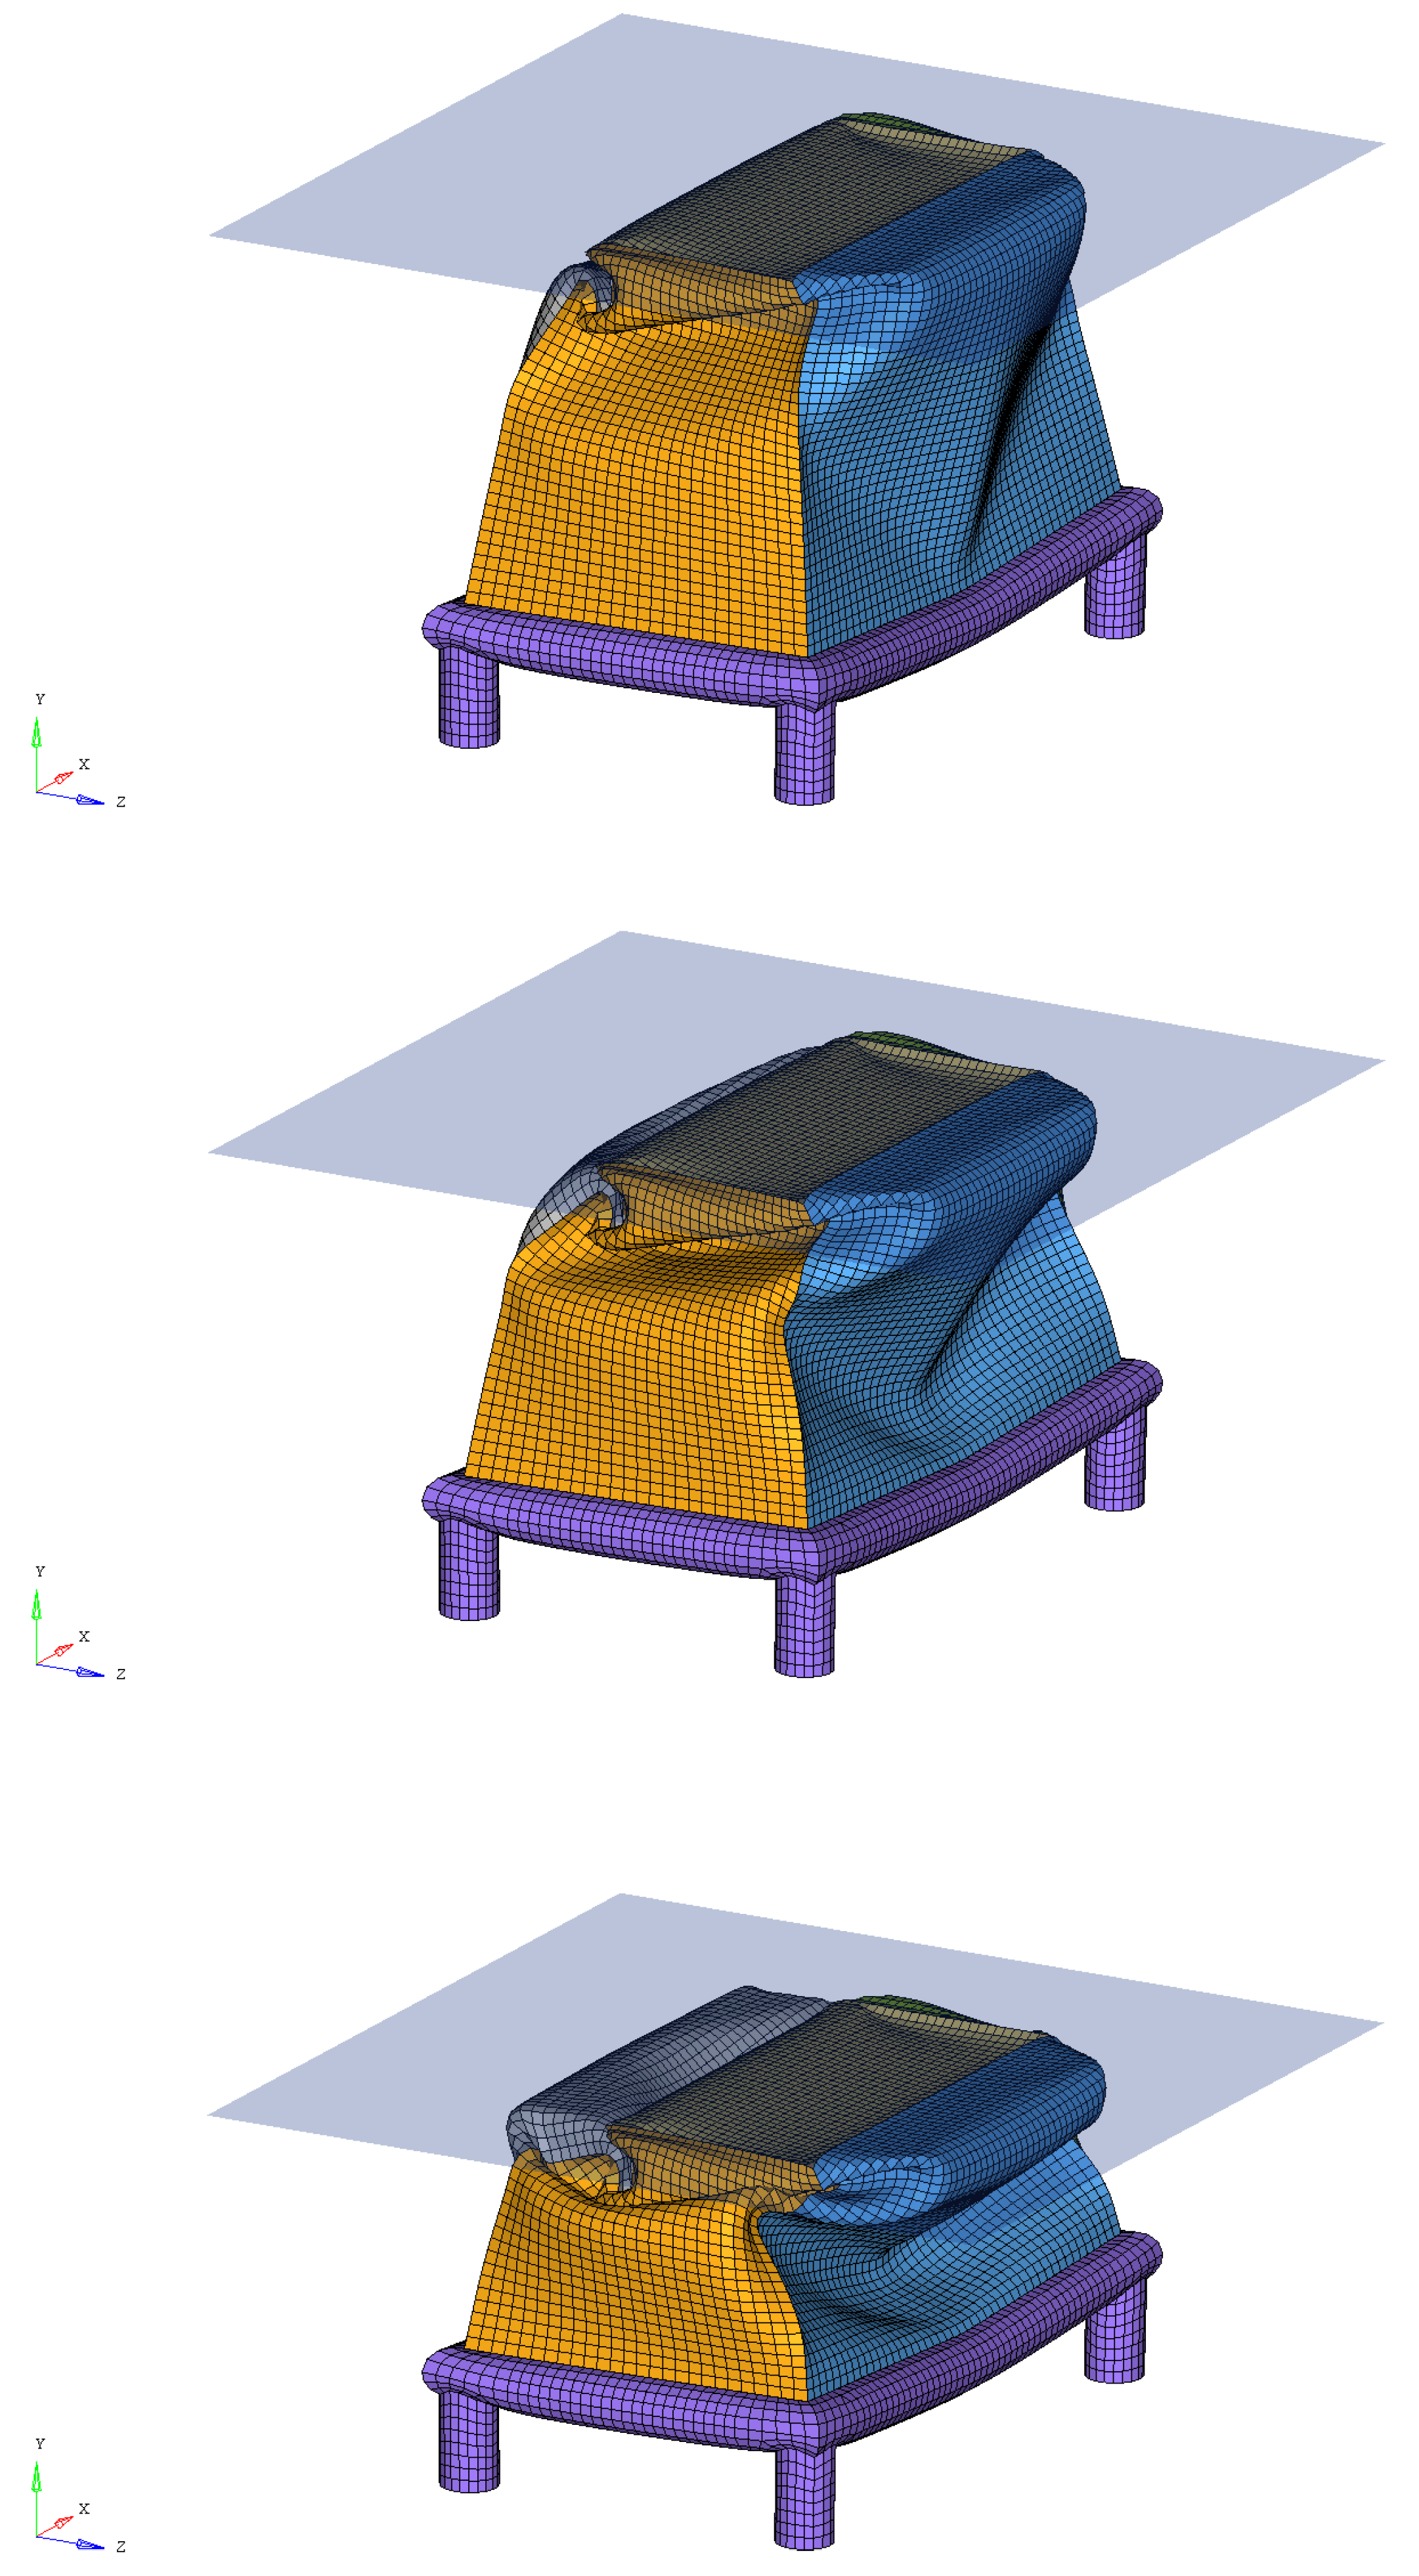
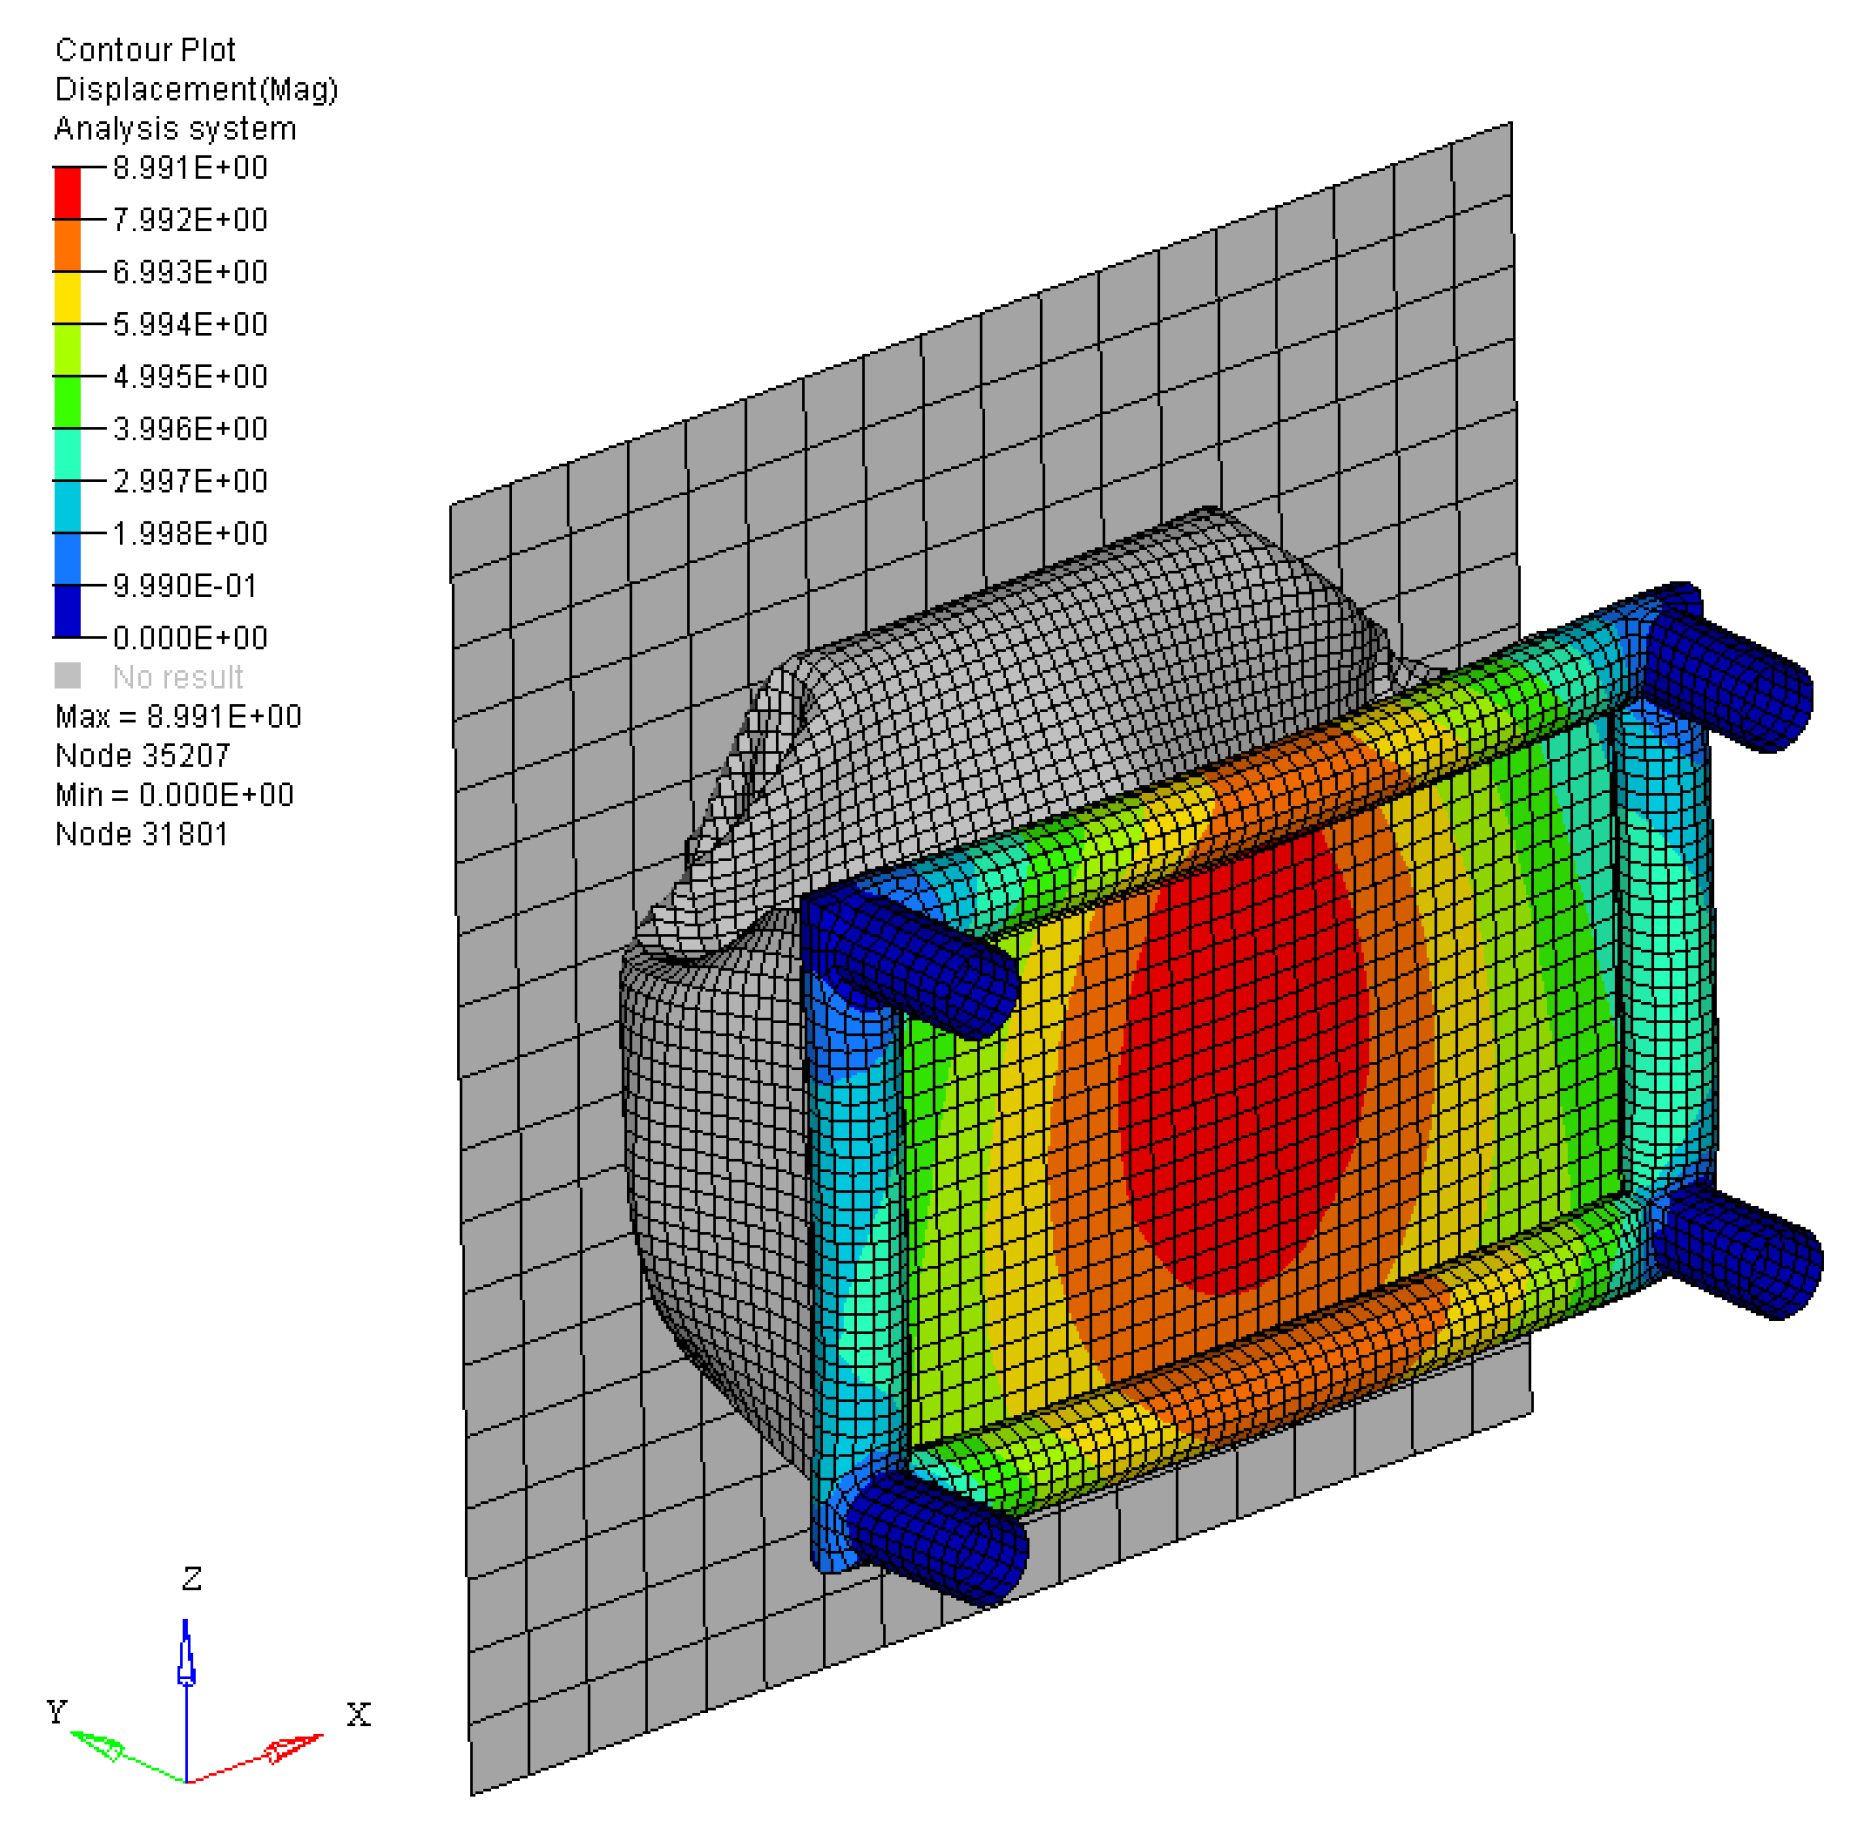
The results of the simulations for the coarse and fine meshes are compared with the images and data from the experimental test. In
Figure 6, it can be seen that, qualitatively, the simulation with the reference mesh (right panel) reproduces accurately the overall behavior of the part. In the top images, at time 37 ms, the weld is starting to fail in the simulation, and in the real test, the corresponding edge is subjected to a big deformation, also in the verge of failing. In the middle images, the failure has developed and the opening is clearly seen for both the test case and the simulation with the reference mesh. The weld fails in the same spot as in the experimental test and, thanks to the trigger, the failure of the weld resembles the opening that appears in the experiment. We note that for the coarse mesh (left panels) there is no weld failure. The simulation lasts 60 ms, the time it takes for the impact block to fully stop and the results are recorded in steps of 0.5 ms. These computations are performed with 64 Gb of RAM and an Intel-Core i7-4820K processor, the mesh sizes and computing times are described in
Table 2.
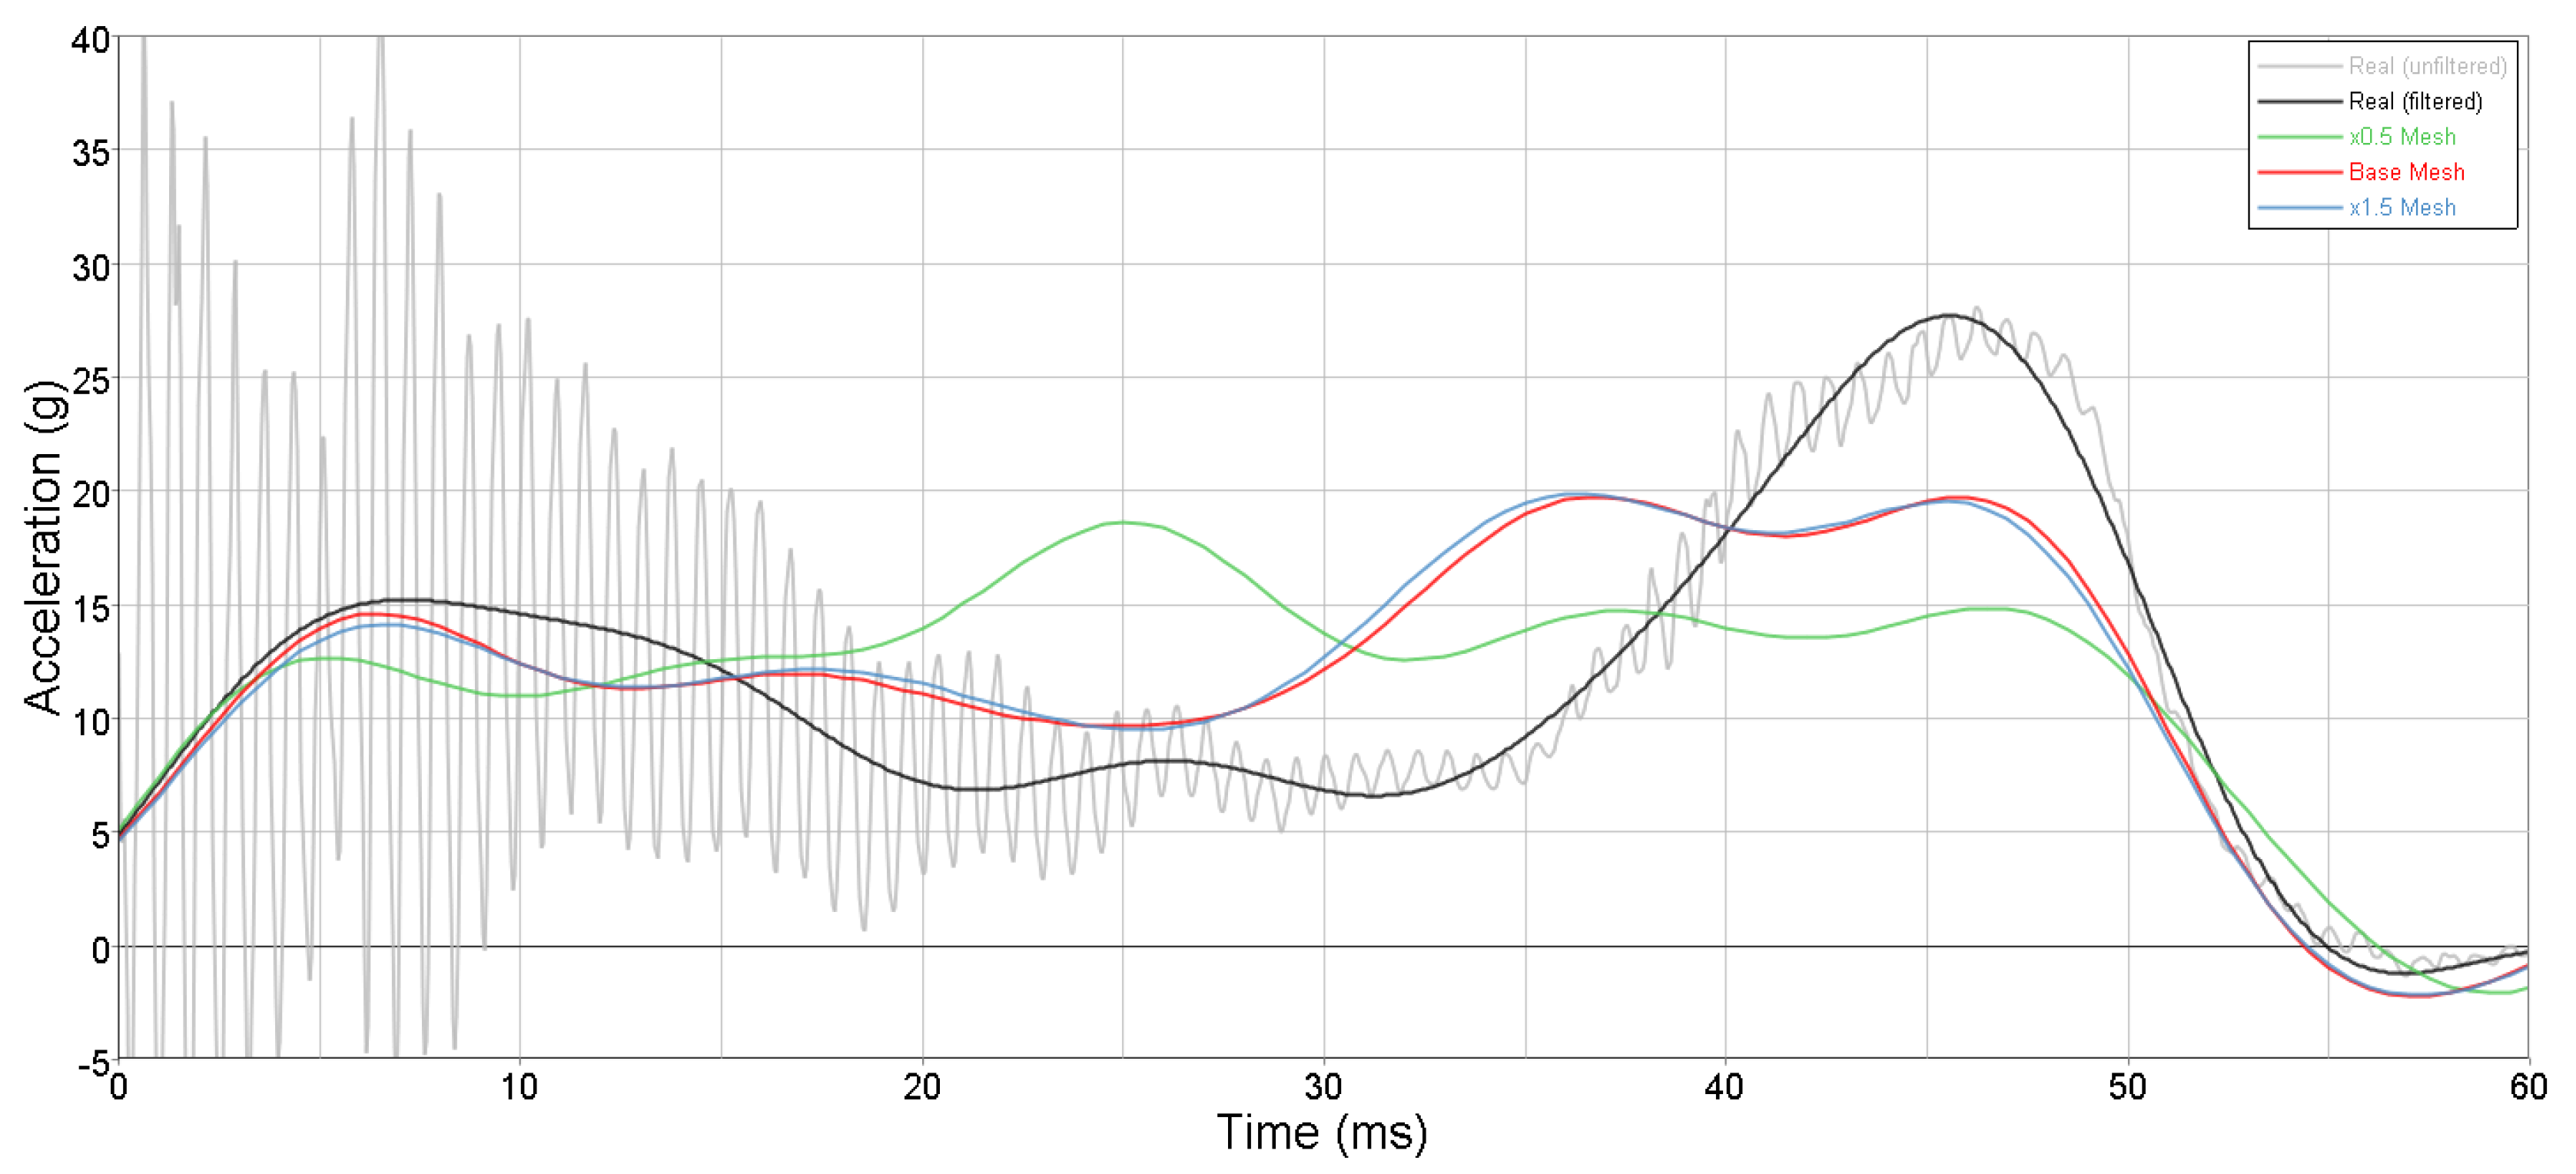
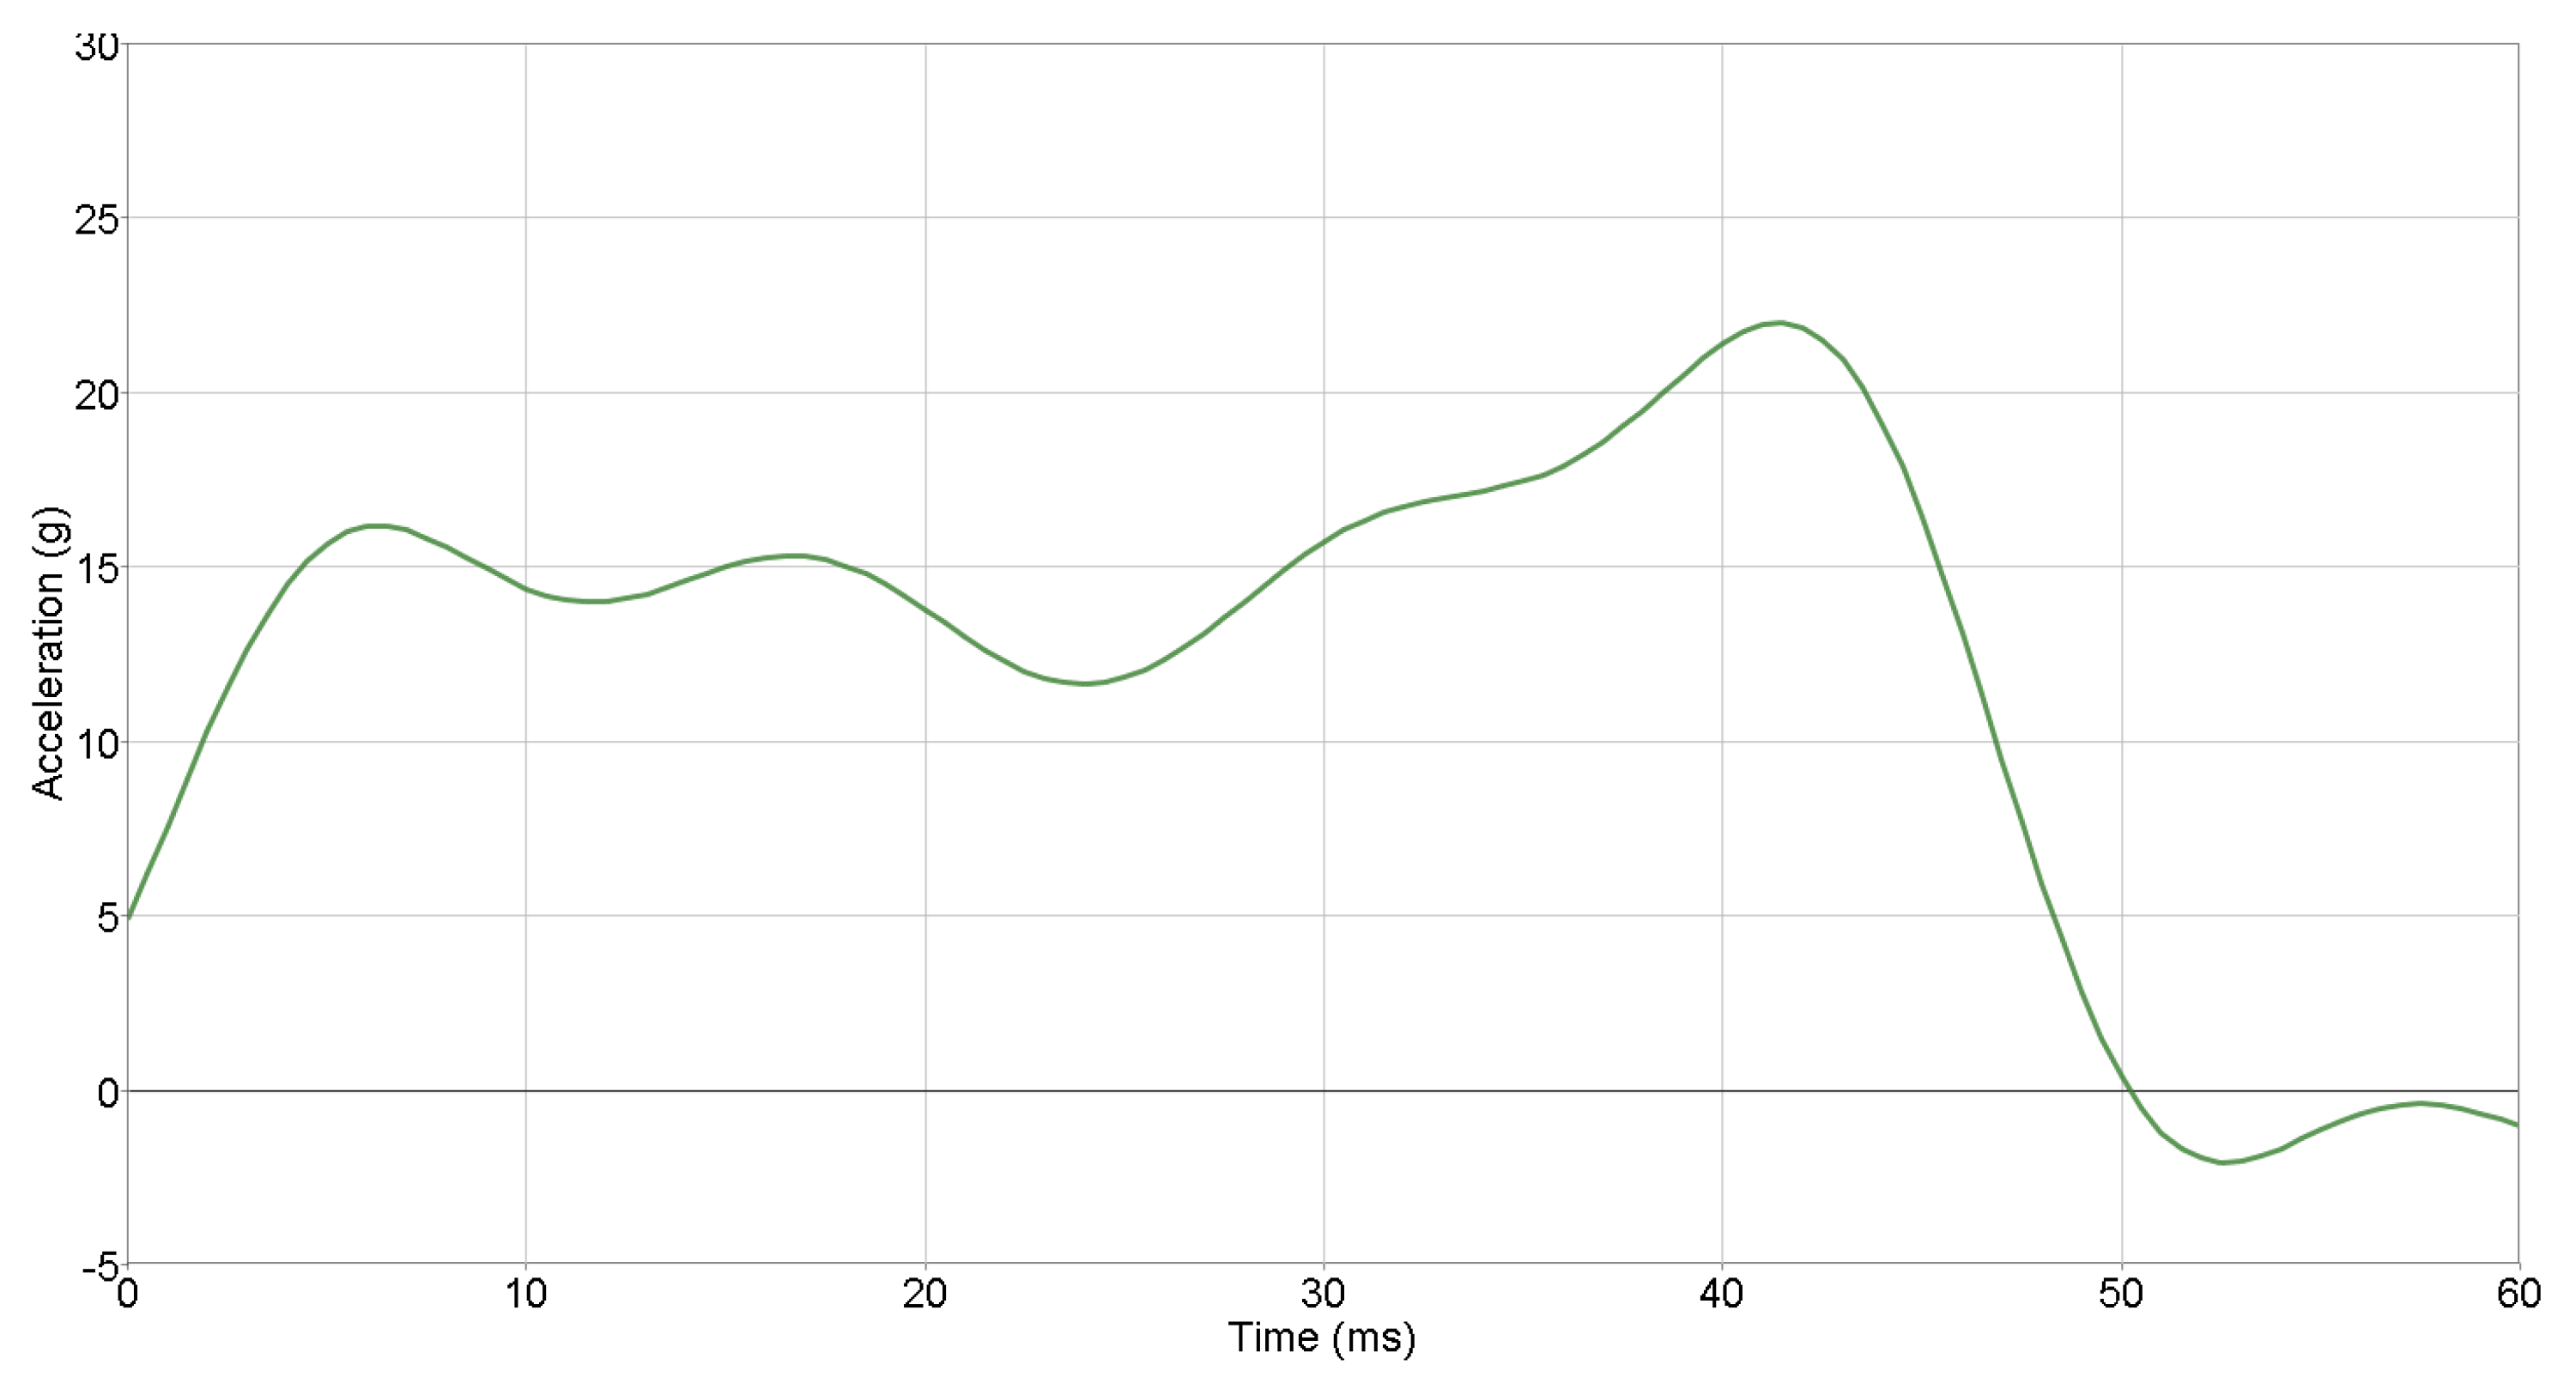
Regarding the deceleration of the impact block, the results for this magnitude, as the block descends, are represented in
Figure 7. The unfiltered accelerometer data is shown in light gray, and the filtered values (processed with a CFC 100 Hz filter) in black. The numerical results are also filtered similarly to the experimental results. In the graph, a tendency to reproduce the test curve can be seen; however, it is difficult to obtain close quantitative results in explicit simulations where the time interval of interest lasts only a few milliseconds [
39,
40,
41]. Also, the noise in the experimental data impedes quantitative comparisons. Regarding the convergence of the mesh, we show the results for the different mesh sizes, observing a convergence for the two smaller ones. Thus, since the results are similar and the computing time is significantly higher for the refined mesh, we only consider the reference mesh for further analysis. The different values for the green line (coarse mesh) are probably caused by a different folding pattern that generates self-contacts in the structure, as well as the absence of welding failure that can be seen in
Figure 6 (left panels).

 ,
, 


