Lung X-ray Segmentation using Deep Convolutional Neural Networks on Contrast-Enhanced Binarized Images


1
Department of Electronics and Computer Engineering, National Taiwan University of Science and Technology, Taipei 10607, Taiwan
2
Department of Computer Science, National Chengchi University, Taipei 11605, Taiwan
*
Author to whom correspondence should be addressed.
Mathematics 2020, 8(4), 545; https://0-doi-org.brum.beds.ac.uk/10.3390/math8040545
Submission received: 2 March 2020
/
Revised: 29 March 2020
/
Accepted: 1 April 2020
/
Published: 7 April 2020
(This article belongs to the Special Issue Artificial Intelligence and Big Data Computing)
Abstract
:Automatically locating the lung regions effectively and efficiently in digital chest X-ray (CXR) images is important in computer-aided diagnosis. In this paper, we propose an adaptive pre-processing approach for segmenting the lung regions from CXR images using convolutional neural networks-based (CNN-based) architectures. It is comprised of three steps. First, a contrast enhancement method specifically designed for CXR images is adopted. Second, adaptive image binarization is applied to CXR images to separate the image foreground and background. Third, CNN-based architectures are trained on the binarized images for image segmentation. The experimental results show that the proposed pre-processing approach is applicable and effective to various CNN-based architectures and can achieve comparable segmentation accuracy to that of state-of-the-art methods while greatly expediting the model training by up to and reducing storage space for CRX image datasets by down to on average.
1. Introduction
Detecting the lung boundary in chest X-ray (CXR) images has been extensively utilized in the diagnosis of lung health [1]. An ENT (ear, neck, and throat) radiologist is trained to instinctively recognize any pulmonary disease based on particular differences that occur within the lung regions [2]. For example, shape irregularity, size measurement, and total lung volume provide clues for serious diseases such as cardiomegaly, pneumothorax, pneumoconiosis, or emphysema. This subjective approach relies on the condition and the experience of a radiologist.
The impact of air pollution on human health is well-documented. The probability of a person to suffer from a pulmonary disease shall increase when the air pollution level increases. Therefore, more patients will need to have an X-ray checkup, which adds more workloads to ENT radiologists and may increase the possibility of error diagnosis.
Several studies [3] have shown that computer-aided diagnosis (CAD) systems can indicate the distinctive features for particular respiratory diseases more accurately, reduce radiologist workload, and make remote diagnostics possible. For instance, the National Library of Medicine, in collaboration with the Indiana University School of Medicine [4], is developing a CAD system for the screening of tuberculosis patients in less developed areas where it is of a lack of radiologists and equipment. A robust CAD system can help improve organ segmentation in many aspects, which include strong edges in the rib cage and clavicle region, convoluted structures over the costophrenic angles and vacillating shape of the lungs, varying heart dimensions, X-ray imaging inhomogeneities, and so forth.
Many methods have been developed for image segmentation in recent years. For example, a rule-based segmentation scheme [5] that adopts a set of pre-defined thresholds and morphological operations were proposed. However, it is heuristic and does not produce accurate results. Recently, deep-learning-based methods have been applied to many computer vision applications for better performance, such as image segmentation. Most deep learning models are built using convolutional neural networks, such as LeNet [6], Alexnet [7], VGGnet [8], GoogleNet [9], ZFNet [10], Fully Convolutional Network (FCN) [11], U-net [12], and SegNet [13]. These Convolutional Neural Network (CNN)-based methods usually require a large amount of training data and long training time to be able to obtain accurate results, which could be a big obstacle for some less developed remote areas to deploy these methods.
Our work aims to propose a pre-processing approach to achieve low-cost lung X-ray segmentation based on CNN-based architectures, which semantically segments the regions of the lung boundary in CXR images. The proposed method has three steps:
- The confined-region-based histogram equalization method is applied to CXR images for increasing the difference (contrast) between the lungs and their surrounding regions (both bony structures and other soft tissues), which is proven to increase accuracy based on the experimental results.
- The grayscale CXR images are transformed into binary images based on the adaptive binarization method, which can reduce of the storage space usage with only a slight drop in prediction accuracy ().
- We verify and compare performance of the proposed method for the lung segmentation task using various convolutional-neural-network-based models that are actively adopted for semantic segmentation, especially for lung segmentation [14], including Fully Convolutional neural Networks (FCNs) [11], U-net [12], and SegNet [13], using the preprocessed CXR datasets. The experimental results revealed that the proposed pre-processing steps could make the model training process faster while maintaining comparable segmentation accuracy compared to those of the state-of-the-art method.
To briefly sum up, we have made three primary contributions. (1) The confined-region-based histogram equalization method we adopt can improve segmentation accuracy. (2) The proposed method can expedite the model training process ( faster). (3) It can substantially save storage space with only a slight drop in prediction accuracy ().
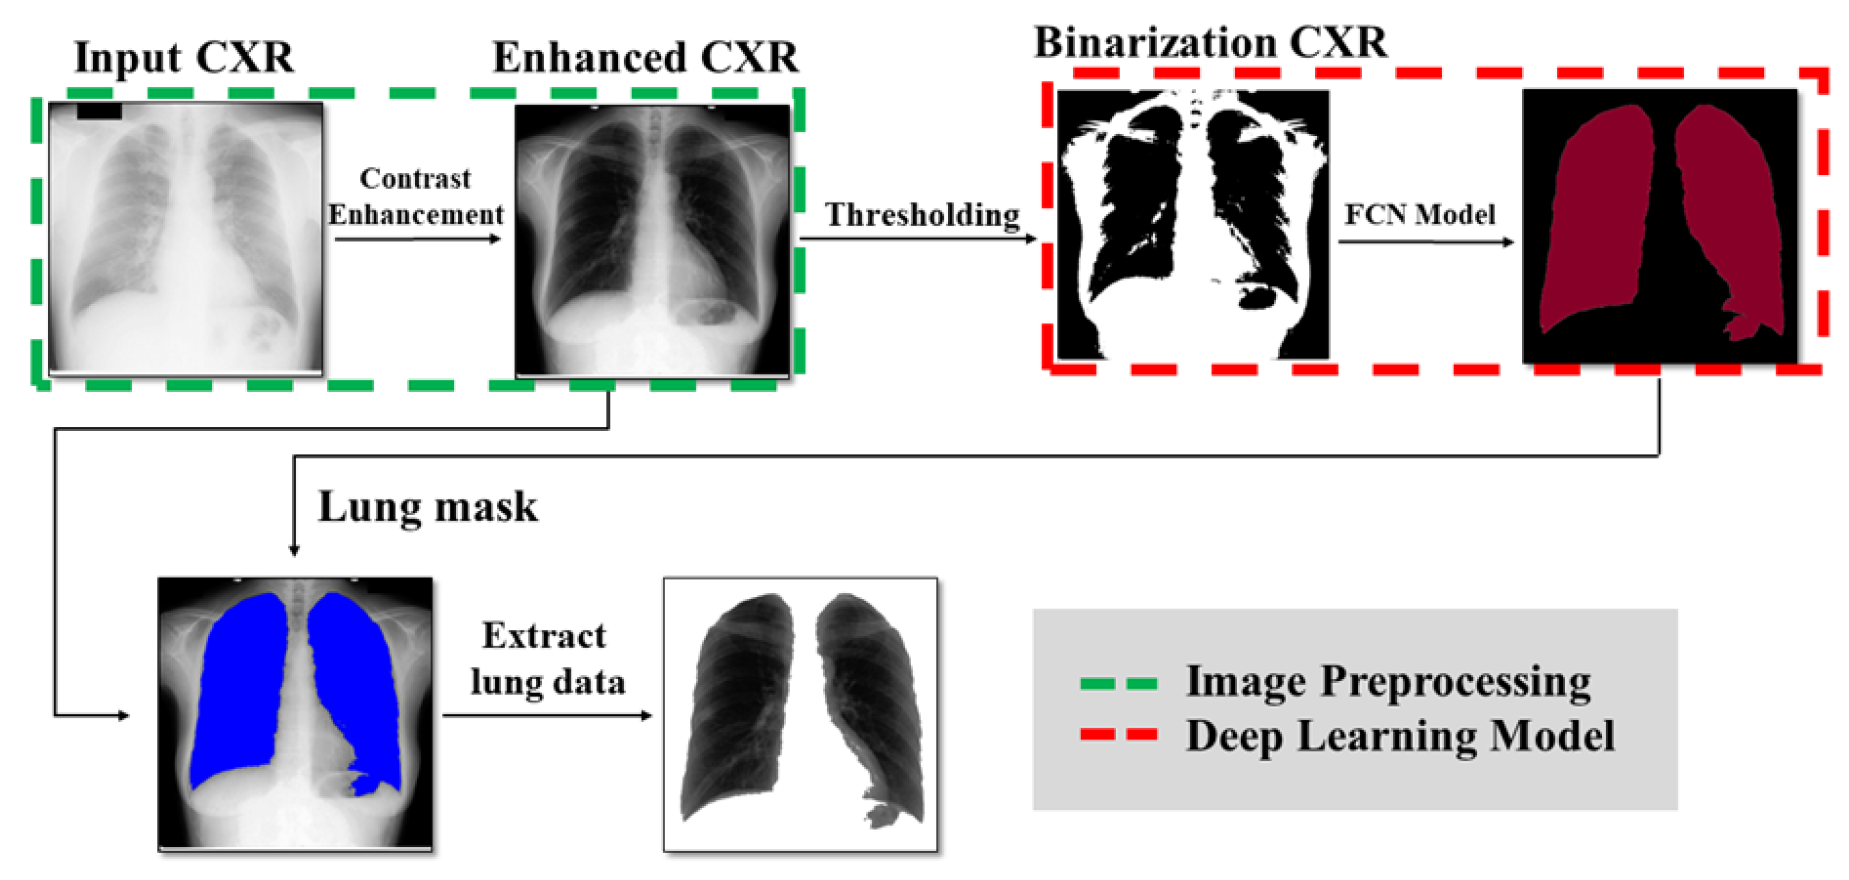
The flowchart of the proposed method is shown in Figure 1. The rest of the paper is organized as follows. In Section 2, the related work will be discussed. The proposed method is described in detail in Section 3. Section 4 introduces the experimental environment and explains the test results. Section 5 concludes the paper.
2. Related Work
Our review covers the four lines of the literature most relevant to our problem—contrast enhancement, image binarization, lung segmentation, and convolutional neural networks.
2.1. CXR Contrast Enhancement
Image enhancement could be an essential component for accurate segmentation, especially for images with low visual quality, such as X-ray images. Existing work on image contrast enhancement broadly falls into two categories as follows—histogram equalization (HE) and gamma correction. HE works by reassigning pixel values to match the uniform distribution for the image histogram, which can enhance the contrast of the input image. Ravia et al. [15] presented a HE technique for bone fracture. Contrast Limited Adaptive Histogram Equalization (CLAHE) locally processes all the small regions of the image, where the contrast is enhanced through adaptive HE, and the chances of noise amplification can be reduced as well. Ahmed et al. [16] proposed an image enhancement algorithm for dental X-ray images based on the adaptive HE technique. Gamma correction can work as a non-linear contrast enhancement technique applied to each pixel and independently modifies the dynamic range of the image. Mustapha et al. [17] proposed an approach to shift and modify the gamma value based on the adaptive factor.
2.2. Image Binarization
Image binarization aims to convert a grayscale image to its binary version. For example, scanned electronic documents can be binarized for further use by separating texts and other information from the background. There are two main approaches for image binarization, which are local and global image binarization methods. For the local binarization method, the threshold is determined according to properties of local regions in the image, generally working well on low-quality images. Niblack [18] proposed to calculate the mean and standard deviation of pixels in a sliding window manner to determine the threshold. Sauvola’s approach [19] extends Niblack’s work [18], which addresses the issue of black noise using the range of intensities of the image. Unlike local image binarization methods, which usually are more time-consuming and computationally expensive, global image binarization only determines one global threshold. If pixel values are more than the threshold, they are classified as foreground. Otherwise, they are background. Otsu’s method [20] finds the threshold that maximizes the between-class variance, which is equivalent to minimizing the within-class variance. Ridler et al. [21] proposed to calculate the threshold by iteratively dividing the pixel histogram into two classes.
2.3. Lung Segmentation
There has been a lot of work proposed in image segmentation for chest X-ray analysis over the last few decades. We can roughly classify the related approaches into three categories for lung segmentation [22]. First, we have rule-based segmentation schemes, which are also parametric learning algorithms with a sequence of steps and rules such as thresholding [23], the edge detection [24,25], the geometrical fitting models [25], the region growing [24] and the morphological operations [15]. Lihua et al. [15] proposed to replace edge detection in lung segmentation with the first derivative of the horizontal and/or vertical image profiles. However, these methods are mostly heuristic and do not generate accurate results. Therefore, they are often used as an initialization step in more robust segmentation algorithms [26]. Second, pixel classification-based schemes exploit general classifiers, such as the Markov random field modeling or various types of neural networks, to extract lung regions. They are supervised-learning-based methods that classify the pixel values into the lung and non-lung regions using a set of lung masks [11,12,27,28,29,30,31]. Suzuki et al. [32] proposed to utilize massive training artificial neural networks for suppressing contrast of ribs and clavicles in chest radiographs while the visibility of nodules and lung vessels was maintained. Third, they are deformable model-based schemes that have been widely applied to analyzing medical images because of its shape and size flexibility, such as Active Shape Models (ASMs) are deformable statistical models of the shape of objects that contain a set of landmark points [33]. ASMs have been successfully applied to lung region segmentation [34,35,36] and achieved fair accuracy although their results often not accurate in clavicles and rib cages. There have been a number of studies [37,38,39] that proposed to address this issue. Active Appearance Models (AAMs) [27] utilize the multi-scale filter bank of Gaussian derivatives and k-nearest neighbor classifiers. The major difference between AAMs and ASMs is that AAMs consider all object pixels with a combination of shapes and appearances, while ASMs consider border representation. In addition, hybrid approaches that combine prior schemes to produce better results were also discussed and proposed. For instance, Ginneken et al. [27] integrated deformation-based (active shape model, active appearance model), and pixel classification methods for better performance using the majority rule. Coppini et al. [40] exploited a closed fuzzy-curve algorithm for emphysema detection. The fuzzy-membership functions are determined by Kohonen networks to model lung boundaries. Candemir et al. [4] proposed a lung segmentation method that specifically analyzes input using a content-based image retrieval approach for determining features by SIFT-flow registration to extract fine details.
2.4. Common Convolutional Neural Network Models for Segmentation
Current state-of-the-art neural networks based object detection methods generally include two parts—bounding box proposals and semantic segmentation. For bounding box proposals, generating potential bounding boxes in an image and running a classifier on those proposed boxes. Redmon et al. [30] proposed a single regression method that directly deals with image pixels to generate bounding box coordinates and category probabilities. Liu et al. [31] used a small convolution filter to predict object classes and offsets at bounding box locations with different scale detections. Semantic segmentation methods can assign a pre-defined class pixel-wise. Consequently, the prediction accuracy, in general, for medical image segmentation using semantic-based methods could be higher than that using the bounding box-based methods since there may be pixels that do not correspond to any referred objects in bounding boxes. Shelhamer et al. [11] proposed Fully Convolutional neural Networks (FCNs), whose architecture consists of only convolution layers without any fully-connected layers. FCNs have several variants, such as FCN-32, FCN-16, and FCN-8, representing that their outputs are 32, 16, and 8 times upsampled prediction. Ronneberger et al. [12] proposed a U-net model that allows the network to propagate context information to higher resolution layers. Badrinarayanan et al. [13] presented a trainable architecture that consists of an encoder network, a corresponding decoder network followed by a pixel-wise classification layer. There are hybrid methods that combine the prior schemes. For example, Howard et al. [41] utilized depthwise separable convolutions to build lightweight deep neural networks.
3. Proposed Method
3.1. Contrast Enhancement with Confined-Region-Based HE
The radiographic examination involves the use of high kilovoltage techniques, such as X-rays or Gamma Rays, to check the internal structure of a componentis, which needs an overall penetration through all tissues (decrease in attenuation differences), therefore likely causing low-contrast X-ray images. Before further using these images, we may obtain more accurate segmentation results if these images can be enhanced to have better contrast. Conventionally, applying HE to images can often improve contrast in images; however, HE uniformly stretches out the intensity range of the image, which may cause image under- or over-enhancement. Therefore, we propose using confined-region-based HE for the purpose of better differentiating the lungs from other surrounding regions.
Let I be the b-bit input image be the intensity of the input image at pixel p. The image histogram H is computed as
where and is the indicator function defined as
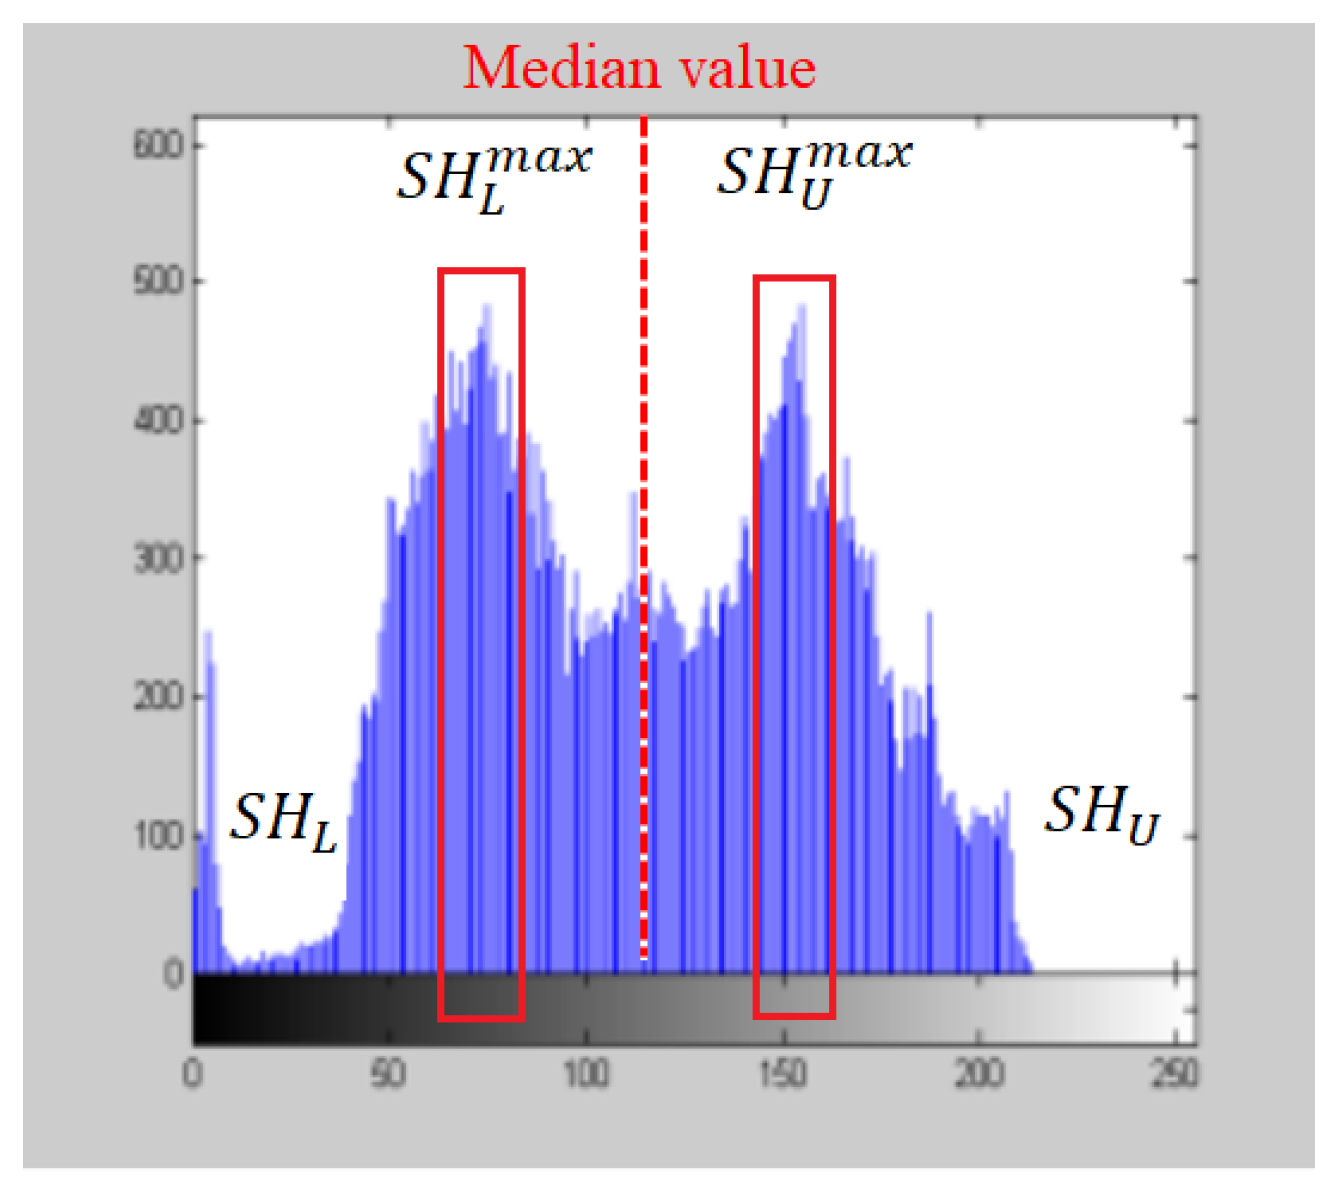
First, we separate the input image histogram H into the two sub-histograms, and , based on the median intensity of the image, where and
Generally, a CXR image has a dark background and bright foreground, where represents the histogram of the background with dark features of soft tissues, and represents the foreground with bright features of bone structures. To enlarge the difference between the background and foreground, we define the confined-region cumulative distribution function with lower and upper bounds, L and U, as:
where . Based on the confined-region cumulative distribution function , the transformation function T of HE is defined as:
In our method, we specify L and U as and , where
That is, and represent the peak bin values of and , as shown in Figure 2. At last, the output image after our confined-region-based HE can be obtained as .
3.2. Image Binarization
After applying our confined-region-based HE to the input image, we can quantize its intensity range to reduce the storage size. To introduce a more flexible method for image quantization, we adopt a specific image thresholding approach based on the iterative selection [42] to find the thresholds to quantize the intensity range of the input image with different levels. With the initial cluster centers assigned, we can classify pixels into different groups. By observing CXR features, the first two cluster centers are empirically initialized as one of the four corners and the center of the image. We consider the chosen corner pixel as a background pixel with its intensity of . In contrast, the center pixel is regarded as a foreground pixel with its intensity of , where . The remaining cluster centers can be selected evenly between and , and each cluster center corresponds to its cluster . Next, an image pixel is classified to a class with the center that has the shortest distance to the pixel, where the distance is calculated as:
Here, i is a pixel index, and , meaning as . After all the pixels are properly classified, we update the cluster centers as:
where will be iteratively updated until it converges. With the cluster centers , we can then quantize the original intensity range for image quantization. According to our experimental results, we choose to binarize CXR images to reduce the data storage usage with only a slight drop in prediction accuracy ().
3.3. Image Segmentation Based on Deep Neural Networks
At last, after applying contrast enhancement and image binarization to CXR images, we choose three state-of-the-art deep-neural networks-based models often used for semantic segmentation, including FCN, U-net, and SegNet [14], to assess the practicality of the proposed method. Note that we train these models over our pre-processed CXR images for lung X-ray segmentation from scratch.
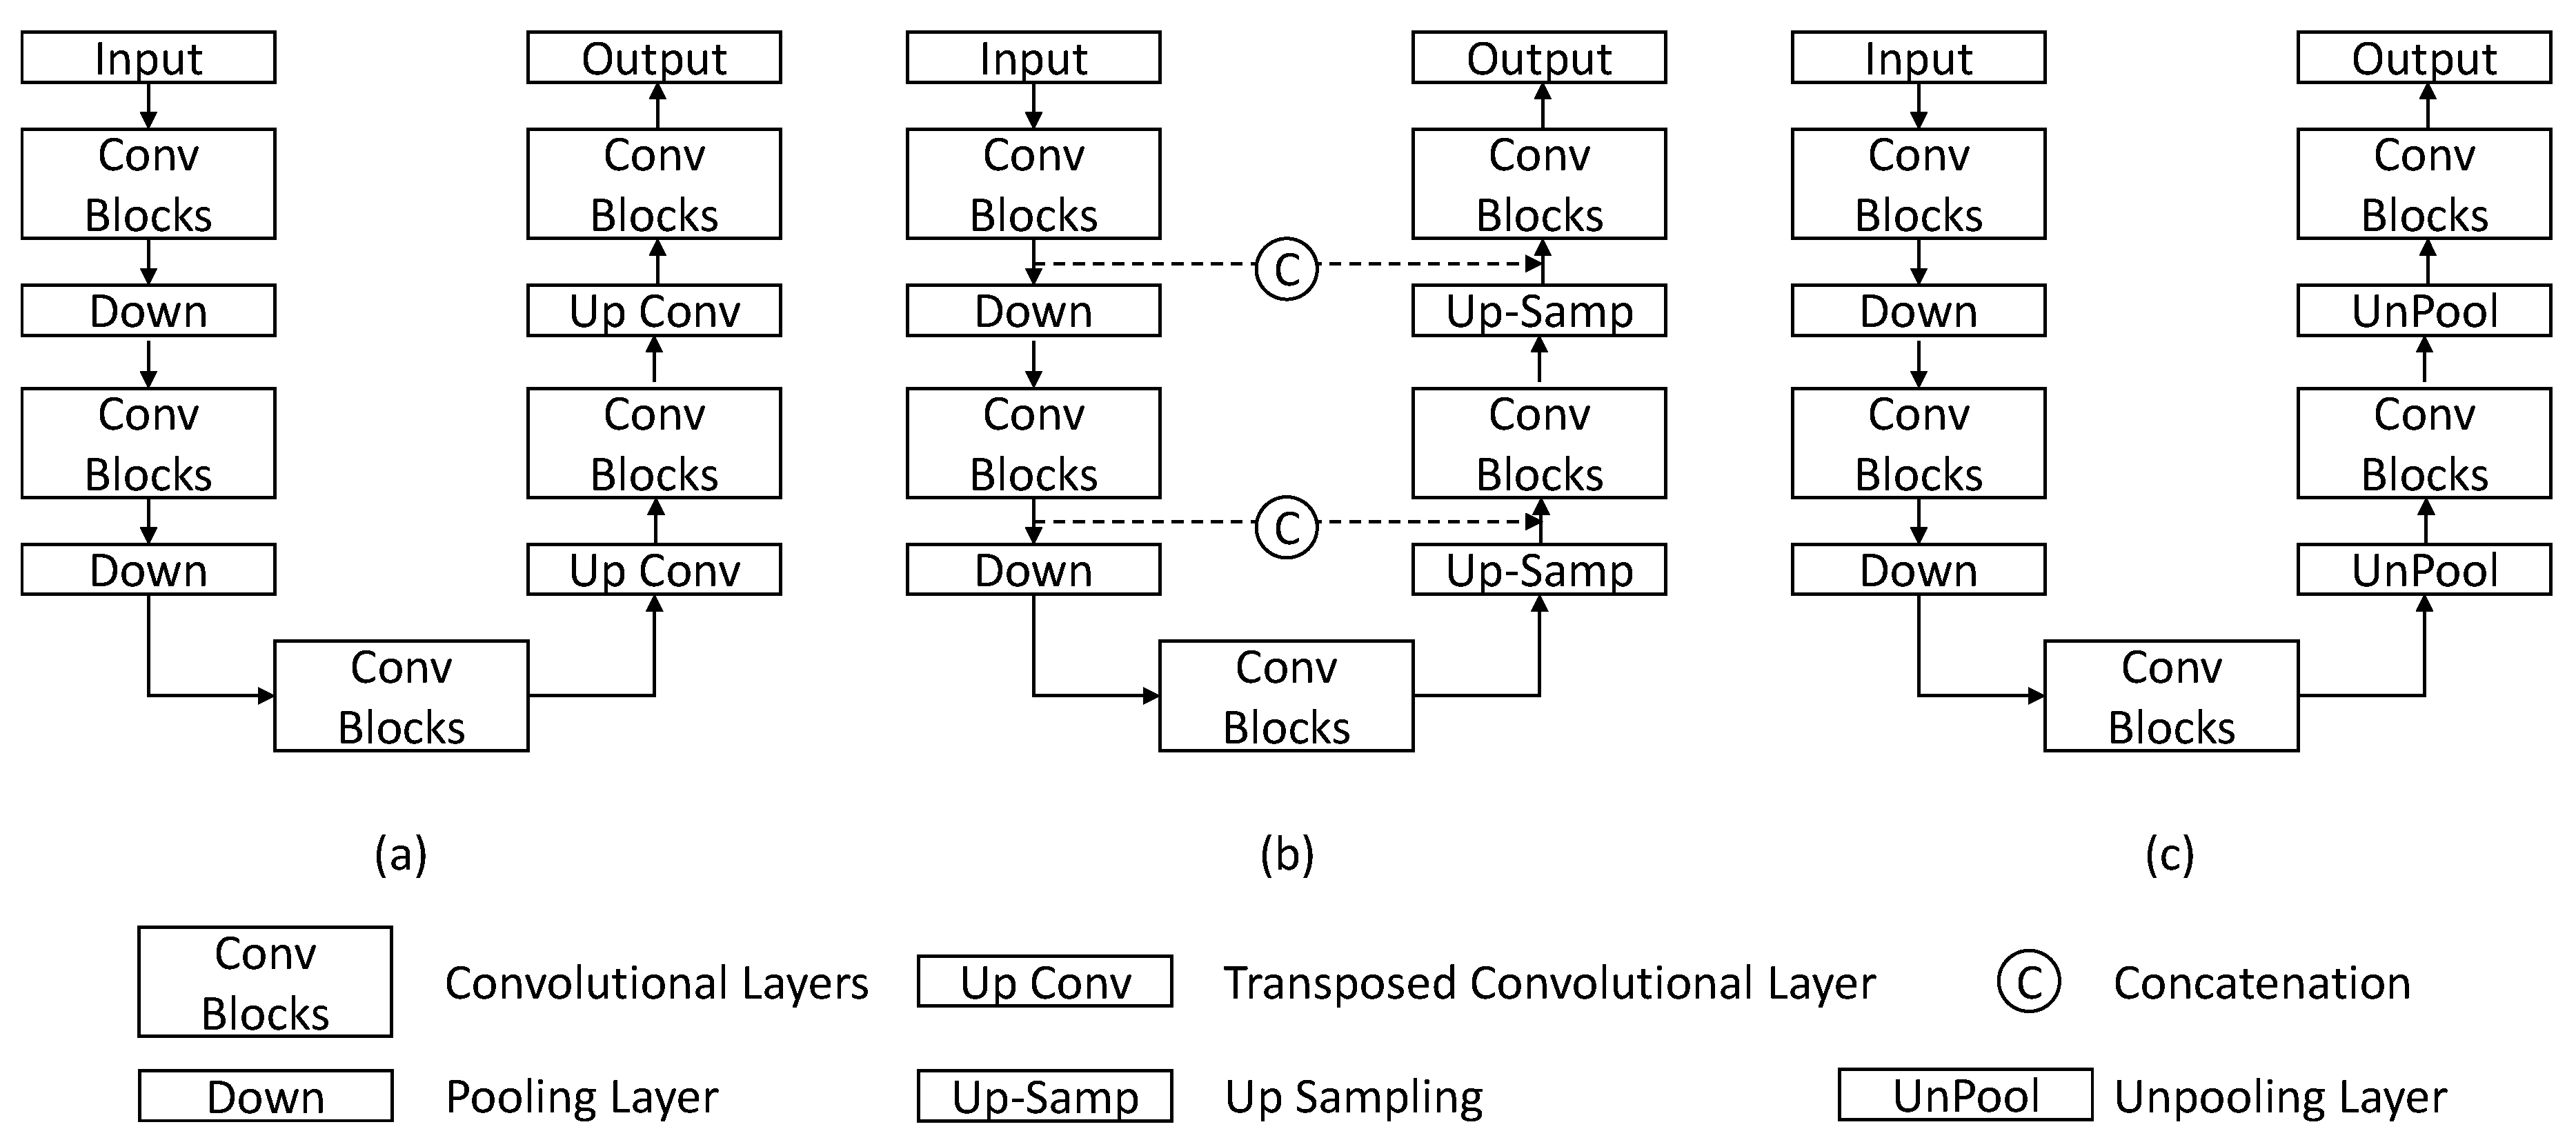
In Figure 3, we show general architectures of FCN [11], U-net [12], and SegNet [13]. An FCN model [11], which consists of only convolutional, pooling, and transposed convolution layers, transforms the input image into pixel categories. Instead of using fully connected layers, the model uses encoder-like layers to extract features from the input image and transform these features back to the size of the input image through the transposed convolution layer. For a pixel at a given location in the input image, the output is a predicted segmentation label of the pixel that corresponds to the location. A U-Net architecture originally derived from the FCN architecture proposed in Reference [12] by adding a full decoder. What U-net differs from FCN is that U-net replaces the transposed convolutional layers with upsampling operations to increase the resolution of the output. Additionally, U-net adds skip-connections to concatenate low-level features from the encoder part with high-level features from the decoder part to provide local information to the global information. SegNet [13] is a convolutional encoder-decoder architecture proposed for semantic pixel-wise segmentation, whose architecture is similar to that of U-net. The differences lie in two aspects. First, the original SegNet does not have skip-connections. Second, it uses unpooling layers to upsample resolutions of feature maps and the output.The general loss function for a lung segmentation task is defined by binary cross entropy as:
where is the ground truth segmentation label of the pixel p and is the predicted probability of p being the lung regions.
4. Experimental Results
4.1. Chest X-ray Datasets
To verify our method, we collected three different CXR datasets for the experiment:
- Japan Society of Radiology Technology (JSRT) dataset, which contains manually-annotated segmentation labels of lung fields, heart, and clavicles. The JSRT dataset contains 154 nodule-containing digital CXR images (100 malignant cases, 54 benign cases) and 93 normal digital images [43]. The images are grayscale with their bit depth of 12. The size of the images is . Both the vertical and horizontal pixel spacing is mm.
- The Department of Health and Human Services of Maryland (Montgomery dataset) collected X-ray images over many years under Montgomery County’s Tuberculosis Control scheme. The dataset consists of 58 digital CXR images with manifestations of tuberculosis and 80 normal digital CXR images [44]. The X-ray images are 12-bit grayscale images, and their size is with mm pixel resolution.
- The dataset from a private clinic in India includes 397 chest X-rays with resolutions of , , and . They are all 12-bit grayscale images. The vertical and horizontal pixel spacing are both mm.
Here, we randomly split each dataset into the training, validation, and testing datasets, where there are 620 images for training, 69 images for validation, and 69 images for testing [27,44]. To enlarge the dataset, we did random cropping for augmentation as recommended in Reference [45]. Note that all the images are grayscale with 12-bit depth and are resized to for training and testing. The experiment was run on a computer with Inter® core™ i7-7700 4.20 GHz CPU, 16GB RAM, and an Nvidia GeForce RTX 2080 Ti with 11GB of VRAM.
4.2. Object Evaluation
To fairly compare the performance of the above-mentioned models, the measurement metrics used are the Jaccard Simi, Dice’s coefficient and Mean Absolute Error (). The Jaccard Similarity coefficient, known as the Jaccard Index, is for measuring the similarity and diversity of sample sets, which defined as , where , , and are the numbers of true positives, false positives, and false negatives. The Dices coefficient also quantifies the similarity like but with a different weight on true positive as .
Each model is trained and tested on both the original chest X-ray (OCXR) and enhanced chest X-ray (ECXR) dataset for a more detailed comparison. The ECXR dataset is generated using the mentioned contrast enhancement method in Section 3.1. In the experiment, pixels are classified into k groups for testing, where . In Table 1, it shows that the proposed contrast enhancement can overall help increase on U-net model, on FCN-8 model, on FCN-32 model, and on SegNet model. Besides, using different k on either the OCXR or ECXR dataset with the these network models, they have similar average accuracy on , , and MAE. Therefore, to save the storage size, we can binarize the images that are used for lung segmentation. Moreover, it can also save time that model access images.
4.3. Convergence Rate
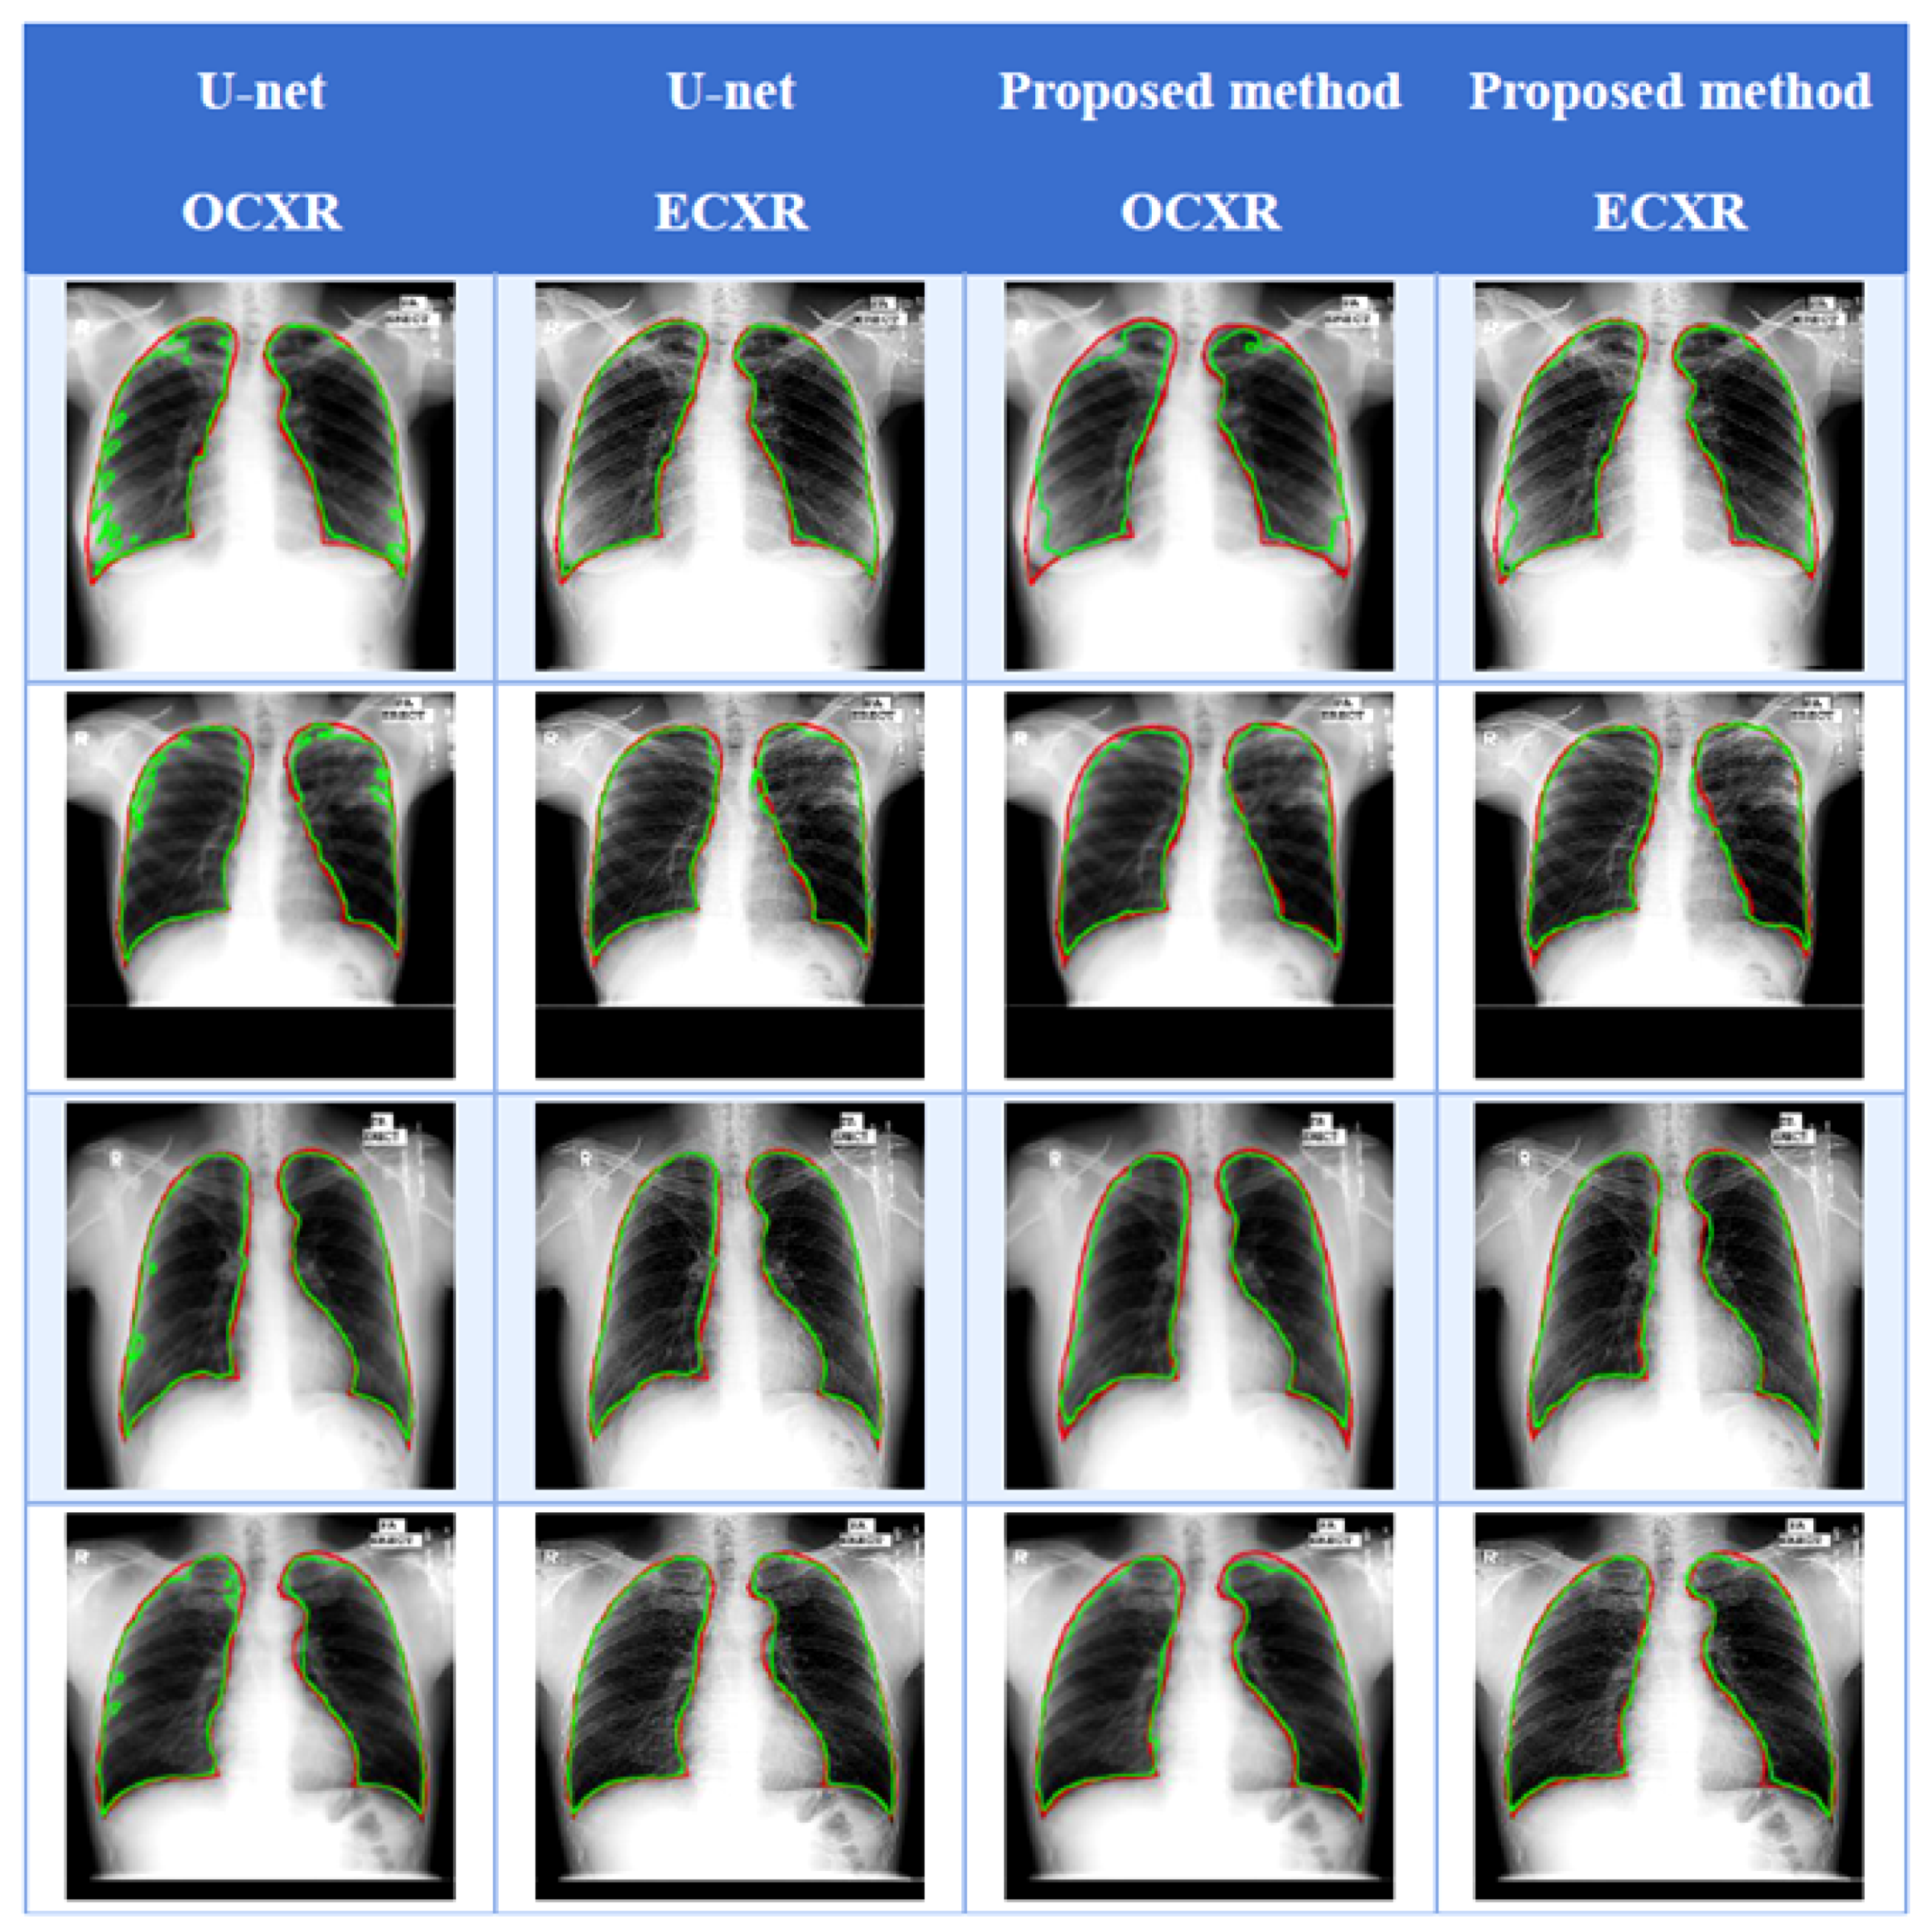
As previously noted, the proposed method uses binarized CXR images for training and testing. Table 2 summarizes the number of iterations required for the training of different models for the lung segmentation to converge. In the experiment, we compare the number of iterations needed for the training of different models to converge with CRX image datasets, unprocessed or processed. To be specific, we generate the ECXR dataset by applying our confined-region-based HE to the OCXR dataset. We binarize the OCXR images to produce the BOCXR dataset. At last, the BECXR dataset is obtained by binarizing the ECXR dataset. The results show that the ECRX dataset is easier for the often used segmentation models to train on. By comparing the training with the OCXR and ECXR datasets, we can see the training on the ECXR dataset converges faster than that on the OCXR one. Using the image binarization approach based on pixel clustering, we can accelerate the training by , comparing the BOCXR to the OCXR dataset. If we binarize the OCXR and ECXR datasets (BOCXR vs. BECXR), the training on the BECXR dataset converges faster by than on the BOCXR one. Moreover, our image binarization approach also expedites the training on the enhanced dataset (ECXR). That is, using the BECXR dataset can speedup the segmentation models in convergence by on average than using the ECXR. Table 2 shows in detail all the comparisons of convergence rates among different segmentation models. In summary, if applying our image enhancement method and binarization to the OCXR dataset, we can achieve faster for the training to converge on average. Figure 4 demonstrates accurate segmentation results obtained using the U-net model trained on the BECXR dataset, which is the OCXR dataset processed by the proposed pre-processing approach.
5. Conclusions
In this work, we have made two primary contributions. First, we propose an effective pre-processing approach that can save storage space for image datasets. Second, we greatly expedite the model training process in lung X-ray segmentation based on CNN-based architectures using the proposed method. More specifically, using the proposed contrast enhancement and image binarization steps, we demonstrate that it can help the training converge faster and take less storage space for data with only a slight drop in prediction accuracy (). We test our approach using four often-used CNN-based segmentation models with the OCXR, ECXR, BOCXR, and BECXR datasets to verify the effectiveness of our proposed pre-processing approach. Experimental results showed that using the dataset (BECXR) processed by the proposed method can help the training converge faster as well as decrease of the storage space usage on average compared to using the original dataset (OCXR).
Author Contributions
Conceptualization, methodology, software, and validation, H.-J.C.; experiment analysis, S.-W.H.; investigation and writing—original draft preparation, H.-J.C.; proofreading and editing, S.-W.H. and Y.-T.P.; supervision, S.-J.R. and Y.-T.P.; project administration, S.-J.R. and Y.-T.P.; funding acquisition, Y.-T.P. All authors have read and agreed to the published version of the manuscript.
Funding
This work was funded in part by the Ministry of Science and Technology of Taiwan (MOST) AI Biomedical Research Center under Grant MOST 109-2634-F-019-001.
Conflicts of Interest
The funders had no role in the design of the study; in the collection, analyses, or interpretation of data; in the writing of the manuscript, or in the decision to publish the results.
Abbreviations
Acronyms used in the paper.
| CLAHE | Contrast Limited Adaptive Histogram Equalization |
| CXR | Chest X-ray |
| ASM | Active Shape Model |
| AAM | Active Appearance Model |
| FCN | Fully Convolutional neural Network |
| CAD | Computer-Aided Diagnosis |
| TB | Tuberculosis |
| CNN | Convolutional Neural Network |
| FCN | Fully Convolutional Network |
| HE | Histogram Equalization |
| JSRT | Japan Society of Radiology Technology |
| OCXR | Original Chest X-ray |
| ECXR | Enhanced Chest X-ray |
| BOCXR | Binarized OCXR |
| BECXR | Binarized ECXR |
| MAE | Mean Absolute Error |
References
- Kligerman, S.; Cai, L.; White, C.S. The effect of computer-aided detection on radiologist performance in the detection of lung cancers previously missed on a chest radiograph. J. Thorac. Imaging 2013, 28, 244–252. [Google Scholar] [CrossRef] [PubMed]
- Cecil, R.L.F.; Goldman, L.; Schafer, A.I. Goldman’s Cecil Medicine, Expert Consult Premium Edition–Enhanced Online Features and Print, Single Volume, 24: Goldman’s Cecil Medicine; Elsevier Health Sciences: Amsterdam, The Netherlands, 2012. [Google Scholar]
- Mazzone, P.J.; Obuchowski, N.; Phillips, M.; Risius, B.; Bazerbashi, B.; Meziane, M. Lung cancer screening with computer aided detection chest radiography: design and results of a randomized, controlled trial. PLoS ONE 2013, 8, e59650. [Google Scholar] [CrossRef] [PubMed] [Green Version]
- Candemir, S.; Jaeger, S.; Palaniappan, K.; Musco, J.P.; Singh, R.K.; Xue, Z.; Karargyris, A.; Antani, S.; Thoma, G.; McDonald, C.J. Lung segmentation in chest radiographs using anatomical atlases with nonrigid registration. IEEE Trans. Med. Imaging 2013, 33, 577–590. [Google Scholar] [CrossRef] [PubMed]
- Chondro, P.; Yao, C.Y.; Ruan, S.J.; Chien, L.C. Low order adaptive region growing for lung segmentation on plain chest radiographs. Neurocomputing 2018, 275, 1002–1011. [Google Scholar] [CrossRef]
- LeCun, Y.; Bottou, L.; Bengio, Y.; Haffner, P. Gradient-based learning applied to document recognition. Proc. IEEE 1998, 86, 2278–2324. [Google Scholar] [CrossRef] [Green Version]
- Krizhevsky, A.; Sutskever, I.; Hinton, G.E. Imagenet classification with deep convolutional neural networks. In Proceedings of the Advances in Neural Information Processing Systems 25 (NIPS 2012), Lake Tahoe, NV, USA, 3–6 December 2012. [Google Scholar]
- Simonyan, K.; Zisserman, A. Very deep convolutional networks for large-scale image recognition. arXiv 2014, arXiv:1409.1556. [Google Scholar]
- Szegedy, C.; Liu, W.; Jia, Y.; Sermanet, P.; Reed, S.; Anguelov, D.; Erhan, D.; Vanhoucke, V.; Rabinovich, A. Going deeper with convolutions. In Proceedings of the IEEE Conference on Computer Vision and Pattern Recognition 2015, Boston, MA, USA, 7–12 June 2015. [Google Scholar]
- Zeiler, M.D.; Fergus, R. Visualizing and understanding convolutional networks. In Proceedings of the European Conference on Computer Vision 2014, Zurich, Switzerland, 6–12 September 2014; Springer: Berlin/Heidelberg, Germany, 2014. [Google Scholar]
- Long, J.; Shelhamer, E.; Darrell, T. Fully convolutional networks for semantic segmentation. In Proceedings of the IEEE Conference on Computer Vision and Pattern Recognition 2015, Boston, MA, USA, 7–12 June 2015. [Google Scholar]
- Ronneberger, O.; Fischer, P.; Brox, T. U-net: Convolutional networks for biomedical image segmentation. In Proceedings of the International Conference on Medical Image Computing And Computer-Assisted Intervention, Munich, Germany, 5–9 October 2015; Springer: Berlin/Heidelberg, Germany, 2015. [Google Scholar]
- Badrinarayanan, V.; Kendall, A.; Cipolla, R. Segnet: A deep convolutional encoder-decoder architecture for image segmentation. IEEE Trans. Pattern Anal. Mach. Intell. 2017, 39, 2481–2495. [Google Scholar] [CrossRef]
- Hooda, R.; Mittal, A.; Sofat, S. An efficient variant of fully-convolutional network for segmenting lung fields from chest radiographs. Wirel. Pers. Commun. 2018, 101, 1559–1579. [Google Scholar] [CrossRef]
- Parveen, N.R.S.; Sathik, M.M. Enhancement of bone fracture images by equalization methods. In Proceedings of the 2009 International Conference on Computer Technology and Development, Kota Kinabalu, Malaysia, 13–15 November 2009; Volume 2, pp. 391–394. [Google Scholar]
- Ahmad, S.A.; Taib, M.N.; Khalid, N.E.A.; Taib, H. An analysis of image enhancement techniques for dental X-ray image interpretation. Int. J. Mach. Learn. Comput. 2012, 2, 292. [Google Scholar] [CrossRef] [Green Version]
- Mustapha, A.; Hussain, A.; Samad, S.A. A new approach for noise reduction in spine radiograph images using a non-linear contrast adjustment scheme based adaptive factor. Sci. Res. Essays 2011, 6, 4246–4258. [Google Scholar]
- Patin, F. An Introduction to Digital Image Processing. 2003. Available online: https://pdfhall.com/an-introduction-to-digital-image-processing-fr_5b221dea097c47246a8b460a.html (accessed on 20 August 2019).
- Sauvola, J.; Pietikäinen, M. Adaptive document image binarization. Pattern Recognit. 2000, 33, 225–236. [Google Scholar] [CrossRef] [Green Version]
- Otsu, N. A threshold selection method from gray-level histograms. IEEE Trans. Syst. Man Cybern. 1979, 9, 62–66. [Google Scholar] [CrossRef] [Green Version]
- Ridler, T.; Calvard, S. Picture thresholding using an iterative selection method. IEEE Trans. Syst. Man Cybern. 1978, 8, 630–632. [Google Scholar]
- Reeves, A.P.; Kostis, W.J. Computer-aided diagnosis of small pulmonary nodules. In Seminars in Ultrasound, CT and MRI; Elsevier: Amsterdam, The Netherlands, 2000. [Google Scholar]
- Li, L.; Zheng, Y.; Kallergi, M.; Clark, R.A. Improved method for automatic identification of lung regions on chest radiographs. Acad. Radiol. 2001, 8, 629–638. [Google Scholar] [CrossRef]
- Toriwaki, J.; Ji, T.; Ji, H. Computer analysis of chest photofluorograms and its application to automated screening. Iyō denshi to seitai kōgaku. Jpn. J. Med Electron. Biol. Eng. 1980, 3, 63–81. [Google Scholar]
- Yue, Z.; Goshtasby, A.; Ackerman, L.V. Automatic detection of rib borders in chest radiographs. IEEE Trans. Med. Imaging 1995, 14, 525–536. [Google Scholar] [PubMed]
- Annangi, P.; Thiruvenkadam, S.; Raja, A.; Xu, H.; Sun, X.; Mao, L. A region based active contour method for X-ray lung segmentation using prior shape and low level features. In Proceedings of the 2010 IEEE International Symposium on Biomedical Imaging: From Nano to Macro, Rotterdam, The Netherlands, 14–17 April 2010. [Google Scholar]
- Van Ginneken, B.; Stegmann, M.B.; Loog, M. Segmentation of anatomical structures in chest radiographs using supervised methods: A comparative study on a public database. Med. Image Anal. 2006, 10, 19–40. [Google Scholar] [CrossRef] [PubMed] [Green Version]
- Loog, M.; Ginneken, B. Segmentation of the posterior ribs in chest radiographs using iterated contextual pixel classification. IEEE Trans. Med. Imaging 2006, 25, 602–611. [Google Scholar] [CrossRef] [PubMed]
- Loog, M.; van Ginneken, B. Supervised segmentation by iterated contextual pixel classification. In Proceedings of the Object Recognition Supported by User Interaction for Service Robots, Quebec City, QC, Canada, 11–15 August 2002. [Google Scholar]
- Redmon, J.; Divvala, S.; Girshick, R.; Farhadi, A. You only look once: Unified, real-time object detection. In Proceedings of the IEEE Conference on Computer Vision and Pattern Recognition, CVPR 2016, Las Vegas, NV, USA, 26 June–1 July 2016. [Google Scholar]
- Liu, W.; Anguelov, D.; Erhan, D.; Szegedy, C.; Reed, S.; Fu, C.Y.; Berg, A.C. Ssd: Single shot multibox detector. In Proceedings of the European Conference on Computer Vision, ECCV 2016, Amsterdam, The Netherlands, 11–14 October 2016; Springer: Berlin/Heidelberg, Germany, 2016. [Google Scholar]
- Suzuki, K.; Abe, H.; MacMahon, H.; Doi, K. Image-processing technique for suppressing ribs in chest radiographs by means of massive training artificial neural network (MTANN). IEEE Trans. Med. Imaging 2006, 25, 406–416. [Google Scholar] [CrossRef] [Green Version]
- Cootes, T.F.; Taylor, C.J.; Cooper, D.H.; Graham, J. Active shape models-their training and application. Comput. Vis. Image Underst. 1995, 61, 38–59. [Google Scholar] [CrossRef] [Green Version]
- Yu, T.; Luo, J.; Ahuja, N. Shape regularized active contour using iterative global search and local optimization. In Proceedings of the 2005 IEEE Computer Society Conference on Computer Vision and Pattern Recognition (CVPR’05), San Diego, CA, USA, 20–25 June 2005. [Google Scholar]
- Van Ginneken, B.; Frangi, A.F.; Staal, J.J.; ter Haar Romeny, B.M.; Viergever, M.A. Active shape model segmentation with optimal features. IEEE Trans. Med. Imaging 2002, 21, 924–933. [Google Scholar] [CrossRef] [PubMed]
- Van Ginneken, B.; Katsuragawa, S.; ter Haar Romeny, B.M.; Doi, K.; Viergever, M.A. Automatic detection of abnormalities in chest radiographs using local texture analysis. IEEE Trans. Med. Imaging 2002, 21, 139–149. [Google Scholar] [CrossRef] [PubMed]
- Seghers, D.; Loeckx, D.; Maes, F.; Vandermeulen, D.; Suetens, P. Minimal shape and intensity cost path segmentation. IEEE Trans. Med. Imaging 2007, 26, 1115–1129. [Google Scholar] [CrossRef]
- Shi, Y.; Qi, F.; Xue, Z.; Chen, L.; Ito, K.; Matsuo, H.; Shen, D. Segmenting lung fields in serial chest radiographs using both population-based and patient-specific shape statistics. IEEE Trans. Med. Imaging 2008, 27, 481–494. [Google Scholar]
- Dawoud, A. Lung segmentation in chest radiographs by fusing shape information in iterative thresholding. IET Comput. Vis. 2011, 5, 185–190. [Google Scholar] [CrossRef]
- Coppini, G.; Miniati, M.; Monti, S.; Paterni, M.; Favilla, R.; Ferdeghini, E.M. A computer-aided diagnosis approach for emphysema recognition in chest radiography. Med. Eng. Phys. 2013, 35, 63–73. [Google Scholar] [CrossRef]
- Howard, A.G.; Zhu, M.; Chen, B.; Kalenichenko, D.; Wang, W.; Weyand, T.; Andreetto, M.; Adam, H. Mobilenets: Efficient convolutional neural networks for mobile vision applications. arXiv 2017, arXiv:1704.04861. [Google Scholar]
- Pal, N.R.; Pal, S.K. A review on image segmentation techniques. Pattern Recognit. 1993, 26, 1277–1294. [Google Scholar] [CrossRef]
- Shiraishi, J.; Katsuragawa, S.; Ikezoe, J.; Matsumoto, T.; Kobayashi, T.; Komatsu, K.I.; Matsui, M.; Fujita, H.; Kodera, Y.; Doi, K. Development of a digital image database for chest radiographs with and without a lung nodule: receiver operating characteristic analysis of radiologists’ detection of pulmonary nodules. Am. J. Roentgenol. 2000, 174, 71–74. [Google Scholar] [CrossRef]
- Hinton, G.E.; Srivastava, N.; Krizhevsky, A.; Sutskever, I.; Salakhutdinov, R.R. Improving neural networks by preventing co-adaptation of feature detectors. arXiv 2012, arXiv:1207.0580. [Google Scholar]
- Hillman, B.J.; Joseph, C.A.; Mabry, M.R.; Sunshine, J.H.; Kennedy, S.D.; Noether, M. Frequency and costs of diagnostic imaging in office practice—A comparison of self-referring and radiologist-referring physicians. N. Engl. J. Med. 1990, 323, 1604–1608. [Google Scholar] [CrossRef] [PubMed]
Figure 1.
Flowchart of the proposed pre-processing approach.

Figure 2.
A chest X-ray (CXR) image histogram is divided into the two sub-histograms. and represent the peak bin values in the lower and upper sub-histograms.
Figure 2.
A chest X-ray (CXR) image histogram is divided into the two sub-histograms. and represent the peak bin values in the lower and upper sub-histograms.

Figure 3.
General architectures of three common state-of-the-art deep-neural networks-based models for semantic segmentation. (a) Fully Convolutional Network (FCN) [11], (b) U-net [12], and (c) SegNet [13].

Figure 4.
An example of segmentation results. The red and green contours represent the expert annotation and the estimated segmentation by the U-net model [12], respectively. Note that contrast of the figure is enhanced for display.
Figure 4.
An example of segmentation results. The red and green contours represent the expert annotation and the estimated segmentation by the U-net model [12], respectively. Note that contrast of the figure is enhanced for display.


Table 1.
The segmentation accuracy (measured using Jaccard, Dice, and MAE metrics) of the often-used segmentation models using different pixel clusters.
Table 1.
The segmentation accuracy (measured using Jaccard, Dice, and MAE metrics) of the often-used segmentation models using different pixel clusters.
| Model | Index | MAE | Model | Index | MAE | ||||||
|---|---|---|---|---|---|---|---|---|---|---|---|
| U-net | k = 2 | ECXR | 0.838 | 0.880 | 0.738 | FCN-8 | k = 2 | ECXR | 0.808 | 0.807 | 0.709 |
| OCXR | 0.832 | 0.738 | 0.737 | OCXR | 0.804 | 0.704 | 0.710 | ||||
| k = 16 | ECXR | 0.839 | 0.887 | 0.739 | k = 16 | ECXR | 0.809 | 0.810 | 0.709 | ||
| OCXR | 0.835 | 0.740 | 0.739 | OCXR | 0.805 | 0.706 | 0.709 | ||||
| k = 256 | ECXR | 0.840 | 0.891 | 0.740 | k = 256 | ECXR | 0.809 | 0.810 | 0.711 | ||
| OCXR | 0.836 | 0.739 | 0.740 | OCXR | 0.806 | 0.707 | 0.710 | ||||
| Original | ECXR | 0.842 | 0.893 | 0.739 | Original | ECXR | 0.809 | 0.811 | 0.711 | ||
| OCXR | 0.839 | 0.740 | 0.740 | OCXR | 0.808 | 0.707 | 0.709 | ||||
| FCN-32 | k = 2 | ECXR | 0.641 | 0.645 | 0.621 | SegNet | k = 2 | ECXR | 0.833 | 0.842 | 0.734 |
| OCXR | 0.638 | 0.541 | 0.620 | OCXR | 0.835 | 0.736 | 0.735 | ||||
| k = 16 | ECXR | 0.641 | 0.650 | 0.626 | k = 16 | ECXR | 0.835 | 0.845 | 0.735 | ||
| OCXR | 0.639 | 0.543 | 0.624 | OCXR | 0.835 | 0.735 | 0.734 | ||||
| k = 256 | ECXR | 0.642 | 0.653 | 0.630 | k = 256 | ECXR | 0.836 | 0.846 | 0.735 | ||
| OCXR | 0.640 | 0.541 | 0.629 | OCXR | 0.835 | 0.734 | 0.734 | ||||
| Original | ECXR | 0.642 | 0.655 | 0.632 | Original | ECXR | 0.837 | 0.851 | 0.736 | ||
| OCXR | 0.641 | 0.543 | 0.628 | OCXR | 0.835 | 0.734 | 0.735 | ||||
Table 2.
The comparisons of the convergence rates (measured using numbers of iterations needed for the training of the models to converge) using different pre-processing approaches. The second to fifth columns list the total iterations for convergence. The sixth to tenth columns list the iteration reduction percentages “A” versus “B” (e.g., original chest X-ray (OCXR) vs enhanced chest X-ray (ECXR)). The last row shows the average with respect to each column.
| Model | Iterations | OCXR vs. ECXR | OCXR vs. BOCXR | OCXR vs. BECXR | BOCXR vs. BECXR | ECXR vs. BECXR | |||
|---|---|---|---|---|---|---|---|---|---|
| OCXR | ECXR | BOCXR | BECXR | ||||||
| U-net | 11,321 | 9394 | 10,517 | 8664 | −17.02% | −7.10% | −23.47% | −17.62% | −7.77% |
| FCN-8 | 21,665 | 19,523 | 20,101 | 16,512 | −9.89% | −7.22% | −23.78% | −17.85% | −15.42% |
| FCN-32 | 19,433 | 17,576 | 18,298 | 15,273 | −9.56% | −5.84% | −21.41% | −16.53% | −13.10% |
| SegNet | 13,588 | 12,209 | 12,456 | 11,868 | −10.15% | −8.33% | −12.66% | −4.72% | −2.79% |
| Average | 16,502 | 14,676 | 15,343 | 13,079 | −11.07% | −7.02% | −20.74% | −14.75% | −10.88% |
© 2020 by the authors. Licensee MDPI, Basel, Switzerland. This article is an open access article distributed under the terms and conditions of the Creative Commons Attribution (CC BY) license (http://creativecommons.org/licenses/by/4.0/).
Share and Cite
MDPI and ACS Style
Chen, H.-J.; Ruan, S.-J.; Huang, S.-W.; Peng, Y.-T. Lung X-ray Segmentation using Deep Convolutional Neural Networks on Contrast-Enhanced Binarized Images. Mathematics 2020, 8, 545. https://0-doi-org.brum.beds.ac.uk/10.3390/math8040545
AMA Style
Chen H-J, Ruan S-J, Huang S-W, Peng Y-T. Lung X-ray Segmentation using Deep Convolutional Neural Networks on Contrast-Enhanced Binarized Images. Mathematics. 2020; 8(4):545. https://0-doi-org.brum.beds.ac.uk/10.3390/math8040545
Chicago/Turabian StyleChen, Hsin-Jui, Shanq-Jang Ruan, Sha-Wo Huang, and Yan-Tsung Peng. 2020. "Lung X-ray Segmentation using Deep Convolutional Neural Networks on Contrast-Enhanced Binarized Images" Mathematics 8, no. 4: 545. https://0-doi-org.brum.beds.ac.uk/10.3390/math8040545
Note that from the first issue of 2016, this journal uses article numbers instead of page numbers. See further details here.