Article

Rational Design of a Genetic Finite State Machine: Combining Biology, Engineering, and Mathematics for Bio-Computer Research

by
David Fuente
1,2,*,
Óscar Garibo i Orts
3,
J. Alberto Conejero
4 and
Javier F. Urchueguía
1
1
Instituto de Aplicaciones de las Tecnologías de la Información y de las Comunicaciones Avanzadas, Universitat Politècnica de València, 46022 València, Spain
2
Department of Biophysics, Faculty of Science, Palacký University, 77147 Olomouc, Czech Republic
3
ETS Ingeniería Informática, Universitat Politècnica de València, 46022 València, Spain
4
Instituto Universitario de Matemática Pura y Aplicada, Universitat Politècnica de València, 46022 València, Spain
*
Author to whom correspondence should be addressed.
Submission received: 4 June 2020 / Revised: 3 August 2020 / Accepted: 11 August 2020 / Published: 14 August 2020

Abstract

:
The recent success of biological engineering is due to a tremendous amount of research effort and the increasing number of market opportunities. Indeed, this has been partially possible due to the contribution of advanced mathematical tools and the application of engineering principles in genetic-circuit development. In this work, we use a rationally designed genetic circuit to show how models can support research and motivate students to apply mathematics in their future careers. A genetic four-state machine is analyzed using three frameworks: deterministic and stochastic modeling through differential and master equations, and a spatial approach via a cellular automaton. Each theoretical framework sheds light on the problem in a complementary way. It helps in understanding basic concepts of modeling and engineering, such as noise, robustness, and reaction–diffusion systems. The designed automaton could be part of a more complex system of modules conforming future bio-computers and it is a paradigmatic example of how models can assist teachers in multidisciplinary education.

1. Introduction

1.1. Genetic-Device Engineering

Nowadays, many research fields are converging into multidisciplinary areas where different types of knowledge are required. In particular, synthetic biology is an incipient transversal field that seeks the creation and modification of living organisms to provide them with new functions that they do not have or to optimize already present capacities [1]. The development of engineered organisms pursues the mass production of medicines, fuels, food, or bulk chemicals [2], and the design of biosensors capable of detecting harmful compounds [3]. Experts see this discipline as the one responsible for revolutionizing life sciences during the next decade [4,5]. Indeed, there are already commercial ventures in this matter such as milk secretion by yeast, β-carotene high-content rice, artificial vanillin production or bio-rubber synthesis, among others [6].
Every year, hundreds of university teams participate in the most prestigious synthetic biology competition in the world, which is called the International Genetically Engineering Machine competition (iGEM) and is held by Massachusetts Institute of Technology and iGEM Foundation. In this contest, student teams develop cutting-edge synthetic biology ideas to transform organisms into bio-factories. Plenty of breakthrough futuristic works can be found in the corresponding wiki of each team (igem.org). Interestingly, a strict requirement for any project is to support the experimental work with mathematical modeling.
After having reviewed tens of projects, one work caught our attention: the genetic finite state machine (FSM) initially conceived by a group of undergraduate students from the Swiss Federal Institute of Technology in Zurich (ETHZ, Zürich, Switzerland). The ETHZ team developed an automaton, whose states corresponds to genetic constructions, which are built in a modular way [7]. The corresponding project wiki is accessible (https://2006.igem.org/wiki/index.php/ETH_Zurich_2005).
An FSM is a mathematical model of computation in which the system can be in exactly one of a finite number of states at any given time [8]. Each instant, the state of the machine is determined by the input signals, i.e., the outgoing signal depends only on the state of the machine and the actual input values. An FSM has interesting properties to be explored mathematically. Yet, to achieve a final prototype fulfilling desired specifications, extensive modeling work is in general required since the implementation of artificial genetic circuits has a huge impact on the native species. Correct parametrization is crucial to fine-tune the circuit and obtain robust and well-programmed functionality.
We can implement this in a prokaryotic bacterium, such as E. coli. Cells incorporating this device would be capable of “counting” up to two signals. However, adding n FSM in series, 2n stimuli could be counted. Despite the slowness of genetic circuits compared with electronic ones, one milliliter of suspension with living cells can have up to 109 cells, hence increasing the prospect of converting living cells into computational networks. In other words, the cellular counter could be a part of the heart of a future biological computer. Additionally, when coupled with other genetic devices, the FSM might be used as a trigger once a threshold number of signals has been reached.
A genetic circuit works in a rather simple fashion: genetic modules produce regulatory proteins, also called transcription factors, which affect the operation of the rest of the modules, i.e., such proteins can either activate or repress the protein production of the other constructs [9]. Hence, this network is analogous to an electronic circuit with logic gates [10], which can deliver completely different outputs depending on its configuration [11]. Here, the analogy of the electric current corresponds to the protein generation rate, which is, in turn, affected by the concentration of some of the transcriptional factors.

1.2. Cellular Automata and Self-Replicative Machines

A cellular automaton (CA) is a well-formalized framework that evolves in discrete steps and is used for exploring spatial dynamic systems [12]. In this type of formalism, space is modeled as a regular grid of cells, also called patches, of a particular dimension. Each cell can be in a limited number of states and can interact with the neighbor patches following some defined set of transition rules. The state of any cell evolves according to its present state and its neighboring patches. Typically, the rule for updating the patches’ state is equal for each patch, does not change over time, and is applied to the whole grid simultaneously and iteratively.
The CA concept was first introduced in the late 1940s by J. von Neumann and S. Ulam to design machines that were able to self-reproduce [13]. Through rather simple principles, complex figures and cell patterns emerged and in some cases even the cells could reproduce themselves. In 1970, John Conway unveiled the probably best-known cellular automaton, the Game of Life (Life), published by Martin Gardner in Scientific American magazine [14]. Conway designed Life so as to obtain patterns that may grow indefinitely and can be considered a simplified example of a self-replicative machine. One of Life’s most important characteristics is its ability to perform universal computation, that is, that with an appropriate initial distribution of living and dead cells, Life can be converted into a general-purpose computer, a Turing machine [15]. An online applet to explore the emergent patterns of this cellular automaton is available (https://bitstorm.org/gameoflife/).

1.3. Multidisciplinary Education under the Umbrella of Synthetic Biology

Nowadays, Science, Technology, Engineering, and Mathematics (STEM) education [16], [17] is gradually increasing its importance in other fields of study, such as biology [18]. Multidisciplinary teaching strategies [19,20,21] are necessary due to demanded professional profiles in a hyper-connected and technological society that continuously requests high-tech products and services. In this regard, students often lack in-depth mathematical knowledge and often tend to overlook mathematical tools [22] that could be useful for their future research career and scientific success. Often, false beliefs related to the difficulty and possible applications of mathematics affect students’ predisposition to learn modeling notions [23]. With the appropriate context and selected examples [24,25], it would be easier for engineers and life science students to comprehend advanced formal concepts.
In our case, we have been teaching a course on Metabolic Engineering and Synthetic Biology to students in the last year of the Biotechnology degree at our university. This course is structured in two parts:
  • Metabolic Engineering, where the students are first introduced to (i) the fundamentals of the dynamics of genetic circuits through ordinary differential equations and to (ii) genome-scale metabolic modeling.
  • Synthetic Biology, where the students learn how to build synthetic circuits, to design genetic parts, and how to use the different assembly methods [26] and related software [27].
Our present contribution is linked to the first part. We follow a project-based learning approach in which students revisit the modeling framework of a previous iGEM project in groups of three to four students. These projects allow us to delve deeper into some mathematical aspects with direct application to biotechnology. Students have to implement models following the indications of the corresponding team wiki. They have to evaluate and check what is exposed in the project and experiment with the model, suggesting further improvements related to the chosen topic. Such an approach has contributed to a sustained and rising enrolment of students in this course. This has further motivated students to study Synthetic Biology and has contributed to the involvement and success of our team in the iGEM competition. Finally, this approach is really effective to be transferred to online education as we have seen during last months. We could redesign the course during the confinement caused by the CoVID-19 pandemic without considerable effort. Indeed, students only need the appropriate instructions and basic knowledge to start developing their own models, often following a modular approach while making use of selected online tutorials and their own prepared documentation.
The second part of the subject is partially evaluated by presenting the biological aspects of another iGEM project. In this case, students also have to include the Human Practices section, in which they show the impact of the project on society and other disciplines. Multidisciplinary approaches have been the backbone of our last projects presented at the iGEM competition (Hype-IT http://2016.igem.org/Team:Valencia_UPV, ChatterPlant http://2017.igem.org/Team:Valencia_UPV and Printeria http://2018.igem.org/Team:Valencia_UPV), where the development of open hardware and software for the Synthetic Biology community has been a leitmotiv.
Though our actual modeling lectures have been positively evaluated by the students, we want to go one step further in mathematics education. In this work, we present a teaching strategy that could stimulate students to gather deeper mathematical knowledge to assess a well-known example within the student’s background and apply different models to the same system. In this way, students can better recognize the advantages and limitations of each modeling framework. For this purpose, the “one-system-different-models” principle is applied to the FSM. By doing so, we can investigate some of its mathematical properties from a broader perspective and delimit a proper parametrization space.
In particular, we will first use ordinary differential equations (ODEs) to simulate the protein concentration of each state and hence to illustrate the basic behavior of the whole system. Simple tools such as ODEs encourage students to become more familiar with the problem and introduce students to abstraction and logical thinking since living cells can be treated as modular systems [28]. Some examples can be found in [29,30]
Such a deterministic approach has some limitations because it gives an ideal average response, which is often not realistic in the biological field due to the inherent randomness of life [31]. Thus, other frameworks incorporating noise are needed. Since there are few states and thus few model variables, we decided to use the master equation for computing the stochastic process as it is computationally feasible for our case study and delivers an exact solution. A comprehensive review of stochastic procedures in systems biology is available [32]. Finally, the circuit was simulated as a cellular automaton to investigate spatio–temporal patterns since the FSM at the culture level can be considered a reaction–diffusion system as most of the life processes are [33].
In summary, the present work intends to be a multidisciplinary example of how modeling can contribute to the development of coherently designed systems. Thanks to engineering and mathematical principles, higher levels of complexity can be reached, while encouraging young students to learn more about mathematics and its often unexploited potential.

2. Materials and Methods

2.1. System Description

The signal counter is implemented as a genetic circuit switching among four internal states, R1 to R4 (Figure 1). The transition between these states is induced by an external signal. Therefore, this genetic FSM is a Mealy Machine: its output depends both on the present state and the present input [34]. The latter can be either absent or present (state values of 0 or 1) as indicated in Figure 1A. Repeated stimuli will lead to successive transitions and finally, to recursive cycling through the four states. Each time the state R4 is reached, an output signal is generated. Therefore, the system is capable of counting input stimuli: for every second signal an output signal is generated. The FSM has an electronic equivalent comprising 3-input NOR gates (Figure 1B). To biologically design such a circuit, genetic logic gates are needed. Generally, any genetic gate is composed of a set of biological parts [35] that allows the transcription of the genetic sequence and the consequent translation into a protein, following the central dogma of molecular biology. Those parts are the promoter (starts transcription, green arrow), ribosome binding site (starts translation, yellow oval), coding sequence (the protein, blue arrow), and the terminator (stops transcription, stop sign) as shown in Figure 1C. A NOR gate delivers a high output only if all inputs to the gate are low. This type of gate can be biologically implemented through a high-basal activity promoter that is repressed by three regulatory proteins. A promoter is a genetic part whose main role is to start the genetic replication cascade (state is ON). When its start site is unblocked, the transcription machinery can attach to it and start copying the coding sequence for a subsequent protein translation. Such regulatory proteins can either have activator or repressive functions on other promoters. Yet, in this FSM, all are effective repressors, except for the signal molecule, which has activation or repressor capacity depending on the promoter it interacts with (Figure 1A). Moreover, if there is at least one of the three corresponding repressors of a particular genetic construction, transcription of the genetic information is inhibited. Only when none is present, transcription might occur (Figure 1C). Each NOR gate expresses a repressor protein Rn that can itself block the operation of both previous gates (Rn−1, Rn−2) and only allow the next one Rn+1. In this way, the FSM can coherently shift to the next state when the signal status changes.

2.2. Deterministic Model

We can describe the signal counter by a set of four ordinary differential equations, each for one state, following Equations (1)–(4). Each represents the temporal evolution of the corresponding regulatory protein Rn, as the general Equation (5) indicates.
d R 1 d t = k 0 + k s y n · a c t ( S , K S a ) · r e p ( R 2 , K R ) · r e p ( R 3 , K R ) k d e g · R 1
d R 2 d t = k 0 + k s y n · r e p ( S , K S r ) · r e p ( R 3 , K R ) · r e p ( R 4 , K R ) k d e g · R 2
d R 3 d t = k 0 + k s y n · a c t ( S , K S a ) · r e p ( R 4 , K R ) · r e p ( R 1 , K R ) k d e g · R 3
d R 4 d t = k 0 + k s y n · r e p ( S , K S r ) · r e p ( R 1 , K R ) · r e p ( R 2 , K R ) k d e g · R 4
Hence, the content evolution of any protein can be described in general for n = 1, 2, 3, 4 as:
d R n d t = k 0 + k s y n · h ( S , K S , ( 1 + ( 1 ) n + 1 ) / 2 ) · h ( R n + 1 , 0 ) · h ( R n + 2 , 0 ) k d e g · R n
with the following functions:
h ( x , K , μ ) = ( x K ) n · μ 1 + ( x K ) n
a c t ( S , K ) = h ( S , K , 1 )   and   r e p ( S , K ) = h ( S , K , 0 )
S ( t ) = max ( 0 , S m a x · s i n ( p · t 2 π ) )
The set of parameters for the base simulation, the coherent design, is:
k 0 = 0   m i n 1 , k s y n = 300   m i n 1 , k d e g = 10   m i n 1 ,   n = 4 ,
K R = 30 ,   K S a = K S r = 0.1 ,   S m a x = 300 ,   p = 20   m i n ,
while the initial conditions are
R 1 ( 0 ) = 1 , R 2 ( 0 ) = R 3 ( 0 ) = R 4 ( 0 ) = 0
The first term of each equation corresponds to the basal synthesis rate k 0 , the second to the induced synthesis rate, whose maximum capacity is given by k s y n , and the third term to the degradation rate, which depends on the characteristic parameter k d . K R is the repressor affinity; it modulates the repressor capacity, that is, the repressor concentration required for an effective inhibition of the other proteins’ synthesis. Similar consideration can be assumed for K S a and K S r , regarding the signaling-molecule effect.
Interestingly, the system of ODEs clearly illustrates the genetic construct dependencies’ producing the repressor protein. Each genetic construct is repressed by the regulatory protein created by the genes that correspond to the next two states. Further, the even-number states are activated by the signal molecule, while the odd ones are repressed. Such interaction is provided by the function h, which is the Hill–Langmuir equation for μ = 1, a particular case of a rectangular hyperbola. Moreover, the Hill coefficient n is a measure of the ultra-sensitivity, i.e., the steepness of the response curve. This parameter is linked with the cooperativity of molecular binding [36]. Values higher than one describe a positively cooperative binding. This is the case for most of the regulatory proteins that are attached to the promoter’s operator site. This site has normally enough space to allow the docking of dimers or even tetramers of regulatory proteins as in our case. In general, it has been assumed that those proteins do not interfere with each other or with their corresponding sites within the promoter.
In summary, the set of ordinary differential equations illustrates how one can define a complex system with desired properties in a simple and modular way. For example, a biological 3-input NOR gate can be in silico defined by coupling three different mathematical functions whose main variable is the corresponding repressor, as indicated in the ODE system.

2.3. Stochastic Model

Randomness and life are intimately related since living cells display noisy behaviors in practically any biological process due to the probabilistic character of biochemical reactions. This is especially critical when the number of reacting molecules is low. In the context of cellular noise, intrinsic and extrinsic noises can be differentiated [37]. The first one happens because of internal microscopic states that lead to differentiated reaction rates. The second emerges from external noise sources that are assumed to affect a given process in the same manner. Thus, extrinsic noise is characterized by affecting molecule creation so that those processes might covary with respect to the external source.
To apply an appropriate stochastic procedure, first it will be assumed that the gene–protein ecosystem of interactions is in thermal equilibrium, where particles move freely and randomly. Due to their homogeneous distribution, they can be found in any part of the volume with the same probability. Thus, the reaction propensities only depend on the actual state of the system [38], i.e., each protein level. Hence, they are random variables whose evolution can be simulated through a Markov process [39]. Therefore, we will use the kinetic Monte Carlo method [38,39,40], which is often referred to as the Gillespie algorithm in the biochemical context, for simulating the stochastic system. The procedure consists of numerically simulating the time evolution of the molecules in a chemically reacting system. This population is discrete and reacts randomly.
Within the master-equation approach, a fundamental magnitude is the system size Ω . This parameter has a volume unit and is used to convert a concentration x into a number of molecules X:
X = Ω x
Alternatively, at a given concentration, as defined by the deterministic model, the greater the system size Ω , the larger the number of molecules. Therefore, the size directly establishes the number of molecules present in the system and thus, the noise.

2.4. Spatial Model

Living systems are normally formed by millions of cells structured as tissues or as colonies. Indeed, spatial modelling is crucial in many cases because space can also affect the overall performance due to emergent properties at a global scale. ODEs can hardly cope with the spatial component when dynamic processes are assessed and for this purpose, partial differential equations are necessary. Nevertheless, there are other formalisms that can deal with space in a more visual and intuitive way such as cellular automata and agent-based models [41]. In fact, we can transform our single-cell FSM into a cell–colony automaton modeled as a regular lattice of cells.
To do so, a CA will be used. A two-dimensional regular grid of square cells is chosen for its simplicity and the Moore neighborhood is proposed, i.e., each patch interacts with the eight adjacent cells. There are 200 cells per row and column, summing up a total of 40,000 cells arranged as a square world. When both horizontal and vertical borders are open, all patches have the same number of neighbor cells and the world is in reality a torus. The biochemical reactions already described for individual cells of the automaton will be implemented at a culture level. Further, diffusion will play a role since it enables compounds to move from one cell to the neighboring ones. This is the principle of reaction–diffusion systems, first introduced in the early 1950s by A. M. Turing [42] and whose respective equations for our study case are the following for n = 1, 2, 3, 4:
Δ r e a c R n = ( k 0 + k s y n · h ( S , K S n , 1 + ( 1 ) n + 1 2 ) · h ( R n + 1 , 0 ) · h ( R n + 2 , 0 ) k d e g · R n ) · Δ t
Δ d i f f R n = D R n · ( 1 | N ( i ) | j N ( i ) R n j R n i )
Δ R n = Δ r e a c R n +   Δ d i f f R n
Equation (10) represents the reaction rate for each time step Δ t and genetic construct present in a cell, i.e., there are four reaction rates in each patch. In contrast, Equation (11) shows the diffusion of a cell i assuming isotropic dissemination of the four regulatory proteins along the eight neighboring cells Nj through the diffusion coefficient D R n . Both rates together sum up the concentration rate at each time step, as Equation (12) indicates.
For an appropriate visualization of protein concentrations along the cell lattice, we chose a different color for each protein (red, yellow, green, and blue following the state sequence). The basic color rule is that the protein with the highest concentration determines the patch’s color at any time step. The color intensity increases according to the percentage of the most abundant protein in that cell, starting from 25% to 50%, the level at which the color intensity saturates.
We developed the code for the deterministic and stochastic simulations in Matlab R2019 a and the routine for the cellular automaton in the NetLogo platform. The latter allows the rapid development of CA and agent-based models for the exploration of emergent phenomena [43]. Indeed, NetLogo is an open-source programming language and comes with an extensive model library in a variety of domains such as economics, biology, physics, chemistry, psychology, and dynamic systems [44]. The employed Matlab and NetLogo codes are included as Supplementary Materials for interested readers.

3. Results

3.1. Deterministic Model

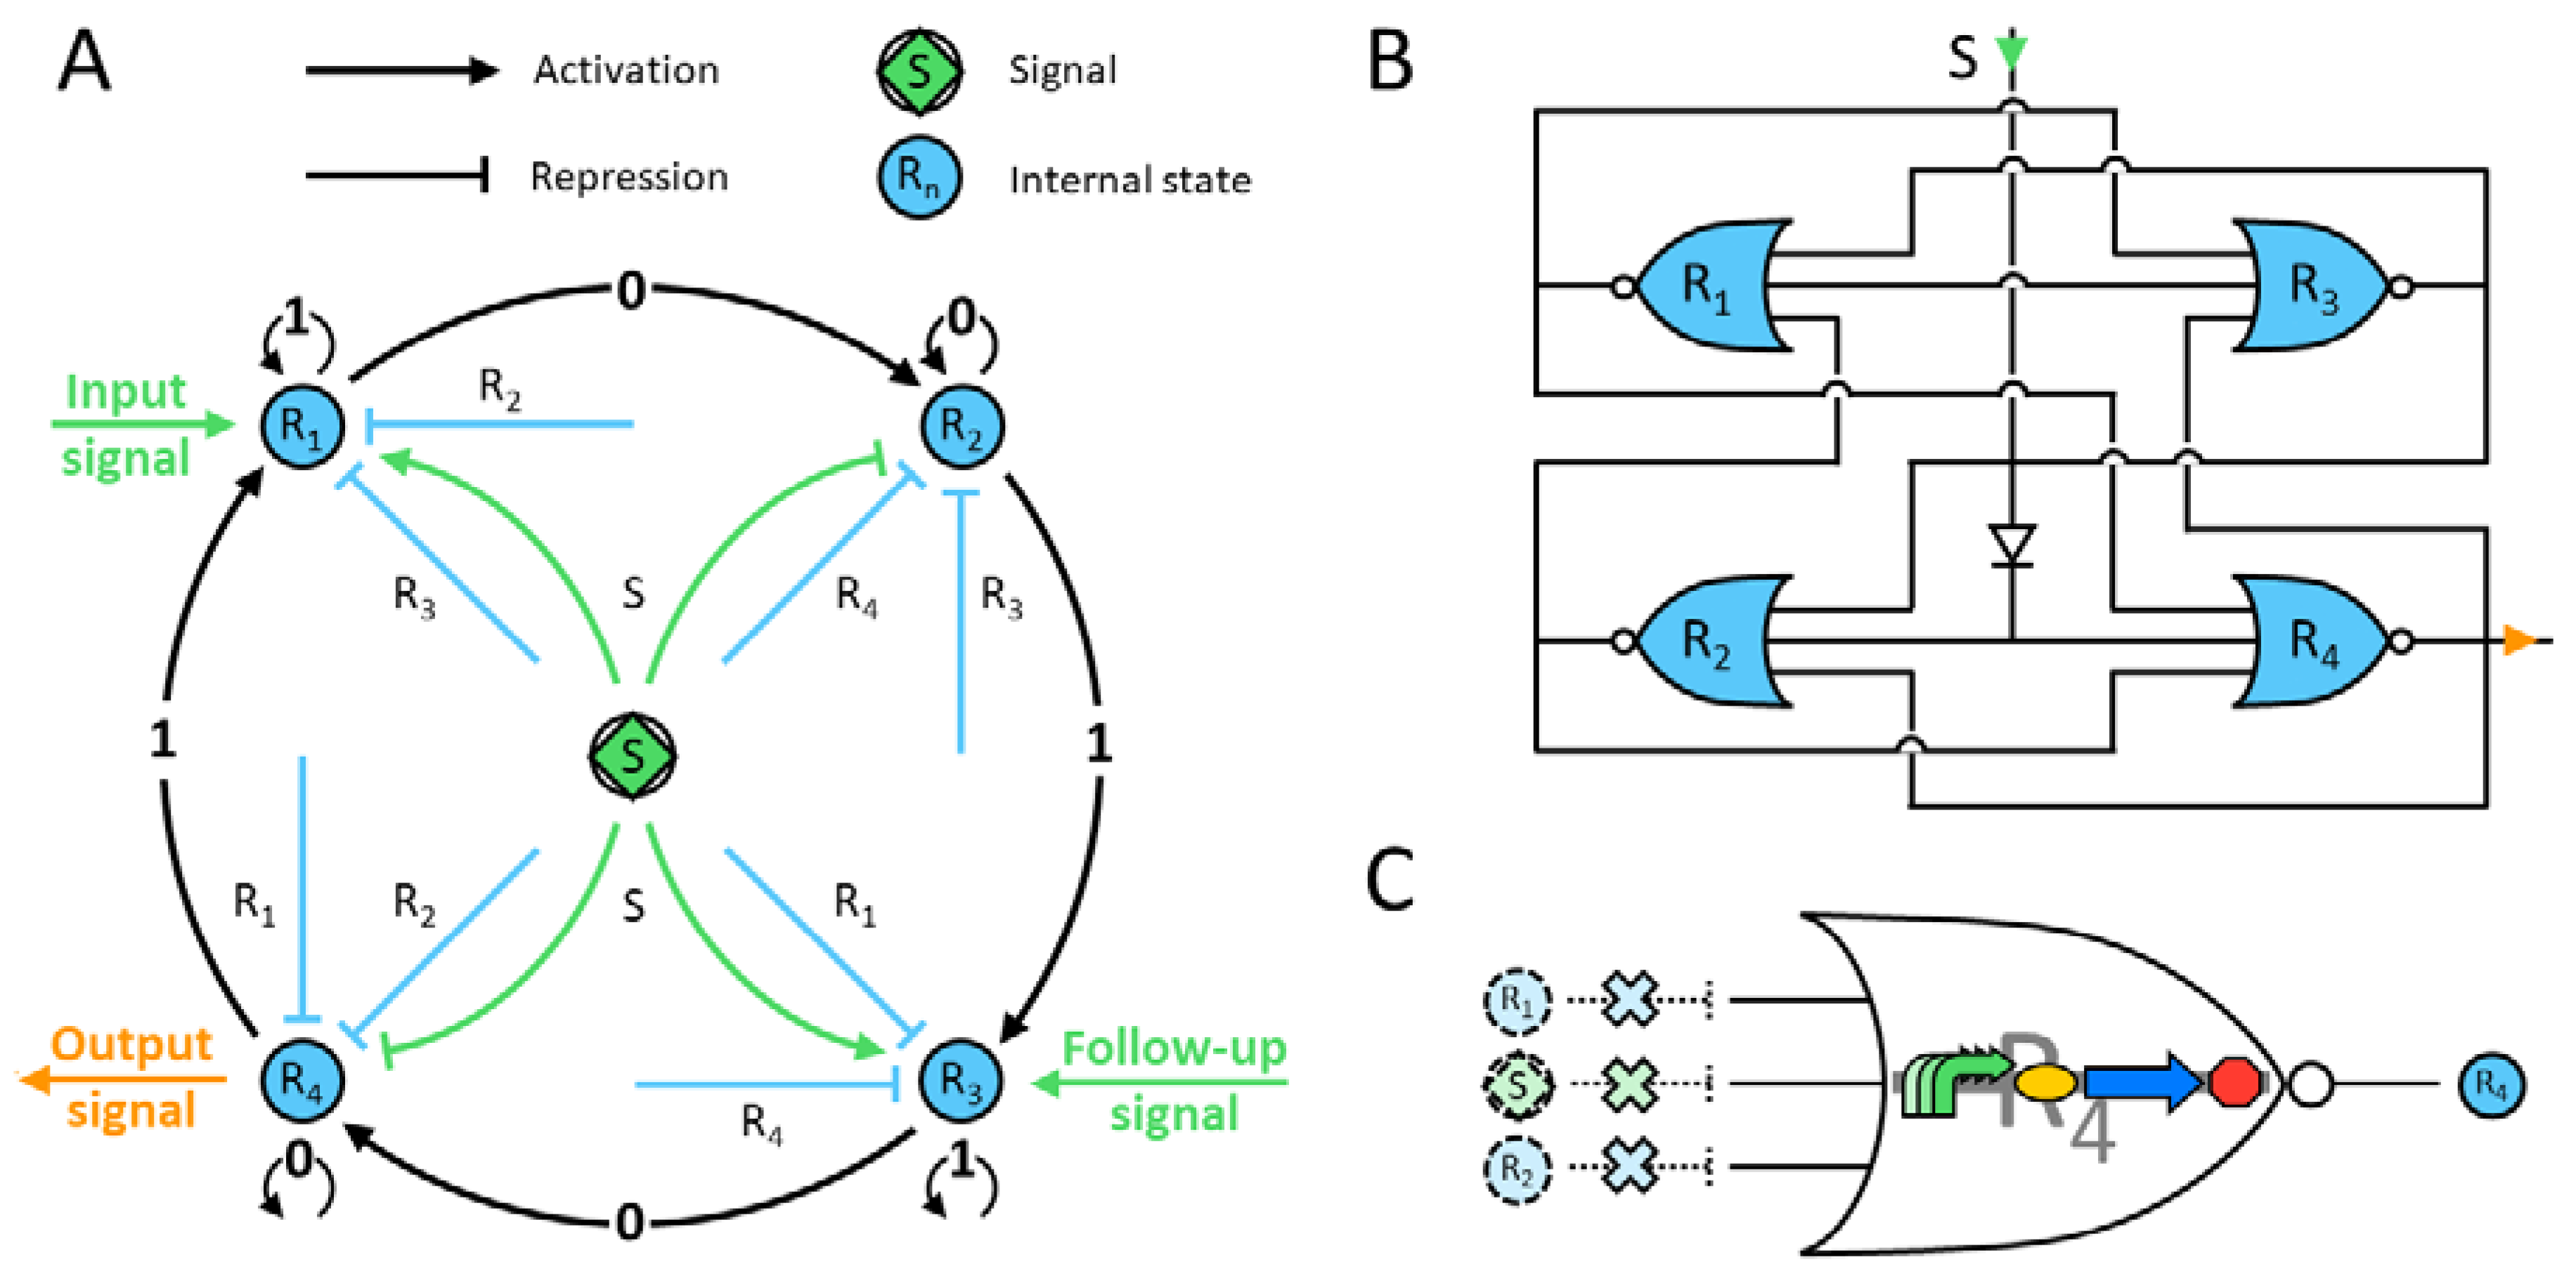
The designed genetic circuit is depicted in 
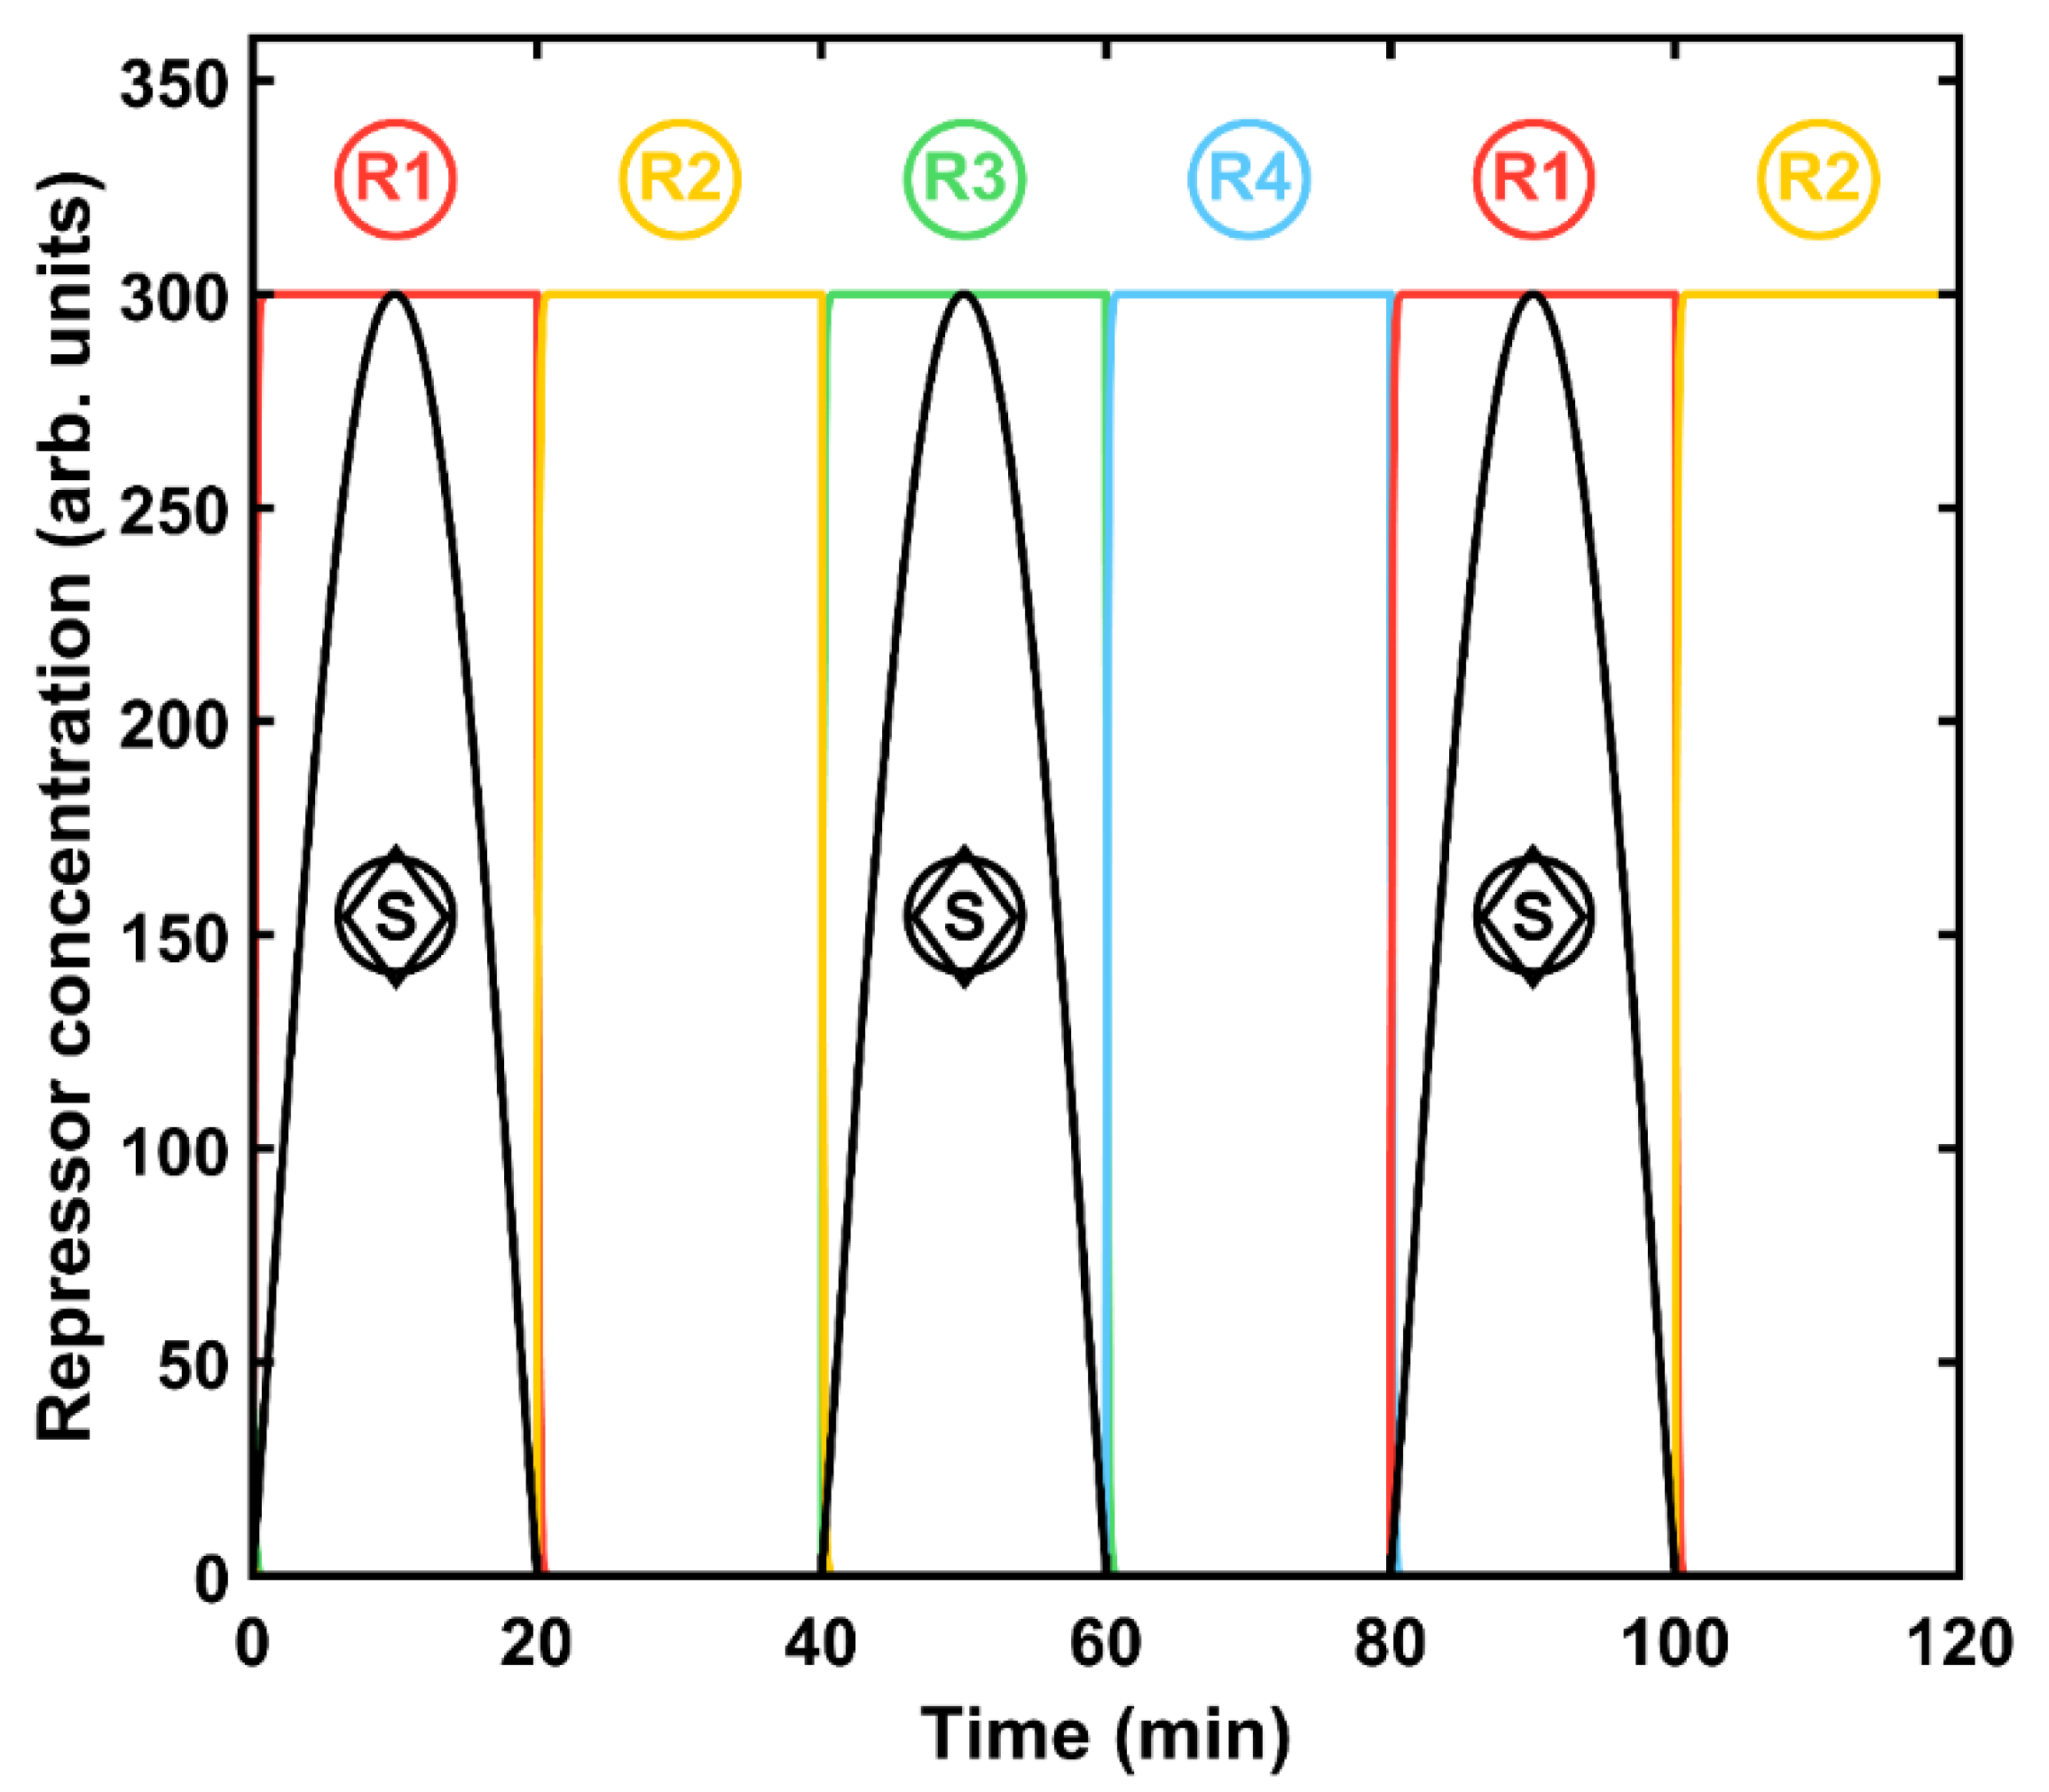
Figure 1, and the corresponding protein evolution is displayed in Figure 2. The four-state automaton starts with the genetic construct producing the repressor protein R1. Only when there is a signal can it be activated, i.e., remains in state 1. Since the other repressors are absent, the machine stays in this state while the signal is present (Figure 2). Once the latter disappears, R1 proteins cannot be built up any more. Moreover, these factors have no inhibitory effect on the next state construct by design. The production of R2 starts once the signal inhibition has faded and the next two repressors are still absent in the system. Remarkably, any previous-state repressor does not affect the promoter of the next-state construct. Hence, the system shifts to R2 and stays in this state while there is no signal. In addition, the R1 proteins are gradually degraded and their concentration vanishes. Next, a second input signal appears; it represses the promoter of R2 and activates the one of R3 (Figure 2). Again, since there are no transcription factors of the next two states, the machine will remain in this state while the signal is on. Finally, the same principles apply for the last state, that is R4, but this construct also produces an output signal that can be externally measured. In summary, the automaton shows a robust and expected output for each state, while the others remain close to zero.
Regarding the effect of the initial conditions, if only a tiny amount of R1 is present, the system can shift state in a consistent manner. If instead of this, the system starts from zero-protein conditions, R1 and R3 appear under signal presence as expected, and their maximal concentrations are around six times lower (data not shown). Increasing the initial concentration of R1 does not affect the automaton behavior as long as there are no other proteins present.
The steady-state concentration is equal to the ratio of protein production to degradation given by the respective coefficients k s y n / k d e g , that is, 300 concentration units for our case study. Therefore, the repressor effects are negligible in the coherent design: there is no effective repression when one state dominates over the rest.
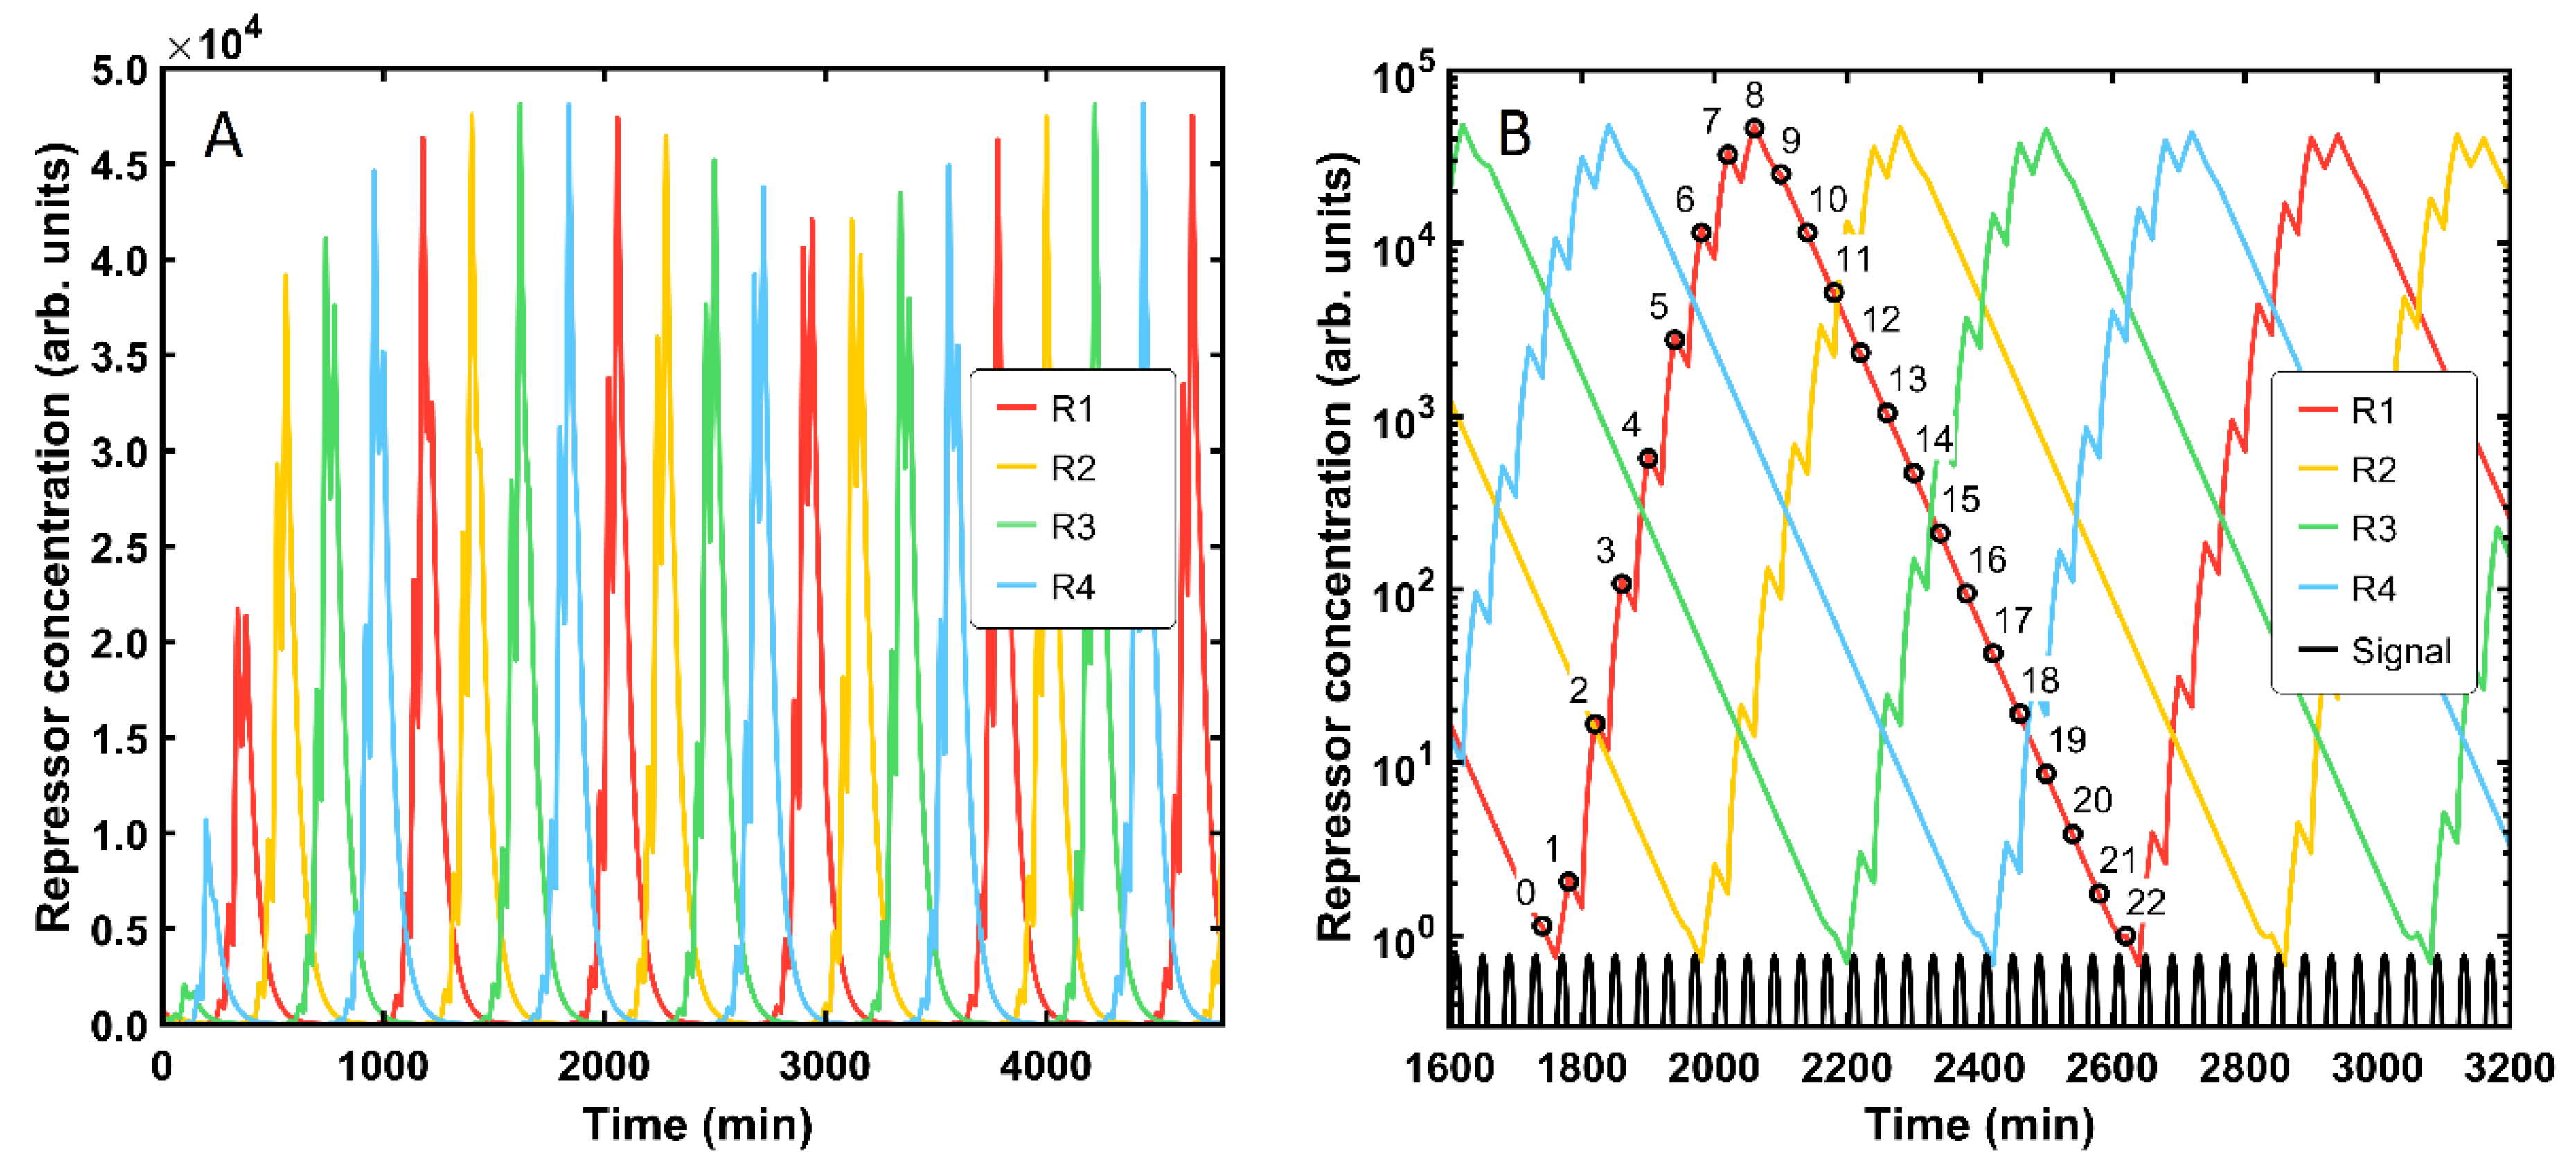
The genetic FSM is a complex system whose functionality is rather sensitive to changes in the magnitude of particular parameters. To illustrate this fact, we evaluated the performance of the automaton with the same parameter set as in the base case of a robust-functionality machine, but assuming a reduced protein degradation rate k d e g , which is now considered to be 50 times lower ( k d e g = 0.2   m i n 1 ). Interestingly, the system displays an altered response (Figure 3). First, time scales and protein concentrations are now an order of magnitude higher. Counterintuitively, the maximal machine output takes much longer to be delivered, though the repressor amounts are considerably higher (Figure 3A). Indeed, the automaton does not display fully robust behavior since many more input signals are required for reaching one machine cycle. The protein levels do not follow any sequential chain and display a sharper shape. In addition, abrupt concentration changes are visible at each signal shift. To further investigate the described effects, the protein concentrations were plotted in a semilogarithmic plot and focused on the time scale of a single machine cycle (Figure 3B). Two different system responses can be distinguished: a local one affected by any new input signal (the abrupt slope changes) and an overall one, which is on a longer time scale. Hence, the FSM is still operating, as it was intended, but at another pace. In fact, 22 input signals are necessary to reach the same state again instead of two stimuli as in the standard design: eight for reaching the state peak, and another fourteen for the lowest value. In general, if the degradation rate is divided by k, then the whole cycle is k-times longer.
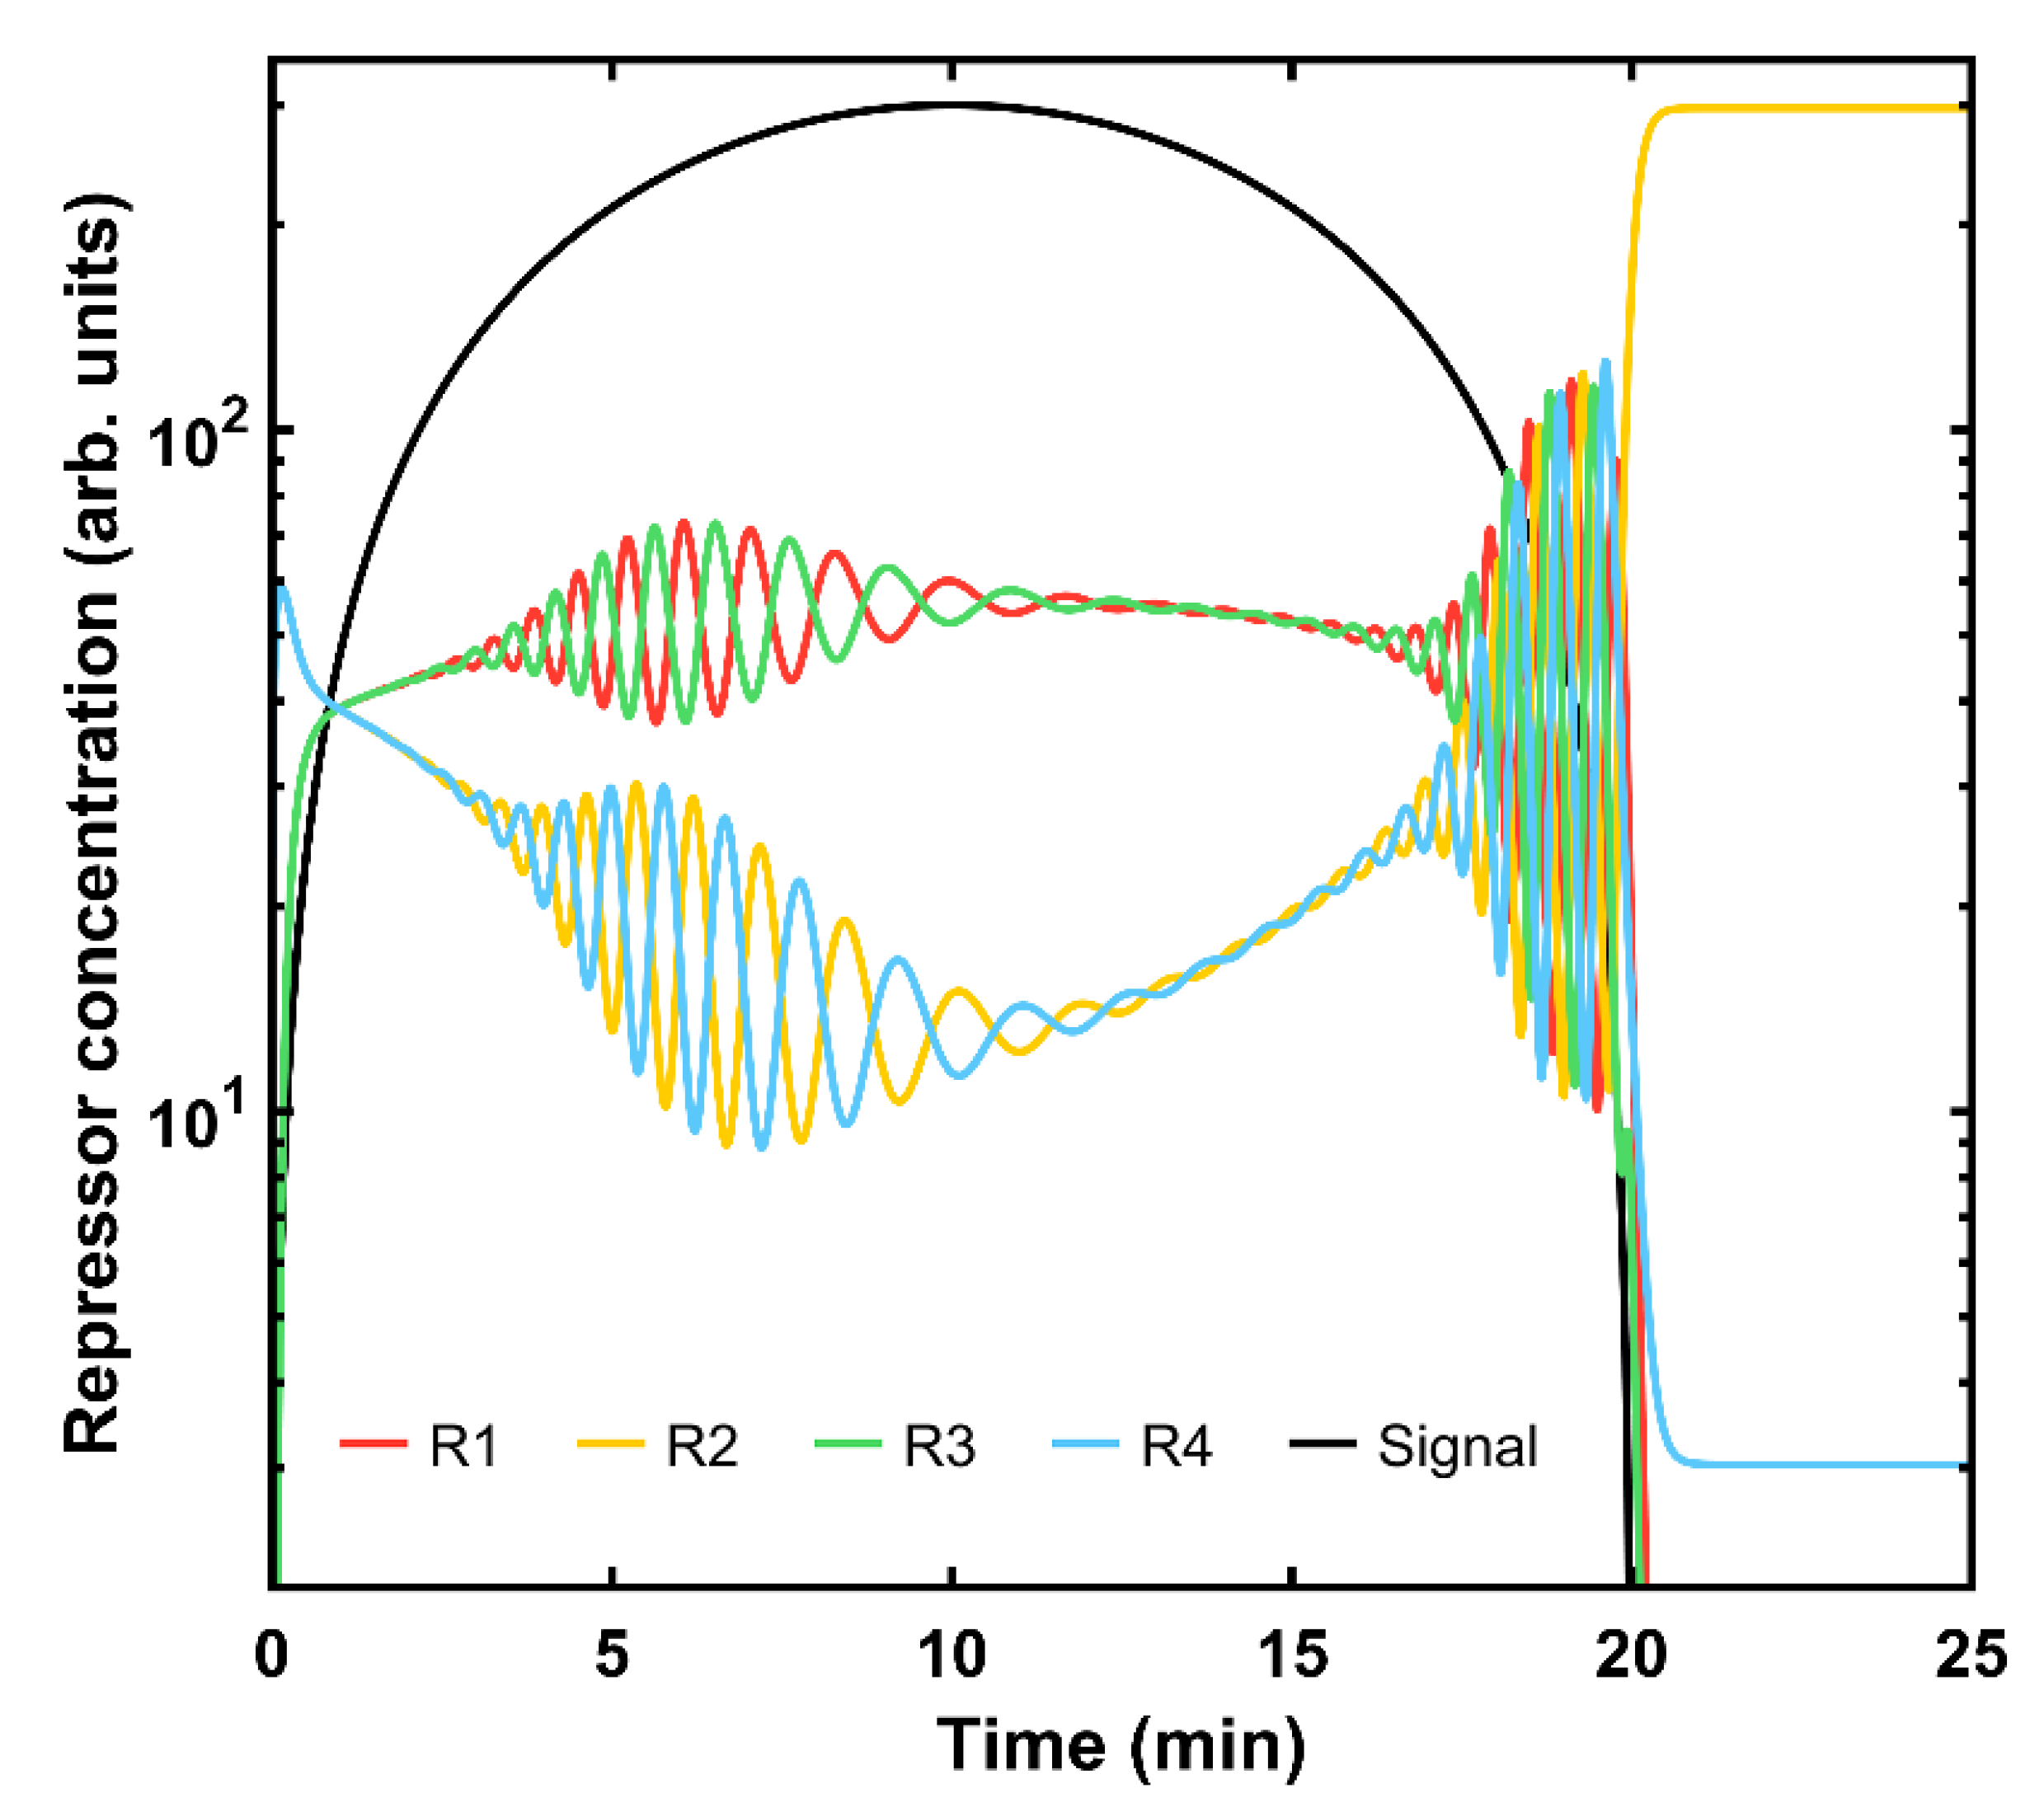
Another interesting experiment can be carried out when asymmetries are introduced in the system by considering a different effect of the input signal regarding its activation (R1, R3) and inhibition capacity (R2, R4). We hypothesize that the molecule representing the signal is capable of stronger activation of the promoter responsible for the production of the proteins R1 and R3, while efficiently repressing the others. The corresponding parameters are now assumed to be K S a = 10 ,   K S r = 165 . In Figure 4, the system displays oscillatory behavior as the signal emerges.
Remarkably, the four states are coupled, sharing the same concentration magnitude within state blocks (red and green curves vs. yellow and blue ones). As long as the signal remains at a high level, both blocks remain approximately constant. However, once it starts to disappear, all states enter a strong feedback loop that is resolved once the signal is over and the second state rules over the rest. Once the system receives another signal, the same oscillatory phenomenon arises. Similarly, the signal amplitude has a clear impact on the device. When it is very low, below one unit, the evolution of the protein content starts to oscillate when the signal is present, but for even lower signal values, the R2 protein becomes predominant and its concentration is constant over time (data not shown).

3.2. Stochastic Model

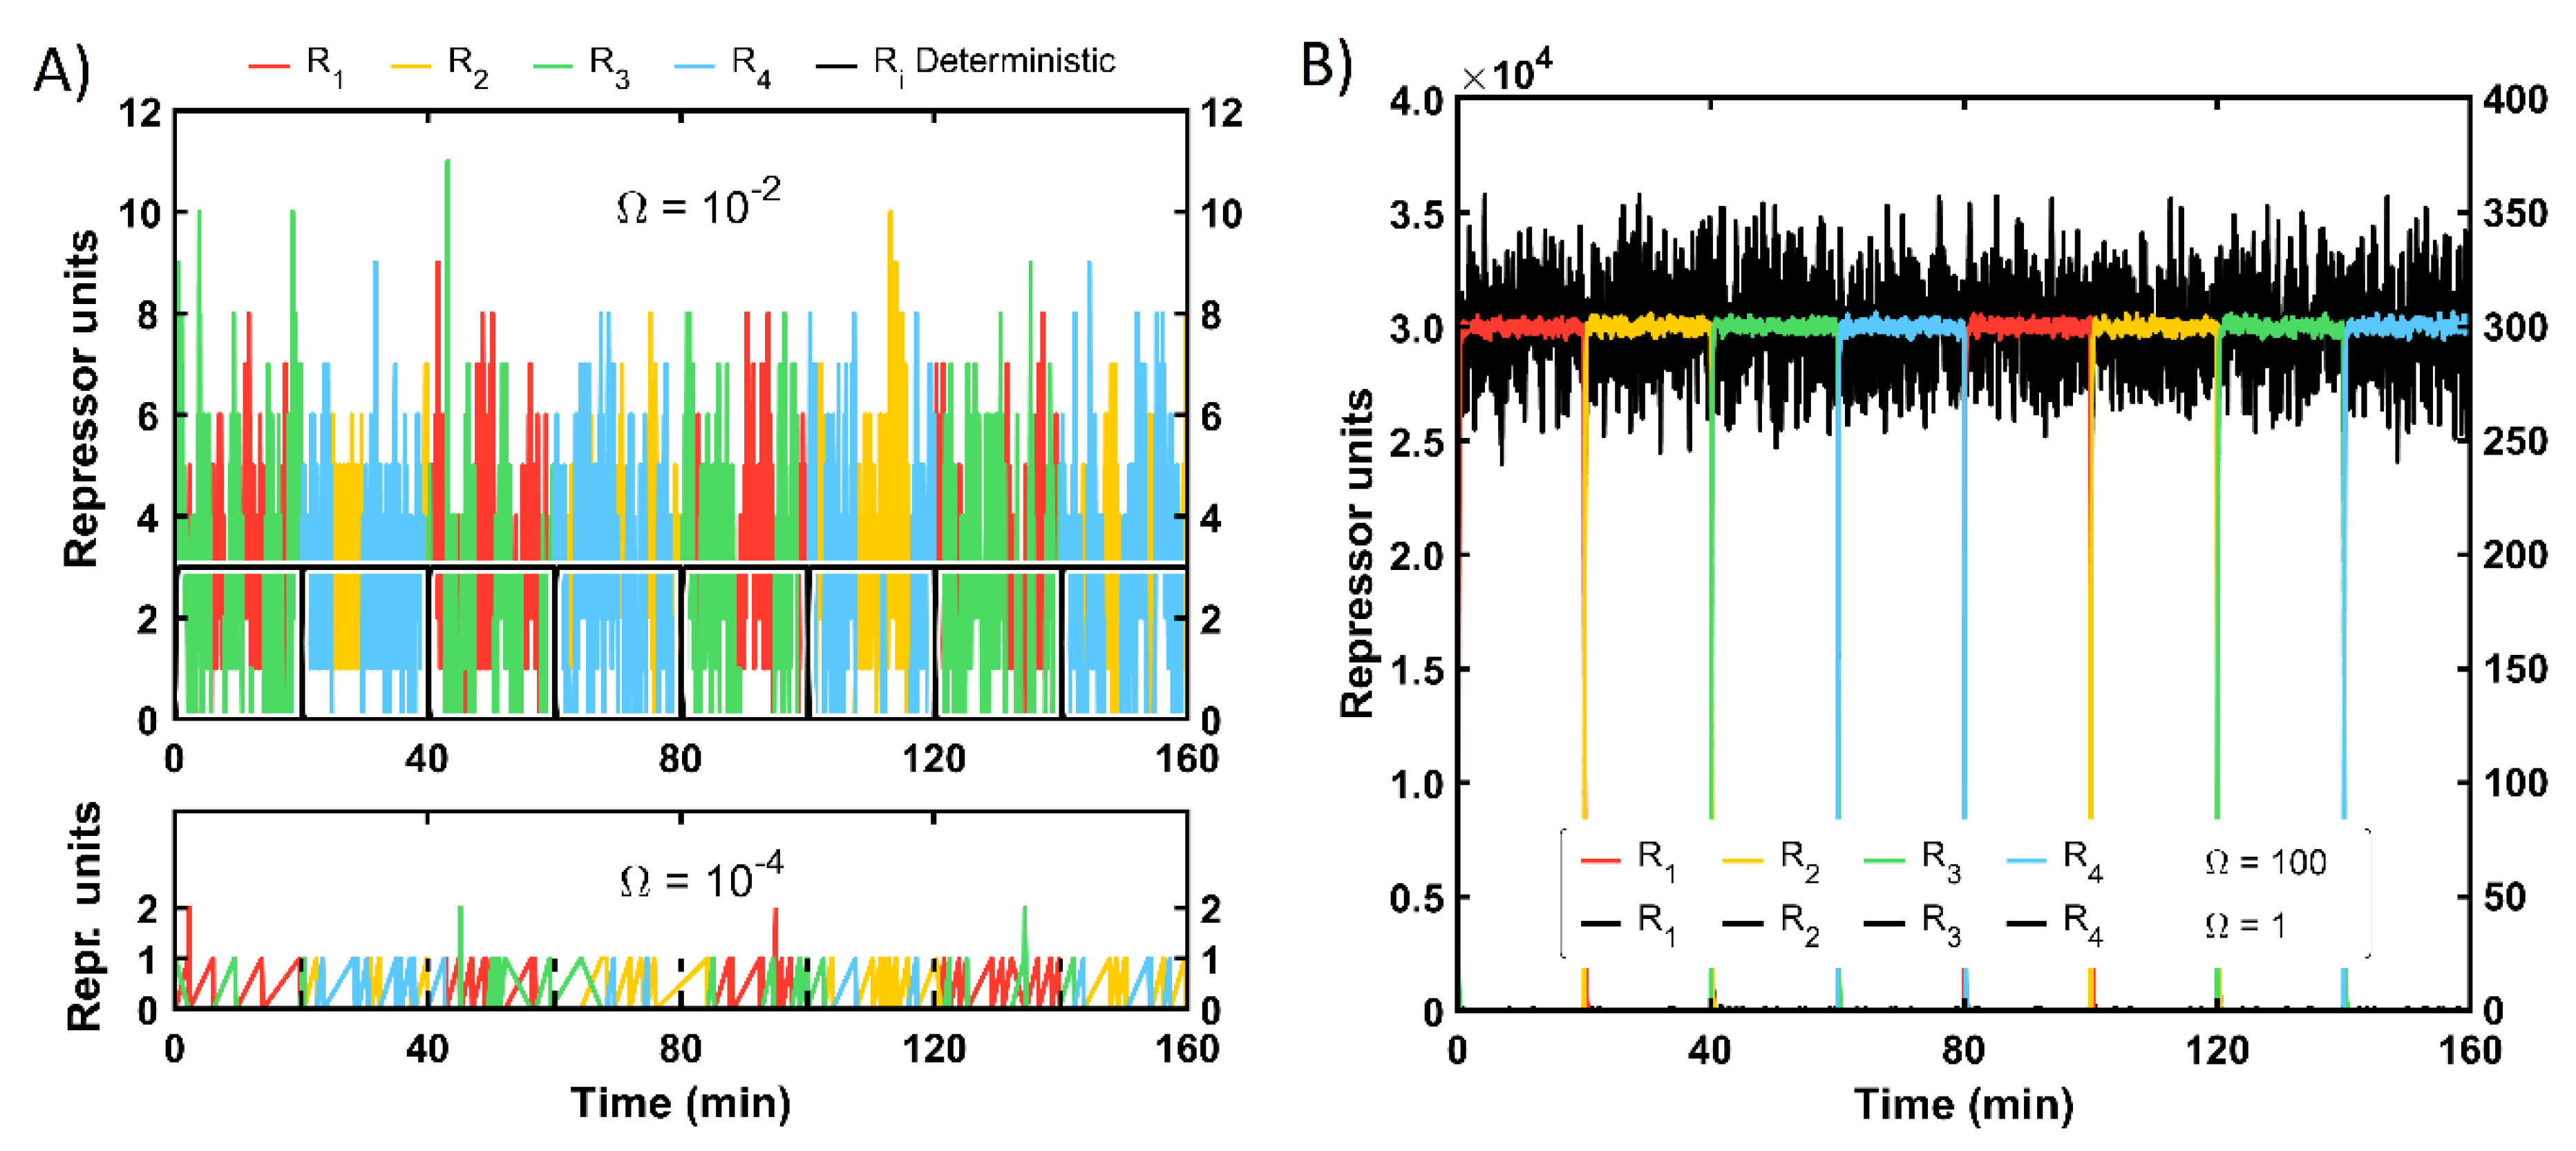
For the stochastic approach, the protein level is not directly given as a continuous magnitude but as a discrete one: the amount of one protein type will be either increased or decreased and only in one unit each time step. In Figure 5, the solution of the FSM master equation for different system sizes Ω is represented. The protein amount for the smallest Ω size (10−4) ranges from zero to two molecules. The expected repressor amount corresponds, similarly to the deterministic simulation, to the proportion of protein production vs. degradation. Yet, in the stochastic framework, this ratio is multiplied by the system size parameter k s y n / k d e g · Ω , which is 0.03 units for this cell-scale. Thus, the maximal value is approximately 67 times that magnitude. The next system size (10−2) displays a lower difference between the expected value (3 units, showed in black in Figure 1A in the top graph) and the maximal output, which reaches up to 11 units. For both sizes, the system is rather noisy since two proteins coexist in significant amounts permanently. Besides, there could be some aberrant protein content for some time steps during the signal shift, e.g., unexpected R2 proteins under signal presence. In Figure 5B, the evolution of the machine for larger scales is plotted. For both values, 1 and 100, the system already has robust behavior, in which only one state is dominant, and the procedure is followed in a sequential way: the FSM can shift to the next state regardless of the noise presence. For clarity, all proteins for Ω equal one are depicted in black, yet they are coherent with the standard state sequence R1-R2-R3-R4. The noise level expressed as the relative difference with respect to the mean value is for most cases below 15%. The system with the highest protein content ( Ω equal to one hundred) resembles the deterministic performance, displaying very reduced noise levels.
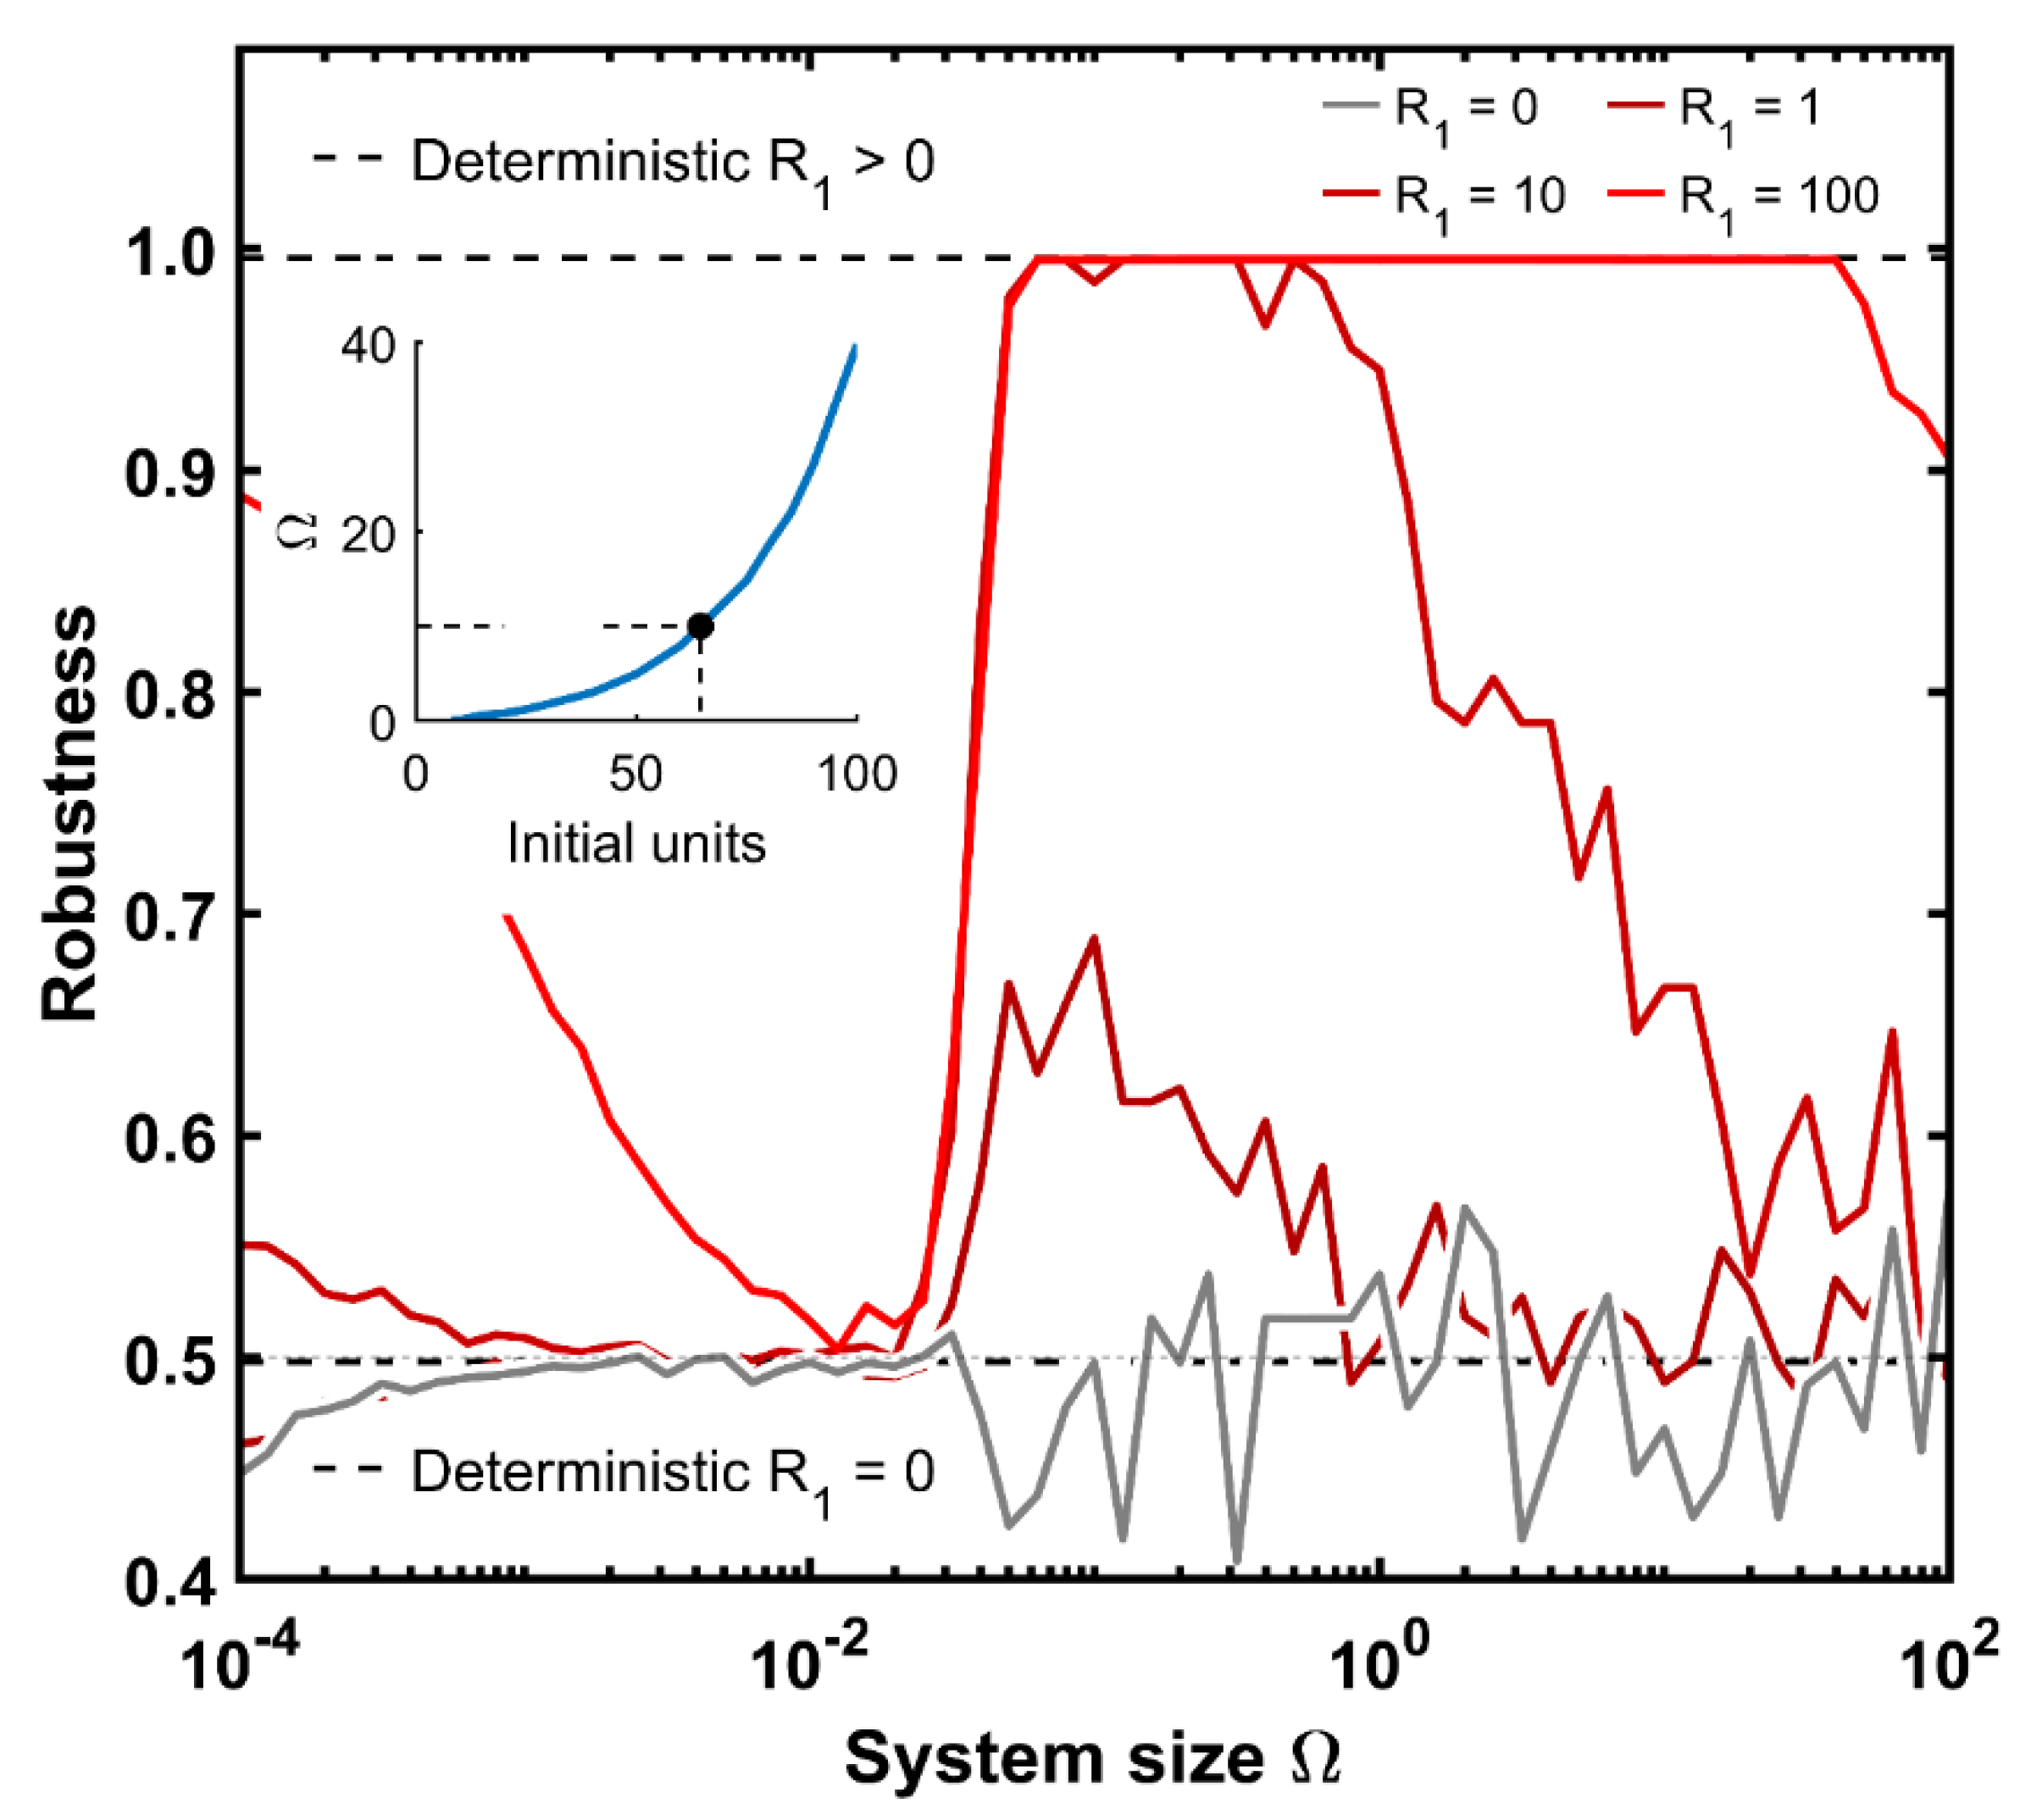
Remarkably, larger systems show a coherent operation starting from the R1 state. However, this is not the case for the smaller scales. Hence, it is interesting to delve deeper into the robustness of the machine as a function of its size and initial state information. For this purpose, we define the robustness of the system as the proportion of correct-type proteins (following the coherent design) for that semi-period with respect to the sum of all proteins for that time period. We calculate the robustness for the first two cycles, i.e., four periods, since the system behavior is the same for the following cycles.
Figure 6 displays the robustness of the system as a function of its size for a given initial protein amount, averaging 100 simulation replicates in each case. When the system departs from zero protein units (gray), the robustness is less than 0.5 for small cellular systems (around 0.45 for the smallest one) because the automaton is so chaotic that for some signal transitions, unexpected proteins can still appear: the signaling effect is too weak to prevent any type of protein from being produced, regardless of the signal correspondence at those time steps. Above sizes of 10−3, the signal effect is already sufficiently strong to at least discriminate between both protein blocks (Figure 5A, top graph). Therefore, the robustness oscillates around 0.5 for the remaining system sizes. Remarkably, the robustness value tends to have a greater variability for larger sizes. This occurs because the system has the same probability to start counting from green-R3 than from the red-R1 protein. This provides a robustness magnitude of either one or zero for each single run.
The next case is that with only a single protein of R1 as the initial condition (darker red color). The machine follows the same behavior as the previous case for Ω values below 10−2. Above this threshold, the FSM can operate with robustness values slightly above 0.5. However, in larger systems, the machine output drops again to 0.5 because the system is too big for the initial information. A similar situation occurs with R1 equal to 10 and 100; robustness falls to 0.5 but in much higher cellular environments. Interestingly, any machine with a sufficiently large number of initial proteins, approximately at least 10 red proteins at the time of onset, reaches full effectiveness around an Ω magnitude of 0.06 units. This cell scale roughly corresponds to 20 repressor molecules as maximal output within our parametrization set.
Moreover, the deterministic robustness has been outlined. Deterministic systems without any initial protein end up at a robustness of 0.5. The exact value is 0.498 due to minor protein units while one states dominates over the other. Similarly, any deterministic initial protein content above zero delivers a fully coherent FSM, with a robustness of 0.996, doubling the previous one as expected.
This value coincides with the maximal coherence of the stochastic simulations. Additionally, the inset plot of Figure 6 illustrates the amount of repressor molecules at the onset of time that allows a maximal system size before the automaton starts to fail at being fully robust. This association seems to follow an exponential function: with a minor increase in the initial amount of proteins, the cell size can be much higher to retain full functionality.
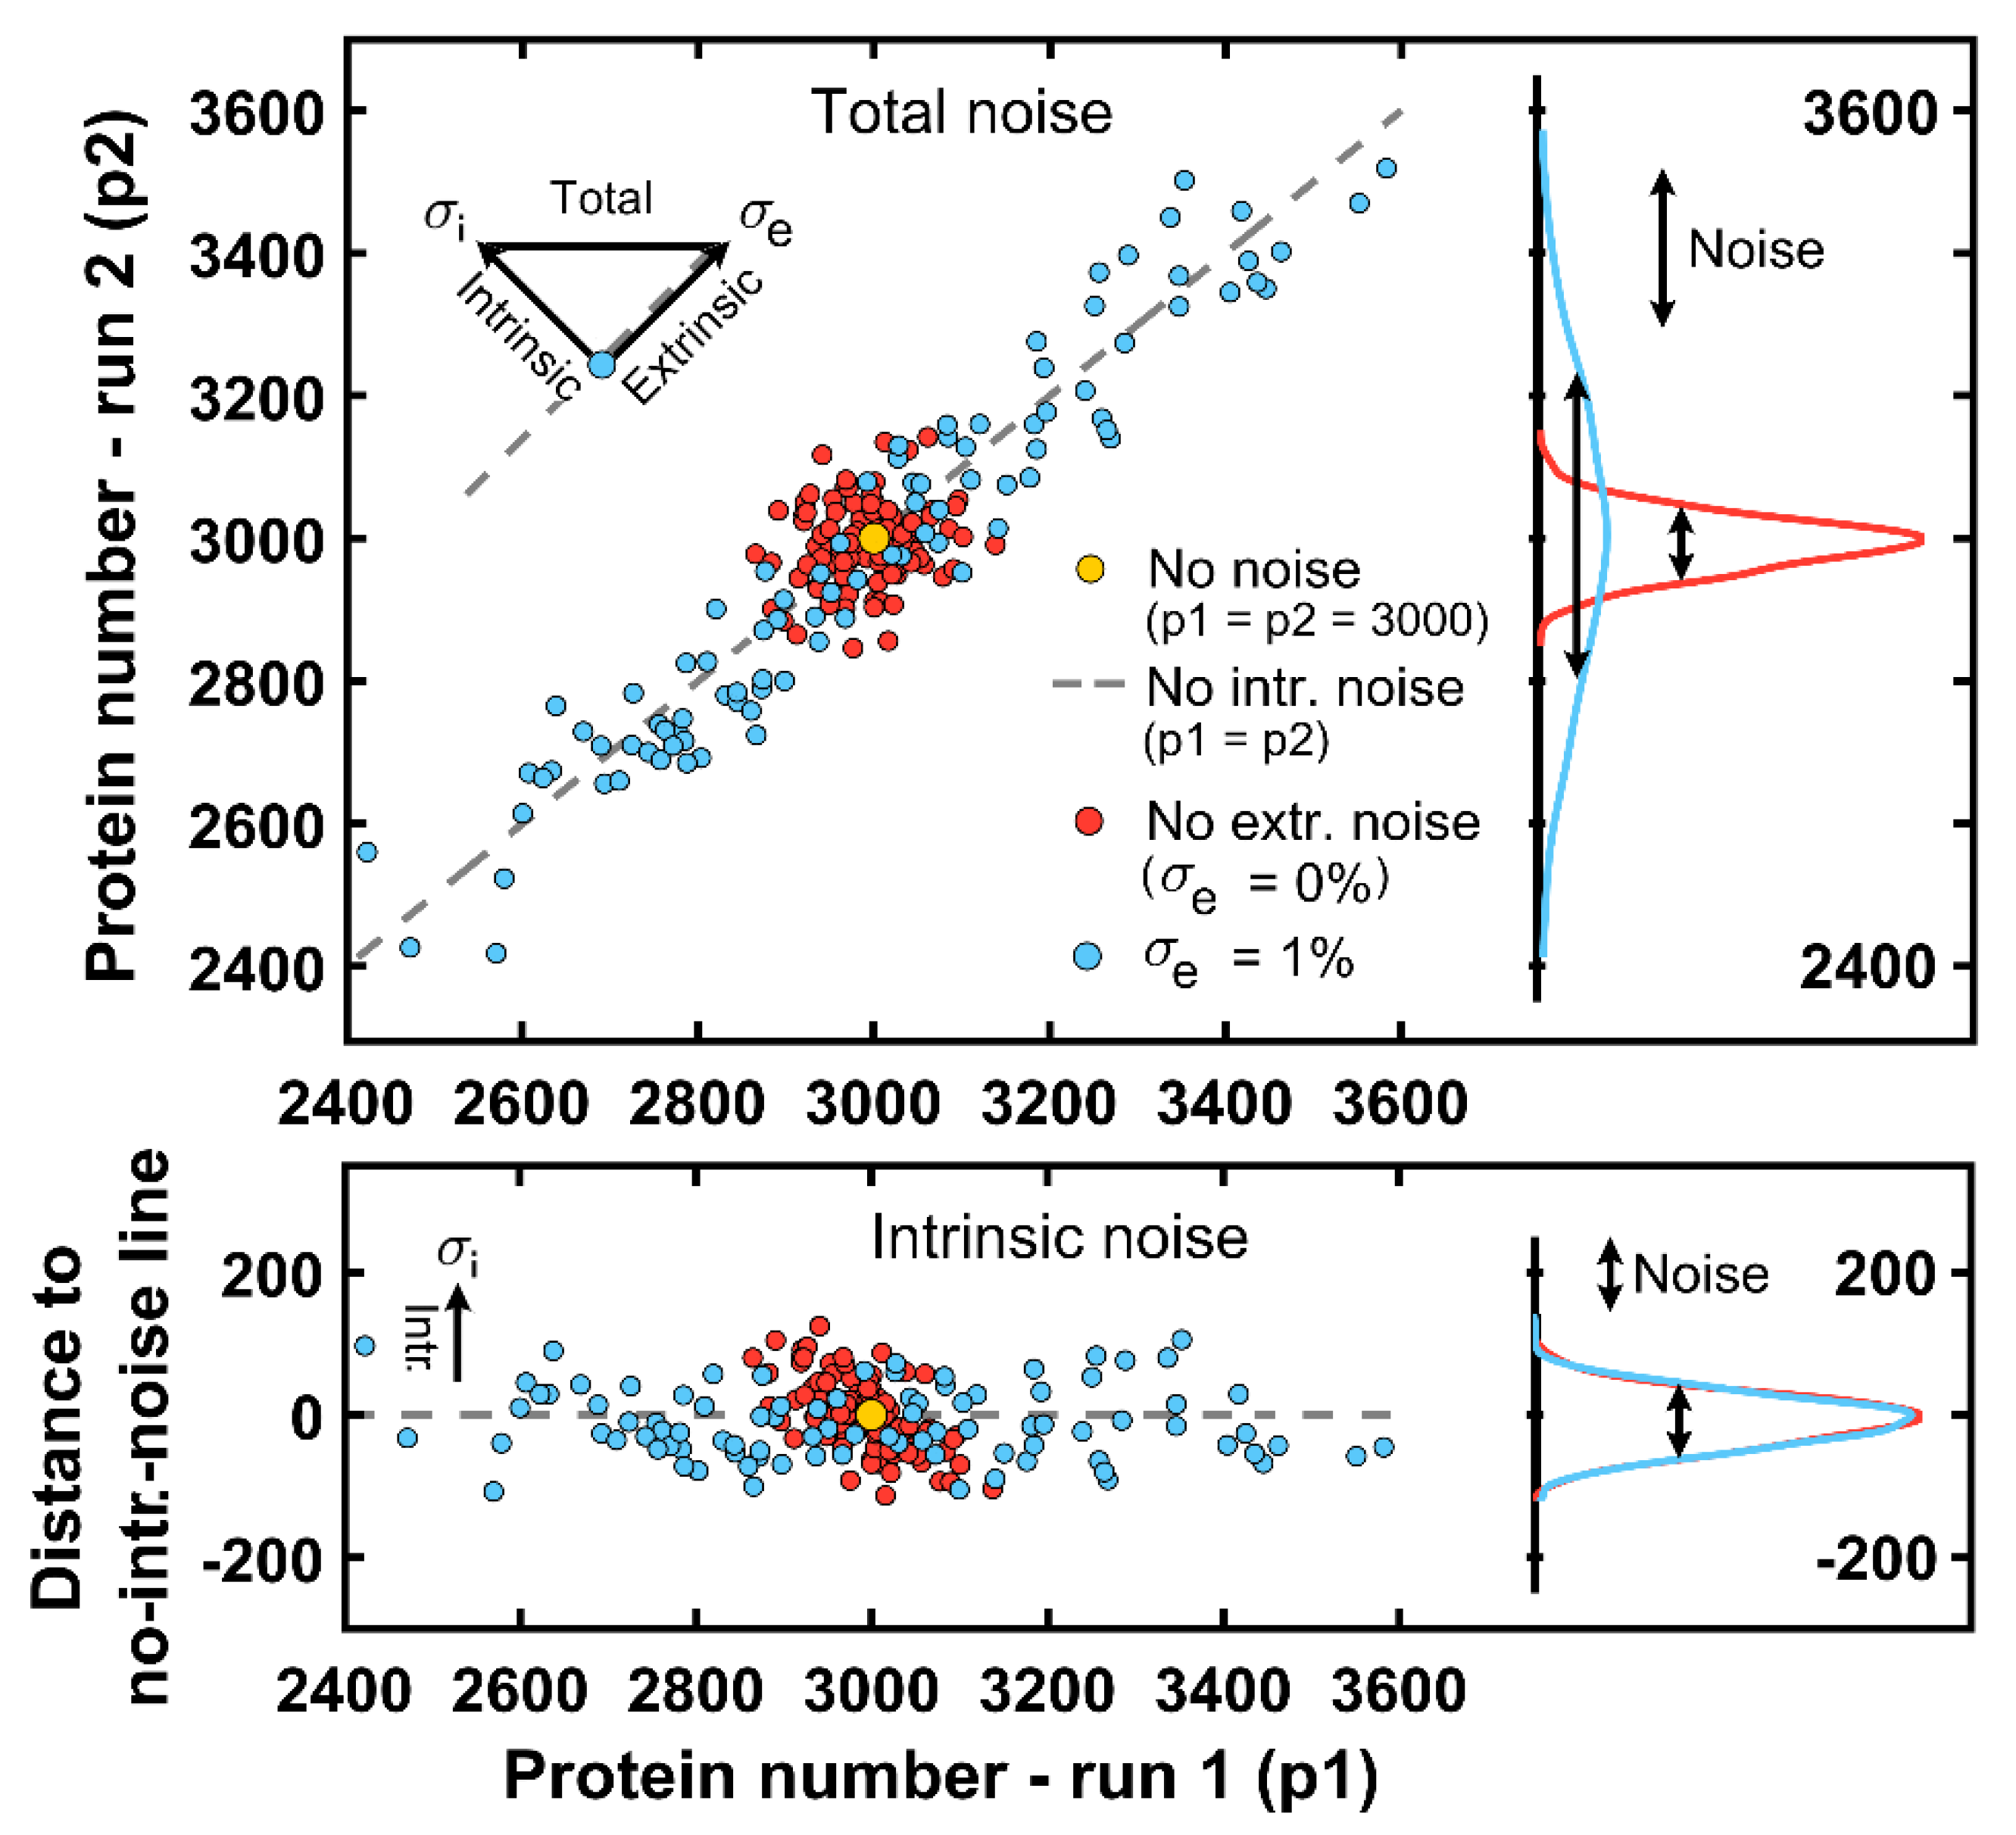
A related feature of the coherence of the device is the noise present in the cellular system. In this regard, intrinsic and extrinsic noises can considerably impact the machine’s performance; therefore, it is critical to assess their magnitude. For the case of a system size Ω of 10 (thousands of R1 proteins per cell), the noise level is already low but still significant (Figure 5B). To test the intrinsic noise of this system size, 100 cells were simulated with two runs for each (Figure 7). For simplicity, the signal was set as constant and equal to S m a x = 300. The R1 initial protein amount was assumed to be 100 since it is sufficient for a coherent automaton, as Figure 6 illustrates.
Intrinsic noise emerges from the inherent nature of living cells: systems with the same parameters can display different results when noise is present. Alternatively, extrinsic noise is an external stochastic process that affects molecular reactions in an equivalent manner. For the FSM, the extrinsic noise can be seen as a factor that promotes maximal protein levels to covary, and thus, it is orthogonal to the intrinsic magnitude (top panel of Figure 7). Indeed, Figure 7 displays two experiments: one without extrinsic noise (red dots) and the other with some extrinsic noise due to a 1% deviation from the mean value of the synthesis-rate parameter k s y n (blue dots).
If one compares both cell groups, the total randomness, seen as a combination of intrinsic and extrinsic noises, is only enlarged due to the latter factor in the blue-cell group, while the intrinsic noise remains equal as the system size does. For the deterministic case without noise, both runs for the same cell (with the same k s y n value) would result in a protein value always equal to k s y n / k d e g · Ω under steady-state conditions (yellow dot) while cells only displaying extrinsic noise would lie on the gray dashed line in Figure 7 corresponding to no-intrinsic-noise cells (each run delivers the same protein amount, p1 = p2). In particular, the intrinsic deviation for most of the cells lies within ±5% of the mean protein amount (bottom panel of Figure 7).
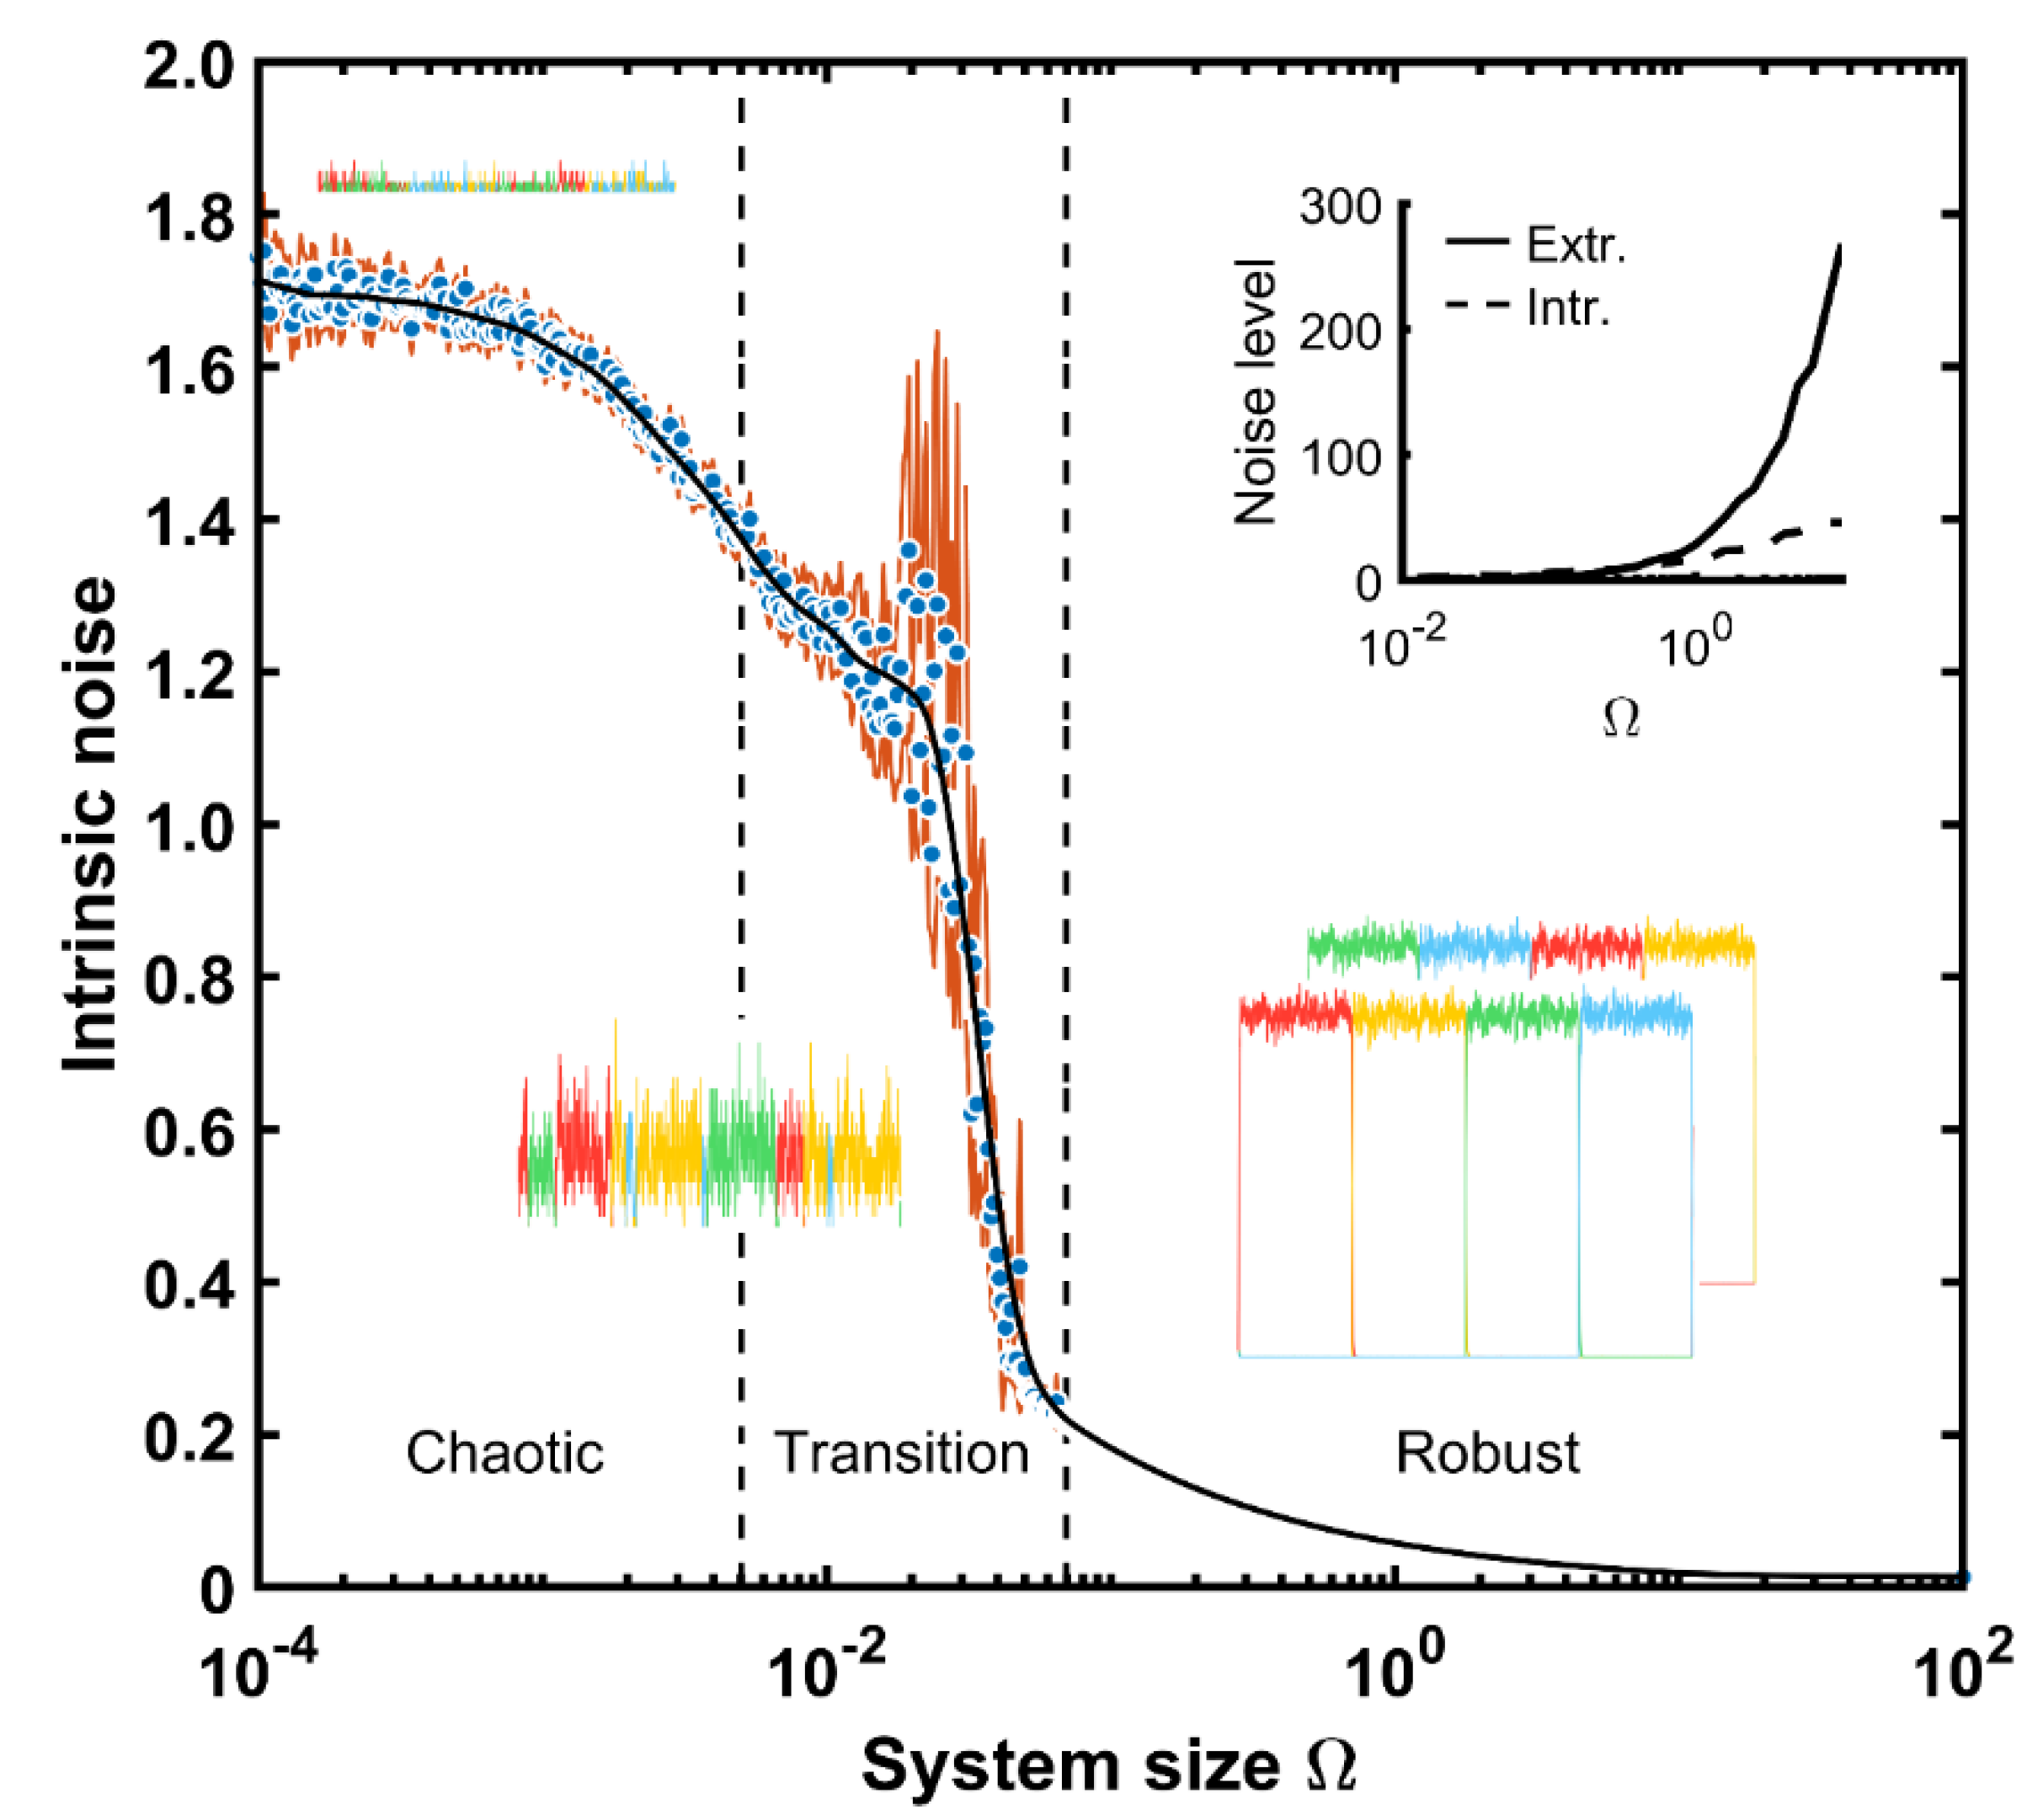
Once we have illustrated both noise types, we will estimate their magnitudes depending on the system size. In Figure 8 the relationship of the intrinsic noise, given as the coefficient of variation for different cellular sizes, is depicted. The intrinsic noise is around 1.7 for the smallest systems and stays almost constant up to Ω values below 10−3. For cells with more proteins, the system noise drops to 1.4 units. Interestingly, the confidence interval is rather narrow. This implies that the system is rather small and therefore, the possible amounts for proteins too (below 10 repressor units as a maximal amount, Figure 5A). However, for Ω magnitudes between 10−2 and 10−1, the system displays a larger solution space where possible protein numbers increase so much that the protein means can be affected by high values, and the mean confidence interval increases. Alternatively, for magnitudes above 10−1, the system is so big that the intrinsic noise given as the coefficient of variation remains low, below 0.2, and the confidence interval amplitude is almost zero. For larger sizes, the automaton works coherently if there is not enough initial information, but the system can start at the wrong state as already described in Figure 6.
In summary, the system displays three different behaviors based upon its size. For very small scales, it operates in an almost random manner, showing up states that might not even be coherent with respect to the signal status. This chaotic performance is gradually transformed into a coherent device as the size increases. Indeed, there is a transition size band for Ω between 0.005 and 0.08 units, in which sustained states can be formed, but not for the whole semi-period. Under these conditions, the machine cannot shift the state in a sequential order. Above 0.1 units, the system displays a very low noise level, acting as a deterministic system (the confidence interval coincides with the mean and thus disappears visually), yet still depending on a sufficient amount of the initial protein content to retain the sequence in the appropriate order. The inset of Figure 8 compares the magnitude between the intrinsic and extrinsic noise levels, assuming an extrinsic amount equal to the one in Figure 7 (1% of k s y n , σ e = 30).
The extrinsic level is lower than the intrinsic one for size values 0.5. Above this threshold, the system is so large that the extrinsic noise increases exponentially, representing almost 90% of the overall system noise for real-cell sizes ( Ω   = 1). It has to be noted that though the intrinsic noise is given in absolute units and increases with the system size (shown in the inset of Figure 8), its coefficient of variation does not. The latter is given in relative units and decreases with larger system sizes as depicted in Figure 8. This happens since in the latter case the noise is divided by its mean and this increases with the system size as shown in Figure 5.

3.3. Spatial Model

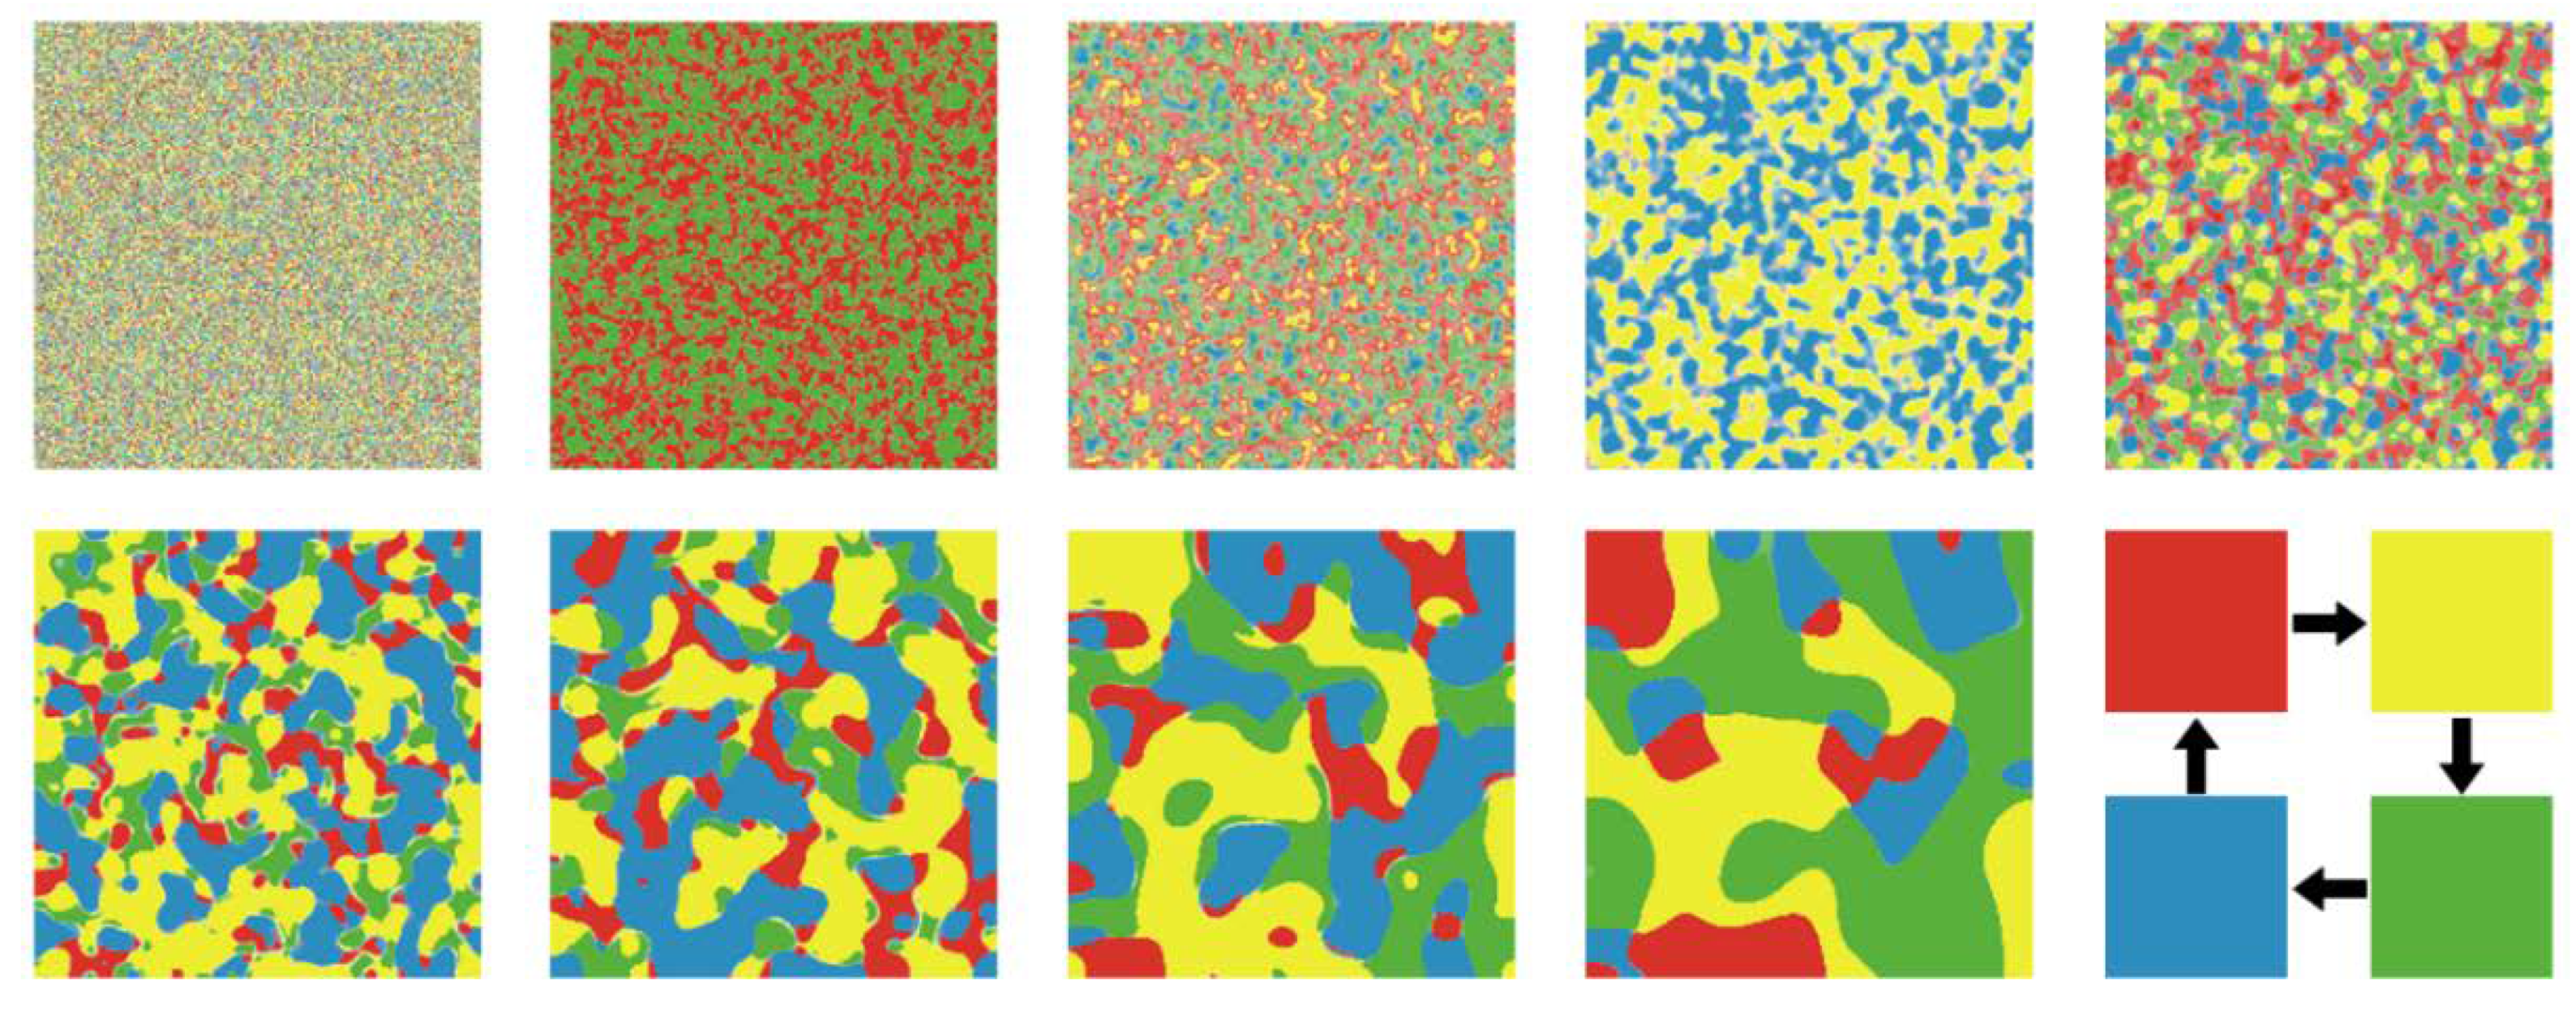
For the cellular automaton formalism, we first studied the system with the same parameters as in the base case of the ODE set and chose a time step of 0.001 min and a diffusion coefficient of 0.01. In Figure 9, different time steps for the CA simulation are shown. The world is composed of cells whose initial concentration of regulatory proteins is obtained from the uniform distribution [0, 2]. The protein with the highest concentration determines the patch color. This is for most cells shown in a pale tone due to similar concentration levels of all proteins in this random initialization. A few time steps after the signal appearance, only red and green cells remain due to the signal activation and repression of each protein block. However, once the signal vanishes, the concentration of red-green R1-R3 repressors is still so high because the signal period is rather long. This contributes to a delay in the manifestation of the other repressors (R2–R4), even in the absence of a signal. Progressively, both protein blocks tend to equalize their concentrations (we have assumed so far the same parametrization for each protein). The cells are decoupled from signaling but follow local state aggrupation. Further, diffusion contributes to the formation of larger clusters in which only one transcriptional factor dominates the others. Diffusion together with the rather long signal period is enough in this simulation to collapse the system so that after some time steps only a unique protein will be present (almost 100 times higher than any other). Thus, the CA of the FSM under the given parametrization set ends up as a single-color world of patches that can coherently shift within states following the signal inputs as required for a proper device design.
Different scenarios can be in silico tested by modifying boundary conditions and the parameter set. The main characteristics that will be checked are the impact of the signal period, the reaction and diffusion rate, and the degradation velocity of the regulatory proteins. We gave some flexibility to the system by opening borders, which permits us to observe more types of dynamics. In this way, the two-dimensional square lattice is equivalent to a torus as the neighborhood of the edge cells continues at the opposite border.
The FSM is a reaction–diffusion system in which both phenomena interact and create emergent patterns at a culture scale. The CA can be found in two basic situations, either the cells react homogeneously to external stimuli as a single reaction unit or local clusters appear. If diffusion rules, i.e., its rate is sufficient to absorb all the produced molecules, these are simply shared among all patches. In this case, mean properties do apply since there are thousands of replicates of the same cell. However, when reaction rules over diffusion, different cell configurations arise. Such figures might not be interesting when a synchronous and overall response of the culture is expected, yet can be useful when one seeks other behaviors, such as morphogenetic structures.
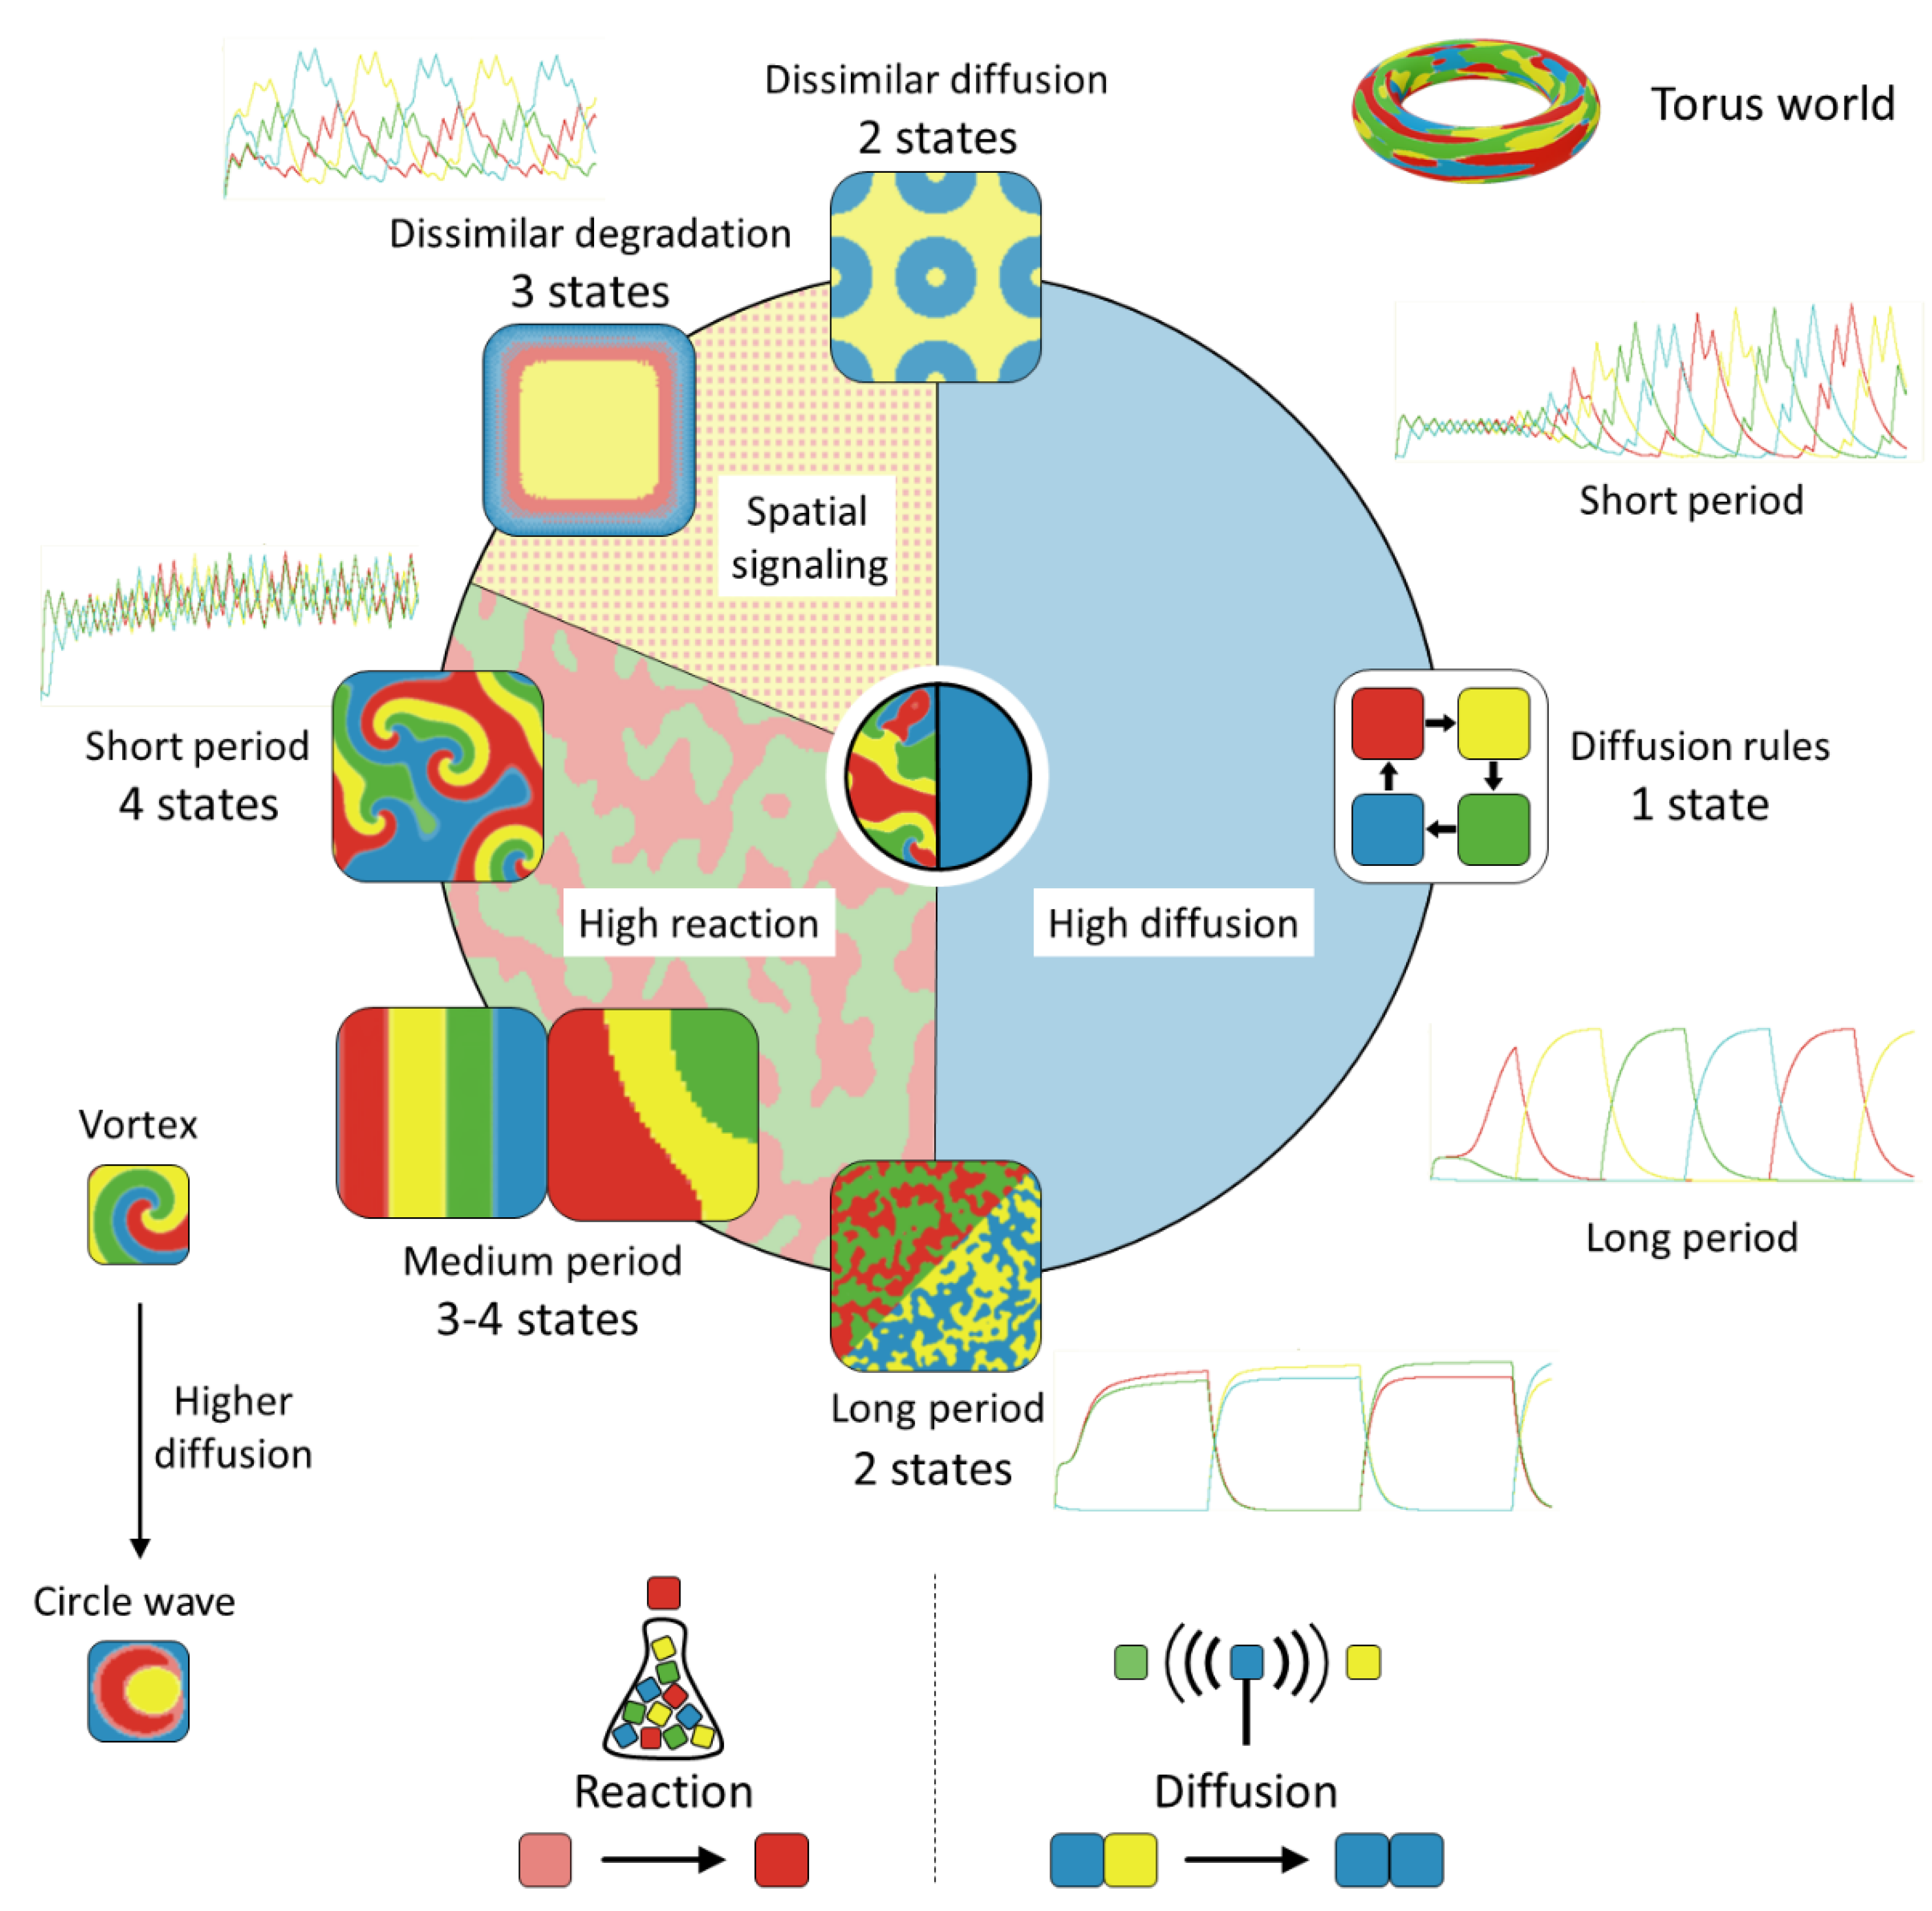
Figure 10 displays the automaton result of different cases after 100,000 steps in a torus world formed by 40,000 cells. Next to some of the simulation results, the time evolution of the four protein concentrations during the first 3000 steps is also displayed for a better illustration of the FSM behavior. The left side of the circle in Figure 10 shows patterns in which reaction governs over diffusion, while the opposite happens on the right side. When diffusion rules, the other parameters are not relevant and the culture FSM shrinks to homogeneous behavior. Depending on the parameter set, the time needed for reaching system synchronization varies. Moreover, the signal period affects the response (right side of Figure 10). Longer periods promote a steeper response and higher maximal protein content than shorter ones under the diffusion regime. The latter transiently create a chaotic behavior with multiple clusters reacting with each other that end up at a sole state for each time step.
Alternatively, when the reaction rate is sufficiently high (left side of Figure 10), the system can retain bi-stable block activity. This implies that no single repressor is capable of reaching a concentration threshold to eliminate its partner protein (R1–R3 and R2–R4), and therefore, two states can coexist (bottom side of Figure 10). Increased degradation rates k d can lead to a single-color state since protein levels are reduced as well as the effective reaction rate. Similarly, if we increase the repressor capacity K R , the automaton might again reach an attractor state where the diffusion phenomenon governs the whole system since the preponderant protein type can then inhibit the production of the rest.
A signal-period increase can promote differentiated attractors. For example, moving bands of same-state cells can develop. Further, if the period signal is rather short, vortices become visible (left side of Figure 10). In each vortex center, the four concentrations are in similar amounts and a rotation pattern emerges, yet the vortex center does not move. Vortices remain as long as external perturbations are not strong enough to terminate them. This can only happen if stronger cell dynamics around the vortex absorb them, or by a sudden increase of reaction or diffusion rates. In the first case, the FSM ends up in two states, while in the latter, a round cluster can arise.
So far, it was assumed that if the external signal is a small molecule interacting with the transcriptional machinery of living cells, the stimulus is present or absent across the collection of functional units, i.e., the signal intensity is equal for all cells of the grid. However, we can also excite the system by applying optical or electrical signals at specific points. In this case, it would be interesting to analyze the propagation capacity of such stimuli within the culture and the pattern that appears due to the spatial arrangement of the signal input. For this purpose, we carried out several experiments in which the signal excites the system in specific cells but not in all of them (top and top-left side of Figure 10). In general, keeping the symmetry of parameters, the spatial reduction of signaling contributes to the disappearance of the R1 and R3 states because they need signal input to actively produce their proteins.

4. Discussion

The described base-case parametrization allows a coherent state shift after recurrent signaling processes. In this regard, parameters forcing a strong repression enhance the coherent behavior. For example, the ratio k s y n / k d can influence the proportion of both proteins of the same block. When this ratio drops below some threshold magnitude, both protein concentrations tend to equalize. On the contrary, when the ratio is very high, only one repressor dominates in that time period over the rest. Additionally, if the three repressor fractions of the ODEs account for one (Equations (1)–(4)), then the synthesis–degradation ratio corresponds to the steady-state protein value before the signal status changes. Moreover, if only K S a is increased, the signal intensity might not be sufficiently strong to activate the block of R1–R3 proteins. In this case, both protein levels are in a very small amount and similarly, R2–R4 are present in a higher quantity. However, if K S r is the parameter to be considerably increased, the system starts to oscillate for low signal values and then reaches a stable state for R1 while the signal intensity is close to the peak value. However, when the signal reaches less than half its amplitude, the system again becomes unstable. Once the signal is over, R2 reaches the dominant state. This R1–R2 dominance is maintained over all remaining cycles. Therefore, the automaton shows a rich variety of attractor states depending on the parameter set. In general, parameter sensitivity depends on the overall set, so specific threshold values are hard to find. In any case, a more rigorous assessment of the parameter sensitivity and bifurcation analysis are beyond the scope of this contribution.
Deterministic simulations properly describe mean system responses; they are especially appropriate when molecules are present in high amounts. However, they cannot capture many phenomena in processes with a limited number of entities. Indeed, living cells are noisy environments with a discrete number of elements as is the case of the transcription and translation processes. Small-scale systems will display a variety of possible behaviors that will not arise in the continuous deterministic framework. For example, the possible effect of the initial information of the system, i.e., the initial protein content, cannot be properly assessed under the first framework. Remarkably, the typical system size of genetic devices in terms of the protein content is in the range of hundreds to thousands of proteins ( Ω = 1–10), which falls in the coherent size range (Figure 8). But even in this case, the initial content will determine the fate of the system, an aspect not covered by the deterministic approach.
Moreover, robustness (Figure 6) and noise (Figure 8) are intimately linked since the latter affects the former. It is not casual that the transition period regarding the system size is the same for both magnitudes: at this scale, the system is large enough to end up with a rather varied number of proteins levels and one-protein domination lengths less than a signal semi-period. However, a system with sufficient size can retain a unique protein state along the corresponding time period. For larger scales, the increase of the maximal protein level is proportional to Ω , which is not the case for smaller sizes due to non-optimal functioning of the device: other proteins might emerge and thus, interfere.
In this regard, larger systems dilute the original information, i.e., the amount of initial proteins of a specific type. Therefore, sufficient information has to be provided to overcome the inherent randomness of larger systems, which might start with the wrong state sequence (right side of Figure 8). Alternatively, systems that are rather small are intrinsically chaotic and do not allow coherent behavior. Therefore, intermediate cell sizes deliver optimal results with respect to robustness when the initial information is limited. In particular, for a typical protein content of 1000 repressor molecules, at least approximately 60 initial protein units will be needed to ensure full functionality.
The cellular automaton provides students with a good scaffold to test and see spatial patterns emerging from interacting cells. Figure 10 summarizes the CA’s three main scenarios: either all four states are possible at a given time step, only a repressor block (2 proteins) or only a homogeneous mono-protein system. As a general rule, diffusion tends to equalize protein concentrations and hence to lead to a robust culture behavior as required. In summary, high reaction rates promote islands of proteins, whereas diffusion works in the opposite direction. In this regard, high degradation rates reduce the repression capacity of proteins: diffusion is not quick enough to reach the nodes of production of other states and only the signal status matters. Therefore, the system ends up in a two-state culture. Alternatively, low degradation levels induce the same phenomenon observed for the deterministic case (Figure 3). The system ends up in a one-state world, but it takes much longer, and non-smooth concentration variations appear following signaling frequency. It is important to highlight that very high reaction rates lead to two-state automata. On the contrary, low reaction and diffusion levels promote four coexisting states. Similarly, short signaling periods foster the same effect since protein concentrations do not reach high values due to recurrent signal shifts, while longer periods lead to blocked protein behavior for the opposite reason.

5. Conclusions

In this work, we studied a genetic finite state machine that was designed in a modular and rational way. The constructed genetic machinery results from combining appropriate biological, engineering, and mathematical efforts. This theoretical support is critical for advancing the development of fine-tuned organisms and related applications. Moreover, this device could be considered a prototypic example of signal bio-counters for future biotechnological industries. Further, we showed how mathematical models can support education by introducing students from different backgrounds to abstraction and mathematical thinking. Indeed, the formal exploration of a system that is phenomenologically familiar to the students, i.e., a synthetic biological device, can engage pupils in learning important concepts such as robustness, noise or reaction–diffusion processes in a visual and direct way. The use of complementary modelling frameworks might flatten the students’ learning curve: when correctly selected, they can unveil the advantages and limitations of each formalism.
One of the most intriguing aspects of mathematics is its universality since unrelated systems often have the same properties and can indeed be mathematically equivalent, as genetic and electronic circuits are. Thus, the proposed scheme can be potentially reproduced in other research areas. We hope that this work is a good example of how modeling can improve the comprehension and design of real systems, while encouraging students to delve deeper into the fascinating world of mathematics.

Supplementary Materials

The code used in the Matlab and Netlogo platforms is available online at https://0-www-mdpi-com.brum.beds.ac.uk/2227-7390/8/8/1362/s1.

Author Contributions

Conceptualization, D.F. and J.F.U.; methodology, D.F. and J.A.C.; software, D.F. and Ó.G.i.O.; validation, D.F., J.A.C. and J.F.U.; writing—original draft preparation, D.F.; writing—review and editing, D.F. with contributions of Ó.G.i.O., J.A.C. and J.F.U.; visualization, D.F. All authors have read and agreed to the published version of the manuscript.

Funding

D.F. was supported by an internal grant from Palacký University Olomouc (no. IGA_PrF_2020_028) and J.A.C. by MEC, grant number MTM2016-75963-P.

Conflicts of Interest

The authors declare no conflict of interest.

References

  1. Khalil, A.S.; Collins, J.J. Synthetic biology: Applications Come of Age. Nat. Rev. Genet. 2010, 11, 367–379. [Google Scholar] [CrossRef] [PubMed]
  2. Jullesson, D.; David, F.; Pfleger, B.; Nielsen, J. Impact of Synthetic Biology and Metabolic Engineering on Industrial Production of Fine Chemicals. Biotechnol. Adv. 2015, 33, 1395–1402. [Google Scholar] [CrossRef] [PubMed]
  3. Bereza-Malcolm, L.T.; Mann, G.; Franks, A.E. Environmental Sensing of Heavy Metals through Whole Cell Microbial Biosensors: A Synthetic Biology Approach. ACS Synth. Biol. 2015, 4, 535–546. [Google Scholar] [CrossRef] [PubMed]
  4. Katz, L.; Chen, Y.Y.; Gonzalez, R.; Peterson, T.C.; Zhao, H.; Baltz, R.H. Synthetic Biology Advances and Applications in the Biotechnology Industry: A Perspective. J. Ind. Microbiol. Biotechnol. 2018, 45, 449–461. [Google Scholar] [CrossRef]
  5. Matheson, S. Engineering a Biological Revolution. Cell 2017, 168, 329–332. [Google Scholar] [CrossRef]
  6. Clarke, L.; Kitney, R. Developing Synthetic Biology for Industrial Biotechnology Applications. Biochem. Soc. Trans. 2020, 48, 113–122. [Google Scholar] [CrossRef] [Green Version]
  7. Huynh, L.; Tagkopoulos, I. Optimal Part and Module Selection for Synthetic Gene Circuit Design Automation. ACS Synth. Biol. 2014, 3, 556–564. [Google Scholar] [CrossRef]
  8. Wang, J.; Tepfenhart, W.M. Formal Methods in Computer Science; Chapman and Hall/CRC: Boca Raton, FL, USA, 2019; ISBN 9781498775328. [Google Scholar]
  9. McDaniel, R.; Weiss, R. Advances in Synthetic Biology: On the Path from Prototypes to Applications. Curr. Opin. Biotechnol. 2005, 16, 476–483. [Google Scholar] [CrossRef]
  10. Andrianantoandro, E.; Basu, S.; Karig, D.K.; Weiss, R. Synthetic Biology: New Engineering Rules for an Emerging Discipline. Mol. Syst. Biol. 2006, 2, 2006.0028. [Google Scholar] [CrossRef] [Green Version]
  11. Tyson, J.J.; Chen, K.C.; Novak, B. Sniffers, Buzzers, Toggles and Blinkers: Dynamics of Regulatory and Signaling Pathways in the Cell. Curr. Opin. Cell Biol. 2003, 15, 221–231. [Google Scholar] [CrossRef]
  12. Wolfram, S. Statistical Mechanics of Cellular Automata. Rev. Mod. Phys. 1983, 55, 601–644. [Google Scholar] [CrossRef]
  13. Von Neumann, J.; Burks, A.W. Theory of Self-Reproducing Automata; University of Illinois Press: Champaign, IL, USA, 1966. [Google Scholar]
  14. Gardner, M. Mathematical Games: The Fantastic Combinations of John Conway’s New Solitaire Game “Life”. Sci. Am. 1970, 223, 120–123. [Google Scholar] [CrossRef]
  15. Goucher, A.P. Universal computation and construction in GoL cellular automata. In Game of Life Cellular Automata; Springer: London, UK, 2010; pp. 505–517. ISBN 9781849962162. [Google Scholar]
  16. Bybee, R.W. What Is STEM Education? Science 2010, 329, 996. [Google Scholar] [CrossRef] [PubMed] [Green Version]
  17. Swaid, S.I. Bringing Computational Thinking to STEM Education. Procedia Manuf. 2015, 3, 3657–3662. [Google Scholar] [CrossRef] [Green Version]
  18. Dai, T.; Cromley, J.G. Changes in Implicit Theories of Ability in Biology and Dropout from Stem Majors: A Latent Growth Curve Approach. Contemp. Educ. Psychol. 2014, 39, 233–247. [Google Scholar] [CrossRef]
  19. Willaert, S.S.; de Graaf, R.; Minderhoud, S. Collaborative Engineering: A Case Study of Concurrent Engineering in a Wider Context. J. Eng. Technol. Manag. 1998, 15, 87–109. [Google Scholar] [CrossRef]
  20. Burbaite, R.; Stuikys, V.; Damasevicius, R. Educational robots as collaborative learning objects for teaching Computer Science. In Proceedings of the ICSSE 2013—IEEE International Conference on System Science and Engineering, Budapest, Hungary, 4–6 July 2013; pp. 211–216. [Google Scholar]
  21. Damaševičius, R.; Narbutaite, L.; Plauska, I.; Blažauskas, T. Advances in the Use of Educational Robots in Project-Based Teaching. TEM J. 2017, 6, 342–348. [Google Scholar] [CrossRef]
  22. Machado, D.; Costa, R.S.; Rocha, M.; Ferreira, E.C.; Tidor, B.; Rocha, I. Modeling Formalisms in Systems Biology. AMB Express 2011, 1, 1–14. [Google Scholar] [CrossRef] [Green Version]
  23. Rojo Robas, V.; Madariaga, J.M.; Villarroel, J.D. Secondary Education Students’ Beliefs about Mathematics and Their Repercussions on Motivation. Mathematics 2020, 8, 368. [Google Scholar] [CrossRef] [Green Version]
  24. Schlitt, T.; Brazma, A. Current Approaches to Gene Regulatory Network Modelling. BMC Bioinform. 2007, 8, 1–22. [Google Scholar] [CrossRef] [Green Version]
  25. Karlebach, G.; Shamir, R. Modelling and Analysis of Gene Regulatory Networks. Nat. Rev. Mol. Cell Biol. 2008, 9, 770–780. [Google Scholar] [CrossRef] [PubMed]
  26. Casini, A.; Storch, M.; Baldwin, G.S.; Ellis, T. Bricks and Blueprints: Methods and Standards for DNA Assembly. Nat. Rev. Mol. Cell Biol. 2015, 16, 568–576. [Google Scholar] [CrossRef] [PubMed] [Green Version]
  27. Appleton, E.; Madsen, C.; Roehner, N.; Densmore, D. Design Automation in Synthetic Biology. Cold Spring Harb. Perspect. Biol. 2017, 9, a023978. [Google Scholar] [CrossRef] [PubMed] [Green Version]
  28. Selberg, J.; Gomez, M.; Rolandi, M. The Potential for Convergence between Synthetic Biology and Bioelectronics. Cell Syst. 2018, 7, 231–244. [Google Scholar] [CrossRef] [PubMed] [Green Version]
  29. Britton, N.F.; Bulai, I.M.; Saussure, S.; Holst, N.; Venturino, E. Can Aphids Be Controlled by Fungus? A Mathematical Model. Appl. Math. Nonlinear Sci. 2019, 4, 79–92. [Google Scholar] [CrossRef] [Green Version]
  30. Rojas, C.; Belmonte-Beitia, J. Optimal Control Problems for Differential Equations Applied to Tumor Growth: State of the Art I. Appl. Math. Nonlinear Sci. 2018, 3, 375–402. [Google Scholar] [CrossRef] [Green Version]
  31. Tsimring, L.S. Noise in Biology. Reports Prog. Phys. 2014, 77, 026601. [Google Scholar] [CrossRef]
  32. Székely, T.; Burrage, K. Stochastic Simulation in Systems Biology. Comput. Struct. Biotechnol. J. 2014, 12, 14–25. [Google Scholar] [CrossRef]
  33. Bessonov, N.; Bocharov, G.; Meyerhans, A.; Popov, V.; Volpert, V. Nonlocal Reaction–Diffusion Model of Viral Evolution: Emergence of Virus Strains. Mathematics 2020, 8, 117. [Google Scholar] [CrossRef] [Green Version]
  34. Mealy, G.H. A Method for Synthesizing Sequential Circuits. Bell Syst. Tech. J. 1955, 34, 1045–1079. [Google Scholar] [CrossRef]
  35. Marchisio, M.A. Parts & Pools: A Framework for Modular Design of Synthetic Gene Circuits. Front. Bioeng. Biotechnol. 2014, 2, 42. [Google Scholar] [CrossRef] [PubMed] [Green Version]
  36. Stefan, M.I.; Le Novère, N. Cooperative Binding. PLoS ONE Comput. Biol. 2013, 9, e1003106. [Google Scholar] [CrossRef] [PubMed] [Green Version]
  37. Elowitz, M.B.; Levine, A.J.; Siggia, E.D.; Swain, P.S. Stochastic Gene Expression in a Single Cell. Science 2002, 297, 1183–1186. [Google Scholar] [CrossRef] [Green Version]
  38. Gillespie, D.T. Exact stochastic simulation of coupled chemical reactions. J. Phys. Chem. 1977, 81, 2340–2361. [Google Scholar] [CrossRef]
  39. Gillespie, D.T. A General Method for Numerically Simulating the Stochastic Time Evolution of Coupled Chemical Reactions. J. Comput. Phys. 1976, 22, 403–434. [Google Scholar] [CrossRef]
  40. Gillespie, D.T. Stochastic Simulation of Chemical Kinetics. Annu. Rev. Phys. Chem. 2007, 58, 35–55. [Google Scholar] [CrossRef]
  41. Railsback, S.F.; Lytinen, S.L.; Jackson, S.K. Agent-based Simulation Platforms: Review and Development Recommendations. Simulation 2006, 82, 609–623. [Google Scholar] [CrossRef]
  42. Turing, A.M. The Chemical Basis of Morphogenesis. Bull. Math. Biol. 1990, 52, 153–197. [Google Scholar] [CrossRef]
  43. Tisue, S.; Wilensky, U. Netlogo: A Simple Environment for Modeling Complexity. Conf. Complex Syst. 2004, 21, 16–21. [Google Scholar] [CrossRef]
  44. Wilensky, U.; Rand, W. An Introduction to Agent-Based Modeling Modeling Natural, Social, and Engineered Complex Systems with NetLogo; Mit Press: Cambridge, MA, USA, 2015; ISBN 9780262731898. [Google Scholar]
Figure 1. (A) Mathematics: scheme of the four-state machine showing the state dependencies and signals. (B) Engineering: diagram of the corresponding electronic circuit composed of four 3-input NOR gates. (C) Biology: genetic design of a 3-input NOR gate based on a hybrid promoter regulated by three different molecules (e.g., R4 is produced when R1, R2, and the signal S are absent).
Mathematics 08 01362 g001
Figure 2. Time evolution of the concentration of each repressor protein Rn (corresponding colors displayed) for a coherent design of a four state machine. The sinusoidal input signal (the first half period is a sine function, the second is zero) of an overall period of 40 min is depicted in black.
Mathematics 08 01362 g002
Figure 3. (A) Time evolution of the concentration of each repressor protein Rn for the same parameter set in the base simulation except for k d e g = 0.2   m i n 1 and a much longer simulation period. (B) Same simulation as in (A), but the repressor-concentration axis is in logarithmic scale and the selected time scale is focused on one machine cycle. The input signal is depicted in black and its magnitude has been rescaled for clarity.
Mathematics 08 01362 g003
Figure 4. Time evolution of the concentration of each repressor protein Rn for the same parameter set as the base simulation except for K S a = 10 ,   K S r = 165 . Signal depicted in black.
Mathematics 08 01362 g004
Figure 5. Time evolution of the amount of each repressor protein Rn for different values of the system size Ω following the master equation approach. (A) Top graph for Ω = 10 2 (deterministic solution is plotted in black), bottom graph for Ω = 10 2 . (B) Similarly, the system evolution with Ω = 1 (right axis, all states in black) and Ω = 100 (left axis, regular colors) is depicted.
Mathematics 08 01362 g005
Figure 6. The robustness of the FSM is depicted as a function of the system size and for different R1 initial protein levels while the others are absent. The robustness of the deterministic system for R1 equal to or greater than zero is also shown. The inset plot displays the relationship between the minimal amount of repressor units at the beginning of the experiment for a coherent operation of the FSM with respect to the maximal system size. A typical value of the protein content for a living cell is highlighted.
Mathematics 08 01362 g006
Figure 7. Effect of intrinsic and extrinsic noises in the protein amount of R1 under steady-state conditions with a signal presence for Ω equal to 10. Two groups of 100 cells each were simulated with 2 runs per cell with a mean value of k s y n / k d e g · Ω = 3000 in both cases. In particular, a cellular group without extrinsic noise (red dots) and another with σ e = 30 (blue dots, 1% of the mean value) were simulated. The bottom panel depicts the intrinsic component σ i of the total noise. The intrinsic noise is given by the difference in protein number with respect to the gray line, i.e., the no-intrinsic-noise line. The probability density function of the total (top panel) and the intrinsic (bottom panel) noises is shown on the right side.
Mathematics 08 01362 g007
Figure 8. Intrinsic noise is given as the coefficient of variation based on the system size. Mean (blue dots) of 100 replicates, smoothed mean (black line), and the 95% confidence interval (red line) thereof are plotted. For each performance interval, a characteristic time evolution plot is also depicted. The inset plot shows the extrinsic (1% of k s y n ) and intrinsic noise levels for different system sizes as the standard deviation under the same conditions, as explained in Figure 7.
Mathematics 08 01362 g008
Figure 9. Cellular automaton of the culture-scale FSM within a square world with closed borders starting from random values for all the regulatory proteins with Δ t = 0.001 and D R = 0.01 for all species. Nine different time steps of a base-case simulation are shown before the system reaches full synchronization (time sequence from left to right).
Mathematics 08 01362 g009
Figure 10. Scheme of the main attractors that can be gathered after 100,000 time steps by tuning the process characteristics of the torus CA through its parameters. When reaction rules, signaling can be tested as a spatially homogeneous property or as grid. The time evolution of each protein concentration during the first 3000 steps is also included for some assessed cases, including those when diffusion rules for long and also short signal periods. The number of dominant states is also indicated for each case.
Mathematics 08 01362 g010

