Article

A Self-Care Prediction Model for Children with Disability Based on Genetic Algorithm and Extreme Gradient Boosting

1
Department of Industrial and Systems Engineering, Dongguk University, Seoul 04620, Korea
2
Industrial Artificial Intelligence (AI) Research Center, Nano Information Technology Academy, Dongguk University, Seoul 04626, Korea
3
School of Business & Economics, Universiti Brunei Darussalam, Gadong BE1410, Brunei
4
Department of Environmental Engineering, Faculty of Engineering and Science, Curtin University, Miri 98009, Malaysia
5
Informatika, Universitas Islam Negeri Sunan Kalijaga, Yogyakarta 55281, Indonesia
*
Author to whom correspondence should be addressed.
Submission received: 21 August 2020 / Revised: 14 September 2020 / Accepted: 14 September 2020 / Published: 15 September 2020

Abstract

:
Detecting self-care problems is one of important and challenging issues for occupational therapists, since it requires a complex and time-consuming process. Machine learning algorithms have been recently applied to overcome this issue. In this study, we propose a self-care prediction model called GA-XGBoost, which combines genetic algorithms (GAs) with extreme gradient boosting (XGBoost) for predicting self-care problems of children with disability. Selecting the feature subset affects the model performance; thus, we utilize GA to optimize finding the optimum feature subsets toward improving the model’s performance. To validate the effectiveness of GA-XGBoost, we present six experiments: comparing GA-XGBoost with other machine learning models and previous study results, a statistical significant test, impact analysis of feature selection and comparison with other feature selection methods, and sensitivity analysis of GA parameters. During the experiments, we use accuracy, precision, recall, and f1-score to measure the performance of the prediction models. The results show that GA-XGBoost obtains better performance than other prediction models and the previous study results. In addition, we design and develop a web-based self-care prediction to help therapist diagnose the self-care problems of children with disabilities. Therefore, appropriate treatment/therapy could be performed for each child to improve their therapeutic outcome.

1. Introduction

Children with motor and physical disabilities have issues with daily living, and self-care as the main daily need more consideration for these children. Since self-care classification is a complex and time-consuming process, it has become a major and challenging issue, especially when there is a shortage of expert occupational therapists [1]. However, decision tools could be used to support therapist in diagnosing and classifying the self-care problems so that the appropriate treatment could be performed for each child [2]. The World Health Organization (WHO) has created a conceptual framework called ICF-CY, which stands for international classification of functioning, disability, and health for children and youth (ICF-CY). This framework has been used as a standardized guideline to classify self-care problems [3]. Several previous studies have utilized machine learning algorithms, such as the artificial neural network (ANN) [4], k-nearest neighbor (KNN) [5], naïve Bayes (NB) [6], extreme gradient boosting (XGBoost) [7], fuzzy neural networks (FNN) [8], deep neural networks (DNN) [9], and hybrid autoencoder [10] to help occupational therapists improve the classification accuracy and reducing the time as well as the cost of self-care classification [11].
Extreme gradient boosting (XGBoost) is supervised machine learning algorithm based on the improvement of gradient boosting trees that can prevent overfitting [12]. Previous researchers have reported the advantage of XGBoost as classification model for predicting hepatitis B virus infection [13], gestational diabetes mellitus of early pregnant women [14], future blood glucose level of type 1 diabetes (T1D) patients [15], coronary artery calcium score (CACS) [16], and heart disease prediction [17]. However, in the machine learning research, the performance of the classification model may be influenced by unrelated attributes or features [18,19]. Feature selection is used to reduce the dimensionality of data [20,21] and in medical diagnosis, is used to identify most significant features related to disease [22,23]. Genetic algorithm (GA) is a feature selection method that has been used to find the best feature subsets [24,25] and shown significant advantage for improving the performance of emotional stress state detection [26], severe chronic disorders of consciousness prediction [27], children’s activities regarding recognition and classification [28], gene encoder [29], hepatitis prediction [30], and coronavirus disease (COVID-19) patient detection [31]. A previous study revealed that a combination of GA and XGBoost has improved the model performance [32]. However, to the best of our knowledge, none of the previous studies have combined GA and XGBoost together to improve the performance of the model, especially for the case of self-care classification. In addition, the absence of model evaluation based on statistical tests as well as practical application of self-care predication are the major limitations of previous works. As suggested by Demšar [33], a statistical significance test can be utilized to prove the significance of the proposed model as compared to other classification models. Furthermore, previous studies have also reported the effectiveness and usefulness of the practical application of prediction model to identify risks and assist the decision-making for pediatric readmission prediction [34], preventive medicine [35], violent behavior prediction [36], and trauma therapy [37].
Therefore, the present study proposes GA-XGBoost to improve the performance of the self-care prediction model. To our best knowledge, this is the first time GA and XGBoost have been applied to improve self-care prediction accuracy. In addition, we validate our results by performing two-step statistical significance test to confirm the significant performance differences between our proposed model and other models used in the study. Furthermore, we also design and develop the prototype of web-based self-care prediction to assist therapists in diagnosing the self-care problems of children with disabilities. Thus, it is expected that an appropriate treatment/therapy could be performed for each child and can improve their therapeutic outcomes. The contributions of our study can be summarized as follows: (i) we propose a combined method of GA and XGBoost for self-care prediction, which has never been done before; (ii) we improve the performance of the proposed model by adjusting the population size of GA; (iii) we conduct extensive comparative experiments on the proposed model with other prediction models and previous study results; (iv) we perform a two-step statistical significance test to verify the performance of proposed model; (v) we provide the impact analysis of feature selection method with or without GA as well as other feature selection methods toward model’s accuracy performance; and (vi) finally, we show the practicability of our proposed model by designing and developing the web-based self-care prediction model. In addition, we publicly share the source code of our program so that it might be useful for decision makers and practitioners as practical guidelines on developing and implementing self-care prediction models for real application.
The structure of this study is organized as follows: Section 2 contains the literature review. In Section 3, we present the proposed self-care prediction model with detailed explanation of datasets, methodologies, and performance evaluations used in the study. Section 4 presents and discusses the experimental results, covering the performance evaluation, the impact analyses of feature selections on the model’s performance, and the comparison of the proposed model with previous works. We present the applicability of our self-care prediction in Section 5. The concluding remarks and future study avenues are presented in Section 6. Finally, the list of acronyms and/or abbreviations used in the study is summarized in Appendix A (see Table A1).

2. Literature Review

This section discusses previously developed machine learning models for self-care prediction, with consideration of XGBoost and GA for health-related datasets.

2.1. Self-Care Prediction Based on ICF-CY Dataset

Machine learning algorithms (MLAs) have been recently developed to diagnose children with disabilities according to the standard international classification of functioning, disability, and health: children and youth version (ICF-CY) dataset. SCADI (self-care activities based on ICF-CY) is the only publicly available dataset that complies with ICF-CY standard and has been utilized by researchers to build the self-care prediction model. Zarchi et al. (2018) provided the original SCADI dataset and showed the possible expert systems for self-care prediction [4]. They applied an artificial neural network (ANN) to classify the children and C4.5 decision tree algorithm to extract the related rules related with self-care problems. Using 10-fold cross-validation (10-fold CV) for evaluation, the ANN achieved an accuracy of up to 83.1%. Islam et al. (2018) proposed a combination of principal component analysis (PCA) and k-nearest neighbor (KNN) to reduce the size of original features and detect multi-class self-care problems [5]. Based on 5-fold CV experimental results, the KNN was the best performer, achieving an accuracy of 84.29%. Liu et al. (2019) proposed a feature selection method called information gain regression curve feature selection (IGRCFS) [6]. The IGRCFS was applied to the SCADI dataset to obtain the optimal features. The experimental results from 10-fold CV revealed that the combination of IGRCFS and naïve Bayes (NB) achieved the highest accuracy of 78.32%. Le and Baik (2019) aimed to improve the diagnosis performance of self-care prediction [7]. To achieve this, the authors used Synthetic Minority Over Sampling Technique (SMOTE) to balance the dataset. Based on their 10-fold CV experiment results, the proposed model, e.g., extreme gradient boosting (XGBoost) achieved an accuracy of 85.4%. The work of Souza et al. (2019) treated the original SCADI dataset differently [8]. They converted the original SCADI dataset into a binary classification (binary-class) problem to identify the children who were diagnosed with the presence (positive class) or absence (negative class) of self-care problems. Fuzzy neural networks (FNN) were reported as the best classifier, providing 85.11% test accuracy on the binary class of SCADI dataset. Most recently, Akyol (2020) evaluated the performance of deep neural networks (DNN) and extreme learning machines (ELM) on the multi-class SCADI dataset [9]. The study used the hold-out method to divide the data into 60% and 40% for training and testing data, respectively. The result showed that the maximum accuracy was achieved by DNN and ELM at 97.45% and 88.88%, respectively. Furthermore, a hybrid autoencoder for classifying the self-care problem based on the combination of autoencoders and deep neural networks (DNN) was proposed by Putatunda (2020) [10]. The proposed model was tested using the 10-fold CV, achieving average accuracy by up to 84.29% and 91.43% for multi-and binary-class datasets, respectively.

2.2. Extreme Gradient Boosting (XGBoost) and Genetic Algorithms (GA)

Extreme gradient boosting (XGBoost) is a supervised machine learning model based on an improved gradient boosting decision trees and can be used for regression and classification problems [12]. Previous studies have utilized XGBoost and shown significant results for predicting hepatitis B virus infection, gestational diabetes mellitus of early pregnant women, future blood glucose level of T1D patients, and coronary artery calcium score (CACS). A hepatitis B virus infection prediction based on XGBoost and Borderline-Synthetic minority oversampling technique (Borderline-SMOTE) was developed by Wang et al. (2019) to identify high-risk populations in China [13]. The result revealed that their model performed better than other models, achieving an area under the receiver operating characteristic curves (AUC) of 0.782. Liu et al. (2020) employed a XGBoost-based model for predicting the status of gestational diabetes mellitus (GDM) among Chinese pregnant women that were registered before the 15th week of pregnancy in Tianjin, China [14]. The hold-out method was adopted to divide dataset into 70%, and 30% for training and testing data, respectively. The result showed that XGBoost outperformed logistic regression by achieving an accuracy of 75.7%. Alfian et al. (2020) developed a model based on XGBoost to predict the future value of blood glucose for T1D patients [15]. Based on 30- and 60-min prediction horizon (PH) results, the XGBoost showed its superiority by achieving average of root mean square error (RMSE) of 23.219 mg/dL and 35.800 mg/dL for PH-30 and-60 min, respectively. Finally, Lee et al. (2020) assessed several machine learning models including XGBoost to predict the CACS from a healthy population [16]. With 5-fold cross-validation, the XGBoost was the best model as compared to other models by achieving AUC of 0.823.
Feature selection is an important task that affects the performance of classification models [18,19]. Genetic algorithms (GA) is a nature inspired and heuristic algorithm that is utilized for search optimization problems and has been widely adopted to find the optimum feature subsets toward improving the performance of models [24,25]. In healthcare area, GA was utilized to improve the classification models by finding the optimum feature subsets for gene encoder, hepatitis prediction, and COVID-19 patients’ detection. Uzma et al. (2020) proposed gene encoder based on GA to evaluate the feature subset and three machine learning models such as support vector machine (SVM), k-nearest neighbors (KNN), and random forest (RF) were used to classify the cancer samples [29]. The experiments on six benchmark datasets revealed that GA-based feature selection improved the performance of all models used in their study. Parisi et al. (2020) utilized GA to improve the performance of prognosis model for hepatitis prediction [30]. Based on the experimentation on publicly available hepatitis dataset, the proposed model achieved the highest accuracy of 90.32% as compared to the results from previous study. Finally, GA has recently been applied to improve early COVID-19 patient prediction [31]. They used GA as the wrapper method to find the most relevance features from the chest computed tomography (CT) images for positive and negative COVID-19 subjects. The experimental results showed that their model achieved highest accuracy of 96% as compared to other recent methods for detecting the COVID-19 patients.
Furthermore, a previous study has reported positive and promising result by integrating GA as a feature selection method and XGBoost as a classification model. Qu et al. (2019) proposed GA-XGBoost to identify the characteristics/features related with traffic accidents [32]. They applied the model into big data of traffic accidents in 7 cities in China. The empirical analysis showed that GA-XGBoost performed better, achieving AUC of 0.94 as compared to other models compared in the study. Their study also revealed that the selected optimum feature subsets were accurate with better performance. However, to the best of our knowledge, none of the previously mentioned studies have utilized GA and XGBoost together to improve the performance of the classification model, especially for the case of self-care activities problems. In addition, the absence of model evaluation based on statistical test as well as practical application of self-care predication are the major limitations of the previous works. As suggested by Demšar [33], a statistical significance test can be utilized to prove the significance of the proposed model as compared with other classification models and datasets. Previous studies have reported the effectiveness and usefulness of practical application of prediction model to identify risks and assist the decision-making for pediatric readmission prediction [34], preventive medicine [35], violent behavior prediction [36], and trauma therapy [37].
Therefore, the present study proposes GA-XGBoost to improve the performance of the self-care prediction model. To our best knowledge, this is the first time GA and XGBoost have been applied to improve self-care prediction accuracy. In addition, we validate our results by performing a two-step statistical significance test to confirm the significant performance differences between our proposed model and other models used in the study. Furthermore, we also design and develop the prototype of web-based self-care prediction to assist therapist diagnose the self-care problems of children with disabilities. Thus, it is expected that an appropriate treatment/therapy could be performed for each child and can improve their therapeutic outcomes. Finally, the detailed previous works on self-care prediction as compared to our present study are summarized in Table 1.

3. Methodology

3.1. Dataset

We used the publicly available standard dataset related to self-care activity problems of children with disabilities, namely SCADI (self-care activities based on ICF-CY). The SCADI dataset was provided by Zarchi et al. (2018) and collected by expert occupational therapists from 2016 to 2017 at educational and health centers in Yazd, Iran [4]. The dataset consists of 70 subjects in the age range of 6–18 years old, 41% female. The original dataset considered 29 self-care activities based on ICF-CY code standards which the detailed description can be seen in Table 2. For each feature code, the extent of impairment is applied and indicated as 0: no impairment, 1: mild impairment, 2: moderate impairment, 3: severe impairment, 4: complete impairment, 8: no specified, and 9: not applicable. For example, the feature code “d 5100-1” indicates that the subject has mild impairment of washing body parts. For each subject, 203 (29 × 7) self-care activities and 2 additional features for age and gender are provided. In the gender feature, the value of 0 and 1 represent males and females, respectively. While in the self-care activities feature, the value of 0 and 1 represents the absence or presence of a self-care activity, respectively. The self-care problems as the target class in this dataset have been categorized by the therapist into 7 classes, as presented in Table 3. The original target output of SCADI dataset is a multi-class problem with the value range from 1 to 7. The 7 value is used to represent the absence of self-care problems while the values from 1 to 6 are used to represent the presence of self-care problems with its different conditions. In our study, we considered the original multi-target/category output from the SCADI as the dataset I. In addition, we followed previous studies [8,10] in converting the target class output from a multi-class problem to a binary-class problem and we considered this as dataset II. The final target class output for dataset II is set to 0 if self-care problem is not present in the subject and to 1 for all the subjects who have been categorized as having self-care problems. We pre-processed the data by applying the previous rule to the original records. Finally, after data pre-processing, the final dataset II consists of 70 subjects with 54 and 16 subjects being labeled with the presence (positive class) and absence (negative class) of self-care problem, respectively. Both datasets are then used for the next process of GA-based feature selection for improving the self-care classification model.

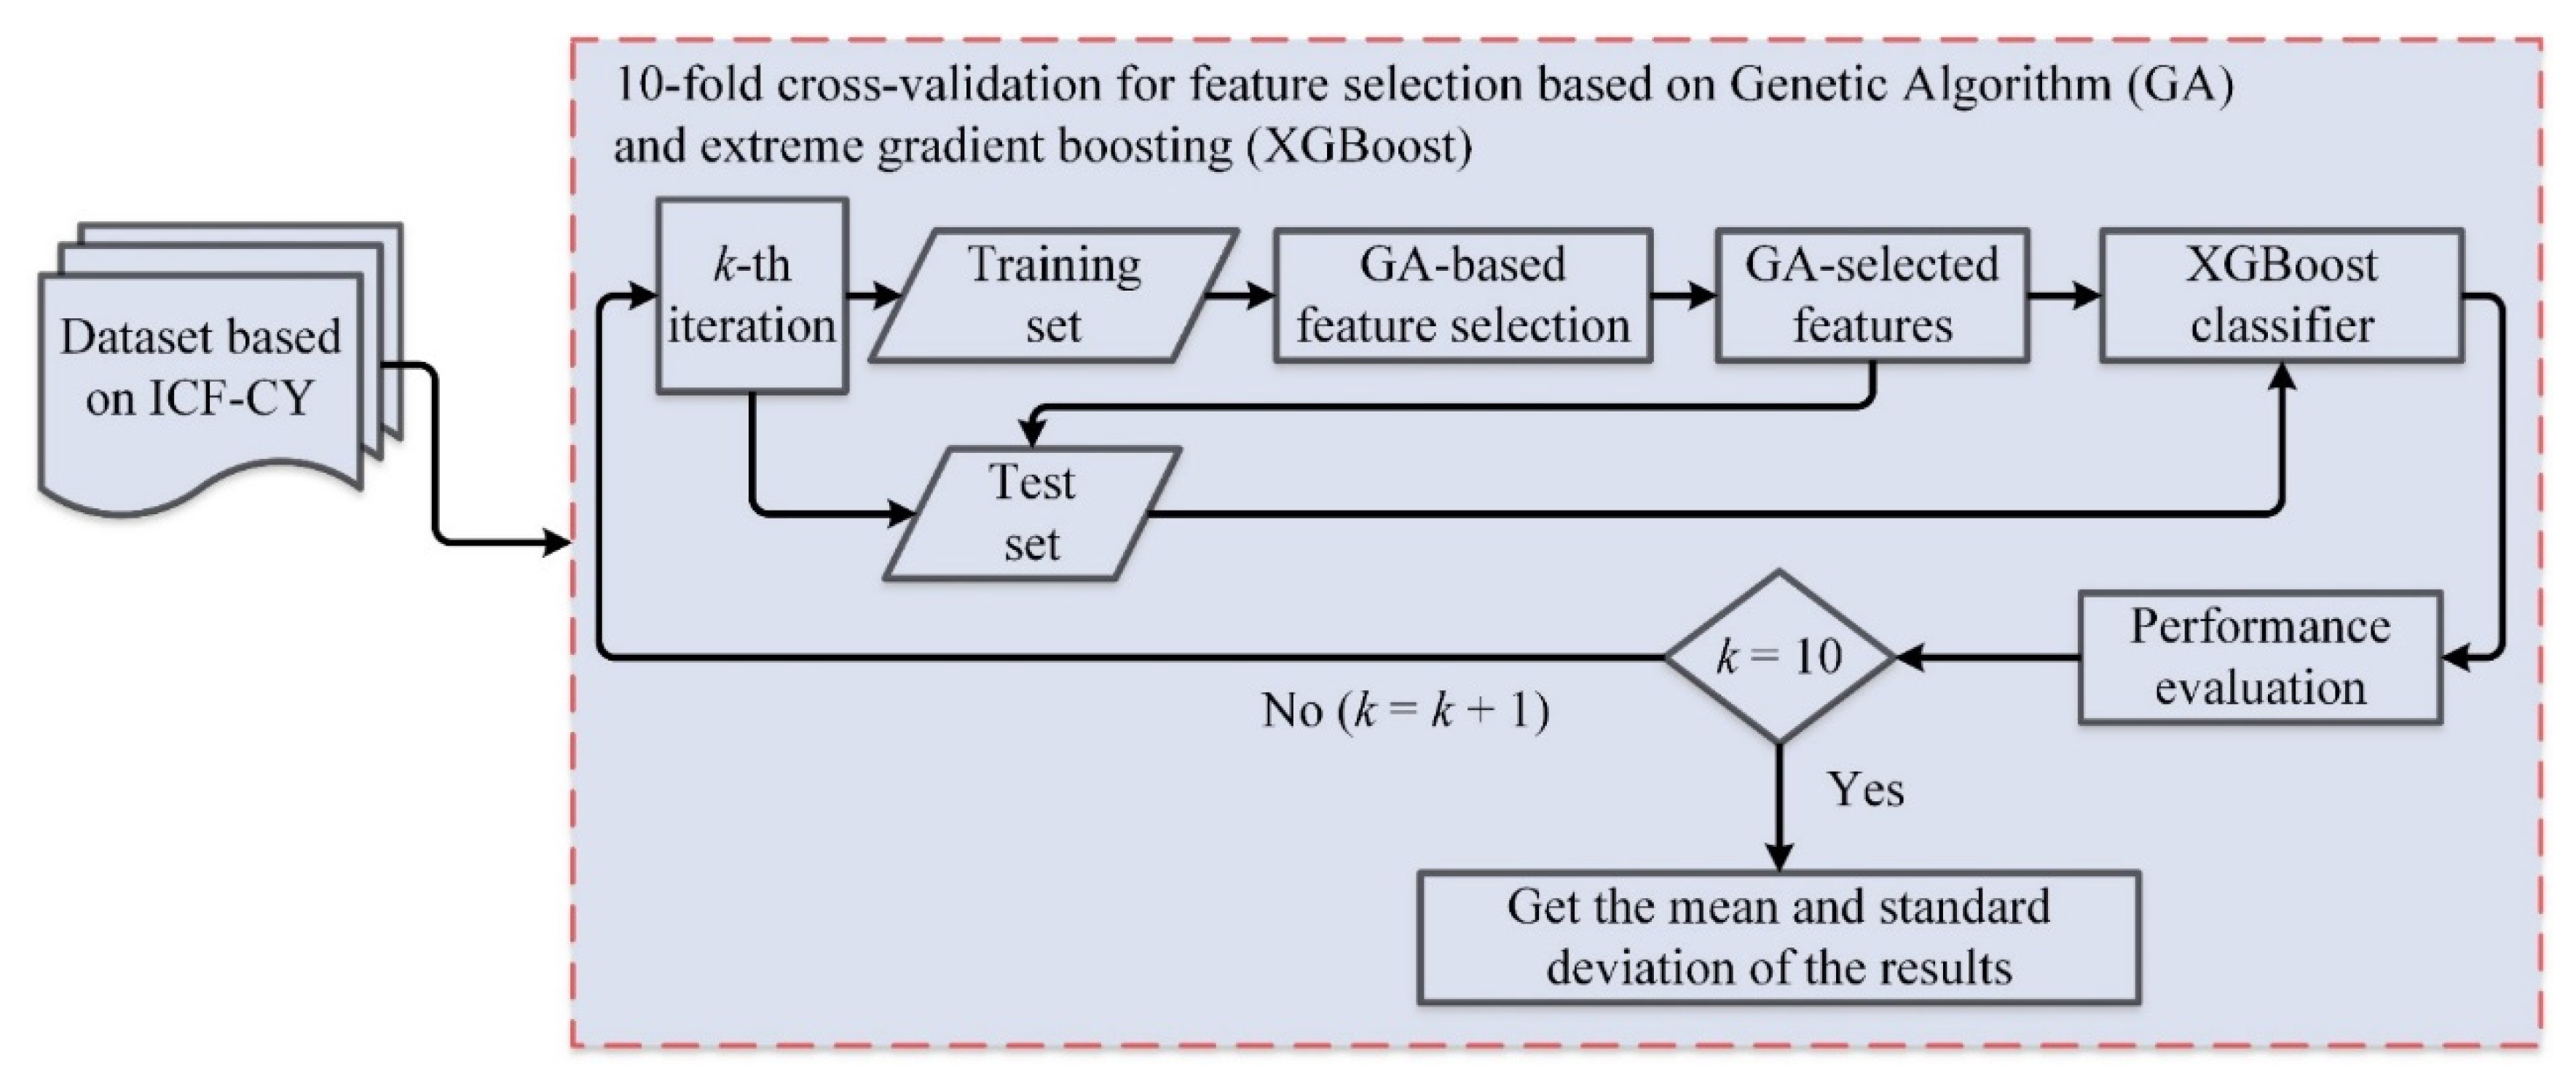
3.2. Design of Proposed Self-Care Prediction Model

Figure 1 shows the general ideas of the proposed self-care prediction model based on genetic algorithms (GAs) and extreme gradient boosting (XGBoost). First, we utilized a standardized self-care dataset based on ICF-CY (SCADI). Second, we used 10-fold cross-validation (10-fold CV) as a validation method for the proposed and comparison machine learning models. In 10-fold CV, the dataset is split into 10 subsets of equal size and the instances for each subset or fold are randomly selected. Each subset in turn is used for the test set and the remaining are used for the training set. The model is evaluated 10 times, such as that each subset is used once as the test set. The training set is then used by GA to find the best feature sets and then the XGBoost classifier is used to learn the pattern from the best GA-selected features from a set of paired input and desired outputs. Once the learning process is finished, the trained model is then used to predict the self-care problems from the test set data. The prediction outputs are then compared with the original target of test data (ground truth) to calculate the model’s performance.

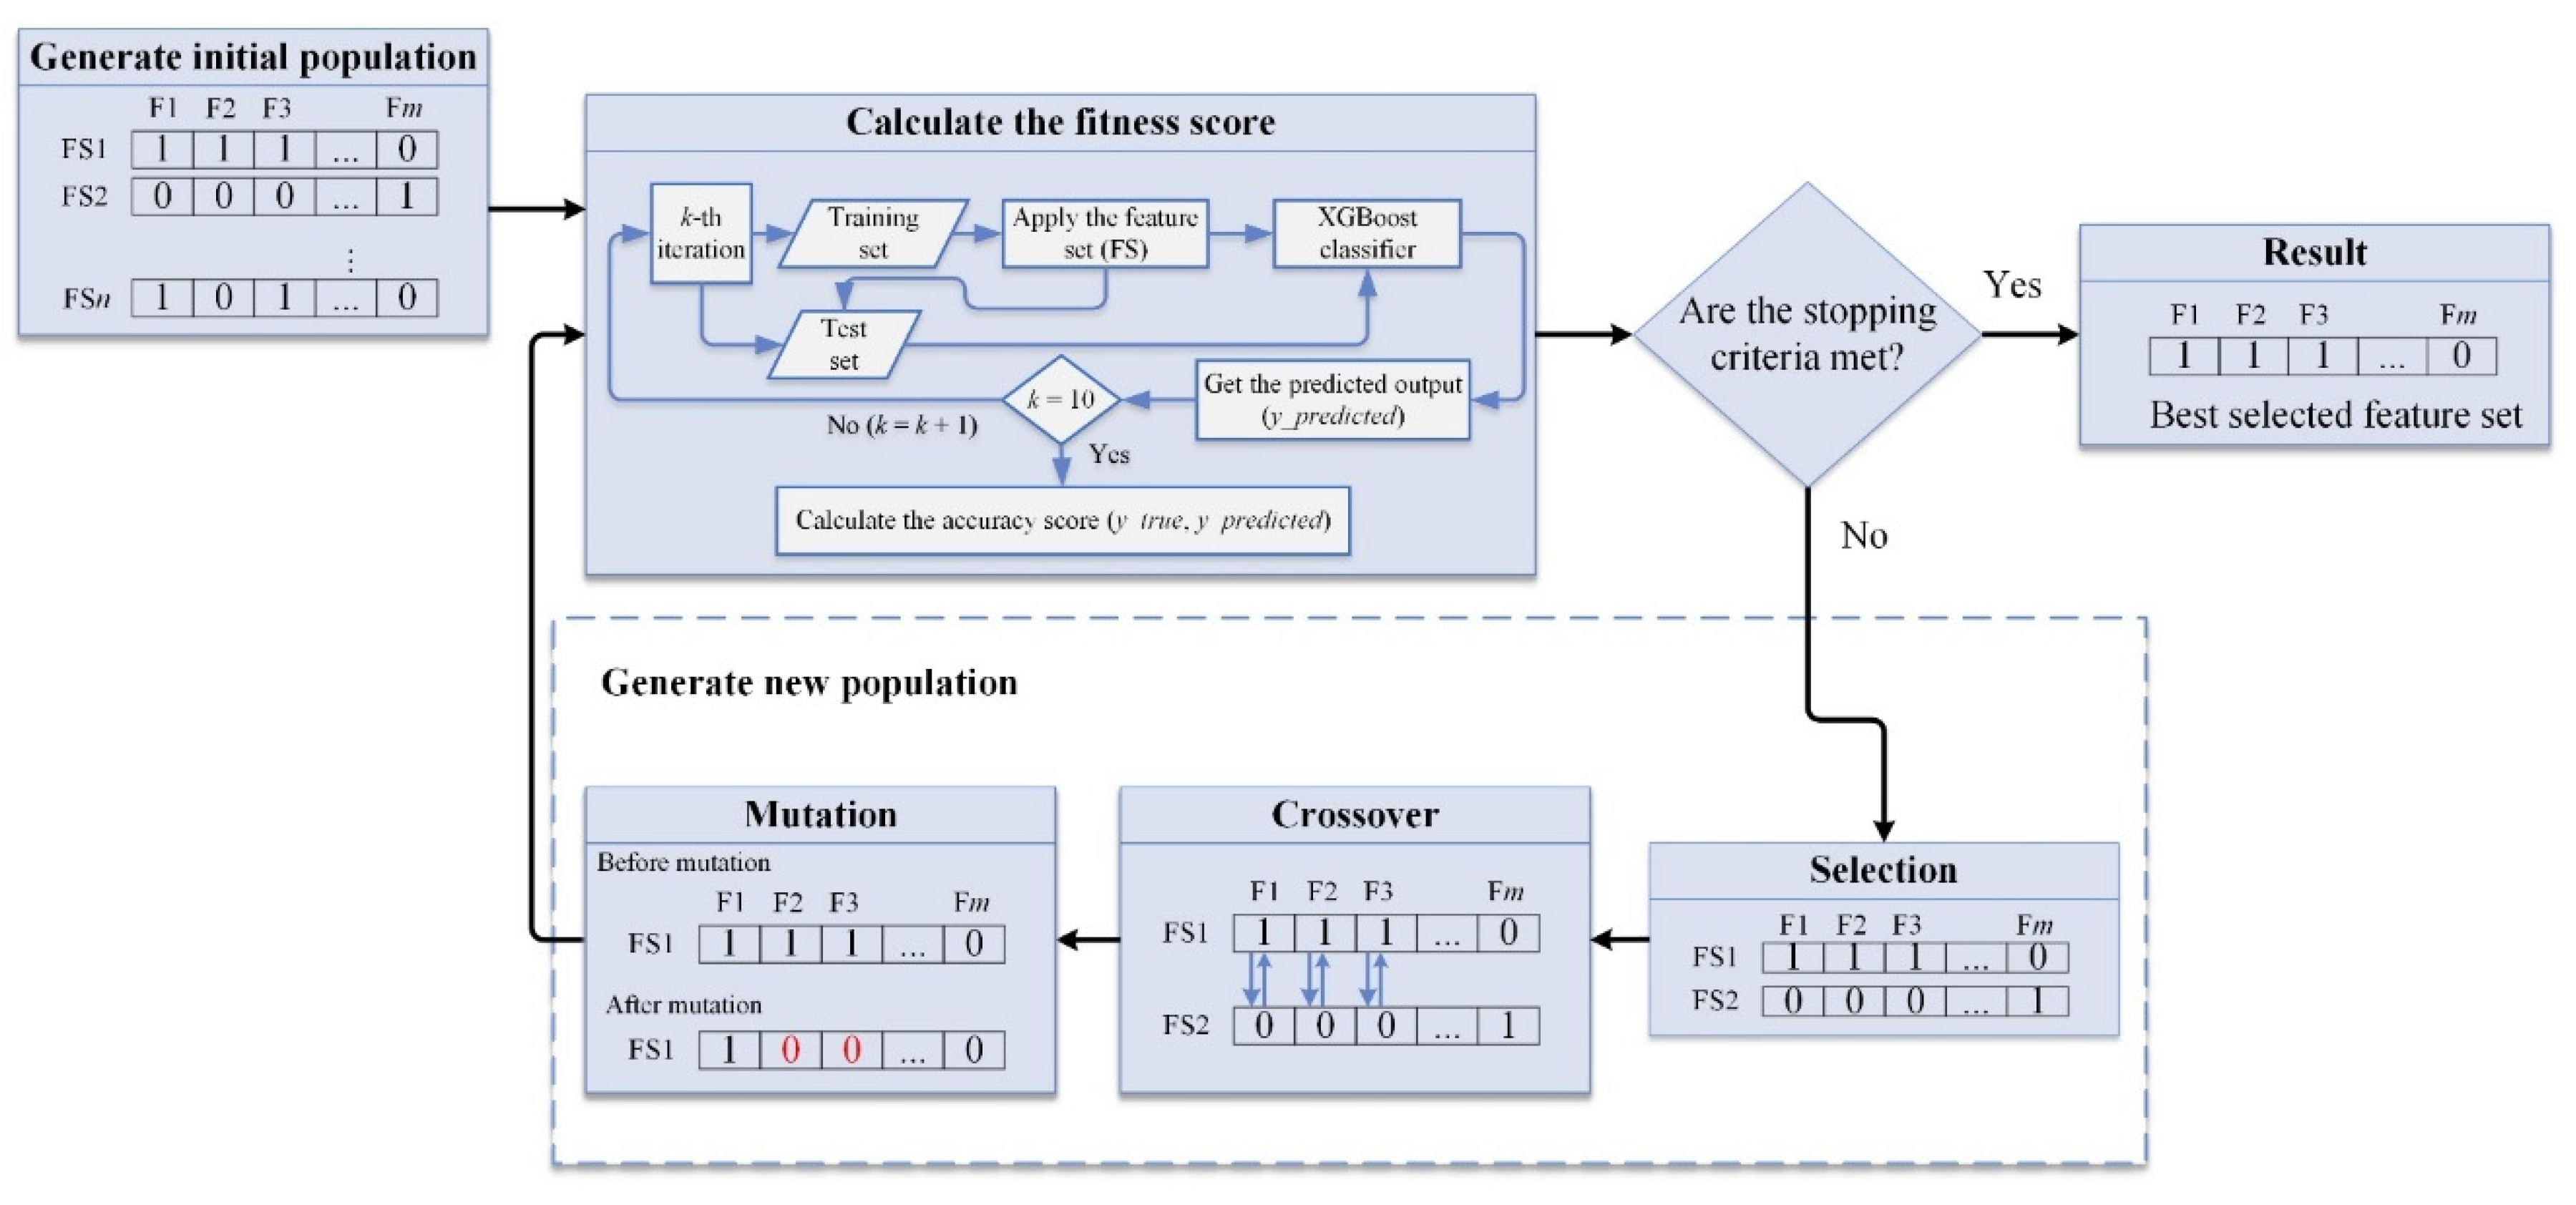
3.3. Genetic Algorithm (GA)

Feature selection is an important task in classification problems to reduce the cost and training time as well as increase its model performance [38]. Genetic algorithms (GAs) have been previously used for feature selection and showed significant results for selecting the best feature sets [24,25]. In the health arena, GA can highly improve the performance of models for emotional stress state detection [26], severe chronic disorders of consciousness prediction [27], children’s activity recognition and classification [28], gene encoder [29], hepatitis prediction [30], and COVID-19 patient detection [31].
GA is a robust optimization technique based on a population of solutions that develops through genetic operations such as selection, crossover, and mutation [39]. GA works first by randomly generating an initial population which consists of fixed-length binary strings (individuals) as a candidate solution for the best possible feature’s subset (FS). A feature subset is represented in each string (as individual) and the values at each position in the string are coded in binary such that a feature is selected (1) or unselected (0). Next, the fitness score (i.e., how well a feature subset endures over the defined assessment criteria) is calculated for each feature subset. We adopt the wrapper method [24,25] and select the classification accuracy as the fitness score. Better feature subsets (i.e., indicate with high fitness score) have a higher chance of being selected to form a new feature subset (as offspring) through a crossover or mutation operation. Crossover creates two new feature subsets (offspring) from a pair of selected feature subsets by exchanging part of their bit values randomly with the random value should be less than the predefined crossover probability (cx-pb). While mutation changes some of the bit values (either changing the string value from 0 to 1 or 1 to 0) in a subset randomly with the random value should be less than the predefined mutation probability (mt-pb). The GA method is an iterative procedure in which each generation is formed by applying the GA operators to the members of the present generation. In this way, good individuals are developed over time until the stopping criteria are met. Thus, the population size (pop-size), the number of generations (n-gen), mutation probability (mt-pb), and crossover probability (cx-pb) are the major parameters of the GA method. Figure 2 shows the flow-chart of the GA-based feature selection and the detailed procedure is summarized in Algorithm 1.
Algorithm 1. Genetic Algorithms (GA)-based feature selection pseudocode
Input: population size, pop-size; crossover probablity, cx-pb; mutation probability, mt-pb; number of generations, n-gen;
Output: Best individual, best-ind;
1:Generate initial population, pop
2:pop ← population(pop-size)
3:Calculate initial fitness score, fitnesses
4:fitnesses ← list(map(evaluate, pop))
5:For individual ind, fitness value fit in zip(pop, fitnesses) do
6: Individual fitness score ind-fitfit
7:end for
8:For each generation g in range(n-gen) do
9: Select the next generation individuals, offspring
10:offspring ← select (pop, len(pop))
11: Clone the selected individuals
12:offspring ← list(map(clone, offspring))
13: Apply crossover on the offspring
14:for child1, child2 in zip(offspring[::2], offspring[1::2]) do
15:  if random() < cx-pb then
16:   mate(child1, child2)
17:  end if
18:end for
19: Apply mutation on the offspring
20:for mutant in offspring do
21:  if random() < mt-pb then
22:   mutate(mutant)
23:  end if
24:end for
25: Evaluate the individuals with an invalid fitness score
26: Weak individual weak_ind ← [ind for ind in offspring if not individual with valid fitness score]
27:fitnesses ← list(map(evaluate, weak_ind))
28:for ind, fit in zip(weak_ind, fitnesses) do
29:  Individual fitness score ind-fitfit
30:end for
31: The population is fully replaced by the offspring
32:pop[:] ← offspring
33:end for
34:Gather all the fitnesses in one list, all-fitnesses
35:all-fitnesses ← [ind-fit[0] for ind in pop]
36:Select the best individual, best-ind
37:best-ind ← selectBest(pop, 1)[0]
38:returnbest-ind
Through the different setup of experiments, the optimal parameters for the population size (pop-size), the crossover probability (cx-pb), and the mutation probability (mt-pb) were discovered; they are 160, 0.7, 0.19 for dataset I and 170, 0.9, 0.36 for dataset II, respectively. In addition, we used the number of generations (n-gen) = 30 for all datasets. After applying GA, approximately 42.93% and 54.15% were selected as the best feature subsets for dataset I and II, respectively. The detailed parameters used in GA and its best-selected feature subsets for each dataset are presented in Table 4.

3.4. Extreme Gradient Boosting (XGBoost)

After selecting the best feature sets by utilizing the GA from the training data, the XGBoost is used to learn and generate the robust prediction model. Previous studies have reported the advantage of using XGBoost for predicting hepatitis B virus infection [13], gestational diabetes mellitus of early pregnant women [14], future blood glucose level of T1D patients [15], coronary artery calcium score (CACS) [16], and heart disease prediction [17]. XGBoost was proposed by Chen and Guestrin and is a scalable supervised machine learning algorithm based on the improvement of gradient boosting decision trees (GBDT) and used for regression and classification problems [12]. The improvement parts of XGBoost as compared to GBDT are in terms of regularization, loss function, and column sampling. Gradient boosting is a method where new prediction models are constructed and employed to calculate the prediction error, after which the scores are summed to obtain the ultimate prediction outcome. XGBoost used the gradient descent and objective functions to minimize the loss score and measure the model performance when a new model is formed, respectively. The objective function term ( ϕ ) can be calculated as:
( ϕ ) = i l ( y ^ i , , y i ) + k ( f k ) ,
where
( f ) =   γ T +   1 2 λ | | w | | 2 .
Here, term l is a differentiable convex loss function that is used to calculate the difference between the prediction term ( y ^ i ) and the target term ( y i ) . While the term is utilized to penalize the complexity of the trained model. The term T represents the number of leaves in the tree. Furthermore, each term f k relates to an independent tree structure ( q ) and leaf weight ( w ). Finally, the γ relates to the threshold and pre-pruning is performed while optimizing to limit the growth of the tree and term λ is used to smooth the final learned weights to tackle the overfitting problems. In summary, the objective function optimization in the XGBoost is transformed into a problem of defining the minimum of a quadratic function. Finally, XGBoost has a better capability to overcome overfitting problems because of the establishment of the regularization term.

3.5. Performance Metrics and Experimental Setup

In this study, we used four performance metrices, including accuracy, precision, recall, and F1-score, to evaluate and compare the performance of our proposed model with other classification models [40]. Table 5 and Table 6 show the detailed performance metrices used in this study for dataset I (multi-class) and II (binary-class) respectively. To provide a general and robust model, we applied 10-fold cross-validation for all classification models, with the ultimate performance result being the average. We used Python V3.6.5 to implement all the classification models with the help of several libraries such as Sklearn V0.20.2 [41] and XGBoost V0.81. We conducted all experiments on a Windows machine, 16 GB memory, and Intel Core i7 processor with 3.60 GHz × 8 cores. In addition, we used the default parameters set by Sklearn and XGBoost to provide fewer configurations so that our study could easily be reproduced by the reader.

4. Results and Discussion

In this section, we present and discuss all the experiment results. Firstly, we present the performance evaluation of our proposed models as compared with state-of-the art models, followed by the feature selection implication analysis on the model’s performance. Next, we provide the impact analysis of population size with respects to accuracy. Finally, we present the benchmark discussion of our models as compared with existing results from previous studies.

4.1. Performance Evaluation of Proposed Models

This sub-section reported the performance of our proposed model towards other models, i.e., NB, LR, MLP, SVM, DT, and RF for all datasets. We employed some performance metrices such as accuracy, precision, recall, and F1-score from 10-fold cross validation (10-fold CV) and presented the results in mean ± standard deviation. Table 7 and Table 8 show the detailed performance comparison results for a dataset I and II, respectively. The results revealed our proposed model outperformed other models by achieving accuracy, precision, recall, and F1-score up to 90%, 79.92%, 84.75%, 81.21% for dataset I and 98.57%, 98.33%, 100%, 99.09% for dataset II, respectively. In addition, the proposed model utilized GA for finding the best feature sets and selected around 42.93% and 54.15% for dataset I and II, respectively. The results confirmed that the GA-selected features have increased the model’s performance in our study.
We further investigated the performance of our proposed model by comparing the significance among the models using a two-step statistical test. We followed the suggestion from Demšar [33] to apply the Friedman test [42] with the post-hoc tests for the comparison of multiple models over several datasets. A post-hoc test can be performed if the performance differences between the models can be identified. Once the difference is discovered; a post-hoc test is performed by utilizing the Holm method [43] for pairwise comparisons of the “control” with another model. The Holm method is used since we want to evaluate the significance of our proposed model as compared with other models. In this case, we set our “proposed” model as a “control” which will be benchmarked against other models such as NB, LR, MLP, SVM, DT, and RF. The p-value indicates whether our proposed model has a significant difference. The significant difference is confirmed when the p-value is lower than the threshold (0.05 in our study). Table 9 shows the Friedman test results including the rank and p-value. It should be noted that the lower the rank of the model, the better the model. The presented results confirmed that our proposed model arises as to the best model, resulting from the fact that it has the lowest rank and the p-value = 4.89 × 10⁻¹⁹ is lower than the threshold (p-value < 0.05). This means that we can reject the null hypothesis that says there is no significant difference between the models. Furthermore, since the null hypothesis is rejected, we proceed with the post-hoc test utilizing Holm to estimate the performance differences of our proposed model with another model. Table 10 shows the results of Friedman post-hoc test comparison among the pairs. The results revealed that the proposed model has significant performance differences as compared with other models (p-value < 0.05). Finally, based on two-step statistical test results, we can conclude that our proposed model has significant performance differences as compared to other models used in this study.

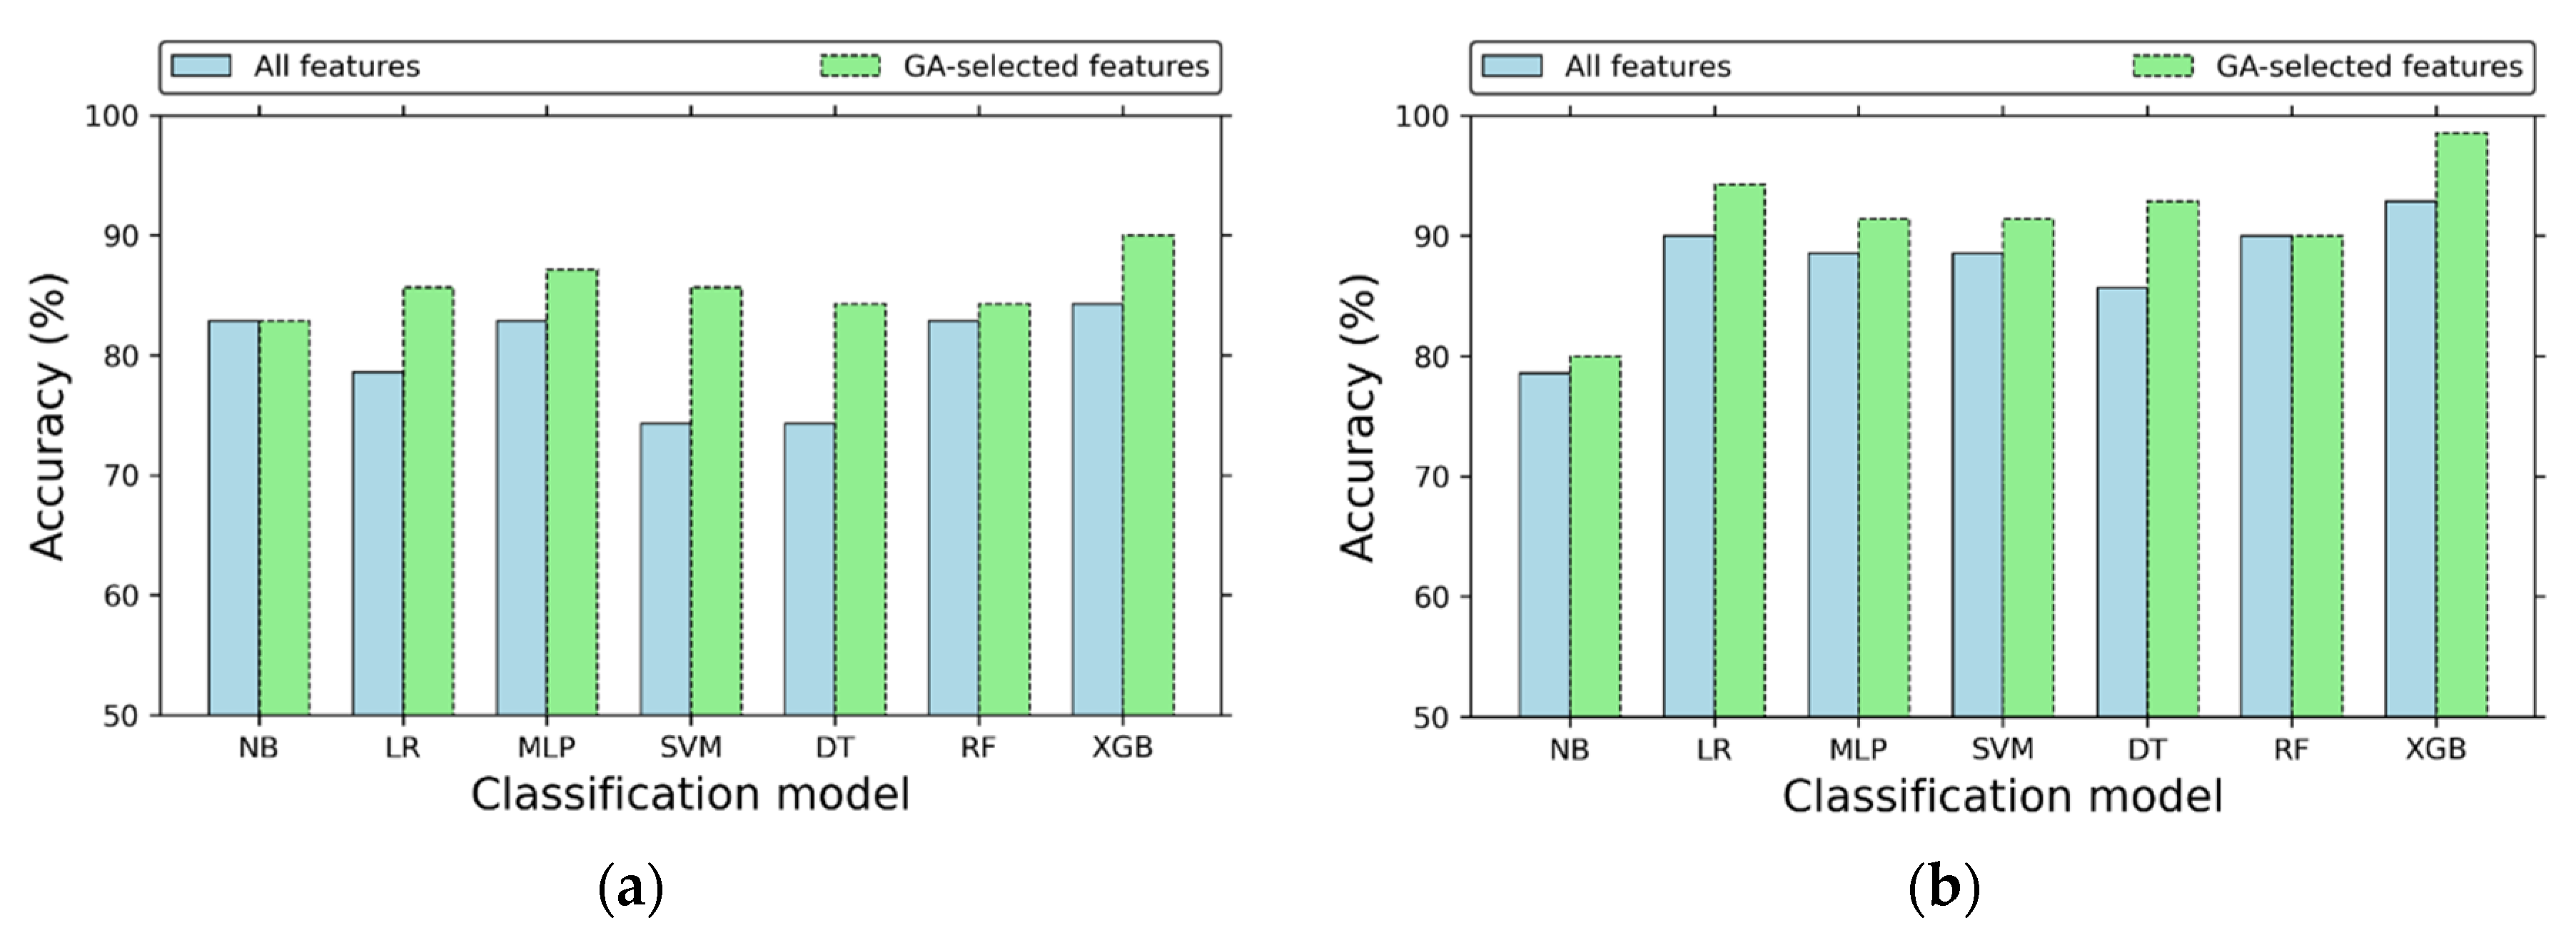
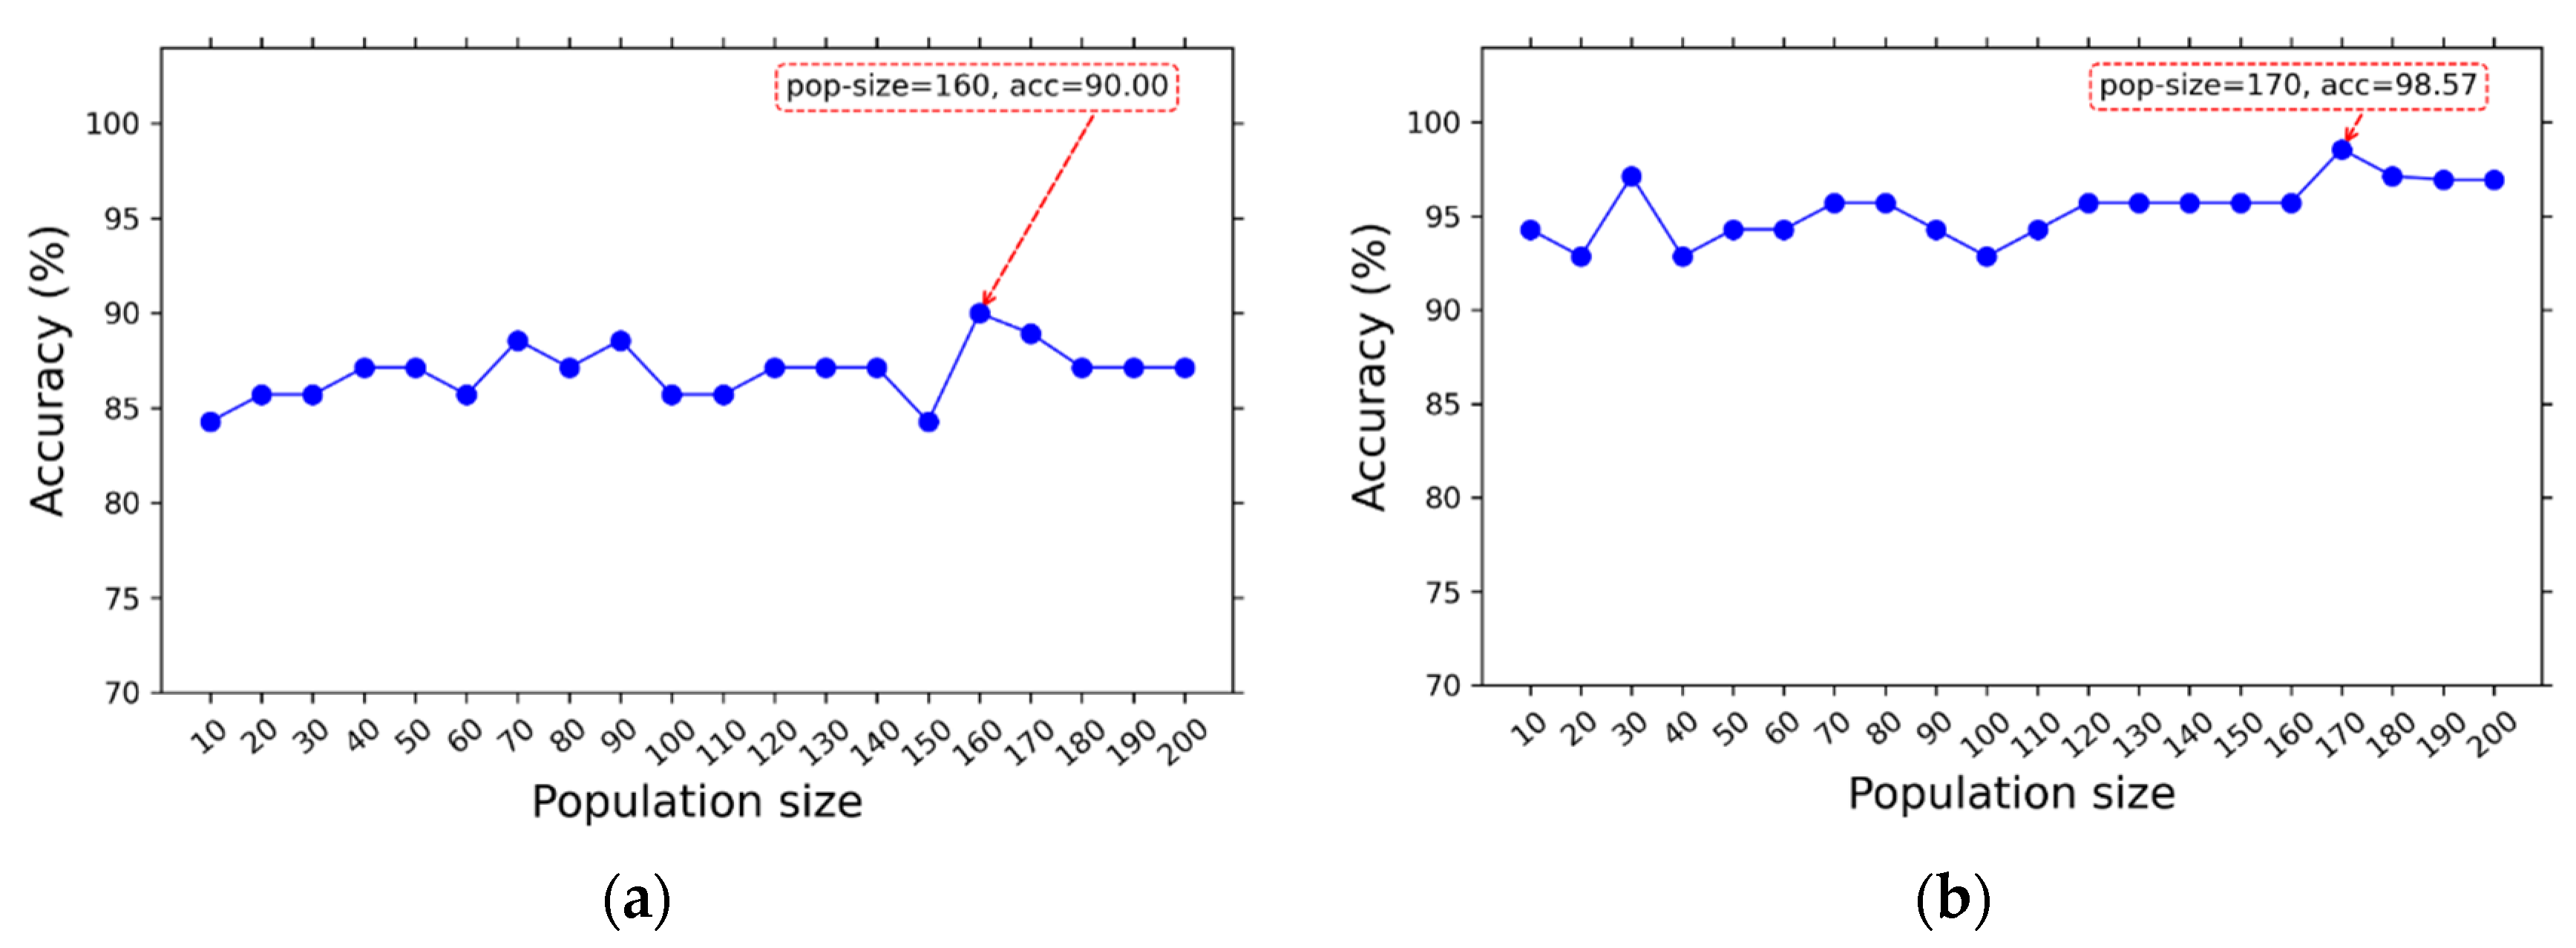
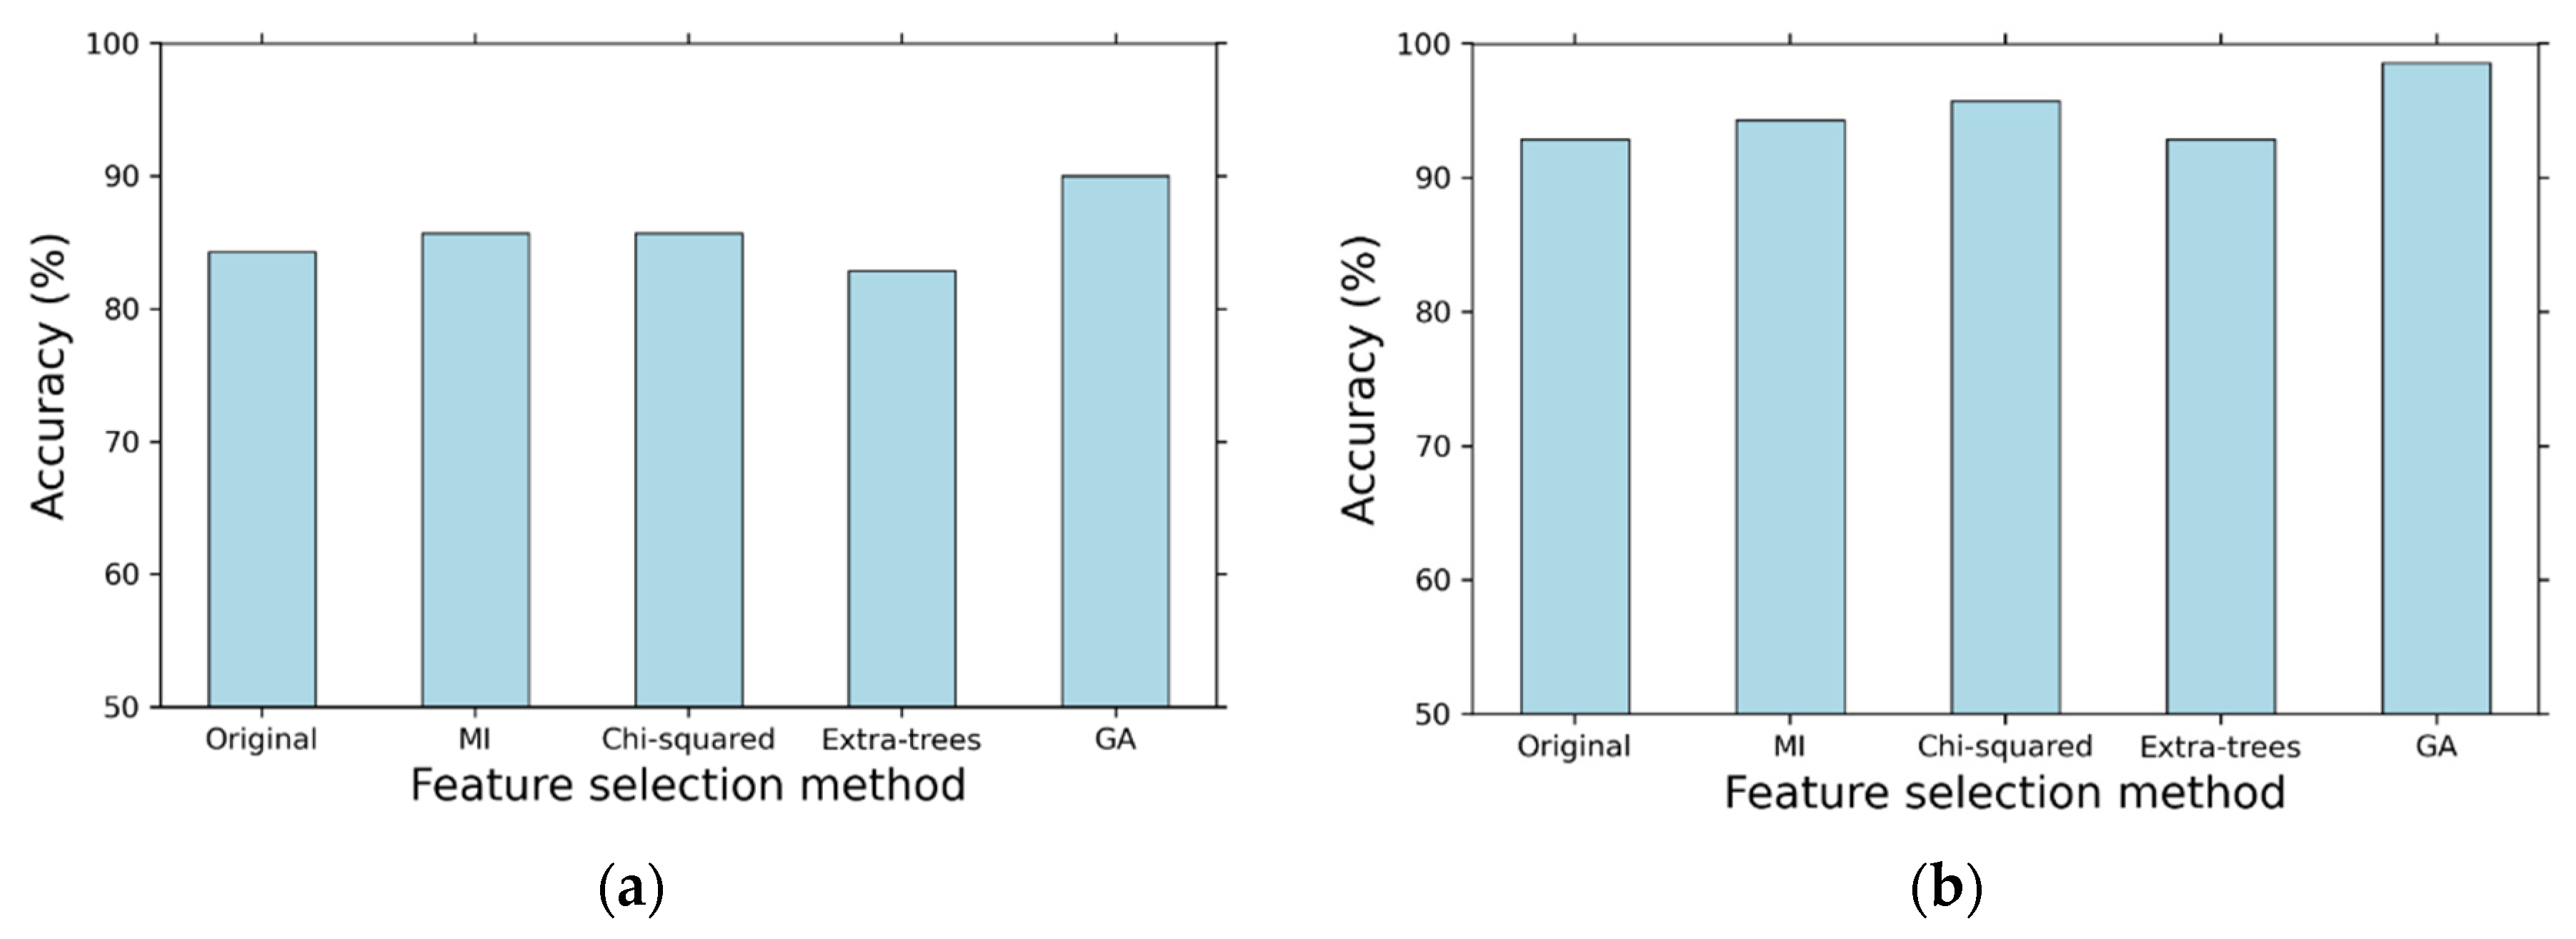
4.2. Impacts of Features Selections on the Classification Performance

In this sub-section, we analyzed the impacts of feature selections on the classification model’s performance. Figure 3a shows the implication of GA for a dataset I toward model’s accuracy. It shows that most of the classification models were improved, aside from NB. Similarly, Figure 3b shows the impacts of GA for dataset II on the model’s accuracy. The result showed that most of the classification model’s accuracy was improved, except for RF. Thus, selecting the best feature sets using GA can improve most of the classification models’ accuracy for all datasets. GA provided significant accuracy improvement for all classification models as compared those without GA, representing average improvement by up to 5.71% and 3.47% for dataset I and II, respectively. In addition, feature selection based on GA has also significantly improved our proposed XGBoost model in all datasets, achieving accuracy from 84.29% and 92.86% to 90% and 98.57%, for dataset I and II respectively, with average improvement as much as 5.71%. Therefore, incorporating GA with XGBoost model was the best choice to improve the model accuracy for all datasets.
The optimal number of population size (pop-size) is essential to implement GA. Therefore, we investigated the impact of pop-size on model accuracy. The detailed parameter settings for GA are presented in Table 4. As shown in Figure 4, the optimal accuracy is achieved up to 90% and 96.57% when the number of population (pop-size) is set to 160 and 170 for dataset I and II, respectively. It is clear that the increased number of population size has potentially increased the model’s accuracy. Finally, with the selected optimal number of population size, 88 and 111 feature-sets were selected for dataset I and II, respectively. These selected features were then applied to the proposed model to improve the model’s accuracy.
Feature selection can be grouped into three categories, known as wrapper, filter, and embedded methods [44,45]. Filter methods find the relevance of features by their correlation with target output, while wrapper methods utilize machine learning model to measure the usefulness of feature subsets according to their predictive performance. The embedded methods perform feature selection in the process of training based on the specified learning algorithm. In our study, we used GA as an application of wrapper methods, while mutual information (MI) and chi-squared were utilized for the filter methods. In case of embedded methods, we utilized the extra-trees algorithm [46] to extract relevant features. Figure 5a,b shows the impact of several feature selection methods on the XGboost model accuracy for dataset I and II, respectively. The extra-trees-based feature selection automatically found the optimal number of features; they are 62 and 67 for dataset I and II, respectively. In addition, based on our investigation, we found that the optimal number of features for MI and chi-squared are 35 and 6, and 5 and 50 for dataset I and II, respectively. GA performed superior accuracy for the proposed XGboost model, up to 5.71% accuracy improvements for all datasets as compared to outcomes without feature selection (original). However, the other feature selection methods considered in this study, i.e., MI and chi-squared, performed poorly, with slight accuracy improvement for all datasets. As for extra-trees, there were no accuracy improvement for all datasets. Thus, GA was the most excellent option for XGBoost model, providing optimum classification model accuracy for all datasets.

4.3. Comparison of the Proposed Model with Previous Works

In this study, we compared the performance of our proposed model with the previous study results that have utilized the same SCADI dataset. Table 11 summarizes the comparison study of the proposed model with previous related works. In general, the proposed model has outperformed all previous study results applied on the same dataset such as ANN [4], KNN [5], NB [6], SMOTE + XGBoost [7], FNN [8], DNN [9], and hybrid autoencoder [10]. The best accuracy for multi-class classification problem on the SCADI dataset still goes for DNN [9]; however, it should be noted that they used hold-out validation method (60%/40% for training and testing) which is less reliable and increase the possibility of over-fitting and over-optimism, as compared with 10-fold cross-validation [47]. Finally, in term of binary-class classification problem, our proposed model has the highest performance by achieving the accuracy up to 98.57% as compared with the results from previous related works. Furthermore, none of previous studies have utilized statistical tests for evaluating their models. In addition, none of the previous studies have provided the practical application of their developed model into real application. Hence, in the present study, we provide a two-step statistical test to confirm the significance of our proposed model as compared to state-of-the-art models. Finally, we design and develop the practical application of our proposed model into web-based self-care prediction.
It worth mentioning that the direct performance comparison of the presented results is not fair, since they have been obtained from different classification models and validation methods. Therefore, the results which were presented in Table 11 cannot be used to merely justify the performance of the classification models, but it simply could be used as an overall comparison between the proposed model and previous studies. Benchmarking machine learning models will turn out to be rather fairer as other standardized self-care datasets become publicly available in the future.

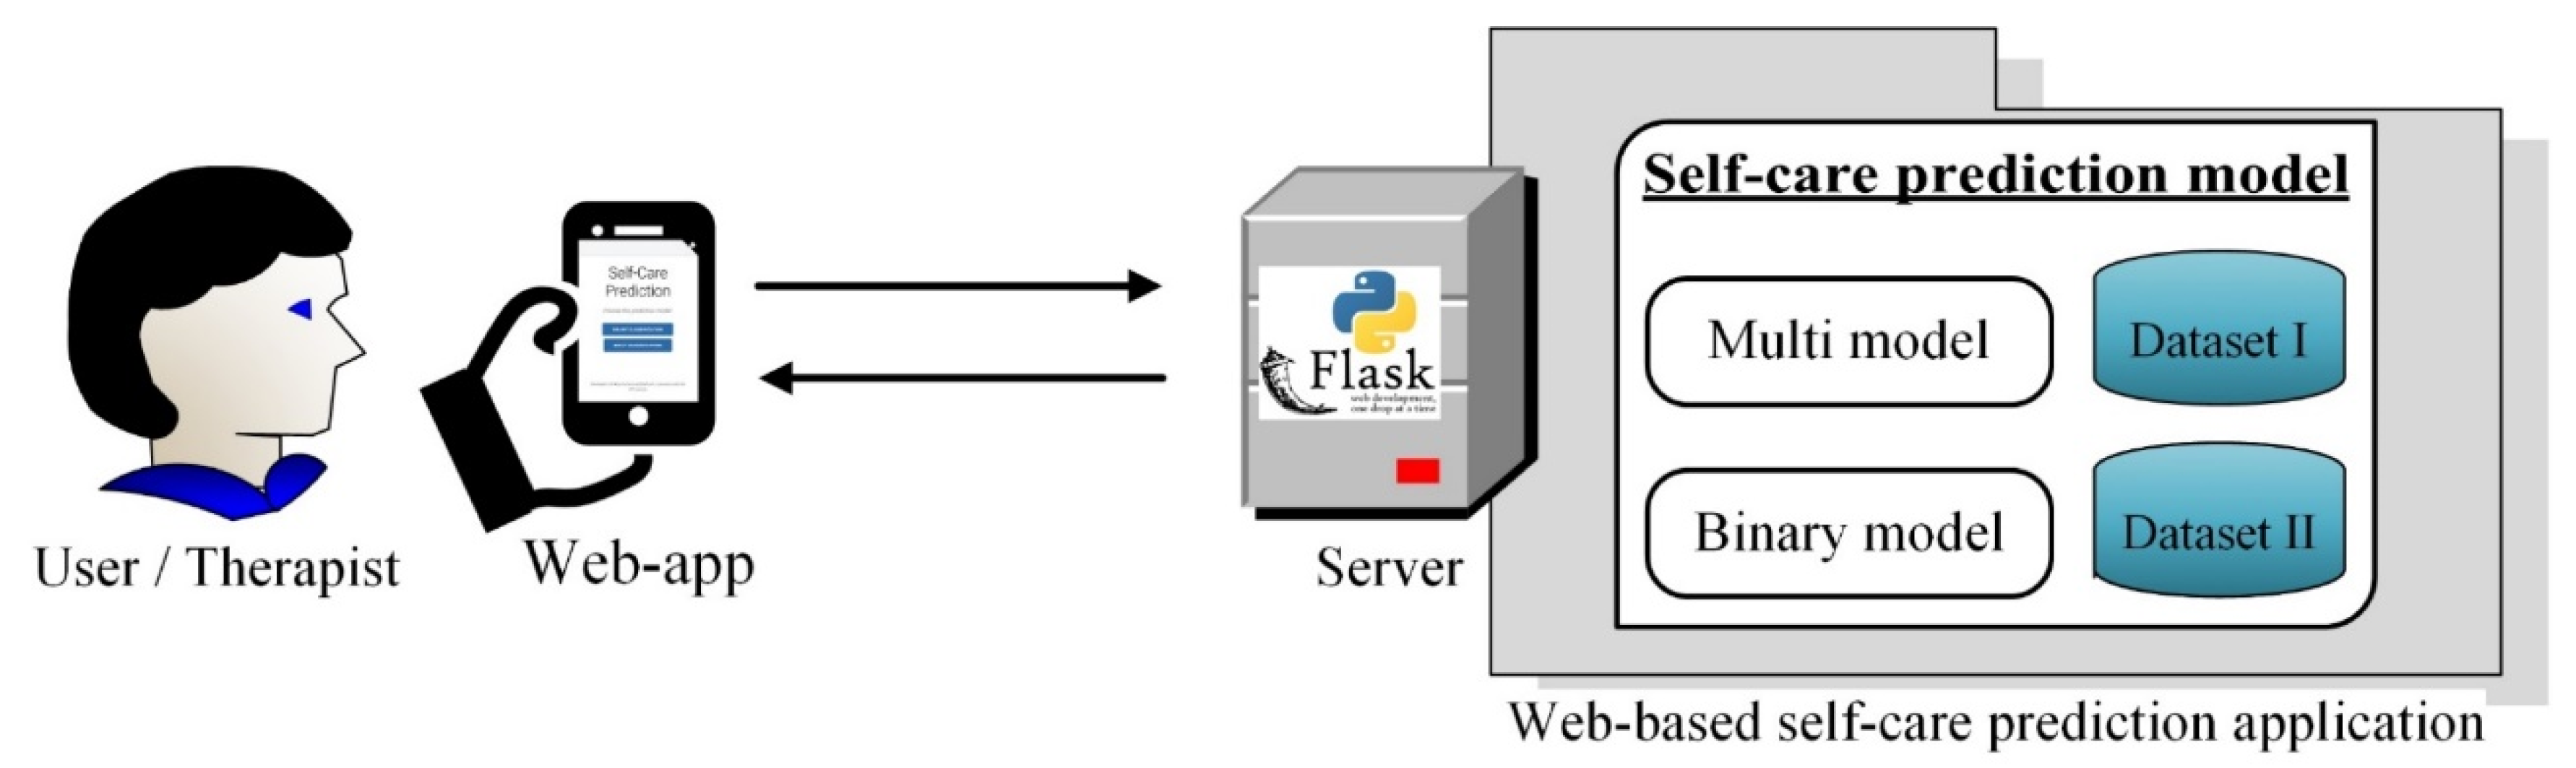
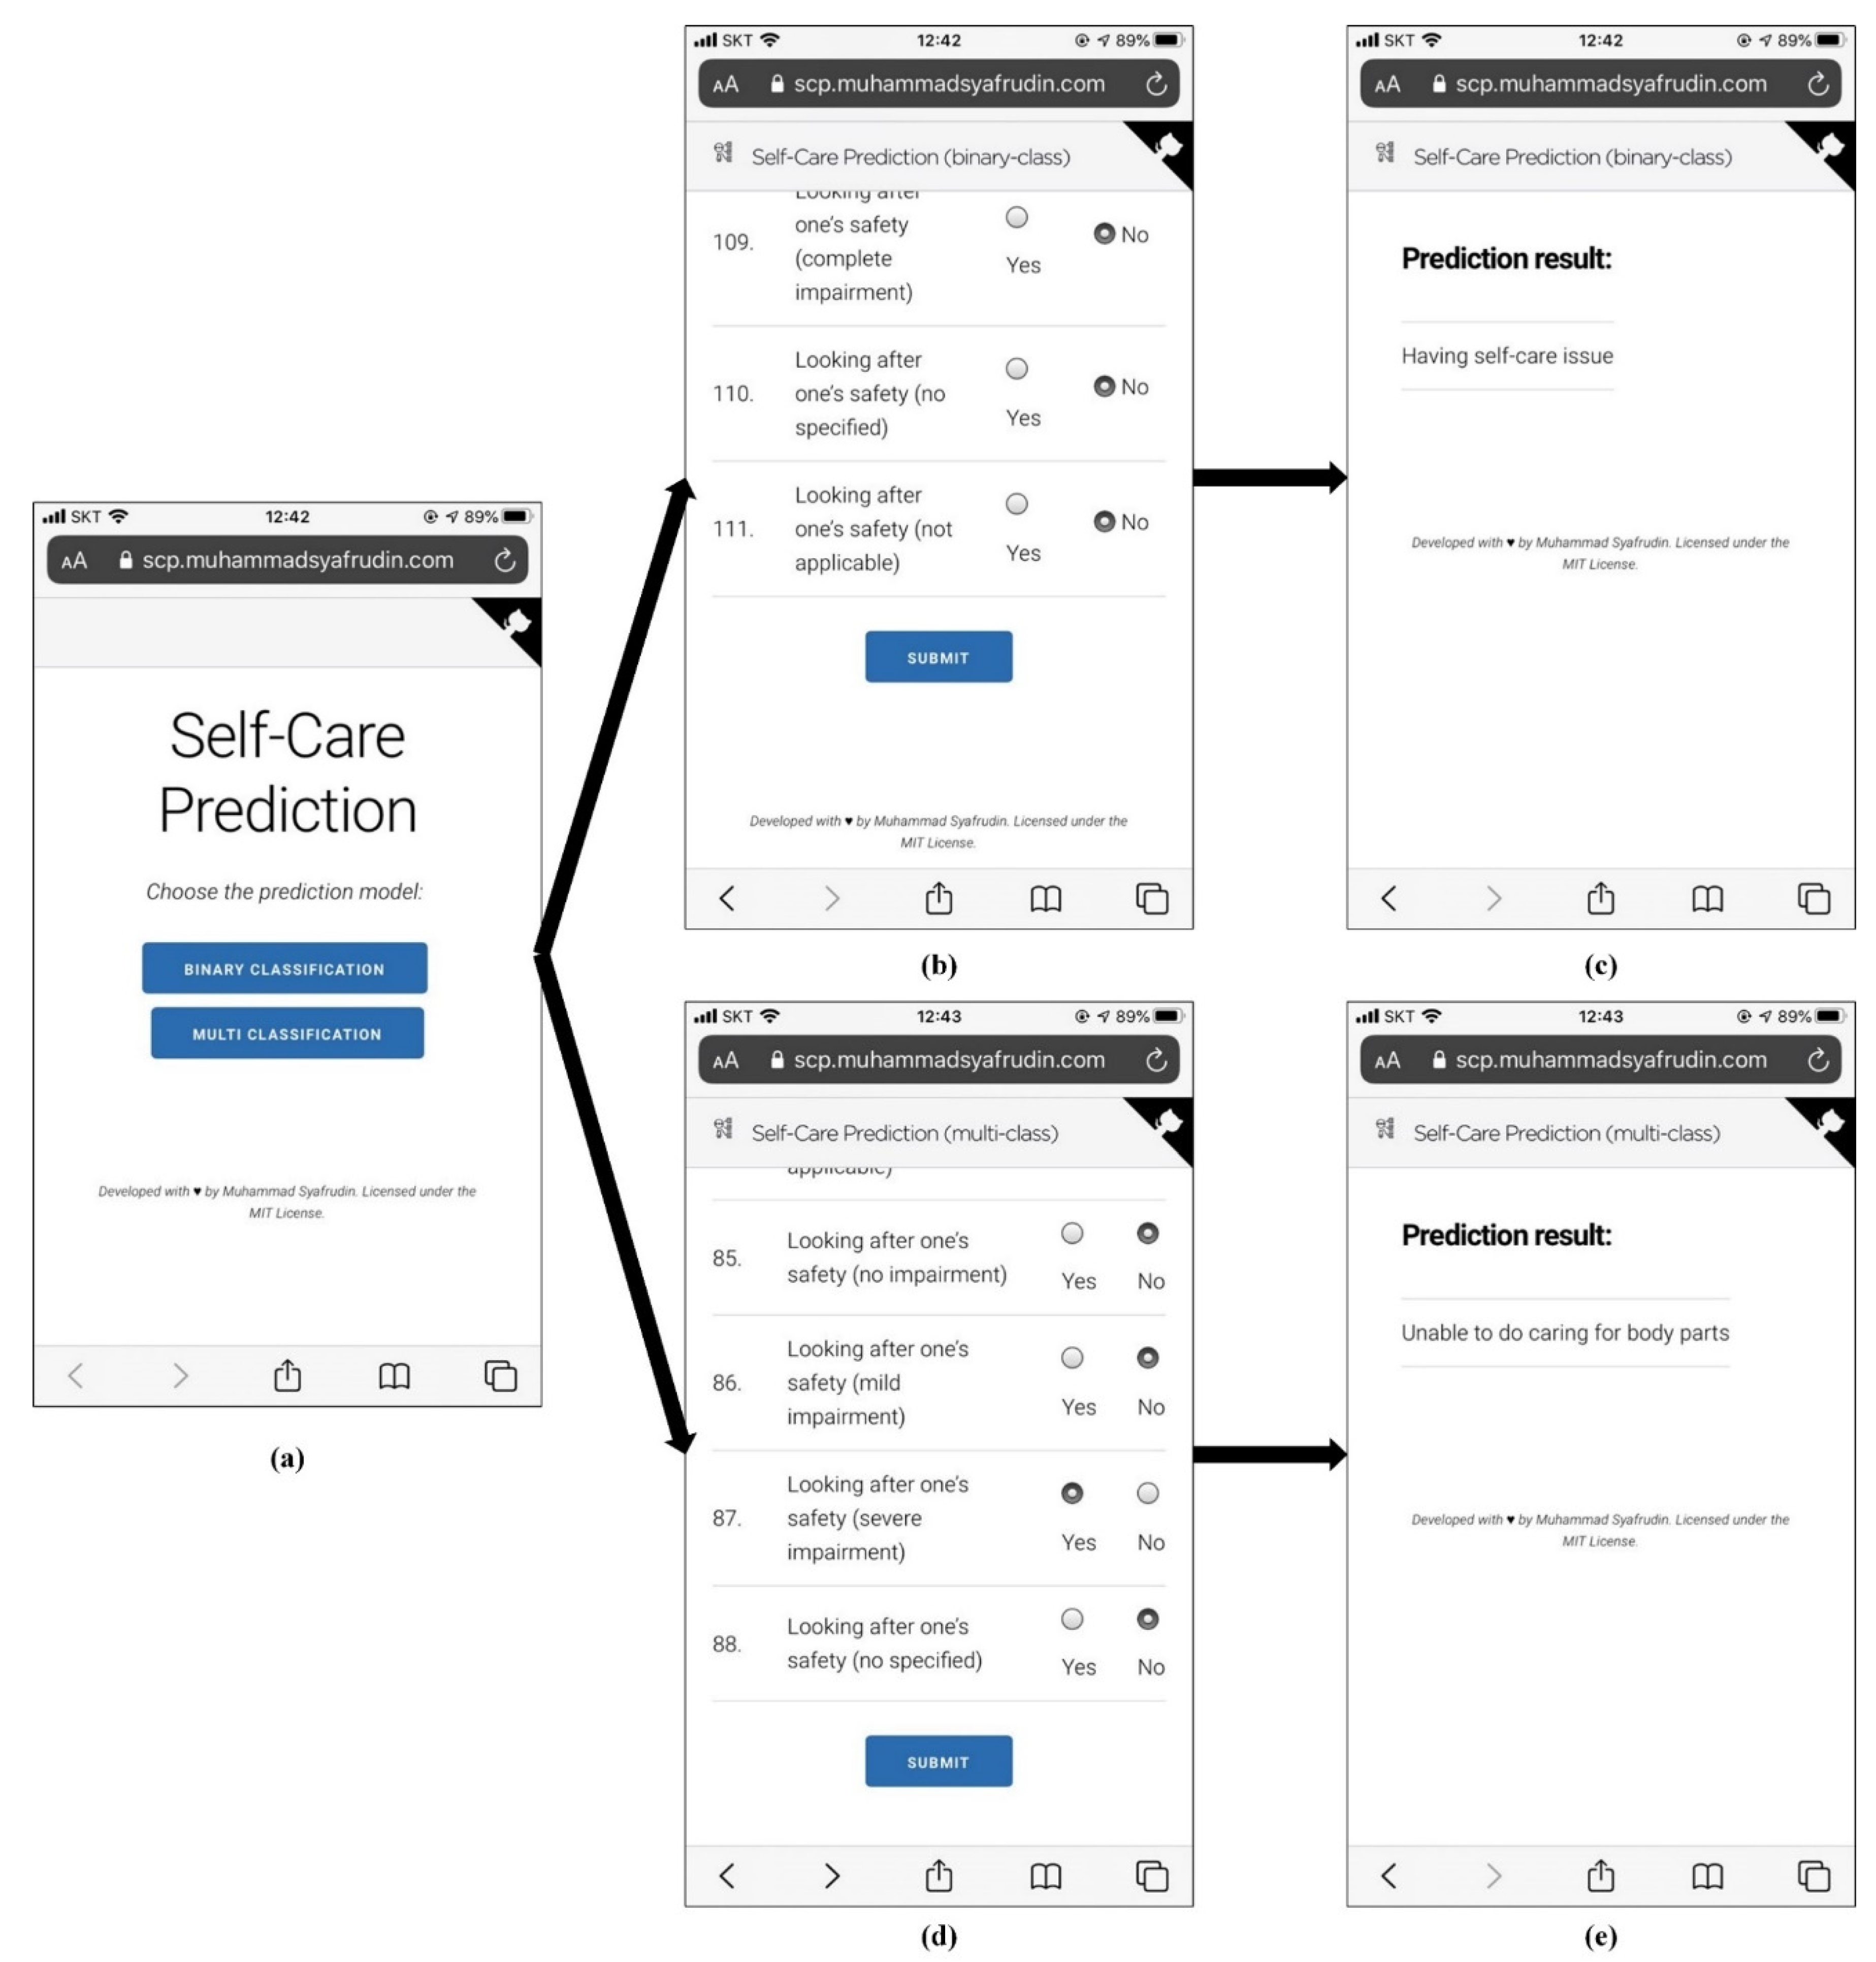
5. Practical Application of the Proposed Self-Care Prediction Model

Previous studies have shown the effectiveness and usefulness of web-based risk assessments in identifying risks and assisting the decision-making for pediatric readmission prediction [34], preventive medicine [35], violent behavior prediction [36], and trauma therapy [37]. Thus, in this section, we aim to design and develop web-based self-care prediction application (web-app) to provide decision tools for therapist in diagnosing children with disabilities. The web-based self-care prediction was developed in Python V3.8.5 by utilizing Flask V1.1.2 as a Python web server with Milligram framework v1.4.1 for data representation, while the proposed prediction model was loaded using Joblib V0.14.1 and applied with XGBoost V1.2.0. As illustrated in Figure 6, the user/therapist can access the web-based self-care prediction through their web-browser via personal computers or mobile devices. Then, the user can choose the prediction tasks, either binary or multi-classification and fill out the corresponding diagnosis form. The diagnosis data are then transmitted into a Flask-based web server and its corresponding prediction model is used to predict the subjects’ self-care status. The prediction result is then sent back to the web-based self-care prediction result interface. The proposed self-care prediction model is generated from dataset I and II for the multi and binary model, respectively.
Figure 7a shows the first menu page interface of web-based self-care prediction in which users can choose the prediction model. After choosing the menu, the corresponding diagnosis form will be shown to the users so that its necessary diagnosis data can be filled out by the users. Once all the diagnosis data are filled, the user can press the “SUBMIT” button to send all the data to the Flask-based web server, which loads the trained prediction model to diagnose the subjects’ self-care status. The diagnosis form and its prediction result interface for binary- and multi-classification can be seen in Figure 7b–e, respectively. The developed web-based self-care prediction is expected to help therapists in diagnosing children with disabilities and improve the effectiveness of self-care classification problems. Therefore, the appropriate treatment/therapy could be performed for each child to improve their therapeutic outcomes.
The developed web-based self-care prediction and its source codes can be accessed at https://scp.muhammadsyafrudin.com and https://github.com/justudin/selfcare-apps, respectively. It worth noting that this developed model is only limited to the specific dataset; therefore, the trained models cannot be utilized for other demographic subjects. In addition, we have not employed the models for experimenting with therapists due to the limitation of the dataset (specific for Iranian children). Once another demographic subjects (for example in Korea) are gathered, we could perform experimenting our self-care prediction model with therapist and it is currently out of the scope of our present study.

6. Conclusions and Future Works

This study presents a self-care prediction model known as GA-XGBoost, which combined genetic algorithms (GA) with extreme gradient boosting (XGBoost) for predicting self-care problems of children with disabilities. Due to the fact that it is a complex and time-consuming process for occupational therapists to diagnose self-care problems, many researchers have focused on developing self-care prediction models. We combined GA-XGBoost to improve the performance of self-care prediction model which are based on two research ideas. First, GA is used to find the best feature subsets from the training dataset. Second, the selected features are then used for XGBoost to learn the pattern and generate a robust prediction model.
We conducted six experiments to evaluate the performance of our proposed model. First, we performed 10-fold cross-validation and compared GA-XGBoost with six prediction models such as NB, LR, MLP, SVM, DT, and RF. The results revealed that GA-XGBoost achieved superior performance as compared to other six prediction models with an accuracy up to 90% and 98.57% for dataset I and II, respectively. Second, we performed two-step statistical significant test to prove the improved performance of the proposed model. The obtained p-value from first and second step of test were both lower than the threshold (p-value < 0.05) which showed and confirmed the significance performance of our proposed model. Third, we presented the impact analysis of feature selection with and without GA on the accuracy of all prediction models. The result found that GA significantly increased the accuracy of all prediction models with average improvement by up to 5.71% and 3.47% for dataset I and II, respectively. Fourth, we analyzed the impact of number of population size (pop-size) parameter in GA on the model accuracy and found that the maximum accuracy was achieved when the pop-size = 160 and 170 for dataset I and II, respectively. Fifth, we conducted comparison GA with other feature selection methods such as MI, chi-squared, and extra-trees. This experiment revealed that GA was superior in improving XGBoost accuracy, while MI and chi-squared both performed poorly and there was no accuracy improvement from extra-trees. Finally, the sixth step was to compare the performance of the proposed model with the previous study results. The results revealed that the proposed model was better than previous study in terms of accuracy, providing statistical tests and practical application for self-care prediction. We also designed and developed the model to help therapists diagnose the self-care problems of children with disabilities. Therefore, the appropriate treatment/therapy could be performed for each child to improve their health outcomes. Furthermore, these extensive experiments as well as the developed application could be useful for health decision makers and practitioners as practical guidelines on developing improved prediction models and implementing the model into real application.
It is worth noting that we still have many aspects that have not been considered in the current study. Thus, we could explore these in the future. First, we only utilized one specific demographic dataset (from children in Iran). We could investigate the robustness of GA-XGBoost by applying to other similar datasets related to children with disabilities once new datasets become available in the future. Second, we only utilized GA as an optimization method to optimize the best feature subsets. However, there are many different optimization methods such as particle swarm optimization (PSO), ant colony optimization (ACO), forest optimization algorithm (FOA), and so on. In the future, we could use different optimization methods to find the best feature subsets. In addition, we have not conducted experiments with therapists in Korea yet because the dataset was come from different demographic (Iran), however; we could perform it if the specific demographic dataset (for example in Korea) are gathered in the future.

Author Contributions

Conceptualization, J.R.; Data curation, N.L.F. and A.F.; Investigation, M.A.; Methodology, M.S.; Project administration, J.R.; Resources, T.H. and A.F.; Software, M.S.; Validation, G.A.; Visualization, N.L.F.; Writing—original draft, M.S.; Writing—review & editing, G.A., M.A. and T.H. All authors have read and agreed to the published version of the manuscript.

Funding

This paper receives no external funding.

Acknowledgments

This paper is a tribute made of deep respect for a wonderful person, colleague, advisor, and supervisor, Yong-Han Lee (1965–2017).

Conflicts of Interest

The authors declare no conflict of interest.

Appendix A

Table A1. List of acronyms and/or abbreviations used in the study.
Acronym/AbbreviationDefinition
GAGenetic algorithms
XGBoostExtreme gradient boosting
WHOWorld health organization
ICF-CYInternational classification of functioning, disability, and health: children and youth version
SCADISelf-care activities dataset based on ICF-CY
MLAsMachine learning algorithms
ANNArtificial neural network
KNNK-nearest neighbor
NBNaïve bayes
FNNFuzzy neural networks
DNNDeep neural networks
LRLogistic regression
MLPMulti-layer perceptron
SVMSupport vector machine
DTDecision tree
RFRandom forest
T1DType 1 diabetes
CACSCoronary artery calcium score
COVID-19Coronavirus disease
CVCross-validation
PCAPrincipal component analysis
IGRCFSInformation gain regression curve feature selection
SMOTESynthetic minority over sampling technique
ELMExtreme learning machines
FSFeature’s subset
Borderline-SMOTEBorderline-Synthetic minority oversampling technique
AUCArea under the receiver operating characteristic curves
GDMGestational diabetes mellitus
PHPrediction horizon
RMSERoot mean square error
CTComputed tomography
cx-pbCrossover probability
mt-pbMutation probability
pop-sizePopulation size
n-genNumber of generations
GBDTGradient boosting decision trees
MIMutual information
Web-appWeb-based application

References

  1. Tung-Kuang, W.; Shian-Chang, H.; Ying-Ru, M. Identifying and Diagnosing Students with Learning Disabilities using ANN and SVM. In Proceedings of the The 2006 IEEE International Joint Conference on Neural Network Proceedings, Vancouver, BC, Canada, 16–21 July 2006; IEEE: Vancouver, BC, Canada, 2006; pp. 4387–4394. [Google Scholar] [CrossRef]
  2. Haley, S.; Andrellos, P.J.; Coster, W.; Haltiwanger, J.T.; Ludlow, L.H. Pediatric Evaluation of Disability Inventory™ (PEDI™). Available online: https://eprovide.mapi-trust.org/instruments/pediatric-evaluation-of-disability-inventory (accessed on 5 June 2020).
  3. World Health Organization. International Classification of Functioning, Disability and Health: Children and Youth Version: ICF-CY. World Health Organization. 2007. Available online: https://apps.who.int/iris/handle/10665/43737 (accessed on 10 June 2020).
  4. Zarchi, M.S.; Fatemi Bushehri, S.M.M.; Dehghanizadeh, M. SCADI: A standard dataset for self-care problems classification of children with physical and motor disability. Int. J. Med. Inform. 2018, 114, 81–87. [Google Scholar] [CrossRef] [PubMed]
  5. Islam, B.; Ashafuddula, N.I.M.D.; Mahmud, F. A Machine Learning Approach to Detect Self-Care Problems of Children with Physical and Motor Disability. In Proceedings of the 2018 21st International Conference of Computer and Information Technology (ICCIT), Amsterdam, The Netherlands, 10–11 December 2018; IEEE: Dhaka, Bangladesh, 2018; pp. 1–4. [Google Scholar]
  6. Liu, L.; Zhang, B.; Wang, S.; Li, S.; Zhang, K.; Wang, S. Feature selection based on feature curve of subclass problem. In Proceedings of the 2019 International Joint Conference on Neural Networks (IJCNN), Budapest, Hungary, 14–19 July 2019; IEEE: Piscataway, NJ, USA, 2019; pp. 1–8. [Google Scholar]
  7. Le, T.; Baik, S. A Robust Framework for Self-Care Problem Identification for Children with Disability. Symmetry 2019, 11, 89. [Google Scholar] [CrossRef] [Green Version]
  8. Souza, P.V.C.; dos Reis, A.G.; Marques, G.R.R.; Guimaraes, A.J.; Araujo, V.J.S.; Araujo, V.S.; Rezende, T.S.; Batista, L.O.; da Silva, G.A. Using hybrid systems in the construction of expert systems in the identification of cognitive and motor problems in children and young people. In Proceedings of the 2019 IEEE International Conference on Fuzzy Systems (FUZZ-IEEE), New Orleans, LA, USA, 23–26 June 2019; IEEE: New Orleans, LA, USA, 2019; pp. 1–6. [Google Scholar]
  9. Akyol, K. Comparing of deep neural networks and extreme learning machines based on growing and pruning approach. Expert Syst. Appl. 2020, 140, 112875. [Google Scholar] [CrossRef]
  10. Putatunda, S. Care2Vec: A hybrid autoencoder-based approach for the classification of self-care problems in physically disabled children. Neural. Comput. Appl. 2020. [Google Scholar] [CrossRef]
  11. Yeh, Y.-L.; Hou, T.-H.; Chang, W.-Y. An intelligent model for the classification of children’s occupational therapy problems. Expert Syst. Appl. 2012, 39, 5233–5242. [Google Scholar] [CrossRef]
  12. Chen, T.; Guestrin, C. XGBoost: A Scalable Tree Boosting System. In Proceedings of the Proceedings of the 22nd ACM SIGKDD International Conference on Knowledge Discovery and Data Mining, San Francisco, CA, USA, 13–17 August 2016; ACM: San Francisco, CA, USA, 2016; pp. 785–794. [Google Scholar] [CrossRef] [Green Version]
  13. Wang, Y.; Du, Z.; Lawrence, W.R.; Huang, Y.; Deng, Y.; Hao, Y. Predicting Hepatitis B Virus Infection Based on Health Examination Data of Community Population. IJERPH 2019, 16, 4842. [Google Scholar] [CrossRef] [Green Version]
  14. Liu, H.; Li, J.; Leng, J.; Wang, H.; Liu, J.; Li, W.; Liu, H.; Wang, S.; Ma, J.; Chan, J.C.; et al. Machine learning risk score for prediction of gestational diabetes in early pregnancy in Tianjin, China. Diabetes Metab. Res. Rev. 2020. [Google Scholar] [CrossRef]
  15. Alfian, G.; Syafrudin, M.; Rhee, J.; Anshari, M.; Mustakim, M.; Fahrurrozi, I. Blood Glucose Prediction Model for Type 1 Diabetes based on Extreme Gradient Boosting. IOP Conf. Ser. Mater. Sci. Eng. 2020, 803, 012012. [Google Scholar] [CrossRef]
  16. Lee, J.; Lim, J.-S.; Chu, Y.; Lee, C.H.; Ryu, O.-H.; Choi, H.H.; Park, Y.S.; Kim, C. Prediction of Coronary Artery Calcium Score Using Machine Learning in a Healthy Population. JPM 2020, 10, 96. [Google Scholar] [CrossRef]
  17. Fitriyani, N.L.; Syafrudin, M.; Alfian, G.; Rhee, J. HDPM: An Effective Heart Disease Prediction Model for a Clinical Decision Support System. IEEE Access 2020, 8, 133034–133050. [Google Scholar] [CrossRef]
  18. Tsai, C.-J. New feature selection and voting scheme to improve classification accuracy. Soft Comput 2019, 23, 12017–12030. [Google Scholar] [CrossRef]
  19. Panay, B.; Baloian, N.; Pino, J.A.; Peñafiel, S.; Sanson, H.; Bersano, N. Feature Selection for Health Care Costs Prediction Using Weighted Evidential Regression. Sensors 2020, 20, 4392. [Google Scholar] [CrossRef] [PubMed]
  20. Dash, M.; Liu, H. Feature selection for classification. Intell. Data Anal. 1997, 1, 131–156. [Google Scholar] [CrossRef]
  21. Aggarwal, C.C. (Ed.) Data Classification; Chapman and Hall/CRC: Boca Raton, FL, USA, 2014; ISBN 978-1-4665-8675-8. [Google Scholar] [CrossRef]
  22. Jain, D.; Singh, V. Feature selection and classification systems for chronic disease prediction: A review. Egypt. Inform. J. 2018, 19, 179–189. [Google Scholar] [CrossRef]
  23. Fitriyani, N.L.; Syafrudin, M.; Alfian, G.; Rhee, J. Development of Disease Prediction Model Based on Ensemble Learning Approach for Diabetes and Hypertension. IEEE Access 2019, 7, 144777–144789. [Google Scholar] [CrossRef]
  24. Vafaie, H.; De Jong, K. Genetic algorithms as a tool for feature selection in machine learning. In Proceedings of the Proceedings Fourth International Conference on Tools with Artificial Intelligence TAI ’92, Arlington, VA, USA, 10–13 November 1992; pp. 200–203. [Google Scholar] [CrossRef]
  25. Salcedo-Sanz, S.; Prado-Cumplido, M.; Pérez-Cruz, F.; Bousoño-Calzón, C. Feature Selection via Genetic Optimization. In Artificial Neural Networks—ICANN 2002; Dorronsoro, J.R., Ed.; Lecture Notes in Computer Science; Springer Berlin Heidelberg: Berlin/Heidelberg, Germany, 2002; Volume 2415, pp. 547–552. ISBN 978-3-540-44074-1. [Google Scholar] [CrossRef]
  26. Shon, D.; Im, K.; Park, J.-H.; Lim, D.-S.; Jang, B.; Kim, J.-M. Emotional Stress State Detection Using Genetic Algorithm-Based Feature Selection on EEG Signals. IJERPH 2018, 15, 2461. [Google Scholar] [CrossRef] [Green Version]
  27. Wutzl, B.; Leibnitz, K.; Rattay, F.; Kronbichler, M.; Murata, M.; Golaszewski, S.M. Genetic algorithms for feature selection when classifying severe chronic disorders of consciousness. PLoS ONE 2019, 14, e0219683. [Google Scholar] [CrossRef] [Green Version]
  28. García-Dominguez, A.; Galván-Tejada, C.E.; Zanella-Calzada, L.A.; Gamboa-Rosales, H.; Galván-Tejada, J.I.; Celaya-Padilla, J.M.; Luna-García, H.; Magallanes-Quintanar, R. Feature Selection Using Genetic Algorithms for the Generation of a Recognition and Classification of Children Activities Model Using Environmental Sound. Mob. Inf. Syst. 2020, 2020, 1–12. [Google Scholar] [CrossRef] [Green Version]
  29. Uzma, A.F.; Tubaishat, A.; Shah, B.; Halim, Z. Gene encoder: A feature selection technique through unsupervised deep learning-based clustering for large gene expression data. Neural. Comput. Appl. 2020. [Google Scholar] [CrossRef]
  30. Parisi, L.; RaviChandran, N. Evolutionary feature transformation to improve prognostic prediction of hepatitis. Knowl.-Based Syst. 2020, 200, 10601. [Google Scholar] [CrossRef]
  31. Shaban, W.M.; Rabie, A.H.; Saleh, A.I.; Abo-Elsoud, M.A. A new COVID-19 Patients Detection Strategy (CPDS) based on hybrid feature selection and enhanced KNN classifier. Knowl.-Based Syst. 2020, 205, 106270. [Google Scholar] [CrossRef] [PubMed]
  32. Qu, Y.; Lin, Z.; Li, H.; Zhang, X. Feature Recognition of Urban Road Traffic Accidents Based on GA-XGBoost in the Context of Big Data. IEEE Access 2019, 7, 170106–170115. [Google Scholar] [CrossRef]
  33. Demšar, J. Statistical Comparisons of Classifiers over Multiple Data Sets. J. Mach. Learn. Res. 2006, 7, 1–30. [Google Scholar]
  34. Taylor, T.; Altares Sarik, D.; Salyakina, D. Development and Validation of a Web-Based Pediatric Readmission Risk Assessment Tool. Hosp. Pediatrics 2020, 10, 246–256. [Google Scholar] [CrossRef]
  35. Yu, C.-S.; Lin, Y.-J.; Lin, C.-H.; Lin, S.-Y.; Wu, J.L.; Chang, S.-S. Development of an Online Health Care Assessment for Preventive Medicine: A Machine Learning Approach. J. Med. Internet. Res. 2020, 22, e18585. [Google Scholar] [CrossRef]
  36. Krebs, J.; Negatsch, V.; Berg, C.; Aigner, A.; Opitz-Welke, A.; Seidel, P.; Konrad, N.; Voulgaris, A. Applicability of two violence risk assessment tools in a psychiatric prison hospital population. Behav. Sci. Law 2020, bsl.2474. [Google Scholar] [CrossRef]
  37. Sansen, L.M.; Saupe, L.B.; Steidl, A.; Fegert, J.M.; Hoffmann, U.; Neuner, F. Development and randomized-controlled evaluation of a web-based training in evidence-based trauma therapy. Prof. Psychol. Res. Pract. 2020, 51, 115–124. [Google Scholar] [CrossRef]
  38. Blum, A.L.; Langley, P. Selection of relevant features and examples in machine learning. Artif. Intell. 1997, 97, 245–271. [Google Scholar] [CrossRef] [Green Version]
  39. Goldberg, D.E. Genetic Algorithms in Search, Optimization and Machine Learning, 1st ed.; Addison-Wesley Longman Publishing Co., Inc.: Boston, MA, USA, 1989; ISBN 0-201-15767-5. [Google Scholar]
  40. Sokolova, M.; Lapalme, G. A systematic analysis of performance measures for classification tasks. Inf. Process. Manag. 2009, 45, 427–437. [Google Scholar] [CrossRef]
  41. Pedregosa, F.; Varoquaux, G.; Gramfort, A.; Michel, V.; Thirion, B.; Grisel, O.; Blondel, M.; Prettenhofer, P.; Weiss, R.; Dubourg, V.; et al. Scikit-learn: Machine Learning in Python. J. Mach. Learn. Res. 2011, 12, 2825–2830. [Google Scholar]
  42. Friedman, M. The Use of Ranks to Avoid the Assumption of Normality Implicit in the Analysis of Variance. J. Am. Stat. Assoc. 1937, 32, 675–701. [Google Scholar] [CrossRef]
  43. Holm, S. A Simple Sequentially Rejective Multiple Test Procedure. Scand. J. Stat. 1979, 6, 65–70. [Google Scholar]
  44. Guyon, I.; Elisseeff, A. An Introduction to Feature Extraction. In Feature Extraction; Guyon, I., Nikravesh, M., Gunn, S., Zadeh, L.A., Eds.; Studies in Fuzziness and Soft Computing; Springer Berlin Heidelberg: Berlin/Heidelberg, Germany, 2006; Volume 207, pp. 1–25. ISBN 978-3-540-35487-1. [Google Scholar]
  45. Miao, J.; Niu, L. A Survey on Feature Selection. Procedia Comput. Sci. 2016, 91, 919–926. [Google Scholar] [CrossRef] [Green Version]
  46. Geurts, P.; Ernst, D.; Wehenkel, L. Extremely randomized trees. Mach. Learn. 2006, 63, 3–42. [Google Scholar] [CrossRef] [Green Version]
  47. Santos, M.S.; Soares, J.P.; Abreu, P.H.; Araujo, H.; Santos, J. Cross-Validation for Imbalanced Datasets: Avoiding Overoptimistic and Overfitting Approaches [Research Frontier]. IEEE Comput. Intell. Mag. 2018, 13, 59–76. [Google Scholar] [CrossRef]
Figure 1. The proposed genetic algorithms (GA) and extreme gradient boosting (XGBoost) for self-care prediction.
Mathematics 08 01590 g001
Figure 2. The flow-chart of genetic algorithms (GA)-based feature selection.
Mathematics 08 01590 g002
Figure 3. Impacts of genetic algorithms (GA)-based feature selection on the XGBoost model accuracy for dataset (a) I (multi-class), and (b) II (binary-class).
Mathematics 08 01590 g003
Figure 4. XGboost model accuracy with respect to population size (pop-size) for dataset (a) I (multi-class) and (b) II (binary-class).
Mathematics 08 01590 g004
Figure 5. Comparison analysis of several feature selection methods on the XGBoost model accuracy for dataset (a) I (multi-class), and (b) II (binary-class).
Mathematics 08 01590 g005
Figure 6. Self-care predication architecture framework.
Mathematics 08 01590 g006
Figure 7. Prototype of web-based self-care prediction: (a) menu page, (b) Binary-class diagnosis form and (c) its prediction result, (d) Multi-class diagnosis form and (e) its prediction result.
Mathematics 08 01590 g007
Table 1. Summary of existing works for self-care prediction of children with disabilities as compared to our proposed study.
StudyMethodFeature SelectionValidation MethodClassification TypeStatistical TestPractical Application
Zarchi et al., 2018 [4]ANNNo10-fold CVMulti-classNoNo
Islam et al., 2018 [5]KNNYes5-fold CVMulti-classNoNo
Liu et al., 2019 [6]NBYes10-fold CVMulti-classNoNo
Le and Baik, 2019 [7]SMOTE + XGBoostNo10-fold CVMulti-classNoNo
Souza et al., 2019 [8]FNNNok-fold *Binary-classNoNo
Akyol, 2020 [9]DNNNoHold-outMulti-classNoNo
Putatunda, 2020 [10]Hybrid autoencoderNo10-fold CVMulti-class,
Binary-class
NoNo
Our proposed studyGA + XGBoost Yes10-fold CVMulti-class,
Binary-class
Yes, with two-step statistical testYes
Notes: CV = cross-validation; * there was no clear number of k-fold used in the source paper.
Table 2. Self-care activity codes of the self-care activities based on ICF-CY (SCADI) dataset [4].
Self-CareNo.Activity DescriptionFeature CodeImpairment Extension Code
I. Washing oneself1Washing body partsd 51000, 1, 2, 3, 4, 8, 9
2Washing whole bodyd 5101
3Drying oneselfd 5102
II. Caring for body parts4Caring for skind 52000, 1, 2, 3, 4, 8, 9
5Caring for teethd 5201
6Caring for haird 5202
7Caring for fingernailsd 5203
8Caring for toenailsd 5204
9Caring for nosed 5205
III. Toileting10Indicating need for urinationd 530000, 1, 2, 3, 4, 8, 9
11Carrying out urination appropriatelyd 53001
12Indicating need for defecationd 53010
13Carrying out defecation appropriatelyd 53011
14Menstrual cared 5302
IV. Dressing15Putting clothesd 54000, 1, 2, 3, 4, 8, 9
16Taking off clothesd 5401
17Putting on footweard 5402
18Taking off footweard 5403
19Choosing appropriate clothingd 5404
V. Eating20Indicating need for eatingd 55000, 1, 2, 3, 4, 8, 9
21Carrying out eating appropriatelyd 5501
VI. Drinking22Indicating need for drinkingd 56000, 1, 2, 3, 4, 8, 9
23Carrying out feeding from bottled 5602
VII. Looking after one’s health24Ensuring one’s physical comfortd 57000, 1, 2, 3, 4, 8, 9
25Managing diet and fitnessd 5701
26Managing medications and following health adviced 57020
27Seeking advice or assistance from caregivers or professionalsd 57021
28Avoiding risks of abuse of drugs or alcohold 57022
VIII. Looking after one’s safety29Looking after one’s safetyd 5710, 1, 2, 3, 4, 8, 9
Notes: For extent of impairment, the meanings of the values are as follows. 0: no impairment, 1: mild impairment, 2: moderate impairment, 3: severe impairment, 4: complete impairment, 8: no specified, and 9: not applicable.
Table 3. The target class and description for each dataset used in this study.
DatasetTarget ClassDescription# of Subject
I (multi-class)1Unable to do caring for body parts2
2Unable to do toileting7
3Unable to do dressing1
4Unable to do washing and caring for body parts and dressing12
5Unable to do washing, caring for body parts, toileting, and dressing3
6Unable to do eating, drinking, washing, caring for body parts, toileting, and dressing29
7No issues16
II (binary-class)0No issues16
1Having self-care issues54
Table 4. Genetic algorithm parameters and its best selected features for each dataset used in this study.
DatasetGA Parameter# of FeatureBest Selected Feature
pop-sizecx-pbmt-pbn-genOriginal
(%)
Selected (%)
I
(multi-class)
1600.70.1930205 (100%)88 (42.93%)d 5100-3, d 5101-1, d 5101-2, d 5101-4, d 5101-8, d 5101-9, d 5102-0, d 5102-2, d 5102-4, d 5200-0, d 5200-1, d 5200-3, d 5200-4, d 5201-3, d 5201-8, d 5202-9, d 5203-9, d 5204-1, d 5204-4, d 5204-9, d 5205-0, d 5205-1, d 5205-3, d 5205-8, d 53000-1, d 53000-4, d 53000-8, d 53000-9, d 53001-0, d 53001-2, d 53001-3, d 53001-4, d 53001-9, d 53010-2, d 53010-4, d 53010-9, d 53011-3, d 53011-4, d 5302-4, d 5400-0, d 5400-1, d 5400-2, d 5400-8, d 5401-1, d 5401-3, d 5401-4, d 5401-8, d 5401-9, d 5402-0, d 5403-0, d 5403-2, d 5403-9, d 5404-0, d 5404-1, d 5404-4, d 5404-8, d 5404-9, d 5500-0, d 5500-2, d 5500-3, d 5500-4, d 5500-9, d 5501-8, d 5600-4, d 5600-9, d 5602-3, d 5602-4, d 5602-9, d 5700-0, d 5700-2, d 5700-3, d 5701-0, d 5701-1, d 5701-3, d 5701-4, d 5701-8, d 57020-2, d 57020-3, d 57020-4, d 57020-8, d 57021-2, d 57022-3, d 57022-8, d 57022-9, d 571-1, d 571-2, d 571-3, d 571-8
II
(binary-class)
1700.90.3630205 (100%)111 (54.15%)Gender, d 5100-0, d 5100-3, d 5100-4, d 5100-9, d 5101-0, d 5101-1, d 5101-2, d 5102-0, d 5102-8, d 5102-9, d 5200-0, d 5200-1, d 5200-2, d 5200-3, d 5200-4, d 5201-0, d 5201-1, d 5201-2, d 5201-3, d 5201-8, d 5202-2, d 5202-8, d 5203-1, d 5203-2, d 5203-3, d 5203-9, d 5204-0, d 5204-1, d 5204-2, d 5204-3, d 5204-9, d 5205-2, d 5205-3, d 5205-8, d 53000-1, d 53000-4, d 53000-8, d 53001-4, d 53001-9, d 53010-2, d 53010-4, d 53011-3, d 53011-4, d 5302-1, d 5302-2, d 5302-4, d 5400-0, d 5400-1, d 5400-9, d 5401-0, d 5401-3, d 5401-4, d 5401-8, d 5402-1, d 5402-2, d 5402-4, d 5402-8, d 5403-0, d 5403-1, d 5403-8, d 5403-9, d 5404-0, d 5404-3, d 5404-9, d 5500-8, d 5501-0, d 5501-1, d 5501-4, d 5501-8, d 5501-9, d 5600-0, d 5600-1, d 5600-2, d 5600-4, d 5600-8, d 5600-9, d 5602-0, d 5602-1, d 5602-3, d 5602-8, d 5602-9, d 5700-0, d 5700-4, d 5700-8, d 5700-9, d 5701-0, d 5701-2, d 5701-3, d 5701-4, d 5701-8, d 5701-9, d 57020-3, d 57020-8, d 57020-9, d 57021-2, d 57021-4, d 57021-5, d 57021-6, d 57022-0, d 57022-1, d 57022-2, d 57022-3, d 57022-4, d 57022-8, d 57022-9, d 571-0, d 571-3, d 571-4, d 571-8, d 571-9
Notes: pop-size = the number of populations; cx-pb = the crossover probability; mt-pb = the mutation probability; n-gen = the number of generations.
Table 5. Performance metrices for multi classification problem (dataset I).
MetricFormula
Average accuracy i = 1 l t p i + t n i t p i + f n i + f p i + t n i l
Precision M i = 1 l t p i t p i + f p i l
Recall M i = 1 l t p i t p i + f n i l
F 1   score M ( β 2 + 1 ) P r e c i s i o n M R e c a l l M   β 2 P r e c i s i o n M + R e c a l l M
Notes: t p i   ,   f p i   ,   f n i   ,   t n i   are true positive, false positive, false negative and true negative for class C i respectively. M indices represent macro-averaging.
Table 6. Performance metrices for binary classification problem (dataset II).
MetricFormula
Accuracy ( t p + t n ) / ( t p + f n + f p + t n )
Precision t p / ( t p + f p )
Recall t p / ( t p + f n )
F1 score ( β 2 + 1 )   t p ( β 2 + 1 )   t p + β 2 f n + f p
Notes: tp, fp, fn, and tn are true positive, false positive, false negative and true negative respectively.
Table 7. Performance comparison of several classification models for dataset I (multi-class).
MethodFeature Selection# of Features (%) Performance Metric (%)
AccuracyPrecisionRecallF1-Score
NBNone205 (100%)82.86 ± 10.6965.25 ± 22.3673.25 ± 18.1067.70 ± 20.35
LR78.57 ± 14.6463.08 ± 24.8170.58 ± 21.8865.31 ± 23.27
MLP82.86 ± 10.6967.58 ± 22.0874.00 ± 18.0369.13 ± 20.33
SVM74.29 ± 12.4553.92 ± 13.0763.08 ± 15.2157.23 ± 13.70
DT74.29 ± 20.0058.50 ± 21.7461.58 ± 22.0258.81 ± 22.10
RF82.86 ± 10.6967.83 ± 21.3174.08 ± 18.7169.31 ± 20.22
Proposed ModelGA88 (42.93%)90.00 ± 9.1579.92 ± 20.1884.75 ± 15.4381.21 ± 18.43
Notes: all performance metric values are in mean ± standard deviation (%).
Table 8. Performance comparison of several classification models for dataset II (binary-class).
MethodFeature Selection# of Features (%)Performance Metric (%)
AccuracyPrecisionRecallF1-Score
NBNone205 (100%)78.57 ± 17.2091.31 ± 11.1483.00 ± 19.7585.16 ± 12.48
LR90.00 ± 11.1693.81 ± 9.9495.00 ± 10.6793.61 ± 7.19
MLP88.57 ± 14.0093.81 ± 9.9493.33 ± 15.2892.27 ± 10.20
SVM88.57 ± 10.6987.86 ± 10.93100.00 ± 0.0093.17 ± 6.29
DT85.71 ± 12.7892.38 ± 9.9891.33 ± 15.5890.39 ± 9.47
RF90.00 ± 14.3695.48 ± 9.4393.33 ± 15.2893.18 ± 10.44
Proposed ModelGA111 (54.15%)98.57 ± 4.2998.33 ± 5.00100.00 ± 0.0099.09 ± 2.73
Notes: all performance metric values are in mean ± standard deviation (%).
Table 9. Friedman test results by utilizing the value of accuracy for all datasets.
MethodFriedman Rankp-Value
NB9.374.89 × 10−19
LR8.44
MLP7.92
SVM10.09
DT9.63
RF7.50
Proposed Model5.02
Table 10. Comparative results of all models using the Holm-based Friedman post-hoc test.
ComparisonPost-Hoc p-ValueSignificant?
Proposed vs. NB0.000055Yes
Proposed vs. LR0.001908Yes
Proposed vs. MLP0.007504Yes
Proposed vs. SVM0.000002Yes
Proposed vs. DT0.000021Yes
Proposed vs. RF0.012983Yes
Table 11. Comparison of the proposed model with the results from previous related works.
MethodYearFeature Selection# of Features (%)Validation MethodClassification TypeAccuracy (%)Statistical TestPractical Application
ANN [4]2018-205 (100%)10-fold CVMulti-class83.1NoNo
KNN [5]2018PCA53 (25.85%)5-fold CVMulti-class84.29NoNo
NB [6]2019IGRCFS12 (5.85%)10-fold CVMulti-class78.32NoNo
SMOTE + XGBoost [7]2019-31 (15.12%)10-fold CVMulti-class85.4NoNo
FNN [8]2019-205 (100%)k-fold *Binary-class85.11NoNo
DNN [9]2019-205 (100%)Hold-outMulti-class97.45NoNo
Hybrid autoencoder [10]2020-205 (100%)10-fold CVMulti-class84.29NoNo
Binary-class91.43
Proposed Model
(GA + XGBoost)
2020GA88 (42.93%)10-fold CVMulti-class90.00Yes, with two-step statistical testYes
111 (54.15%)Binary-class98.57
Notes: CV = cross-validation; * there was no clear number of k-fold used in the source paper.

