Generating Photomosaics with QR Code Capability

1
Department of Computer Science and Engineering, Yuan Ze University, Taoyuan City 32003, Taiwan
2
Department of Digital Media, School of Design Art, Xiamen University of Technology, Xiamen 361000, China
*
Author to whom correspondence should be addressed.
Mathematics 2020, 8(9), 1613; https://0-doi-org.brum.beds.ac.uk/10.3390/math8091613
Submission received: 5 August 2020
/
Revised: 15 September 2020
/
Accepted: 16 September 2020
/
Published: 18 September 2020
(This article belongs to the Special Issue Artificial Intelligence and Big Data Computing)
Abstract
:A photomosaic is an image with two layers of visual information, including an overarching image that can be seen from a distance and a matrix of individual tile images when examined closely. This paper presents a method for generating photomosaics with an additional layer of quick response code (QR code) information that can be accessed by typical QR code scanners in cell phones. The basic idea is to carefully classify the tile images in different categories and generate the photomosaic patches by referring to the properties of QR code modules. Three levels of construction methods for generating the proposed photomosaics in different image resolutions are proposed. The results show that the generated photomosaics have good visual quality and high robustness for decoding the QR code. The proposed method endows conventional photomosaics with the QR code capability. It extends photomosaics from exhibiting purely visual information to the linkage of multimedia data. Furthermore, it increases the feasibility and potential of applying photomosaics in diverse applications, such as activity promotions or commercial product advertisements.
1. Introduction
A photomosaic is a kind of image decorative art that was first introduced by Silver [1] in 1997. A typical photomosaic conveys two layers of visual information to viewers. When a photomosaic is viewed at a close distance, a matrix of individual tile images can be clearly seen; when the photomosaic is looked at from a far distance, an overarching image can be perceived. A photomosaic is an image which is assembled from many smaller images called tiles. In a conventional photomosaic-generating scheme, a theme image is selected as the reference master image, and usually a large quantity of candidate images are prepared to be the tile images. The master image is divided into several non-overlapping blocks, and each block is replaced by a representative tile image which was searched from the tile image database. The representative tile image usually has similar color and texture properties with the replaced block. When looked at from a distance, the obtained photomosaic stitched up by the tile image grids looks like the reference master image.
The basic idea of the conventional photomosaic generation method mentioned above is simple and easy to implement. However, it is a challenging work to create a photomosaic with high visual quality. Many candidate tile images should be prepared and the computational time is not trivial. Many studies [2,3,4] have been devoted to the construction of photomosaics with high visual quality and lower computational complexity. In [2], Di Blasi and Petralia provided a fast method for searching the best representative tiles. The method accelerates the photomosaic generation speed by utilizing the Antipole clustering strategy to organize the tile images in the data structure of Antipole Tree. In [3], Choi et al. presented a genetic feature selection method for building an optimized subset of tile images to minimize the memory requirement and to accelerate the pattern-matching process. The method can render the photomosaic with fast speed for real-time applications. In [4] Fujisawa et al. developed a photomosaic generation method with fast-speed by utilizing the computational power of graphics processing units (GPUs), and an interactive photomosaic system that allows users to dynamically alter the content of the photomosaic is demonstrated.
With respect to exhibiting photomosaics in different art styles, the jigsaw image mosaicking technique was introduced by Kim and Pellacini [5], where images with arbitrary shapes are selected as the tiles to compose the final mosaic work. In [6], Di Blasi et al. proposed the puzzle image mosaics, which is an improvement version of the jigsaw image mosaic. In [7], Orchard and Kaplan proposed a cut-out image mosaic with high-quality photomosaics. The method was done by selecting arbitrarily shaped image parts to assemble the final mosaic. In [8], Park et al. presented a method to construct the photomosaic using multi-layer rotated objects called the stack mosaic. The method allows the artist to use a relatively small image database to produce photomosaics without degrading the quality of the generated photomosaic work. In [9], the stackable mosaic technique was extended to mobile devices by Kang et al. The method reduces the computational time by employing only two layers of objects to construct the photomosaic and optimizing the database of objects. In [10], D’Souza et al. applied a single portrait photo to present a self-referential animating photomosaic. The method takes the portrait photo to serve as both the target image and the tile images. The genetic algorithm is applied to search for the best tile image iteratively, which improves the quality of the resulting photomosaic gradually. In [11], a photomosaic generating method applying a redundant tile removal process and a color adjustment procedure is proposed, where photomosaics with high visual similarity to the master image can be obtained with an acceptable computational time. A method for generating photomosaics using photos belonging to users’ social networking is proposed by Seo and Kang [12]. In this method the best tile selection process considers not only the image quality but also the social context. They reported that photomosaics composed of familiar photos are more satisfying to the viewers. Some other photomosaic generating methods were studied and proposed in [13,14,15,16].
Most of the photomosaic-generating methods reported in the literature exhibit only a layer of visual information. The paper in [17] extends photomosaics to include an additional layer of message—a quick response code (QR code). To the best our knowledge, this is the first research for conveying QR codes on photomosaic art. It extends photomosaics from two-layer information to a new three-layer decorative art, and transforms photomosaics from pure visual information to multimedia content. This paper is an extension of our conference paper in reference [17]. The improvements of the paper compare to the conference version include: (a) the introductions to QR code structure and the Fast Library for Approximate Nearest Neighbors (FLANN) are added in Section 2; (b) three construction levels for generating photomosaics with different image resolutions are designed in this paper, while only a photomosaic-generating version is presented in the conference paper; (c) performance evaluation data include time to generate the photomosaics and QR code decoding rates are added in the paper.
2. Related Techniques
This section introduces related techniques used in the proposed scheme, including (A) basic photomosaic generation procedure, (B) the QR code, and (C) the FLANN.
2.1. Basic Photomosaic-Generation Procedure
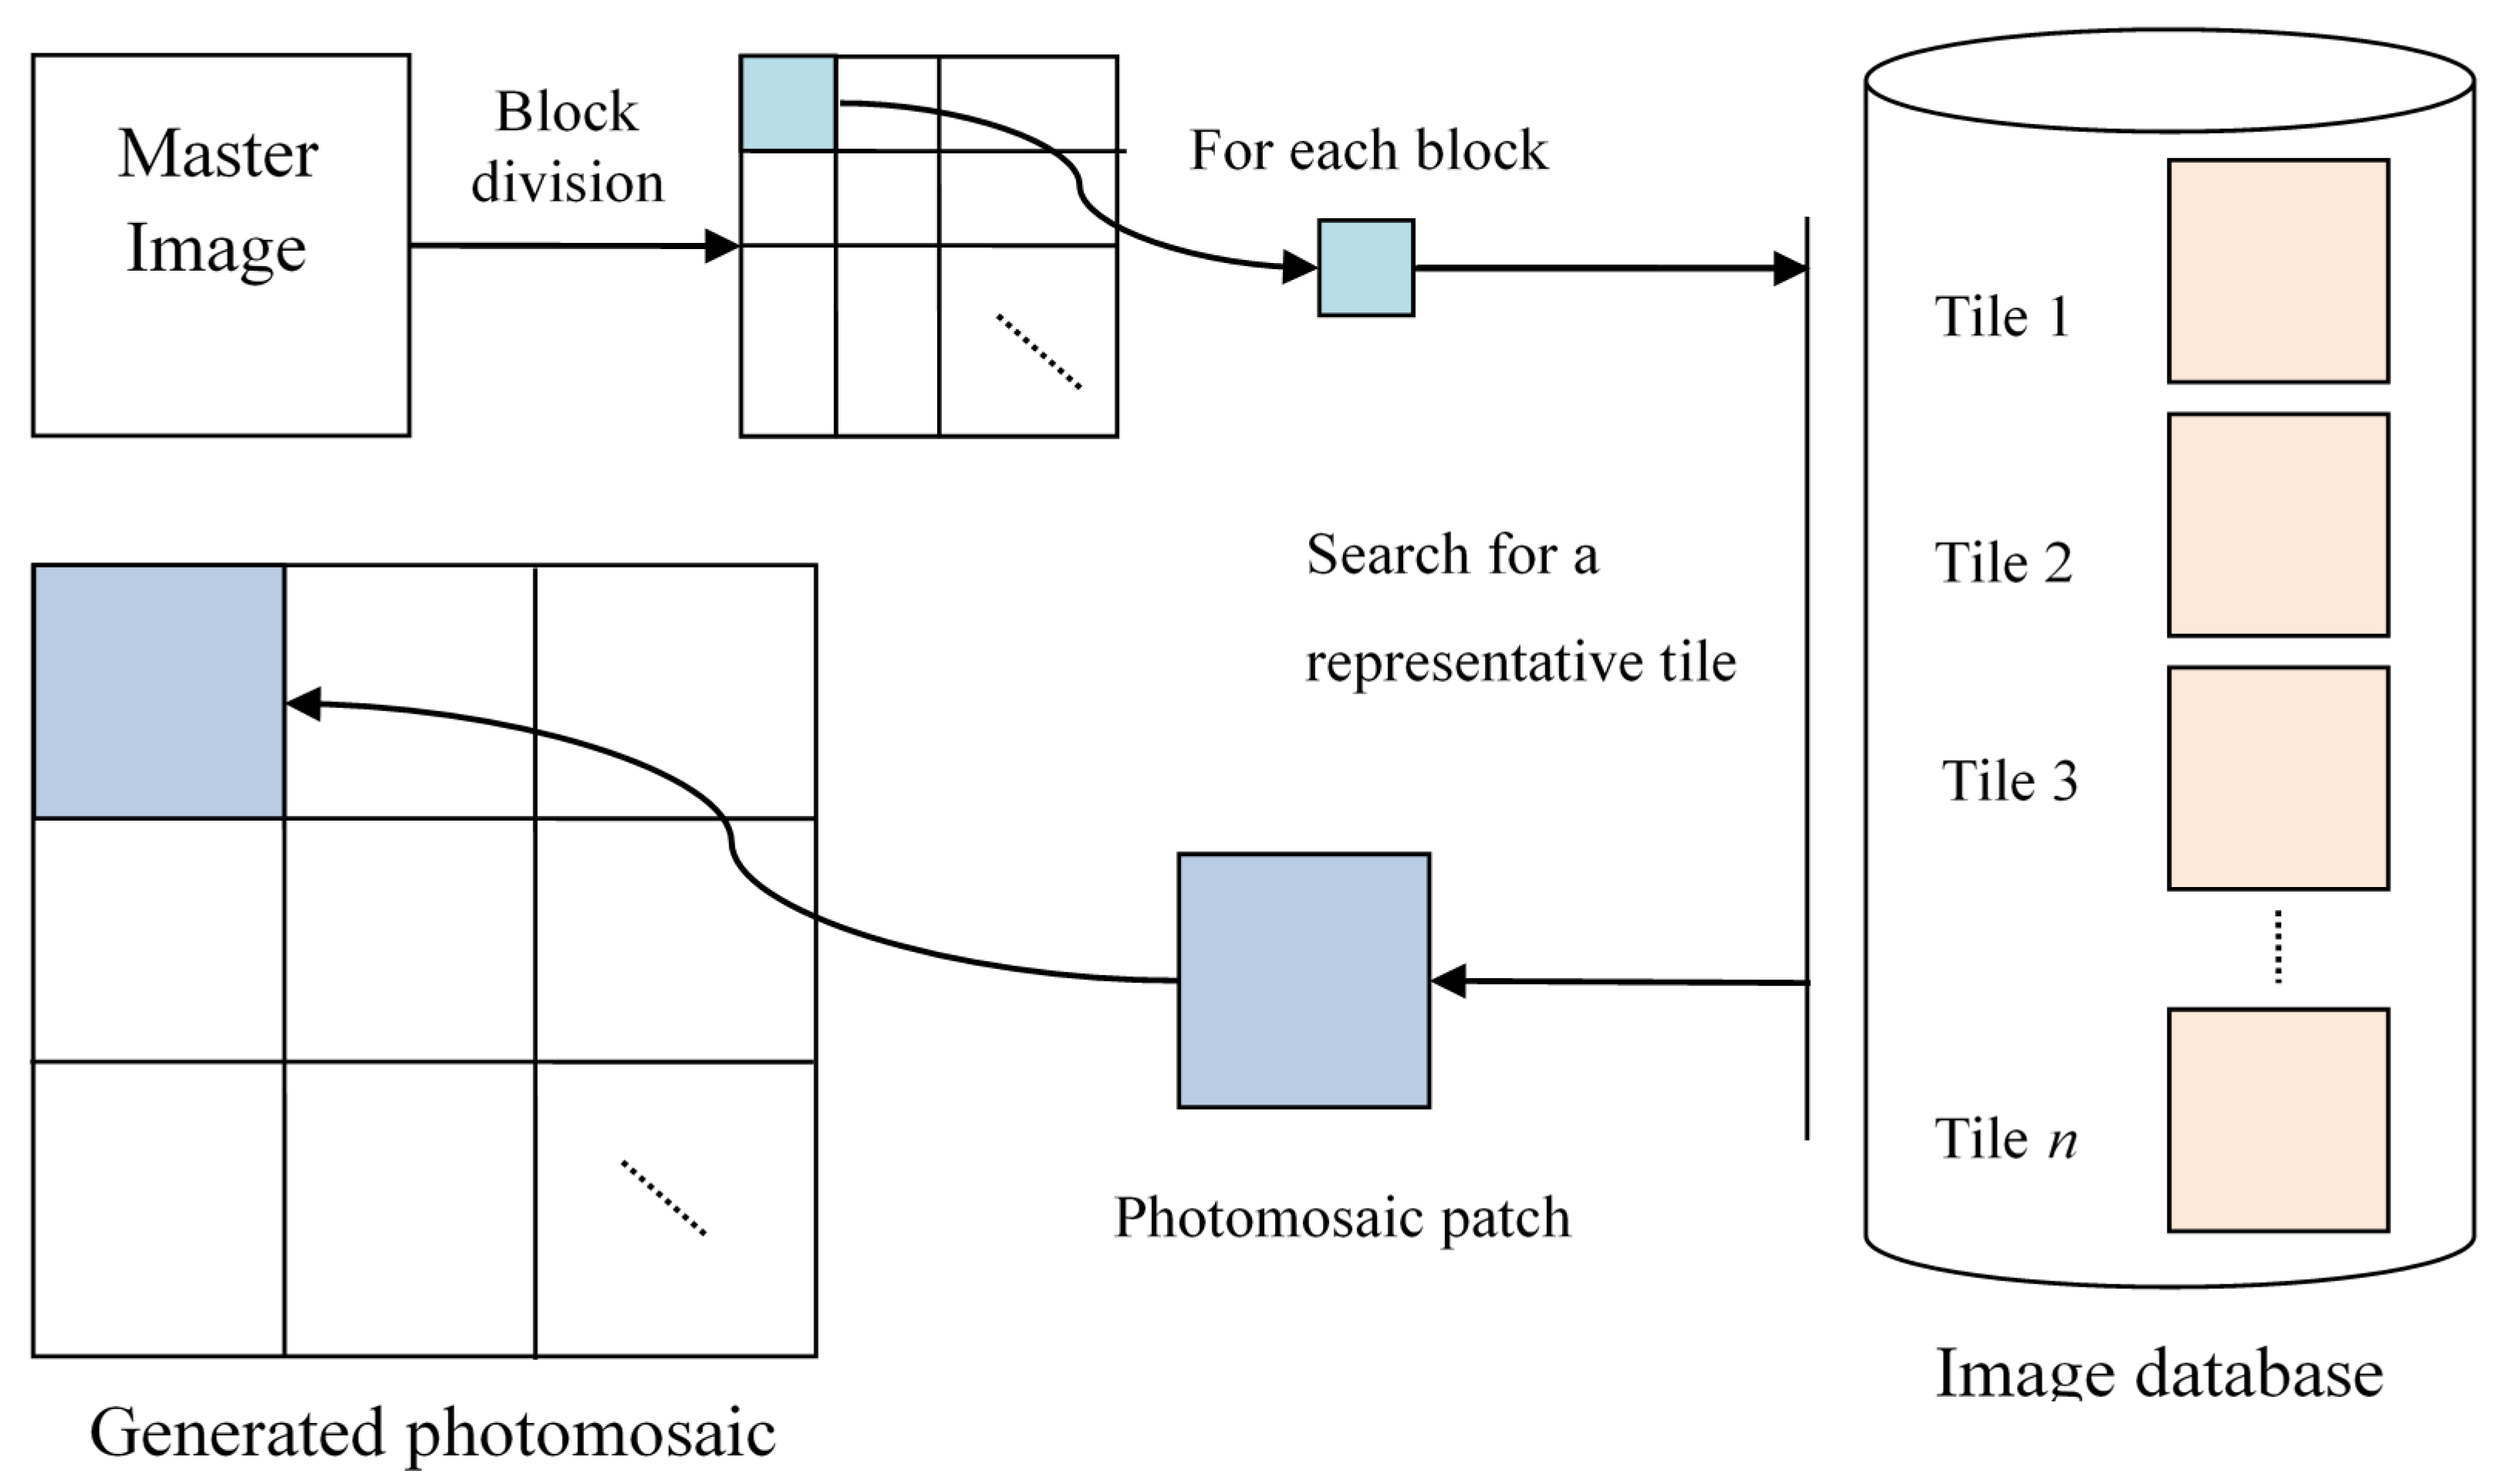
The basic procedure of constructing a photomosaic replaces each block of the master image with a visually similar tile image that is selected from the candidate tile images. The procedure is illustrated in Figure 1 and can be summarized in the following steps.
Procedure of generating conventional photomosaic
Input: a master image, a set of n tile images
Output: a photomosaic
- (1)
- Divide the master image into multiple blocks with the same size.
- (2)
- Fetch a block not yet processed from the master image in scan order (i.e., from top to bottom and from left to right), and search for a best representative title image for the block from the image database.
- (3)
- Replace the current block with the representative tile image obtained in Step 2.
- (4)
- Repeat steps 2 and 3 until all the image blocks on the master image are replaced by tile image patches. The photomosaic is generated.
2.2. The Quick Response (QR) Code
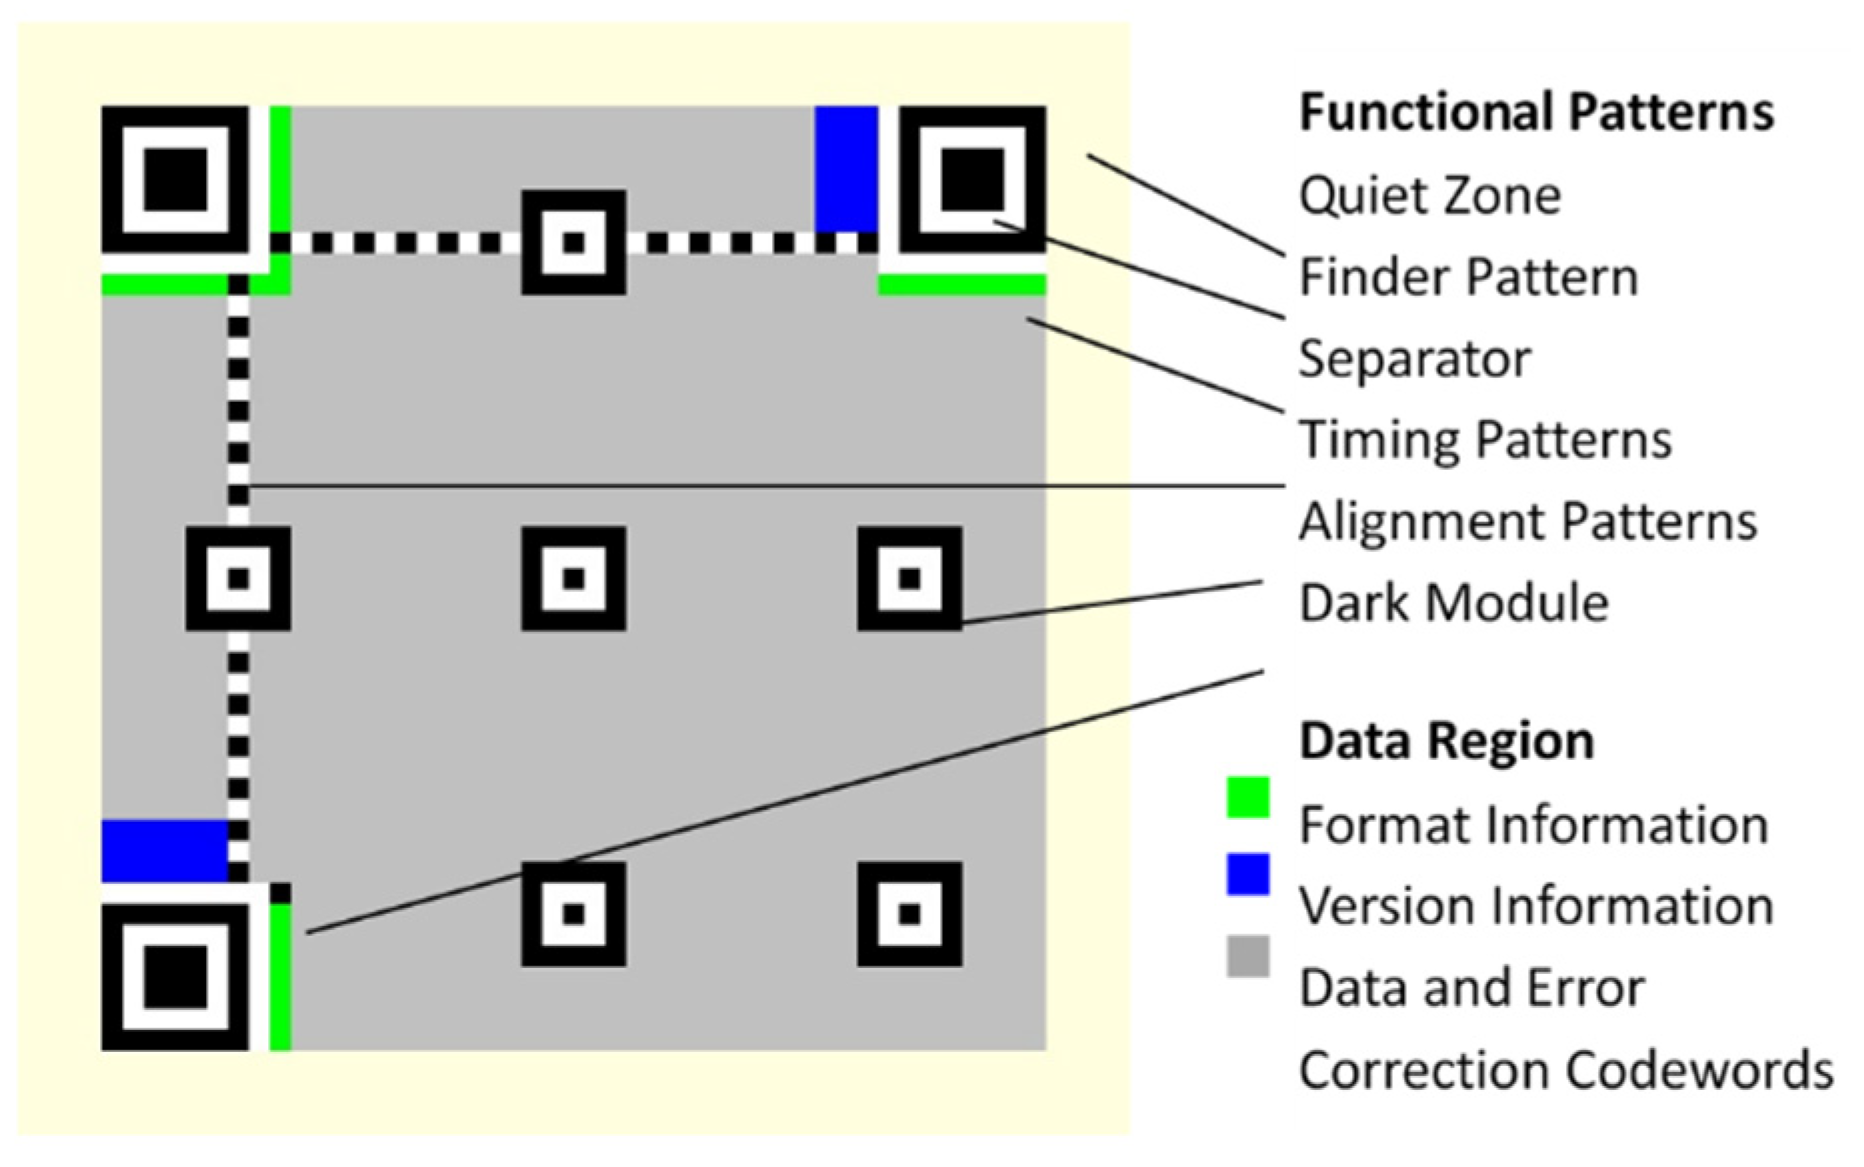
The QR code [18] is now the most frequently used two-dimensional barcode in the world. It is a 2-D matrix of dark and light elements called “modules”. Each dark (or black) and light (or white) module represents a 1 and 0, thus making it machine-intelligible. The structure of a typical QR code is illustrated in Figure 2. It consists of functional patterns that are easily read and the encoding region where the actual data is stored. The functional patterns include finder patterns, the separators, the timing patterns, the alignment patterns and the quiet zone surrounding the QR code. The encoding region contains data that was encoded by the Reed–Solomon error correction code to archive high robustness.
The size of a QR code is determined by its version number. A QR code of version V, V = 1, 2, …, 40, contains (17 + 4 V) × (17 + 4 V) modules. There are four levels of error correction capabilities. L, M, Q and H support up to 7%, 15%, 25% and 30% recovery capability, respectively, for lost or damaged data. There is no standard method for determining dark modules and/or light modules in the QR code specification. However, most commercial QR code readers [19,20] evaluate the average luminance of one-third of the center region of a module to determine its type.
2.3. The Fast Library for Approximate Nearest Neighbors (FLANN)
The finding of nearest neighbor matches for training data with high dimension vectors is one of the key problems in many computer and machine-learning applications. To obtain high accuracy of matching result, it usually requires expansive computational time and a large training data set. According to Muja and Lowe’s study [21], the randomized k-d tree forest and the priority search k-means tree are found to be the two most efficient algorithms for matching high-dimensional features. They presented an algorithm that can efficiently match a large number of binary features by searching multiple hierarchical clustering trees.
The result of research [21] has been proved very efficient, and the program was written as an open source library called the FLANN [22]. Due to its high performance, the FLANN has been incorporated into the OpenCV open source computer and machine learning software library. It is now one of the most popular libraries for nearest neighbor matching, and is widely used in many computer vision applications. The FLANN contains a collection of algorithms for the nearest neighbor search, and a system that can automatically choose the best algorithm and optimal parameters depending on the given dataset. In this study, we adopt FLANN to perform the best representative tile searching procedure in the proposed photomosaic-generating scheme.
3. The Proposed Photomosaic-Generation Scheme
In a conventional photomosaic-generation scheme, the photomosaic is usually generated with the two layers of visual information: (1) from a far view, an overarching image similar to the master image can be perceived, and (2) at close range, a matrix of individual tile images can clearly be seen. In this study, we will endow the generated photomosaic with a third layer of information—a QR code can be read from the photomosaic using a typical QR code scanner on a cell phone.
Photomosaics are often created by artists to express themes for their creative ideas. In most cases, the content of the tile images are required to remain as accessible as the original without any change. To create a photomosaic with high artistic quality, the photomosaic in this study is generated under the following two constraints: (1) the original tile images are applied to stitch up the photomosaic without any modification to the colors; and (2) every two tiles on the photomosaic are different, i.e., each tile image will be selected at most once to generate a photomosaic.
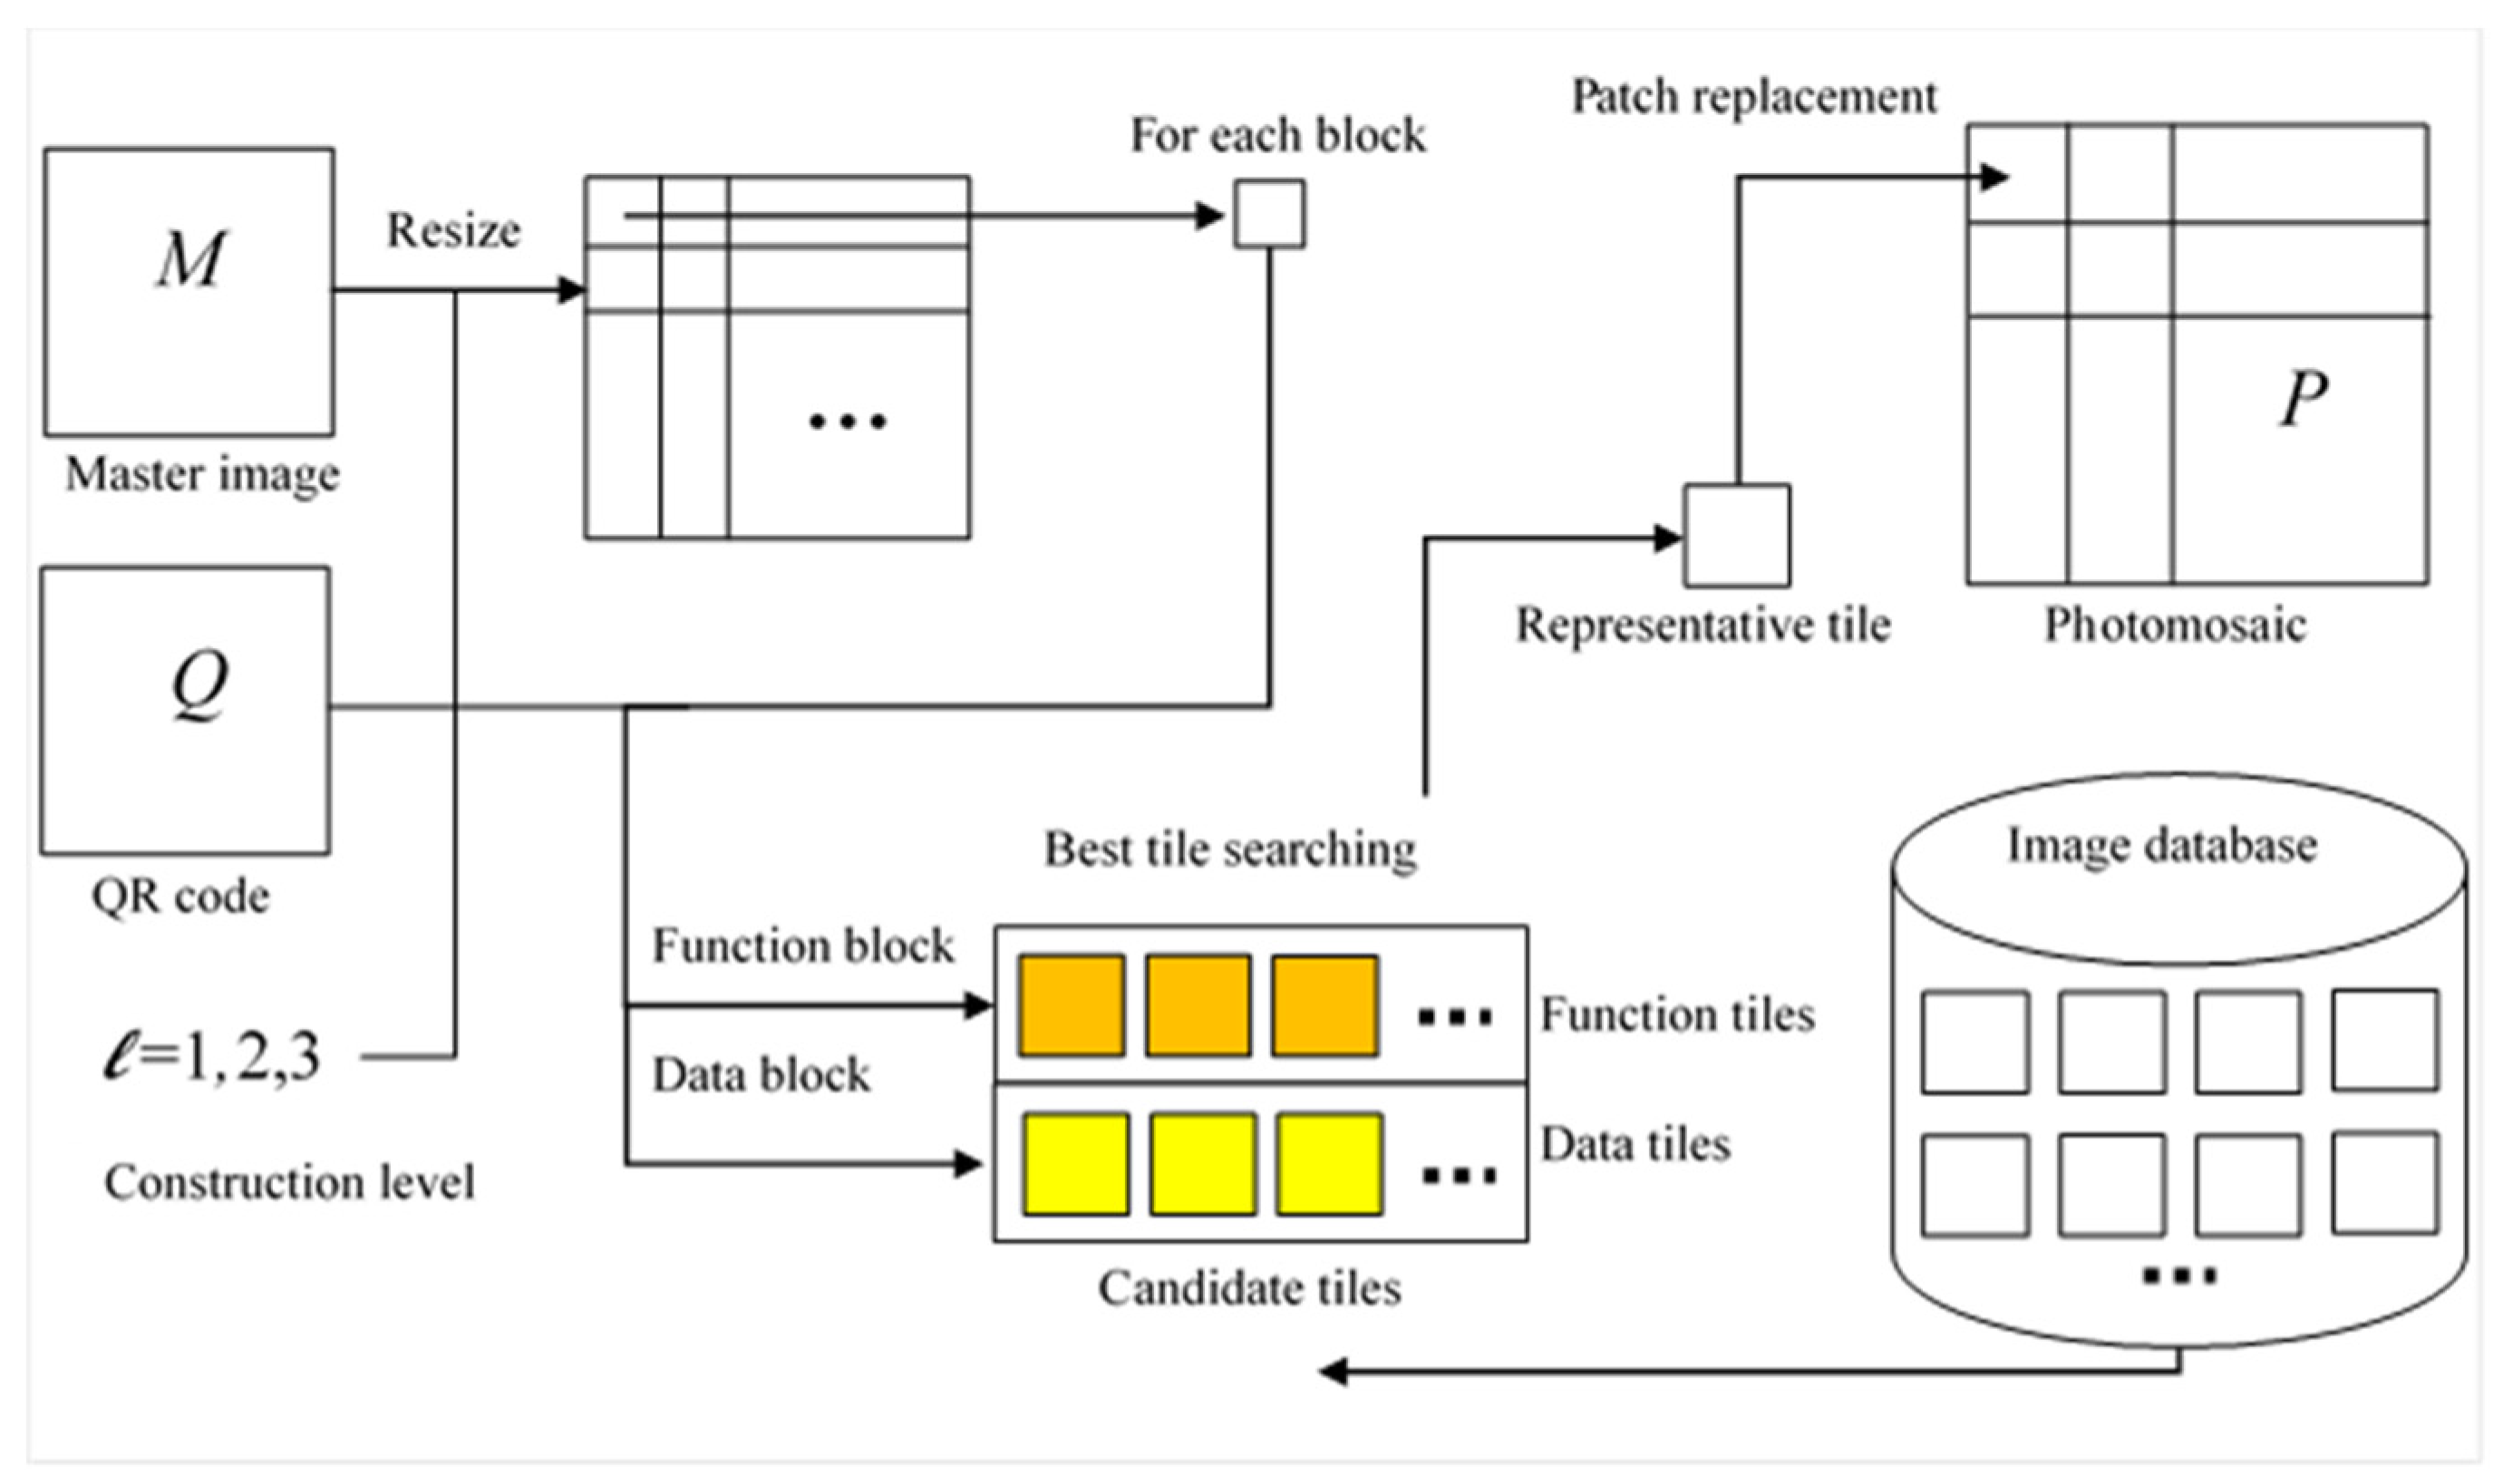
Figure 3 is the flowchart of the proposed photomosaic generation scheme. In the proposed method, the input data include a reference master image denoted by M, a set of z tile images denoted by {t1,t2,…,tz}, and a version-v QR code denoted by Q. The output is the generated photomosaic denoted by P.
The photomosaic-generating procedure of the proposed scheme is similar to that performed in the procedure of creating conventional photomosaics described in Section 2. However, some modifications are made in order to endow the generated photomosaic with the QR code content.
- (a)
- An image resizing step is performed to resample the master image M into a square image with an appropriate side length. Additionally, a mapping relationship between blocks of the master image and the modules of the QR code is established, which ensures that all of the QR code modules are exactly encoded on the photomosaic.
- (b)
- A block classification rule is designed to classify the blocks of the resized master image into different categories, where blocks in the same category require tiles with similar color distributions. The classification rule is based on the relative location of a block on the QR code and the position of the block within a QR code module.
- (c)
- A tiles sifting process is designed to select appropriate tile image sets (one set for a block type) from the image database.
- (d)
- The best representative tile-searching algorithm is designed by considering the property of its corresponding QR code module that correctly encodes the QR code on the generated photomosaic.
The procedure of the photomosaic with the QR code generating procedure is summarized below.
Procedure of generating photomosaics with QR code capability
Input: a master image M, a set of z tile images {t1,t2,…,tz}, a QR code Q with version V, the construction level l, and the block length b.
Output: a photomosaic P
- (1)
- Scale M to a square image M’ with side length d that is calculated using the following Equation.The side length d of the scaled image is derived according to the QR code version V, the construction level l, and the size (b × b pixels) of a tile image. (17 + 4V) is the module number on each side of a version-V QR code specified in QR code standard, and each QR code module is drawn on a square of (l × b) × (l × b) pixels that comprises l × l tile images.
- (2)
- Divide M’ into l × l × n non-overlapping blocks in which each block has size b × b, where n = (17 + 4V) × (17 + 4V) is the number of modules on Q. Given the structure of the QR code as shown in Figure 2, and according to the position of a block on M’ in proportion to its corresponding module on Q, the blocks of M’ are classified in two categories: (a) functional blocks, and (b) data blocks. Functional blocks are image blocks located in the area of functional patterns, and data blocks are image blocks located in the area of encoding region.
- (3)
- Fetch a not-processed-yet block from M’ in scan order, and perform one of the following sub-steps according to the category of the current block and the color of the corresponding QR code module.
- (a)
- If the current block is a functional block and the corresponding QR code module on Q is white, we search for a representative tile from the candidate tiles set . Similarly, if the current block is a functional block and the corresponding QR code module on Q is black, we search for a representative tile from the candidate tiles set . and are the candidate tile sets for white functional blocks and black functional blocks, respectively. The following equations are applied to select and from tile images in the database:In Equation (2), I(tj) (0 ≤ I(tj) ≤ 1.0) represents the averaged luminance of tile tj, and threshold δ is used to control the robustness property of the generated QR code.
- (b)
- If the current block is a data block, check the type c of the current block and search for a best representative tile from the candidate tile images set associated with block type c in construction level l. The block-type classification method and the candidate tile-sifting process for each construction level are given in the subsequent sections.
- (4)
- Replace the current block with the representative tile image obtained in Step 3.
- (5)
- Repeat steps 3 and 4 until all the image blocks on M’ are replaced by tile image patches. Photomosaic P is generated.
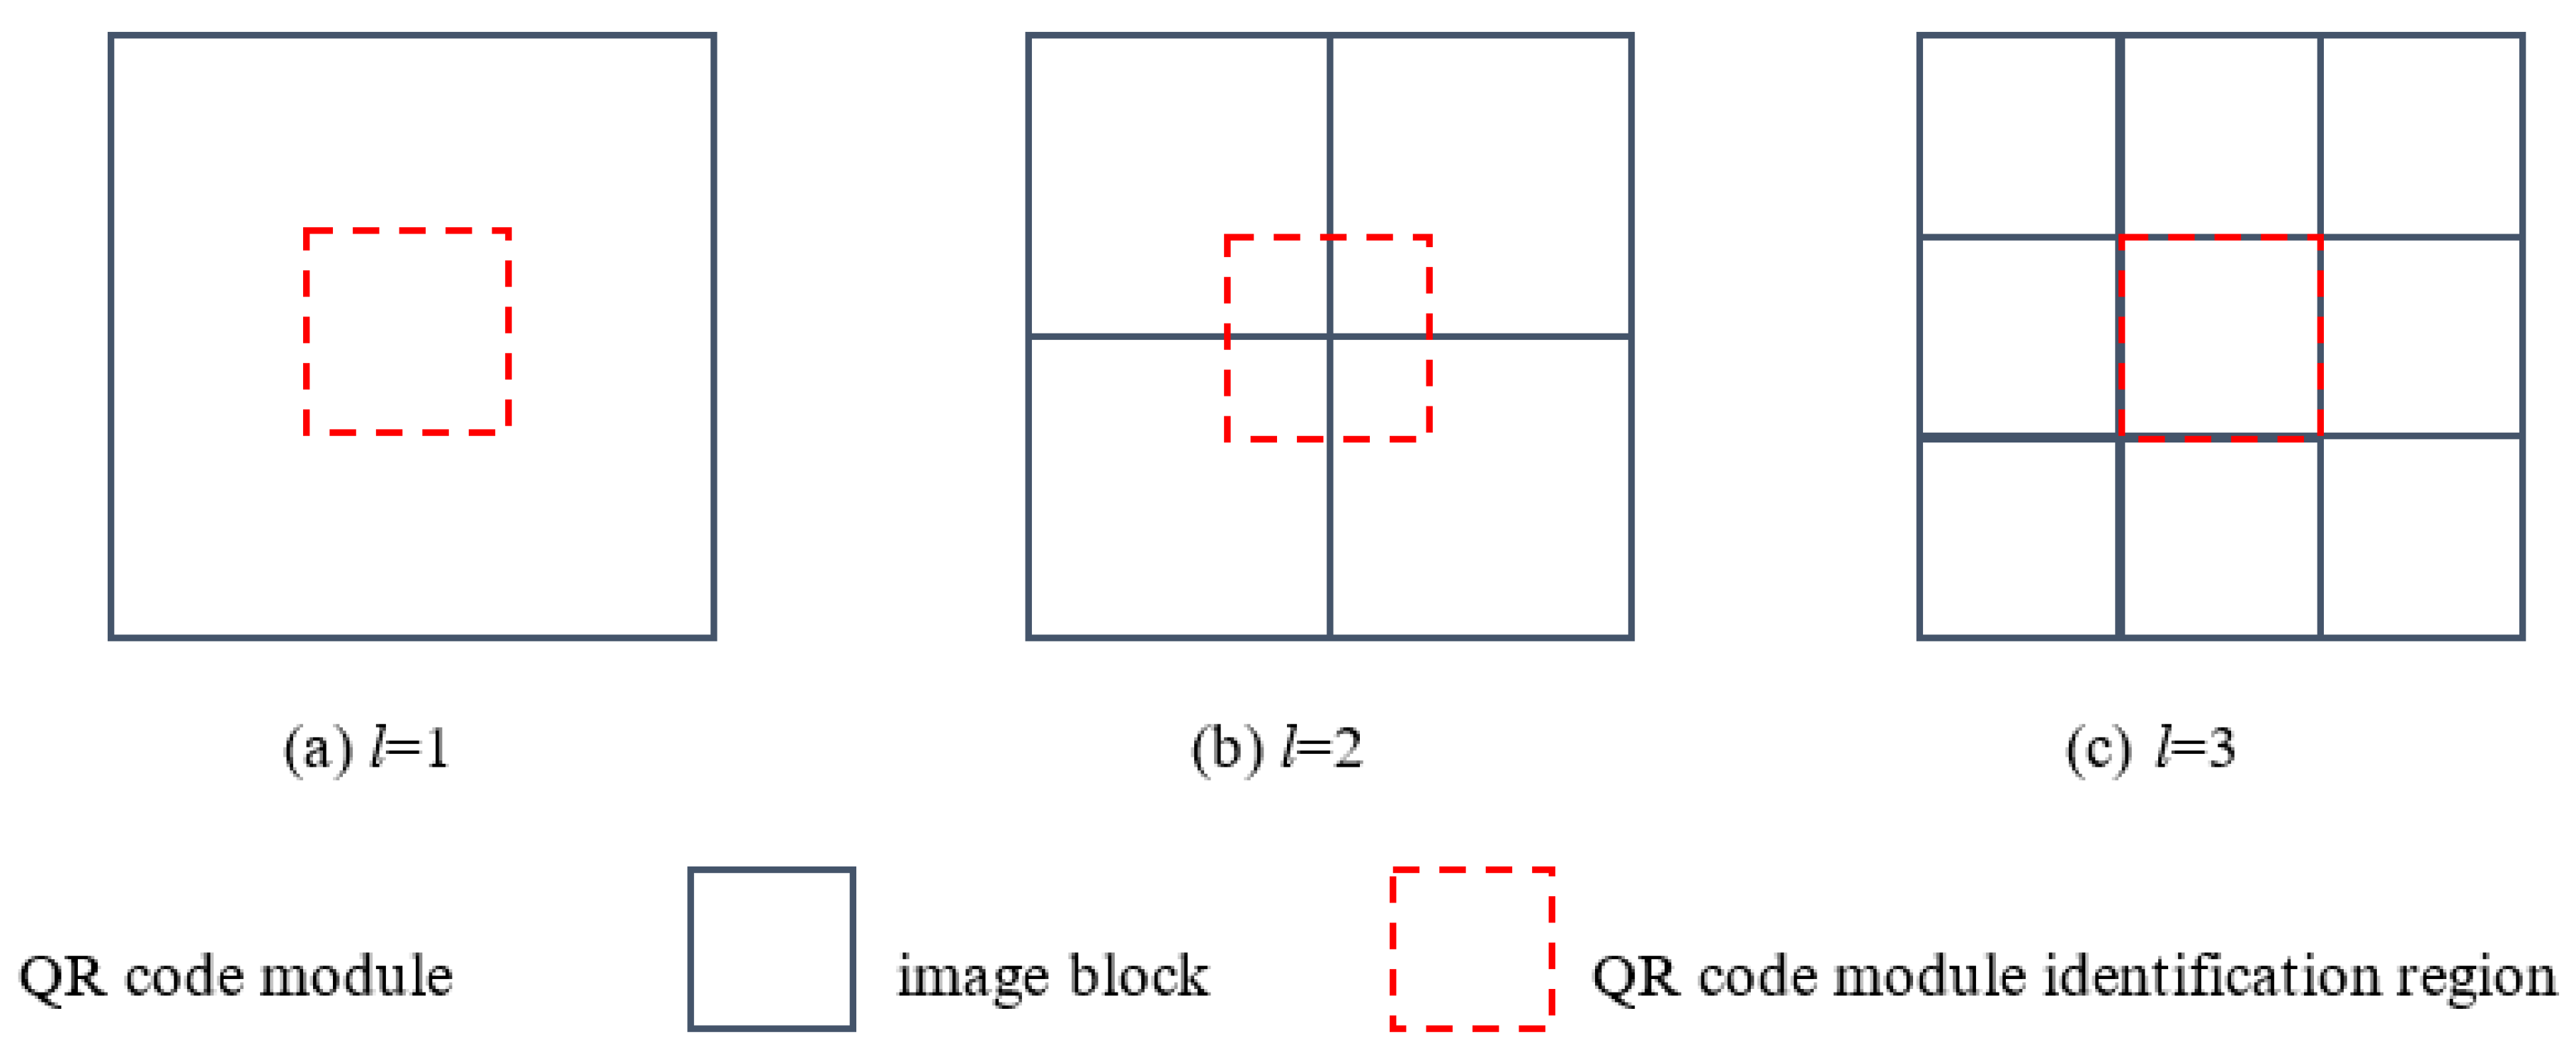
Three construction levels (l = 1, 2, 3) for generating photomosaics with different image resolutions are designed. In the construction method of level-l as shown in Figure 4, each QR code module is encoded in l × l tile(s) on the generated photomosaic. The block classification method and candidate tile-sifting process in each construction level are given below.
3.1. Candidate Tile-Sifting Process of Construction Level-1
In level-1 construction method, the data blocks and the QR code modules have one-to-one mapping relationship as illustrated in Figure 4a. In this case, the type of a data block is defined by the corresponding QR code module. That is, a white data block maps to a white QR code module, and a black data block maps to a black QR code module.
For a white data block (c = 0), we search for a representative tile from the candidate tiles set . Similarly, for a black data block (c = 1), we search for a representative tile from the candidate tile set . The candidate tiles of and are selected from the images in the database using the following Equations:
In Equation (3) is the averaged luminance of the one-third center area (the red rectangle area in Figure 4a) of tile t, where and is the threshold value for controlling the robustness.
3.2. Candidate Tile-Sifting Process of Construction Level-2
In level-2 construction method, a QR code module is mapped to four data blocks as illustrated in Figure 4b. According to their relative positions mapped on the QR code module, the data blocks are classified into four types c = {BLT, BRT, BLB, BRB}. In this case, the tile images with averaged brightness in the opposite corner that belong to the type of destination QR code module are selected as the candidate tile set. For examples, is the candidate tile set for blocks with type BLT that are mapped to a white QR code module that contains tiles whose averaged luminance of its bottom right one-third rectangular area is white, and is the candidate tile set for blocks with type BLT that are mapped to a white QR code module that contains tiles whose averaged luminance of its bottom right one-third rectangular area is black. The tile image sets are selected from the image database using the following Equations:
In Equation (4) the threshold is a robustness parameter, and represents the averaged luminance of one-third rectangle at the bottom right of the block. The methods for selecting candidate tile images for block types BRT, BLB, and BRB are expressed in Equations (5)–(7).
3.3. Candidate Tile-Sifting Process of Construction Level-3
In level-3 construction method, a module of the QR code is mapped to eight data blocks as illustrated in Figure 4c. The data blocks are classified into two types denoted by c = {Binner, Bouter} according to their relative positions mapped on the QR code module. The data block in the centroid has type Binner, and the eight blocks located at the boundary have type Bouter. The candidate tiles for data block type Bouter are all of the tile images in the database:
The tile sets and are selected from the image database to sift appropriate candidate tiles for center blocks with corresponding white QR code modules and with corresponding black QR code modules, respectively. This process uses the following rules:
In Equation (9) I(tj) is the mean luminance of all the pixels of tile tj, and is set to the same threshold depicted in Equation (2).
In the level-l (l = 1, 2, 3) photomosaic construction method, a module of the QR code is replaced using l × l tiles, and the one-third center region of the square composed of the l × l tiles is maintained to possess the same luminance class (0 or 1) of the QR code module. In most of the commercial QR code readers [18,19], the decoding of a QR code module depends on the luminance of the centroid one-third region of a module. Our method follows the decoding implementation adopted in functional QR code readers, which provides good robustness for decoding the QR code.
3.4. Representative Block-Searching Procedure
In the proposed method, each image block of the resized master image is assigned to a specific block type. The set of candidate images associated with this block is selected from the image database using the aforementioned candidate image sifting procedures.
Without the loss of generality, the best representative tile searching procedure can be formalized in the following problem:
Take block B with the size of b × b pixels and a set of n candidate tile images {t1, t2, …, tn } in which each tile image has size k × k pixels. Search for the best tile such that
where dist(B, tj) is the distance between B and tile tj.
Smaller block size b generates photomosaics with better visual quality; however, more computation time is needed and photomosaics with larger size is generated. Note that the size of block B is not equal to the size of tile tj, j = 1,2,…,n. B has b × b pixels and tj has k × k pixels. To compute the distance between block B and tile tj, B is divided into 4 × 4 equal-sized sub-blocks, and each sub-block is represented by its average color. The feature vector of B is represented by its 16 averaged pixels as , i = 1, 2, …, 16. Similarly, tj is also divided into 4 × 4 equaled-size sub-blocks, and each sub-block is represented by its average color. The feature vector of tj is also represented by its 16 average pixels as , i = 1, 2, …, 16.
The following Equation is applied to evaluate the distance between block B and tile tj:
where and are the respective channel colors of block B and tile tj in the L*a*b* color space. The parameter β is a weight that controls the influence of the luminance value and the chromatic values in tile selection. Its value is empirically set as 0.2 to obtain a good compromise between them. The color values of all channels are normalized to the range [0, 1.0). Theoretically, each term of , , and has maximum value 1.0 and minimum value 0. In can easily be calculated that the maximum value of is 35.2, and the minimum value of is 0.
For each set of candidate tile images, a randomized KD-tree is built using the functions provided in FLANN [22]. Each point node is a tile image represented by its 48-dimensional feature vector, and it includes 16 representative averaged pixels in which each pixel has the three channel values of L*, a*, and b*. The library provides an efficient mechanism for searching for the best representative tile from a large set of tile images.
4. Experimental Results
In the proposed tile-sifting process, only tile images with qualified luminance conditions are selected as candidate tile images. The proposed QR code generation procedure replaces a white QR code module with a 0-type tile image, and replaces a black QR code module with a 1-type tile image. It assures that the QR code exhibited on the generated photomosaic is exactly the same with the input QR code. Theoretically, the content of QR code can be captured and correctly be decoded from the photomosaic by the threshold for discriminating between a black module and a white module. However, the external lighting condition in the environment where a photomosaic is displayed will influence the decoding to the content of the QR code. To make the QR code robust and easily captured and decoded, we designed a procedure to select proper thresholds for sifting the candidate tile images. Furthermore, experiments were conducted to test the QR code decoding capability.
The test program was written using the C# programming language. The ZXing barcode image processing library [23] was applied to generate the QR code, and the EmguCV image processing library [24] was applied to perform image operations. The program ran on a personal computer (Intel Core i7-3770 CPU with 3.40 GHz and 16GB RAM). The 2010-MIRFLICKR-1M database has 1,000,000 Flickr images under the Creative Commons license. It was downloaded from [25] and each image was resized to 128 × 128 pixels using the image resizing method in [26] for the candidate tile images.
Next, we selected the appropriate thresholds for δ, , , and in Equations (2) to (9). We used two cell phones, including a Samsung S3 cell phone and an iPhone 6s cell phone. Two QR code scanners were installed in each phone, as summarized in Table 1. These devices and scanners were applied to capture the photomosaics and test the QR code decoding accuracy. A user was asked to move his/her cell phone to scan the photomosaic. If the message of the QR code could be decoded correctly by the QR reader within 10 s, it was defined as a success case; otherwise, it was defined as a failure case.
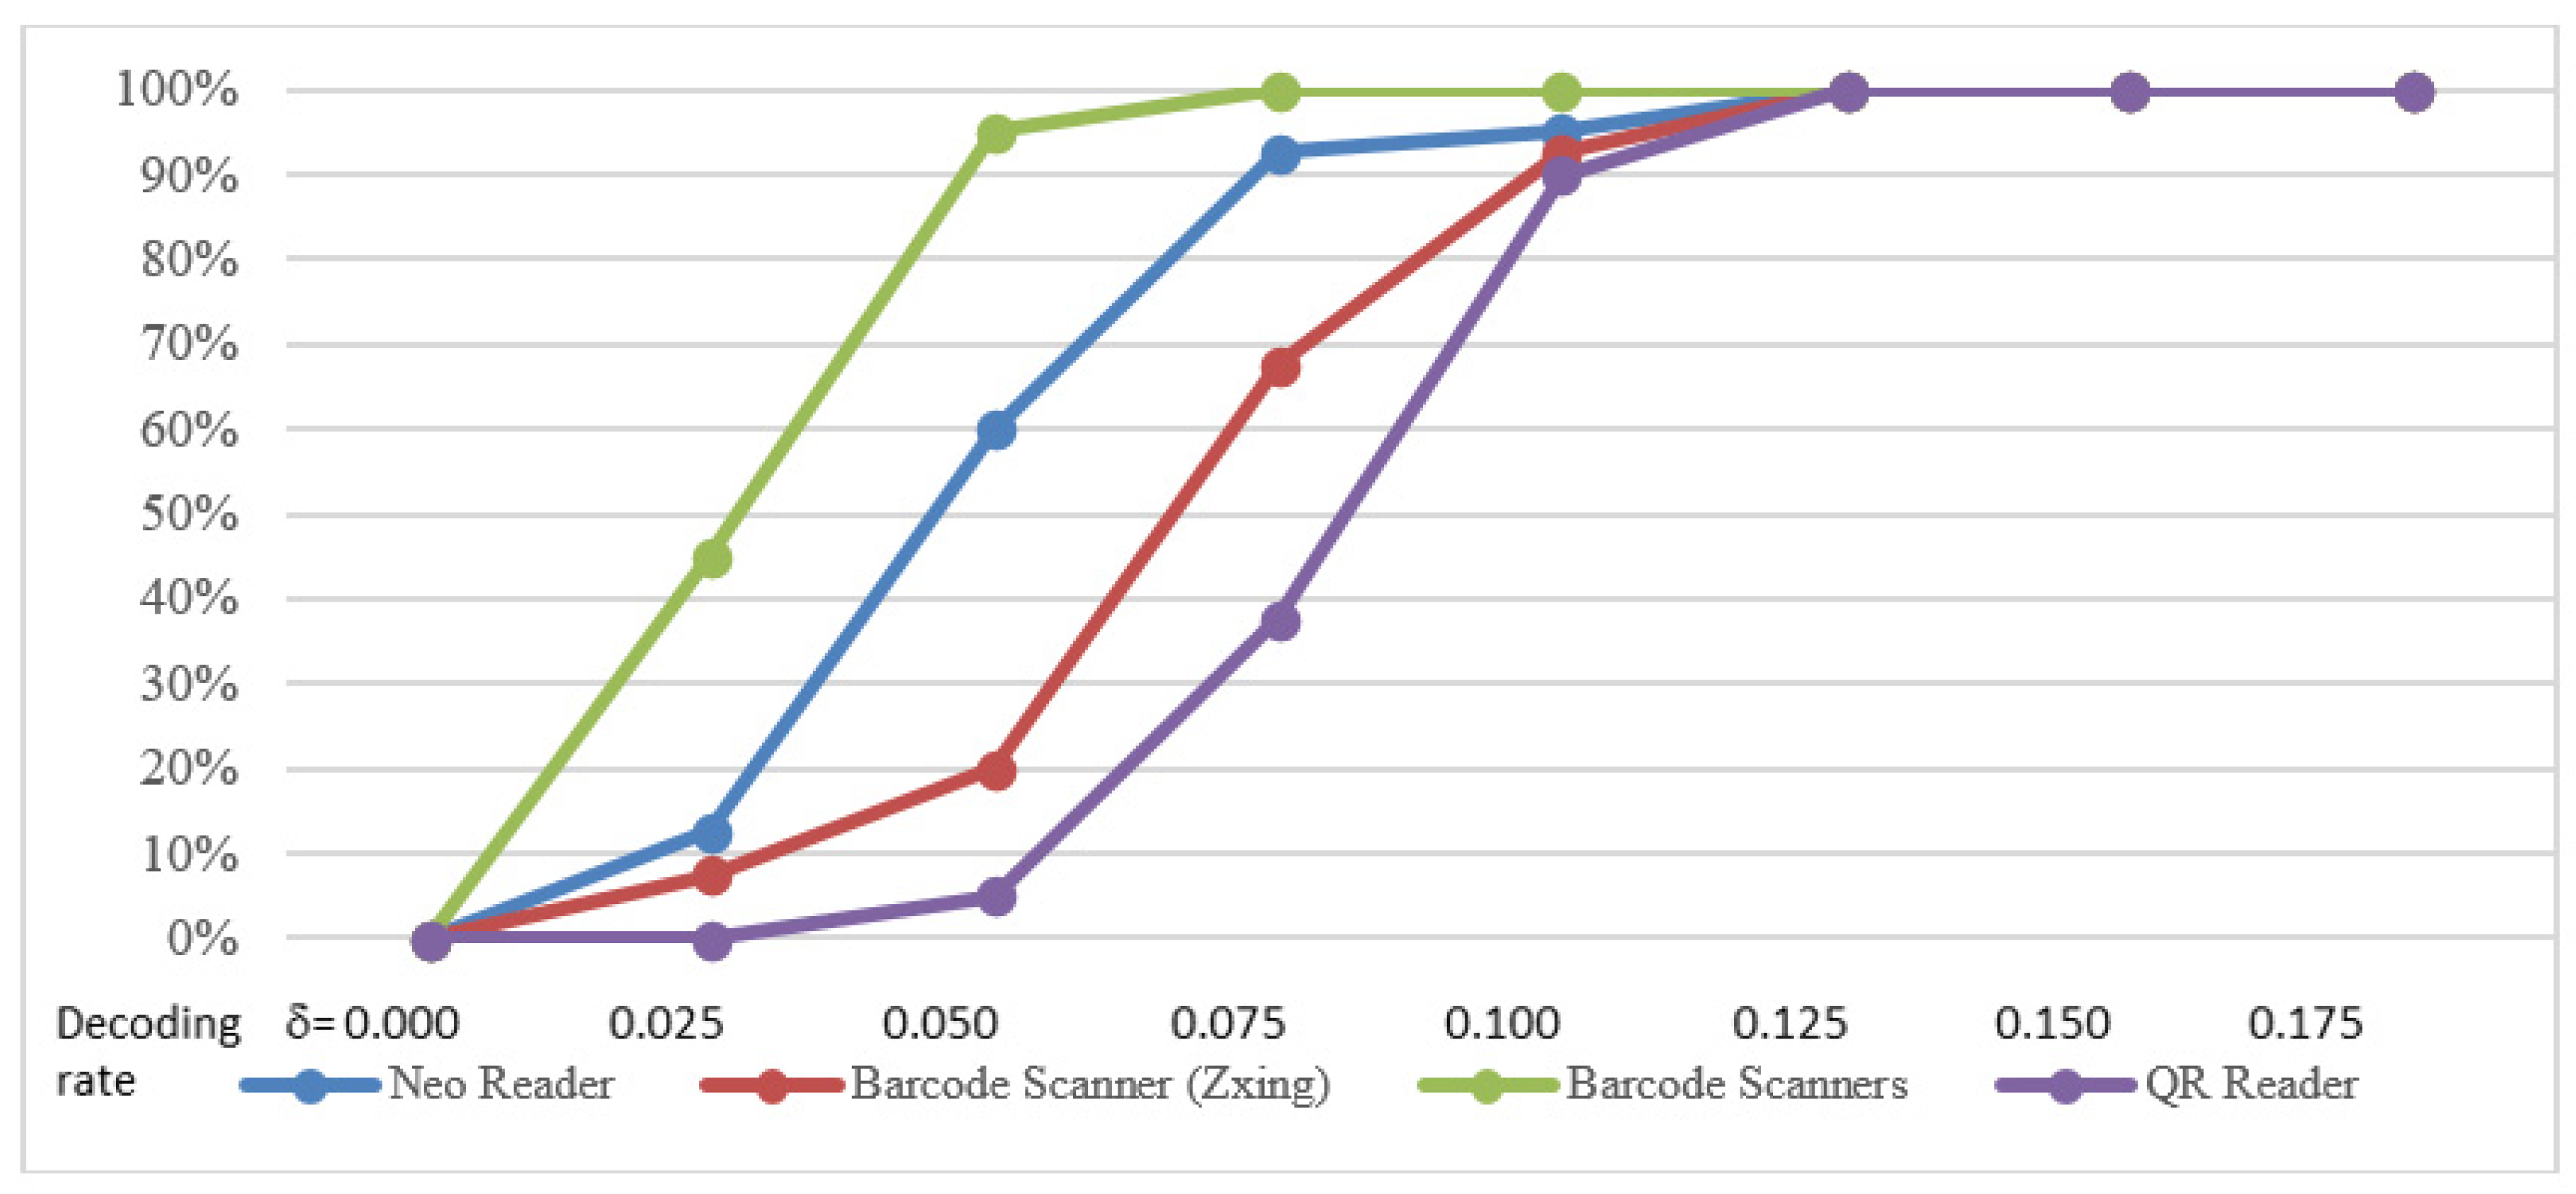
The first experiment is conducted to determine threshold δ in Equation (2) and threshold in Equation (9). 10 photomosaics with distinct master images were generated using construction level 3 by using different values of δ ( was set to the same value) to sift the candidate tile images. The generated photomosaics were shrunk and displayed on the screen of an ASUS-VX239-H monitor. Four users were asked to access the QR code on the photomosaics using the QR code readers on the cell phones. The QR code decoding rates using different values of δ in this experiment are shown in Figure 5. We can see that when δ ≥ 0.25, the message of all QR codes can be decoded successfully. Therefore, we set δ to 0.25 in all of the following experiments, and set to 0.25 in construction level 3.
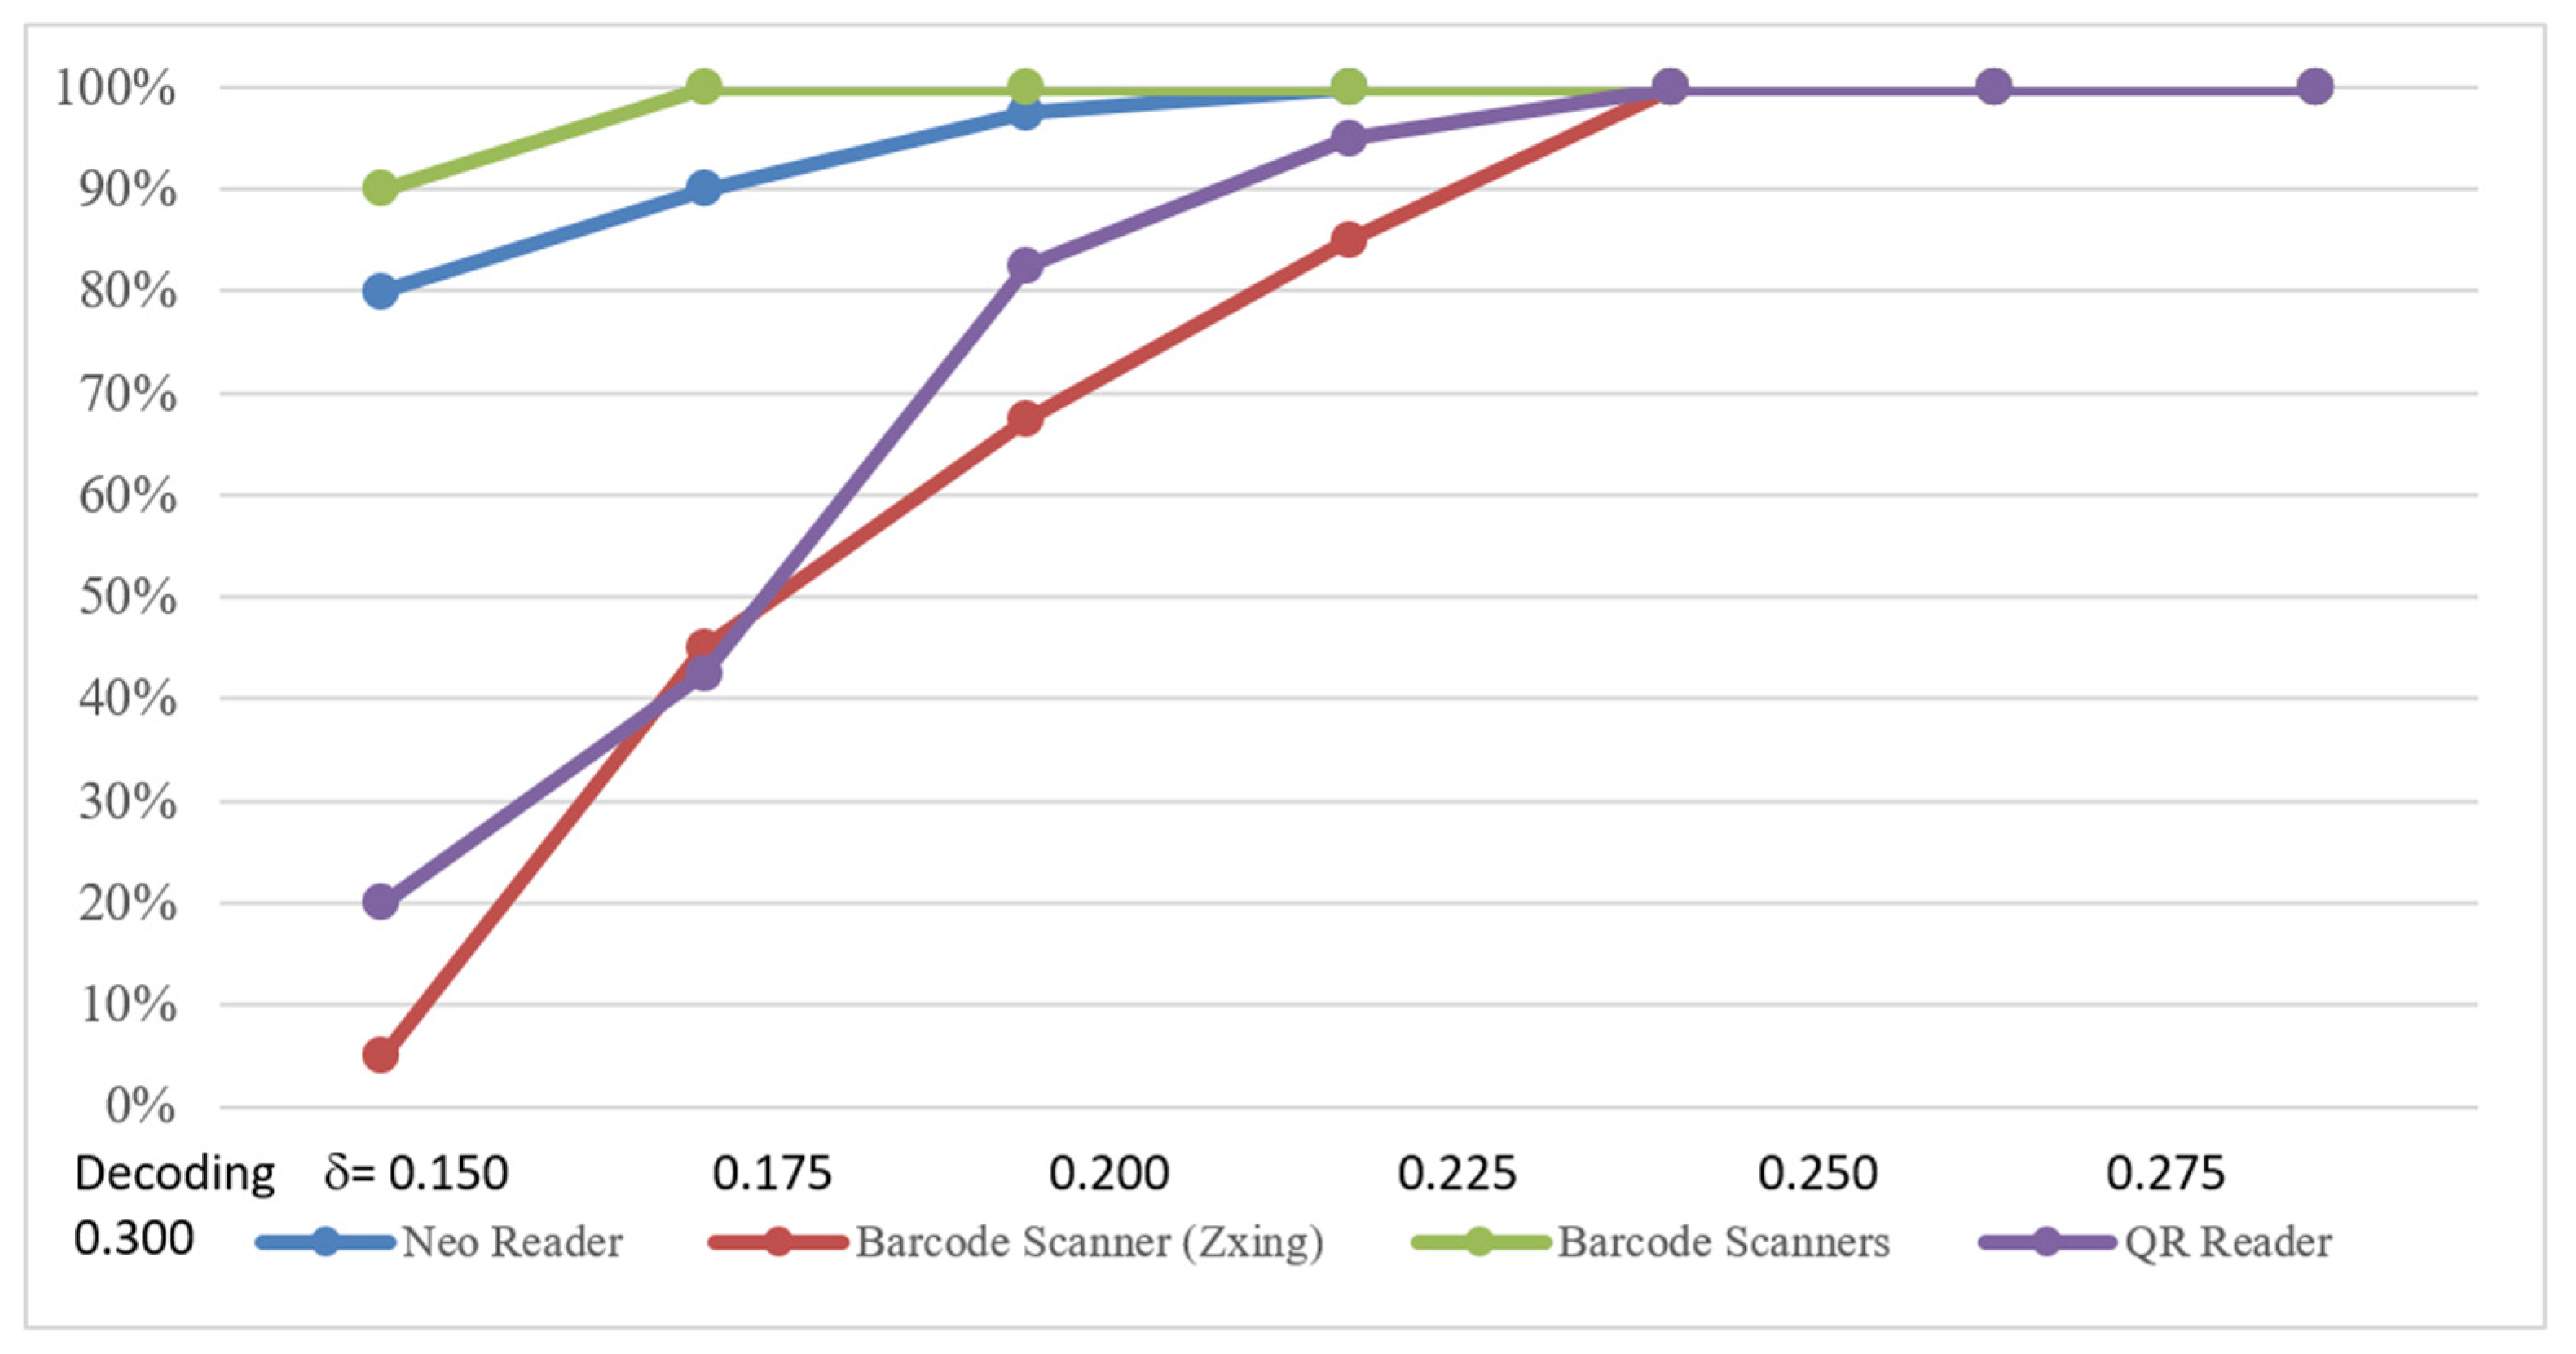
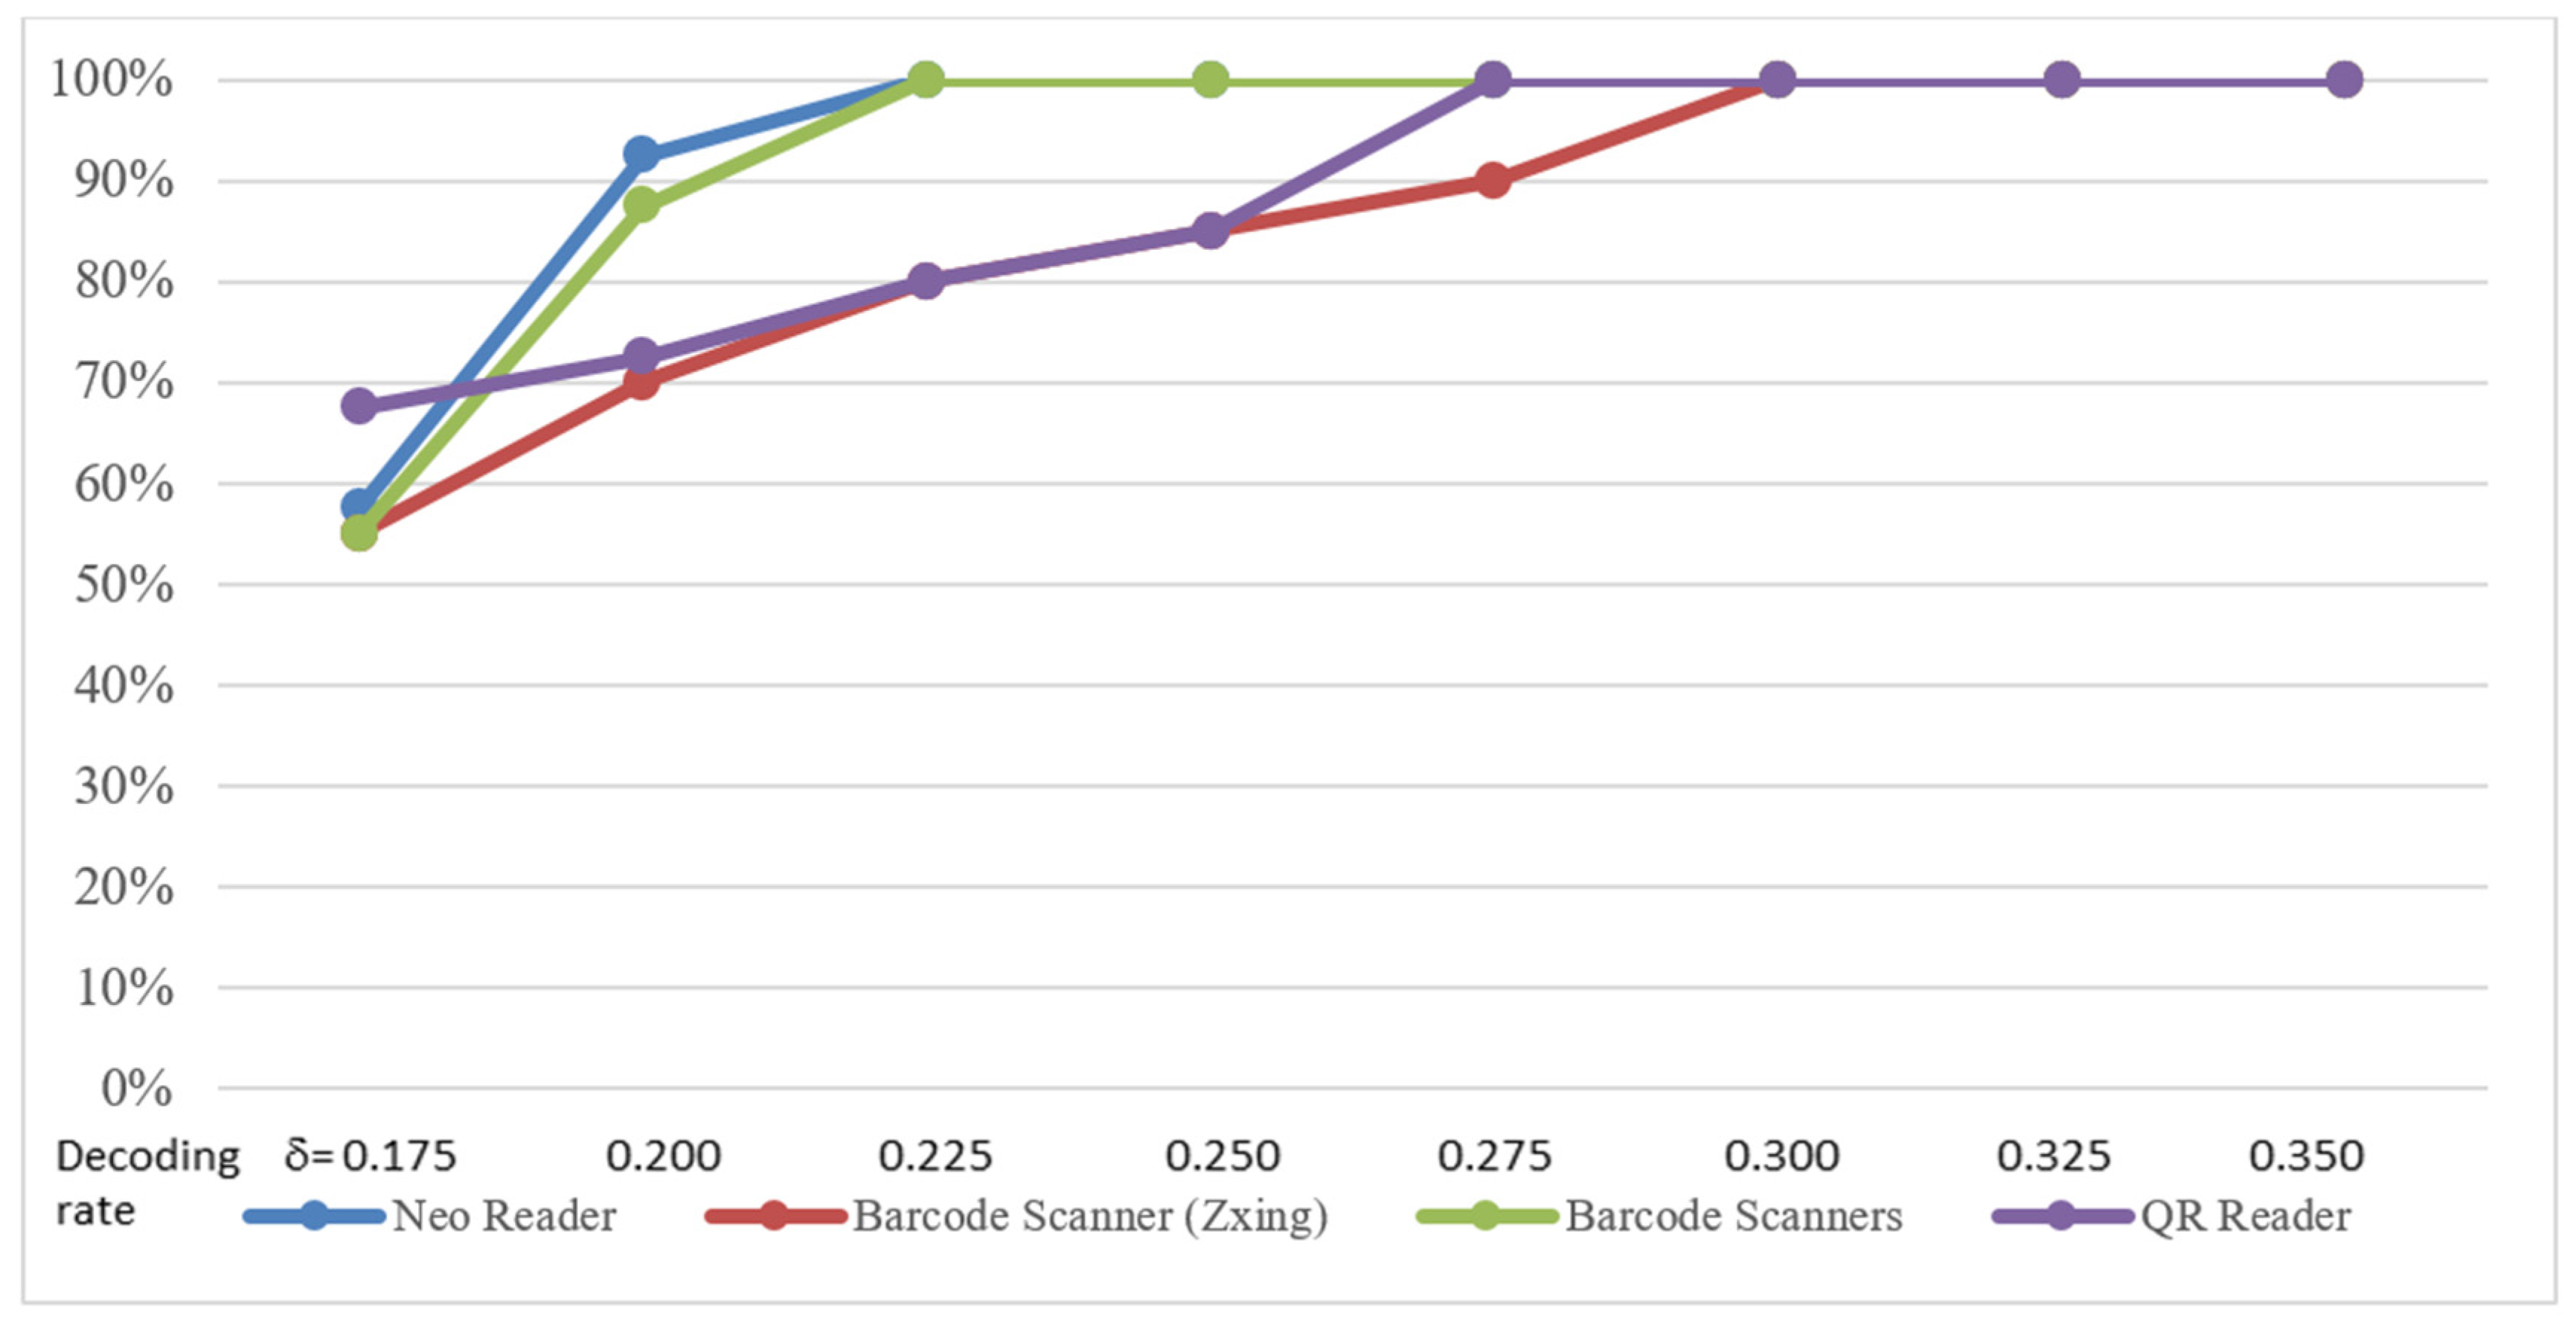
A second experiment was conducted to evaluate the appropriate threshold value of parameter in Equations (3) to (6). It constructed photomosaics by selecting functional tiles with δ set to 0.25, and it tested different values of for sifting data tiles for the level-1 construction method. Similarly, a third experiment was conducted to evaluate appropriate threshold values of parameter in Equation (7). It also constructed photomosaics by sifting functional tiles with δ set to 0.25, and tested different values of for sifting data tiles in the level 2 construction method. In each of the two experiments, 10 photomosaics with distinct master images were generated, and 4 users were asked to access the QR code on the photomosaics using the QR code readers on the cell phones. The results of the two experiments are shown in Figure 6 and Figure 7, respectively. They suggest that the value of parameter is set to 0.3 and the value of parameter is set to 0.125 in order to correctly decode all the QR codes on the generated photomosaics.
The number of candidate tiles for each category obtained by sifting candidate tiles using Equations (2) to (9) are summarized in Table 2. This shows that more tiles passed the sifting process for level-2 data tiles, and fewer tiles passed the sifting process for the candidate functional tiles and level-1 data tiles. However, the number of candidate tiles in each category is adequate for generating photomosaics in different versions of QR code. Note that we set δ = = 0.25, which causes the number of candidate tiles in to be the same as that in , and the number of candidate tiles in to be the same as that in . All of the 1,000,000 images in the database images were candidates for and .
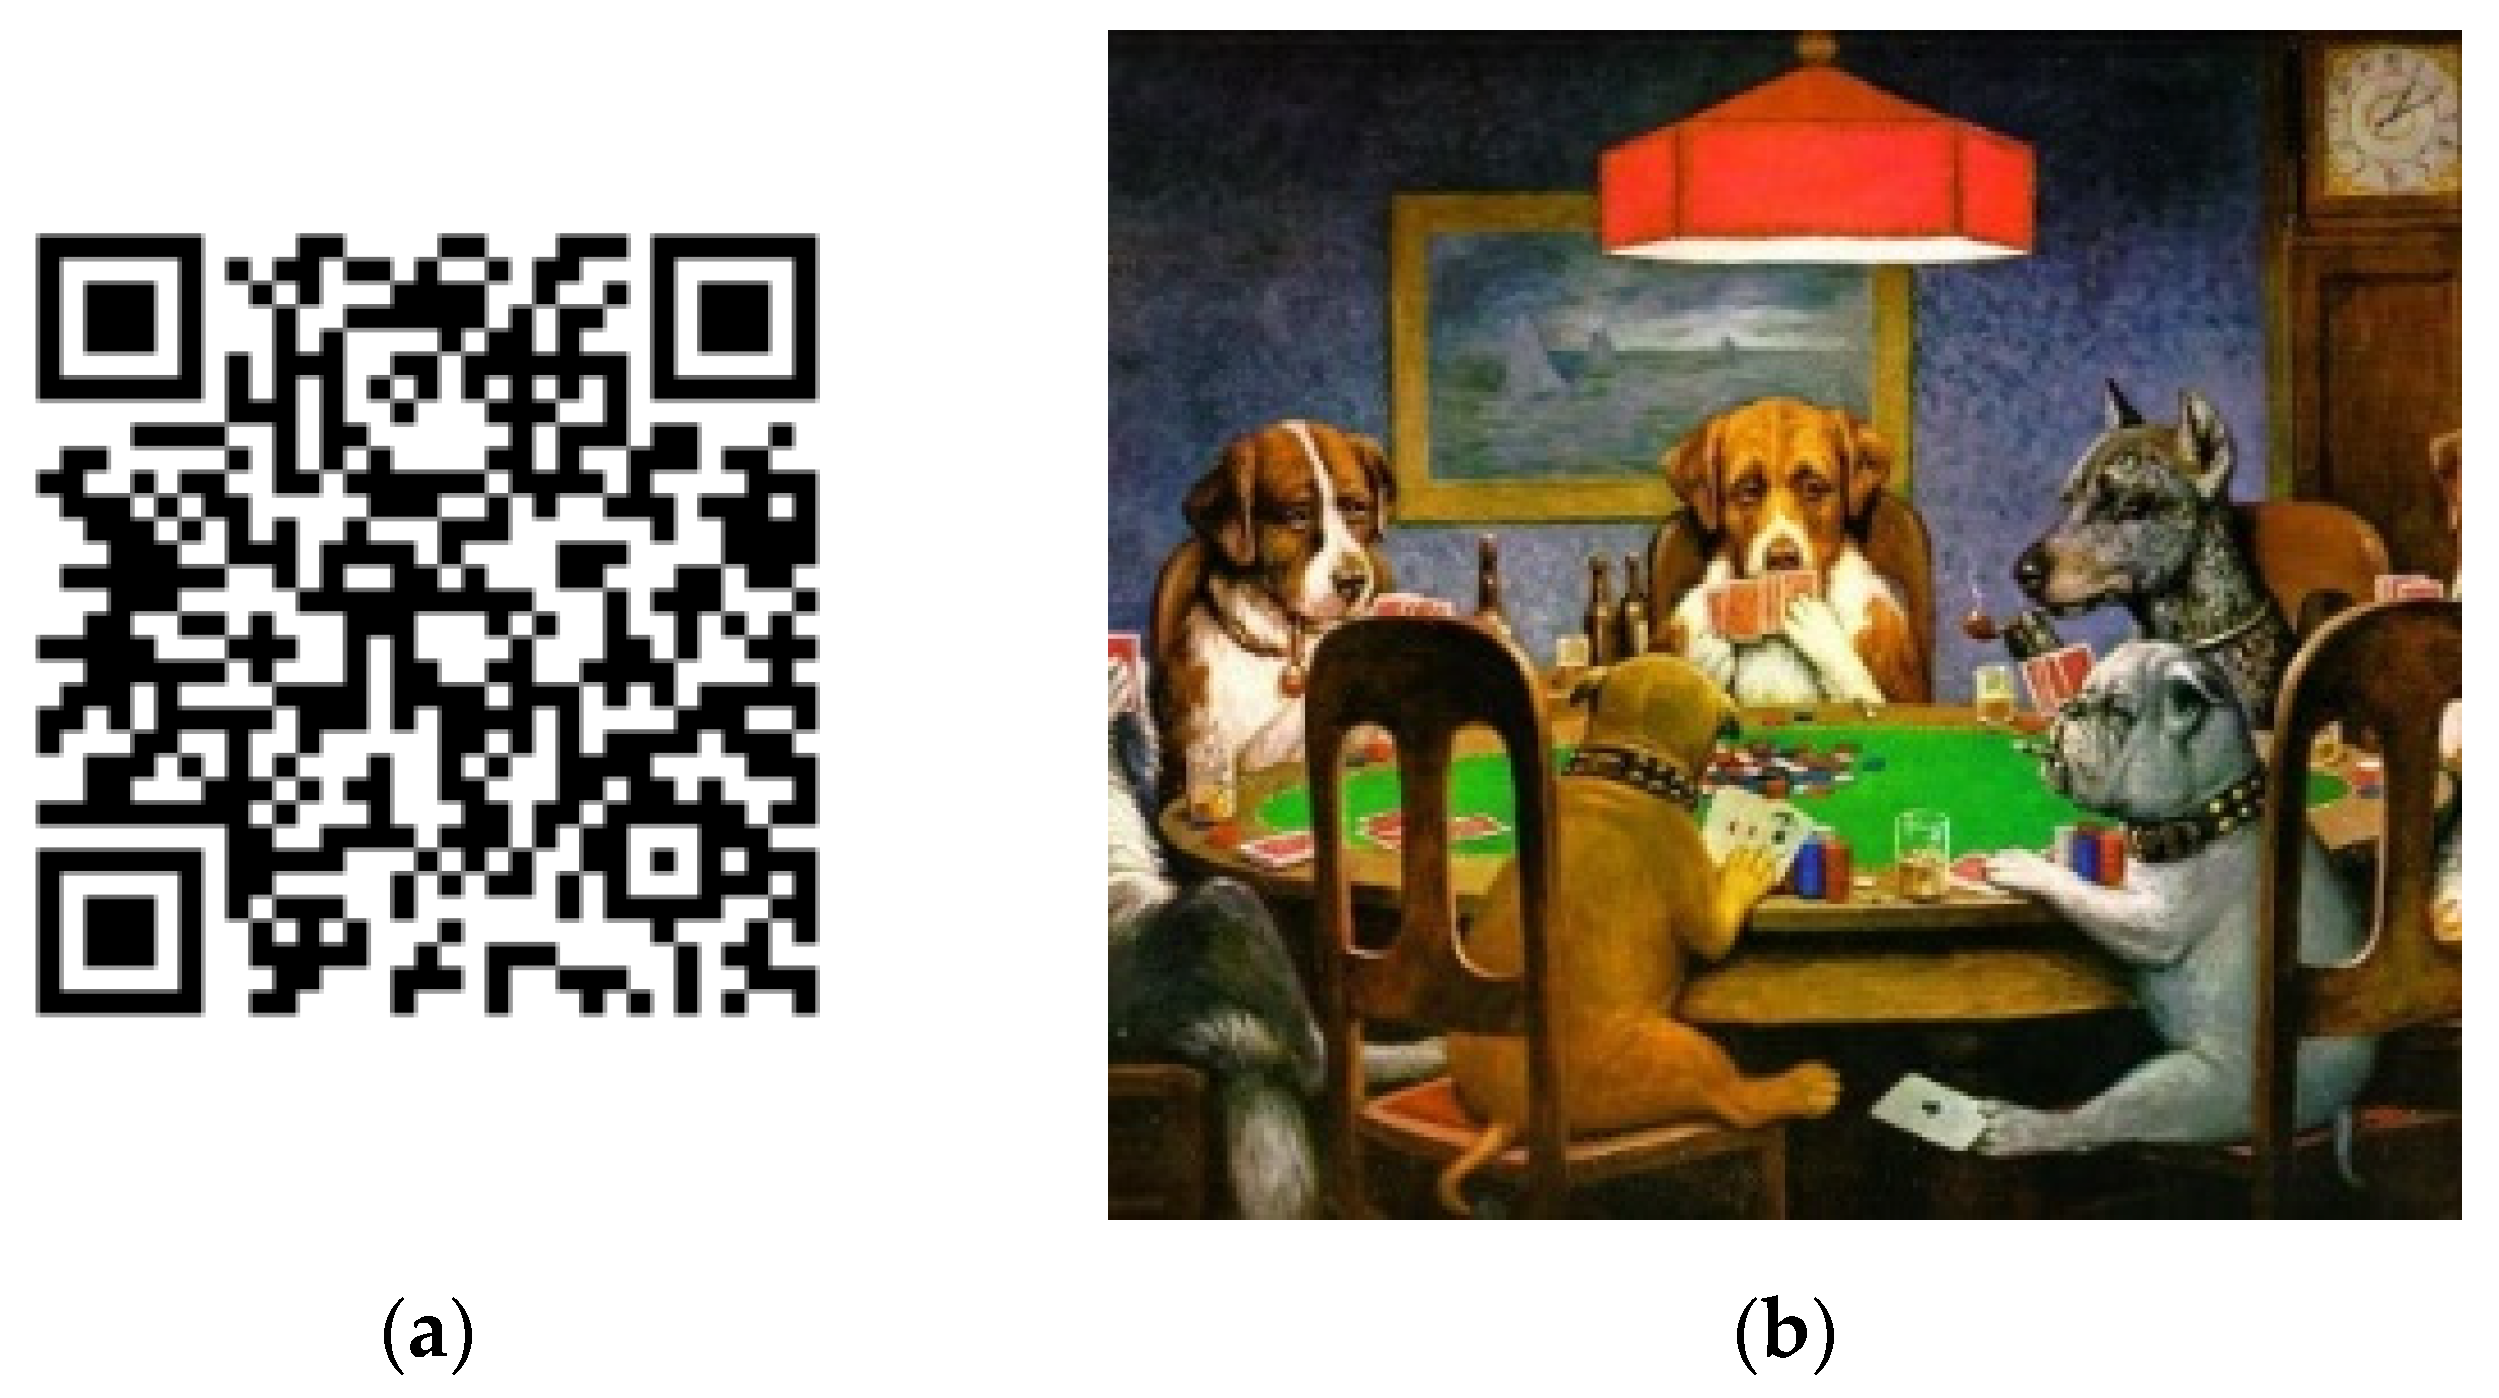
Figure 8 shows a version-4 QR code with 33 × 33 modules, the string “https://www.cse.yzu.edu.tw/” and a master image “Dogs play poker” with a size of 738 × 838 pixels.
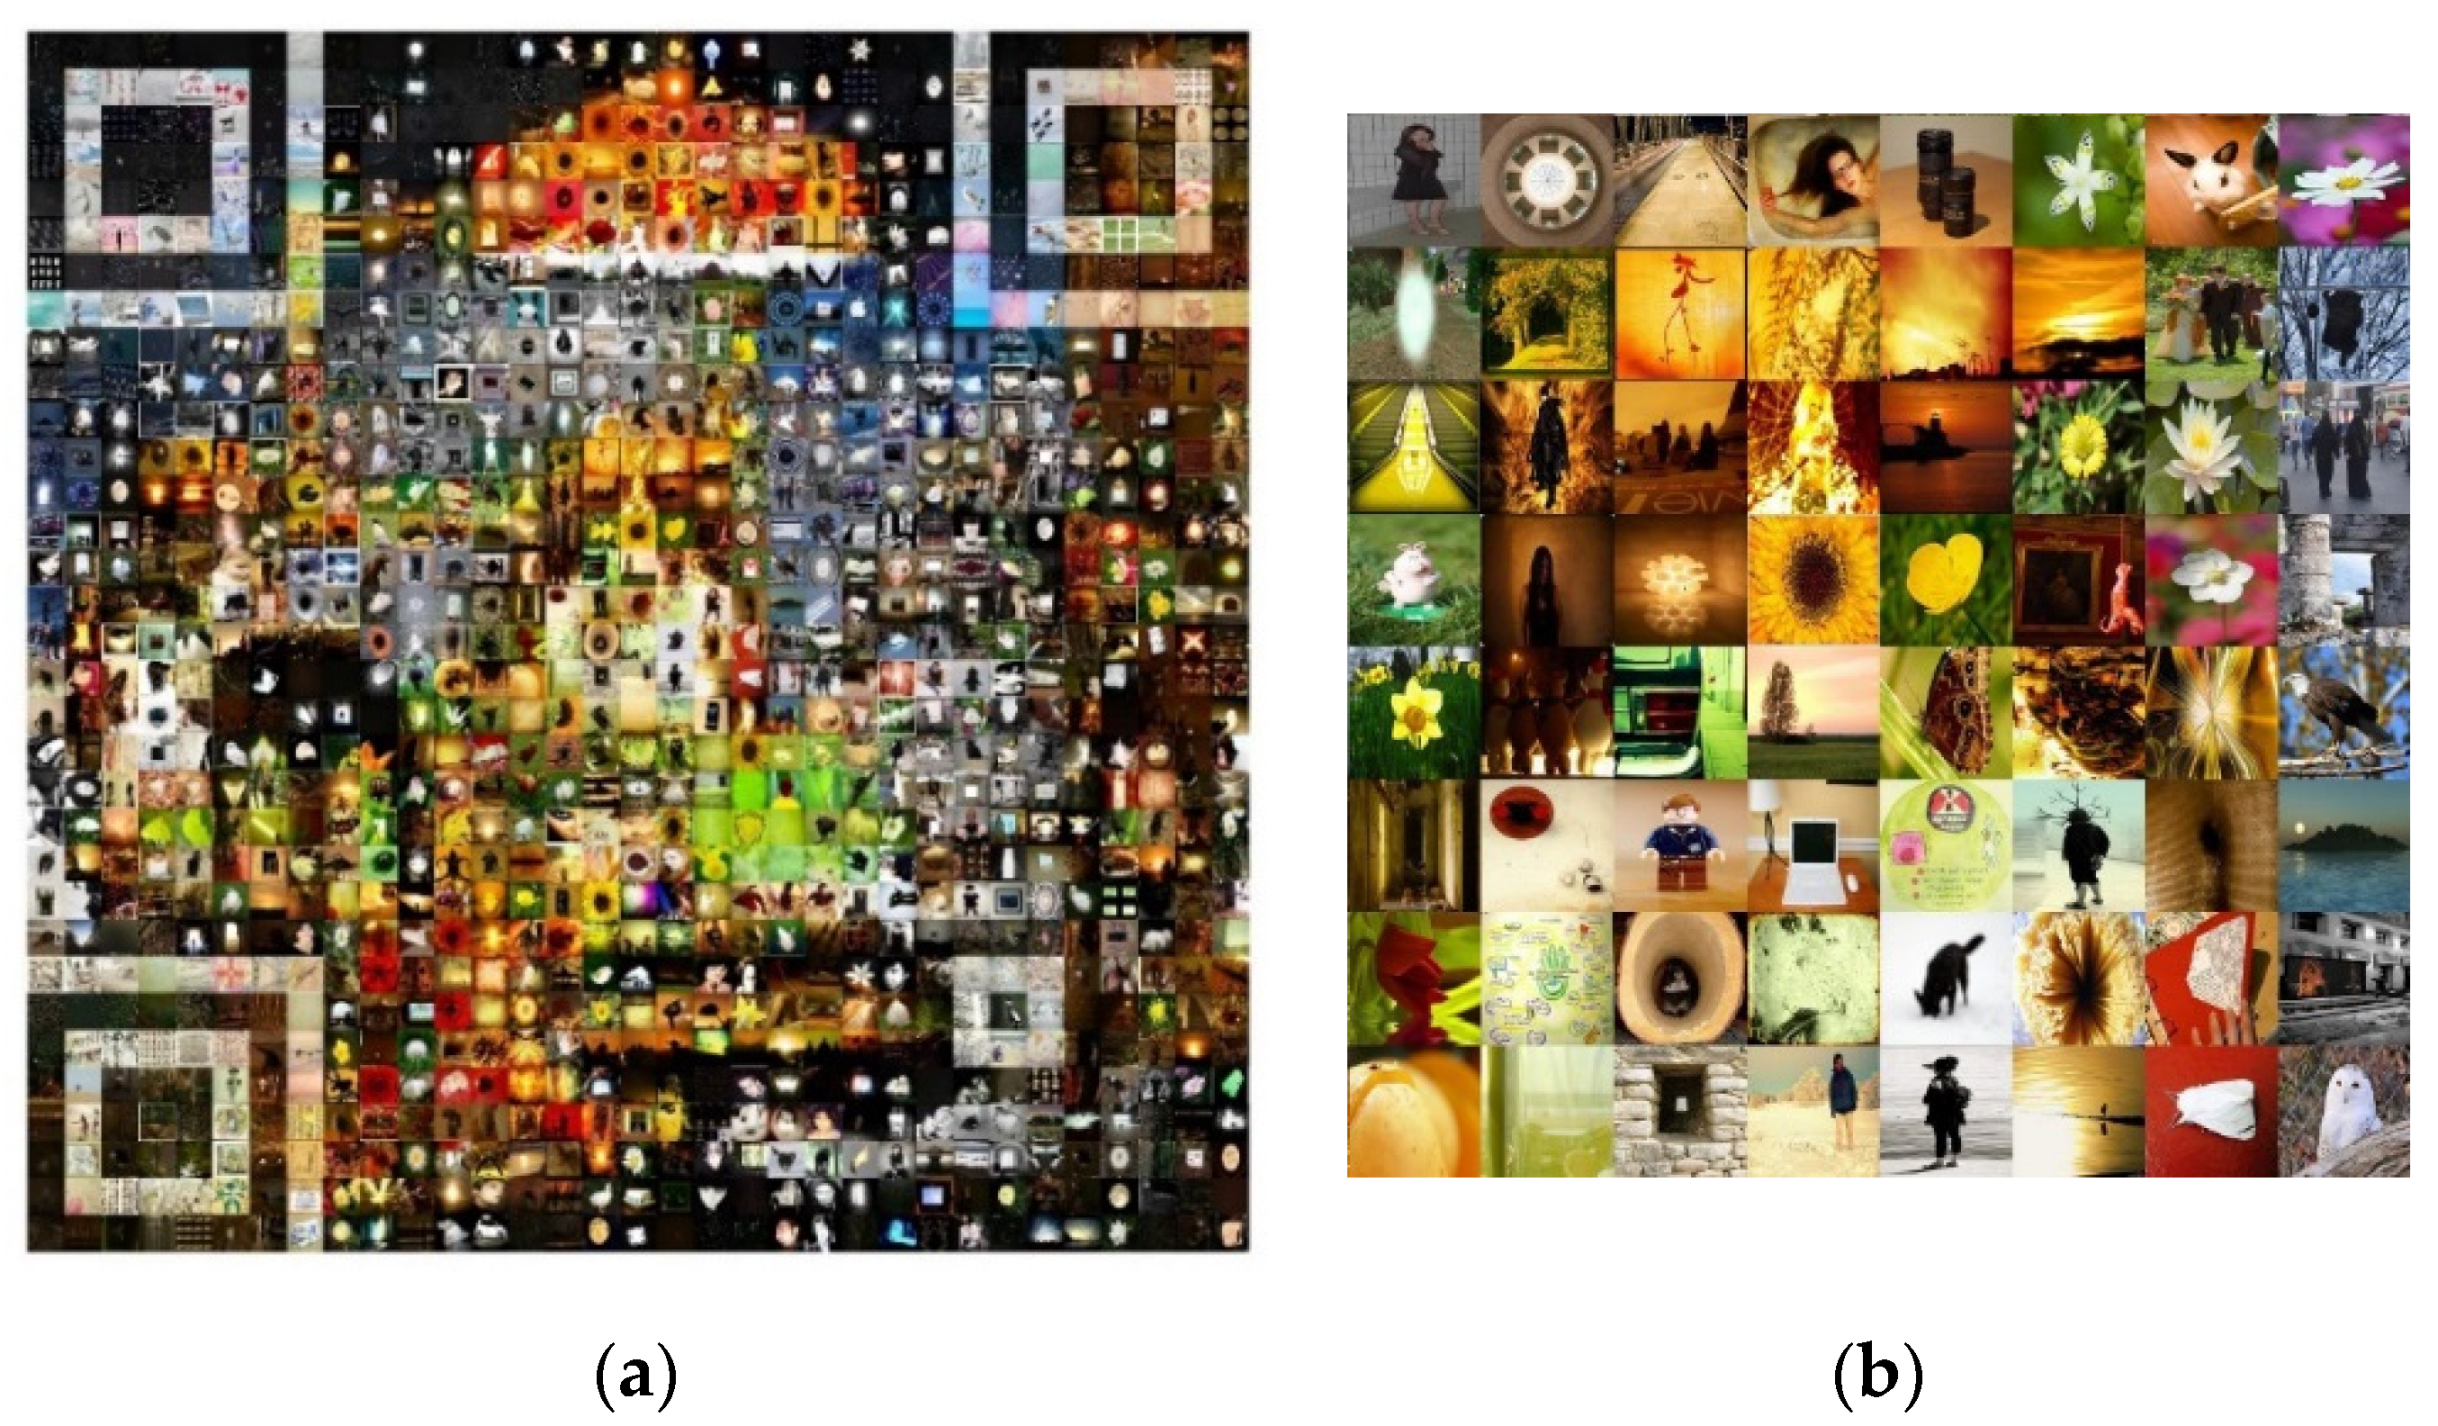
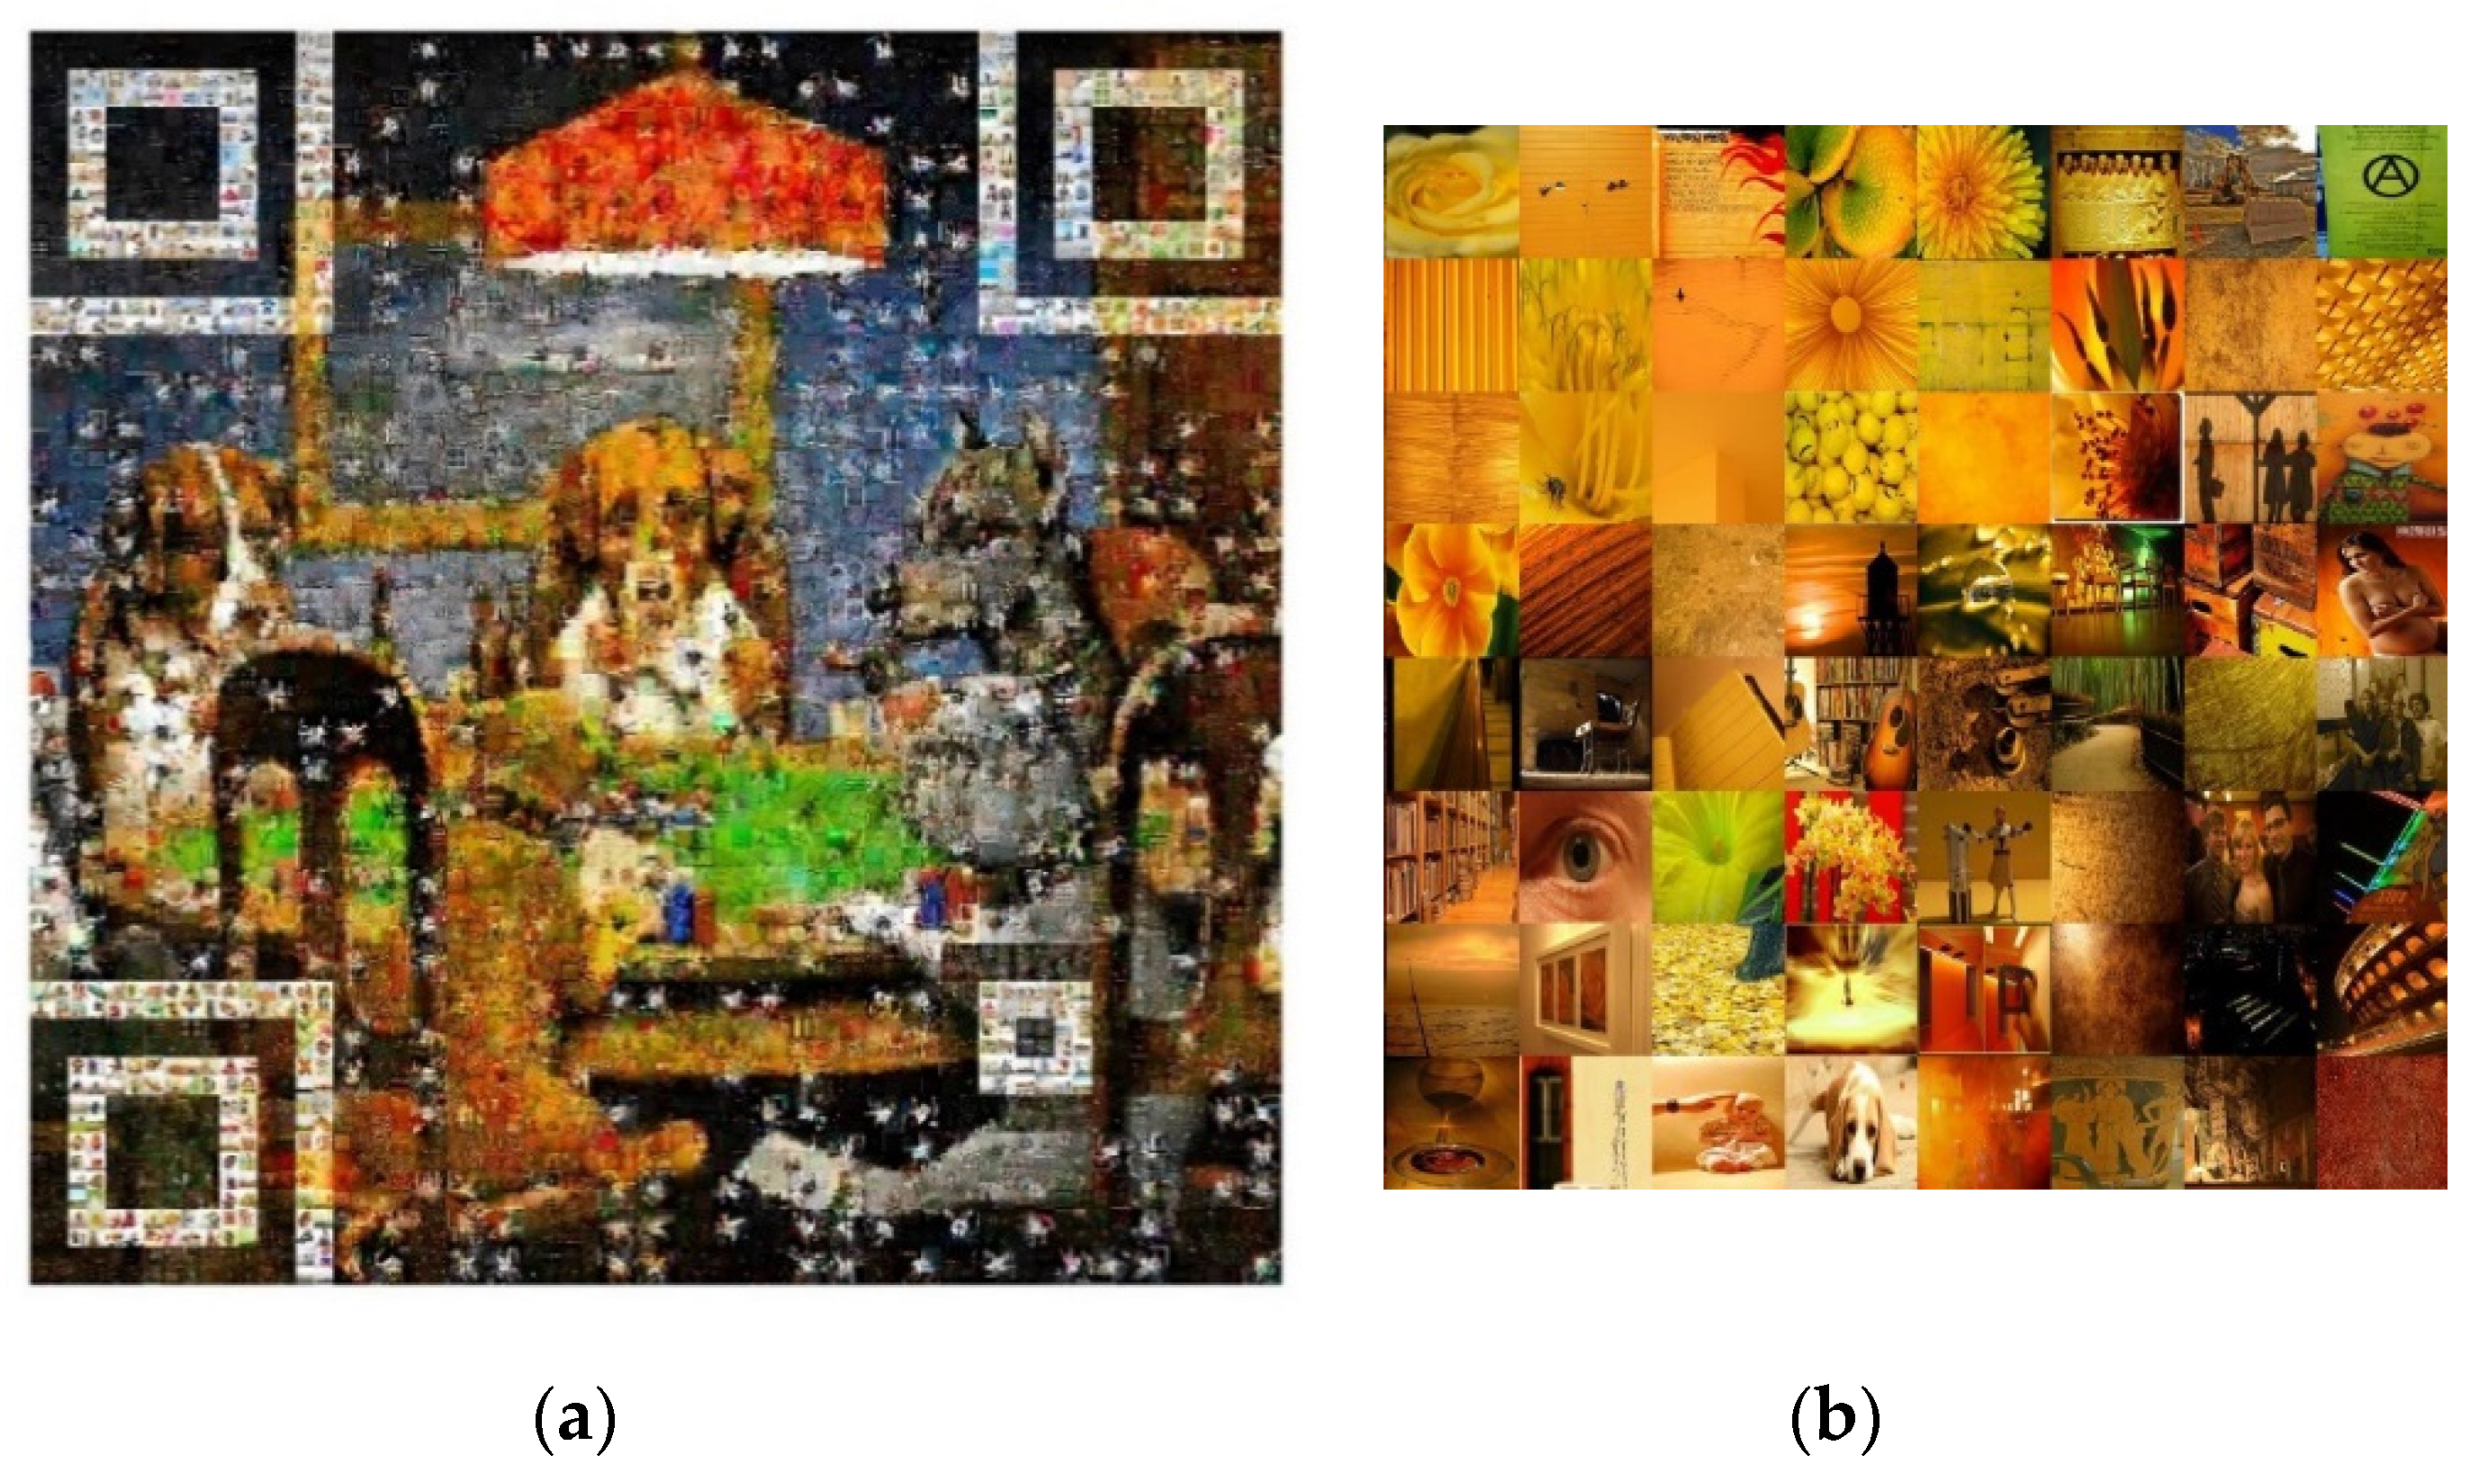
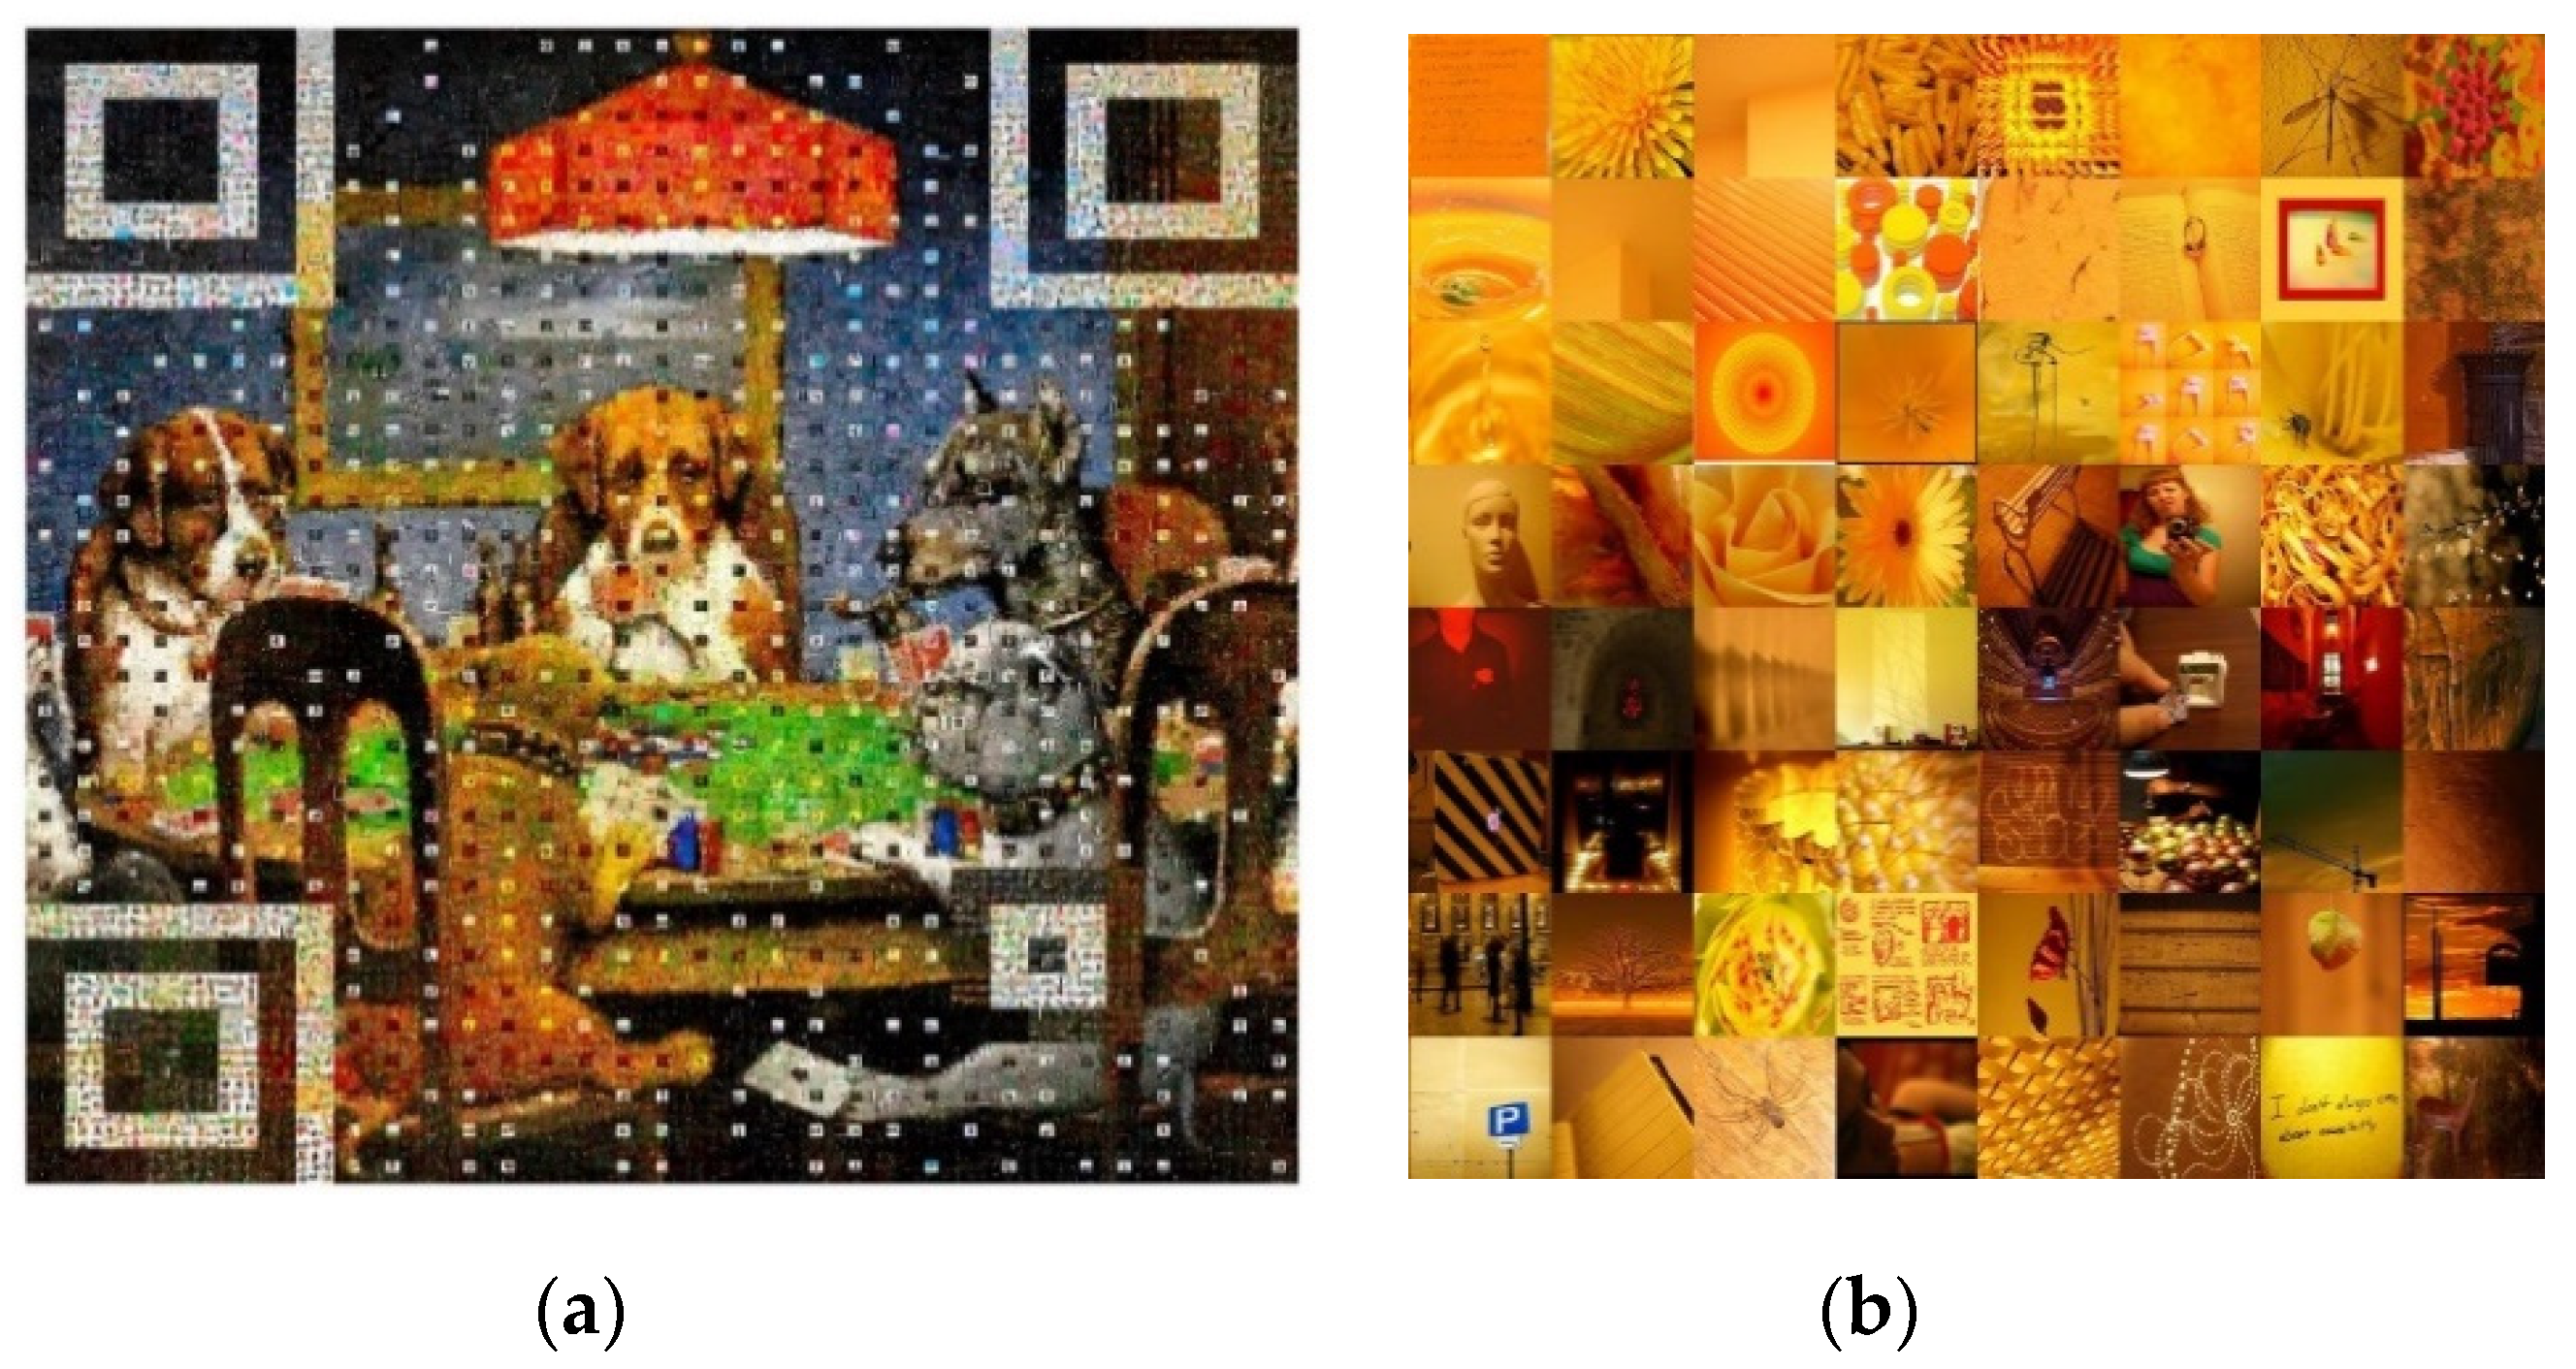
Figure 9, Figure 10 and Figure 11 are photomosaics generated using different construction levels. In this experiment, only the finder patterns and the alignment patterns of the QR code were regarded as functional blocks. In each illustration, the left panel is the obtained photomosaic, and the right panel shows 8 × 8 tiles in the center region (the face of the dog) of the photomosaic. Four white tiles were generated in each side for the quiet zone surrounding the QR code. The sizes of the generated photomosaic images in Figure 9a, Figure 10a, Figure 11a were 5248 × 5248, 10,496 × 10,496, and 15,744 × 15,744 pixels, respectively. They are all displayed in the same scale to reflect the visual quality of viewing the photomosaic from a far distance. We can see that the photomosaic generated using level 1 has lowest visual quality, and photomosaic generated using level 3 has highest visual quality. But level-1 photomosaic needs the least computation time and storage, and level-3 photomosaic has the heaviest storage burden and longest computational time.
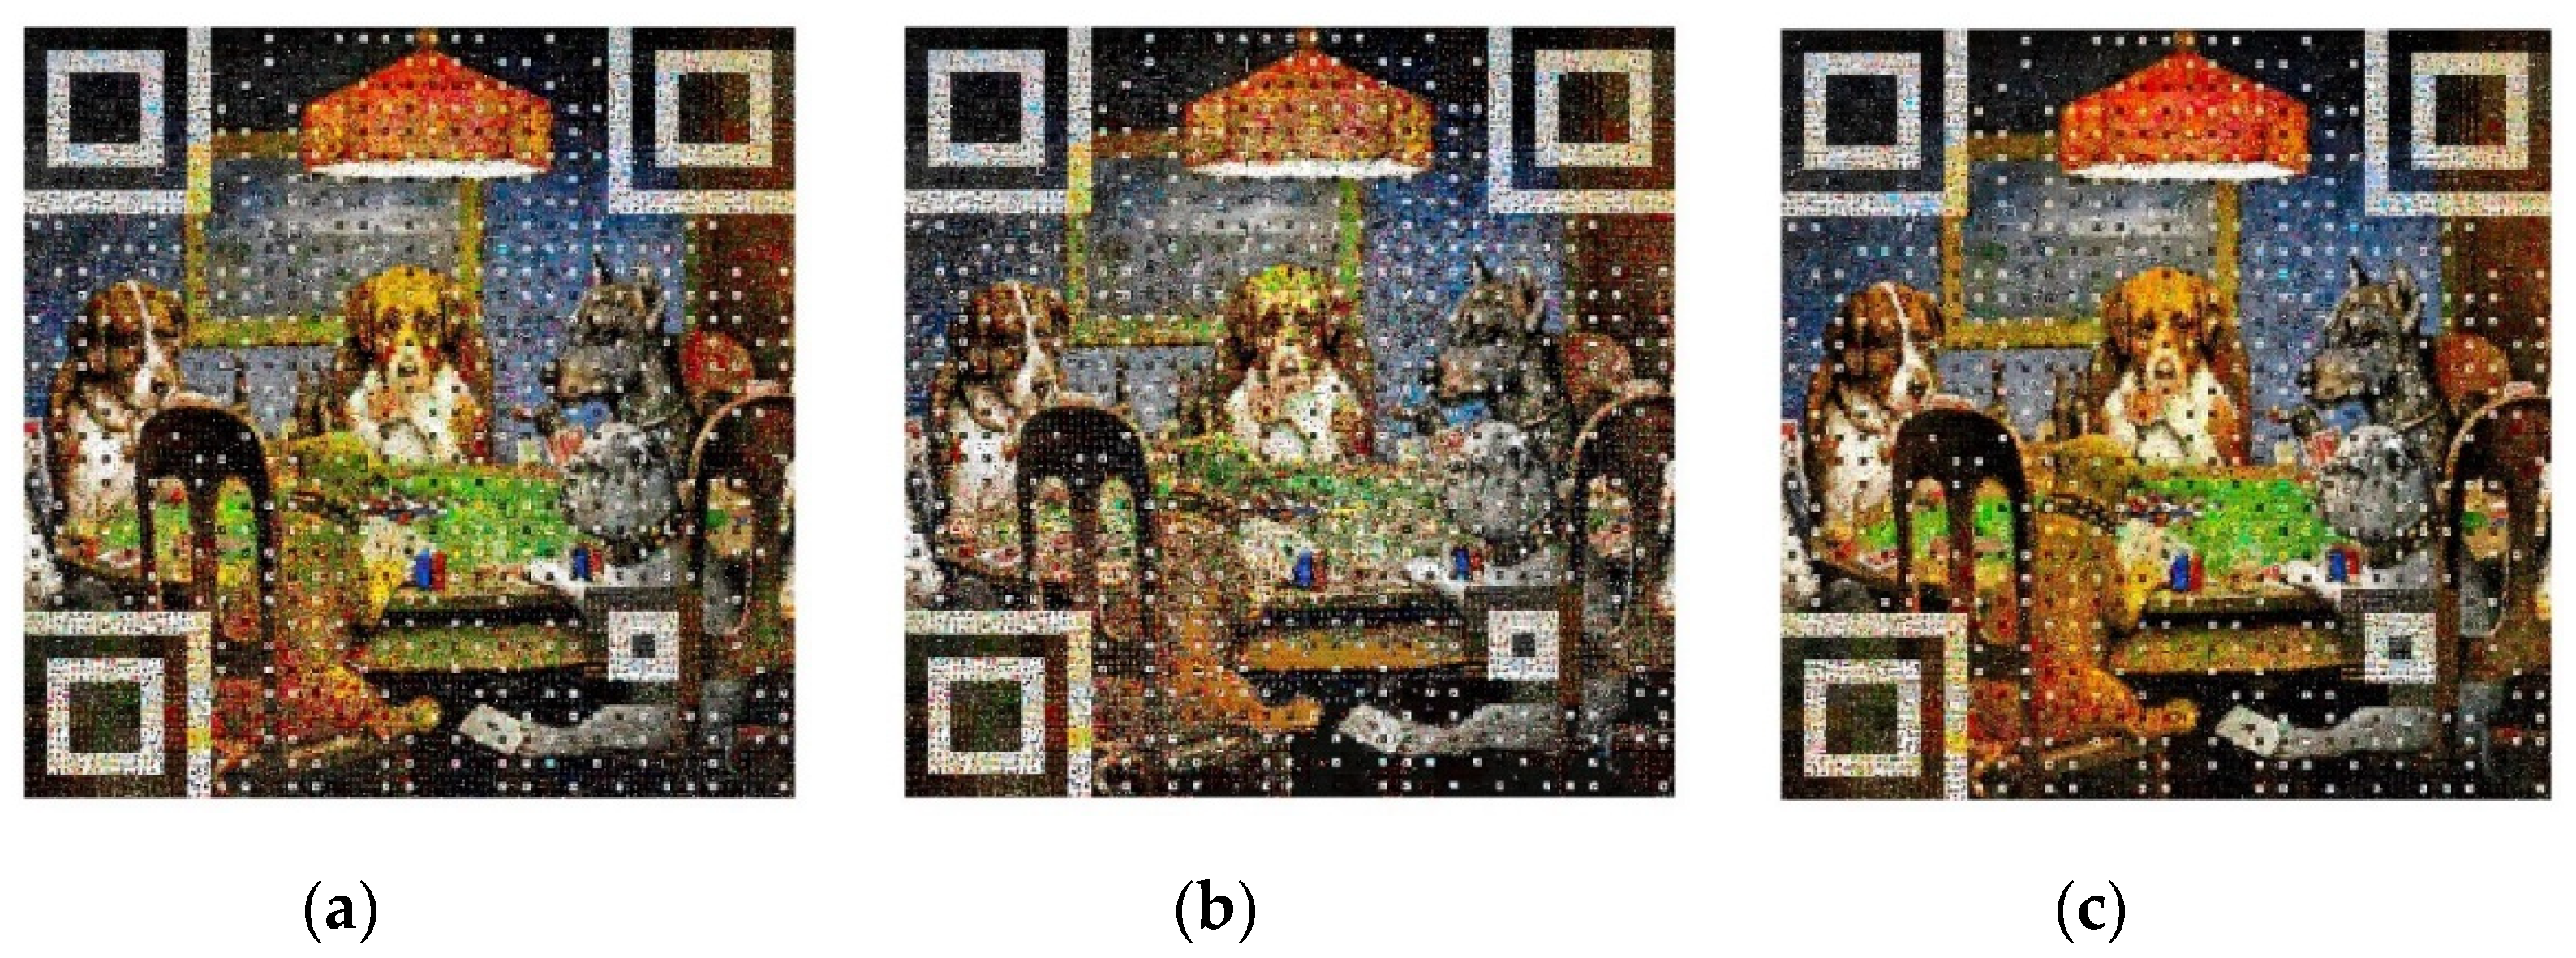
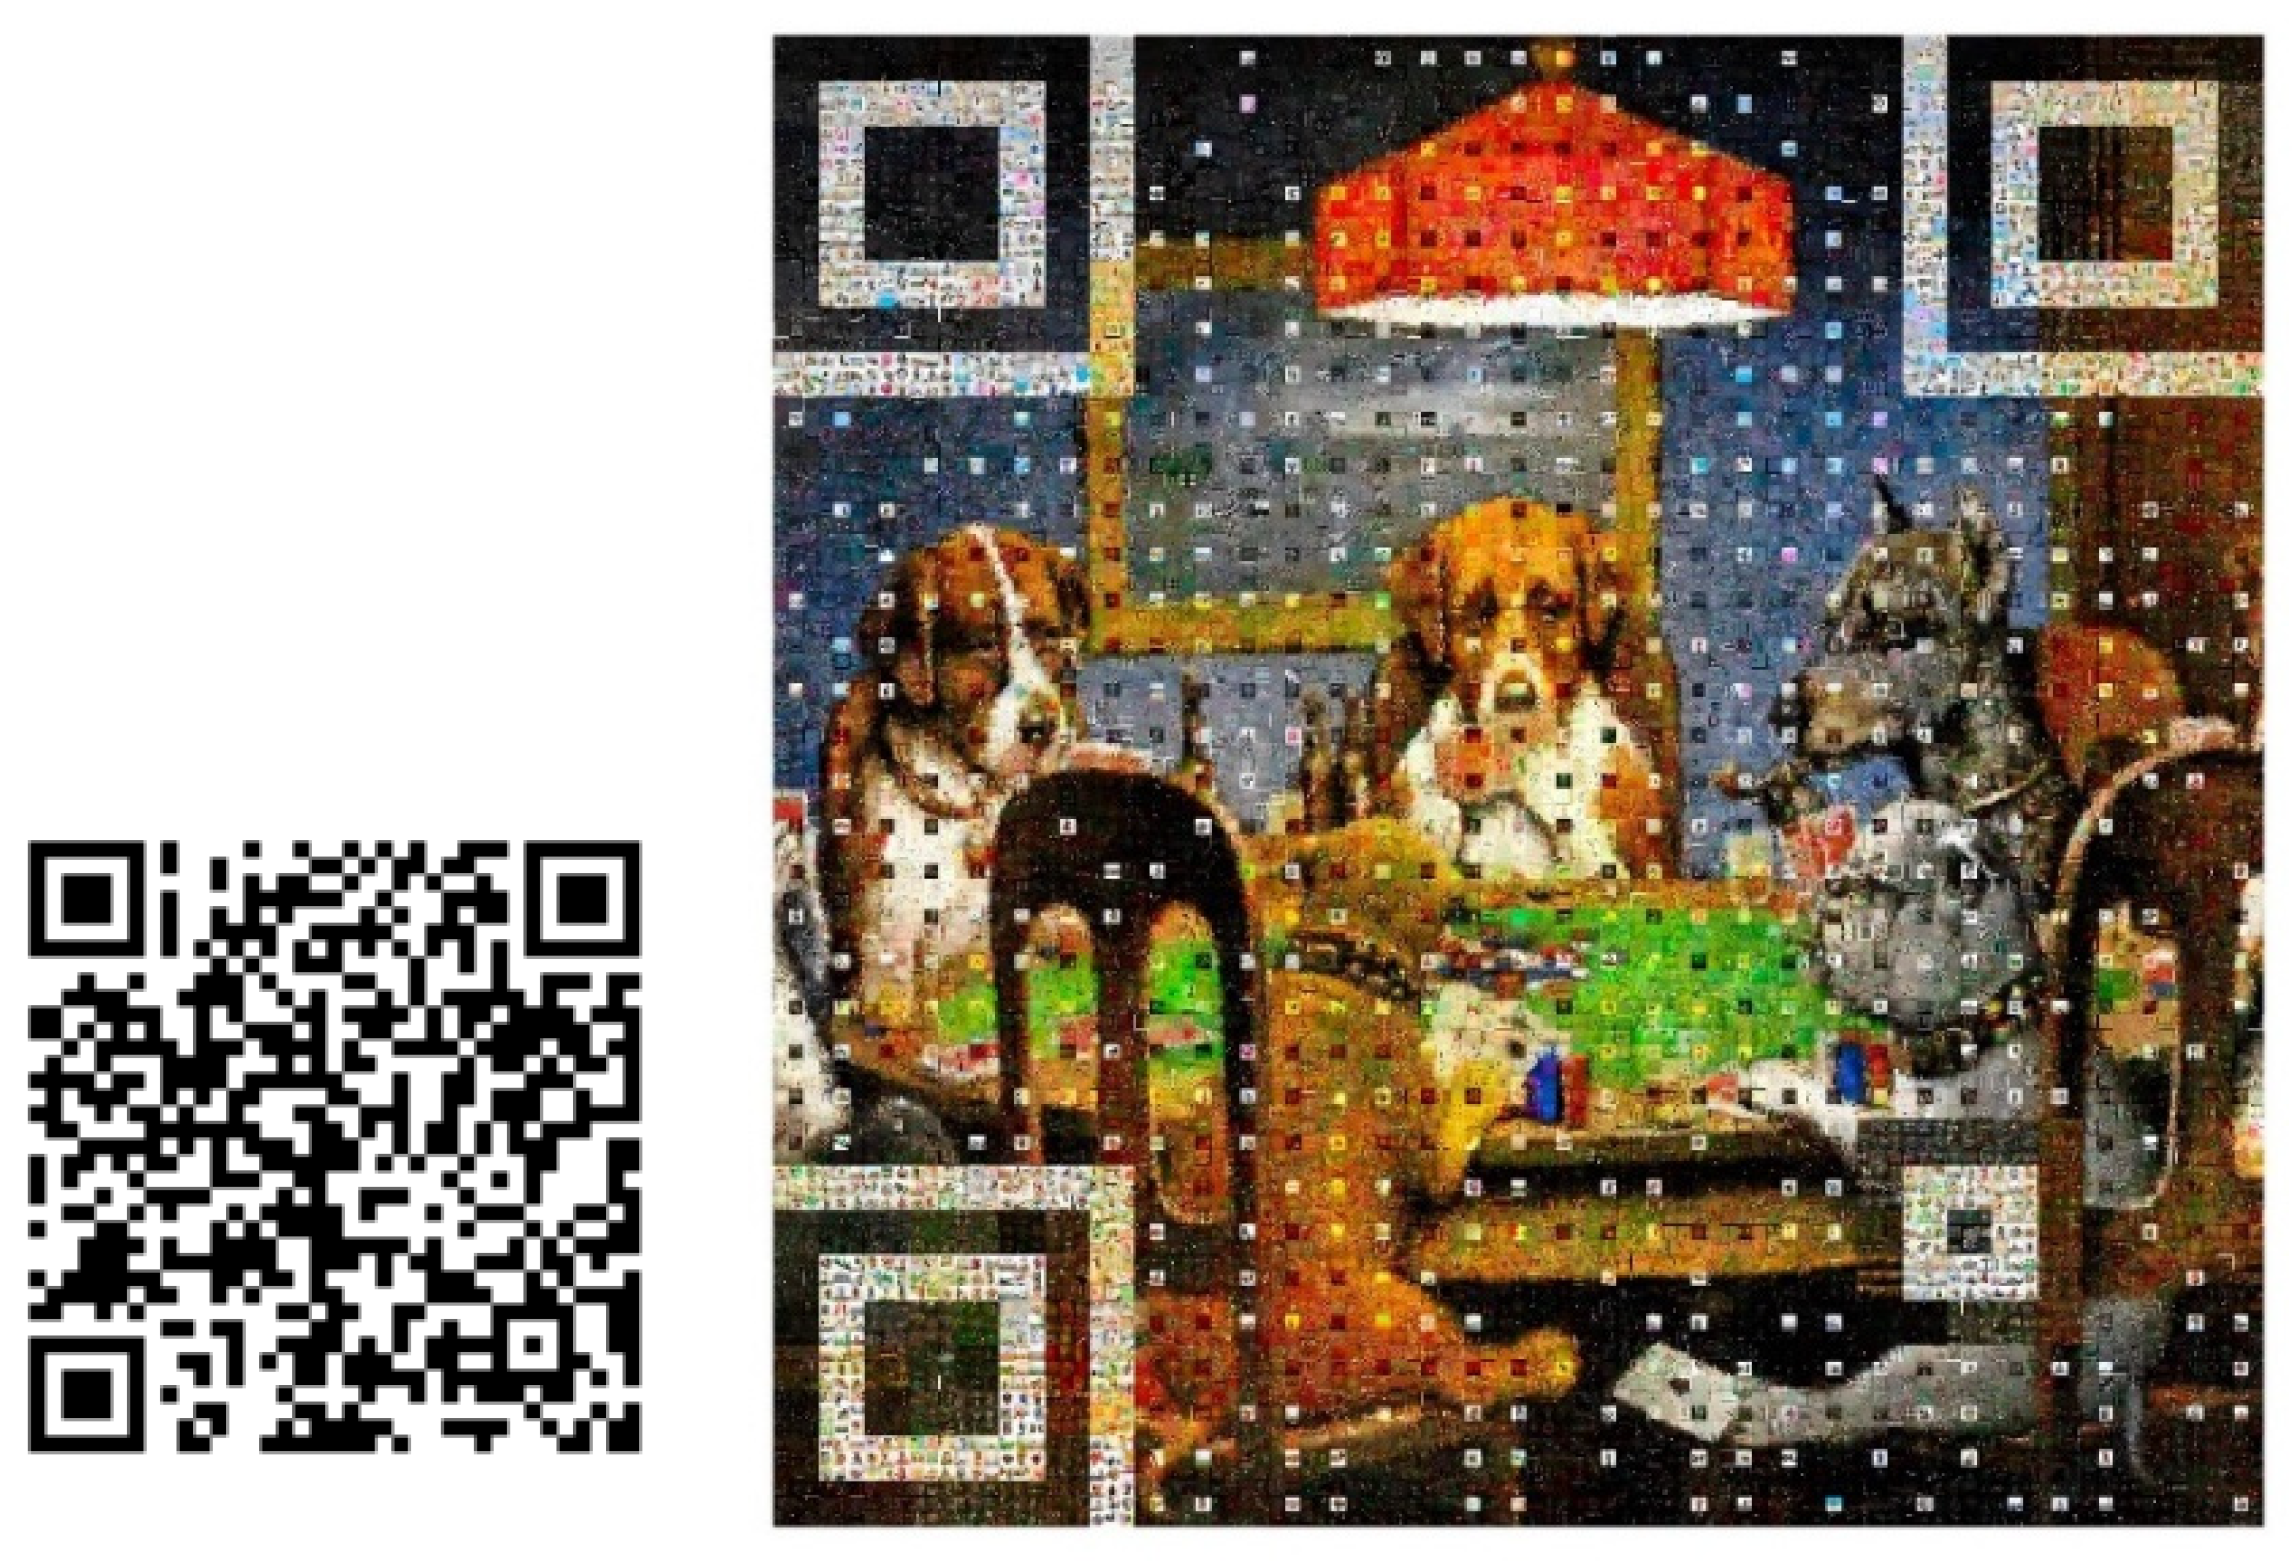
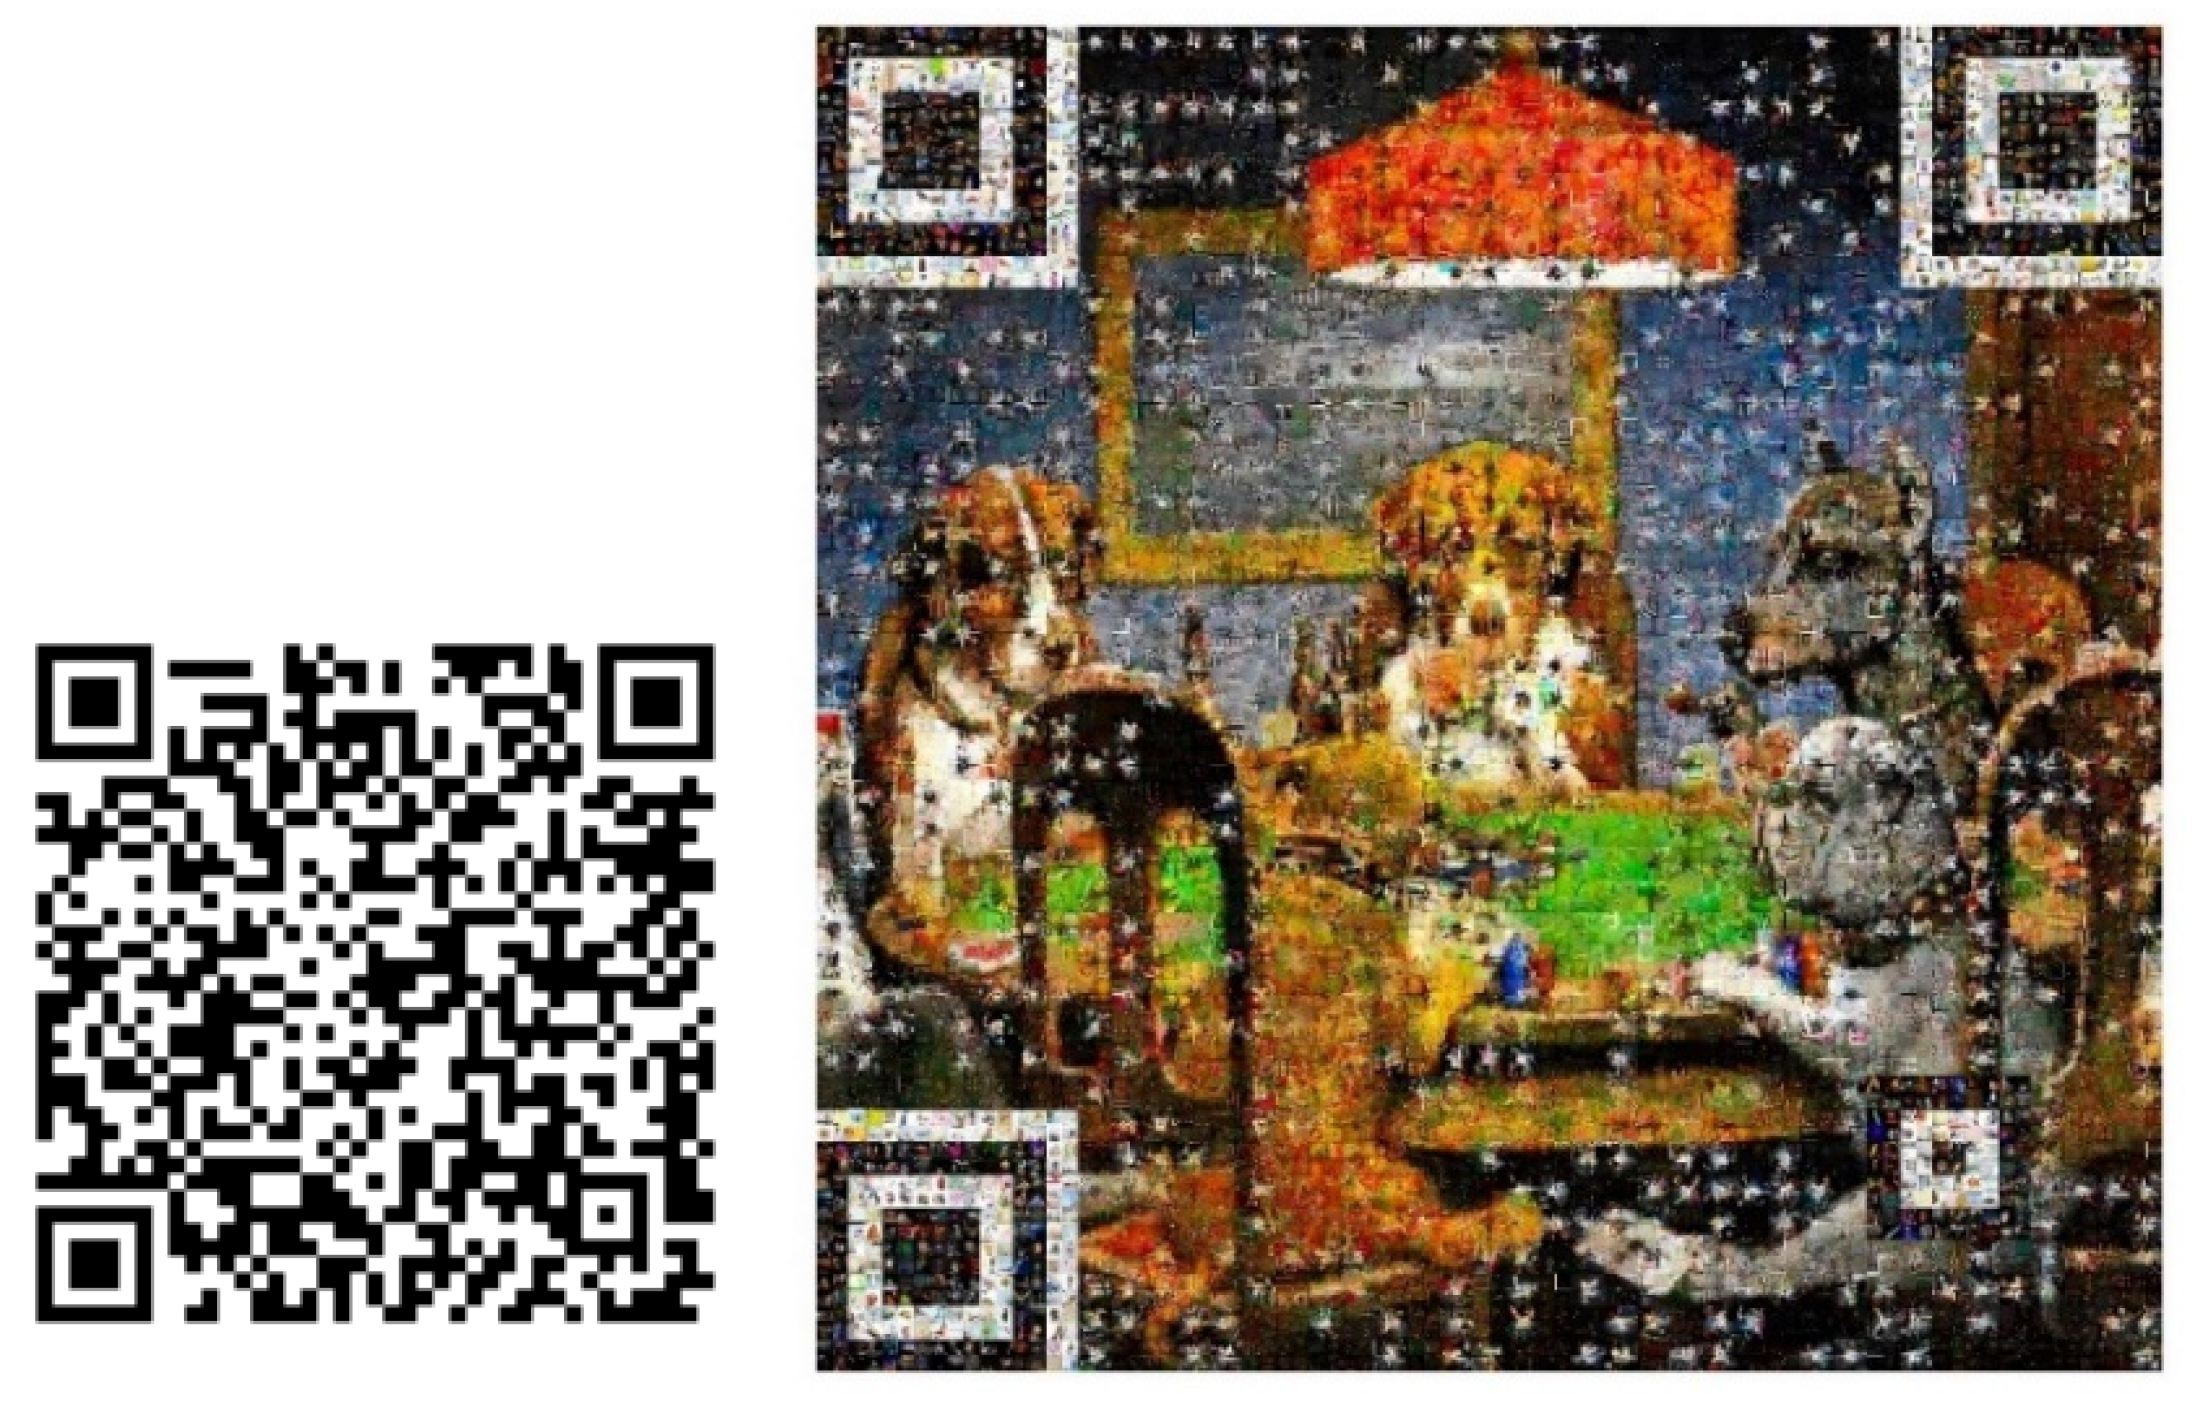
Figure 12a–c are the photomosaics generated using the level-3 construction method with 20,000, 100,000, and 500,000 candidate tile images. We can see that the visual quality of the photomosaic increases as the number of candidate tile images increases. The QR code on a photomosaic can be read by taking a photo of the photomosaic using a standard QR code reader on a cell phone. Figure 13 and Figure 14 illustrate the proposed photomosaics generated using different versions of QR codes. The left panel in Figure 13 is a version-5 QR code with 37 × 37 QR code modules and string content “http://www.cse.yzu.edu.tw/research/”. The generated photomosaic is shown in the right panel, which is comprised of 111 × 111 tile images. The left panel of Figure 14 is a version-6 QR code with 41 × 41 modules and the content “http://www.cse.yzu.edu.tw/research/learning/”. The generated photomosaic is shown in the right panel, which comprises 123 × 123 tile images. It can be seen that the visual quality of the photomosaics are all high, and the QR code on each photomosaic can be read by standard QR code readers.
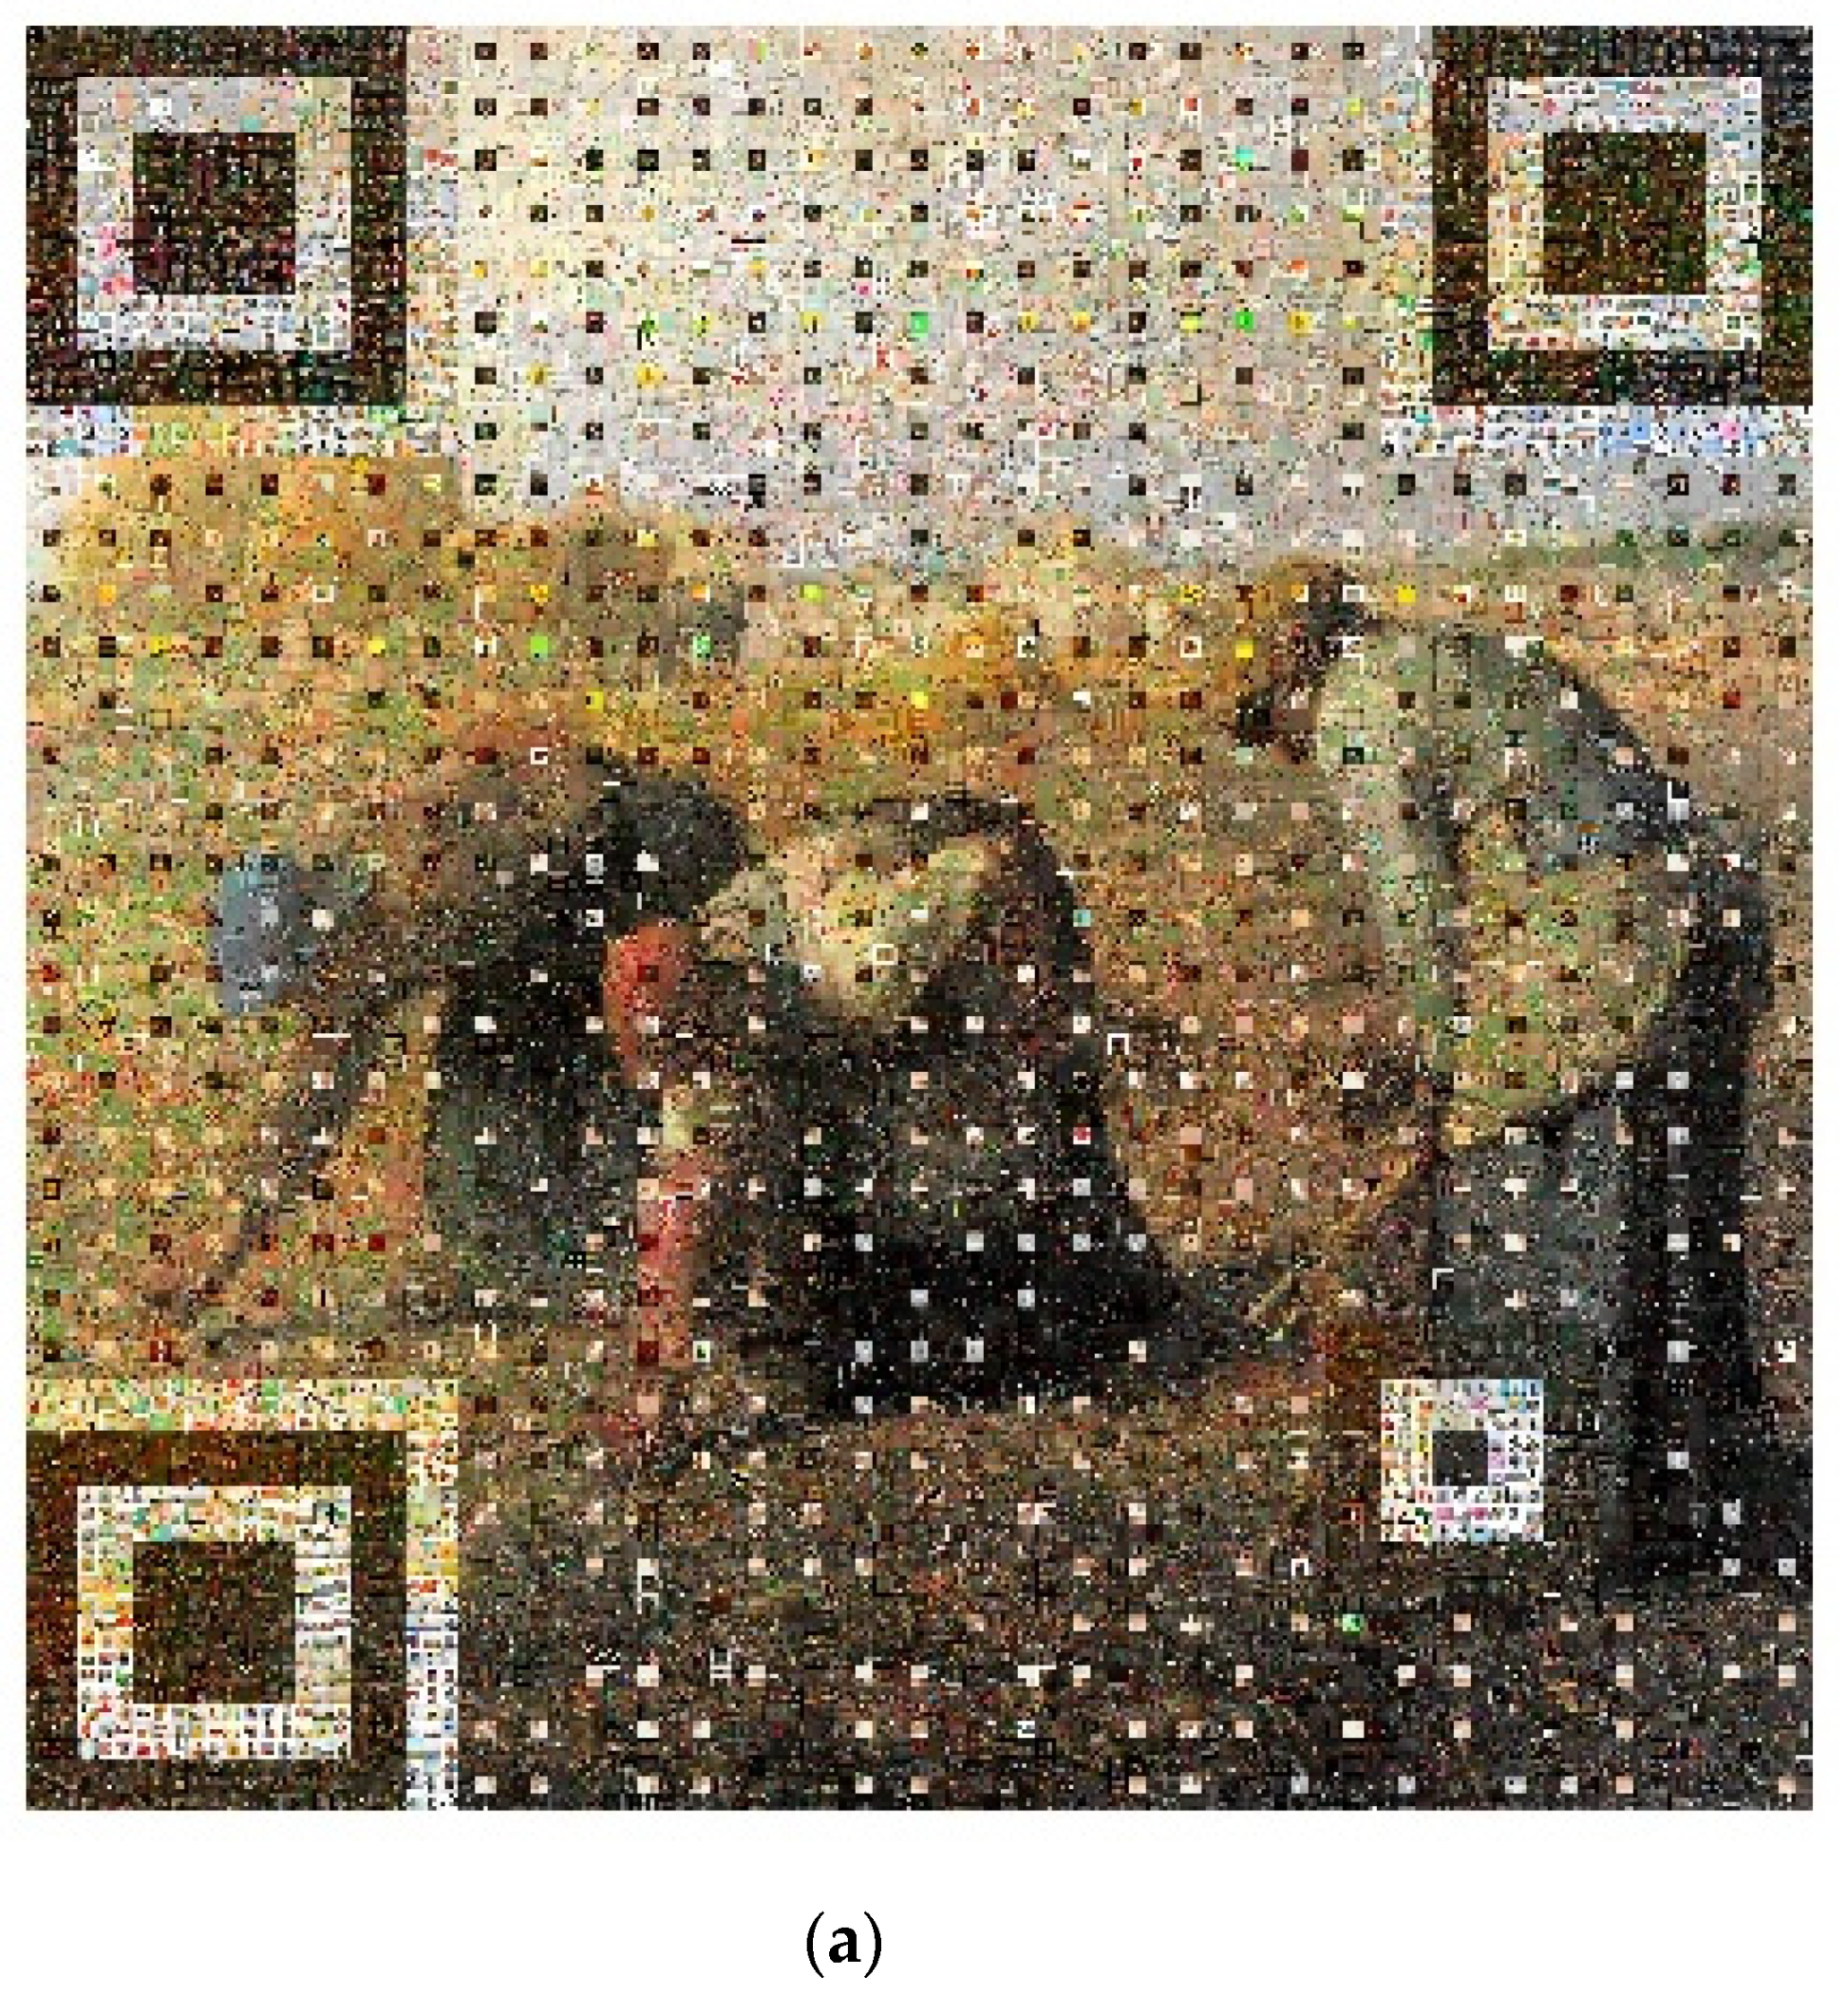
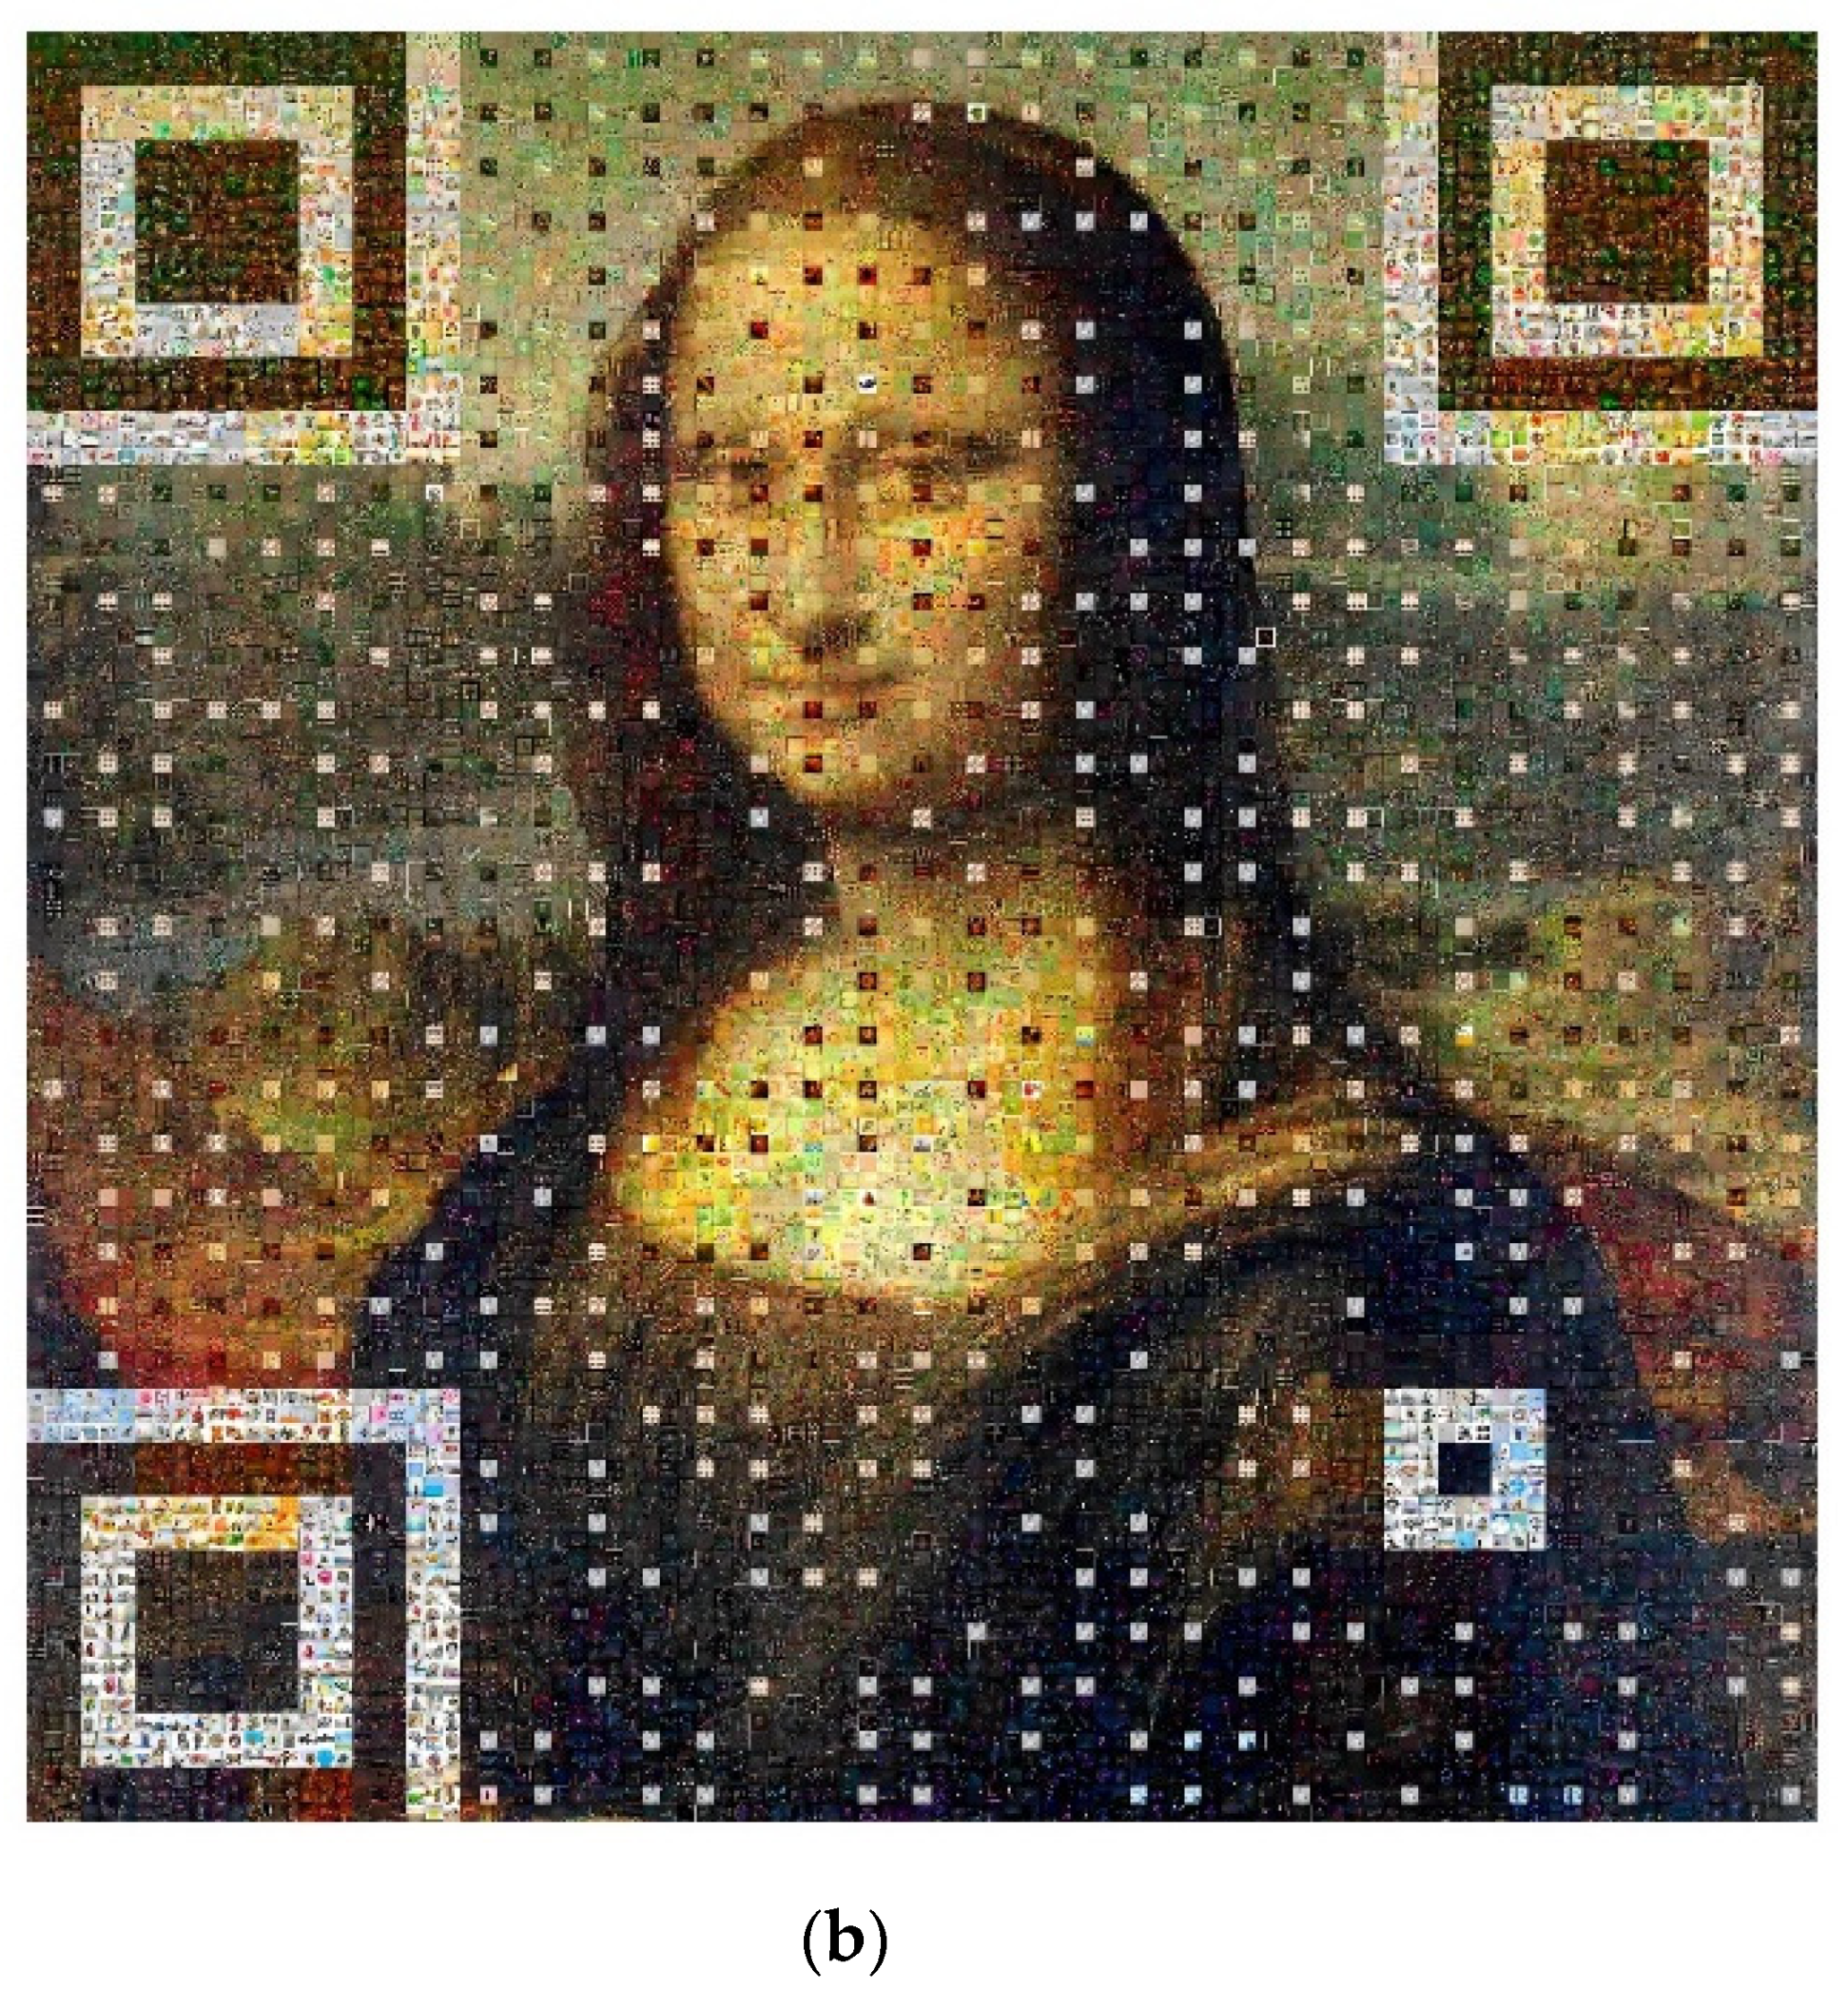
Figure 15 shows another two examples of the photomosaic-generating result. Again, the visual quality of each photomosaic is high and the QR code on the photomosaic can easily be accessed by using a QR code reader on the cell phone to take a photo of the photomosaic.
The average computational times for generating photomosaics in the proposed 3 levels of construction methods using different numbers of tile images are summarized in Table 3. This shows that as the number of tile images increases, the computational time is also increased. The average computation time for creating photomosaic art from the proposed method is acceptable.
5. Conclusions
A conventional photomosaic displays two-layer of visual information. At a close range, a matrix of individual tile images can be seen. From a far position, the photomosaic appears to be a single image. This paper proposes a new method to endow photomosaics with an additional message—a QR code. In a photomosaic with a QR code capability method, obtaining high visual quality of the photomosaic and also ensuring high decoding robustness of the QR code is challenging. This paper applies a pre-classifying step to group the candidate tile images into categories in such a way that tile images with similar colors and textures belonging to the same category. It speeds up the representative tile image-searching procedure in photomosaic generation process. Three construction levels for generating the photomosaics with different resolutions are designed, and experiments show the proposed method can generate photomosaics with acceptable visual quality and QR codes that can easily be read by standard QR code readers.
The proposed method extends photomosaics from exhibiting pure visual information to providing an additional text message. The text message on the QR code can be read by taking a photo of the photomosaic using a standard QR code scanner installed on a cell phone. In this way dynamic multimedia information for the photomosaic can easily be linked and accessed. It increases the potential and feasibility of applying photomosaic art to many creative applications. For example, in an art exhibition program of a museum, a photomosaic with a QR code linked to the webpage of the exhibition can be generated. The master image of the photomosaic can be a poster image depicting the theme of the exhibition, and the tile images can be photos uploaded from visitors. The museum can display the photomosaic on billboards. The visitors can interact with the photomosaic during the exhibition to obtain a quality experience.
Author Contributions
Conceptualization and methodology, R.-Z.W. and Y.S.; software, C.-L.L.; validation, R.-Z.W., Y.S. and C.-L.L.; writing—original draft preparation, C.-L.L. and Y.S.; writing—review and editing, R.-Z.W. All authors have read and agreed to the published version of the manuscript.
Funding
This research was supported in part by the Ministry of Science and Technology of Taiwan, under Grant MOST 104-2221-E-155-041.
Conflicts of Interest
The authors declare no conflict of interest.
References
- Silvers, R.; Hawley, M. Photomosaics; Henry Holt: New York, NY, USA, 1997. [Google Scholar]
- Di Blasi, G.; Petralia, M. Fast photomosaic. In Proceedings of the Poster ACM/WSCG2005: 13th International Conference in Central Europe on Computer Graphics, Visualization and Computer Vision 2005, Plzen, Czech Republic, 31 January–4 February 2005; pp. 15–16. [Google Scholar]
- Choi, Y.S.; Koo, B.K.; Moon, B.R. Optimization of an image set by genetic feature selection for real-time photomosaics. In Proceedings of the GECCO’10: Genetic and Evolutionary Computation Conference, Portland, OR, USA, 7–11 July 2010; pp. 1309–1310. [Google Scholar]
- Fujisawa, M.; Amano, T.; Taketomi, T.; Yamamoto, G.; Uranishi, Y.; Miyazaki, J. Interactive photomosaic system using GPU. In Proceedings of the 20th ACM International Conference on Multimedia, Nara, Japan, 29 October–2 November 2012; pp. 1297–1298. [Google Scholar]
- Kim, J.; Pellacini, F. Jigsaw image mosaics. In Proceedings of the SIGGRAPH2002: 29th Annual Conference on Computer Graphics and Interactive Techniques, San Antonio, TX, USA, 23–26 July 2002; pp. 657–664. [Google Scholar]
- Di Blasi, G.; Gallo, G.; Petralia, M.P. Puzzle image mosaic. In Proceedings of the IASTED/VIIP2005: International Conference on Visualization, Imaging & Image Processing 2005, Benidorm, Spain, 7–9 September 2005. [Google Scholar]
- Orchard, J.; Kaplan, C.K. Cut-out image mosaics. In Proceedings of the 6th International Symposium on Non-Photorealistic Animation, Annecy, France, 9–11 June 2008; pp. 79–87. [Google Scholar]
- Park, J.W.; Yoon, K.H.; Ryoo, S.T. Multi-layered stack mosaic with rotatable object. Lect. Notes Comput. Sci. 2006, 1, 12–23. [Google Scholar]
- Kang, D.; Seo, S.H.; Ryoo, S.K.; Yoon, K.H. A photomosaic image generation on smartphone. In Lecture Notes in Electrical Engineering; Springer: Dordrecht, The Netherlands, 2011; Volume 107. [Google Scholar] [CrossRef]
- D’Souza, D.; Ciesielski, V.; Berry, M.; Trist, K. Generation of self-referential animated photomosaics. In Proceedings of the 15th ACM International Conference on Multimedia 2007, Augsburg, Germany, 23–29 September 2007; pp. 489–492. [Google Scholar]
- Lee, H.Y. Generation of photo-mosaic images through block matching and color adjustment. Int. J. Comput. Inf. Sci. Eng. 2014, 8, 43–46. [Google Scholar]
- Seo, S.; Kang, D. A photomosaic image generation method using photo annotation in a social network environment. Multimed. Tools Appl. 2016, 75, 12831–12841. [Google Scholar] [CrossRef] [Green Version]
- Dobashi, Y.; Haga, T.; Johan, H.; Nishita, T. A method for creating mosaic images using Voronoi diagrams. In Proceedings of the Eurographics 2002, Saarbrücken, Germany, 2–6 September 2002; pp. 341–348. [Google Scholar]
- Battiato, S.; Di Blasi, G.; Farinella, G.M.; Gallo, G. A survey of digital mosaic Techniques. In Proceedings of the Eurographics Italian Chapter Conference 2006, Catania, Italy, 22–24 February 2006; pp. 129–135. [Google Scholar]
- Choi, Y.S.; Jung, S.; Kim, J.W.; Koo, B.K. Real-time video photomosaics with optimized image set and GPU. J. Real-Time Image Process. 2014, 9, 569–578. [Google Scholar] [CrossRef]
- Shah, J.; Gala, J.; Parmar, K.; Shah, M.; Kambli, M. Range based search algorithm for photomosaic generation. Int. J. Adv. Res. Comput. Commun. Eng. 2014, 3, 5510–5512. [Google Scholar]
- Li, C.L.; Su, Y.; Wang, R.Z. Extended photomosaic with QR code capability. In Proceedings of the IEEE International Conference on Multimedia & Expo Workshops (ICMEW) 2017, Hong Kong, China, 10–14 July 2017; pp. 345–350. [Google Scholar]
- ISO/IEC 18004:2015. Information technology-Automatic identification and data capture techniques-QR code bar code symbology specification. Int. Organ. Stand. ISO/IEC 2015, 18004, 126. [Google Scholar]
- Chu, H.K.; Chang, C.S.; Lee, R.R.; Mitra, N.J. Halftone QR Codes. ACM Trans. Graph. 2013, 32, 1–8. [Google Scholar] [CrossRef]
- Lin, Y.; Chang, Y.; Wu, J. Appearance-Based QR Code Beautifier. IEEE Trans. Multimed. 2013, 15, 2198–2207. [Google Scholar] [CrossRef]
- Muja, M.; Lowe, D.G. Scalable nearest neighbor algorithms for high dimensional data. IEEE Trans. Pattern Anal. Mach. Intell. 2014, 36, 2227–2240. [Google Scholar] [CrossRef] [PubMed]
- FLANN—Fast Library for Approximate Nearest Neighbors. Available online: https://github.com/mariusmuja/flann (accessed on 7 September 2020).
- ZXing.Net. Available online: https://zxingnet.codeplex.com (accessed on 7 September 2020).
- Emgu CV. Available online: http://www.emgu.com (accessed on 7 September 2020).
- MIRFLICKR Download. Available online: http://press.liacs.nl/mirflickr/mirdownload.html (accessed on 7 September 2020).
- Chiu, Y.P.; Wang, R.Z.; Lee, Y.K. A fast image resizing technique with invariant aspect ratio of salient region. In Proceedings of the 2015 IPPR CVGIP, Yilan, Taiwan, 17–19 August 2015; pp. A5:1–8. [Google Scholar]
Figure 1.
Basic procedure for creating a photomosaic.

Figure 2.
Structure of a quick response (QR) code.

Figure 3.
Flowchart of the proposed photomosaic-generation scheme.

Figure 4.
Configuration of a QR code module on image blocks in three construction levels. (a) Module layout of level 1. (b) Module layout of level 2. (c) Module layout level 3.
Figure 4.
Configuration of a QR code module on image blocks in three construction levels. (a) Module layout of level 1. (b) Module layout of level 2. (c) Module layout level 3.

Figure 5.
QR code decoding rate for estimating δ and .

Figure 6.
QR code decoding rate for estimating .

Figure 7.
QR code decoding rate for estimating .

Figure 8.
The input QR code and master image. (a) QR code. (b) Master image.

Figure 9.
Photomosaic generated using the Level-1 method. (a) Photomosaic. (b) Zoom in tiles of the face of the dog.
Figure 9.
Photomosaic generated using the Level-1 method. (a) Photomosaic. (b) Zoom in tiles of the face of the dog.

Figure 10.
Photomosaic generated using the Level-2 method. (a) Photomosaic (b) Zoom in tiles of the face of the dog.
Figure 10.
Photomosaic generated using the Level-2 method. (a) Photomosaic (b) Zoom in tiles of the face of the dog.

Figure 11.
Photomosaic generated using the Level-3 method. (a) Photomosaic. (b) Zoom in tiles of the face of the dog.
Figure 11.
Photomosaic generated using the Level-3 method. (a) Photomosaic. (b) Zoom in tiles of the face of the dog.

Figure 12.
Comparison of creating level-3 photomosaics with different numbers of tile images. (a) 100,000 tiles. (b) 20,000 tiles. (c) 500,000 tiles.
Figure 12.
Comparison of creating level-3 photomosaics with different numbers of tile images. (a) 100,000 tiles. (b) 20,000 tiles. (c) 500,000 tiles.

Figure 13.
Level-3 photomosaic generated with QR code version 5.

Figure 14.
Level-3 photomosaic generated with QR code version 6.

Figure 15.
More photomosaics generated using the level-3 construction method. (a) Photomosaic with master image “The Gleaners”. (b) Photomosaic with master image “Mona Lisa”.
Figure 15.
More photomosaics generated using the level-3 construction method. (a) Photomosaic with master image “The Gleaners”. (b) Photomosaic with master image “Mona Lisa”.


Table 1.
Photomosaic capturing devices.
| Device | QR Code Reader |
|---|---|
| Samsung S3 | Neo Reader |
| Barcode Scanner (ZXing) | |
| iPhone 6s | QR Reader |
| Barcode Scanner |
Table 2.
Number of tiles obtained for each category.
| Category | Quantity | Category | Quantity |
|---|---|---|---|
| 111,932 | 24,249 | ||
| 21,702 | 47,366 | ||
| 139,164 | 483,366 | ||
| 138,628 | 482,298 | ||
| 253,024 | 358,026 | ||
| 253,904 | 358,696 | ||
| 111,932 | 24,249 | ||
| 1,000,000 | 1,000,000 |
Table 3.
Average time of generation photomosaics with version-4 QR code.
| Method Number of Tiles | Level 1 | Level 2 | Level 3 |
|---|---|---|---|
| 20,000 | 34.6 s | 3 min 16.0 s | 6 min 44.5 s |
| 100,000 | 34.9 s | 5 min 09.1 s | 11 min 10.7 s |
| 500,000 | 48.6 s | 7 min 03.0 s | 16 min 31.7 s |
| 1,000,000 | 1 min 04.8 s | 8 min 23.6 s | 23 min 57.4 s |
© 2020 by the authors. Licensee MDPI, Basel, Switzerland. This article is an open access article distributed under the terms and conditions of the Creative Commons Attribution (CC BY) license (http://creativecommons.org/licenses/by/4.0/).
Share and Cite
MDPI and ACS Style
Li, C.-L.; Su, Y.; Wang, R.-Z. Generating Photomosaics with QR Code Capability. Mathematics 2020, 8, 1613. https://0-doi-org.brum.beds.ac.uk/10.3390/math8091613
AMA Style
Li C-L, Su Y, Wang R-Z. Generating Photomosaics with QR Code Capability. Mathematics. 2020; 8(9):1613. https://0-doi-org.brum.beds.ac.uk/10.3390/math8091613
Chicago/Turabian StyleLi, Chin-Lin, Yangcong Su, and Ran-Zan Wang. 2020. "Generating Photomosaics with QR Code Capability" Mathematics 8, no. 9: 1613. https://0-doi-org.brum.beds.ac.uk/10.3390/math8091613
Note that from the first issue of 2016, this journal uses article numbers instead of page numbers. See further details here.