Deficits in the Statistical and Probabilistic Literacy of Citizens: Effects in a World in Crisis


1
Department of Statistics and O.R. and Mathematics Education, Faculty of Geology, University of Oviedo, Calle Jesús Arias de Velasco, s/n, 33005 Oviedo, Asturias, Spain
2
Department of Subject-Specific Education, Faculty of Education, University of Girona, Plaça Sant Domènec, 9, 17004 Girona, Catalonia, Spain
*
Author to whom correspondence should be addressed.
Mathematics 2020, 8(11), 1872; https://0-doi-org.brum.beds.ac.uk/10.3390/math8111872
Submission received: 30 September 2020
/
Revised: 15 October 2020
/
Accepted: 15 October 2020
/
Published: 29 October 2020
(This article belongs to the Special Issue Mathematical Modeling and Simulation in Science and Engineering Education II)
Abstract
:The emergency caused by coronavirus disease 2019 (COVID-19) has revealed significant deficiencies in citizens’ statistical and probabilistic knowledge and in people’s understanding of mathematical and, particularly, stochastic models, which may lead to wrong personal or institutional choices, with critical consequences for the entire population. Mathematics teachers play an essential role in ensuring citizens’ statistical and probabilistic literacy. This study aimed at analyzing the pedagogical content knowledge that teachers utilized to teach statistics and probability through considering contextualized situations. In order to accomplish this purpose, fourteen secondary mathematics teachers participated in a formative and evaluative activity that was designed using the transformational professional competence model. During each evaluative phase, a group discussion was conducted. Participants were asked to reflect on their actions when promoting statistical and probabilistic literacy by considering a range of topics (data science, didactic resources, and methodological approaches) that were addressed during the training phase. A mixed, quantitative–qualitative methodological design was used for the data collection and analysis, which involved open-ended, multiple-choice, or scale-type questions that were moderated by the Metaplan® approach and the Mentimeter® software. The main ideas that emerged from the results indicated the need to reinforce the use of real data, technological resources to handle the visualization of information, the elaboration of different types of graphs besides the classical ones, and the formulation of hypotheses. The initial diagnosis will continue within a research and practice community made up of teachers and researchers. Therefore, a working proposal based on examples and models contextualized within the COVID-19 crisis is presented in order to enhance secondary mathematics teachers’ pedagogical content knowledge.
1. Introduction
The coronavirus disease 2019 (COVID-19) pandemic has resulted in a global crisis in both social and economic areas. The virus has spread in a very short period to over 180 countries. In order to curb its expansion, several countries, such as Spain, have opted for the total or partial lockdown of their populations, with unprecedented repercussions. As a society, what can we learn from this exceptional situation? More specifically, how can research in mathematics education contribute?
Considering the different areas of research in mathematics education [1], this study focused on the professional development of mathematics teachers because we believe that the current crisis implies redesigning what is taught and how it is taught. In Spain, the current state of emergency caused by COVID-19 has highlighted some significant deficits in the mathematics knowledge of citizens, which makes it difficult for them to understand what is occurring, how it is occurring, and why it is occurring. Concepts such as the exponential model for virus propagation, the reading of big databases, the normal distribution (flattening the coronavirus curve, which is related to the density function), the law of rare events (for example, the fact that a 4% mortality rate out of 15,000 infected people generates more deaths than a 50% mortality rate out of 1000 infected), or probability models with subjective estimates [2] represent key knowledge that could encourage the population to act more intelligently.
Beyond questions of a lack of civility, we believe that this absence of knowledge may result in Spanish citizens carrying out some actions that are forbidden by the lockdown, such as going out for reasons that are not strictly necessary or traveling from a place that is a hotbed of COVID-19 to a place where they have a second home in order to have a better time during the lockdown, despite the risk that this represents to the inhabitants of the new location.
This lack of mathematics knowledge in general, and in relation to statistics and probability in particular, has also been highlighted in the press, as well as in the information shared by some governments and the way they share this information; even the Director-General of the World Health Organization (WHO) has warned of an infodemic as part of the COVID-19 crisis [3], warning of the lack of accurate information being published by the media during the outbreaks. As an example, Figure 1 shows graphs that were supposed to provide information about the expansion of COVID-19 in Spanish autonomous communities (i.e., regions) during the period from 9–22 March 2020. Nevertheless, these supposedly comparative graphs use different frequency scales on the y-axis, with varying steps between 20 and 500 units, which could very easily confuse the general population and lead to misinterpretations.
Given these kinds of situations, in this article, we advance the claim that an in-depth reflection is needed from the perspective of the professional development of mathematics teachers to analyze the reasons for this lack of knowledge and to make some proposals for enabling an evolution toward improvements.
In this study, we focused on the professional development of Spanish in-service secondary school mathematics teachers. Our assumption was that they usually had a formalist background in mathematics and lacked pedagogical knowledge regarding how to teach statistics and probability [5,6]. Consequently, we considered that the absence of statistical and probabilistic literacy in the population could be due to the lack of training of mathematics teachers in terms of pedagogical content knowledge. Therefore, it was essential to carry out a thorough diagnosis of what these deficits were.
From this perspective, the aim of this study was to analyze the pedagogical knowledge teachers utilized to teach statistics and probability on the basis of contextualized situations. The contribution of this study to mathematics education research is reflected in the design and development of a training and evaluative activity that was grounded in the transformational professional competence model and in the components and factors constituting the idea of statistical and probabilistic literacy. From the results obtained during the evaluative component of the activities, this study provided a working proposal based on examples and models contextualized within the COVID-19 crisis that were aimed at enhancing secondary mathematics teachers’ pedagogical content knowledge.
2. Theoretical Framework
In order to theoretically support our study, two interrelated aspects were addressed: (a) the professional development of mathematics teachers and (b) statistical and probabilistic literacy. To contextualize these issues, we point out two preliminary ideas about teacher training in Spain.
First, the Spanish education system is managed by 18 Departments of Education, with each one corresponding to one of the regional governments, together with the national government in some parts of the territory and the schools abroad. Regulatory and coordination functions are held by the national Ministry, while the regional governments are responsible for scheduling and planning the activities for continuous teacher training via courses or training centers. These training programs vary between regions and even between training centers, with all of them having complete autonomy to design courses, which are not compulsory for teachers and not necessarily linked to the teachers’ specialization (mathematics, in our case)
Second, in the case of secondary education teachers, holding a master’s degree has been compulsory for secondary education teachers since 2009, which is made up of consecutive training after completing a specialized bachelor’s degree [7]. This degree provides more comprehensive and complete training for teachers who will work in classroom contexts, which in recent years, have grown in complexity, not only in terms of the students but also in organizational and structural terms. The master’s degree is intended to overcome the formalist training that is very focused on the knowledge of the content and to promote broad pedagogical knowledge that can be used to teach the content.
2.1. Professional Development of Mathematics Teachers
Studies on the professional development of mathematics teachers have constituted one of the most prolific lines of research in recent years [8]. These studies provide knowledge that allows us to advance our understanding of the practice of the mathematics teacher as a field of scientific research, opening channels that enhance communication between theory and practice, and between research and teacher training [9].
Within this context of developing an understanding of mathematics teachers’ practice, our aim was to analyze the pedagogical knowledge that Spanish in-service teachers utilized to plan and manage mathematics teaching in the classroom and, above all, to consider how it can be transformed to promote their professional competence. Different theoretical models have been developed to analyze mathematics teachers’ knowledge. Shulman [10] advanced a model that has had the most impact on studies of teachers’ thinking. He proposed three categories that, from his perspective, constitute teacher knowledge: (a) knowledge of the content, which refers to teachers’ mental organization of the content they are going to teach; (b) pedagogical content knowledge (PCK), which refers to the type of knowledge that goes beyond the material to be taught and that is focused on an understanding of what facilitates or hinders the learning of specific themes of the subject taught; (c) knowledge of the curriculum, which refers to knowledge about the curricular program at the educational level that is being worked on, as well as the variety of materials (such as textbooks) that can be used in teaching.
The PCK category has attracted considerable interest in the field of mathematics education research. For example, Ball [11,12] proposes a line of research in which teachers’ mathematical and pedagogical knowledge is analyzed on the basis of a model known as mathematical knowledge for teaching (MKT). Hill, Schilling, and Ball [13], Hill, Rowan, and Ball [14], Ball, Thames, and Phelps [15], and Hill, Ball, and Schilling [16] took up Shulman’s idea of PCK by considering teachers’ knowledge of what promotes or hinders mathematics learning to be an important element. From this model, PCK is conceived as the fundamental knowledge needed to develop processes of mathematics teaching and learning and comprises the following subdomains: knowledge of content and students (KCS), knowledge of content and teaching (KCT), and knowledge of the curriculum. Another proposal is the mathematics teacher’s specialized knowledge (MTSK) model, which was elaborated by Carrillo et al. [17] on the basis of a fine-tuning of the MKT. Regarding the PCK, it is made up of the following subdomains: knowledge of mathematics teaching (KMT), knowledge of features of mathematics learning (KFLM), and knowledge of mathematics learning standards (KMLS). It is important to note the role that teachers’ beliefs play in the MTSK model since while not constituting a type of knowledge in itself, they can influence and even determine teachers’ conceptions and ways of carrying out educational tasks. The didactic–mathematical teacher model by Godino [18] is another proposal that aims to explore what a mathematics teacher needs to know to carry out their job. This includes the didactic dimension, which comprises epistemic, cognitive, affective, interactional, mediational, and ecological facets. In summary, the different models described above highlight the considerable interest that exists in analyzing the pedagogical knowledge that teachers have for teaching mathematics since this has direct repercussions on their students’ learning.
What happens, however, when teachers’ pedagogical knowledge is non-existent or lacking due to an excessively formalist training model? Studies in mathematics education have tried to respond to this question using didactic approaches to offer guidelines on what mathematics should be taught and, above all, how they should be taught. More recently, specific models have been designed that are focused more directly on transforming teacher practice, such as the transformational professional competence model [19]. This model, which is based on reflective learning [20] and education for sustainability [21], defines elements for the transformation of prior knowledge, experiences, and belief systems into professional competence in mathematics pre-service teachers (Figure 2). From this perspective, it promotes the link between academic knowledge and professional experiences in the sense previously proposed by Hahn [22] in terms of teaching statistics.
Figure 2 shows, first of all, that one of the main purposes of teacher education is to progressively transform pre-service teachers’ prior knowledge, experiences, and beliefs into competencies that contribute to their professional development. A second issue that is essential to consider is that knowledge is transformed into various phases that must necessarily be developed symmetrically in the two types of agent involved: pre-service teachers and lecturers. This is a matter of great importance because if pre-service teachers and lecturers are not synchronized during a teaching sequence, it is very difficult for teacher education to contribute to the transformation of pre-service teachers’ knowledge and values. Finally, it should be considered whether this transformation process is carried out within the framework of group discussions and/or communities of practice [23] through using various strategies and techniques, such as asking good questions to promote reflective dialogues.
The essential components of this model (deconstruction, co-construction, and reconstruction) have been successfully applied in previous studies with Spanish in-service teachers [24,25]; therefore, we consider that these components are also effective for promoting their professional development and, more specifically, transforming their pedagogical knowledge in order to improve it.
2.2. Statistical and Probabilistic Literacy
We have already suggested in the introduction that Spanish mathematics teachers tend to have a formalist knowledge of mathematics, in the sense defined by Bourbaki, according to which, they lack pedagogical knowledge regarding how to teach mathematics in general, and statistics and probability in particular. In relation to this particular content, and in order to guarantee more contextualized teaching, statistical and probabilistic literacy needs to be promoted through authentic tasks, which is understood as those tasks that simulate approaches to real life in the most reasonable way possible [26], beyond that of solving decontextualized exercises in a mechanical way and using formulas that can be applied without being understood. In this sense, Hahn [27] highlights the importance of using real contexts to teach statistics, in which data are defined as numbers in context [28]. For these authors, context is a characteristic of the discipline and it is what differentiates it from mathematics, which is often defined as the essential language of statistics [29]. Therefore, for Hahn [27] (p. 34), “context is therefore essential. In teaching statistics, reference statistical practices must be considered, but also ensure that statistics are not cannibalized by the host discipline.”
In tune with these ideas, Gal [30] characterizes statistical literacy, which he conceives as the ability to understand and critically evaluate statistical results that permeate daily life and to appreciate the contribution that statistics make to public, private, professional, and personal decisions. More specifically, Gal indicates that this relates to the person’s capacity to interpret, critically evaluate, and express their opinions on statistical information, arguments related to data, or stochastic phenomena, when applicable. Furthermore, Gal argues that statistically literate behavior requires the joint activation of different cognitive components (literacy skills, statistical knowledge, and knowledge of mathematics, context, or the world of knowledge), as well as a willingness (the presence of a critical position, the belief in the power of statistical processes, the belief in oneself as a person capable of thinking statistically, and the belief in the legitimacy of adopting a critical perspective regarding information received from “official” sources or experts). Likewise, Gal [30,31] also describes cognitive components (big ideas: variation, randomness, independence, predictability/uncertainty; how to calculate probabilities; the importance of language, context, and critical questions) and dispositional factors (critical position, beliefs, and attitudes, as well as personal feelings in relation to uncertainty and risk) as basic elements of probabilistic literacy, which are clearly related to statistical literacy.
One of the most recognized contributions toward promoting this literacy is the Guidelines for Assessment and Instruction in Statistics Education (GAISE) Project [32]. The revised recommendations simplified and reordered the original ones, which are now: (1) teach statistical thinking (teach statistics as an investigative process of problem-solving and decision-making; give students experience with multivariable thinking), (2) focus on conceptual understanding, (3) integrate real data with a context and purpose, (4) foster active learning, (5) use technology to explore concepts and analyze data, and (6) use assessments to improve and evaluate student learning.
It is also important to consider the notion of data literacy. Although the term arose at the beginning of the 21st century [33], it has only been put in the educational international agenda very recently; this was strongly influenced by the rise of data science, which is linked to big data and the so-called fourth industrial revolution [34], to which unsuspected health-related phenomena, such as COVID-19, should be added, with far-reaching socio-economic repercussions. Data science is emerging as one of the most important interdisciplinary fields, which mainly combines concepts and methods from statistics and computer science but also from mathematics and information sciences. The importance of data literacy has been acknowledged by the Organization for Economic Co-operation and Development (OECD) [35], which has highlighted it as one of the main goals of the 2030 Agenda. Definitions of data literacy include many facets that have been used when defining statistical literacy, but the paradigm of data-driven science is now especially underlined. Within the goals of the 2030 Agenda, OECD points out the need for pre-processing data to foster data quality that produces meaningful information by organizing and, especially, visualizing data.
Batanero and her team at the University of Granada (Spain) have provided multiple resources and strategies for advancing statistical and data literacy. By way of example, Batanero and Chernoff [36] present a collection of selected papers that represent the current variety of research on the teaching and learning of probability. The respective chapters address a diverse range of theoretical, empirical, and practical aspects that underpin the teaching and learning of probability, curricular issues, probabilistic reasoning, and misconceptions and biases, as well as their pedagogical implications. Batanero and Borovcnik [37] demonstrated how investigations and experiments provide promising teaching strategies to help high school students acquire statistical and probabilistic literacy. The authors put the following educational principles into practice, which reflect their views regarding how these subjects should be taught: a focus on the most relevant ideas, postponing extensions to later stages; illustrating the complementary/dual nature of statistical and probabilistic reasoning; utilizing the potential of technology and showing its limits; reflecting on the different levels of formalization to meet the wide variety of students’ previous knowledge, abilities, and learning types. A few years before, Batanero and Díaz [38] described ways of developing a statistical curriculum for secondary or university education through appropriately sequenced projects.
In light of this previous work, this study aimed to analyze the pedagogical knowledge of fourteen secondary education mathematics teachers to promote the teaching of statistics and probability. In order to accomplish this purpose, a formative and evaluative activity was designed based on the transformational professional competence model presented above. With the data obtained, we outlined a proposal for statistical and probability didactics that will help to understand phenomena such as COVID-19 and to act accordingly.
3. Methodology
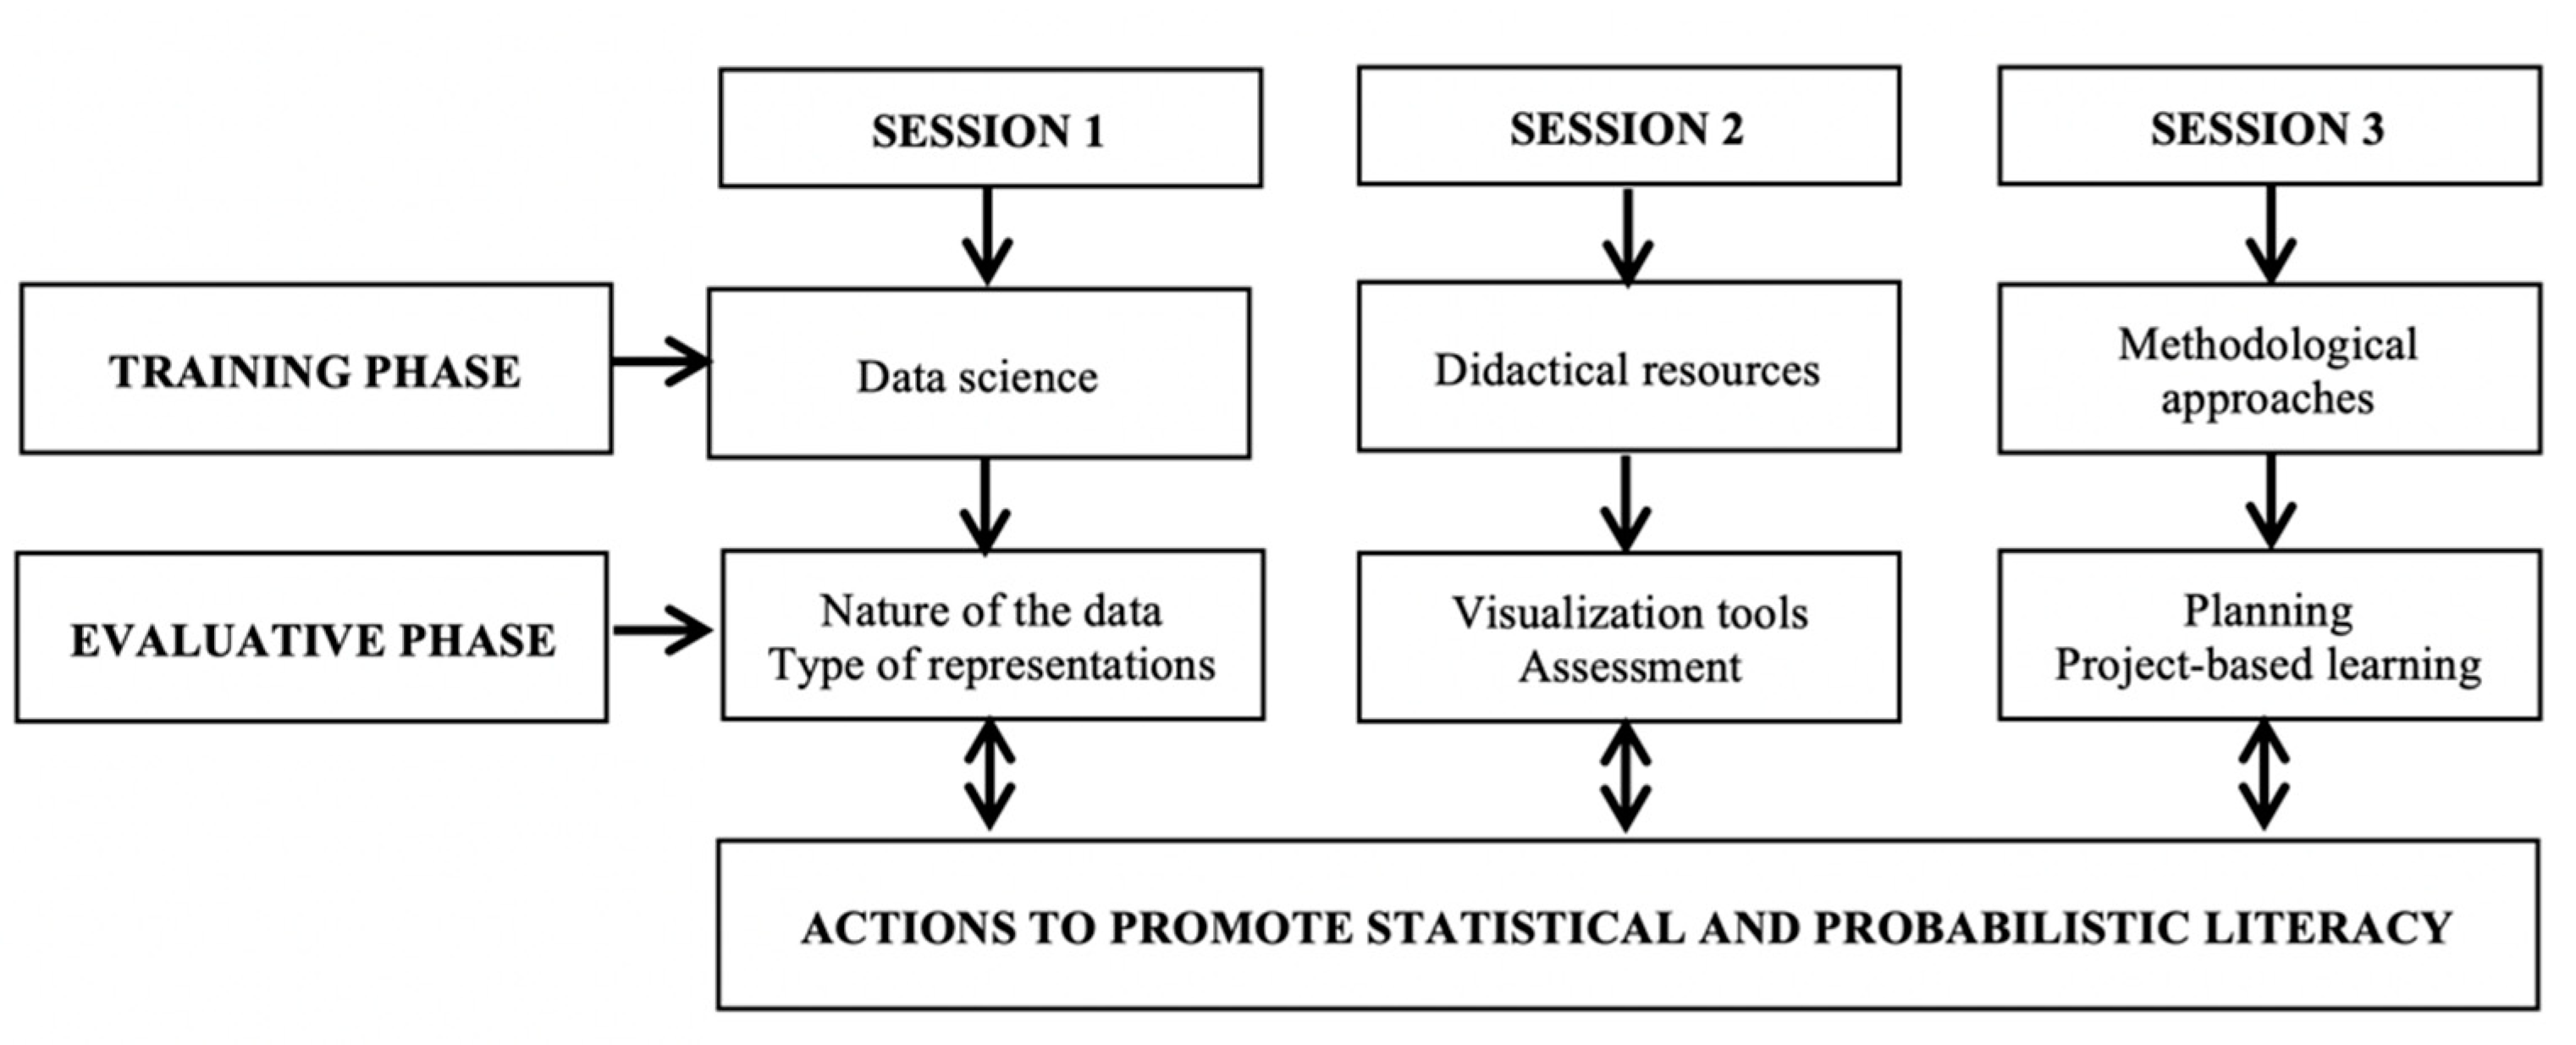
Building on both the transformational professional competence model and on the components and factors constituting the idea of statistical and probabilistic literacy, a training and evaluative activity was developed. The activity consisted of three sessions lasting three and a half hours each and took place over two consecutive weeks in November 2019. Each session comprised two phases, following previous research methodological designs (see [19,24] in terms of the transformational professional competence model in relation to in-service teachers). Figure 3 illustrates the structure of the activity and the organization of the topics covered in each session. Fourteen mathematics teachers from diverse secondary education schools located in different cities within the same region (Asturias, Spain) participated in the activity. Although the sampling technique (non-random) was a limiting factor regarding generalizing the results to a larger population of teachers, this study established an initial diagnosis of the pedagogical content knowledge the teachers utilized to teach statistics and probability. From the results, even if not representative, a working proposal based on examples and models contextualized within the COVID-19 crisis was presented.
During each training phase, an expert provided some explicit practical guidelines about how to promote statistical and probabilistic literacy in secondary education students. This phase had a twofold goal. The first purpose was to share didactic resources for promoting statistical and probabilistic literacy with teachers, such as data manipulation and visualization techniques; situations and contexts that are real and attractive to students; methodologies related to project-based learning, interdisciplinarity, or group work. These topics were aligned with the revised GAISE Project recommendations mentioned before. Second, it aimed at evoking participants’ reflection on their own teaching practice, focusing their attention on a specific topic that would be further addressed during the second phase of the corresponding session. During this phase, according to the deconstruction microprocess established in Figure 2, teachers’ previous knowledge emerged, and they became conscious about it. Hence, it provided an opportunity to detect knowledge deficits, especially about pedagogical knowledge, and to identify beliefs that could obstruct the promotion of adequate statistical and data literacy (for instance, adherence to a textbook as the sole teaching resource).
During each evaluative phase, participants were asked to reflect on their actions when promoting statistical and probabilistic literacy by considering the topic addressed by the expert during the preceding phase. Information was gathered using qualitative research techniques. In particular, a group discussion that was moderated using the Metaplan® [39] approach and Mentimeter® (version 3.1, Mentimeter AB, Stockholm, Sweden) software, was conducted in each session. Group discussions allowed for obtaining the information shared within a group of individuals that sought to generate ideas and solutions, develop opinions and agreements, or formulate objectives and actions. During the discussions, what arose in the training phase tackled previous knowledge and beliefs, and by means of dialogue, interaction, and negotiation, the co-construction microprocess (Figure 2) started allowing for the beginning of the reconstruction of new professional knowledge. The two moderation methods produced a sudden visual image of participants’ contributions that were portrayed together with their shared understanding, which reinforced interaction and participation. Data obtained from the group discussions were analyzed by using a mixed, quantitative–qualitative methodology [40].
Briefly, the Metaplan® [39] moderation method requires arranging participants into small groups. After each question is posed by the moderator, a brainstorming process begins within each group: each participant presents his/her own opinions on the subject, providing the opportunity for other group members to agree or disagree. All ideas, verbally shared or not, must be written down on a self-adhesive card, one idea per card. After a few minutes, the moderator collects the cards and pins them on a board, organizing them into categories (see Figure 4), by grouping them or posting them isolated depending on how many people agreed. Before moving on to a new question, answers are discussed by the whole group, and new reflections or connections between existing ideas may emerge. The Metaplan® [39] moderation method was applied during the evaluative phase of the first session.
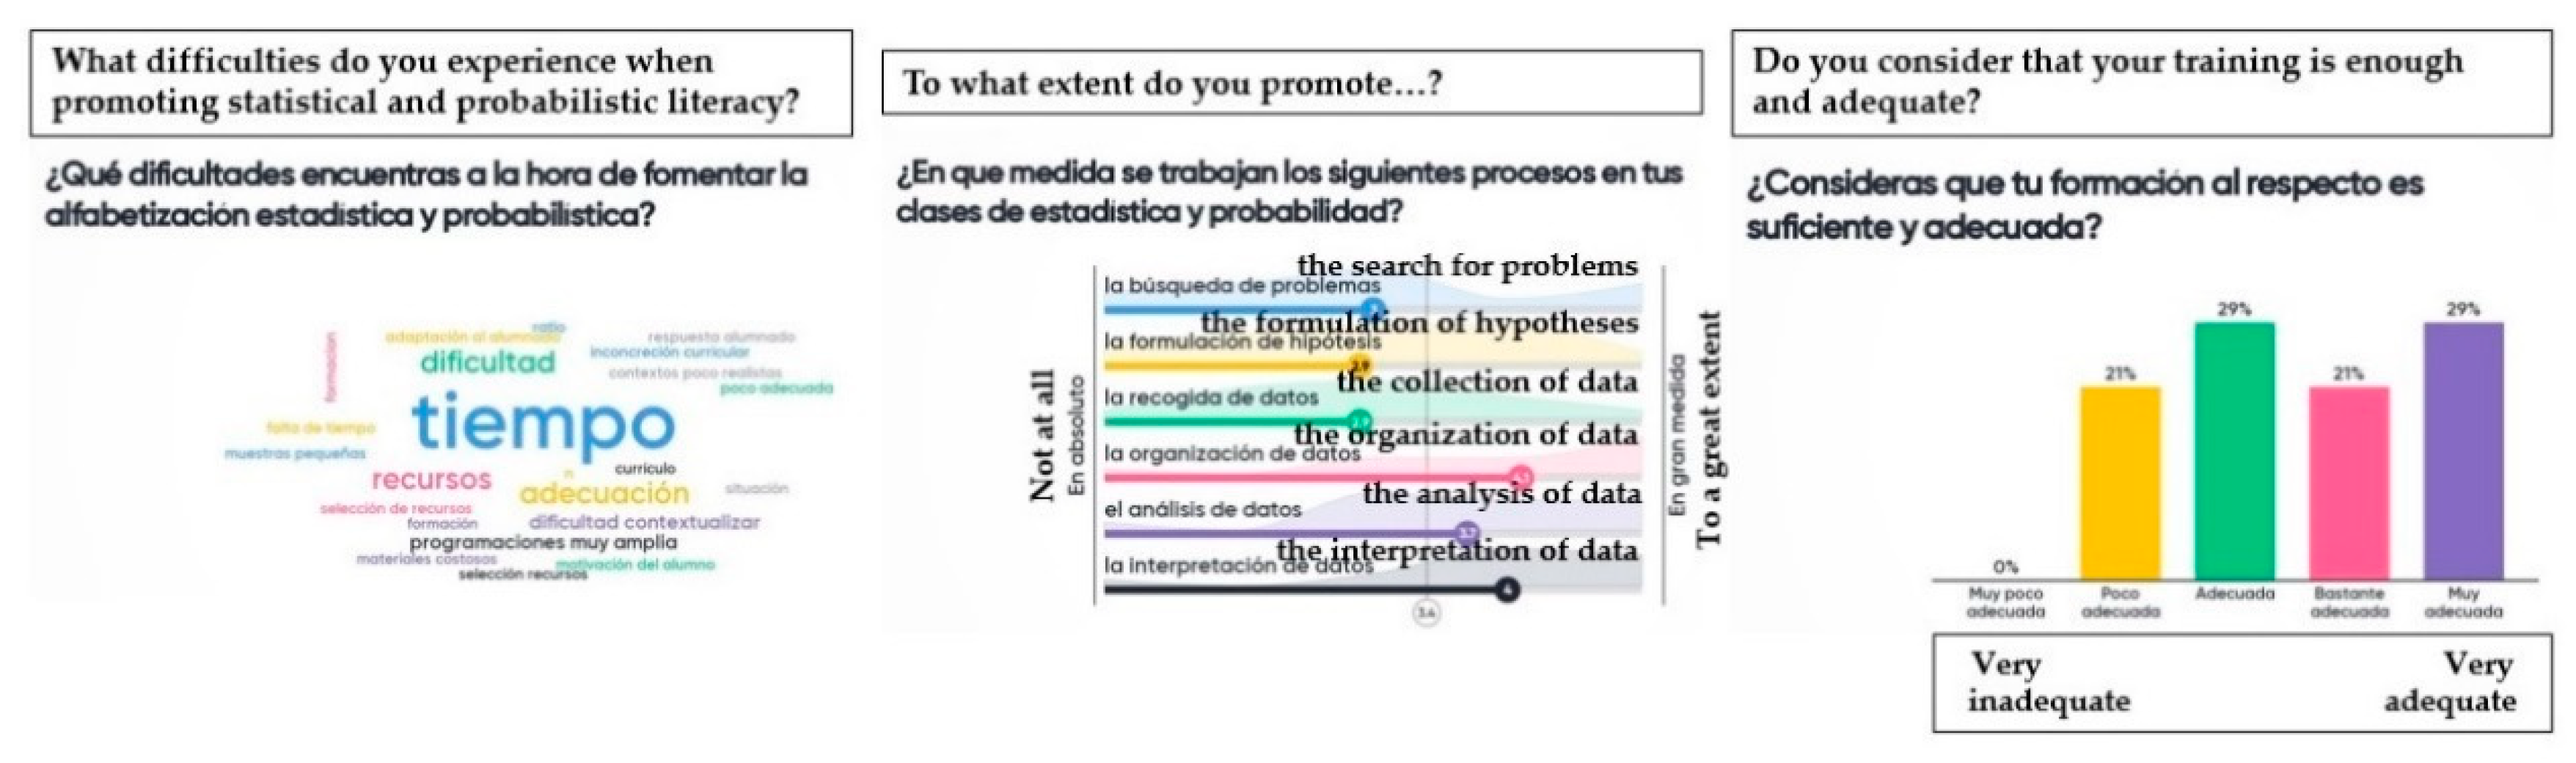
Mentimeter® is interactive presentation software. Participants answer individually on an electronic device. Questions can be of different types, such as open-ended, multiple-choice, or scale-type. For each question, once the answers have been submitted, results are shown by means of graphical representation (with a different display depending on its type, see Figure 5), and they are discussed within the whole group. Mentimeter® was used during the evaluative phase of the second and third sessions.
The questions used during each group discussion (see Table 1) focused on the three topics addressed during the training phase, namely, data science, didactic resources, and methodological approaches.
4. Results
The results are presented following the sequence stated in Figure 3, that is, data science, didactic resources, and methodological approaches.
Regarding data used by teachers when teaching statistics and probability, academic, demographic, personal, and social data predominated (such as consumption, sports, or leisure). The use of electoral databases or the PISA (Program for International Student Assessment) database appeared occasionally. Regarding the source of these data, the textbook, the media, and the Internet stood out. To a lesser extent, databases shared by public institutions, such as municipalities, the National Institute of Statistics, or the United Nations Educational, Scientific, and Cultural Organization (UNESCO), were proposed. Furthermore, the use of surveys carried out by students to collect their own data or the generation of random data by means of a calculator or a spreadsheet appeared as isolated ideas. Most participants claimed to not have difficulties integrating the context of the data when teaching; although, as it will be discussed later, the nature of the data they used may not stimulate students enough.
The participating teachers explained that the uses of the data they promoted coincided with the uses the Spanish curriculum [41] demands. In this sense, the elaboration of tables and graphs and the calculation of statistical parameters and probabilities prevailed over the analysis of variability or the interpretation of the results within the given context, with the latter being key processes in statistical literacy [32]. Regarding the elaboration of tables and graphs, the presence of frequency tables, histograms, sector diagrams, box diagrams, and scatter plots became noticeable. All participants claimed to encourage changes between tabular and graphical representations, but never between different types of graphs. During the discussion, teachers justified their actions regarding the nature, use, and types of representations of the data employed for teaching by referring to the predominant approach in textbooks. Notwithstanding, some teachers acknowledged that “there is a difference (in view of students’ learning) between what appears in the textbook and experimenting with a random event.” From this statement, we deduced that textbooks acted as a significant reference for teachers in terms of didactic resources.
Regarding the didactic resources used by teachers for teaching statistics and probability, the unanimous answer was the calculator and the spreadsheet, although a few teachers sporadically used some apps. Due to the shortage detected, both in number and variety, it was decided to deepen the discussion on this topic to try to detect the possible causes of something that at first glance seemed to be a problem. Teachers admitted to having limited availability of didactic resources and lacking training regarding the existence of such resources and their suitability for the statistical and probabilistic concepts students are expected to understand. In particular, teachers seemed reluctant to increase the use of technological resources for the visualization and analysis of data due to the little or no evaluation made of students’ competence in relation to the use of these resources. As external factors, participants pointed out the lack of flexibility of the curriculum (“learning standards are quite settled”), in addition to the low quality of students’ work, which appeared to be strongly discouraging for the teachers.
Regarding the methodological approaches followed when teaching statistics and probability, the results were similar to those of previous sessions. The use of textbooks, group work, surveys, experimentation, games, and project-based learning appeared to be the most common approaches, in contrast to the use of everyday situations, manipulatives, the elaboration of reports, and debates, which were mentioned by a couple of participants. In this sense, 44% of participants claimed to have fewer methodological training than they needed to promote statistical and probabilistic literacy in students.
Assuming the methodological guidelines in Alsina [42] for teaching statistics and probability, which was based on his mathematics teaching itineraries approach and the mathematical processes of the National Council of Teachers of Mathematics [43], together with the GAISE Project, participants were asked to use a Likert scale from 1 (“Not at all”) to 5 (“To a great extent”) to identify the extent to which they posed challenges and questions to students to explain, argue, and justify their actions; related the learning of statistics and probability to other areas of mathematics and to other areas of knowledge; encouraged interaction between students. Furthermore, they were asked to assess, using the same scale, the extent to which they promoted each of the processes of the statistical research cycle proposed by Wild and Pfannkuch [44]. Table 2 shows the mean values for each of these actions. The results confirmed the reflections made on the use of data presented above during the group discussions.
Batanero and Díaz [38] underlined project-based learning as an effective method for teaching and learning statistics and probability since it reproduces the whole statistical process of posing questions; collecting data; organizing, representing, and analyzing the information; making decisions about the questions; judging the validity of the answers. Nevertheless, only 36% of the participating teachers used this methodology to teach statistics and probability. Among the reasons given for not doing so, the lack of time and training stood out. Participants discussed some other limitations, such as the lack of coordination between teachers from different subjects, the lack of initiative, the size of the groups of students, the lack of motivation of students, and the difficulty of assessing students’ performance when using this methodology.
Throughout the activity, the lack of training appeared as a recurrent difficulty, regardless of the topic under discussion. Therefore, teachers were asked to assess the adequacy of their pedagogical knowledge in relation to their abilities to promote statistical and probabilistic literacy in students; it was found that only 50% considered their pedagogical knowledge quite or very suitable. The whole group agreed that teacher training is always voluntary and, in general, rather scarce. Diverse opinions were expressed regarding the adequacy of the little training they received. After a brief discussion about potential gaps, they highlighted three aspects to be reinforced that, coincidentally, were in line with the topics addressed during the activity: knowledge and management of didactic resources that are appropriate for teaching statistics and probability, guidelines on the design of didactical sequences, and, in general, training in statistical and probabilistic didactics. As an example, most teachers demanded “specific strategies to teach the mean and the median that allow students to understand which statistical parameter is better depending on the situation” and “[t]his kind of tips, related to explicit guidelines, is what we need.”
5. Discussion and Conclusions: Statistical and Probabilistic Models to be Used in In-Service Teacher Training
One of the main ideas to be discussed from the results obtained is the need for reinforcing the use of real data. The teachers acknowledged using mainly data from textbooks, that is, textbooks acted as a significant reference for teachers in terms of didactic resources. However, the literature about Spanish textbooks [45] remarks on the lack of real and motivating data. Moreover, during the COVID-19 pandemic, we have unfortunately experienced how important the collection of quality and reliable data is. Shortly after the world outbreak, physician and data scientist Ioaniddis stated that: “The data collected so far on how many people are infected and how the epidemic is evolving are utterly unreliable” [46] (p. 5). Some governments have repeatedly adjusted their methods for collecting and organizing the data for building a reliable and comparable database (e.g., in Spain [47]). Teachers, and students, have lived through this pandemic, paying extraordinary attention to all the news. Hence, if not before, teachers have now experience-based situations in which students can acknowledge the importance of data, in accordance with Hahn [27]. Consequently, when teaching statistics, teachers should not use pre-cooked data, which omit all the problems derived from collecting or sampling processes. Data for learning statistics must be not only realistic but also meaningful, and therefore, motivating for students. The use of real data directly links with project-based learning approaches since one of the initial problems that any statistical study faces is the nature and the quality of data. Through statistical projects, students can start making decisions about when, where, and how to sample, and about how to collect and organize the data. Thus, statistics is not simplified by handling a few data (taken from the textbook) and by posing a problem about something that is not problematic for students. However, when using this methodological approach, teachers must have an appropriate PCK. To develop it, training processes should start by acknowledging teachers’ beliefs and conceptions, previous knowledge, and possible conceptual and pedagogical deficits about statistics and probability that need to be deconstructed in order to build proper PCK [19]. The lack of time was pointed out by teachers as the main obstacle for not using this approach, which was parallel to the feeling of being pressured by curriculum overload, where these are commonly mentioned difficulties for implementing context-based mathematics and science education [48].
Using real data does not necessarily mean using big data, but it should not exclude it. It is obvious that secondary teachers are not data scientists, but the ease of access to entire open databases with a huge amount of information allows them to involve students in the big ideas of statistics [30,31]. Accessing databases, such as the National Institute of Statistics, was rarely mentioned in the group discussion, while that Institute has a broad variety of easily downloadable databases, comparison and visualization online tools, and challenges for students.
Databases lead us to discuss the use of technology. Teachers do not have to be experts in statistical software, but there is a lack of reinforcement of the use of technology to handle statistics in secondary school. Again, we have to develop proper PCK in teachers. The Spanish curriculum advocates for the use of technology but the mentioned technology is limited to calculator and spreadsheets such that textbooks still insist on many handmade and tedious calculations [49,50]. While a calculator and spreadsheets are interesting tools, teachers should explore others, such as adapted statistical software (e.g., R), visualization and modeling software (e.g., TinkerPlots, CODAP, or Fathom), and applets and other online tools, which are proven to be helpful when developing statistical thinking [51]. Particularly, simulation has been highlighted as a bridge between teachers’ content and pedagogical knowledge within this field [52].
Technology is also an essential resource for visualization. The Spanish curriculum only considers the classical statistical graphs: bar chart, pie chart, histogram, and scatter plot, which is clearly underestimating the importance of visualization in statistical literacy, particularly when dealing with public and big databases [53]. This fact leads to a mainly handmade construction of statistical graphs at school, while missing out on analyzing the opportunities, technicalities, and possible difficulties of technology-based construction of graphs. It also limits the potential use of the comparison of distributions, because handmade graphics are very time-consuming, and they make the exchange of representations more difficult. Moreover, limiting the study to the aforementioned statistical graphs leaves out the analysis of other representations that students are exposed to in their daily life, such as dot plots, tag clouds, tree maps, radar or spider charts, heat maps, and choropleths, that they can find in media, videogames, and social networks. A very interesting combination of these factors (data, technology, and visualization) is Gapminder, which offers open data together with dynamic visualization tools, which was recently proved to be useful for students at secondary school [54]. The use of visualization as a first approach to find out what happens with data focuses on exploratory data analysis (EDA) as a complementary, sometimes alternative, approach to statistics, making students become “data detectives” [55] and enriching the context-based statistical experiences [56]. However, the use of EDA demands teachers acquire new content and pedagogical knowledge, which led us again to the model of knowledge construction [19] since EDA is not part of the usual content in mathematics teachers’ initial training unless they have been trained in advanced statistics.
As a concluding section, we include here different core proposals to be used in in-service teacher training that has been contextualized within COVID-19. More specific classroom examples can be found in Rodríguez-Muñiz, Muñiz-Rodríguez, Vásquez, and Alsina [57] and Vásquez, Rodríguez-Muñiz, Muñiz-Rodríguez, and Alsina [58]. Alternative proposals can be outlined based on similar up-to-date urgent topics, such as climate change, poverty, gender equality, or other sustainable development goals of the 2030 Agenda [59,60]. The subsequent double purpose was to implement in-service training based on these models to fill the gaps detected during the diagnosis phase and to analyze the results of this implementation within in-service training programs.
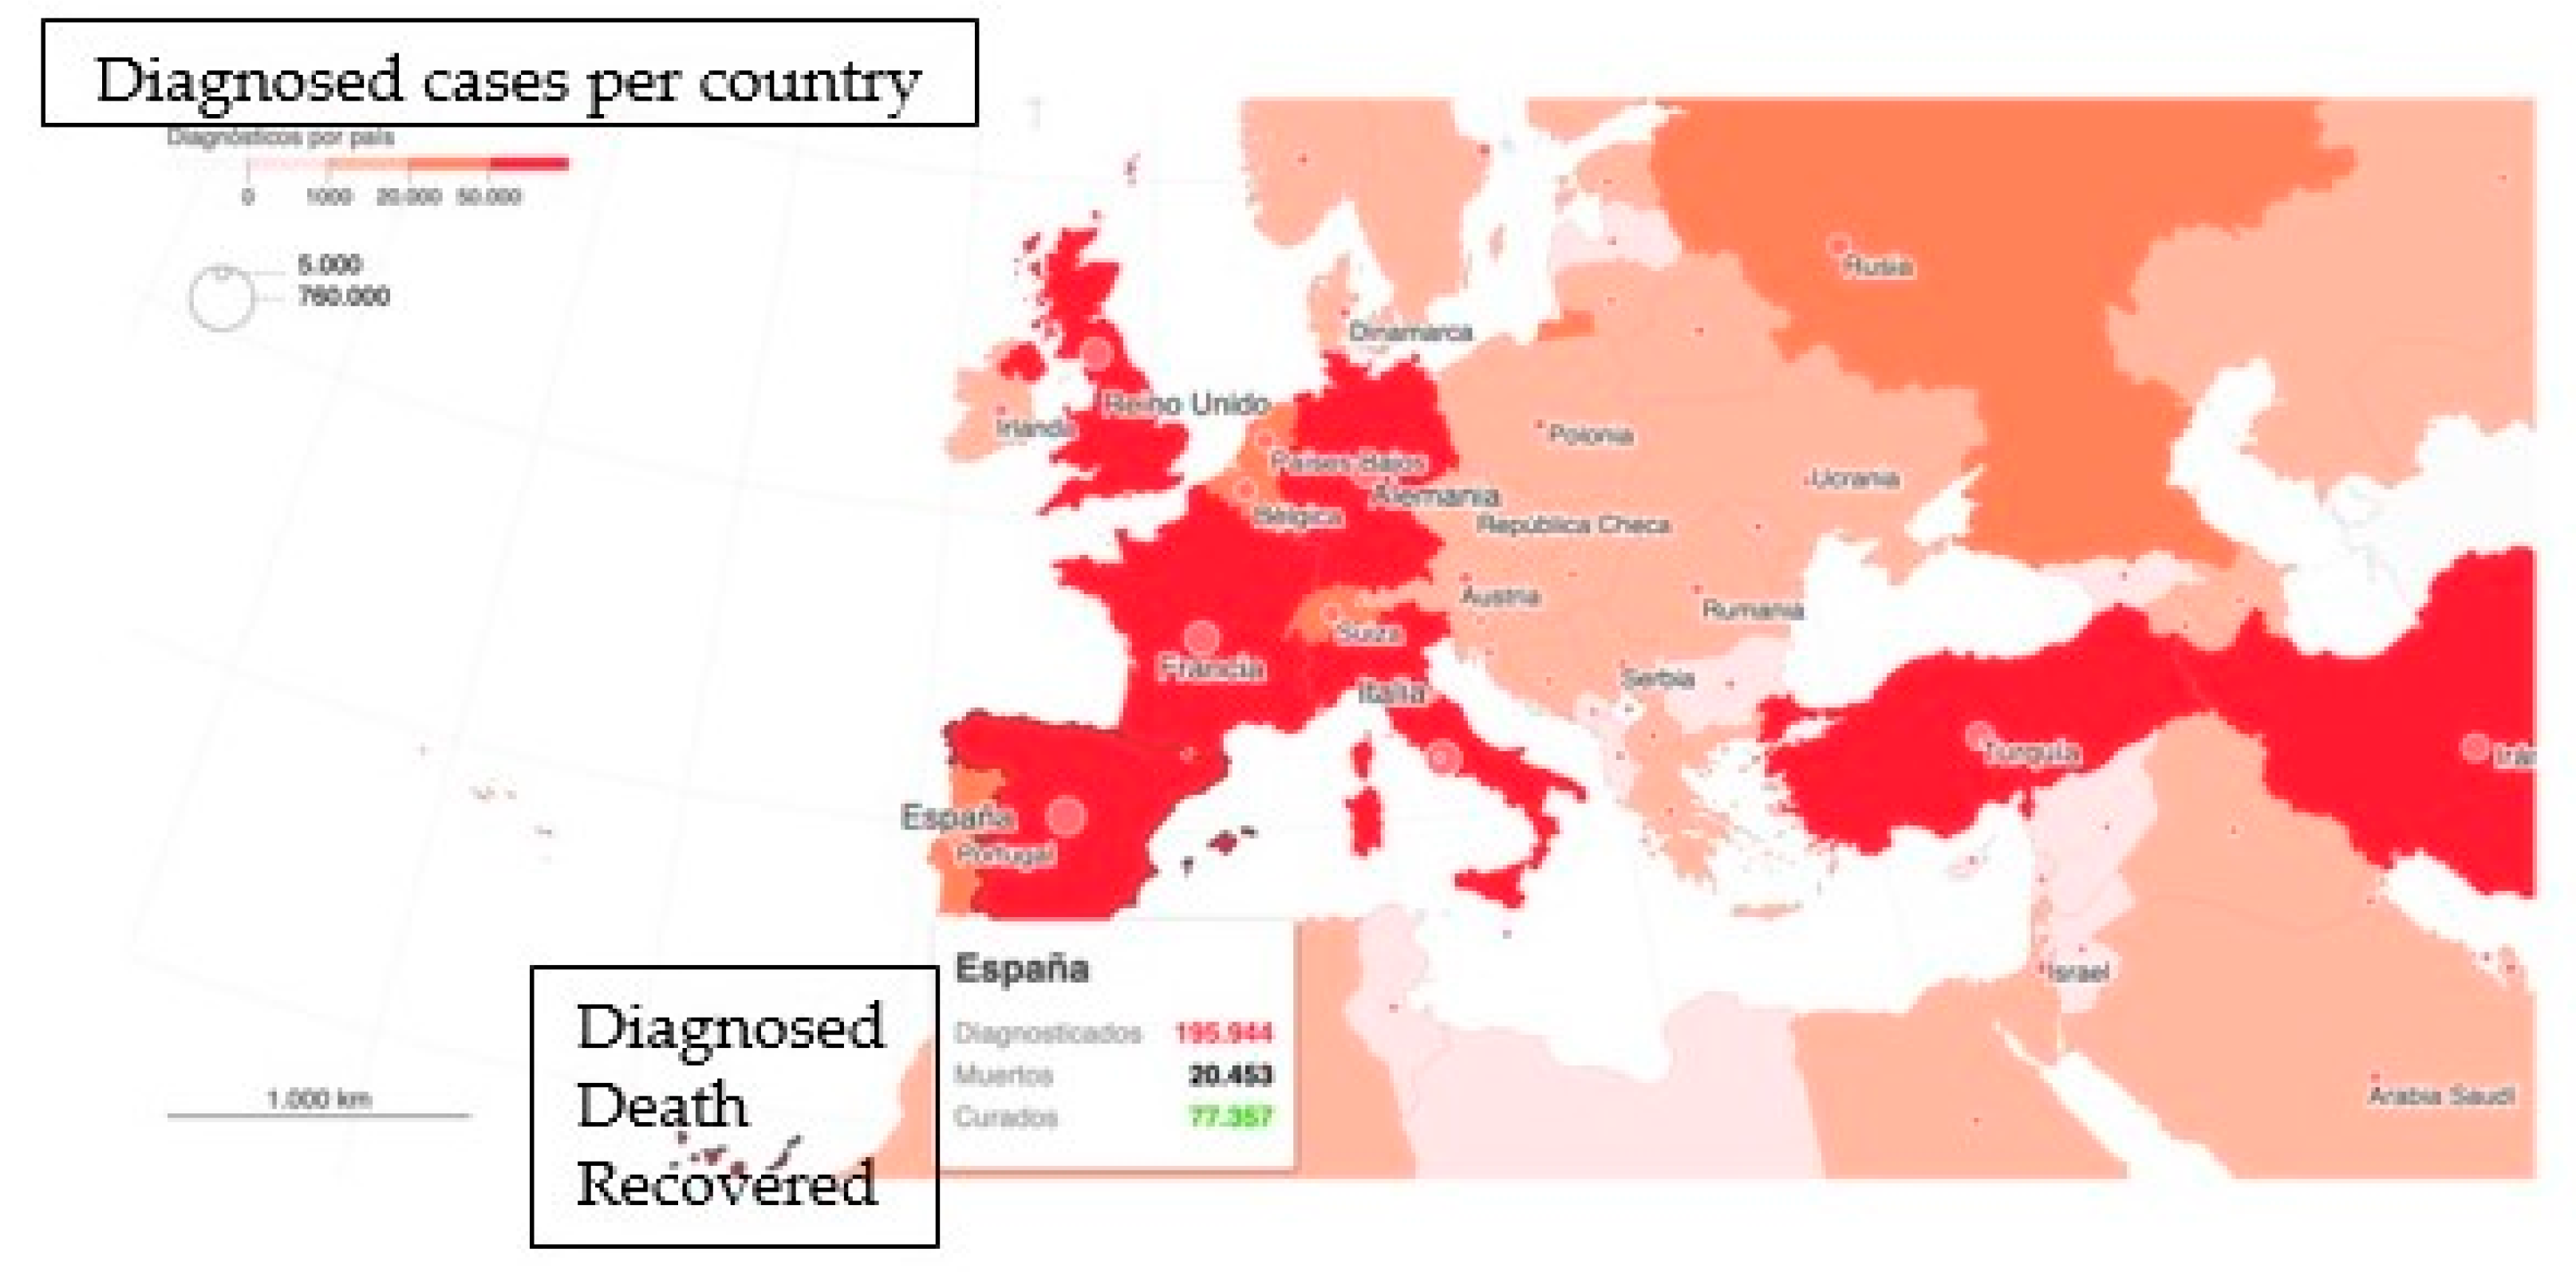
Since the initial appearance of COVID-19, we have witnessed how graphical tools have been used as an attempt to illustrate and promote a better understanding of the situation via public opinion. Nevertheless, the misuses of graphs and deficits in statistical literacy led to a failure in this attempt. Teachers can easily find examples of use, and misuse, of graphical information during the pandemic. For instance, graphs about the number of infected, dead, and recovered people have been presented in different ways: as bar charts, as polygons, or with a continuous drawing, that could hinder students’ comprehension to distinguish a functional graph from a statistical graph (Figure 6). Teachers can also find examples that can be used for promoting discussions about which graph is more suitable for visualizing a time series, how media redesign and invent statistical graphs (Figure 7), or how a choropleth summarizes table information (Figure 8). Teachers’ PCK must be reconstructed for being skilled in analyzing data with appropriate software and visualizing data with technology such that they become empowered and unchained from the use of textbooks as the only resource to promote statistical and data literacy.
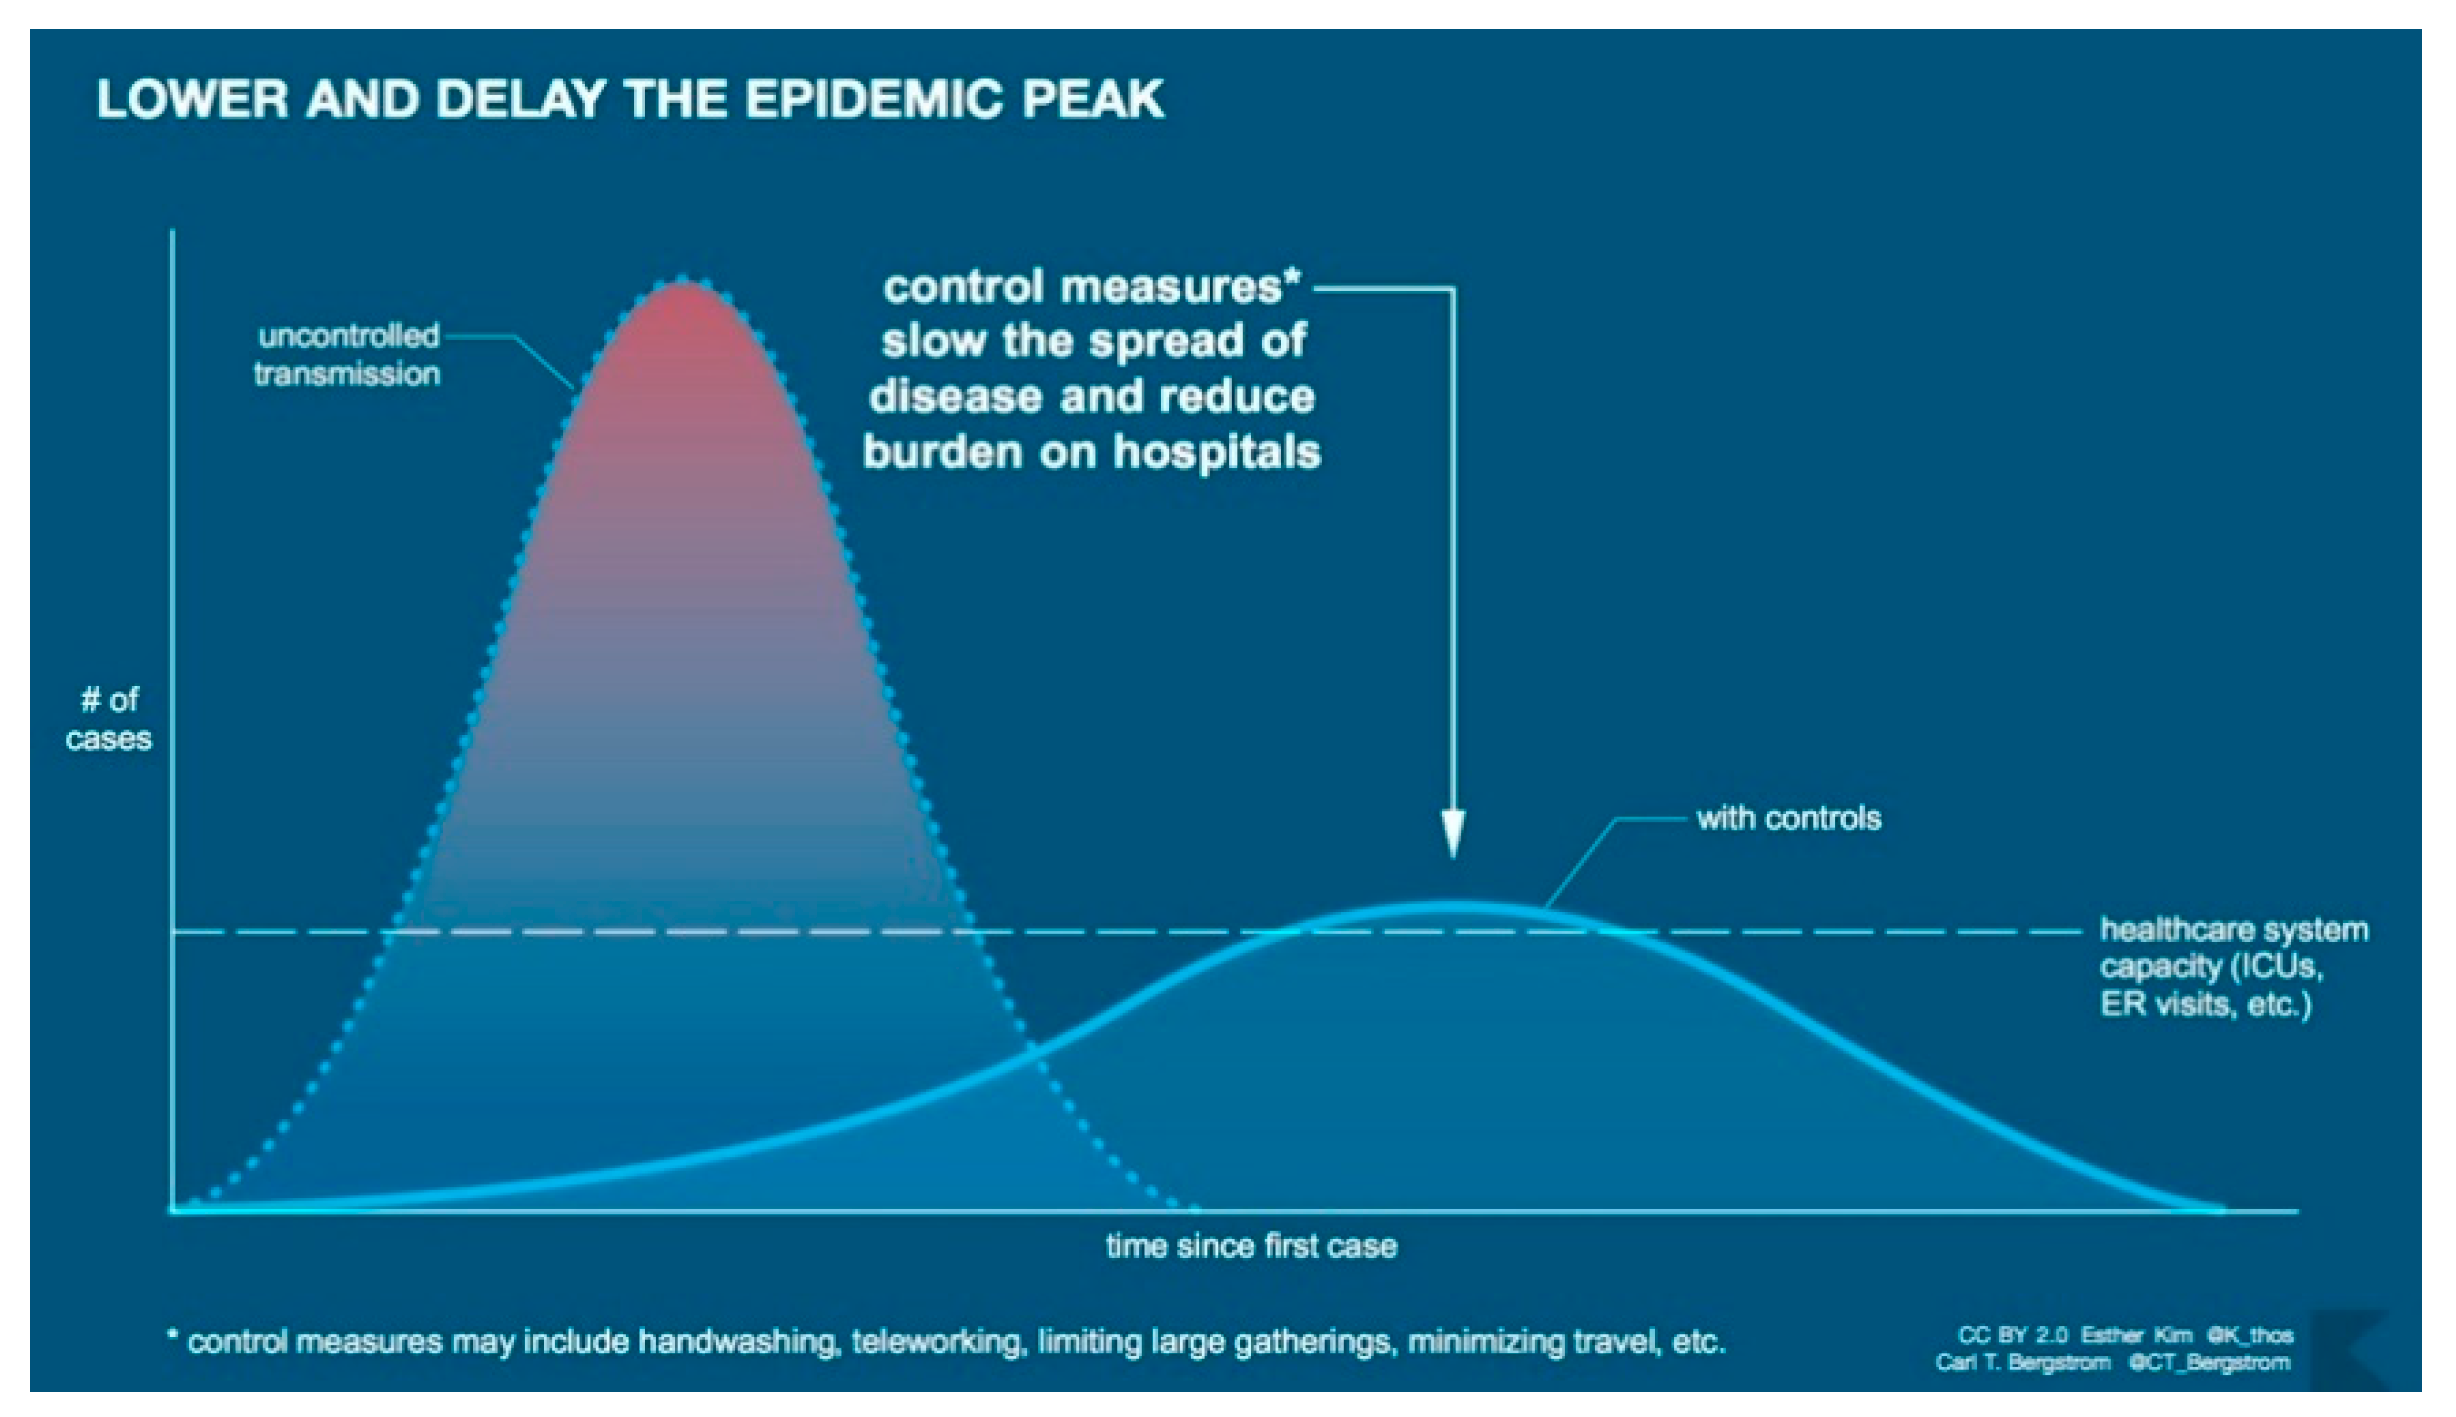
The results obtained in this study also underlined that teachers acknowledged a lack of PCK about formulating hypotheses and providing conjectures, which can be especially discouraging in the case of probability. Whereas statistics seems to be closer to real phenomena, probability can be put into a context that is not about urns, balls, dice, cards, etc. Analyses from Spanish textbooks show how those are the most frequent (sometimes unique) contexts of probability situations and problems, and how decision-making under uncertainty is absent, even in the last years of high school [63]. Again, the COVID-19 crisis offers different examples that have permeated society since they are used by administrations and mass media. One clear example is the so-called “flatten the curve” initiative, which is linked to the origin of social distancing. The normal distribution is introduced in the Spanish curriculum in the penultimate year of high school, together with a brief analysis of the notion of a density function, before studying the definite integral, which makes it even more difficult to understand an already difficult concept at that educational level [64]. “Flattening the curve” is a nice example of how to distribute the same density in an alternative way (Figure 9) that can be used to explore the notion of a density function and informally discuss the idea of kurtosis.
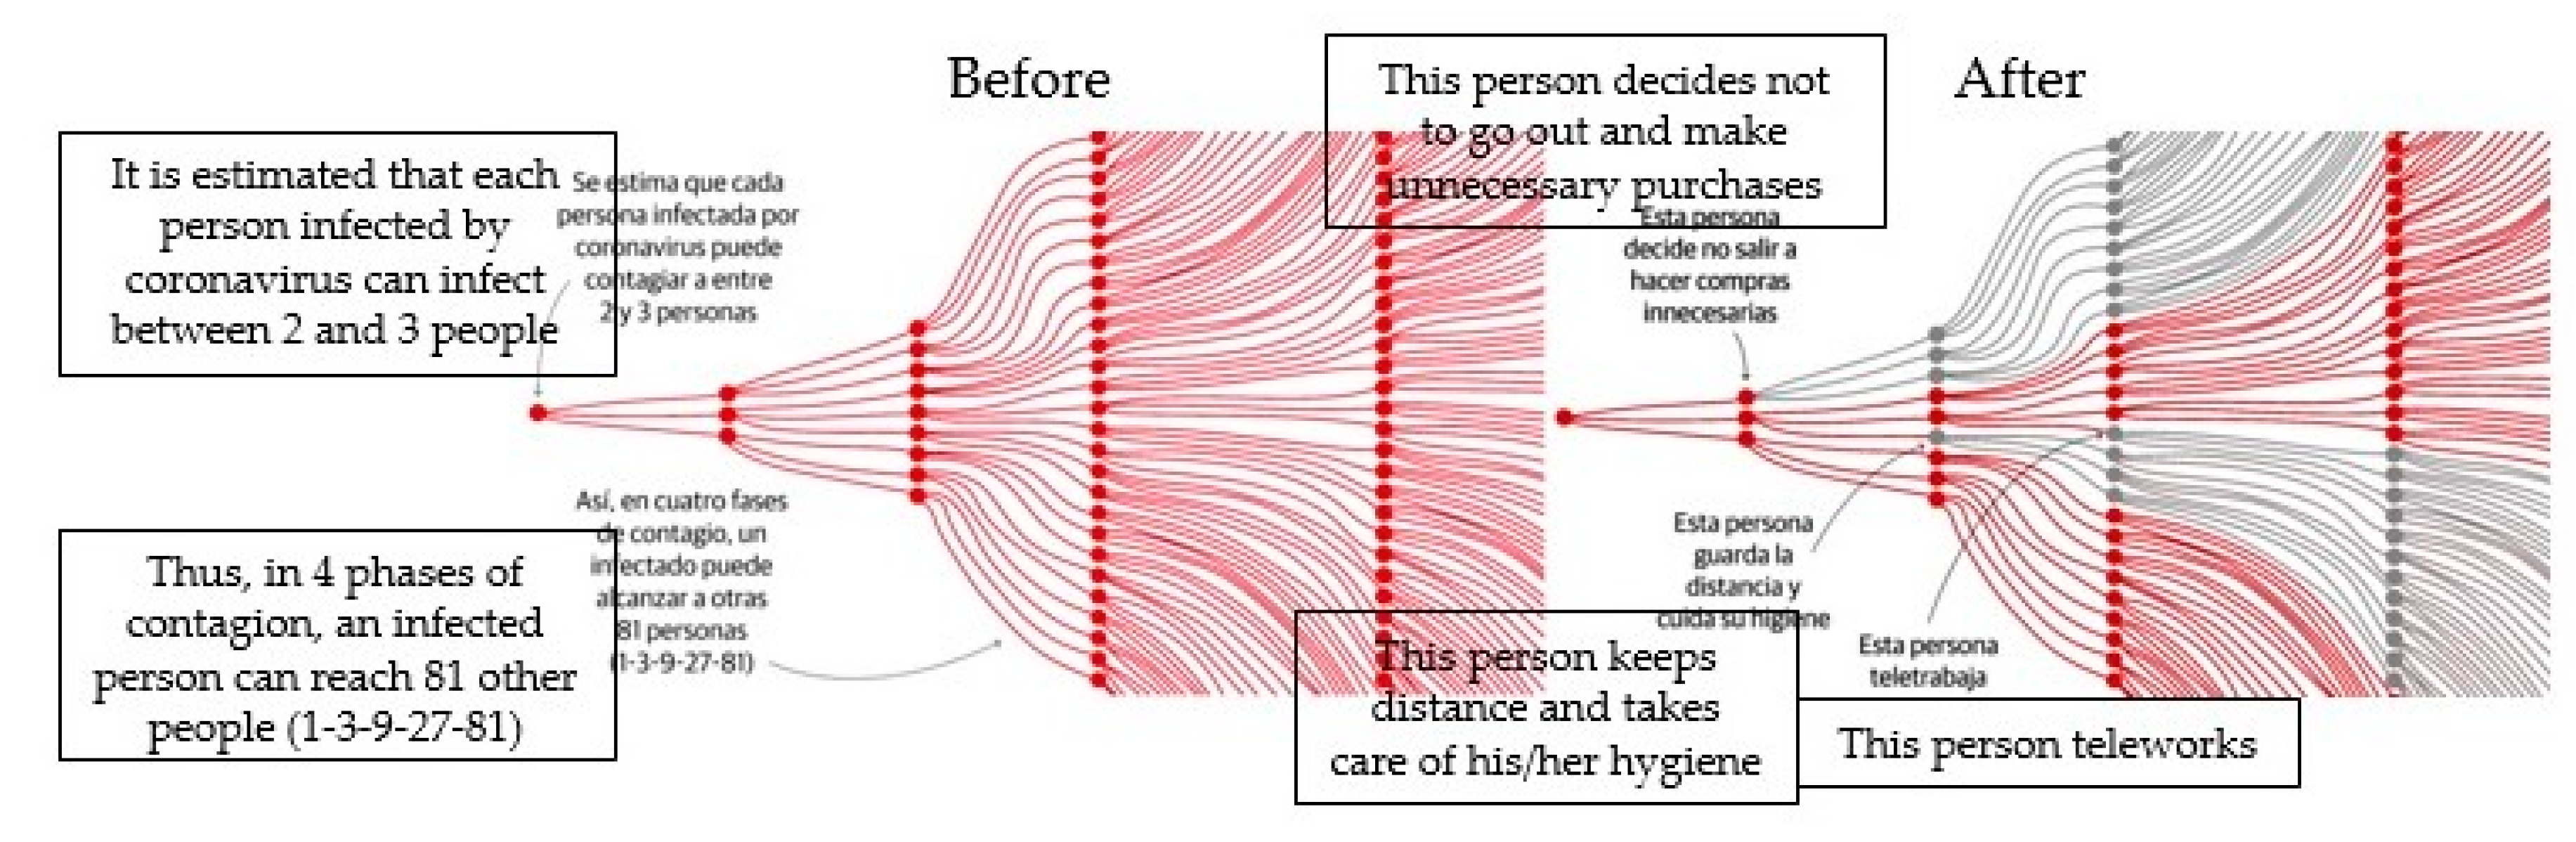
We also have examples about the use of a probability tree as a representative model of the propagation of COVID-19 (Figure 10) that could be used for discussing the nature of randomness and its differences with causality, showing how individuals’ decisions interrupt the infection: red arcs (meaning infection propagation) become grey (no infection) when an individual does not go out for shopping, keeps their distance, or teleworks.
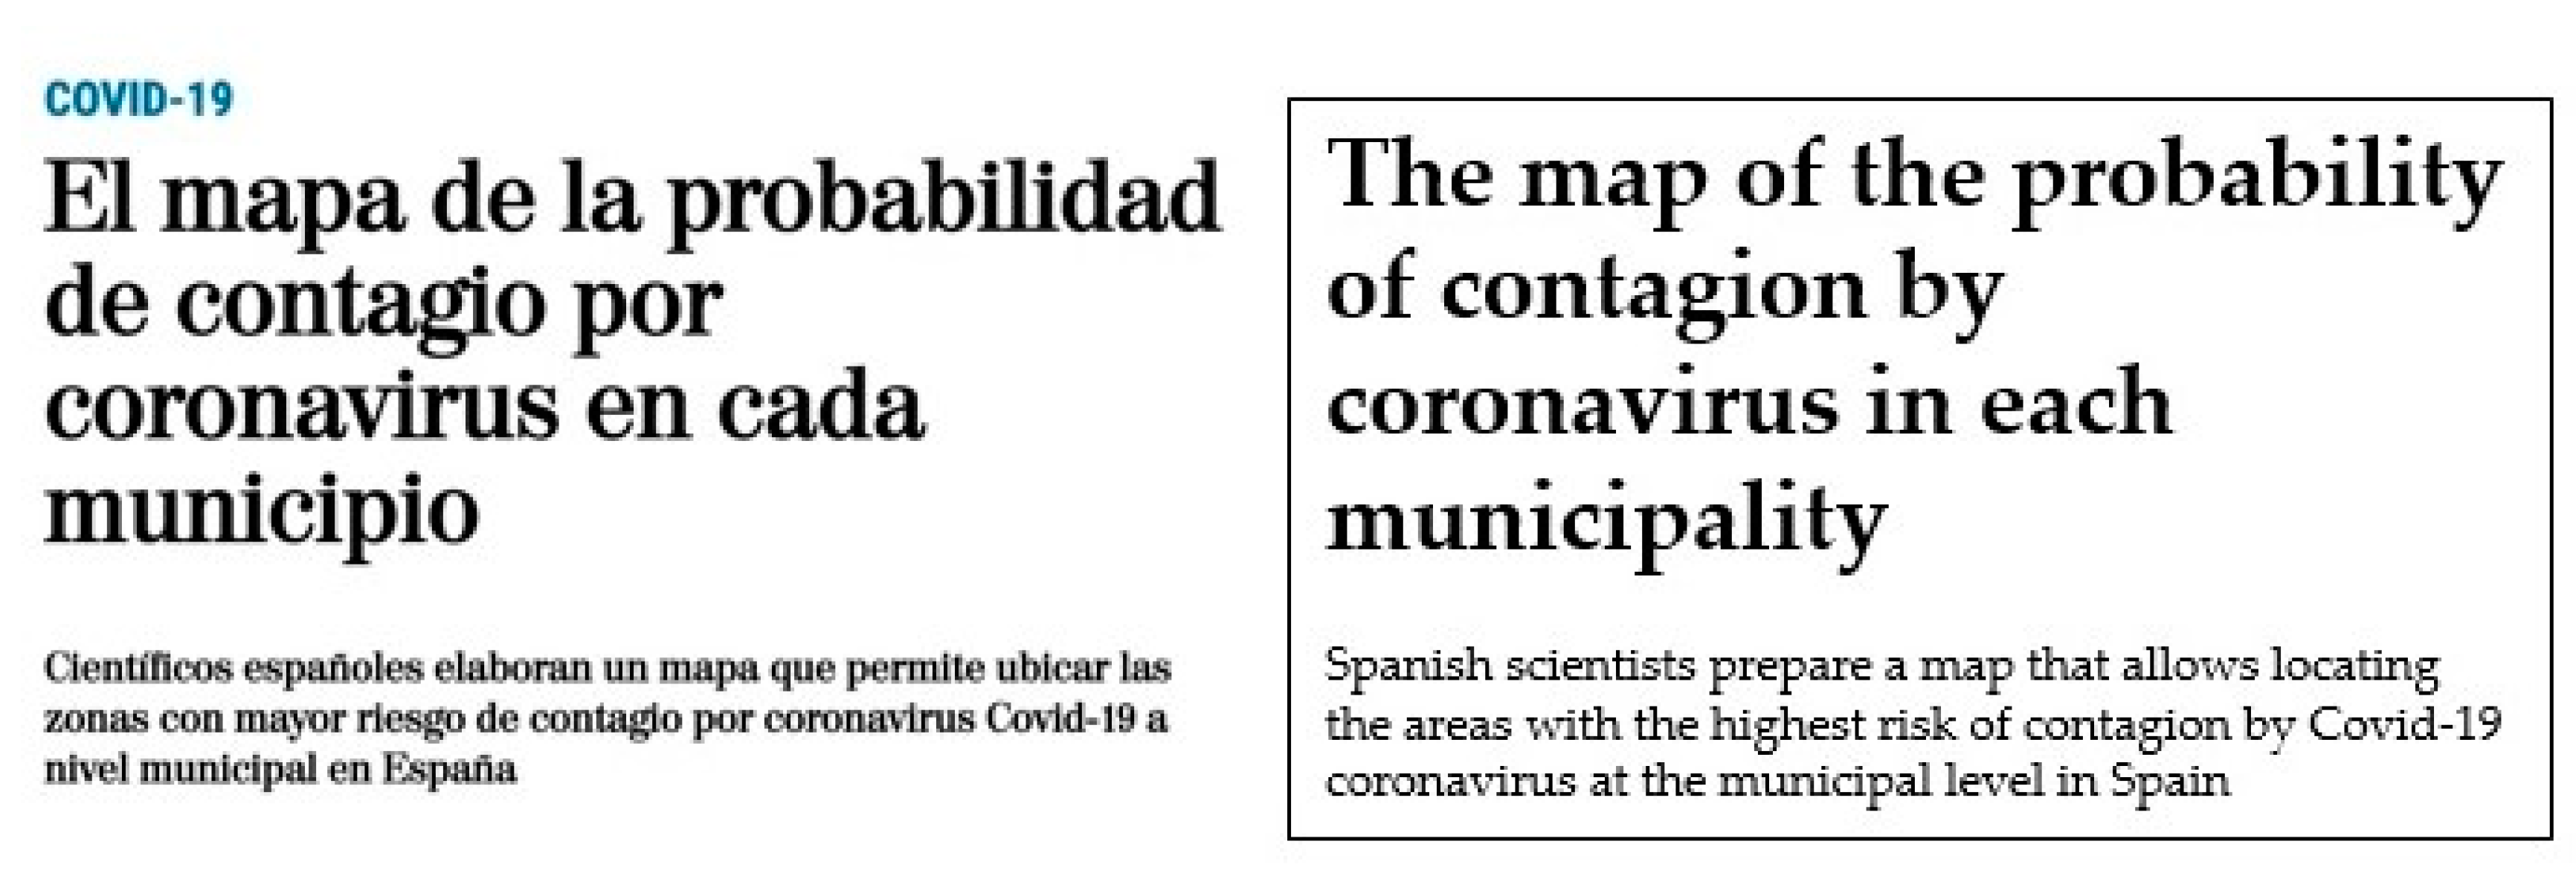
The COVID-19 pandemic has also provided other examples that can be an anchor for teachers’ conceptions about probability and sustainable PCK. In this case, our starting point was Batanero’s work [2,36,67] about the meanings of probability in secondary school. In most countries, school mathematics approaches probability mainly via the classical meaning (based on Laplace’s rule), sometimes via the frequentist approach, and, in advanced levels, by using Kolmogorov’s axiomatic theory. The frequentist meaning of probability produces misconceptions because students could get confused between empirical frequencies and the theoretical probabilities derived from them [67]. This can be illustrated with Figure 11, which shows a tool created by Spanish scientists to predict the risk of getting infected by COVID-19 depending on the municipality by estimating the number of infected from the existing population, the number of tested and infected people in each area, and how the media (Figure 12) “translated” this into a probability model, despite the authors’ effort in clearly explaining the problem of estimating from uncertain data. This example can be used for analyzing teachers’ conceptions about what probability is, what it is measuring, and how it relates to a frequency or an observed percentage. Conjecturing and reasoning now become relevant processes for constructing teachers’ PCK.
The subjective meaning of probability is hardly ever found in textbooks or classroom activities. However, in many daily situations, Laplace’s rule is far from being usable, where there is no possibility of repeating the experiment and the axiomatic theory does not provide a way for eliciting probabilities. Despite everything, we still calculate probabilities in these situations, and we do it by using a subjective approach. Thus, the quantity and the quality of the (subjective) information that we consider and the (subjective) way in which we process it produces probability models. The model given in Figure 11 is an example of a combination of both frequentist and subjective approaches of probability. However, there are many others related to the COVID-19 pandemic. For instance, Figure 13 shows a prediction model for the number of those infected, which was developed by Spanish mathematicians, providing different probability confidence bands. Figure 13 can be used to discuss several approaches with teachers that could allow them to reconsider their knowledge in terms of the difference between uncertainty and causality, the relationship between greater confidence and a wider distance between bands, how meaningful an extremely wide confidence interval is for making predictions, and the data considered and how they are aggregated for eliciting these probability estimates.
We conclude that there is a definite need for enhancing secondary teachers’ pedagogical content knowledge in order to empower them with resources and methods for improving students’ statistical and probabilistic literacy, allowing them to answer to the demands of today’s data society. The COVID-19 pandemic is challenging us in terms of the need for having citizens that are able to handle statistical and probabilistic information and to make decisions based on it. We have detected some ways of action concerning mathematical knowledge (especially in terms of the different meanings of probability beyond the classical one). However, most of the effort must be placed on pedagogical content knowledge, in particular, on the integration of technology and on methodological approaches that allow students to move through all the steps of a statistical process.
Despite the lack of representativeness of the sample, the results illustrate teachers’ knowledge and opinions about statistics and probability. Considering the voluntary nature of the activity, the participating teachers were characterized by having higher motivation and predisposition and better training, which may have caused a positive bias in the results. The fact that data were collected before the COVID-19 pandemic prevented putting the examples that we have developed in the discussion into practice. Nevertheless, it is necessary to remark that the training described in this paper is going to be continued by a working group formed by researchers and secondary school teachers that has become a research and practice community [23]. As a result, examples from COVID-19 are going to be used in the reconstruction of teacher’s pedagogical content knowledge [71], which will gain momentum based on one of the most important experiences in our lives. From this initiative, alternative examples from up-to-date topics, such as climate change, poverty, gender equality, or other sustainable development goals of the 2030 Agenda [59,60], are going to be drawn upon and used within the aforementioned research and practice community in order to enhance both teachers and students’ statistical and probabilistic literacy.
Data availability
Data are available from the corresponding author upon request.
Author Contributions
Conceptualization, L.M.-R., L.J.R.-M., and Á.A.; methodology, L.M.-R. and L.J.R.-M.; software, L.M.-R.; validation, L.M.-R. and L.J.R.-M.; formal analysis, L.M.-R.; investigation, L.M.-R., L.J.R.-M., and Á.A.; resources, L.M.-R. and Á.A.; data curation, L.M.-R.; writing—original draft preparation, L.M.-R., L.J.R.-M., and Á.A.; writing—review and editing, L.M.-R., L.J.R.-M., and Á.A.; visualization, L.M.-R., L.J.R.-M., and Á.A.; supervision, L.J.R.-M. and Á.A.; project administration, L.J.R.-M. and Á.A.; funding acquisition, L.J.R.-M. All authors have read and agreed to the published version of the manuscript.
Funding
This research was carried out within the project “From mathematics education to data science: statistical and digital literacy of secondary school students” (INIE-19-MOD.C-5), which was funded by the Consejería de Educación y Cultura of Asturias and the the University of Oviedo. The activity was co-funded by the Center for Teachers and Resources (CPR, in Spanish acronym) Gijón-Oriente. Laura Muñiz-Rodríguez and Luis J. Rodríguez-Muñiz were also supported by grant TIN2017-87600-P from the Ministerio de Ciencia e Innovación of Spain. Ángel Alsina was also supported by grant EDU2017-84979-R from European Regional Development Fund and the Ministerio de Ciencia e Innovación of Spain.
Acknowledgments
The authors want to express their sincere gratitude to the teachers that participated in the study for their collaboration, as well as to the Center for Teachers and Resources (CPR) Gijón-Oriente, and the Asturian Society of Mathematical Education “Agustín de Pedrayes” (SADEM-Pedrayes) for their help in the organization of the activity.
Conflicts of Interest
The authors do not have any conflicts of interest.
References
- Linares, S. Agendas de Investigación en Educación Matemática en España. Una Aproximación Desde “ISI-Web of Knowledge” y ERIH. In Investigación en Educación Matemática XII; Luengo, R., Gómez, B., Camacho, M., Blanco, L.J., Eds.; SEIEM: Badajoz, Spain, 2008; pp. 25–54. [Google Scholar]
- Batanero, C. Understanding Randomness: Challenges for Research and Teaching. In Proceedings of the Ninth Congress of the European Society for Research in Mathematics Education (CERME9); Krainer, K., Vondrová, N., Eds.; Charles University in Prague, Faculty of Education & ERME: Prague, Czech Republic, 2015; pp. 34–49. [Google Scholar]
- World Health Organization. Available online: https://www.who.int/dg/speeches/detail/munich-security-conference (accessed on 16 April 2020).
- Ministry of Health. Available online: https://www.mscbs.gob.es/profesionales/saludPublica/ccayes/alertasActual/nCov/documentos/Actualizacion_54_COVID-19.pdf (accessed on 23 April 2020).
- Batanero, C. Retos para la Formación Estadística de los Profesores. In Actas do II Encontro de Probabilidades e Estatística na Escola; Fernandes, J.A., Martinho, M.H., Viseu, F., Correia, P.F., Eds.; Centro de Investigação em Educação da Universidade do Minho: Braga, Portugal, 2009; pp. 52–71. [Google Scholar]
- Muñiz-Rodríguez, L.; Aguilar-González, Á.; Rodríguez-Muñiz, L.J. Perfiles del futuro profesorado de matemáticas a partir de sus competencias profesionales. Enseñanza de las Ciencias 2020, 38, 141–161. [Google Scholar]
- Muñiz-Rodríguez, L.; Alonso, P.; Rodríguez-Muñiz, L.J.; Valcke, M. Is there a gap in initial secondary mathematics teacher education in Spain compared to other countries? Revista de Educación 2016, 372, 106–132. [Google Scholar]
- Alsina, Á.; Maurandi, A.; Ferre, E.; Coronata, C. Validating an Instrument to Evaluate the Teaching of Mathematics Through Processes. Int. J. Sci. Math. Educ. 2020, 1–19. [Google Scholar] [CrossRef]
- Llinares, S. Guest Editorial: Knowledge, teaching competences of mathematics teachers and becoming a teacher trainer. Avances de Investigación en Educación Matemática 2018, 13, 1–3. [Google Scholar] [CrossRef] [Green Version]
- Shulman, L. Those Who Understand: Knowledge Growth in Teaching. Educ. Res. 1986, 15, 4–14. [Google Scholar] [CrossRef]
- Ball, D. Bridging Practices. Intertwining content and pedagogy in teaching and learning to teach. J. Teach. Educ. 2000, 51, 241–247. [Google Scholar] [CrossRef]
- Ball, D. What Mathematical Knowledge is Needed for Teaching Mathematics; U.S. Department of Education: Washington, DC, USA, 2003. [Google Scholar]
- Hill, H.C.; Schilling, S.G.; Ball, D.L. Developing Measures of Teachers’ Mathematics Knowledge for Teaching. Elementary Sch. J. 2004, 105, 11–30. [Google Scholar] [CrossRef] [Green Version]
- Hill, H.C.; Rowan, B.; Ball, D.L. Effects of Teachers’ Mathematical Knowledge for Teaching on Student Achievement. Am. Educ. Res. J. 2005, 42, 371–406. [Google Scholar] [CrossRef] [Green Version]
- Ball, D.; Thames, M.; Phelps, G. Content Knowledge for Teaching What Makes It Special? J. Teach. Educ. 2008, 59, 389–407. [Google Scholar] [CrossRef] [Green Version]
- Hill, H.; Ball, D. Schilling, S. Unpacking Pedagogical Content Knowledge: Conceptualizing and Measuring Teachers’ Topic-Specific Knowledge of Students. J. Res. Math. Educ. 2008, 39, 372–400. [Google Scholar]
- Carrillo, J.; Climent, N.; Montes, M.; Contreras, L.C.; Flores-Medrano, E.; Escudero-Ávila, D.I.; Vasco, D.; Rojas, N.; Flores, P.; Aguilar-González, Á.; et al. The mathematics teacher’s specialised knowledge (MTSK) model*. Res. Math. Educ. 2018, 20, 236–253. [Google Scholar] [CrossRef]
- Godino, J. Categorías de análisis de los conocimientos del profesor de matemáticas. UNIÓN, Revista Iberoamericana de Educación Matemática 2009, 20, 13–31. [Google Scholar]
- Alsina, Á.; Mulà, I. Advancing towards a Transformational Professional Competence Model through Reflective Learning and Sustainability: The Case of Mathematics Teacher Education. Sustainability 2019, 11, 4039. [Google Scholar] [CrossRef] [Green Version]
- Korthagen, F.A.; Kessels, J.; Koster, B.; Lagerwerf, B.; Wubbels, T. Linking Practice and Theory; Informa UK Limited: Colchester, UK, 2001. [Google Scholar]
- Bell, D.V.J. Twenty-first Century Education: Transformative Education for Sustainability and Responsible Citizenship. J. Teach. Educ. Sustain. 2016, 18, 48–56. [Google Scholar] [CrossRef] [Green Version]
- Hahn, C. Linking academic knowledge and professional experience in using statistics: A design experiment for business school students. Educ. Stud. Math. 2011, 86, 239–251. [Google Scholar] [CrossRef]
- Jaworski, B. Learning communities in mathematics: Creating an inquiry community between teachers and didacticians. Res. Math. Educ. 2005, 7, 101–119. [Google Scholar] [CrossRef] [Green Version]
- Alsina, Á. El aprendizaje reflexivo en la formación permanente del profesorado: Un análisis desde la didáctica de las matemáticas. Educación Matemática 2007, 19, 99–126. [Google Scholar]
- Alsina, Á. Proceso de transformación de las concepciones del profesorado sobre la resolución de problemas matemáticos. Enseñanza de las Ciencias 2012, 30, 71–88. [Google Scholar]
- Palm, T. Impact of authenticity on sense making in word problem solving. Educ. Stud. Math. 2007, 67, 37–58. [Google Scholar] [CrossRef]
- Hahn, C. La recherche internationale en éducation statistique: état des lieux et questions vives. Statistique et Enseignement 2015, 6, 25–39. [Google Scholar]
- Cobb, G.; Moore, D. Mathematics, statistics and teaching. Am. Math. Mon. 1997, 104, 801–823. [Google Scholar] [CrossRef]
- Watson, J.; Nathan, E. Approaching the borderlands of statistics and mathematics in the classroom: Qualitative analysis engendering an unexpected journey. Stat. Educ. Res. J. 2010, 9, 68–87. [Google Scholar]
- Gal, I. Adults’ Statistical literacy: Meanings, components, responsibilities. Int. Stat. Rev. 2002, 70, 1–25. [Google Scholar] [CrossRef]
- Gal, I. Towards ‘Probability Literacy’ for All Citizens. In Exploring Probability in School: Challenges for Teaching and Learning; Jones, G., Ed.; Springer: New York, NY, USA, 2005; pp. 43–71. [Google Scholar]
- GAISE College Report ASA Revision Committee. Available online: http://www.amstat.org/education/gaise (accessed on 3 May 2020).
- Schield, M. Information literacy, statistical literacy and data literacy. Iassist Quarterly 2004, 28, 6–11. [Google Scholar]
- Gleason, N.W. Higher Education in the Era of the Fourth Industrial Revolution; Palmgrave Macmillan: Singapore, 2018. [Google Scholar]
- OECD. OECD Future of Education and Skills 2030: OECD Learning Compass 2030; OECD: Paris, France, 2019. [Google Scholar]
- Batanero, C.; Chernoff, E. Teaching and Learning Stochastics: Advances in Probability Education Research; Springer: Berlin, Germany, 2018. [Google Scholar]
- Batanero, C.; Borovcnik, M. Statistics and Probability in High School; Sense Publishers: Rotterdam, The Netherlands, 2016. [Google Scholar]
- Batanero, C.; Díaz, C. Estadística con Proyectos; Departamento de Didáctica de la Matemática: Granada, Spain, 2011. [Google Scholar]
- Metaplan. Metaplan® Basic Techniques: Moderating Group Discussions Using the Metaplan Approach; Metaplan: Quickborn, Germany, 2015. [Google Scholar]
- Creswell, J.W.; Plano Clark, V.L. Designing and Conducting Mixed Methods Research; Sage Publications: Thousand Oaks, CA, USA, 2011. [Google Scholar]
- Ministerio de Educación, Cultura y Deporte. Real Decreto 126/2014, de 28 de febrero, por el que se establece el currículo básico de la Educación Primaria. Boletín Oficial del Estado 2014, 52, 1–58. [Google Scholar]
- Alsina, Á. Itinerarios Didácticos para la Enseñanza de las Matemáticas (6-12 años); Graó: Barcelona, Spain, 2019. [Google Scholar]
- NCTM. Principles and Standards for School Mathematics; NCTM: Reston, VA, USA, 2000. [Google Scholar]
- Wild, C.J.; Pfannkuch, M. Statistical thinking in empirical enquiry. Int. Stat. Rev. 1999, 67, 223–248. [Google Scholar] [CrossRef]
- Rodríguez-Muñiz, L.J.; Díaz, P. Las investigaciones sobre la estadística y la probabilidad en los libros de texto de Bachillerato. ¿Qué se ha hecho y qué se puede hacer? Avances de Investigación en Educación Matemática 2018, 14, 65–81. [Google Scholar] [CrossRef]
- STAT. Available online: https://www.statnews.com/2020/03/17/a-fiasco-in-the-making-as-the-coronavirus-pandemic-takes-hold-we-are-making-decisions-without-reliable-data/ (accessed on 15 May 2020).
- Ministerio de Sanidad. Orden SND/352/2020, de 16 de abril, por la que se modifica la Orden SND/234/2020, de 15 de marzo, sobre adopción de disposiciones y medidas de contención y remisión de información al Ministerio de Sanidad ante la situación de crisis sanitaria ocasionada por el COVID-19. Boletín Oficial del Estado 2020, 107, 29200–29204. [Google Scholar]
- Gilbert, J.K.; Bulte, A.M.; Pilot, A. Concept Development and Transfer in Context-Based Science Education. Int. J. Sci. Educ. 2010, 33, 817–837. [Google Scholar] [CrossRef]
- Díaz, P.; Rodríguez-Muñiz, L.J. Analysis of Linear Regression in Spanish Baccalaureate Textbooks. In Sustainability in Statistics Education, Proceedings of the Ninth International Conference on Teaching Statistics (ICOTS9), Flagstaff, AZ, USA, 13–18 July 2014; Makar, K., de Sousa, B., Gould, R., Eds.; International Statistical Institute: Voorburg, The Netherlands, 2014; pp. 1–4. [Google Scholar]
- Rodríguez-Muñiz, L.J.; Corte, Á.; Muñiz-Rodríguez, L. ¿Evolucionan los libros de texto de matemáticas con los cambios curriculares? Estudio de la regresión y la correlación lineal en la Educación Secundaria en España. Números 2020, 103, 65–79. [Google Scholar]
- Biehler, R.; Ben-Zvi, D.; Bakker, A.; Makar, K. Technology for Enhancing Statistical Reasoning at the School Level. In Third International Handbook of Mathematics Education; Springer Science and Business Media LLC: Berlin/Heidelberg, Germany, 2012; pp. 643–689. [Google Scholar]
- Batanero, C.; Biehler, R.; Maxara, C.; Engel, J.; Vogel, M. Using Simulation to Bridge Teachers Content and Pedagogical Knowledge in Probability. In 15th ICMI Study Conference: The Professional Education and Development of Teachers of Mathematics; Ball, D.L., Even, R., Eds.; State University of São Paulo, ICMI: São Paulo, Brazil, 2005; pp. 1–6. [Google Scholar]
- Prodomou, T. Data Visualization and Statistical Literacy for Open and Big Data; IGI Global: Hershery, PA, USA, 2017. [Google Scholar]
- André, M.; Lavicza, Z.; Prodromou, T. Formalizing Students’ Informal Statistical Reasoning on Real Data: Using Gapminder to Follow the Cycle of Inquiry and Visual Analyses. In Proceedings of the Eleventh Congress of the European Society for Research in Mathematics Education (CERME11); Jankvist, U.T., Van den Heuvel-Panhuizen, M., Veldhuis, M., Eds.; Freudenthal Group & Freudenthal Institute, Utrecht University & ERME: Utrecht, The Netherlands, 2019; pp. 1–8. [Google Scholar]
- Pfannkuch, M. Reimagining Curriculum Approaches. In Springer International Handbooks of Education; Springer Science and Business Media LLC: Berlin/Heidelberg, Germany, 2017; pp. 387–413. [Google Scholar]
- Bakker, A. Design Research in Statistics Education: On Symbolizing and Computer Tools; CD- Press: Utrecht, The Netherlands, 2004. [Google Scholar]
- Rodríguez-Muñiz, L.J.; Muñiz-Rodríguez, L.; Vásquez, C.; Alsina, A. ¿Cómo promover la alfabetización estadística y de datos en contexto? Estrategias y recursos a partir de la COVID-19 para Educación Secundaria. Números 2020, 104, 217–238. [Google Scholar]
- Vásquez, C.; Rodríguez-Muñiz, L.J.; Muñiz-Rodríguez, L.; Alsina, A. ¿Cómo promover la alfabetización probabilística en contexto? Estrategias y recursos a partir de la COVID-19 para la Educación Secundaria. Números 2020, 104, 239–260. [Google Scholar]
- Coles, A. Teaching Secondary Mathematics as if the Planet Matters; Informa UK Limited: Colchester, UK, 2013. [Google Scholar]
- Gobierno de España. Available online: https://www.agenda2030.gob.es/objetivos/home.htm (accessed on 15 October 2020).
- El Mundo. Available online: https://www.elmundo.es/ciencia-y-salud/salud/2020/03/20/5e74b922fc6c839d588b45db.html (accessed on 20 April 2020).
- El País. Available online: https://elpais.com/sociedad/2020/07/27/actualidad/1595838623_808240.html (accessed on 6 May 2020).
- Rodríguez-Muñiz, L.J.; Díaz, P.; Muñiz-Rodríguez, L. Statistics and Probability in the Spanish Baccalaureate: Intended Curriculum and Implementation in Textbooks. In 24th ICMI Study Conference. School Mathematics Curriculum Reforms: Challenges, Changes and Opportunities; Shimizu, Y., Vithal, R., Eds.; ICMI, University of Tsukuba: Tsukuba, Japan, 2019; pp. 413–420. [Google Scholar]
- Xu, L.; Clarke, D. Student Difficulties in Learning Density: A Distributed Cognition Perspective. Res. Sci. Educ. 2011, 42, 769–789. [Google Scholar] [CrossRef]
- Carl Theodore Bergstrom. Available online: http://ctbergstrom.com/covid19.html (accessed on 20 April 2020).
- El Comercio. Available online: https://www.elcomercio.es/ (accessed on 20 April 2020).
- Batanero, C.; Henry, M.; Parzysz, B. The Nature of Chance and Probability. In Exploring Probability in School: Challenges for Teaching and Learning; Jones, G.A., Ed.; Springer: New York, NY, USA, 2005; pp. 15–37. [Google Scholar]
- Risk Map for the Spread of COVID-19. Available online: https://covid-19-risk.github.io/map/ (accessed on 20 April 2020).
- El País. Available online: https://www.elmundo.es/ciencia-y-salud/salud/2020/03/15/5e6d35c921efa0c1348b46ba.html (accessed on 20 April 2020).
- La Nueva España. Available online: https://www.lne.es/sociedad/2020/04/19/pronostico-covid-19-jornada-transicion/2626696.html (accessed on 20 April 2020).
- Alsina, Á.; Batllori, R.; Falgàs, M.; Vidal, I. Marcas de autorregulación para la construcción del perfil docente durante la formación inicial de maestros. Revista Complutense de Educación 2019, 30, 55–74. [Google Scholar] [CrossRef] [Green Version]
Figure 1.
Supposedly comparative graphs of the expansion of coronavirus disease 2019 (COVID-19) in four Spanish autonomous communities [4].
Figure 1.
Supposedly comparative graphs of the expansion of coronavirus disease 2019 (COVID-19) in four Spanish autonomous communities [4].

Figure 2.
Elements of the transformation of prior knowledge, experiences, and belief systems into professional competence in teacher education [19] (p. 13).
Figure 2.
Elements of the transformation of prior knowledge, experiences, and belief systems into professional competence in teacher education [19] (p. 13).

Figure 3.
Structure of the activities and organization of the topics covered in each session.

Figure 4.
Result of the Metaplan® [39] moderation method that was used during the first session.
Figure 4.
Result of the Metaplan® [39] moderation method that was used during the first session.

Figure 5.
Results of the Mentimeter® moderation method used during the second and third sessions.

Figure 6.
Evolution of the number of people that were infected, recovered, hospitalized, in an ICU (intensive care unit), or dead in the region of Madrid in March and April 2020 [61]. A period is used to indicate the decimal place.
Figure 6.
Evolution of the number of people that were infected, recovered, hospitalized, in an ICU (intensive care unit), or dead in the region of Madrid in March and April 2020 [61]. A period is used to indicate the decimal place.

Figure 7.
Evolution of the number of deaths in Spain in March and April 2020 by using a hybrid of a bar chart and a frequency polygon [61].
Figure 7.
Evolution of the number of deaths in Spain in March and April 2020 by using a hybrid of a bar chart and a frequency polygon [61].

Figure 8.
Choropleth representing in red-scale the number of diagnosed cases in Europe, per country, by 20 April 2020 [62]. A period is used to indicate the decimal place.
Figure 8.
Choropleth representing in red-scale the number of diagnosed cases in Europe, per country, by 20 April 2020 [62]. A period is used to indicate the decimal place.

Figure 9.
Flattening the curve [65].
Figure 9.
Flattening the curve [65].

Figure 10.
Propagation tree before and after social distancing [66].
Figure 10.
Propagation tree before and after social distancing [66].

Figure 11.
COVID-19 risk map in Spain [68].
Figure 11.
COVID-19 risk map in Spain [68].

Figure 12.
News about the risk map [69].
Figure 12.
News about the risk map [69].

Figure 13.
Prediction model for infected cases in the region of Asturias [70].
Figure 13.
Prediction model for infected cases in the region of Asturias [70].


Table 1.
The questions that were used during the group discussions.
| Data Science |
|---|
| What is the nature of the data you use to promote statistical and probabilistic literacy? What is the source of the data you use? How difficult is it to integrate the context of the data you use in the classroom? What use do you give to the data in the classroom? What kind of representations do you use to visualize and analyze the data with students? Do you promote changes between different types of data representations? |
| Didactic Resources |
| What didactic resources do you use to promote statistical and probabilistic literacy? Are you aware of sufficient didactic resources to promote statistical and probabilistic literacy? In particular, what technological resources do you use for data visualization and analysis? Are you aware of sufficient technological resources for data visualization and analysis? How do you assess the competencies acquired by students in relation to the use of these resources? What difficulties do you experience in this regard when promoting statistical and probabilistic literacy? Do you consider that your training in this regard is enough and adequate? What should be reinforced? |
| Methodological Approaches |
| What methodological approaches do you use to promote statistical and probabilistic literacy? Are you aware of sufficient methodological approaches for promoting statistical and probabilistic literacy? To what extent do you pose challenges and questions to students to explain, argue, and justify their actions; relate the learning of statistics and probability to other areas of mathematics and to other areas of knowledge; encourage interaction between students? To what extent do you promote each of the processes of the statistical research cycle? Do you use project-based learning (PBL) when teaching statistics and probability? What difficulties do you experience regarding the methodological approaches and, in particular, PBL? Do you consider that your training in this regard is adequate? What should be reinforced? |
Table 2.
Mean values of the participating teachers’ actions.
| To What Extent Do You… | Mean |
|---|---|
| pose challenges to students? pose questions to students to explain, argue, and justify their actions? relate the learning of statistics and probability to other areas of mathematics? relate the learning of statistics and probability to other areas of knowledge? encourage interaction between students? | 3.4 4.2 3.3 3.8 3.9 |
| promote the search for problems? promote the formulation of hypotheses? promote the collection of data? promote the organization of data? promote the analysis of data? promote the interpretation of data? | 3.0 2.9 2.9 4.1 3.7 4.0 |
Publisher’s Note: MDPI stays neutral with regard to jurisdictional claims in published maps and institutional affiliations. |
© 2020 by the authors. Licensee MDPI, Basel, Switzerland. This article is an open access article distributed under the terms and conditions of the Creative Commons Attribution (CC BY) license (http://creativecommons.org/licenses/by/4.0/).
Share and Cite
MDPI and ACS Style
Muñiz-Rodríguez, L.; Rodríguez-Muñiz, L.J.; Alsina, Á. Deficits in the Statistical and Probabilistic Literacy of Citizens: Effects in a World in Crisis. Mathematics 2020, 8, 1872. https://0-doi-org.brum.beds.ac.uk/10.3390/math8111872
AMA Style
Muñiz-Rodríguez L, Rodríguez-Muñiz LJ, Alsina Á. Deficits in the Statistical and Probabilistic Literacy of Citizens: Effects in a World in Crisis. Mathematics. 2020; 8(11):1872. https://0-doi-org.brum.beds.ac.uk/10.3390/math8111872
Chicago/Turabian StyleMuñiz-Rodríguez, Laura, Luis J. Rodríguez-Muñiz, and Ángel Alsina. 2020. "Deficits in the Statistical and Probabilistic Literacy of Citizens: Effects in a World in Crisis" Mathematics 8, no. 11: 1872. https://0-doi-org.brum.beds.ac.uk/10.3390/math8111872
Note that from the first issue of 2016, this journal uses article numbers instead of page numbers. See further details here.