
An ITARA-TOPSIS Based Integrated Assessment Model to Identify Potential Product and System Risks


1
Department of Industrial Engineering and Management, Chaoyang University of Technology, 168, Jifeng E. Rd., Wufeng District, Taichung 413310, Taiwan
2
Department of Transportation Management, Tamkang University, 151, Yingzhuan Rd., Tamsui District, New Taipei City 251301, Taiwan
3
Department of Fire Science, Central Police University, 56, Shujen Rd., Takang Vil., Kueishan District, Taoyuan City 33304, Taiwan
4
Department of Industrial Engineering and Management, National Taipei University of Technology, 1, Sec. 3, Zhongxiao E. Rd., Taipei 10608, Taiwan
*
Author to whom correspondence should be addressed.
Mathematics 2021, 9(3), 239; https://0-doi-org.brum.beds.ac.uk/10.3390/math9030239
Submission received: 1 November 2020
/
Revised: 7 January 2021
/
Accepted: 22 January 2021
/
Published: 26 January 2021
(This article belongs to the Special Issue Multiple Criteria Decision Making)
Abstract
:This is a forward-looking approach that uses a multiple-criteria decision analysis (MCDA) model as an assessment tool for risk identification. This study proposes an indifference threshold-based attribute ratio analysis and technique for order preference by similarity to an ideal solution (ITARA-TOPSIS)-based assessment model to identify critical failure modes in products and systems. The improved indifference threshold-based attribute ratio analysis (ITARA) method can generate more reliable weights for risk factors. In addition, the modified technique for order preference by similarity to an ideal solution (TOPSIS) is used to obtain the risk levels of the failure modes. The gray correlation coefficient is applied to replace the conventional Euclidean distance, and a new index is used to determine the priority of failure modes. The determination of risk factors is based on the failure mode and effect analysis (FMEA) theory, including severity, occurrence, and detection. An important indicator, the expected cost, is also included in the framework. The case of a steam turbine for a nuclear power plant is used to demonstrate the approach, and the analysis results show that the proposed model is practical and effective. Moreover, the advantages of our integrated model are illustrated through model comparisons and sensitivity analysis. This paper can help decision-makers, risk engineers, and related researchers to better understand how a systematic risk assessment can be conducted.
1. Introduction
Risk assessment has grown into a separate scientific field over the course of about 40 years, with the establishment of principles, theories, and methods for how to conceptualize, manage, and assess risk. These principles, theories, and methods still profoundly affect the field of risk assessment. New risk assessment studies are constantly appearing, as are significant contributions and new trends in this field. The development of newer, more comprehensive and systematic risk diagnostic tools is the goal in the field of risk management [1]. This involves two main types of tasks: first, to use risk assessment technology to diagnose and explore the potential risk of specific activities, and second, to probe generic risk research and development, related to ideas, theories, concepts, methods, approaches, frameworks, models, and techniques to understand, diagnose, assess, communicate, manage, and summarize risk [2]. In general, the second type of study provides the ideas, methodologies and tools to be used in the specific assessment issues found in the first type of task. Simply put, faced with unknown risk events, decision-makers expect to be able to accurately predict when the risk will occur and then formulate appropriate preventive measures to reduce the damage caused by the risk [3].
Public concern about the field of risk management has expanded in recent years, while risk management has emerged as a systematic and comprehensive procedure to protect human life. Nowadays, risk assessment methods that emphasize quantitative analysis through mathematical logic are popular (e.g., diagrams or algorithms, hazard and operability studies (HAZOPs), and fault tree analysis (FTA). However, it is difficult to collect quantitative data for risk events that have not yet occurred, and even the characteristics, factors, and causes of the events may be unclear [4]. Decision analysis is an alternate approach to improve the accuracy of the risk identification process while determining the optimal alternatives in a scientific manner. Specifically, expert-based decision support systems can effectively obtain more reliable analysis results through the judgments and ideas of experts [5].
In fact, most risk assessment issues involve many complex attributes, factors, and limitations which form a typical multiple-criteria decision analysis (MCDA) problem [6]. The construction of a risk assessment model through MCDA includes three working procedures, namely the construction of the assessment framework, the determination of the weights of the risk factors, and the calculation of the risk scores of the potential failure modes [7]. The creation of the assessment framework usually requires the review of a large amount of literature and discussions with experts to construct assessment risk factors and failure modes. The determination of the risk factor weights is a key step in the MCDA process, because changing the weights may affect the analysis results of the failure modes. Generally speaking, there are two methods for determining weights [8]. One is to obtain subjective weights through information from expert interviews. Some practical issues still need to rely on the subjective ideas of experts. The subjective weighting methods can reflect the preferences of decision-makers so that the evaluation results tend to be what they expect. For example, if a company’s business strategy is to reduce operation costs in order to increase profits, then the cost consideration is to give a larger weight [9,10].
Common tools for processing qualitative survey data include the analytic hierarchy process (AHP) [11], Best Worst Method (BWM) [3], analytic network process (ANP) [12], and stepwise weight assessment ratio analysis (SWARA) [13]. The other is to generate objective weights from risk assessment data. For example, the entropy [14], standard deviation, maximizing deviation, and criteria importance through intercriteria correlation (CRITIC) method [15] all fall into this category. The determination of subjective weights is deeply affected by the experts’ judgment. If experts lack the experience for answering those subjective weighting methods, the results of the weights will be unreliable [8]. The objective weighting methods have the advantage of not needing to interview experts like the subjective weighting methods do. Using the objective weighting methods can effectively reduce the investigation time and cost of risk analysis. It can also avoid the bias arising from the experts’ experience or limited information. The criteria weights obtained by the objective weighting methods reflect the discriminative power of the criteria over the evaluation system [14,15]. Frequently used method for the integration of risk scores in recent years include Vlsekriterijumska Optimizcija i Kaompromisno Resenje (VIKOR) [16], the technique for order preference by similarity to an ideal solution (TOPSIS) [7], preference ranking organization method for enrichment evaluation (PROMETHEE) [17], complex proportional assessment of alternatives (COPRAS) [4], weighted aggregated sum product assessment (WASPAS) [18], and additive ratio assessment (ARAS) [19], among others, which can be used to assess the risk scores and provide a basis for ranking the failure modes. The current MCDA follows an important trend in the development of risk assessment technology, that being to develop faster, more effective, and more reliable analysis models for determining the risk factor weights and sorting the failure modes. It is thus a good idea to combine MCDA with failure mode and effect analysis (FMEA). This theoretical framework can be applied to analyze the risks and reliability of components, products, structures, and systems [6]. Such methods have been applied, for example, for the reliability analysis of computer numerical control rotary machines [3], damage detection of rotor blades of an aircraft’s turbines [20], and robustness evaluation of audio products [7].
A hybrid MCDA model was proposed by Sofuoğlu [21], who combined indifference threshold-based attribute ratio analysis (ITARA) [22] with multiple methods to discuss material selection issues. The model lays an excellent foundation for ITARA research. Our study extends the ITARA-TOPSIS approach, which uses different concepts to improve and apply it in the field of risk assessment. We propose a novel MCDA risk analysis model that integrates the improved ITARA method and the modified TOPSIS technique. The determination of risk factors is based on the FMEA theory, including severity, occurrence, and detection. An important indicator, the expected cost, is also included in the study. It is feasible to identify the importance of these risk factors through ITARA. We improve the rationality of the original ITARA [22] for practical applications and introduce the standard deviation (SD) and the concept of the aspiration level into the calculation process. The improved ITARA can not only reflect the differences between the alternatives, but also understand the alternative performance to the aspiration level. In addition, the modified TOPSIS is applied to calculate the final risk score of each failure mode. In the conventional TOPSIS [23], the Euclidean distance is used to define the gap between the two failure modes. The Euclidean distance is replaced by the gray correlation coefficient in this study. This allows us to take the degree of correlation between failure modes under multiple risk factors to obtain a more reliable gap measurement. Moreover, the ranking index of TOPSIS developed by Kuo [24] can generate more reasonable ranking results. The proposed model overcomes some of the limitations and shortcomings of previous MCDA models and enhances the analysis capability of the model. The innovative features of this model are outlined below:
- The proposed model is new because it integrates an improved ITARA method with the modified TOPSIS technique to overcome some shortcomings of conventional FMEA. Reviewing the risk management literature, we found limited articles combining ITARA with TOPSIS to formulate the risk analysis model;
- This study improves the original ITARA method to more effectively identify critical risk factors and generate more reliable weights. In addition, we replace the gray correlation coefficient and aspiration level in the TOPSIS technique to obtain more reasonable ranking results for the failure modes;
- In this study, the input data is based on qualitative information from the expert surveys, and the amount of data depends on the number of experts, failure modes, and risk factors. The quality and efficiency of the solution obtained from the proposed model are not affected by the amount of data;
- The results of the sensitivity analysis of weight changes for the improved ITARA method indicate that this MCDA model has the robustness for practical applications.
The remainder of this paper is organized as follows. Section 2 reviews the MCDA-based risk assessment and the FMEA literature. Section 3 describes the proposed ITARA-TOPSIS integrated assessment model. Section 4 introduces a real application to illustrate the feasibility of this model. Section 5 discusses the findings and contributions of this study, followed by a summary of the discussion and some directions for future research.
2. A Brief Literature Review of MCDM Combined with FMEA
There are many methods used in MCDA to analyze and rank the determined alternatives or solutions with respect to the important criteria, factors, or indexes [25,26]. MCDA allows for the simultaneous integration of qualitative information and quantitative data and is particularly suitable for processing objective data or subjective judgments. Such an approach is especially useful for environments where risk is uncertain or where experts or decision-makers must rely upon opinions or judgments to expand their evaluation [5,27,28].
The main purpose of MCDA applied in risk management is to construct a structured risk analysis framework and to enhance decision-makers’ understanding of specific decision risk issues. The following list includes a collection of risk management themes that can be dealt with through MCDA [5,29]:
- Screening risk improvement strategies: The time and cost of risk assessments are considerable, so eliminating as many extraneous considerations as possible from improvement programs is desirable.
- Classing and sorting risk prevention measures: Sometimes, risk prevention requires a combination of several measures to maximize the effectiveness of its defense mechanism.
- Searching for the design, identity, or creation of a new alternative, strategy, or measure to meet the goals: Establish an innovative, unique, or novel risk assessment framework for specific issues.
- Detecting potential failure modes or failure factors: From expert interviews or instrument measurements, potential failure factors are summarized and ranked (from highest to lowest, according to a chosen algorithm), and engineers design a product or system of production and eliminate the cause of failure.
- Planning the optimal combination of parameters: Use multi-objective programming tools to find the optimal parameter design and maximize product or system reliability.
Risk engineers will use different methods for risk assessment and internal reporting in different problem situations [4]. Evaluation approaches used to determine the criteria, guidelines, and factors include the checklist, brainstorming, HAZOP, FMEA, structured what if technique (SWIFT), root cause analysis (RCA), primary hazard analysis (PHA), FTA, event tree analysis (ETA), and Ishikawa diagram approaches [30].
The literature review shows many risk assessment studies combining FMEA and MCDA to develop various evaluation models for risk control and improvement in various industries [31,32,33]. The FMEA method is an efficient tool for risk assessment and accident prevention. It has been applied to discover, control, and eliminate recognized or potential failure modes and to improve the robustness of complex systems [32]. In contrast to other risk assessment methods, the major emphasis of FMEA is to engage in proactive treatment of the product or system, rather than finding a solution after the risk has happened. This can help risk engineers to adjust programs, increase compensating provisions, employ the recommended ways, reduce the likelihood of failures, and avoid hazardous accidents [33]. Conventionally, the most common method for evaluating failure risk in FMEA is by developing the risk priority number (RPN). The RPN is the product of the severity (S), occurrence (O) and detection (D) difficulty rates. However, the crisp RPN method has some limitations when applied in real-world cases. The shortcomings of the conventional FMEA are listed below [3,4,32]:
- The three risk factors used in FMEA calculations do not encompass the entire range of causal factors;
- Measuring risk factors (e.g., severity and detection) is very subjective, and a holistic description of group opinion or judgment is lacking;
- The three factors are hard to precisely evaluate in numerical form;
- The three risk factors are often given equal relative weights;
- The mathematical formula for calculating the conventional RPN is questionable;
- RPN values are not continuous with many holes in the scaling, and there is no mechanism to interpret the meaning of the differences between different RPNs;
- Different combinations of the three risk factors may lead to an identical RPN value, causing some high-risk failure modes to be ignored;
- Many of the scores in the range of 1—1000 cannot be formed from the product of the three risk factors;
- Small variations in each rating may lead to tremendously different effects on the RPN.
The FMEA method has been proven to be one of the most important analytical tools for early preventative initiatives in a system, process, or service. However, the limitations above might reduce the reliability of conventional FMEA. The ITARA-TOPSIS-based assessment model was proposed to remedy these shortcomings in the conventional FMEA method.
The three risk factors used in FMEA calculations do not encompass the entire range of causative factors. Some decision-makers are taking the expected cost into account when making this type of decision [31]. Therefore, to comprehensively evaluate the failure modes, the proposed FMEA described is not limited to the original three risk factors. The expected cost is added in the model for risk analysis. The expected cost is the maintenance cost that must be paid when the failure mode occurs. During the process of risk evaluation, experts choose a linguistic term to describe the degree of four risk factors for every failure mode. The corresponding linguistic term scores are shown in Table 1. For example, if the expert considers that the expected cost to fix a specific failure mode is almost close to the original price of the product, then the relative score for the expected cost (E) for the failure mode is 10.
3. The ITARA-TOPSIS-Based Integrated Assessment Model
This section introduces the proposed model and analysis procedures. First, the improved ITARA method is developed to generate weights for the risk factors, and then the modified TOPSIS method is used to integrate and rank the risk scores of the failure modes.
3.1. Improved ITARA
The original ITARA method proposed by Hatefi et al. [22] is applied to generate objective weights for the risk factors. The importance of the risk factors is assigned based on two parameters: dispersion logic (DL) and the indifference threshold (IT). The so-called DL is mainly used to measure the degree of dispersion among failure modes. If the risk rating dispersion of all failure modes in a risk factor is low, the generated weight will be relatively small. This indicates that the criterion has little discriminative power on the evaluation system (i.e., it cannot distinguish between good and bad alternatives). The IT is a threshold value which indicates the degree of allowable dispersion among failure modes. When the degree of dispersion between two adjacent failure modes is less than the threshold, it means that the decision-makers can tolerate the gap. Conversely, when the degree of dispersion exceeds the IT, it means that the corresponding risk factor has significant discriminative power.
However, the original ITARA method only considers the distance between failure modes and ignores their degree of separation relative to the aspiration level (lowest rating). A simple example is to illustrate the shortcomings of the original ITARA method. Assume that there are four failure modes. The risk ratings of four failure modes under the two risk factors are and , and the lowest rating is 1. Although the internal dispersions of the two sets of data are the same, they are significantly different from the lowest rating. In the original ITARA method, the weights of the two criteria will be equal, but this violates the principle of rationality for practical applications. The improved ITARA method can effectively alleviate this shortcoming by adding the coefficient of variation (CV) as a parameter to reflect the overall degree of dispersion. When the risk rating of the failure mode is farther away from the lowest rating, the corresponding risk factor should be assigned a higher weight, which means that this risk factor should be valued by decision-makers. The improved ITARA method proposed in this study is a semi-objective weighting method, because some parameters in the calculation procedure need to be determined by the decision-makers or experts. The steps of the improved ITARA method are discussed in detail below.
- Step 1: Obtain the assessment matrix X.
Assume that there are m failure modes (Mi) assessed through n risk factors (Cj) to obtain the assessment matrix X, as shown in Equation (1). Here, an aspiration level (xaspire, j) is added as an item:
where xij represents the risk rating of the ith failure mode under the jth risk factors.
- Step 2: Set the indifference threshold (ITj).
The decision-makers formulate a reasonable ITj for risk factors, j = 1, 2, …, n. ITj reflects the allowable range of decision-makers for the degree of dispersion.
- Step 3: Calculate the normalized matrix A.
Normalization can unify the assessment units of all risk factors, so the range of elements in the matrix A is between 0 and 1, as shown in Equation (2):
where .
Here, NITj can also be obtained through the normalization of ITj, as shown in Equation (3):
- Step 4: Sort the elements of matrix A (ascending order).
Under the same risk factors, the elements in matrix A are sorted in ascending order to form matrix , as shown in Equation (4). Here, the rows of matrix do not represent the m failure modes, which are used as the base of the normalized values to assess the weights of risk factors. The aspiration level must be the minimum value, so it will be sorted as the first one:
- Step 5: Calculate the dispersion degree of the adjacent values in each column.
The dispersion degree of the adjacent values in each column can be defined by Equation (5):
- Step 6: Determine the distance between and .
When , the degree of dispersion between the adjacent values in each column is beyond the acceptable range of the decision-makers. Therefore, is used to represent the distance between and . Conversely, when , it means that is not significant, so is set to 0. The calculation is as shown in Equation (6):
- Step 7: Generate the weights of the risk factors.
The original ITARA method only calculated the distance between the adjacent values in each column. It did not consider the deviation among the failure modes. Therefore, the CV parameter is added to generate a set of reliable weights, as shown Equation (7):
where and . Here, the calculation of the standard deviation , and the average does not include the aspiration level, while is a proportional parameter whose range is between 0 and 1. In general, when the decision-makers consider the importance of the distance of two neighbors and the CV simultaneously, the is set to 0.5. If the decision-makers focus on the distance between two neighbors, will be set to a value greater than 0.5.
3.2. Modified TOPSIS
The TOPSIS is an effective MCDA method that is used to integrate the performance values of the solutions. The technique mainly determines positive and negative ideal solutions (PIS and NIS) in the solution combinations. Then, we calculate the relative position of each solution by measuring the gaps between each solution and the PIS and NIS. The best solution is closest to the PIS and farthest away from the NIS. The TOPSIS has been widely used in many practical decision-making problems [34]. However, it uses the Euclidean distance to define the distance, which is not suitable for multi-dimensional data [35], and it lacks the amount of information needed to measure potential uncertainty. In order to overcome the above problems, this study uses the gray correlational coefficient to determine the distance between each solution and the PIS and NIS. This is a method for judging the degree of correlation between solutions based on the similarity of multi-dimensional geometric shapes [36].
After the weights of the risk factors are generated by the improved ITARA method, the modified TOPSIS is used to prioritize the failure modes. The procedures of the modified TOPSIS for determining the ranking of the failure modes is outlined below.
- Step 1: Obtain the assessment matrix X.
This is the same as Step 1 in the improved ITARA method.
- Step 2: Calculate the normalized matrix Y.
Here, the highest rating () is used as the denominator instead of the maximum value used in the previous method (). This can truly reflect the real gap. The normalized matrix Y (Equation (8)) is indicated as follows:
where .
- Step 3: Derive the weighted normalized matrix F.
A weighted normalized matrix is obtained by multiplying the risk factor weights by the normalized matrix Y, as shown in Equation (9):
- Step 4: Set the PIS and NIS.
In risk management, the aspiration level is the minimum risk rating, which is regarded as the PIS (Equation (10)). On the other hand, the highest risk rating is the NIS (Equation (11)):
- Step 5: Calculate the gray correlation coefficient of each failure mode in relation to the PIS and NIS.
The gray correlation coefficient of the failure mode i in relation to the PIS and NIS is calculated using Equations (12) and (13), respectively. The ρ is called the distinguished coefficient, which reduces the influence of the maximum absolute difference and adjusts the difference of the correlation coefficient. [0,1], and in general, ρ is set as 0.5. The larger the value of ρ is, the smaller the disintegration capability is:
- Step 6: Calculating the closeness coefficient (CCi).
The CCi is the TOPSIS ranking index, ranging in value from −1 to 1. Kuo [24] provided a novel ranking index to overcome the shortcomings of the conventional TOPSIS, as presented as Equation (14):
where and are the gray correlation coefficient between the failure mode and the PIS and NIS, respectively. The two values are the main parameters for constructing the CCi. The larger the CCi (or the larger the ), the closer the failure mode i is to the NIS, which also means that it has a higher risk. Here, w+ and w− are the weights for and , respectively, and w+ + w− = 1 is required. Generally, when the decision-makers do not tend to value the PIS or NIS, both w+ and w− will be set to 0.5 [24].
4. Demonstration of the Model Using a Real Case
The proposed model was applied for the analysis of a steam turbine for a power plant. Today, there are approximately 448 active nuclear power plants in 31 countries around the world. Nuclear power plants are a type of highly efficient energy output infrastructure, emitting almost no greenhouse gases or carbon dioxide. However, the cost of nuclear power plant construction is very high, and the demand for imported technology is also high. The maintenance costs are higher than other energy supply facilities. Steam turbines are an essential component, and their reliability is important to the operation of the power plant. A steam turbine is essentially a heat engine that performs mechanical work, using steam as the working fluid. Compared with the traditional reciprocating type of steam engines, steam turbines have a greatly improved heat transfer efficiency. Power plants that use steam turbines are commonly known as thermal power plants. They are particularly suitable for fossil fuel-fired thermal power and nuclear power plants. About 80% of the world’s electricity is generated by steam turbine engines [37]. To save costs and ensure the reliability of such turbine systems, it is necessary to evaluate the potential failure modes and implement risk assessment.
4.1. Background Description
The effectiveness and practicability of the proposed model was demonstrated by using data from a nuclear power plant in Taiwan. We used the risk factors defined by the FMEA framework as the assessment criteria, including the S, O, D, and E [3,6,7]. The initial decision group consisted of 24 experts, including professors, government regulators, managers, and power plant engineers in related professions. Every expert had many years of experience in the energy industry. Currently, there are two major nuclear power plants in operation in Taiwan. If an unplanned downtime accident occurs at a nuclear power plant, it will have a serious impact on societal activities. Since the pieces of nuclear power plant equipment are numerous and complex, the most critical component, the steam turbine, was selected for investigation. The experts identified nine major potential failure modes in the steam turbine for the nuclear power plant: high temperature of the engine (M1), a clogged lubricating oil system (M2), foreign objects (M3), fracture of the vane (M4), a loose valve (M5), bearing damage (M6), a broken chassis (M7), mechanical transmission breakdown (M8), and rotor breakdown (M9).
4.2. Using Modified ITARA to Generate the Weights of the Risk Factors
After the major potential failure modes were identified, subjective ratings from experts of each failure mode respective to each risk factor were obtained from the questionnaire. We used the following questions to assist experts in making appropriate assessments of failure modes: (1) What is the severity of the damage to the steam turbine after the failure mode occurs? (2) What is the probability of this failure mode occurring? (3) How easy is it to detect the failure mode before it occurs? (4) What are the associated repair costs after the failure mode occurs? All experts followed these questions to complete the questionnaire. The initial questionnaire of Expert 1 is shown in Table A1 in Appendix A. The average assessment matrix of 24 experts is presented in Table 2 (Equation (1)). For the four risk factors, the expert-given threshold ITj was set to 0.5. From Equations (2)–(6), Table 3, Table 4, Table 5 and Table 6 can be obtained.
Through Equation (7), the was set to 0.65 (jointly decided by 24 experts), and the weights of the risk factors could be obtained as follows: wS = 0.2853, wO = 0.2212, wD = 0.2120, and wE = 0.2815, respectively, as shown in Table 7. Severity was rated as the most important risk factor in this case. In terms of the gap between adjacent values in each risk factor, the expected cost had the highest level of discrimination in the evaluation system (vE = 0.0629). Although the expected cost was not the top factor, it was ranked in second place, which indicates that cost consideration was necessary in a steam turbine risk assessment system. In fact, the company made budget allocations for regular steam turbine maintenance. Overall, the importance of these risk factors was ranked as S E O D.
4.3. Using Modified TOPSIS to Integrate the Risk Ratings of the Failure Modes
The risk assessment of a product or system is a difficult and complex task., especially for evaluation in an environment with many failure modes and risk factors. A systematic and scientific analysis model is needed to measure the risk of failures. The TOPSIS is effective for dealing with this type of problem because it explores the distance between each failure mode and the PIS and NIS when determining the priority for improvement. The calculation procedures of the proposed modified TOPSIS are described in Section 3.2.
The concept of the aspiration level is introduced into TOPSIS in this study. Using Equations (8) and (9), the normalized matrix Y and the weighted, normalized matrix F can be obtained, as shown in Table 8 and Table 9.
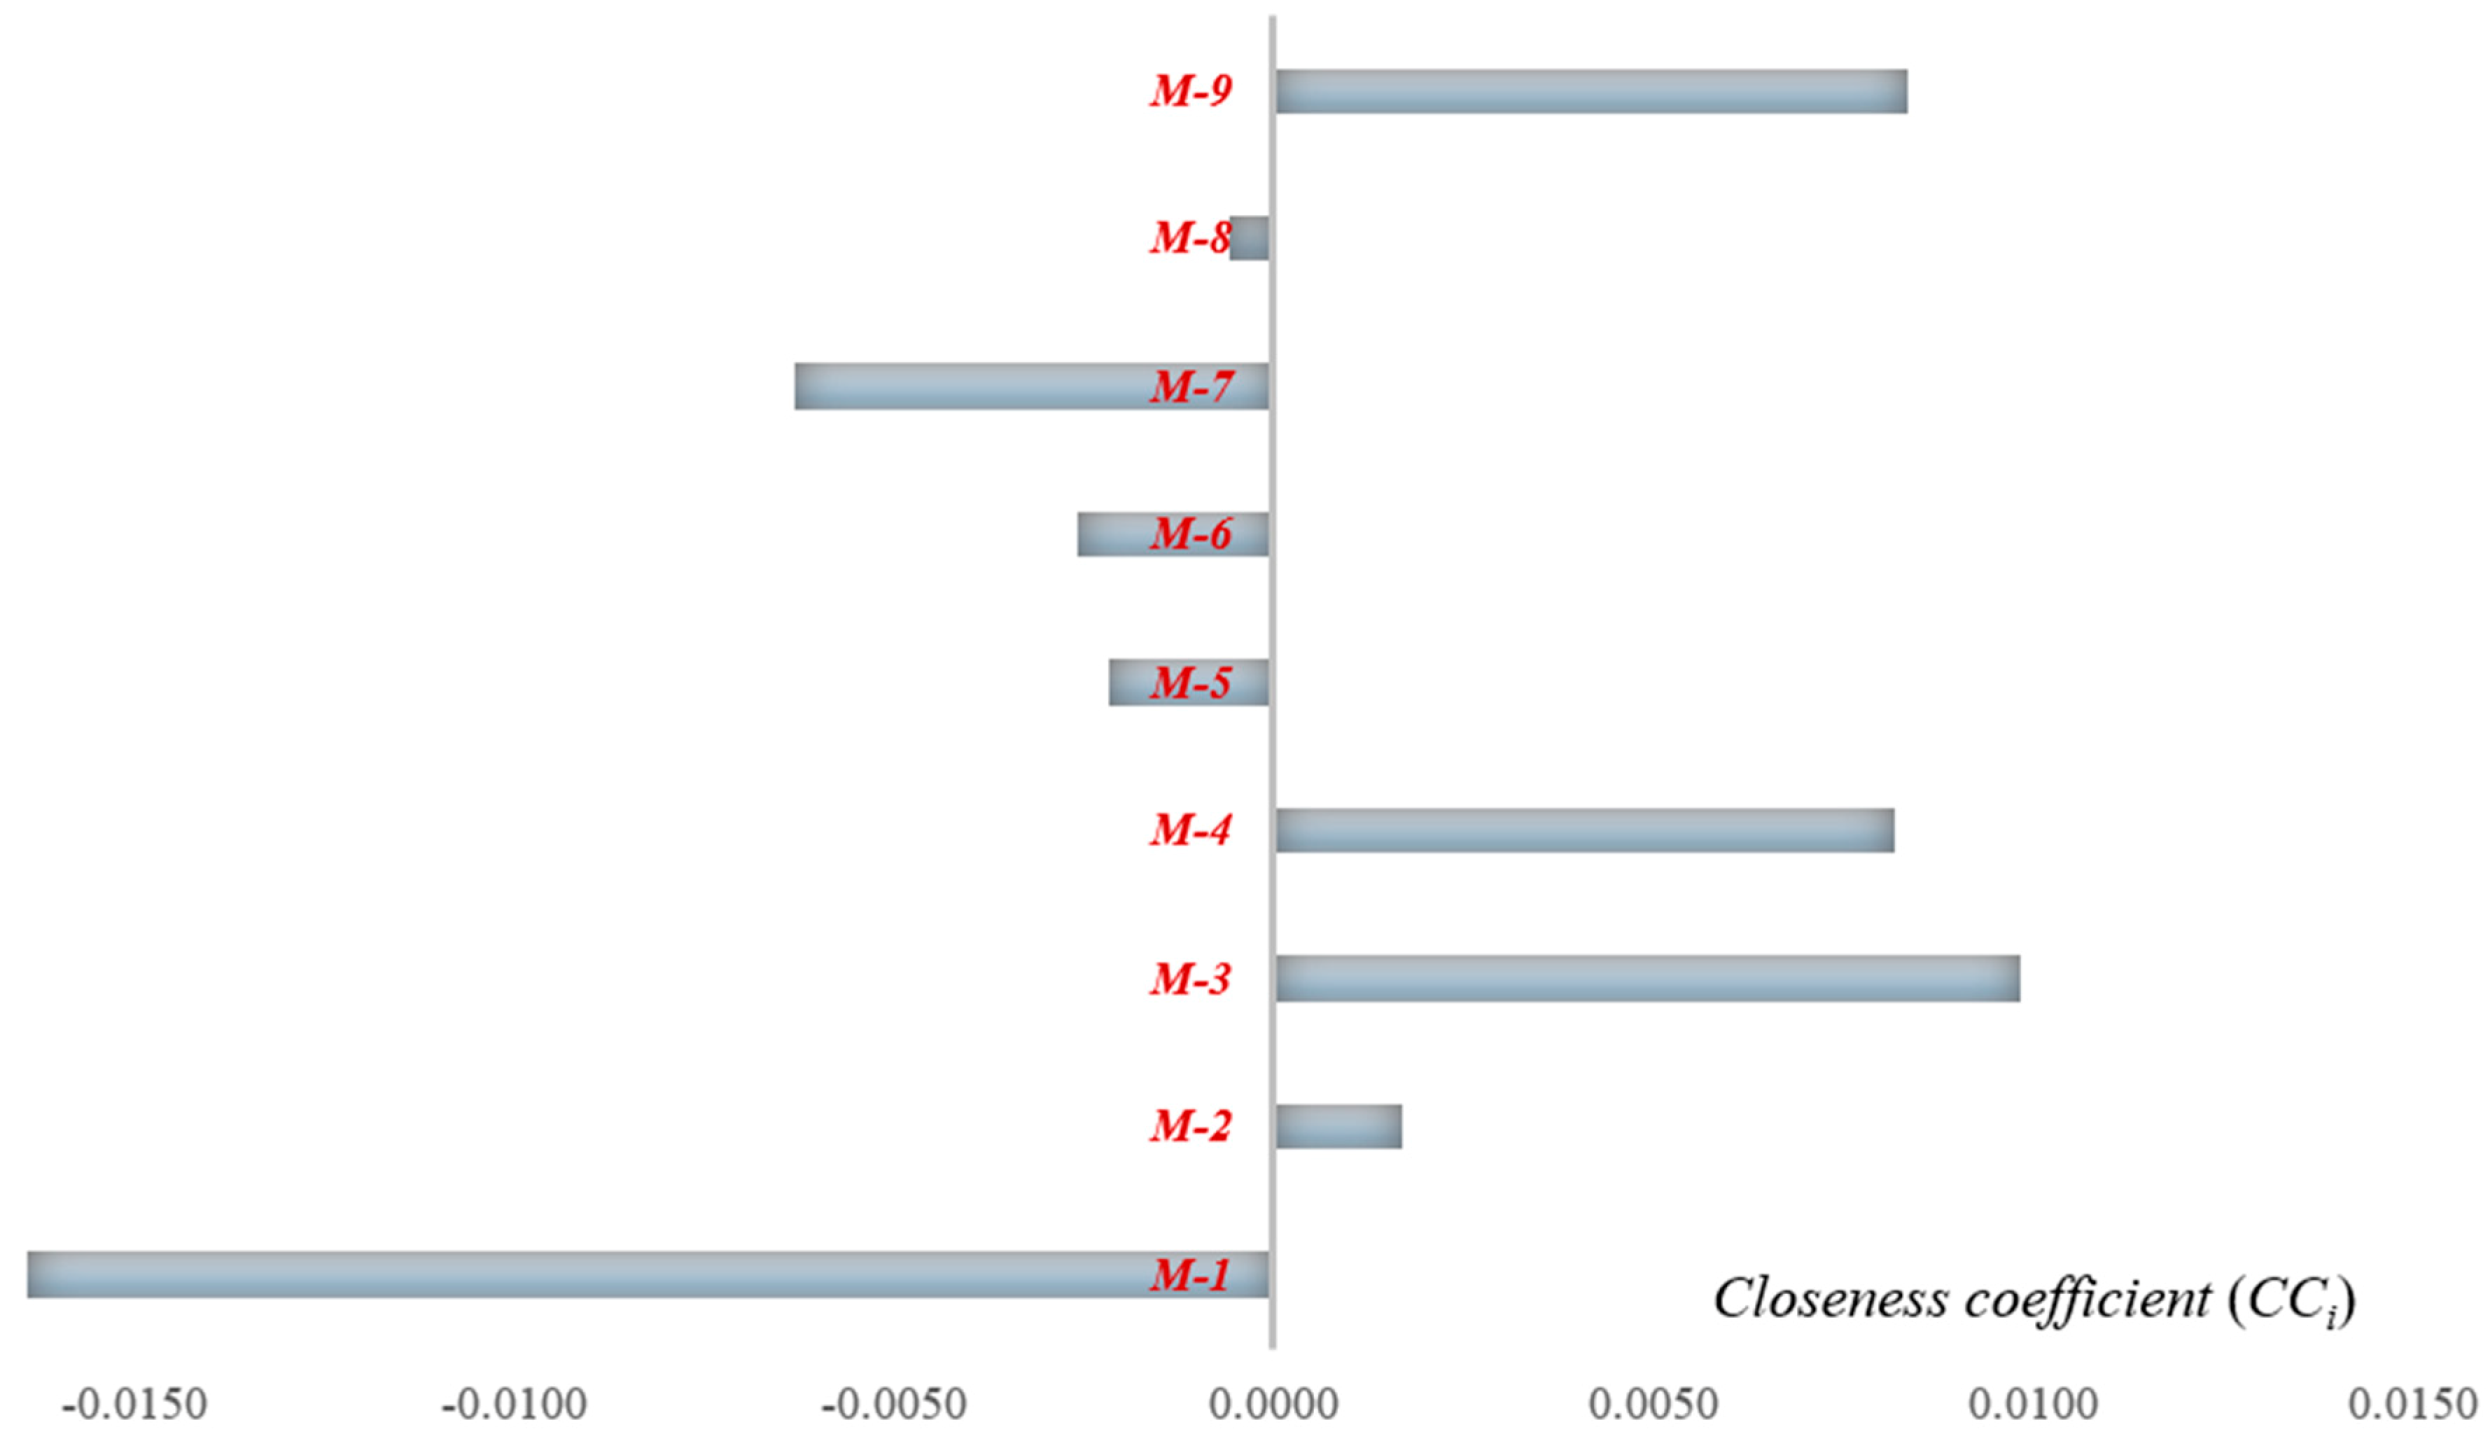
The gray correlation coefficients between the failure mode Mi and the PIS (lowest risk) and NIS (highest risk) can be determined (v* and v−) according to Equations (10)–(14), as shown in Table 10 and Table 11. It was confirmed that the gray correlation coefficient between the less risky failure mode and the PIS must be larger. Conversely, its gray correlation coefficient with the NIS must be smaller. The sum of the CCi was equal to 0. When the CCi was greater than 0, it indicated the set among all the failure modes with higher risk, because their assessment results were closer to the high-risk scenario. Table 12 shows the results of the calculation combining the improved ITARA method and the modified TOPSIS. The priority for failure mode improvement is M3 M9 M4 M2 M8 M5 M6 M7 M1. Figure 1 shows a visualization of our evaluation results, which clearly illustrates the relative risk level. Obviously, M3, M9, M4, and M2 are all high-risk failure modes, and engineers should set improvement measures to eliminate or control them.
5. Discussion and Conclusions
This proposed ITARA-TOPSIS model is suitable for qualitative research on risk assessment in various fields. A review on the MCDA-based hybrid FMEA models for risk management showed only limited articles that considered the inclusion of expected costs for risk maintenance. Although the expected cost is not the top-ranked risk factor, it does affect the failure mode ranking. To the best of our knowledge, this is the first time the ITARA-TOPSIS model has been developed for risk assessment in MCDA research. The developed model is compared with several previous models, including the conventional FMEA, the FMEA with expected costs, AHP-SAW (simple additive weighting method), and the original ITARA -TOPSIS method. Table 13 presents the calculation results for the five models and their failure mode rankings. The results of the FMEA that considers the expected cost are obviously different from those of the conventional FMEA. Although the top failure mode is same, the second-ranking failure modes are M5 and M9, respectively. Moreover, the ranking results obtained with the five methods are different. As mentioned in Section 1, the integrated model proposed in this study should be more reliable and effective than the other four methods because it considers more practical conditions and requirements.
In order to examine the robustness of the modified TOPSIS, a sensitivity analysis is performed by changing the weights of w+ and w− to observe the ranking results. The w+ is adjusted from 0.1 to 0.9, with a proportional change in the w− weight (w− = 1 − w+). From the sensitivity analysis results shown in Figure 2, it can be seen that the top failure mode (in run 1 to 6) is still M3. However, the top rank is changed after run 6, indicating the importance of w+ and w−. This study recommends that decision-makers set both w+ and w− to be 0.5. Since the core concept of TOPSIS considers the importance to PIS and NIS at the same time, using extreme weight combinations may produce biased results.
The weights obtained by the improved ITARA method are based on inherent information, and the index or factor weights are determined by a more objective method. In other words, the proposed method is not only able to consider the weight of every factor, but also determine the weights from a semi-objective point of view. Severity is the most important risk factor from those selected by the 24 decision-makers. Those failure modes identify what needs to be improved first and where to reduce the severity of damage in the system or product.
The steam turbine is the key mechanism for energy conversion in nuclear power plants. Based on the information provided by the 24 engineers and professionals, the factors were selected for the model. The analysis results of the ITARA-TOPSIS integrated assessment model showed that foreign objects (M3), rotor breakdown (M9), and fracture of the vane (M4) were the top three failures leading to the malfunction of the stream turbine. The modified TOPSIS can obtain the relative risk level of the failure modes through the ranking index (CCi). The purpose of the results of the FMEA is to provide engineers with directions for improvement and take proactive measures before an accident occurs. For the above three failure modes, this study conducted in-depth interviews with the experts to illustrate the prevention methods. For M3, better protective nets and fences are constructed to prevent smaller foreign objects from falling in and increase the number of environmental cleanings. For M9 and M4, more detailed checklists are planned to check the two failure modes and prevent unexpected shutdowns. In addition, structural engineers are recommended to use more durable materials to increase the robustness of the steam turbine.
This study makes a contribution to MCDA risk assessment research. This paper not only develops a comprehensive assessment framework for risk management issues, but also proposes a novel, integrated MCDA model to analyze the risk of the failure modes. The three risk factors from FMEA theory are severity, occurrence, and detection. We also included the expected cost as an additional risk factor to make the set of guidelines more complete. The improved ITARA method requires decision-makers or experts’ limited input to determine the criteria weights and uses existing risk rating data to generate the weights of the factors. The existing TOPSIS was also modified to improve its practicality. It is feasible to replace the Euclidean distance with the gray correlation coefficient to determine the multi-dimensional geometric distance more accurately. Moreover, the sensitivity analysis and model comparison provide evidence showing the effectiveness and robustness of the proposed model. The procedures described in this paper can be applied to other MCDA issues, as long as the risk factors are added or modified according to different products or systems. We compiled the research results into a report, which was submitted to the maintenance department of a nuclear energy company. They confirmed that this report would be beneficial to the improvement of product reliability.
Although the ITARA-TOPSIS integrated assessment model is innovative and effective, there are still some shortcomings and limitations. First, the model may be too complex for decision-makers in non-MCDA-related fields to apply. It is expected that some software programs can be developed to help decision-makers using this hybrid model. Second, researchers can apply the model to other industries to compare with the current results. Finally, the interaction among the failure modes has not been discussed in this study. Future work can analyze the effects of interaction among failure modes to identify the most influential failure mode.
Author Contributions
H.-W.L. designed the research and wrote the paper. C.-C.H. and C.-N.H. collected the data, verified the model, and administered the project. J.J.H.L. co-wrote and made revisions to the paper. All authors have read and agreed to the published version of the manuscript.
Funding
No external funding was received for this research.
Institutional Review Board Statement
Not applicable.
Informed Consent Statement
Not applicable.
Data Availability Statement
Not applicable.
Conflicts of Interest
All authors declare that they have no conflict of interest.
Appendix A

Table A1.
The initial questionnaire obtained by Expert 1.
| Mi | S | O | D | E |
|---|---|---|---|---|
| M1 | 6 | 3 | 2 | 3 |
| M2 | 10 | 4 | 4 | 5 |
| M3 | 7 | 3 | 3 | 5 |
| M4 | 10 | 2 | 9 | 6 |
| M5 | 4 | 3 | 3 | 4 |
| M6 | 8 | 5 | 3 | 3 |
| M7 | 5 | 3 | 2 | 3 |
| M8 | 7 | 3 | 5 | 5 |
| M9 | 10 | 2 | 3 | 6 |
References
- Sonnemann, G.; Tsang, M.; Schuhmacher, M. (Eds.) Integrated Life-Cycle and Risk Assessment for Industrial Processes and Products; CRC Press: Boca Raton, FL, USA, 2018. [Google Scholar]
- Aven, T. Risk assessment and risk management: Review of recent advances on their foundation. Eur. J. Oper. Res. 2016, 253, 1–13. [Google Scholar] [CrossRef] [Green Version]
- Lo, H.W.; Liou, J.J.; Huang, C.N.; Chuang, Y.C. A novel failure mode and effect analysis model for machine tool risk analysis. Reliab. Eng. Syst. Saf. 2019, 183, 173–183. [Google Scholar] [CrossRef]
- Lo, H.W.; Shiue, W.; Liou, J.J.; Tzeng, G.H. A hybrid MCDM-based FMEA model for identification of critical failure modes in manufacturing. Soft Comput. 2020, 24, 15733–15745. [Google Scholar] [CrossRef]
- Yatsalo, B.; Gritsyuk, S.; Sullivan, T.; Trump, B.; Linkov, I. Multi-criteria risk management with the use of DecernsMCDA: Methods and case studies. Environ. Syst. Decis. 2016, 36, 266–276. [Google Scholar] [CrossRef]
- Shafiee, M.; Animah, I. An integrated FMEA and MCDA based risk management approach to support life extension of subsea facilities in high-pressure–high-temperature (HPHT) conditions. J. Mar. Eng. Technol. 2020, 1–16. [Google Scholar] [CrossRef]
- Chang, T.W.; Lo, H.W.; Chen, K.Y.; Liou, J.J. A novel FMEA model based on rough BWM and rough TOPSIS-AL for risk assessment. Mathematics 2019, 7, 874. [Google Scholar] [CrossRef] [Green Version]
- Ma, J.; Fan, Z.P.; Huang, L.H. A subjective and objective integrated approach to determine attribute weights. Eur. J. Oper. Res. 1999, 112, 397–404. [Google Scholar] [CrossRef]
- Kou, G.; Lu, Y.; Peng, Y.; Shi, Y. Evaluation of classification algorithms using MCDM and rank correlation. Int. J. Inf. Technol. Decis. Mak. 2012, 11, 197–225. [Google Scholar] [CrossRef]
- Rao, C.; Goh, M.; Zheng, J. Decision mechanism for supplier selection under sustainability. Int. J. Inf. Technol. Decis. Mak. 2017, 16, 87–115. [Google Scholar] [CrossRef]
- Zavadskas, E.K.; Turskis, Z.; Stević, Ž.; Mardani, A. Modelling procedure for the selection of steel pipes supplier by applying fuzzy AHP method. Oper. Res. Eng. Sci. Theory Appl. 2020, 3, 39–53. [Google Scholar] [CrossRef]
- Zamani, M.; Rabbani, A.; Yazdani-Chamzini, A.; Turskis, Z. An integrated model for extending brand based on fuzzy ARAS and ANP methods. J. Bus. Econ. Manag. 2014, 15, 403–423. [Google Scholar] [CrossRef] [Green Version]
- Keršuliene, V.; Zavadskas, E.K.; Turskis, Z. Selection of rational dispute resolution method by applying new step-wise weight assessment ratio analysis (SWARA). J. Bus. Econ. Manag. 2010, 11, 243–258. [Google Scholar] [CrossRef]
- Shannon, C.E. A mathematical theory of communication. ACM Sigmob. Mob. Comput. Commun. Rev. 2001, 5, 3–55. [Google Scholar] [CrossRef]
- Liaw, C.F.; Hsu, W.C.J.; Lo, H.W. A Hybrid MCDM Model to Evaluate and Classify Outsourcing Providers in Manufacturing. Symmetry 2020, 12, 1962. [Google Scholar] [CrossRef]
- Hashemi, H.; Mousavi, S.M.; Zavadskas, E.K.; Chalekaee, A.; Turskis, Z. A new group decision model based on grey-intuitionistic fuzzy-ELECTRE and VIKOR for contractor assessment problem. Sustainability 2018, 10, 1635. [Google Scholar] [CrossRef] [Green Version]
- Morkunaite, Z.; Podvezko, V.; Zavadskas, E.K.; Bausys, R. Contractor selection for renovation of cultural heritage buildings by PROMETHEE method. Arch. Civ. Mech. Eng. 2019, 19, 1056–1071. [Google Scholar] [CrossRef]
- Turskis, Z.; Goranin, N.; Nurusheva, A.; Boranbayev, S. A fuzzy WASPAS-based approach to determine critical information infrastructures of EU sustainable development. Sustainability 2019, 11, 424. [Google Scholar] [CrossRef] [Green Version]
- Turskis, Z.; Lazauskas, M.; Zavadskas, E.K. Fuzzy multiple criteria assessment of construction site alternatives for non-hazardous waste incineration plant in Vilnius city, applying ARAS-F and AHP methods. J. Environ. Eng. Landsc. Manag. 2012, 20, 110–120. [Google Scholar] [CrossRef]
- Bian, T.; Zheng, H.; Yin, L.; Deng, Y. Failure mode and effects analysis based on D numbers and TOPSIS. Qual. Reliab. Eng. Int. 2018, 34, 501–515. [Google Scholar] [CrossRef]
- Sofuoğlu, M.A. Development of an ITARA-based hybrid multi-criteria decision-making model for material selection. Soft Comput. 2019, 23, 6715–6725. [Google Scholar] [CrossRef]
- Hatefi, M.A. Indifference threshold-based attribute ratio analysis: A method for assigning the weights to the attributes in multiple attribute decision making. Appl. Soft. Comput. 2019, 74, 643–651. [Google Scholar] [CrossRef]
- Hwang, C.L.; Yoon, K. Multiple Attribute Decision Making Methods and Applications: A State of the Art Survey; Springer: Berlin/Heidelberg, Germany; New York, NY, USA, 1981. [Google Scholar]
- Kuo, T. A modified TOPSIS with a different ranking index. Eur. J. Oper. Res. 2017, 260, 152–160. [Google Scholar] [CrossRef]
- Yin, L.; Shyur, H.J. A Robust Group Multiple Attributes Decision-Making Method Based on Risk Preference of the Decision Makers. Int. J. Appl. Sci. Eng. 2018, 15, 33–46. [Google Scholar]
- Chuang, Y.C.; Hu, S.K.; Liou, J.J.; Lo, H.W. Building a decision dashboard for improving green supply chain management. Int. J. Inf. Technol. Decis. Mak. 2018, 17, 1363–1398. [Google Scholar] [CrossRef]
- Linkov, I.; Bates, M.E.; Trump, B.D.; Seager, T.P.; Chappell, M.A.; Keisler, J.M. For nanotechnology decisions, use decision analysis. Nano Today 2013, 8, 5–10. [Google Scholar] [CrossRef]
- Hu, S.K.; Tzeng, G.H. A hybrid multiple-attribute decision-making model with modified PROMETHEE for identifying optimal performance-improvement strategies for sustainable development of a better life. Soc. Indic. Res. 2019, 144, 1021–1053. [Google Scholar] [CrossRef]
- Reichelt, B.; Peldschus, F. The application of multi-criteria decision analysis (MCDA) in risk management of civil and environmental engineering projects. Found. Civ. Environ. Eng. 2005, 6, 159–163. [Google Scholar]
- Bagiński, J.; Flisiuk, B.; Górka, W.; Rogowski, D.; Stęclik, T. Multi-criteria Decision Analysis in the Railway Risk Management Process. In International Conference: Beyond Databases, Architectures and Structures; Springer: Cham, Switzerland, 2019; pp. 126–138. [Google Scholar]
- Chang, K.H. Generalized multi-attribute failure mode analysis. Neurocomputing 2016, 175, 90–100. [Google Scholar] [CrossRef]
- Liu, H.C.; Chen, X.Q.; Duan, C.Y.; Wang, Y.M. Failure mode and effect analysis using multi-criteria decision making methods: A systematic literature review. Comput. Ind. Eng. 2019, 135, 881–897. [Google Scholar] [CrossRef]
- Zhu, J.; Shuai, B.; Wang, R.; Chin, K.S. Risk Assessment for Failure Mode and Effects Analysis Using the Bonferroni Mean and TODIM Method. Mathematics 2019, 7, 536. [Google Scholar] [CrossRef] [Green Version]
- Zhang, L.; Zhan, J.; Yao, Y. Intuitionistic fuzzy TOPSIS method based on CVPIFRS models: An application to biomedical problems. Inf. Sci. 2020, 517, 315–339. [Google Scholar] [CrossRef]
- Aggarwal, C.C.; Hinneburg, A.; Keim, D.A. On the surprising behavior of distance metrics in high dimensional space. In International Conference on Database Theory; Springer: Berlin/Heidelberg, Germany, 2001; pp. 420–434. [Google Scholar]
- Younas, M.; Jaffery, S.H.I.; Khan, M.; Khan, M.A.; Ahmad, R.; Mubashar, A.; Ali, L. Multi-objective optimization for sustainable turning Ti6Al4V alloy using grey relational analysis (GRA) based on analytic hierarchy process (AHP). Int. J. Adv. Manuf. Technol. 2019, 105, 1175–1188. [Google Scholar] [CrossRef]
- Xie, H.H.; Zhang, F.; He, Y.Y.; Yang, J.C.; Ma, W.Q. Research on Digital Prototype Technologies of Personnel Airlock for Nuclear Power Plant. In Proceedings of the 2018 International Conference on Power System Technology (POWERCON), Guangzhou, China, 6–8 November 2018; pp. 4684–4691. [Google Scholar]
Figure 1.
Closeness coefficients of the failure modes.

Figure 2.
Results of 9 runs of sensitivity analysis.

Table 1.
Corresponding ratings of linguistic terms.
| Severity | Occurrence | Detection | Expected Cost | Rating |
|---|---|---|---|---|
| No | Almost never | Almost certain | Nearly no cost | 1 |
| Very slight | Remote | Very high | Remote | 2 |
| Slight | Very slight | High | Low | 3 |
| Minor | Slight | Moderately high | Relatively low | 4 |
| Moderate | Low | Moderate | Moderate | 5 |
| Significant | Medium | Low | Moderately high | 6 |
| Major | Moderately high | Very low | High | 7 |
| Extreme | High | Remote | Very high | 8 |
| Serious | Very high | Very remote | Extremely high | 9 |
| Hazardous | Almost certain | Absolute uncertainty | Almost close to original price | 10 |
Table 2.
The assessment matrix X and the indifference threshold ITj.
| Mi | S | O | D | E |
|---|---|---|---|---|
| M1 | 5.590 | 3.475 | 2.470 | 4.865 |
| M2 | 8.160 | 4.330 | 3.155 | 5.425 |
| M3 | 8.120 | 4.975 | 5.065 | 4.980 |
| M4 | 9.340 | 2.865 | 4.125 | 6.120 |
| M5 | 6.185 | 5.250 | 3.770 | 4.605 |
| M6 | 7.420 | 3.900 | 3.255 | 5.390 |
| M7 | 6.770 | 3.415 | 3.705 | 5.040 |
| M8 | 7.070 | 4.160 | 3.735 | 5.395 |
| M9 | 8.815 | 3.720 | 3.080 | 7.010 |
| Aspire | 1 | 1 | 1 | 1 |
| ITj | 0.5 | 0.5 | 0.5 | 0.5 |
Table 3.
The normalized matrix A and the normalized threshold NITj.
| Mi | S | O | D | E |
|---|---|---|---|---|
| M1 | 0.0816 | 0.0937 | 0.0740 | 0.0976 |
| M2 | 0.1192 | 0.1167 | 0.0946 | 0.1089 |
| M3 | 0.1186 | 0.1341 | 0.1518 | 0.0999 |
| M4 | 0.1364 | 0.0772 | 0.1237 | 0.1228 |
| M5 | 0.0903 | 0.1415 | 0.1130 | 0.0924 |
| M6 | 0.1084 | 0.1051 | 0.0976 | 0.1082 |
| M7 | 0.0989 | 0.0921 | 0.1111 | 0.1011 |
| M8 | 0.1033 | 0.1122 | 0.1120 | 0.1083 |
| M9 | 0.1287 | 0.1003 | 0.0923 | 0.1407 |
| Aspire | 0.0146 | 0.0270 | 0.0300 | 0.0201 |
| NITj | 0.007 | 0.013 | 0.015 | 0.010 |
Table 4.
The Matrix (sorted results of matrix A).
| S | O | D | E | |
|---|---|---|---|---|
| Sort 1 | 0.0146 | 0.0270 | 0.0300 | 0.0201 |
| Sort 2 | 0.0816 | 0.0772 | 0.0740 | 0.0924 |
| Sort 3 | 0.0903 | 0.0921 | 0.0923 | 0.0976 |
| Sort 4 | 0.0989 | 0.0937 | 0.0946 | 0.0999 |
| Sort 5 | 0.1033 | 0.1003 | 0.0976 | 0.1011 |
| Sort 6 | 0.1084 | 0.1051 | 0.1111 | 0.1082 |
| Sort 7 | 0.1186 | 0.1122 | 0.1120 | 0.1083 |
| Sort 8 | 0.1192 | 0.1167 | 0.1130 | 0.1089 |
| Sort 9 | 0.1287 | 0.1341 | 0.1237 | 0.1228 |
| Sort 10 | 0.1364 | 0.1415 | 0.1518 | 0.1407 |
Table 5.
The degree of dispersion between adjacent values in each column .
| S | O | D | E | |
|---|---|---|---|---|
| Sort 2-1 | 0.0670 | 0.0503 | 0.0441 | 0.0723 |
| Sort 3-2 | 0.0087 | 0.0148 | 0.0183 | 0.0052 |
| Sort 4-3 | 0.0085 | 0.0016 | 0.0022 | 0.0023 |
| Sort 5-4 | 0.0044 | 0.0066 | 0.0030 | 0.0012 |
| Sort 6-5 | 0.0051 | 0.0049 | 0.0135 | 0.0070 |
| Sort 7-6 | 0.0102 | 0.0070 | 0.0009 | 0.0001 |
| Sort 8-7 | 0.0006 | 0.0046 | 0.0010 | 0.0006 |
| Sort 9-8 | 0.0096 | 0.0174 | 0.0106 | 0.0139 |
| Sort 10-9 | 0.0077 | 0.0074 | 0.0282 | 0.0179 |
Table 6.
The distance between and ().
| S | O | D | E | |
|---|---|---|---|---|
| 1 | 0.0597 | 0.0368 | 0.0291 | 0.0623 |
| 2 | 0.0014 | 0.0013 | 0.0033 | 0.0000 |
| 3 | 0.0012 | 0.0000 | 0.0000 | 0.0000 |
| 4 | 0.0000 | 0.0000 | 0.0000 | 0.0000 |
| 5 | 0.0000 | 0.0000 | 0.0000 | 0.0000 |
| 6 | 0.0029 | 0.0000 | 0.0000 | 0.0000 |
| 7 | 0.0000 | 0.0000 | 0.0000 | 0.0000 |
| 8 | 0.0023 | 0.0039 | 0.0000 | 0.0039 |
| 9 | 0.0004 | 0.0000 | 0.0132 | 0.0078 |
Table 7.
The results obtained with the improved indifference threshold-based attribute ratio analysis (ITARA) method.
Table 7.
The results obtained with the improved indifference threshold-based attribute ratio analysis (ITARA) method.
| S | O | D | E | |
|---|---|---|---|---|
| vj | 0.0599 | 0.0370 | 0.0321 | 0.0629 |
| cvj | 0.1636 | 0.1899 | 0.2049 | 0.1356 |
| wj | 0.2853 | 0.2212 | 0.2120 | 0.2815 |
| Rank | 1 | 3 | 4 | 2 |
Table 8.
The normalized matrix Y (modified technique for order preference by similarity to an ideal solution (TOPSIS)).
Table 8.
The normalized matrix Y (modified technique for order preference by similarity to an ideal solution (TOPSIS)).
| Mi | S | O | D | E |
|---|---|---|---|---|
| M1 | 0.559 | 0.348 | 0.247 | 0.487 |
| M2 | 0.816 | 0.433 | 0.316 | 0.543 |
| M3 | 0.812 | 0.498 | 0.507 | 0.498 |
| M4 | 0.934 | 0.287 | 0.413 | 0.612 |
| M5 | 0.619 | 0.525 | 0.377 | 0.461 |
| M6 | 0.742 | 0.390 | 0.326 | 0.539 |
| M7 | 0.677 | 0.342 | 0.371 | 0.504 |
| M8 | 0.707 | 0.416 | 0.374 | 0.540 |
| M9 | 0.882 | 0.372 | 0.308 | 0.701 |
Table 9.
The weighted normalized matrix F.
| Mi | S | O | D | E |
|---|---|---|---|---|
| M1 | 0.159 | 0.077 | 0.052 | 0.137 |
| M2 | 0.233 | 0.096 | 0.067 | 0.153 |
| M3 | 0.232 | 0.110 | 0.107 | 0.140 |
| M4 | 0.266 | 0.063 | 0.087 | 0.172 |
| M5 | 0.176 | 0.116 | 0.080 | 0.130 |
| M6 | 0.212 | 0.086 | 0.069 | 0.152 |
| M7 | 0.193 | 0.076 | 0.079 | 0.142 |
| M8 | 0.202 | 0.092 | 0.079 | 0.152 |
| M9 | 0.251 | 0.082 | 0.065 | 0.197 |
| r* | 0.029 | 0.022 | 0.021 | 0.028 |
| r− | 0.285 | 0.221 | 0.212 | 0.281 |
Note: The “*” and “−” symbol represent the positive and negative ideals, respectively.
Table 10.
The gray correlation coefficient of the failure mode i in relation to the positive ideal solution (PIS).
Table 10.
The gray correlation coefficient of the failure mode i in relation to the positive ideal solution (PIS).
| Mi | S | O | D | E | v* |
|---|---|---|---|---|---|
| M1 | 1.000 | 0.867 | 1.000 | 0.962 | 3.830 |
| M2 | 0.773 | 0.731 | 0.836 | 0.890 | 3.231 |
| M3 | 0.776 | 0.654 | 0.574 | 0.946 | 2.951 |
| M4 | 0.700 | 1.000 | 0.679 | 0.814 | 3.193 |
| M5 | 0.936 | 0.626 | 0.729 | 1.000 | 3.292 |
| M6 | 0.827 | 0.794 | 0.817 | 0.894 | 3.332 |
| M7 | 0.881 | 0.879 | 0.739 | 0.938 | 3.438 |
| M8 | 0.855 | 0.755 | 0.735 | 0.893 | 3.238 |
| M9 | 0.731 | 0.824 | 0.852 | 0.733 | 3.139 |
Note: The “*” symbol represent the positive ideals.
Table 11.
The gray correlation coefficient of the failure mode i in relation to the negative ideal solution (NIS).
Table 11.
The gray correlation coefficient of the failure mode i in relation to the negative ideal solution (NIS).
| Mi | S | O | D | E | v− |
|---|---|---|---|---|---|
| M1 | 0.433 | 0.824 | 0.770 | 0.726 | 2.754 |
| M2 | 0.708 | 0.900 | 0.820 | 0.782 | 3.211 |
| M3 | 0.701 | 0.968 | 1.000 | 0.737 | 3.406 |
| M4 | 1.000 | 0.777 | 0.902 | 0.865 | 3.544 |
| M5 | 0.476 | 1.000 | 0.870 | 0.703 | 3.049 |
| M6 | 0.599 | 0.860 | 0.828 | 0.778 | 3.065 |
| M7 | 0.527 | 0.819 | 0.865 | 0.743 | 2.954 |
| M8 | 0.558 | 0.884 | 0.867 | 0.779 | 3.088 |
| M9 | 0.845 | 0.845 | 0.814 | 1.000 | 3.504 |
Note: The “−” symbol represent the negative ideals.
Table 12.
The calculation results from the modified TOPSIS.
| Mi | v* | v− | CC | Rank |
|---|---|---|---|---|
| M1 | 3.830 | 2.754 | −0.0164 | 9 |
| M2 | 3.231 | 3.211 | 0.0017 | 4 |
| M3 | 2.951 | 3.406 | 0.0098 | 1 |
| M4 | 3.193 | 3.544 | 0.0082 | 3 |
| M5 | 3.292 | 3.049 | −0.0022 | 6 |
| M6 | 3.332 | 3.065 | −0.0026 | 7 |
| M7 | 3.438 | 2.954 | −0.0063 | 8 |
| M8 | 3.238 | 3.088 | −0.0006 | 5 |
| M9 | 3.139 | 3.504 | 0.0084 | 2 |
Note: The “*” and “−” symbol represent the positive and negative ideals, respectively.
Table 13.
Failure mode rankings of the five models.
| Conventional FMEA | Conventional FMEA (Including Expected Costs) | AHP-SAW | Original ITARA -TOPSIS | Our Proposed Model | ||||||
|---|---|---|---|---|---|---|---|---|---|---|
| Mi | RPN | Rank | RPN | Rank | SAW | Rank | CC | Rank | CC | Rank |
| M1 | 47.980 | 9 | 233.424 | 9 | 4.257 | 9 | 0.072 | 9 | −0.0164 | 9 |
| M2 | 111.475 | 3 | 604.752 | 4 | 5.482 | 4 | 0.361 | 7 | 0.0017 | 4 |
| M3 | 204.611 | 1 | 1018.962 | 1 | 5.893 | 3 | 0.672 | 1 | 0.0098 | 1 |
| M4 | 110.381 | 4 | 675.533 | 3 | 5.896 | 2 | 0.629 | 2 | 0.0082 | 3 |
| M5 | 122.417 | 2 | 563.729 | 6 | 5.021 | 7 | 0.401 | 5 | −0.0022 | 6 |
| M6 | 94.193 | 7 | 507.701 | 7 | 5.187 | 6 | 0.339 | 8 | −0.0026 | 7 |
| M7 | 85.658 | 8 | 431.716 | 8 | 4.891 | 8 | 0.388 | 6 | −0.0063 | 8 |
| M8 | 109.851 | 5 | 592.645 | 5 | 5.248 | 5 | 0.445 | 4 | −0.0006 | 5 |
| M9 | 100.999 | 6 | 708.001 | 2 | 5.964 | 1 | 0.488 | 3 | 0.0084 | 2 |
Publisher’s Note: MDPI stays neutral with regard to jurisdictional claims in published maps and institutional affiliations. |
© 2021 by the authors. Licensee MDPI, Basel, Switzerland. This article is an open access article distributed under the terms and conditions of the Creative Commons Attribution (CC BY) license (http://creativecommons.org/licenses/by/4.0/).
Share and Cite
MDPI and ACS Style
Lo, H.-W.; Hsu, C.-C.; Huang, C.-N.; Liou, J.J.H. An ITARA-TOPSIS Based Integrated Assessment Model to Identify Potential Product and System Risks. Mathematics 2021, 9, 239. https://0-doi-org.brum.beds.ac.uk/10.3390/math9030239
AMA Style
Lo H-W, Hsu C-C, Huang C-N, Liou JJH. An ITARA-TOPSIS Based Integrated Assessment Model to Identify Potential Product and System Risks. Mathematics. 2021; 9(3):239. https://0-doi-org.brum.beds.ac.uk/10.3390/math9030239
Chicago/Turabian StyleLo, Huai-Wei, Chao-Che Hsu, Chun-Nen Huang, and James J. H. Liou. 2021. "An ITARA-TOPSIS Based Integrated Assessment Model to Identify Potential Product and System Risks" Mathematics 9, no. 3: 239. https://0-doi-org.brum.beds.ac.uk/10.3390/math9030239
Note that from the first issue of 2016, this journal uses article numbers instead of page numbers. See further details here.