
Blockchain Technology for Winning Consumer Loyalty: Social Norm Analysis Using Structural Equation Modeling

 ,
,  ,
,  ,
,  and
and
Abstract
:1. Introduction
2. Background
2.1. The Implications of Blockchain Technology in the Tourism Industry
2.2. Relationship with the Concept of Loyalty
2.3. The Effect of the Social Environment of the Consumer
2.4. The Influence of Consumers’ Perception on the Loyalty to Blockchain Technology
3. Materials and Methods
3.1. Model Basic Data
3.2. Data Analysis
3.3. Data Collection and Sample
3.4. Variables and Measurements
4. Results
4.1. Descriptive Data
4.2. PLS context of Structural Equations: Analysis of the Model
4.3. The Analysis of the Predictive Validity of the Model
4.4. Multigroup Analysis
5. Conclusions
5.1. Evidence Obtained
5.2. Implications for Practice and Policy
Author Contributions
Funding
Institutional Review Board Statement
Informed Consent Statement
Data Availability Statement
Acknowledgments
Conflicts of Interest
References
- Assaf, A.G.; Li, G.; Song, H.; Tsionas, M.G. Modeling and forecasting regional tourism demand using the bayesian global vector autoregressive (BGVAR) model. J. Travel Res. 2018, 58, 383–397. [Google Scholar] [CrossRef] [Green Version]
- Dogru, T.; Suess, C.; Sirakaya-Turk, E. Why do some countries prosper more in tourism than others? Global competitiveness of tourism development. J. Hosp. Tour. Res. 2020, 45, 215–256. [Google Scholar] [CrossRef]
- Giorgi, E.; Cattaneo, T.; Ni, M.; Alatriste, R.E. Sustainability and effectiveness of Chinese outline for national tourism and leisure. Sustainability 2020, 12, 1161. [Google Scholar] [CrossRef] [Green Version]
- Canmian, L.; Ruyun, Z.; Min, W.; Jing, X. Measurement and prediction of regional tourism sustainability: An analysis of the Yangtze river economic zone, China. Sustainability 2018, 10, 1321. [Google Scholar]
- Zuo, B.; Huang, S. Revisiting the tourism-led economic growth hypothesis: The case of China. J. Travel Res. Int. Assoc. Travel Res. Mark. Prof. 2018, 57, 151–163. [Google Scholar]
- He, X.; Su, L.; Swanson, S.R. The service quality to subjective well-being of Chinese tourists connection: A model with replications. Curr. Issues Tour. 2020, 23, 1–17. [Google Scholar] [CrossRef]
- Liu, Y.; Huang, K.; Bao, J.; Chen, K. Listen to the voices from home: An analysis of Chinese tourists’ sentiments regarding Australian destinations. Tour. Manag. 2018, 71, 337–347. [Google Scholar] [CrossRef]
- Ying, T.; Wen, J. Exploring the male Chinese tourists’ motivation for commercial sex when travelling overseas: Scale construction and validation. Tour. Manag. 2018, 70, 479–490. [Google Scholar] [CrossRef]
- Hoa, T.V.; Turner, L.; Vu, J. Economic impact of Chinese tourism on Australia: A new approach. Tour. Econ. 2018, 24, 677–689. [Google Scholar]
- Shehzad, K.; Liu, X.; Rauf, A.; Arif, M.; Amin, W. Revolutionising tourism development in China: An effective role of ICT and Western silk road project. Asia Pac. J. Tour. Res. 2019, 24, 965–977. [Google Scholar] [CrossRef]
- Zheng, Y.; Goh, E.; Wen, J. The effects of misleading media reports about COVID-19 on Chinese tourists’ mental health: A perspective article. Anatolia 2020, 31, 337–340. [Google Scholar] [CrossRef] [Green Version]
- Hoque, A.; Shikha, F.; Hasanat, M.; Arif, I.; Abdul Hamid, A.B. The effect of coronavirus (COVID-19) in the tourism industry in China. Asian J. Multidiscip. Stud. 2020, 3, 52–58. [Google Scholar]
- Harrisson-Boudreau, J.-P.; Dahl, B. COVID-19 & Ecommerce in Canada—A Performance Index from 50 Online Stores. Available online:https://www.absolunet.com/hubfs/6890475/PDF-Premium-Downloads/eCommerce-COVID-19-Crisis-Canada-Absolunet-Index.pdf (accessed on 19 December 2020).
- Fuyi, L.; Stacey, F.; Gary, G. E-commerce and industrial upgrading in the Chinese apparel value chain. J. Contemp. Asia 2018, 49, 24–53. [Google Scholar]
- Madan, K.; Yadav, R.; Phau, I. Understanding and predicting antecedents of mobile shopping adoption: A developing country perspective. Asia Pac. J. Mark. Logist. 2018, 30, 139–162. [Google Scholar] [CrossRef]
- Morosan, C.; Defranco, A. Co-creating value in hotels using mobile devices: A conceptual model with empirical validation. Int. J. Hosp. Manag. 2016, 52, 131–142. [Google Scholar] [CrossRef]
- Rita, P.; Oliveira, T.; Estorninho, A.; Moro, S.; Volo, S.; Scott, N. Mobile services adoption in a hospitality consumer context. Int. J. Cult. Tour. Hosp. Res. 2018, 1, 143–158. [Google Scholar] [CrossRef] [Green Version]
- Chandra, S.; Srivastava, S.C.; Theng, Y.L. Evaluating the role of trust in consumer adoption of mobile payment systems: An empirical analysis. Commun. Assoc. Inf. Syst. 2010, 27, 561. [Google Scholar] [CrossRef] [Green Version]
- Qasim, H.; Abu-Shanab, E. Drivers of mobile payment acceptance: The impact of network externalities. Inf. Syst. Front. 2016, 18, 1021–1034. [Google Scholar] [CrossRef]
- Liébana-Cabanillas, F.; Marinkovic, V.; de Luna, I.R.; Kalinic, Z. Predicting the determinants of mobile payment acceptance: A hybrid sem-neural network approach. Technol. Forecast. Soc. Chang. 2018, 129, 117–130. [Google Scholar] [CrossRef]
- Chang, Y.W.; Hsu, P.Y.; Lan, Y.C. Cooperation and competition between online travel agencies and hotels. Tour. Manag. 2019, 71, 187–196. [Google Scholar] [CrossRef]
- Delmolino, K.; Arnett, M.; Kosba, A.; Miller, A.; Shi, E. Step by step towards creating a safe smart contract: Lessons and insights from a cryptocurrency lab. In International Conference on Financial Cryptography and Data Security; Springer: Berlin/Heidelberg, Germany, 2016; pp. 79–94. [Google Scholar]
- Kosba, A.; Miller, A.; Shi, E.; Wen, Z.; Papamanthou, C. Hawk: The blockchain model of cryptography and privacy-preserving smart contracts. In Proceedings of the 2016 IEEE Symposium on Security and Privacy (SP), San Jose, CA, USA, 22–26 May 2016; IEEE: New York, NY, USA, 2016; pp. 839–858. [Google Scholar]
- Shermin, V. Disrupting governance with blockchains and smart contracts. Strateg. Chang. 2017, 26, 499–509. [Google Scholar] [CrossRef]
- Savron, L. How blockchain technology could change our lives. Ursidae Undergrad. Res. J. Univ. North. Colo. 2019, 8, 10. [Google Scholar]
- Rashideh, W. Blockchain technology framework: Current and future perspectives for the tourism industry. Tour. Manag. 2020, 80, 104125. [Google Scholar] [CrossRef]
- Kizildag, M.; Dogru, T.; Zhang, T.; Altin, M.; Ozturk, A.B. Blockchain: A paradigm shift in business practices. Int. J. Contemp. Hosp. Manag. 2018, 32, 953–975. [Google Scholar] [CrossRef]
- Wang, L.; Luo, X.R.; Lee, F. Unveiling the interplay between blockchain and loyalty program participation: A qualitative approach based on BubiChain. Int. J. Inf. Manag. 2019, 49, 397–410. [Google Scholar] [CrossRef]
- Kumar, N.; Aujla, G.S.; Garg, S.; Kaur, K.; Rajan, R.; Garg, S. Renewable energy-based multi-indexed job classification and container management scheme for sustainability of cloud data centers. IEEE Trans. Ind. Inform. 2018, 15, 2947–2957. [Google Scholar] [CrossRef]
- Nakamoto, S. Bitcoin: A Peer-To-Peer Electronic Cash System. Available online: https://metzdowd.com (accessed on 10 September 2020).
- Yli-Huumo, J.; Ko, D.; Choi, S.; Park, S.; Smolander, K. Where is current research on blockchain technology?—A systematic review. PLoS ONE 2016, 11, e0163477. [Google Scholar] [CrossRef]
- Ying, W.; Jia, S.; Du, W. Digital enablement of blockchain: Evidence from HNA group. Int. J. Inf. Manag. 2018, 39, 1–4. [Google Scholar] [CrossRef]
- Liu, Z.; Li, Z. A blockchain-based framework of cross-border e-commerce supply chain. Int. J. Inf. Manag. 2019, 52, 102059. [Google Scholar] [CrossRef]
- Willie, P. Can all sectors of the hospitality and tourism industry be influenced by the innovation of blockchain technology? Worldw. Hosp. Tour. Themes 2019, 11, 112–120. [Google Scholar] [CrossRef]
- Önder, I.; Treiblmaier, H. Blockchain and tourism: Three research propositions. Ann. Tour. Res. 2018, 72, 180–182. [Google Scholar] [CrossRef]
- Colombo, E.; Baggio, R. Tourism distribution channels: Academic, industry and government bridges. Bridg. Tour. Theory Pract. 2017, 8, 289–301. [Google Scholar]
- Karinsalo, A.; Halunen, K. Smart contracts for a mobility-as-a-service ecosystem. In Proceedings of the 2018 IEEE International Conference on Software Quality, Reliability and Security Companion (QRS-C), Lisbon, Portugal, 16–20 July 2018; IEEE: Lisbon, Portugal, 2018; pp. 135–138. [Google Scholar]
- Hu, B.; Huang, W.; Yan, S.; Liu, G.; Zhang, T. Business model design and customer loyalty: The mediating role of customer citizenship behavior. Sustainability 2020, 12, 7047. [Google Scholar] [CrossRef]
- Lee, H.N.; Lee, A.S.; Liang, Y.W. An empirical analysis of brand as symbol, perceived transaction value, perceived acquisition value and customer loyalty using structural equation modeling. Sustainability 2019, 11, 2116. [Google Scholar] [CrossRef] [Green Version]
- Jacoby, J.; Kyner, D.B. Brand loyalty vs. repeat purchasing behavior. J. Mark. Res. 1973, 10, 1–9. [Google Scholar] [CrossRef]
- Pamies, S.D. De la Calidad de Servicio a la Fidelidad del Cliente; ESIC Editorial: Madrid, Spain, 2004. [Google Scholar]
- Latif, F.; Pérez, A.; Sahibzada, U.F. Corporate social responsibility (CSR) and customer loyalty in the hotel industry: A cross-country study. Int. J. Hosp. Manag. 2020, 89, 102565. [Google Scholar] [CrossRef]
- Bahri-Ammari, N.; Bilgihan, A. Customer retention to mobile telecommunication service providers: The roles of perceived justice and customer loyalty program. Int. J. Mob. Commun. 2019, 17, 82. [Google Scholar] [CrossRef]
- Wang, C.J. From emotional labor to customer loyalty in hospitality: A three-level investigation with the JD-R model and cor theory. Int. J. Contemp. Hosp. Manag. 2019, 31, 3742–3760. [Google Scholar] [CrossRef]
- Ajzen, I. The theory of planned behavior, organizational behavior and human decision processes. J. Leis. Res. 1991, 50, 176–211. [Google Scholar]
- Bergel, M.; Brock, C. Visitors’ loyalty and price perceptions: The role of customer engagement. Serv. Ind. J. 2019, 39, 575–589. [Google Scholar] [CrossRef]
- Kim, J.; Lee, K.H. Influence of integration on interactivity in social media luxury brand communities. J. Bus. Res. 2017, 99, 422–429. [Google Scholar] [CrossRef]
- Bergel, M.; Frank, P.; Brock, C. The role of customer engagement facets on the formation of attitude, loyalty and price perception. J. Serv. Mark. 2019, 33, 890–903. [Google Scholar] [CrossRef]
- Derbaix, C.; Vanhamme, J. Inducing word-of-mouth by eliciting surprise–A pilot investigation. J. Econ. Psychol. 2003, 24, 99–116. [Google Scholar] [CrossRef] [Green Version]
- Esmaeilpour, M.; Hoseini, S.Y.; Jafarpour, Y. An empirical analysis of the adoption barriers of e-commerce in small and medium sized enterprises (SMEs) with implementation of technology acceptance model. J. Internet Bank. Commer. 2016, 21, 28–57. [Google Scholar]
- Wu, C.; Chen, I.T. The essence of consumption attitude in high involvement purchase process. J. Int. Mark. Mark. Res. 2010, 35, 23–37. [Google Scholar]
- Kim, J.; Ahn, K.; Chung, N. Examining the factors affecting perceived enjoyment and usage intention of ubiquitous tour information services: A service quality perspective. Asia Pac. J. Tour. Res. 2013, 18, 1–20. [Google Scholar] [CrossRef]
- Holbrook, C.M.B. The chain of effects from brand trust and brand affect to brand performance: The role of brand loyalty. J. Mark. 2001, 65, 81–93. [Google Scholar]
- Conner, M.; Armitage, C.J. Extending the theory of planned behavior: A review and avenues for further research. J. Appl. Soc. Psychol. 2010, 28, 1429–1464. [Google Scholar] [CrossRef]
- Cialdini, R.B.; Trost, M.R. Social influence: Social norms, conformity and compliance. In The handbook of Social Psychology; Gilbert, D.T., Fiske, S.T., Lindzey, G., Eds.; McGraw-Hill: New York, NY, USA, 1998; pp. 151–192. [Google Scholar]
- Hung, S.Y.; Ku, C.Y.; Chang, C.M. Critical factors of wap services adoption: An empirical study. Electron. Commer. Res. Appl. 2004, 2, 42–60. [Google Scholar] [CrossRef]
- Kleijnen, M.; Wetzels, M.; De Ruyter, K. Consumer acceptance of wireless finance. J. Financ. Serv. Mark. 2004, 8, 206–217. [Google Scholar] [CrossRef]
- Tedeschi, J.T. Impression Management Theory and Social Psychological Research; Academic Press: New York, NY, USA, 2013. [Google Scholar]
- Sawang, S.; Yuan, S.; Salim, S.A. It’s not only what I think but what they think! The moderating effect of social norms. Comput. Educ. 2014, 76, 182–189. [Google Scholar] [CrossRef] [Green Version]
- Gómez-Galán, J.; Vergara, D.; Ordóñez-Olmedo, E.; Veytia-Bucheli, M.G. Time of use and patterns of Internet consumption in university students: A comparative study between Spanish-speaking countries. Sustainability 2020, 12, 5087. [Google Scholar] [CrossRef]
- Bagozzi, R.P.; Wong, N.; Abe, S.; Bergami, M. Cultural and situational contingencies and the theory of reasoned action: Application to fast food restaurant consumption. J. Consum. Psychol. 2000, 9, 97–106. [Google Scholar] [CrossRef]
- Smith, J.R.; Louis, W.R. Do as we say and as we do: The interplay of descriptive and injunctive group norms in the attitude–behaviour relationship. Br. J. Soc. Psychol. 2011, 47, 647–666. [Google Scholar] [CrossRef] [Green Version]
- Gillenson, M.L.; Sherrell, D.L. Enticing online consumers: An extended technology acceptance perspective. Inf. Manag. 2002, 39, 705–719. [Google Scholar]
- Lu, J.; Yu, C.S.; Yao, J.E. Personal innovativeness, social influences and adoption of wireless internet services via mobile technology. J. Strateg. Inf. Syst. 2007, 14, 245–268. [Google Scholar] [CrossRef]
- Cyr, D.; Hassanein, K.; Head, M.; Ivanov, A. The role of social presence in establishing loyalty in e-service environments. Interact. Comput. 2007, 19, 43–56. [Google Scholar] [CrossRef]
- Cyr, D.; Head, M.; Ivanov, A. Design aesthetics leading to m-loyalty in mobile commerce. Inf. Manag. 2006, 43, 950–963. [Google Scholar] [CrossRef]
- Seoyoung, K.; Sunny, H.; Hyeyoung, M.; Bee-Lia, C.; Heesup, H. Experience, brand prestige, perceived value (functional, hedonic, social, and financial), and loyalty among grocerant customers. Int. J. Hosp. Manag. 2018, 77, 169–177. [Google Scholar]
- Anil, G.; Nikita, D. Tourist adoption of mapping apps: A UTAUT2 perspective of smart travellers. Tour. Hosp. Manag. 2017, 23, 145–161. [Google Scholar]
- Lee, S.; Kim, D.Y. The effect of hedonic and utilitarian values on satisfaction and loyalty of Airbnb users. Int. J. Contemp. Hosp. Manag. 2018, 30, 1332–1351. [Google Scholar] [CrossRef]
- Ye, S.-T.; Zheng, J.; Zhang, J.; Ye, S.; Song, J.-W.; Bo, W.G. The operation of Hangzhou smart tourism project. Destech Trans. Econ. Bus. Manag. 2019, 30, 1332–1351. [Google Scholar] [CrossRef]
- Huang, Y.; Poderi, G.; Šćepanović, S.; Hasselqvist, H.; Warnier, M.; Brazier, F. Embedding internet-of-things in large-scale socio-technical systems: A community-oriented design in future smart grids. In The Internet of Things for Smart Urban Ecosystems. Internet of Things (Technology, Communications and Computing); Cicirelli, F., Guerrieri, A., Mastroianni, C., Spezzano, G., Vinci, A., Eds.; Springer: Cham, Switzerland, 2019; pp. 125–150. [Google Scholar]
- Lin, Y. E-urbanism: E-commerce, migration, and the transformation of Taobao villages in urban China. Cities 2019, 91, 202–212. [Google Scholar] [CrossRef]
- Hair, J.F.; Ringle, C.M.; Sarstedt, M. Pls-sem: Indeed a silver bullet. J. Mark. Theory Pract. 2011, 19, 139–152. [Google Scholar] [CrossRef]
- Hair, J.F.; Black, W.C.; Babin, B.J.; Anderson, R.E. Multivariate data analysis. Pearson Schweiz. Ag. 2013, 3, 128–134. [Google Scholar]
- Hair, J.F.; Sarstedt, M.; Pieper, T.M.; Ringle, C.M. The use of partial least squares structural equation modeling in strategic management research: A review of past practices and recommendations for future applications. Long Range Plan. 2012, 45, 320–340. [Google Scholar] [CrossRef]
- Supanti, D.; Butcher, K. Is corporate social responsibility (CSR) participation the pathway to foster meaningful work and helping behavior for millennials? Int. J. Hosp. Manag. 2019, 77, 8–18. [Google Scholar] [CrossRef]
- Ketchen, D.J. A primer on partial least squares structural equation modeling. Long Range Plan. 2013, 46, 184–185. [Google Scholar] [CrossRef]
- Burke, J.C.; Mackenzie, S.B.; Podsakoff, P.M. A critical review of construct indicators and measurement model misspecification in marketing and consumer research. J. Consum. Res. 2003, 30, 199–218. [Google Scholar]
- Sarstedt, M.; Schwaiger, M.; Taylor, C.R. Multigroup analysis in partial least squares (PLS) path modeling: Alternative methods and empirical results. Soc. Sci. Electron. Publ. 2011, 22, 195–218. [Google Scholar]
- Henseler, J.; Ringle, C.M.; Sarstedt, M. Testing measurement invariance of composites using partial least squares. Soc. Sci. Electron. Publ. 2015, 49, 41–46. [Google Scholar] [CrossRef]
- Cohen, J. Statistical power analysis for the behavioral sciences. Comput. Environ. Urban Syst. 1990, 14, 71. [Google Scholar]
- Faul, F.; Erdfelder, E.; Buchner, A.; Lang, A.G. Statistical power analyses using G*Power 3.1: Tests for correlation and regression analyses. Behav. Res. Methods 2009, 41, 1149–1160. [Google Scholar] [CrossRef] [Green Version]
- Yin, P.; Cai, A.-Y.; Yin, J. The research on Chinese family travelling decision-making and marketing suggestions for tourism destinations. In Proceedings of the 2009 IEEE/INFORMS International Conference on Service Operations, Logistics and Informatics, Chicago, IL, USA, 22–24 July 2009; IEEE: New York, NY, USA, 2009; pp. 524–527. [Google Scholar]
- Christine Roy, M.; Dewit, O.; Aubert, B.A. The impact of interface usability on trust in web retailers. Internet Res. 2001, 11, 388–398. [Google Scholar] [CrossRef]
- Chen, K.C.; Gursoy, D.; Lau, K.L. Longitudinal impacts of a recurring sport event on local residents with different level of event involvement. Tour. Manag. Perspect. 2018, 28, 228–238. [Google Scholar] [CrossRef]
- Bergkvist, L.I.; Rossiter, J.R. The Predictive Validity of Multiple-Item versus Single-Item Measures of the Same Constructs; American Marketing Association: New York, NY, USA, 2007. [Google Scholar]
- Šegota, T.; Mihalič, T.; Kuščer, K. The impact of residents’ informedness and involvement on their perceptions of tourism impacts: The case of Bled. J. Destin. Mark. Manag. 2017, 6, 196–206. [Google Scholar] [CrossRef]
- Huang, L.; Chang, M. Why do travel agencies choose to undergo IPOS in Taiwan? Tour. Econ. 2017, 24, 79–91. [Google Scholar] [CrossRef]
- Dyer, P.; Gursoy, D.; Sharma, B.; Carter, J. Structural modeling of resident perceptions of tourism and associated development on the sunshine coast, Australia. Tour. Manag. 2007, 28, 409–422. [Google Scholar] [CrossRef]
- Shaykh-Baygloo, R. A multifaceted study of place attachment and its influences on civic involvement and place loyalty in Baharestan new town, Iran. Cities 2020, 96, 102473. [Google Scholar] [CrossRef]
- Sinclair-Maragh, G. Demographic analysis of residents’ support for tourism development in Jamaica. J. Destin. Mark. Manag. 2017, 6, 5–12. [Google Scholar] [CrossRef]
- Hsu, L.C.; Wang, K.Y.; Chih, W.H.; Lin, W.C. Modeling revenge and avoidance in the mobile service industry: Moderation role of technology anxiety. Serv. Ind. J. 2019. [Google Scholar] [CrossRef]
- Chen, C.F.; Chou, S.H. Antecedents and consequences of perceived coolness for generation y in the context of creative tourism: A case study of the Pier 2 Art center in Taiwan. Tour. Manag. 2018, 72, 121–129. [Google Scholar] [CrossRef]
- Gursoy, D.; Ouyang, Z.; Nunkoo, R.; Wei, W. Residents’ impact perceptions of and attitudes towards tourism development: A meta-analysis. J. Hosp. Mark. Manag. 2019, 28, 306–333. [Google Scholar] [CrossRef]
- Su, L.; Swanson, S.R.; Chen, X. Reputation, subjective well-being, and environmental responsibility: The role of satisfaction and identification. J. Sustain. Tour. 2018, 26, 1–18. [Google Scholar] [CrossRef]
- Bakhsh, J.; Potwarka, L.R.; Nunkoo, R.; Sunnassee, V. Residents’ support for the Olympic games: Single host-city versus multiple host-city bid arrangements. J. Hosp. Mark. Manag. 2017, 27, 544–560. [Google Scholar] [CrossRef]
- Zheng, Z.; Yaoqi, Z.; Yali, W. Residents’ support intentions and behaviors regarding urban trees programs: A structural equation modeling-multi group analysis. Sustainability 2018, 10, 377. [Google Scholar]
- Lehto, X.Y.; O’Leary, J.T.; Morrison, A.M. The effect of prior experience on vacation behavior. Ann. Tour. Res. 2004, 31, 801–818. [Google Scholar] [CrossRef]
- Kline, R. Principles and Practice of Structural Equation Modeling; The Guilford Press: New York, NY, USA, 2005. [Google Scholar]
- Yoo, B.; Donthu, N. Developing and validating a multidimensional consumer-based brand equity scale. J. Bus. Res. 2001, 52, 1–14. [Google Scholar] [CrossRef]
- Worthington, R.L.; Whittaker, T.A. Scale development research: A content analysis and recommendations for best practices. Couns. Psychol. 2006, 34, 806–838. [Google Scholar] [CrossRef]
- Yong, A.G.; Pearce, S. A beginner’s guide to factor analysis: Focusing on exploratory factor analysis. Tutor. Quant. Methods Psychol. 2013, 9, 79–94. [Google Scholar] [CrossRef]
- Gao, F.; Zhang, Y. Analysis of WeChat on iPhone. In 2nd International Symposium on Computer, Communication, Control and Automation; Atlantis Press: Amsterdam, The Netherlands, 2013; pp. 278–281. [Google Scholar]
- Khechine, H.; Raymond, B.; Augier, M. The adoption of a social learning system: Intrinsic value in the UTAUT model. Br. J. Educ. Technol. 2020, 51, 2306–2325. [Google Scholar] [CrossRef]
- He, K.; Zhang, J.; Zeng, Y. Households’ willingness to pay for energy utilization of crop straw in rural China based on an improved UTAUT model. Energy Policy 2020, 140, 111373. [Google Scholar] [CrossRef]
- Hair, J.F.; Hult, G.T.M.; Ringle, C.M.; Sarstedt, M. A Primer on Partial Least Squares Structural Equation Modeling (PLS-SEM); Sage publications: London, UK, 2016. [Google Scholar]
- Hair Jr, J.F.; Sarstedt, M.; Hopkins, L.; Kuppelwieser, V.G. Partial least squares structural equation modeling (PLS-SEM): An emerging tool in business research. Eur. Bus. Rev. 2014, 26, 106–121. [Google Scholar] [CrossRef]
- Chin, W.W.; Dibbern, J. A permutation based procedure for multi-group PLS analysis: Results of tests of differences on simulated data and a cross of information system services between Germany and the USA. In Modelización con Estructuras de Covarianzas en Ciencias Sociales: Temas Esenciales, Avanzados y Aportaciones Especiales; Netbiblo-Springer: London, UK, 2009; pp. 501–517. [Google Scholar]
- Bagozzi, R.P. Evaluating structural equation models with unobservable variables and measurement error: A comment. J. Mark. Res. 1981, 18, 375–381. [Google Scholar] [CrossRef]
- Chin, W.W. The partial least squares approach to structural equation modeling. Mod. Methods Bus. Res. 1998, 295, 295–336. [Google Scholar]
- Henseler, J.R.; Ringle, C.M.; Sarstedt, M. A new criterion for assessing discriminant validity in variance-based structural equation modeling. J. Acad. Mark. Sci. 2015, 43, 115–135. [Google Scholar] [CrossRef] [Green Version]
- Henseler, J.; Hubona, G.; Ray, P.A. Using pls path modeling in new technology research: Updated guidelines. Ind. Manag. Data Syst. 2016, 116, 2–20. [Google Scholar] [CrossRef]
- Esposito Vinzi, V.; Chin, W.W.; Henseler, J.; Wang, H. Handbook of Partial Least Squares: Concepts, Methods and Applications; Springer: Heidelberg, Germany, 2010. [Google Scholar]
- Diamantopoulos, A.; Siguaw, J.A. Formative versus reflective indicators in organizational measure development: A comparison and empirical illustration. Br. J. Manag. 2006, 17, 263–282. [Google Scholar] [CrossRef]
- Petter, S.; Straub, D.W.; Rai, A. Specifying formative constructs in information systems research. Mis Q. 2007, 31, 623–656. [Google Scholar] [CrossRef] [Green Version]
- Sarstedt, M.; Ringle, C.M.; Henseler, J.; Hair, J.F. On the emancipation of PLS-SEM: A commentary on Rigdon. Long Range Plan. 2012, 47, 154–160. [Google Scholar] [CrossRef]
- Rasoolimanesh, S.M.; Jaafar, M. Sustainable tourism development and residents’ perceptions in world heritage site destinations. Asia Pac. J. Tour. Res. 2017, 22, 34–48. [Google Scholar] [CrossRef]
- Shmueli, G.; Ray, S.; Estrada, J.M.V.; Chatla, S.B. The elephant in the room: Predictive performance of PLS models. J. Bus. Res. 2016, 69, 4552–4564. [Google Scholar] [CrossRef]
- Evermann, J.; Tate, M. Assessing the predictive performance of structural equation model estimators. J. Bus. Res. 2016, 69, 4565–4582. [Google Scholar] [CrossRef]
- Stone, M.P. Cross-validatory choice and assessment of statistical predictions. J. R. Stat. Soc. Ser. B (Methodol.) 1974, 36, 111–133. [Google Scholar] [CrossRef]
- Geisser, S. The predictive sample reuse method with applications. J. Am. Stat. Assoc. 1975, 70, 320–328. [Google Scholar] [CrossRef]
- Henseler, J.; Ringle, C.M.; Sinkovics, R.R. The use of partial least squares path modeling in international marketing. In New Challenges to International Marketing (Advances in International Marketing, Vol. 20); Sinkovics, R.R., Ghauri, P.N., Eds.; Emerald Group Publishing Limited: Bingley, UK, 2009; pp. 277–319. [Google Scholar]
- Schlaegel, C.; Sarstedt, M. Assessing the measurement invariance of the four-dimensional cultural intelligence scale across countries: A composite model approach. Eur. Manag. J. 2016, 34, 633–649. [Google Scholar] [CrossRef]
- Wetzels, M.; Odekerken-Schroeder, G.; Oppen, C.V. Using PLS path modeling for assessing hierarchical construct models: Guidelines and empirical illustration. Mis Q. 2009, 33, 177–195. [Google Scholar] [CrossRef]
- Chin, W. How to write up and report PLS analyses. In Handbook of Partial Least Squares; Springer: Berlin/Heidelberg, Germany, 2010; pp. 655–690. [Google Scholar]
- Dijkstra, T.K.; Henseler, J.R. Linear indices in nonlinear structural equation models: Best fitting proper indices and other composites. Qual. Quant. 2011, 45, 1505–1518. [Google Scholar] [CrossRef]


| Age | Men | % | Women | % | Total | % |
|---|---|---|---|---|---|---|
| <25 | 284 | 41.76% | 396 | 58.24% | 680 | 48.47% |
| 25–35 | 193 | 44.16% | 244 | 55.84% | 437 | 31.15% |
| 36–45 | 97 | 47.32% | 108 | 52.68% | 205 | 14.61% |
| 46–55 | 37 | 61.67% | 23 | 38.33% | 60 | 4.27% |
| >55 | 13 | 61.90% | 8 | 38.10% | 21 | 1.50% |
| Total | 624 | 44.48% | 779 | 55.52% | 1403 | 100% |
| Items | % >0.50 | Mean ≥3 | SD ≤1.5 | Λ > 0.70 | CR > 0.70 | AVE > 0.50 |
|---|---|---|---|---|---|---|
| SN1 My friends agree that I use the Blockchain in tourism | 52.72% | 2.64 | 1.09 | 0.847 | 0.838 | 0.635 |
| SN2 My family sees with good eyes that I use the Blockchain in tourism | 59.39% | 2.97 | 1.16 | 0.815 | ||
| SN3 My acquaintances approve that I use the Blockchain | 55.01% | 2.75 | 1.10 | 0.722 | ||
| AT1 I am in favor of e-commerce through the Blockchain | 42.22% | 2.11 | 0.84 | 0.879 | 0.899 | 0.749 |
| AT2 The use of Blockchain in tourism is positive | 44.16% | 2.21 | 0.91 | 0.975 | ||
| AT3 I am fine with the use of Blockchain sites in tourism | 43.98% | 2.20 | 0.92 | 0.842 | ||
| US1 Tourism Blockchain sites are easy to use | 44.89% | 2.24 | 0.98 | 0.800 | 0.824 | 0.609 |
| US2 Blockchain sites in tourism are accessible | 46.83% | 2.34 | 0.92 | 0.742 | ||
| US3 Blockchain sites are fast | 49.86% | 2.49 | 0.95 | 0.798 | ||
| HD1 Blockchain sites in tourism are entertaining | 51.12% | 2.56 | 1.02 | 0.874 | 0.906 | 0.763 |
| HD2 It’s fun to use Blockchain sites in tourism | 51.52% | 2.58 | 1.06 | 0.881 | ||
| HD3 It’s pleasant to use Blockchain sites in tourism | 51.58% | 2.58 | 0.99 | 0.865 | ||
| LY1 The next time I travel I will buy using Blockchain | 48.89% | 2.44 | 0.96 | 0.871 | 0.904 | 0.758 |
| LY2 I intend to buy a trip using Blockchain | 49.18% | 2.46 | 0.93 | 0.872 | ||
| LY3 I will recommend the use of the Blockchain | 50.58% | 2.53 | 1.02 | 0.870 |
| SN | AT | US | HD | LY | |
|---|---|---|---|---|---|
| SN | 0.797 | ||||
| AT | 0.494 | 0.865 | |||
| US | 0.551 | 0.640 | 0.781 | ||
| HD | 0.628 | 0.571 | 0.615 | 0.873 | |
| LY | 0.579 | 0.598 | 0.654 | 0.628 | 0.871 |
| Items | SN | AT | US | HD | LY |
|---|---|---|---|---|---|
| SN1 | 0.847 | 0.428 | 0.496 | 0.507 | 0.511 |
| SN2 | 0.815 | 0.371 | 0.436 | 0.489 | 0.460 |
| SN3 | 0.722 | 0.377 | 0.377 | 0.504 | 0.407 |
| AT1 | 0.436 | 0.879 | 0.555 | 0.492 | 0.510 |
| AT2 | 0.428 | 0.875 | 0.560 | 0.519 | 0.541 |
| AT3 | 0.418 | 0.842 | 0.547 | 0.471 | 0.500 |
| US1 | 0.501 | 0.532 | 0.800 | 0.571 | 0.658 |
| US2 | 0.365 | 0.434 | 0.742 | 0.393 | 0.395 |
| US3 | 0.402 | 0.522 | 0.798 | 0.446 | 0.431 |
| HD1 | 0.524 | 0.492 | 0.521 | 0.874 | 0.542 |
| HD2 | 0.547 | 0.458 | 0.491 | 0.881 | 0.512 |
| HD3 | 0.572 | 0.540 | 0.590 | 0.865 | 0.587 |
| LY1 | 0.505 | 0.500 | 0.570 | 0.556 | 0.871 |
| LY2 | 0.491 | 0.561 | 0.579 | 0.539 | 0.872 |
| LY3 | 0.517 | 0.501 | 0.558 | 0.548 | 0.870 |
| SN | AT | US | HD | LY | |
|---|---|---|---|---|---|
| SN | ----- | ||||
| AT | 0.642 | ----- | |||
| US | 0.771 | 0.838 | ----- | ||
| HD | 0.811 | 0.678 | 0.784 | ----- | |
| LY | 0.748 | 0.715 | 0.832 | 0.743 | ----- |
| Hip | Relat. | Paths (β) | t | p Val. | Conf. |
|---|---|---|---|---|---|
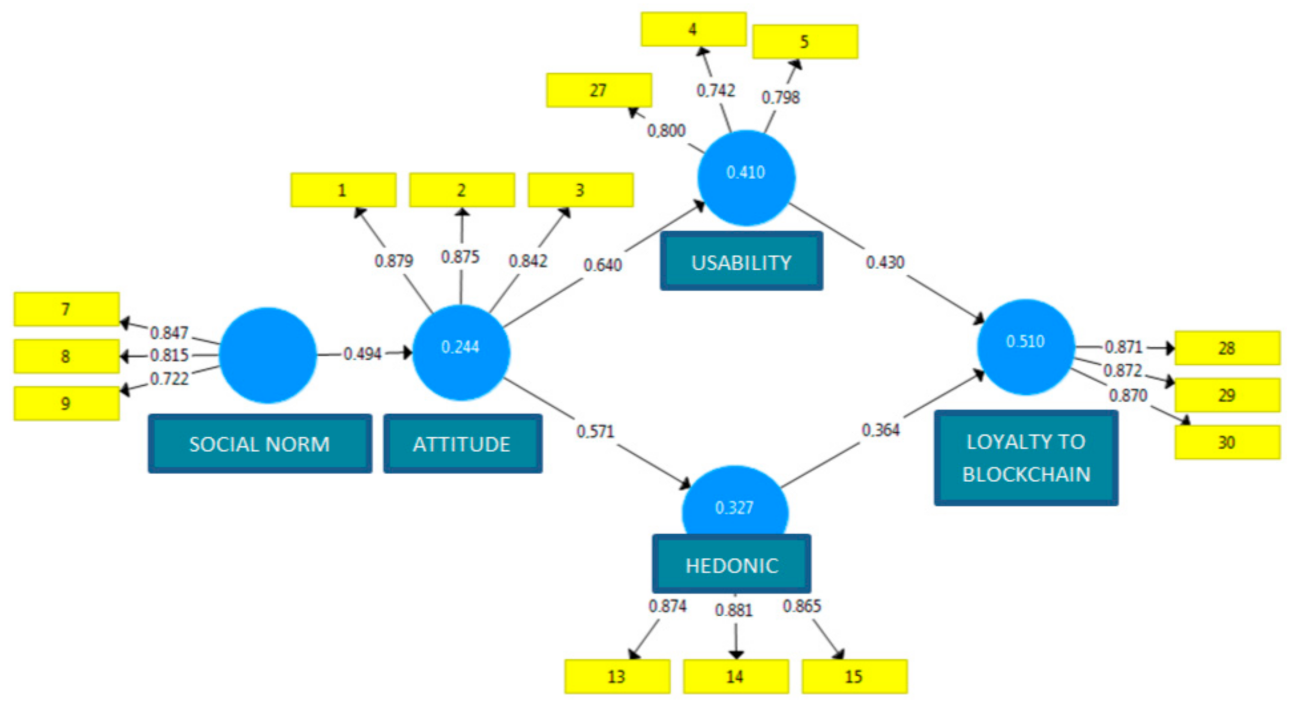
| H1 | SN→AT | 0.494 | 21.244 | 0.000 | Yes |
| H2a | AT→US | 0.640 | 33.426 | 0.000 | Yes |
| H2b | AT→HD | 0.571 | 27.488 | 0.000 | Yes |
| H3 | US→LY | 0.430 | 18.273 | 0.000 | Yes |
| H4 | HD→LY | 0.364 | 15.403 | 0.000 | Yes |
| Latent Variable | Man | ||
|---|---|---|---|
| R2 > 0.20 | Q2 > 0 | ||
| AT | 0.244 | 0.181 | |
| US | 0.410 | 0.246 | |
| HD | 0.327 | 0.245 | |
| LY | 0.510 | 0.384 | |
| GoF > 0.360 | 0.518 | ||
| Step 1 | Step 2 | Step 3 (I) | Step 3(II) | Full Measurement Invariance Established | |||||||
|---|---|---|---|---|---|---|---|---|---|---|---|
| LV | Configural Invariance | Compositional Invariance | Partial Measurement Invariance Established | Equal Mean Assessment | Equal Variance Assessment | ||||||
| C = 1 | Confid. Interval | Dif | Confid. Interval | Equal | Dif | Confi. Interval | Equal | ||||
| SN | Yes | 0.999 | [0.997, 0.999] | Yes | −0.059 | [−0.107, 0.107] | Yes | 0.232 | [−0.137, 0.128] | No | No |
| AT | Yes | 1.000 | [1.000, 1.000] | Yes | 0.075 | [−0.106, 0.107] | Yes | 0.353 | [−0.177, 0.177] | No | No |
| US | Yes | 0.999 | [0.998, 0.999] | Yes | 0.015 | [−0.100, 0.101] | Yes | 0.348 | [−0.152, 0.147] | No | No |
| HD | Yes | 1.000 | [1.000, 1.000] | Yes | −0.029 | [−0.096, 0.104] | Yes | 0.110 | [−0.135, 0.131] | Yes | Yes |
| LY | Yes | 1.000 | [1.000, 1.000] | Yes | −0.031 | [−0.105, 0.098] | Yes | 0.161 | [−0.154, 0.146] | Yes | Yes |
| Hyp. | Relationship | PathPathdif. | p-Value Difference | Supported | |||
|---|---|---|---|---|---|---|---|
| Men | Women | Henseler’s MGA | Permutation Test | ||||
| H1 | SN→AT | 0.536 | 0.455 | 0.081 | 0.078 | 0.066 | No/No |
| H2a | AT→US | 0.676 | 0.601 | 0.075 | 0.061 | 0.066 | No/No |
| H2b | AT→HD | 0.632 | 0.515 | 0.118 | 0.007 | 0.002 | Yes/Yes |
| H3 | US→LY | 0.431 | 0.425 | 0.006 | 0.912 | 0.904 | No/No |
| H4 | HD→LY | 0.388 | 0.346 | 0.042 | 0.404 | 0.386 | No/No |
| Hyp. | Relationship | <25 | 25–45 | >45 |
|---|---|---|---|---|
| H1 | SN→AT | 0.685 | 0.482 | 0.161 |
| H2a | AT→US | 0.626 | 0.422 | 0.125 |
| H2b | AT→HD | 0.632 | 0.392 | 0.224 |
| H3 | US→LY | 0.658 | 0.449 | 0.126 |
| H4 | HD→ LY | 0.526 | 0.498 | 0.210 |
Publisher’s Note: MDPI stays neutral with regard to jurisdictional claims in published maps and institutional affiliations. |
© 2021 by the authors. Licensee MDPI, Basel, Switzerland. This article is an open access article distributed under the terms and conditions of the Creative Commons Attribution (CC BY) license (http://creativecommons.org/licenses/by/4.0/).
Share and Cite
Pérez-Sánchez, M.d.l.Á.; Tian, Z.; Barrientos-Báez, A.; Gómez-Galán, J.; Li, H. Blockchain Technology for Winning Consumer Loyalty: Social Norm Analysis Using Structural Equation Modeling. Mathematics 2021, 9, 532. https://0-doi-org.brum.beds.ac.uk/10.3390/math9050532
Pérez-Sánchez MdlÁ, Tian Z, Barrientos-Báez A, Gómez-Galán J, Li H. Blockchain Technology for Winning Consumer Loyalty: Social Norm Analysis Using Structural Equation Modeling. Mathematics. 2021; 9(5):532. https://0-doi-org.brum.beds.ac.uk/10.3390/math9050532
Chicago/Turabian StylePérez-Sánchez, María de los Ángeles, Zhuowei Tian, Almudena Barrientos-Báez, José Gómez-Galán, and Hanliang Li. 2021. "Blockchain Technology for Winning Consumer Loyalty: Social Norm Analysis Using Structural Equation Modeling" Mathematics 9, no. 5: 532. https://0-doi-org.brum.beds.ac.uk/10.3390/math9050532