
Emotion Recognition and Regulation Based on Stacked Sparse Auto-Encoder Network and Personalized Reconfigurable Music

Key Laboratory for Optoelectronic Technology and System of the Education Ministry of China, College of Optoelectronic Engineering, Chongqing University, Chongqing 400044, China
*
Author to whom correspondence should be addressed.
Mathematics 2021, 9(6), 593; https://0-doi-org.brum.beds.ac.uk/10.3390/math9060593
Submission received: 22 December 2020
/
Revised: 5 March 2021
/
Accepted: 5 March 2021
/
Published: 10 March 2021
(This article belongs to the Special Issue Computational Approaches for Data Inspection in Biomedicine)
Abstract
:Music can regulate and improve the emotions of the brain. Traditional emotional regulation approaches often adopt complete music. As is well-known, complete music may vary in pitch, volume, and other ups and downs. An individual’s emotions may also adopt multiple states, and music preference varies from person to person. Therefore, traditional music regulation methods have problems, such as long duration, variable emotional states, and poor adaptability. In view of these problems, we use different music processing methods and stacked sparse auto-encoder neural networks to identify and regulate the emotional state of the brain in this paper. We construct a multi-channel EEG sensor network, divide brainwave signals and the corresponding music separately, and build a personalized reconfigurable music-EEG library. The 17 features in the EEG signal are extracted as joint features, and the stacked sparse auto-encoder neural network is used to classify the emotions, in order to establish a music emotion evaluation index. According to the goal of emotional regulation, music fragments are selected from the personalized reconfigurable music-EEG library, then reconstructed and combined for emotional adjustment. The results show that, compared with complete music, the reconfigurable combined music was less time-consuming for emotional regulation (76.29% less), and the number of irrelevant emotional states was reduced by 69.92%. In terms of adaptability to different participants, the reconfigurable music improved the recognition rate of emotional states by 31.32%.
1. Introduction
The role and influence of emotion on cognition has become an important research field. It has been found that emotion affects the perception, judgment, reasoning, creativity, and other cognitive processes of individuals [1,2,3]; as such, it is an urgent task to induce and regulate emotions. Traditional methods of emotional induction and regulation often use pictures or music as stimulus materials, for which a universal picture or music library is often used [4,5]. However, due to the diversity of individuals, there are inevitable differences in emotional changes in response to the same material, which makes it impossible to adapt to each individual. Music has ups and downs in pitch and loudness, and can induce multiple emotional states. Compared with pictures, music has the advantage of being segmented. However, due to the diversity of individuals, there are inevitable differences in emotional changes with respect to the same material, which makes it impossible to adapt to each individual. Therefore, new technical methods are needed, in terms of emotion-inducing materials.
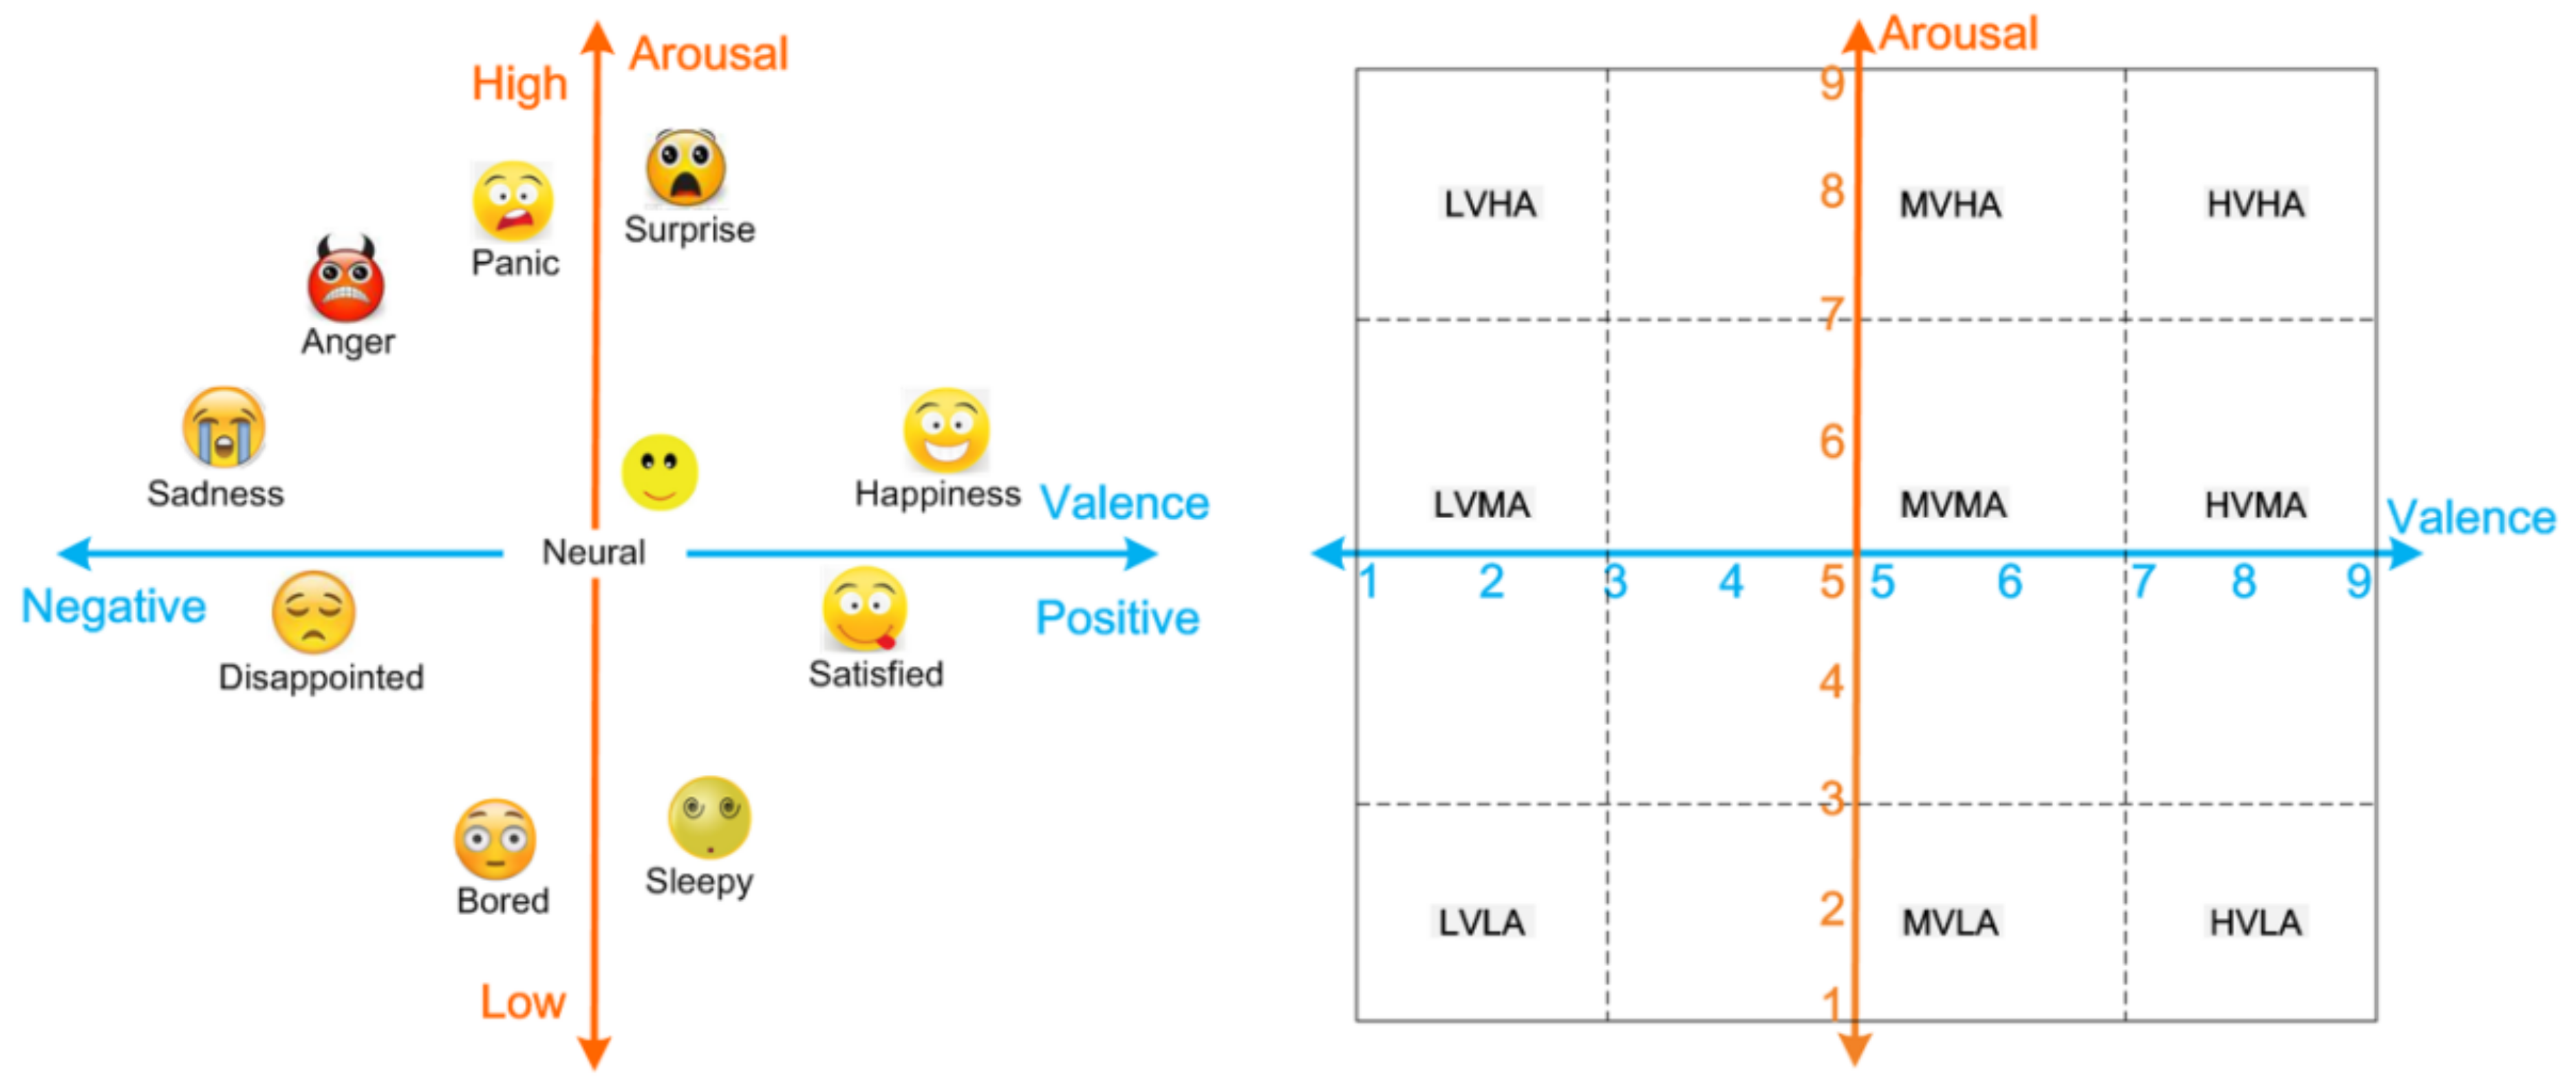
At present, there is no uniform definition for a quantitative description of emotions. According to the research results of psychologists Plutchik and Russell et al., two models are mainly used for the description and classification of emotions: the discrete model and the dimensional model [6,7,8]. Among them, the most widely used is the valence arousal two-dimensional space model [9]. Valence measures the polarity of emotions, increasing as they move from negative to positive emotions. Arousal measures how aroused an emotion is: as alertness goes from low to high, arousal increases. Both are calibrated by the 2-D SAM (Self-Assessment Manikins) scale [10,11]. The valence arousal model is sufficient to describe most emotions and has been widely used in the existing research.
There have been many studies on the effects of music-induced emotions, as assessed by EEG. Hamada et al. made a very comprehensive description of the research status of music on emotion. The study of the influence of music on emotions has increasingly become an important research direction, as well as providing new research directions for future emotion research [12]. Aimed at the influence of music-induced mood, Tseng et al. studied the relationship between music-induced emotion and electroencephalography in the prefrontal lobe. Different musical stimuli can induce distinguishable electrical activity in the brain [13]. In view of the feasibility of using the forehead for emotion recognition, an emotion recognition system had been established, in which the music-induced emotions were classified using a three-channel prefrontal EEG; the associated recognition rate was above 80% [14,15]. Cai et al. used a three-electrode EEG system in the frontal lobe to recognize depression under sound stimulation [16]. Therefore, it is feasible to use the forehead channels to induce and recognize emotion.
There have been many studies on emotional recognition based on EEG signals [17]. Chanel et al. extracted the power spectral density of EEG and the energy spectrum characteristics of each band. The classification of three types of emotion was realized by using simple Bayesian, support vector machine, and other classifiers; the associated recognition rate was 56–63% [18]. Murugappan et al. combined power spectrum and wavelet features, and used the K-nearest neighbor classifier to achieve an 83.04% emotion classification recognition rate [19]. Soleymani and Koelstra et al. constructed a multi-modal emotion database, DEAP, and realized the identification of four types of dimensional emotion tags for an emotional dimension model [20,21]. In general, current research tends to use traditional classifiers, such as naive bayes (NB), k-nearest neighbors (KNN), and support vector machine (SVM) classifiers [9,22]. These three classification methods are typical supervised learning methods, which require a large number of tagged training samples. Common unsupervised EEG emotion recognition methods include clustering algorithms, deep belief networks (DBNs), and so on. Murugappan et al. successfully realized the classification of happiness, disgust, surprise, and fear by adopting Fuzzy C-means [23]. Georgieva et al. extracted a complete feature set from ERP and verified the feasibility of the six standard unsupervised clustering algorithms in distinguishing emotional valence [24]. Wei-Long et al. established three emotion recognition models based on EEG; compared with SVM, LR, and KNN, deep belief networks (DBNS) had higher accuracy [25]. In the emotional recognition of this paper, some samples contained class labels, while other large numbers of divided samples have no class labels. Therefore, new technical methods are urgently needed, in terms of emotional recognition.
According to the existing literature, the average duration of music is 57.1 s, with some lasting up to 30 min [12,26]. During music playback, human emotion perception will also change accordingly, with inter-individual differences [27]. Recent studies have used music as the inducing material, which has problems, such as long time duration, variable emotional states, and poor adaptability. In view of the above problems, using the cutability characteristic of music, we propose an adaptive adjustment model for music segments which are reconfigurable to emotional states. First, the EEG signals of the tested individual are measured by a multi-channel EEG sensor network, and the EEG signals and the complete music are separately segmented to establish a personalized reconfigurable music-EEG library for the tested individual. Then, according to the emotional state recognition model and emotion regulation goal, music segments are selected from the personalized reconfigurable music-EEG library for reconstruction and combination. Finally, the reconstructed combined music is played, thereby adaptively adjusting the emotional state of each individual.
In addition, biomedical EEG data are processed for each participant and a mathematical calculation method for emotional evaluation is established. The calculation method expresses abstract emotional EEG data as specific emotional indicators, through mathematical formulas. Compared with the existing subjective emotional evaluation, it is more objective and novel, while greatly reducing the difficulty of data processing. Therefore, the computational approaches in this article also provide significant reference for the application of mathematics in the biomedical data processing of EEG.
The rest of this article is summarized as follows: Section 2 introduces the experimental method the classification algorithm and the corresponding mathematical analysis method. Section 3 introduces the main results and evaluation. Section 4 analyzes and compares the experimental results. Section 5 summarizes the contributions of this study and its future application prospects.
2. Materials and Methods
2.1. Participants and Stimuli
In the preliminary study, our group recruited 21 college students (11 males and 10 females), who were right-handed, and aged 23–31 (Mean 25.24 ± SD 2.45). Each subject participated in the experiment four times, for about 30 min each time. Before the start of the experiment, all subjects completed and signed a questionnaire and an informed consent form. All participants were shown to have no mental disorders, no history of substance abuse, and no musical training.
A questionnaire survey is a commonly used method to evaluate emotions. It evaluates the whole music, providing a kind of rough, subjective evaluation. In the first stage of the experiment, music was selected subjectively from a given music library. In the second stage, according to each individual’s emotion regulation goal, the reconfigurable music segments were used to conduct personalized regulation of each individual’s emotion. The whole music process involved more refined segmentation and precise matching. The process was automatically matched, without human intervention. Thus, it made up for the deficiencies of the questionnaire survey.
The test music used was Chinese and foreign music. The music material came from the open web. The sound quality of all sound stimulation materials was 44,100 Hz, the sound duration was 3–5 min, and the first 3 min were uniformly intercepted using the Cool Edit Pro software version 2.1. The excess was discarded, and all of the music was instrumental. Volunteers assessed the above-mentioned music, according to the self-evaluation questionnaire of emotional experience, and scored the degrees of pleasure and excitement. The degrees of pleasure and excitement were used as the X and Y axes, and were averaged into four quadrants. Then, from the four quadrants, 15 songs were selected from each, such that a total of 60 songs were used as the public music library. The sound was played using the BOSE QC25 model wired active noise canceling headphones, and participants wore blackout goggles. In the experiment, participants kept their eyes closed during the listening and reduced their eye movements.
Referring to the international 10–20 system, we measured the EEG at forehead positions such as Fp1 and Fp2. In addition, electrodes were selected to be placed on both sides of the left and right eyes, outward by 10%, to synchronously measure the electro-oculogram (marked as E1 and E2), in order to effectively filter the ophthalmological artifacts in the following. The reference electrode and the offset electrode were respectively placed at the pre-auricular points, in front of the left and right ears (marked A1 and A2). The wearable EEG measurement node (with TGAM module sampling rate of 512 Hz) was formed of the TGAM chipset of NeuroSky and a dry electrode.
2.2. Emotional Calibration
With individuals being measured on the basis of the 2-D SAM scale and complete 1–9 Valence and Arousal score evaluation, we set up 3 and 7, respectively, to the Valence and Arousal axes, each divided into three blocks (High valence (HV), middle valence (MV), and low valence (LV), and high arousal (HA), middle arousal (MA), low arousal (LA)), as shown in Figure 1. This method of classifying emotional labels (i.e., according to the threshold value) has been used many times in the existing literature [21,28]. It cannot be affected by the established emotional model, by specifically quantifying each emotional type, and compared with other studies [28], the granularity of the emotional labels classified in this paper was more detailed, which can realize more specific identification of emotion types.
A large number of EEG studies have shown that the right frontal area of the brain is strongly associated with negative emotions, while the left frontal area is highly associated with positive emotions, showing significant differences [29,30,31]; there are also significant differences between the left and right brains [32]. Therefore, in order to quantitatively evaluate the emotional state induced by music, the following formula was established to evaluate it:
where and represent the power of alpha and beta waves respectively, and and represent the positions of the left and right electrodes on the forehead, respectively; that is, represents the beta wave power of the left forehead electrode point, and others in the same way. Arousal and Valence, respectively, represent the corresponding scores of the emotional dimension.
2.3. Experiment Procedure
Each participant chose 18 from the 60 pieces of music provided in the library (the music library was established by the self-evaluation scale of emotional experience). The process of selecting music was not entirely selected by the participants randomly, but had a certain degree of guidance (i.e., the music is selected according to like, average, and dislike), in order to avoid the randomness of the emotional state. This also ensured that the reconfigurable music-EEG library established covered enough emotional states, thus improving the training efficiency of the emotional recognition model.
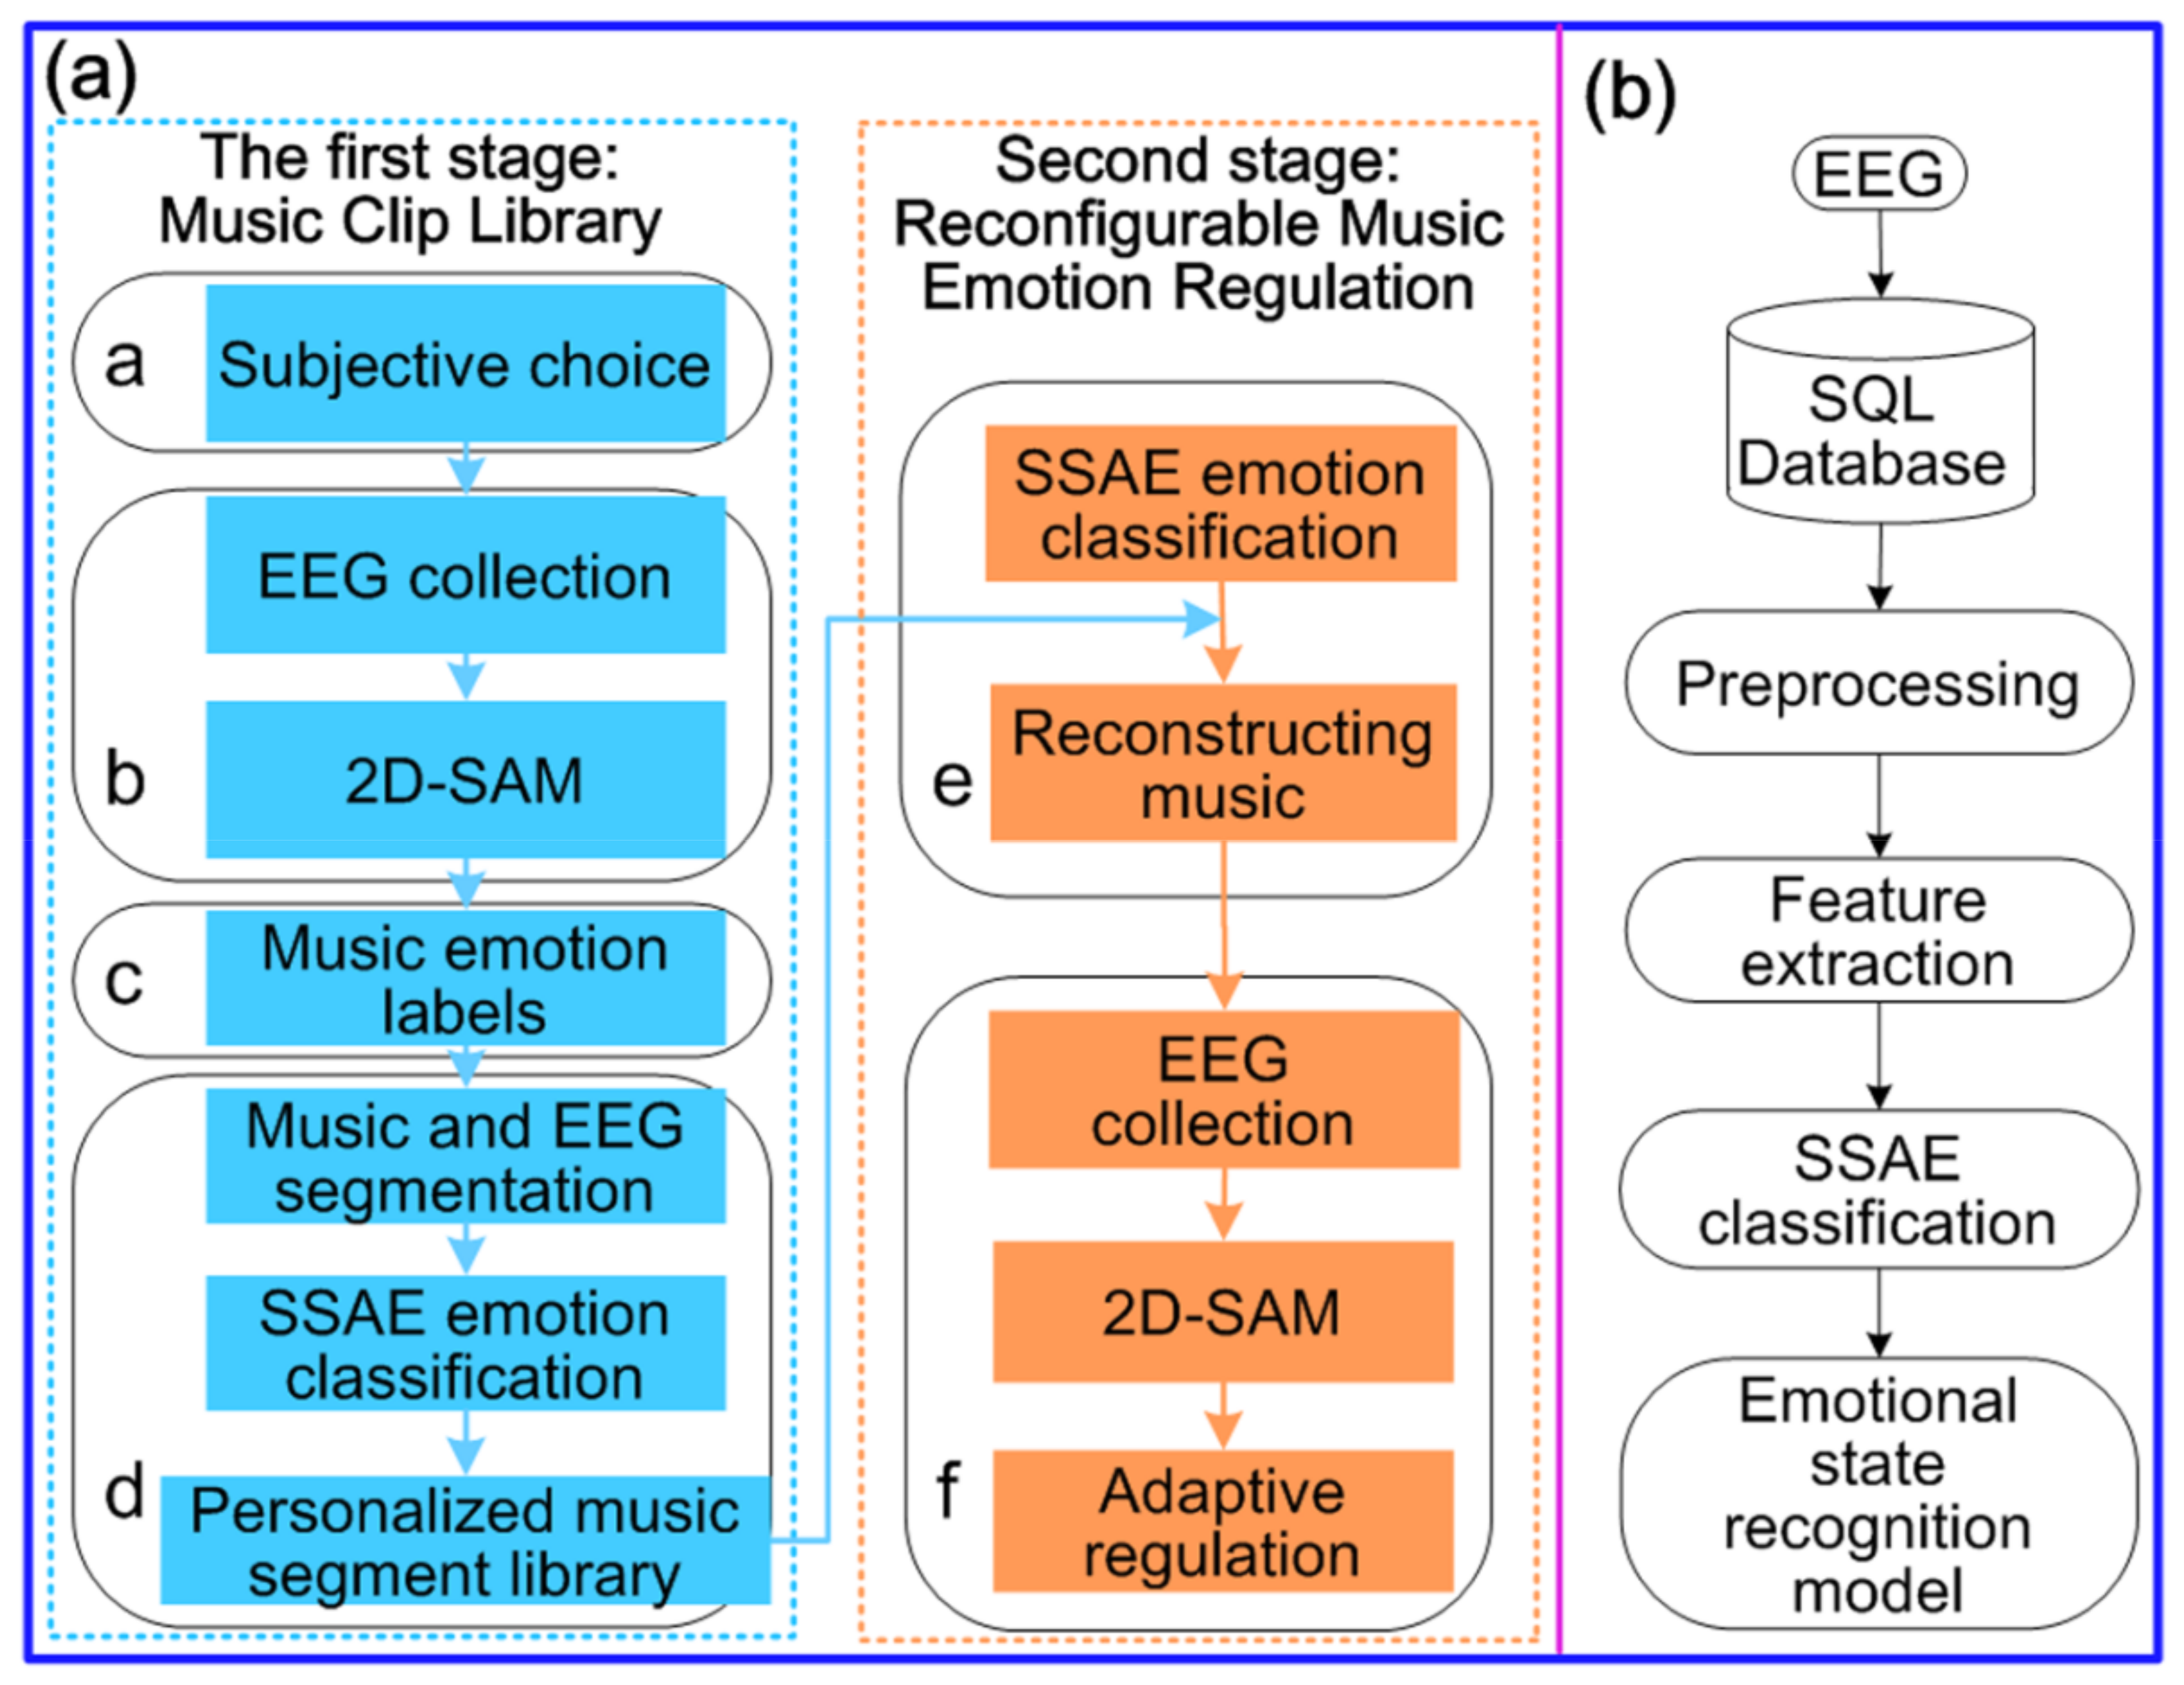
As shown in Figure 2a, the experiment in this paper had two stages: the first stage established a personalized reconfigurable music-EEG library, while the second stage realized the adaptive adjustment of reconfigurable music to emotions, based on stacked sparse auto-encoder (SSAE). Each participant selected 6 songs each, according to their like, average, and dislike sentiments, such that a total of 18 pieces of music were selected. Experiments were conducted successively, and the corresponding EEG was collected. The EEG and music obtained in the experiment were segmented with 5 s as the step size. Then, emotion classification was conducted for the segmented EEG, according to the emotion recognition model in Figure 2b, in order to obtain a personalized music fragment library corresponding to each participant. According to the different goals of emotional regulation, from the corresponding personalized music segment libraries of participants, different music segments were selected for reconstruction and combination, in order to obtain reconfigurable music, which was used for emotional regulation.
2.4. Data Analysis
In the experiment, participants performed a self-assessment of their current emotional state, according to 2D-SAM, to determine emotional labels. The experiment was divided into two stages. The first stage had a sample size of 378 and the second stage had a sample size of 567, for a total of 945. The upper computer wrote the collected original EEG signal into the SQL server database, to address the problem that the associated large amount of data was not easy to store.
The MATLAB® (R2020a) software was used to perform subsequent processing on the original data in this paper. The EEGLAB toolbox was used to perform FIR band-pass filtering (1–50 Hz) for all trials and to perform baseline correction for some trials with baseline drift. After artificially judging the presence of electrooculogram artifacts, combined with the EOG signals of the E1 and E2 electrodes, the correlation coefficients between the individual components extracted by ICA and the EOG signals were calculated. The independent components were identified, which corresponded to those with correlation coefficient greater than 0.7, and EOG artifact independent components. Finally, the EOG artifact independent components were set to zero, in order to reconstruct a clean EEG signal and realize the removal of ocular artifacts. Among them, the ocular artifact rejection criteria were: The vertical EOG is a sharp pulse and the horizontal EOG is a horizontal square wave; the time-domain waveform is spike-like; and the energy is concentrated in the low frequency (<5 Hz) in the power spectrum. Those meeting the above characteristics were judged to have electrooculogram artifacts.
The pre-processed EEG signal was transformed into a wavelet packet and the db20 packet basis function was used to extract the EEG delta wave (<4 Hz), theta wave (4 Hz–8 Hz), low alpha wave (8 Hz–10 Hz), high alpha wave (10 Hz–13 Hz), low beta wave (13 Hz–20 Hz), and high beta wave (20 Hz–30 Hz) signals. This kind of frequency division has appeared many times in the literature [33]. The power spectrum distribution, the frequency value corresponding to the peak point of the power spectrum, approximate entropy, Hurst index, wavelet entropy characteristics, and sample entropy were calculated. In addition, together with the power spectrum ratio of alpha and beta waves, a total of 17 features, as shown in Table 1, were used as joint features.
In order to more intuitively reflect the power variation trend induced by music, the power of the first 20 s in the rest state before the start of the experiment was taken as the reference base average power, . The following formula is established:
According to the feature vectors extracted from EEG, the similarity between feature vectors () and () for any two samples is defined:
Under the same label, the similarity between feature vectors of different samples is called self-similarity. Under different labels, the similarity between feature vectors of different samples is called cross-similarity. The difference between self-similarity and cross-similarity is called diff-similarity. Among them, the higher the self-similarity between similar labels and the greater the similarity difference, the better the sample separability.
2.5. Stacked Sparse Auto-Encoder (SSAE)
At present, Naive Bayes, KNN, and SVM are the widely used classifiers [34,35,36]. These three classification methods are typical supervised learning methods; that is, they require a large number of labeled training samples. In this paper, some samples contained class labels, while others did not. The stacked auto-encoder neural network classification algorithm is suitable for this kind of situation, which can carry out pre-learning on the characteristics of the unlabeled samples, then carry out deep learning correction through the labeled samples. Other unlabeled samples can also be used for the pre-learning of eigenvectors.
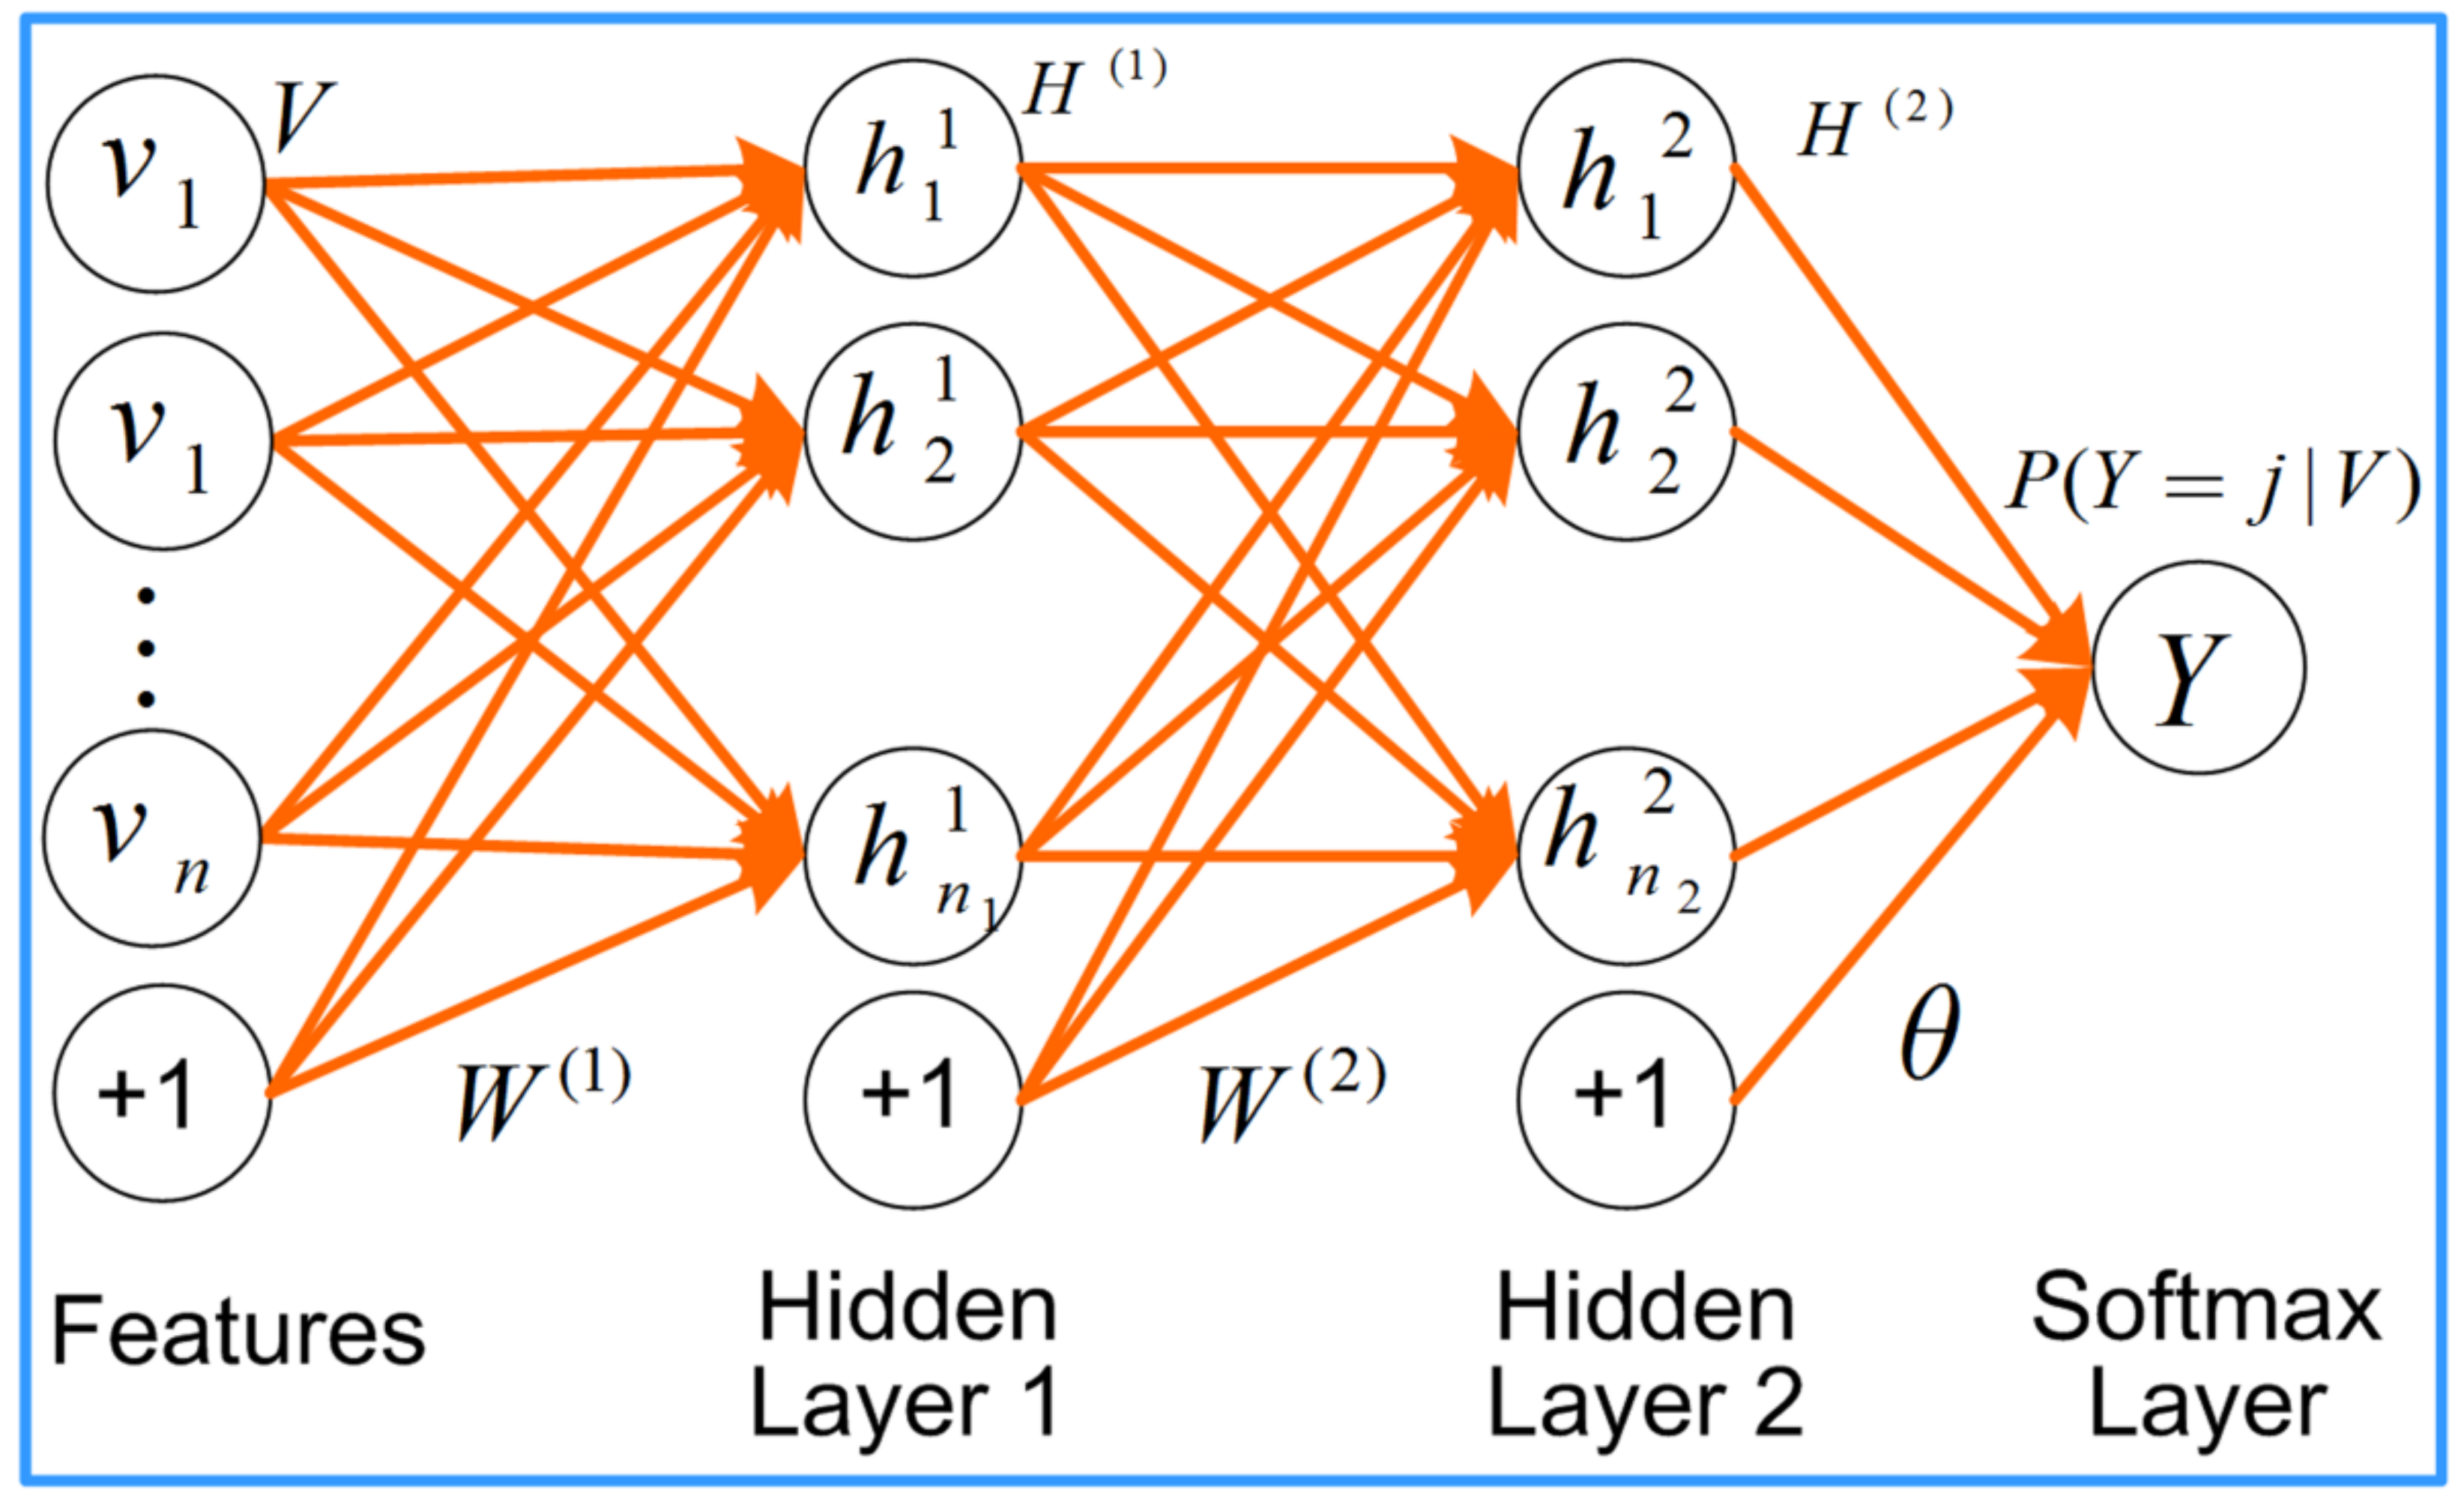
In this paper, a stacked sparse auto-encoder (SSAE) neural network is used, as shown in Figure 3. The training methods were as follows. Let the sparse auto-encoder input be , the weight matrix be , and correspond to bias parameters. The Sigmoid function was selected as the activation function. Then, self-encoder encoding and decoding can be expressed as follows:
We continuously adjust the parameter weight matrix to minimize the original input and reconstruction error, where the loss function is
Sparse auto-encoders add a sparsity limitation to the hidden layer neurons, such that their features are represented sparsely, which is more conducive to data classification. Assuming that is the activation degree of the hidden layer neuron , given input vector , the average activation value of is
In order to satisfy the sparsity condition, the average activation value of all hidden layer units is required to be close to 0.
The sparsity parameter is introduced, where the target value of is usually close to 0. To make , the KL divergence is used to measure the distance between them [37], which has the formula:
where, is the number of hidden layer units.
The loss function can be expressed as follows:
After adding the sparsity condition, the final loss function is
By using the gradient descent method, the values can be obtained, through iteration, by minimizing :
where is the learning rate. The sparse auto-encoder was pre-trained according to the above process.
The extracted joint features were used as input to the SSAE, and the hidden layer was pre-trained. After the unsupervised self-learning of features, the tagged data and Softmax classifier were used to realize classification, where the weights of each layer were modified.
Suppose there are training samples and the number of class tags is . Softmax classification can be achieved by minimizing the cost function . In the actual operation, a weight attenuation term needs to be added, in order to transform the cost function into a strictly convex function:
where is an indicator function. When the expression is true, the value is 1; otherwise, it is 0.
For the Softmax classifier, the probability of classifying the joint feature to be classified as is
Using a back-propagation algorithm for fine-tuning can greatly improve the performance of stacked auto-encoder neural networks. From the Softmax output layer to the hidden layer, the partial derivative of the cost function is obtained layer by layer, the adjustment vector is calculated, and the fine adjustment of the weight matrix is iteratively obtained:
where is the conditional probability vector, is the class label corresponding to the input data, and the fine-tuning amount of each hidden layer is calculated layer by layer:
In summary, the extracted joint feature vector was input into the double hidden layer stack neural network after training. The output was the class label, in order to realize the classification and recognition of emotional state. This method was selected for the following two reasons:
- ①
- We divided music and EEG, such that the emotional sample data contained a large amount of unlabeled data. This classification algorithm can make full use of the existing sample data for pre-learning training;
- ②
- There is random uncertainty inherent to the extraction of EEG feature quantities and the feature quantities differed, such that there is no unified consensus, at present. A stack auto-encoder can fully explore the feature structure used for classification and improve the effect of emotion classification through the hierarchical learning of data features.
3. Results
3.1. EEG Data
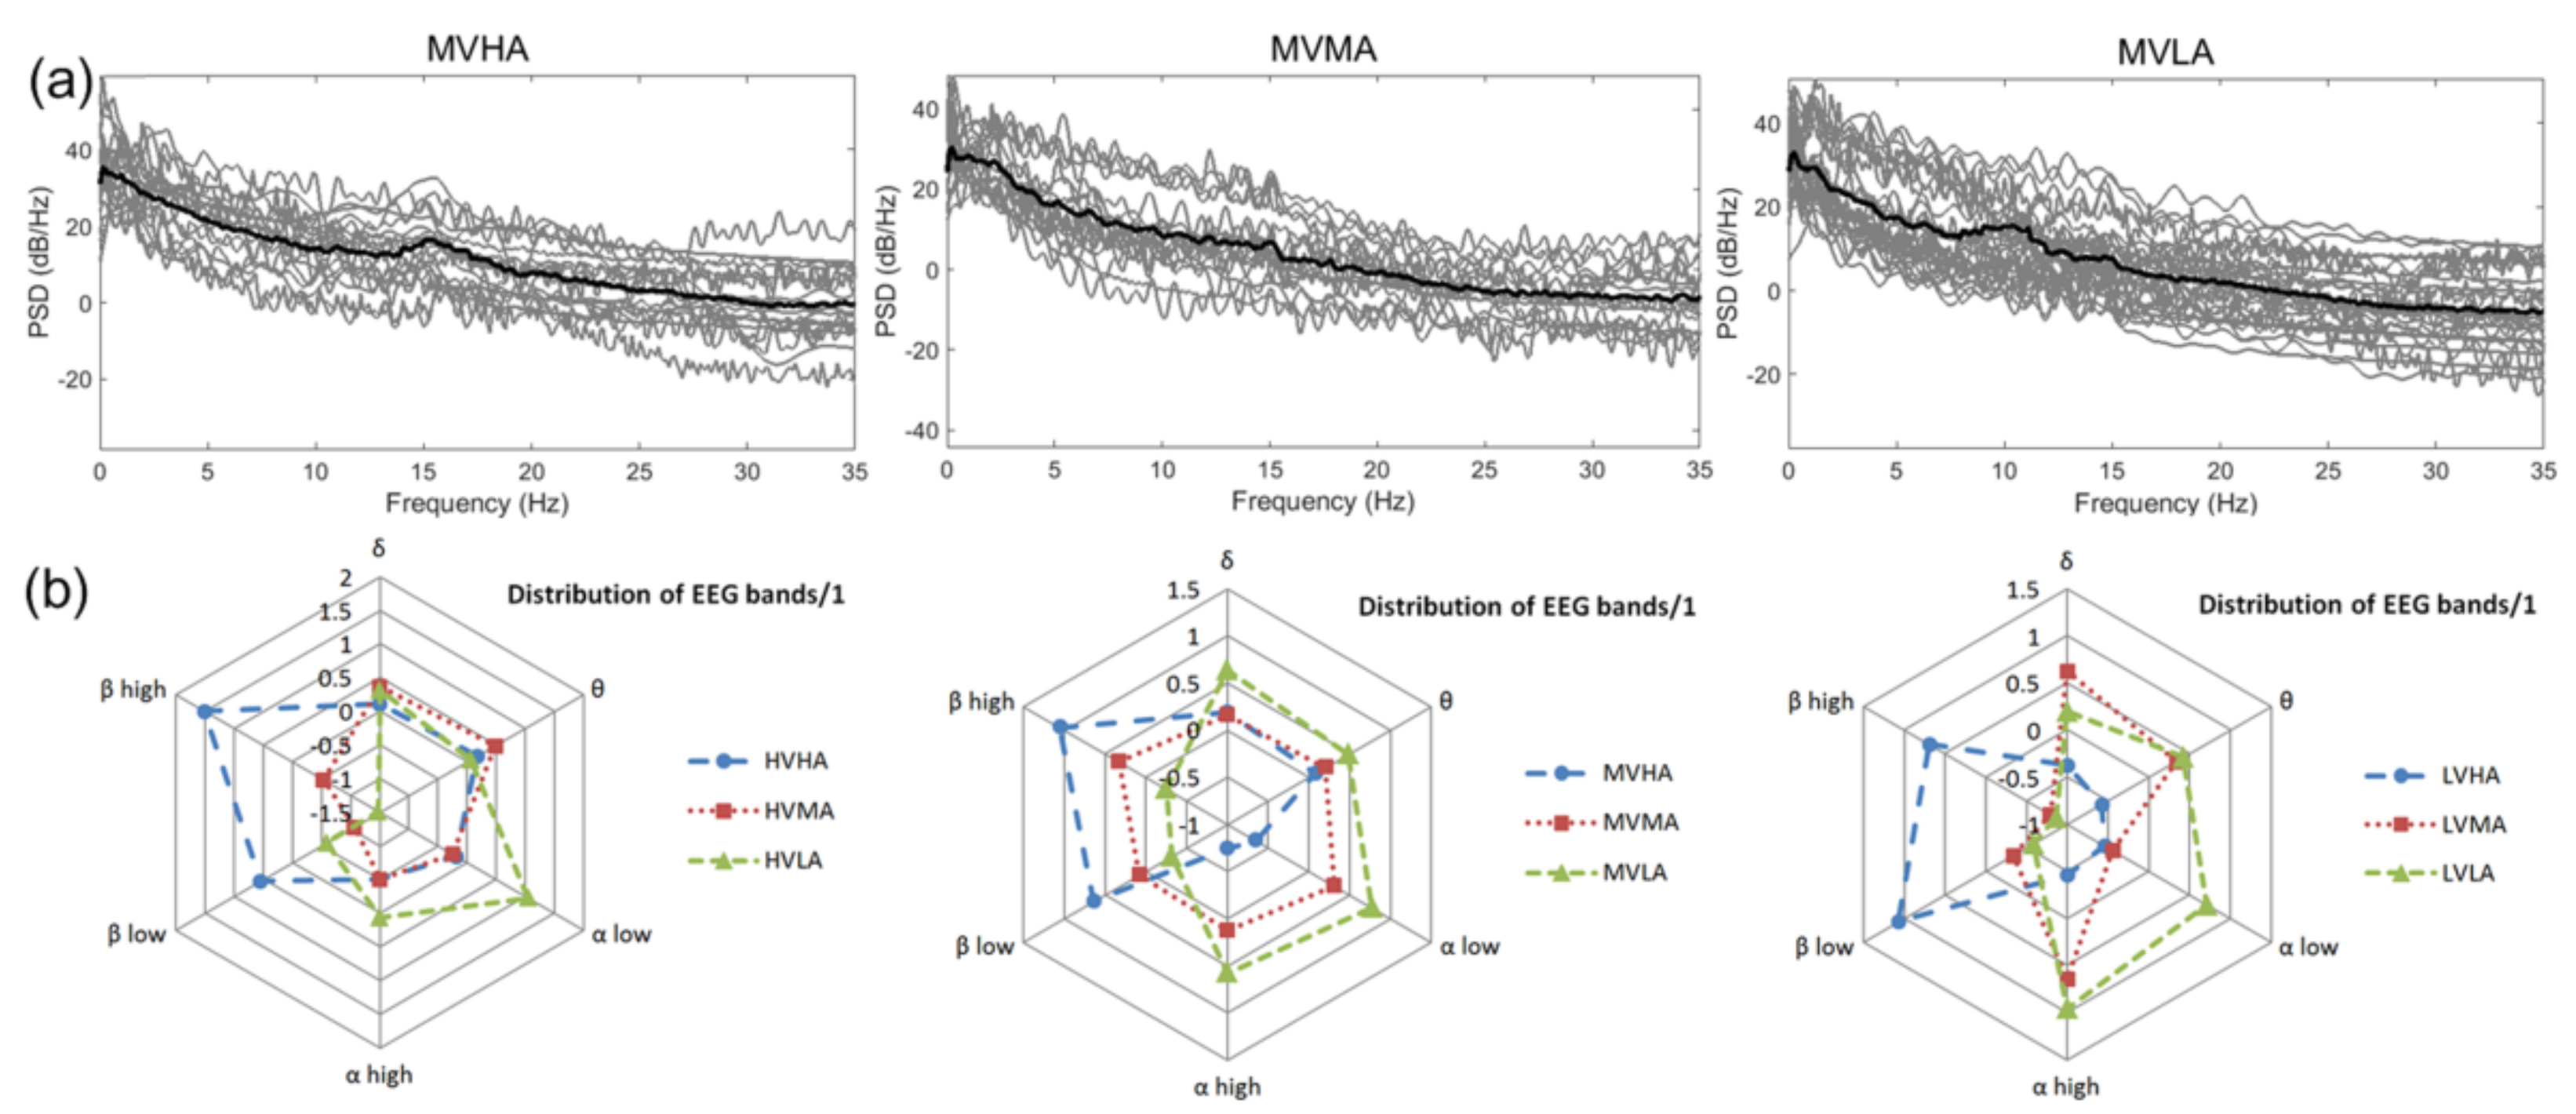
It has been widely accepted that alpha waves are associated with relaxation or brain inactivation. Beta waves are related to the alert or excitatory state of the brain, and are highly correlated with the longitudinal axis of the emotion that is, arousal [38,39], and are also evident in the power spectral density map, as shown in Figure 4a. As arousal decreases, the beta wave power decreases and alpha wave power increases. The emotional horizontal axis—that is, valence—is not found in the power spectral density distribution map. Before the start of the second phase of the experiment, the collected first 20 s were taken as the reference average power Pbase, where the average power P of each band of EEG obtained by the combination of reconfigurable music segments was converted, according to Equation (3), in order to obtain the before and after change trend diagram of each band, as shown in Figure 4b. A radar chart was adopted to visually express the variation of the average power of each band of EEG under different emotional states. As can be seen from Figure 4b, alpha wave power will increase relative to reference power with the emotional state of low arousal LA, alpha wave power will decrease relative to reference power with an increase in arousal, and beta wave power will increase relative to reference power.
3.2. Reconstruction and Combination of Music Segments
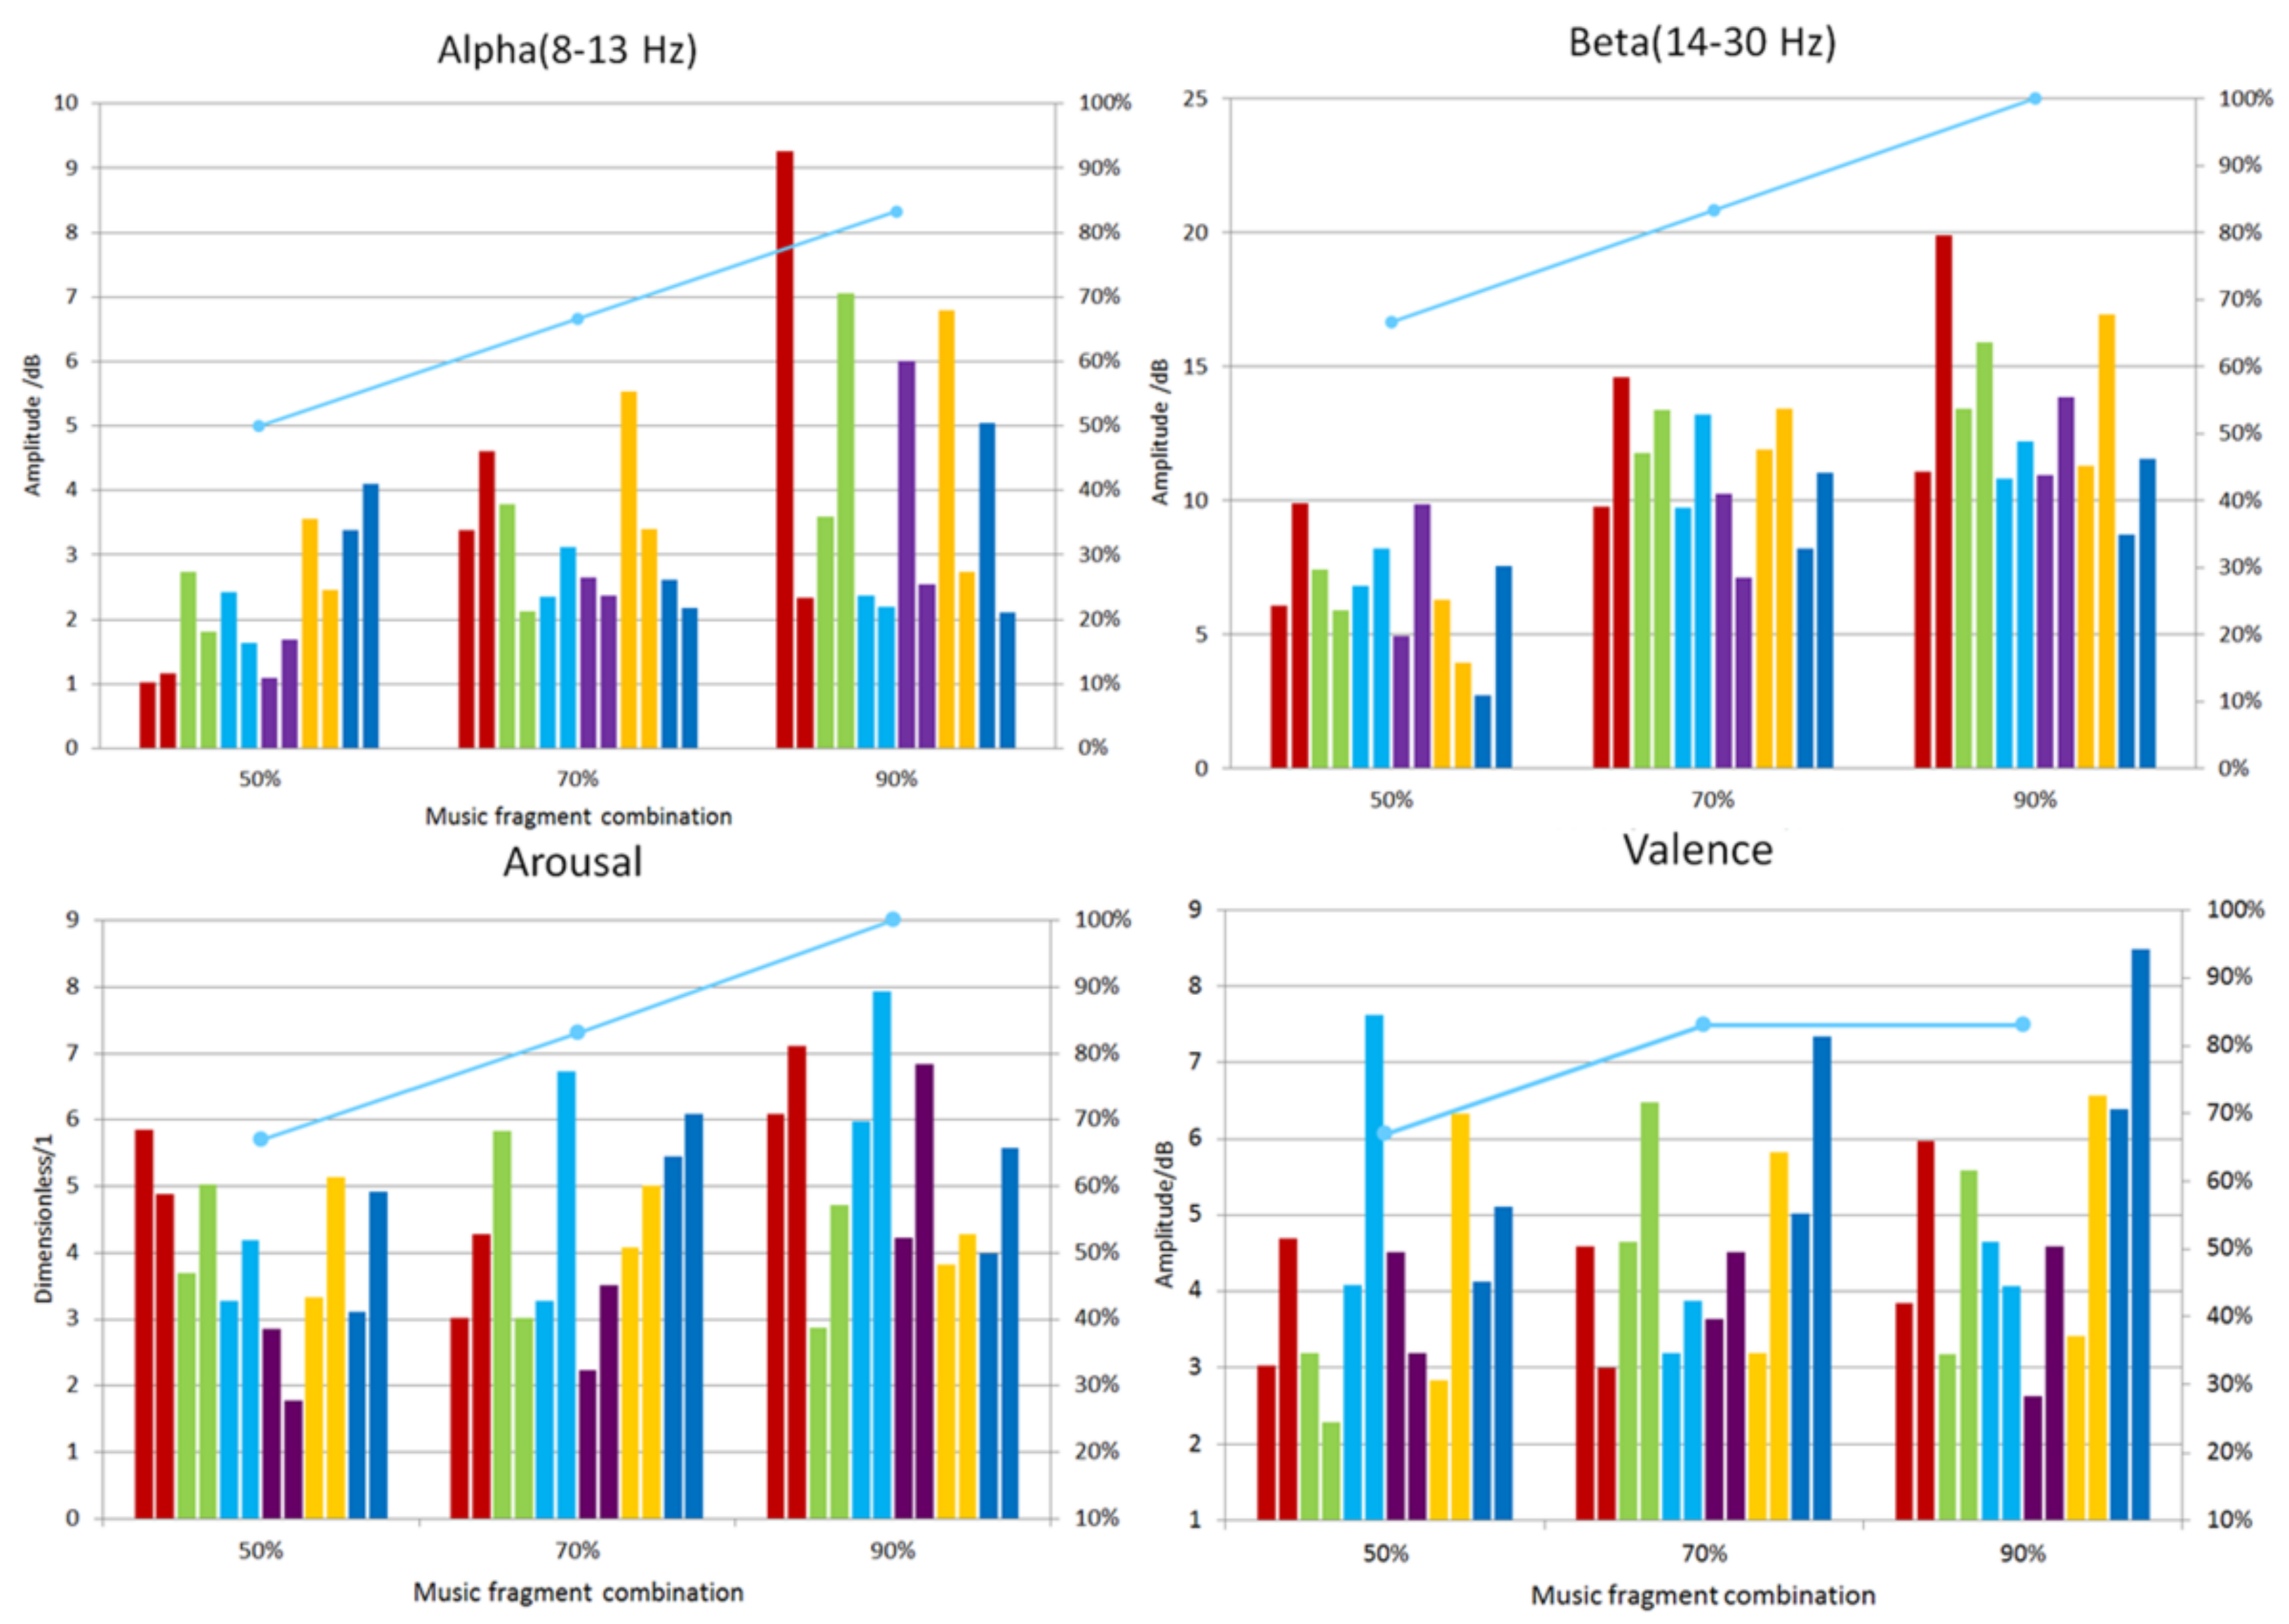
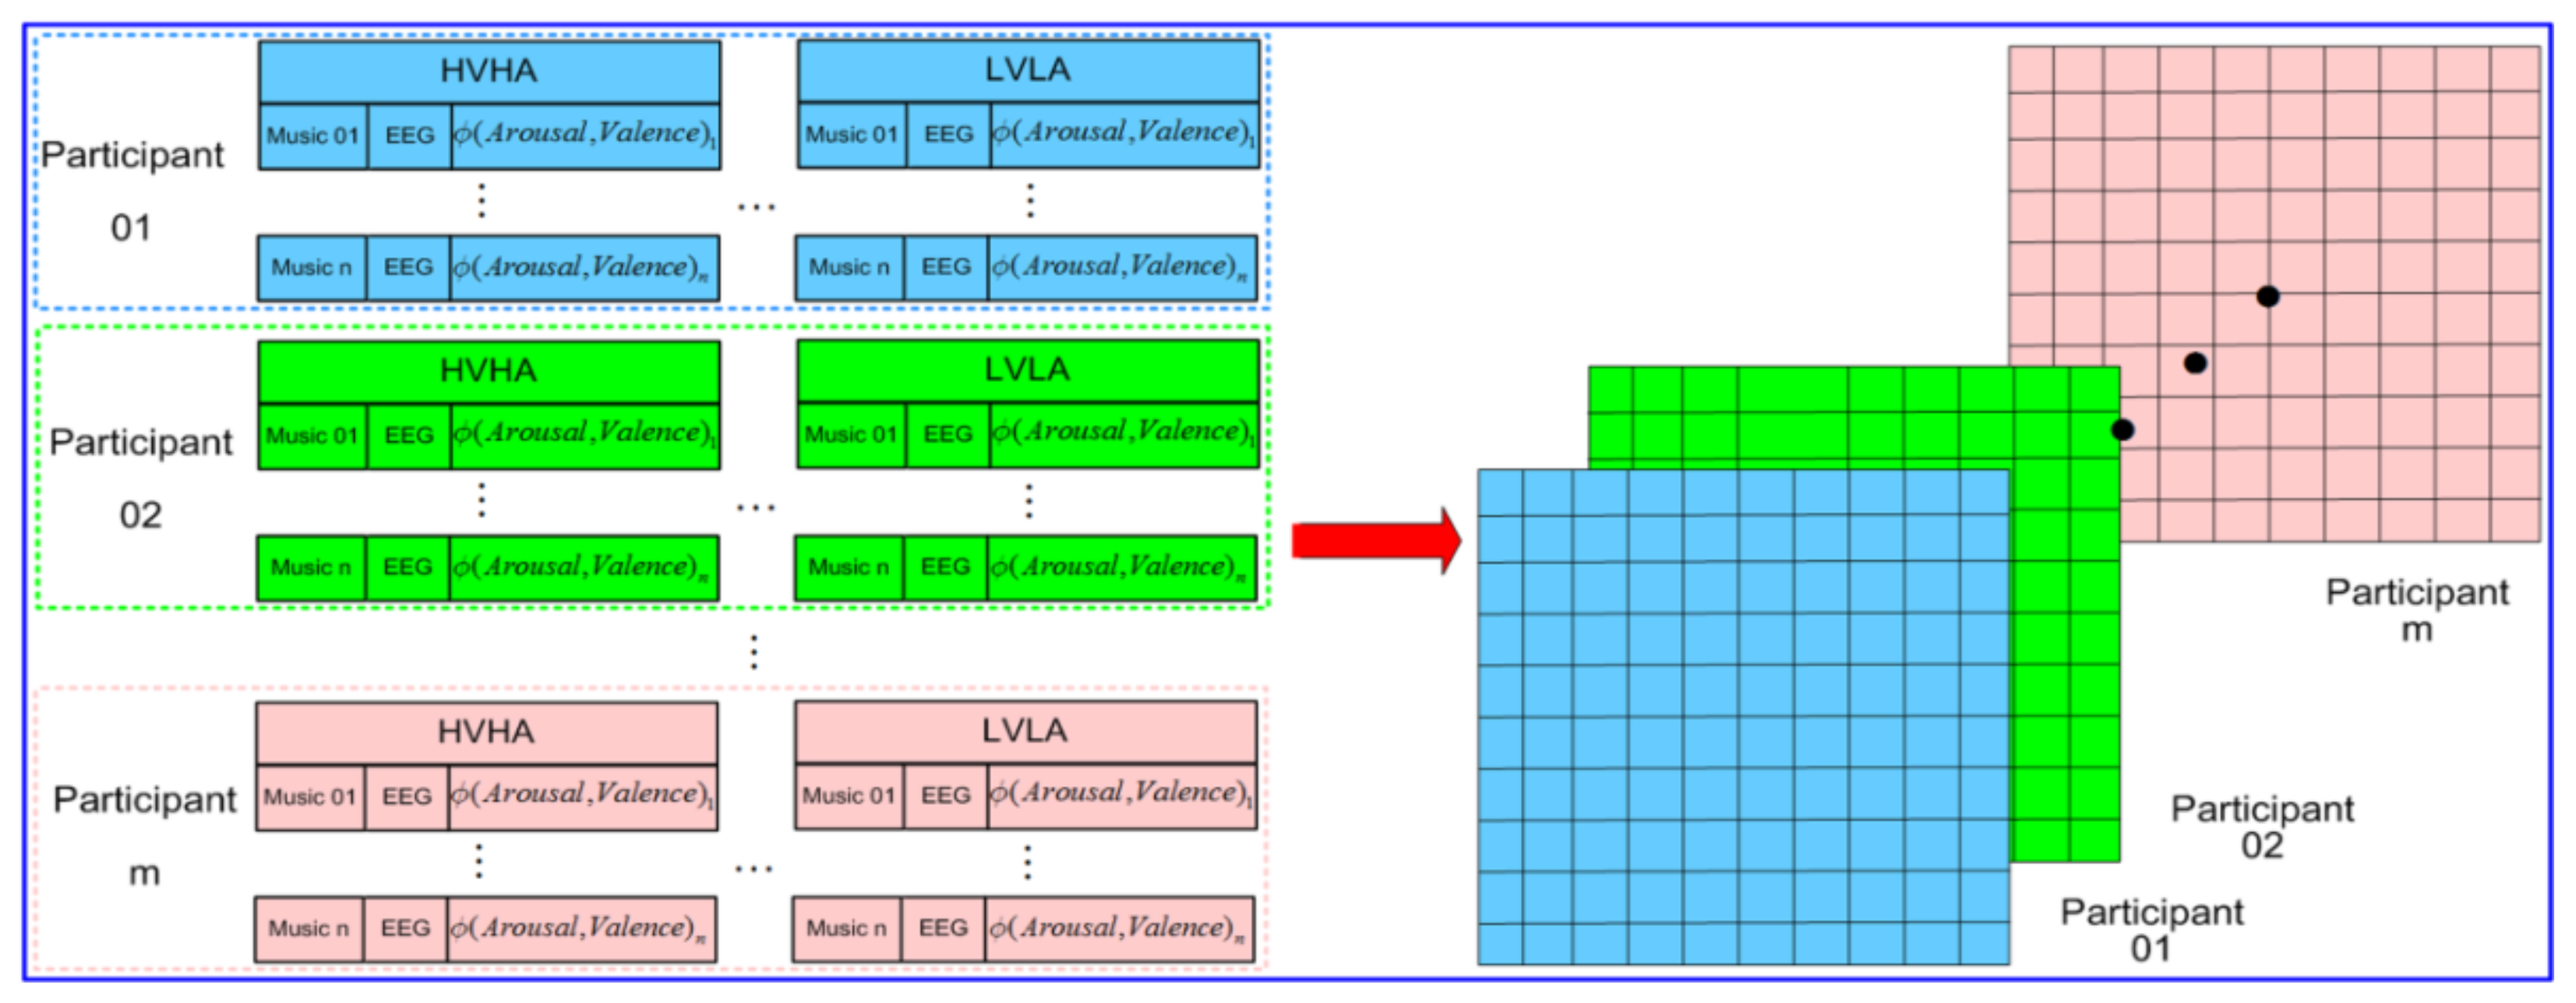
Through previous experiments, it was found that if the music reconstruction combination of soothing and excited music segments was reconstructed, according to the duty cycle of 50%, 70%, and 90%, the Alpha and Beta wave power in the brain frontal EEG signal would appear as shown in Figure 5. When the soothing and excited music were reconstructed, according to the 90% duty cycle, the music had the most obvious effect on the emotional regulation of the brain. According to the formula (Equations (1) and (2)) for quantitative evaluation of arousal and valence, the same phenomenon also occurred, as shown in Figure 5. Of course, as we could not run through all types of music, we first used SSAE to perform emotional classification, and performed Arousal and Valence calculations on the music segments under the same classification label, and sorted them from high to low (according to Arousal and Valence, respectively) to provide participants with corresponding personalized reconfigurable music-EEG libraries, as shown in Figure 6. In this way, we reconstructed the combination, according to the above-mentioned combination, and adjusted the emotion adaptively.
3.3. Reconfigurable Music Segment Emotion Recognition
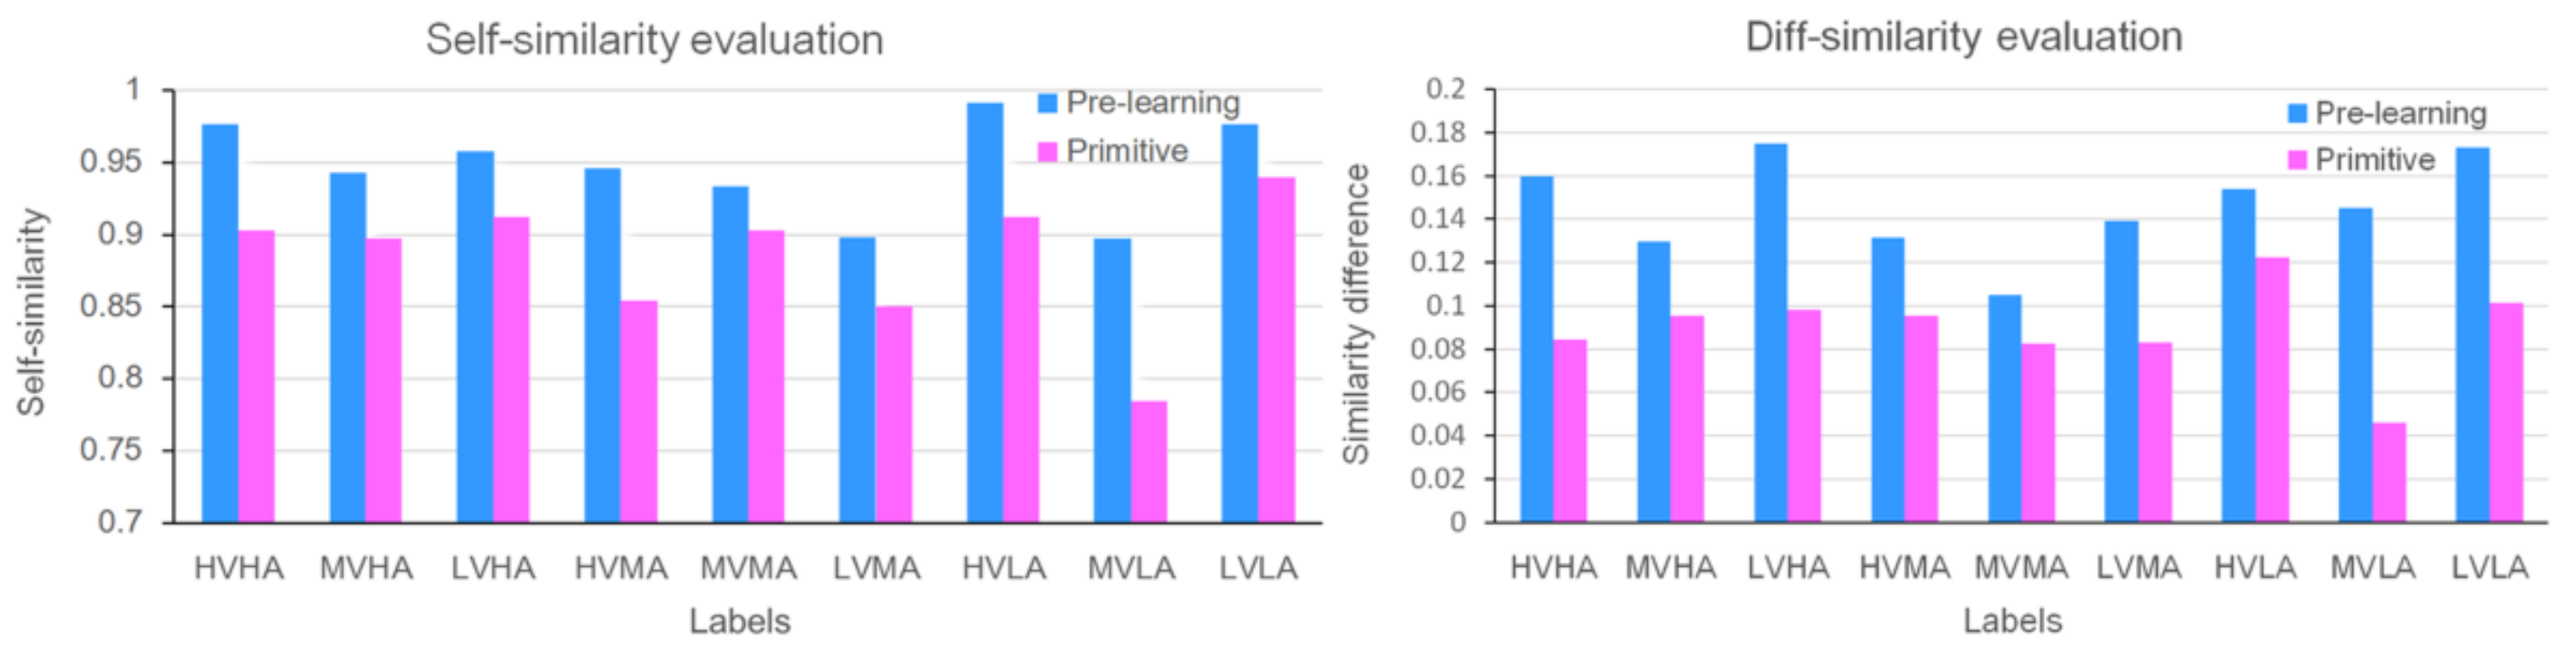
As shown in Figure 7, the original eigenvectors and the pre-trained SSAE eigenvectors were evaluated, in terms of similarity. The result of the diff-similarity evaluation showed that the self-similarity of the same emotional label was greater than the cross-similarity; that is, the sample concentration under the same emotional label was better than the cross-similarity of the emotional labels. The concentration and separability of samples could be obviously improved by the stack auto-encoder after pre-learning, after which the diff-similarity was increased by 31.2%.
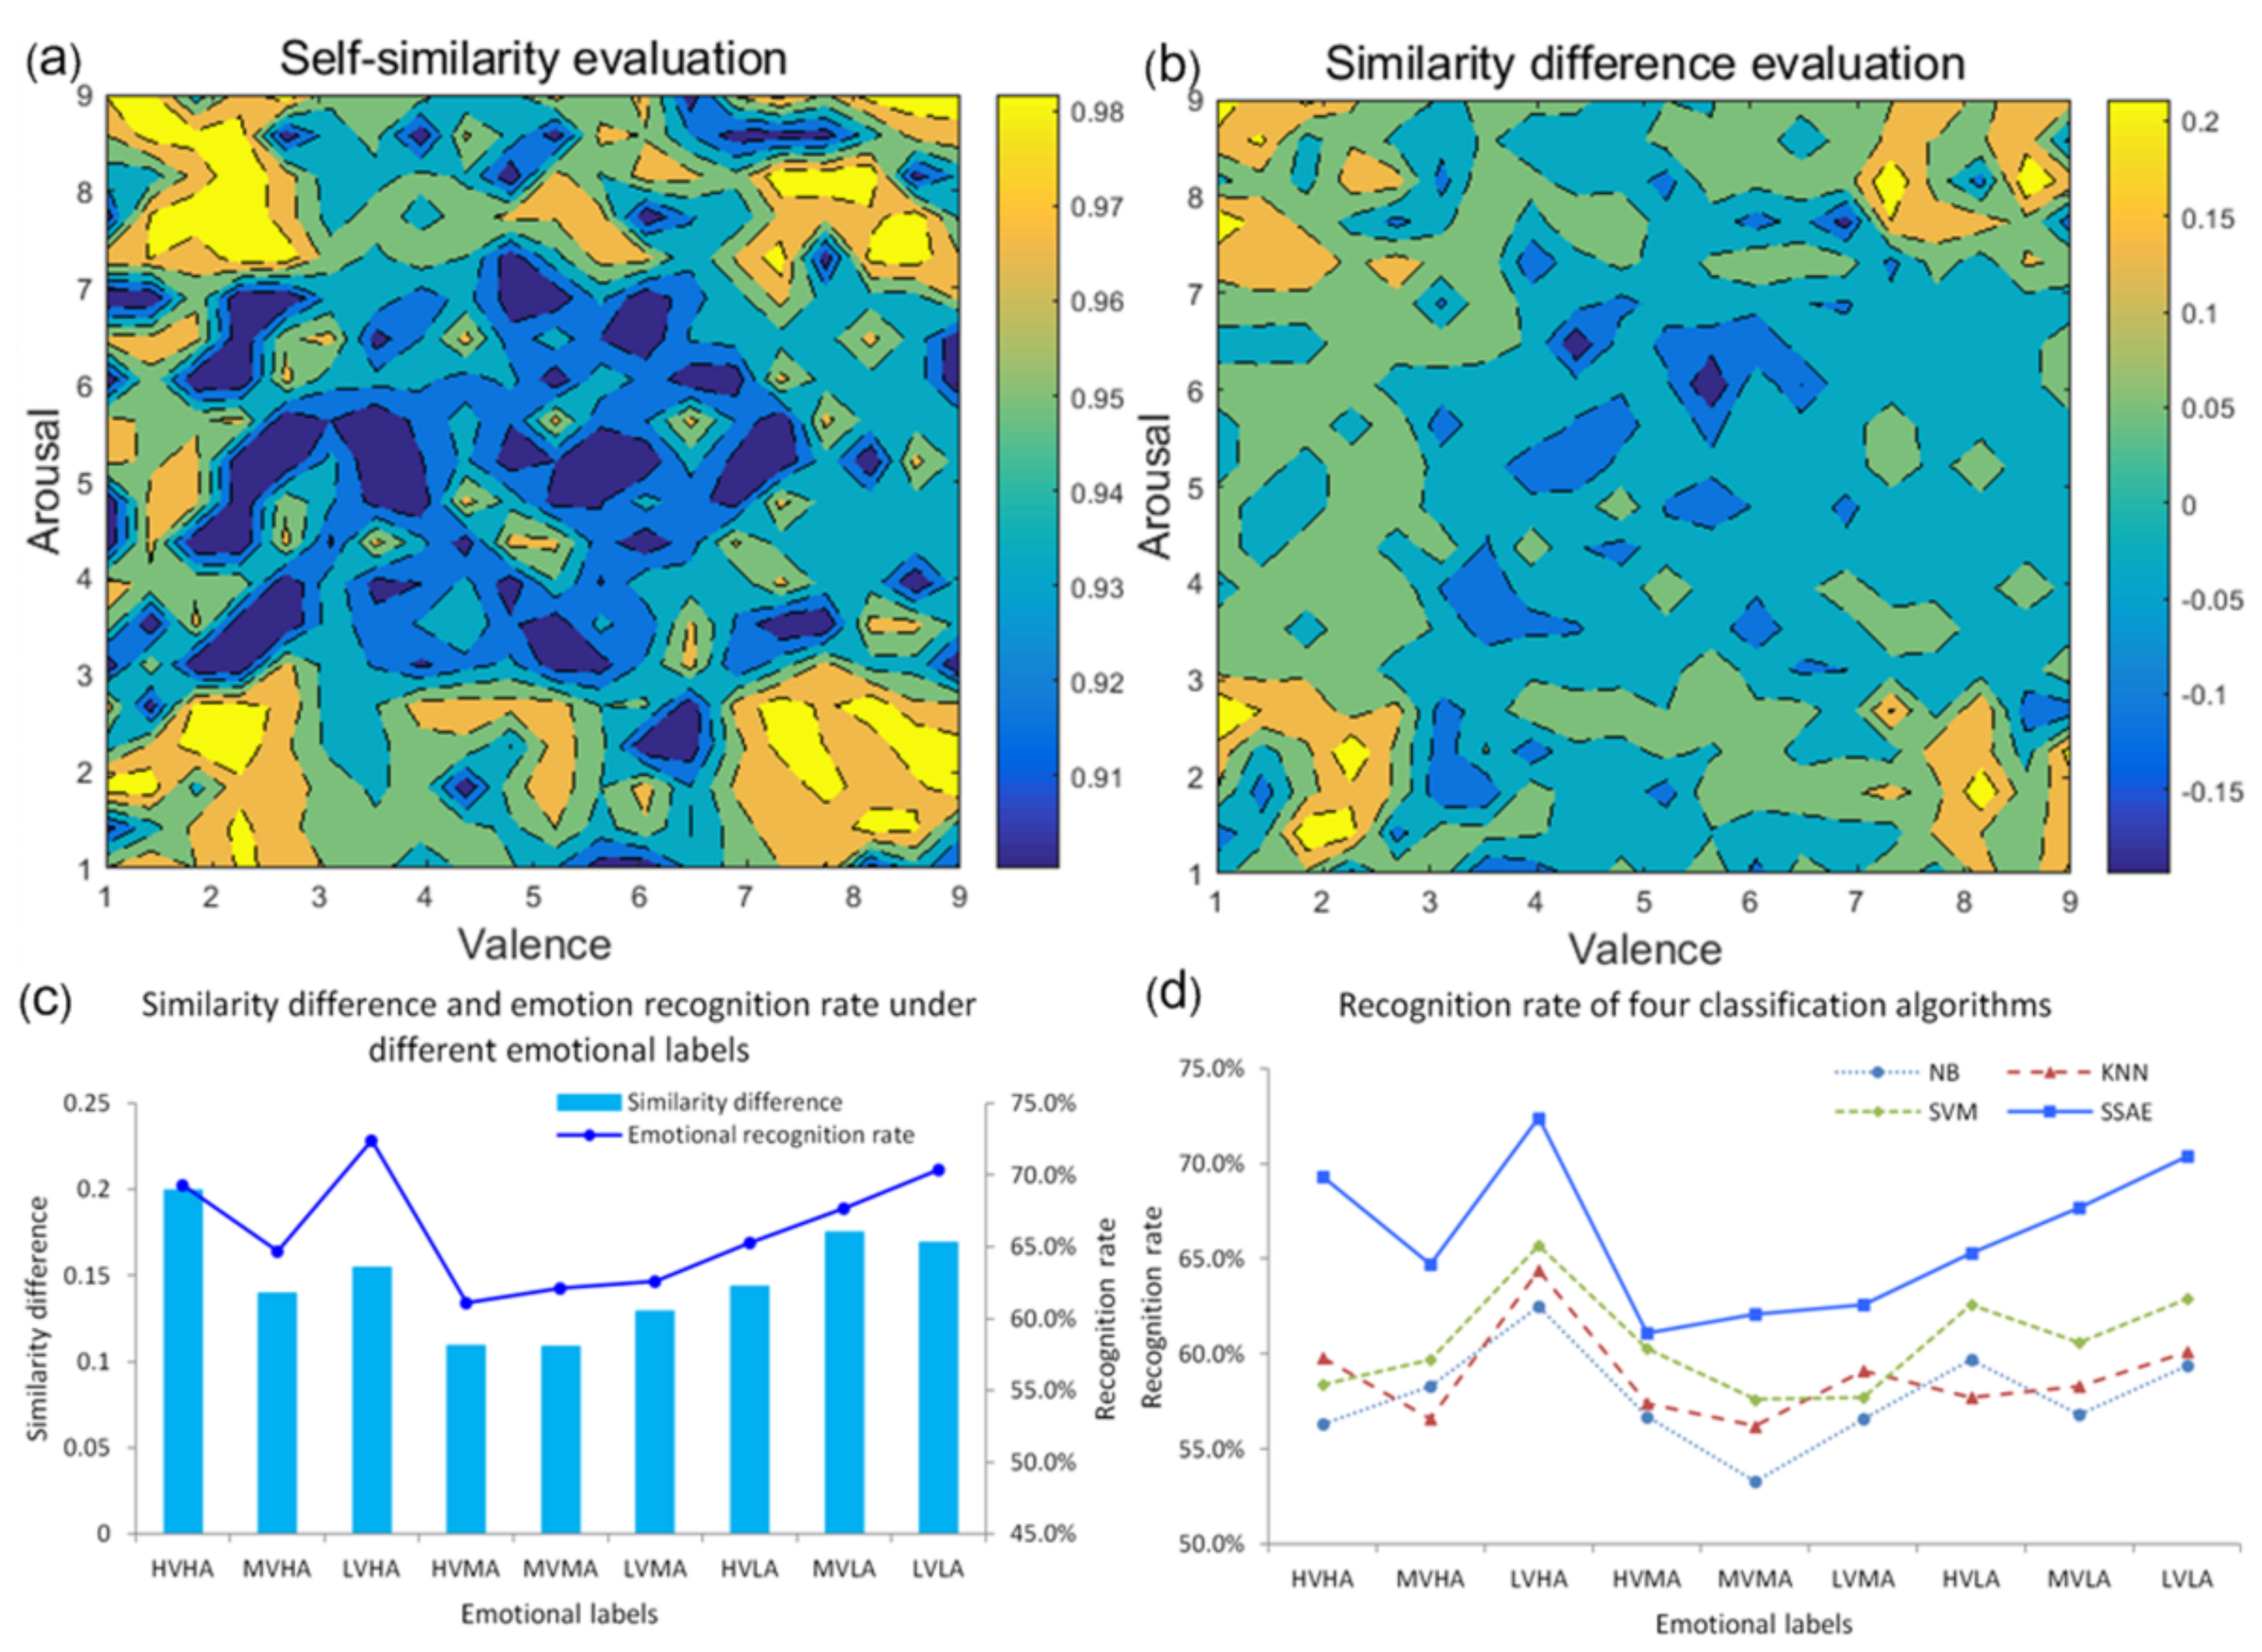
The distribution of the eigenvector self-similarity and diff-similarity under different emotional labels in the V-A plane was shown in Figure 8a,b. The larger the color value, the better the concentration or divisibility of the sample. When the degree of arousal was ‘HA’ or ‘LA’, the concentration or separability of the sample was good, while the degree of arousal of ‘MA’ indicated, relatively poor results. The same pattern was found for valence.
Figure 8c showed the corresponding relationship between diff-similarity and emotion recognition rate under different emotional labels. As can be seen from the figure, the emotion classification algorithm based on the SSAE was consistent with the variation rule of similarity difference and, under high and low arousal, the two changes were the most obvious. In this paper, NB, KNN (K = 9, Euclide distance), SVM (RBF kernel function), and SSAE (, , double hidden layer) were used to classify the emotions of reconfigurable music segments. The recognition rate was shown in Figure 8d. The SSAE optimization feature vector showed a better classification effect than the original, compared with the above three classification algorithms.
3.4. Reconfigurable Music Segment Emotion Regulation
According to the different goals of emotional regulation, from the personalized music segment libraries corresponding to the participants, different music segments were selected for reconstruction and combination, in order to obtain reconfigurable music for use in adaptive emotional regulation. Taking ‘HVHA’ as an example, the SSAE classification label for ‘HVHA’ was selected from the music segment library, with arousal and valence scoring ranked first and (if it was one) the second-highest score, from which two music segments were selected, marked A1 and A2, respectively. Then, the music segment with the highest Arousal score from the ‘HVLA’ corresponding to Low Arousal was selected, marked A3. We intercepted A3 before 1 s, A2 after 4 s, and then recombined with A1 to obtain new reconfigurable music.
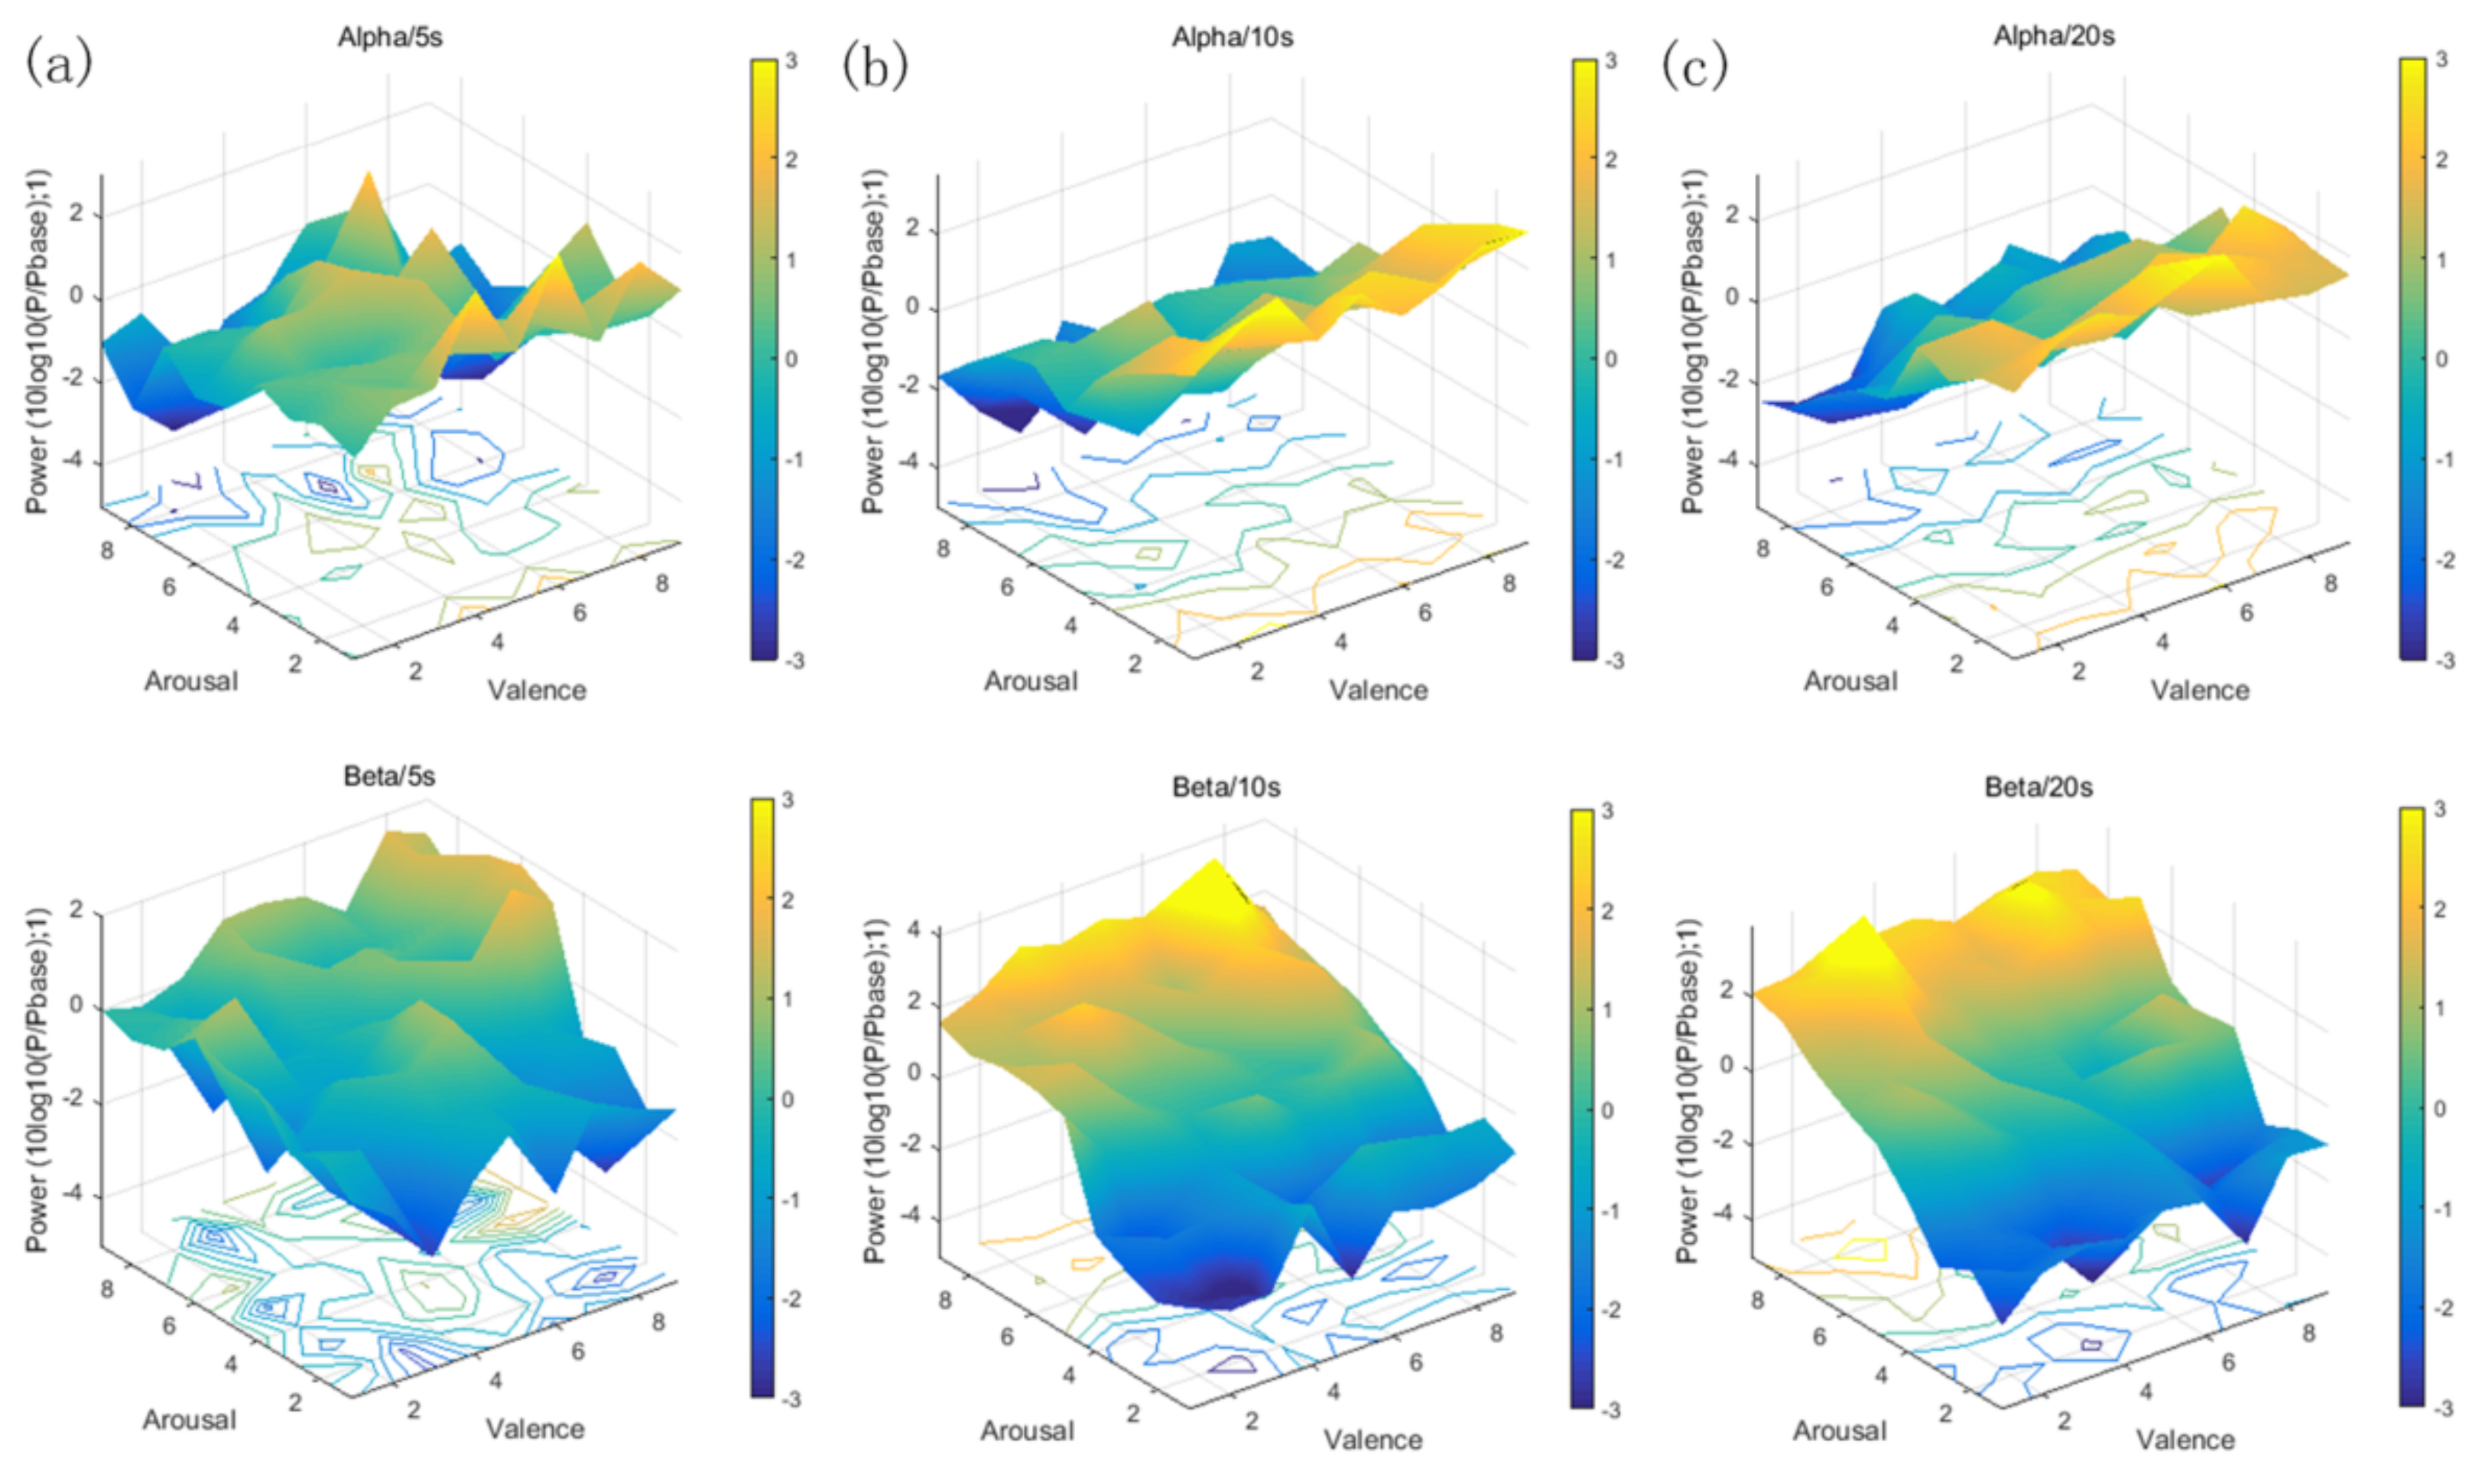
From the personalized music segment library established in the first stage, according to the music segment reconstruction and combination algorithm, we selected the corresponding 3 reconstructed music segments for each emotion label, and obtained the reconstructed music segments of 5, 10, and 20 s in length, respectively, which were used for the reconfigurable music emotional regulation. Alpha and beta waves were selected for intuitive comparison. As shown in Figure 9, the trend of power variation was clearly reflected. According to Equation (3), alpha and beta were obtained under different emotion labels. In the V–A plane, with the increase in the awakening degree, alpha and beta waves showed an obvious decrease and increase, respectively. From the comparison of the three durations in the figure, it can be seen that, when the length of the reconstructed music segment was 10 s, a delicate balance between time consumption and the phenomenon could be achieved; in other words, under the action of a relatively short duration of music induction, alpha and beta waves of the brain showed obvious follow-up changes. Therefore, the reconstruction of music with a 10 s duration was selected in this paper for a comparative experiment with complete music.
By comparing the reconfigurable music segments with complete music, in terms of the emotional regulation of participants, it was found that the reconfigurable music segments had obvious advantages, in terms of speed and emotional adjustment goals. In order to facilitate the quantitative comparison between reconfigurable music and complete music, we used the time window translation method to intercept feature extraction and classification of EEG.
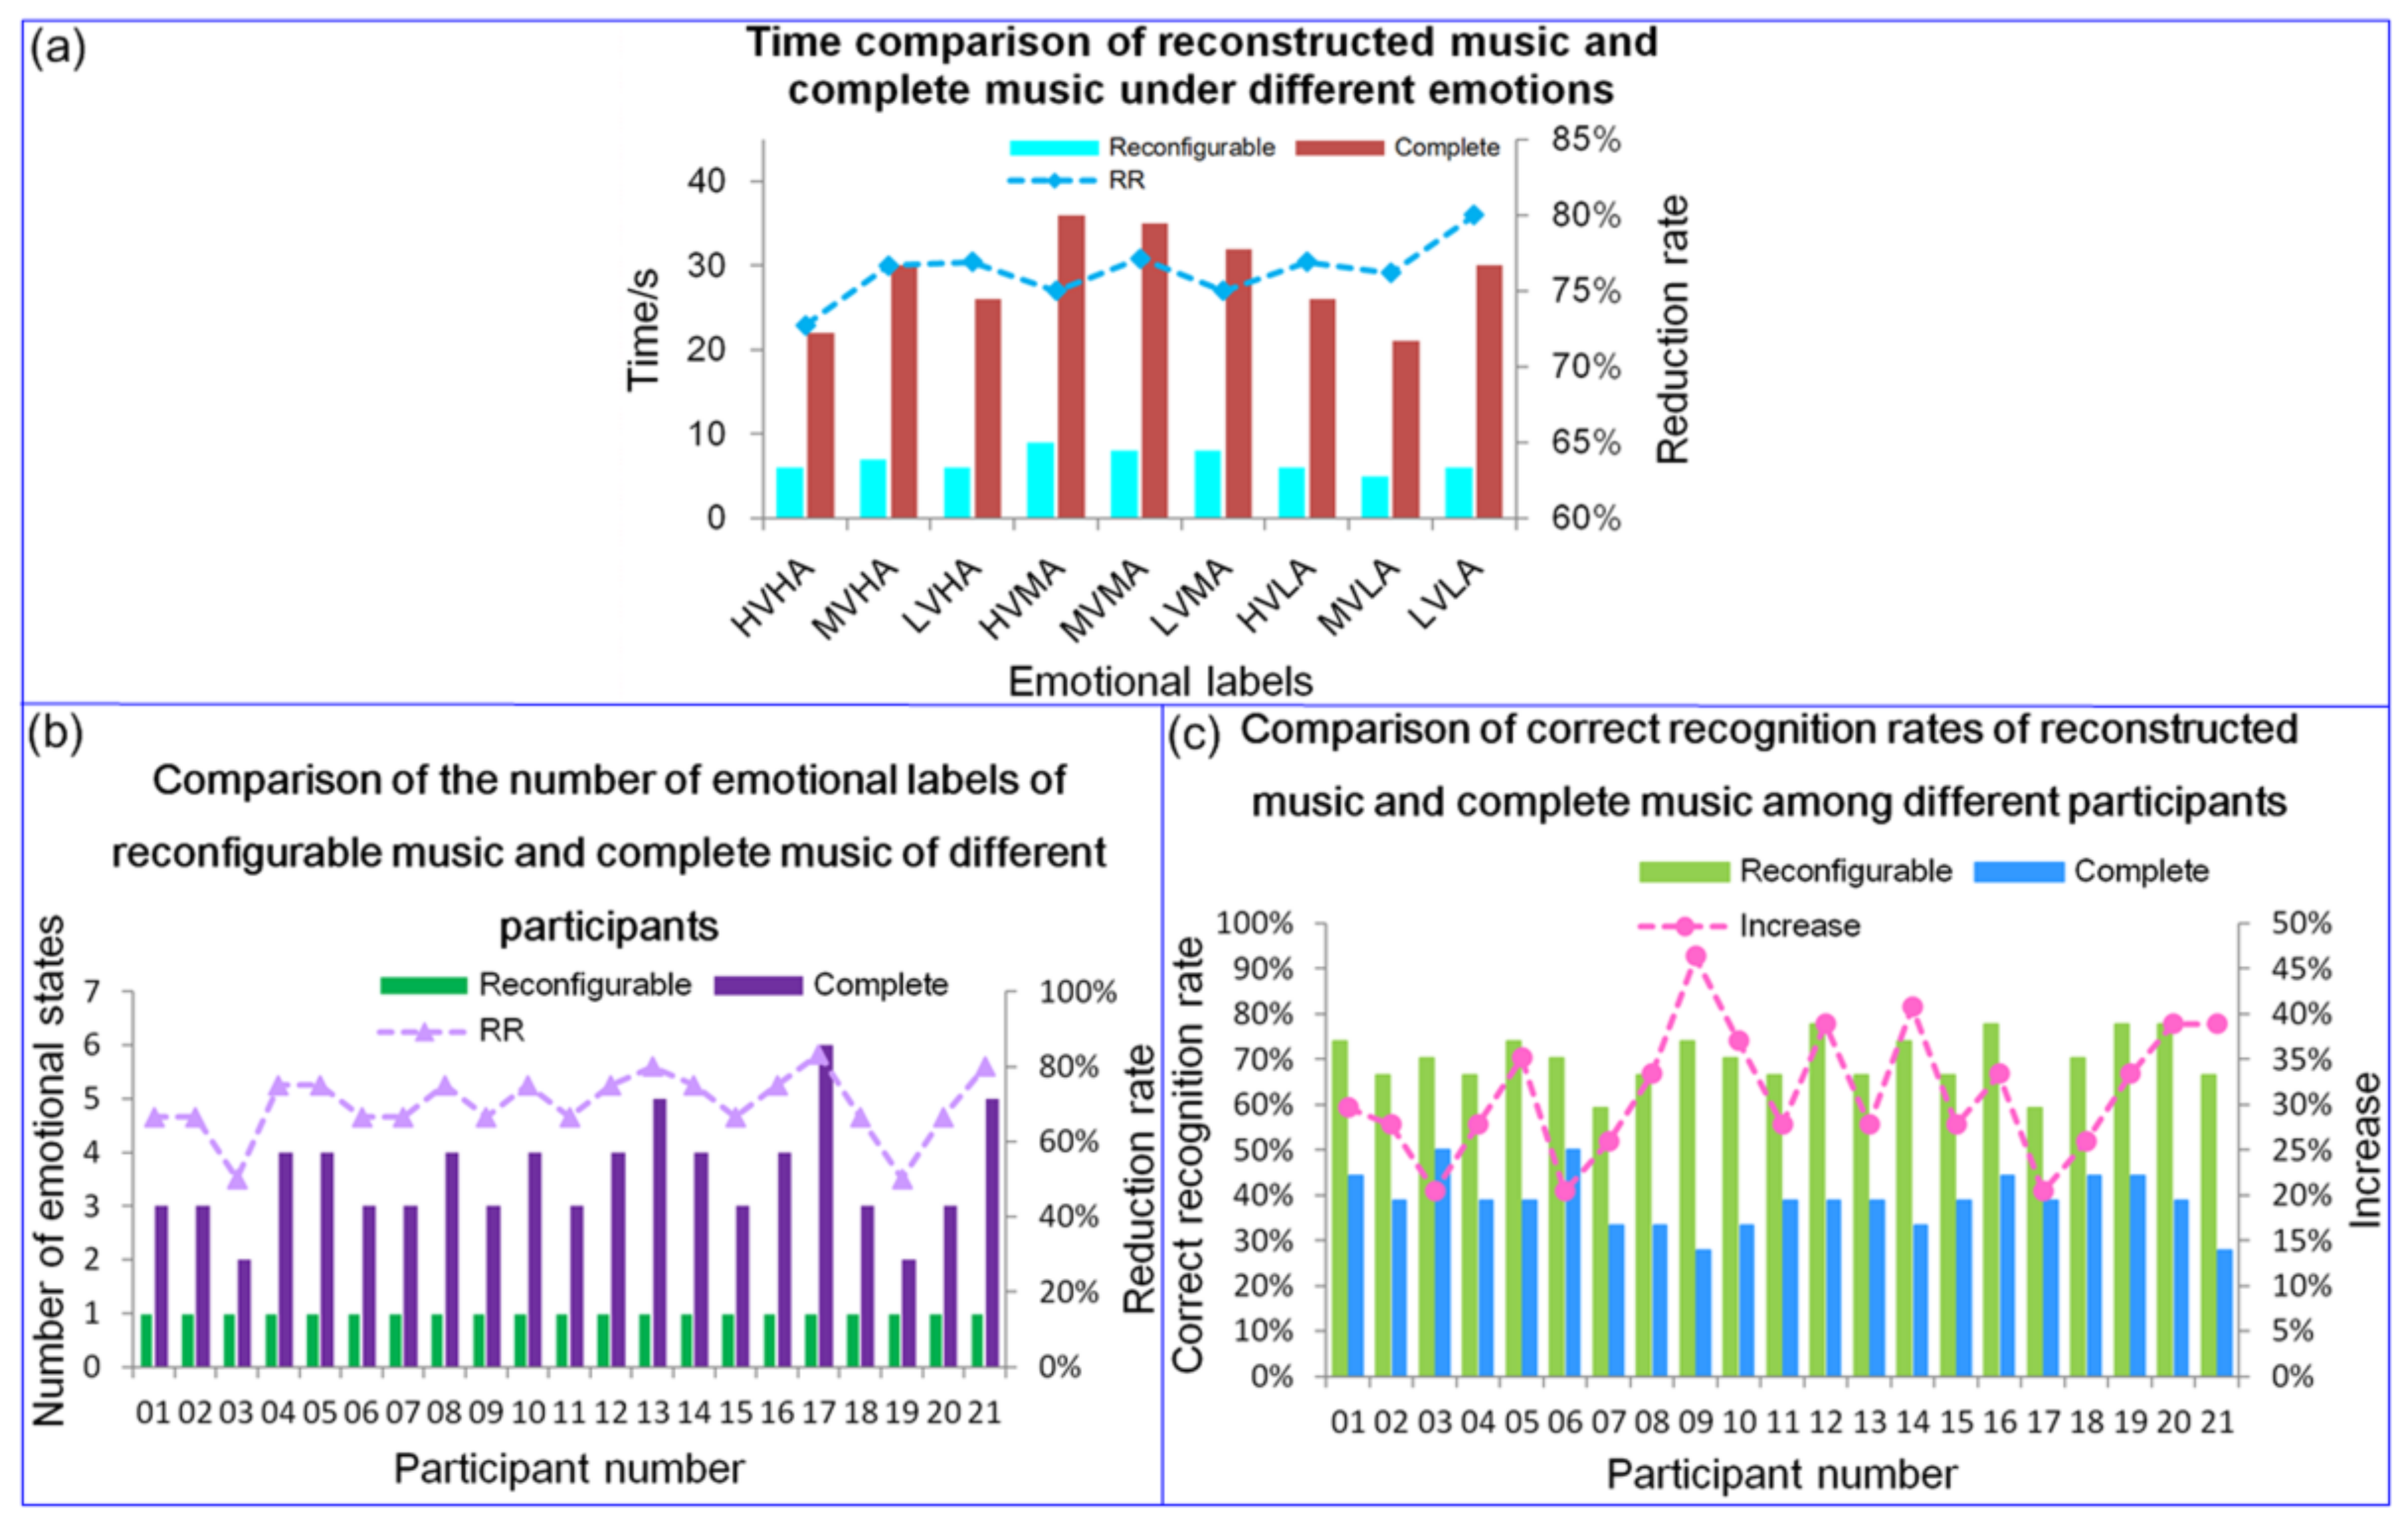
The EEG corresponding to the reconfigurable music and the complete music were respectively segmented by window (window width of 1 s). If the subjective emotion score target was consistent three times or more, the judgment was taken as the duration of the emotional start; when it was insufficient, the maximum duration was taken as the emotional start time. As shown in Figure 10a, the time spent on reconfigurable music segments was significantly shorter, being 76.29% lower than that for complete music. In terms of time consumption, reconfigurable music segments had a clear advantage.
According to the above experimental results, the EEG was segmented with a window width of 10 s; that is, the number of corresponding emotional states was 1. In order to fully reflect the general trend of the data and avoid the influence of the maximal minimum value, the mode was selected as the number of emotional states. The result is shown in Figure 10b, from which, it can be seen that, under the emotional adjustment of reconfigurable music segments and complete music, the number of emotional states induced by reconfigurable music was significantly lower than that of complete music, with the number of emotional states being reduced by 69.92%. Therefore, reconfigurable music segments also have more obvious advantages, in terms of changeable emotions.
The EEG corresponding to the reconfigurable music segment and the complete music was used as a data sample for emotional state recognition, and the probability that the emotion labels of different participants were correctly identified under reconfigurable music segments and complete music were counted, as shown in Figure 10c. From the figure, it can be seen that, under the guidance of reconfigurable music segments and complete music, reconfigurable music segments could regulate emotions significantly better than complete music segments, where the correct recognition rate of emotional labels was improved by 31.32%. Therefore, compared with complete music, reconfigurable music segments had more obvious advantages for emotional regulation, in terms of adaptability to different participants.
4. Discussion
Research assessing how different forms of music can be used to induce emotions, and which form is superior, is still lacking. Common music types include classical music, music clips, and so on [12,38,40]; however, these all apply to specific scenarios. Once the application scenario is changed, it is difficult to guarantee the induction effect of music. As each listener’s subjective perception of the same music is different, it is impossible to adapt to each listener, and the music induction effect on each listener is different. In addition, in the existing emotion-related music datasets, such as the DEAP and MAHNOB-HCI dataset [20,21], the participants conducted subjective emotional evaluations induced by given emotional materials and established a one-way correspondence between EEG and emotional subjective evaluations, but not a two-way feedback adjustment of emotional state, and were unable to adjust emotions individually. In this paper, through the first stage of the experiment, a personalized reconfigurable music-EEG library was obtained corresponding to each participant; meanwhile, in the second stage of the experiment, the reconfigurable music was used to adaptively adjust emotions, thereby performing two-way feedback adjustment.
At present, there is no uniform specification for EEG feature extraction. In this paper, the features were extracted from the different EEG bands, which has been widely used in the existing medical literature [21,41,42]. The fact that the power of the alpha wave is related to the state of relaxation has been medically validated. Some indicators, such as the power spectrum ratio of alpha and beta waves, can be extracted as recognition characteristics of arousal values [38,41]; however, the correlations between the remaining features remain unclear.
According to Schmidt et al., the total power of the EEG bands in the frontal area decreases with the decrease in the emotional intensity of music, while the music intensity was also related to the total alpha power of the frontal area. The total power of each frontal EEG band was not fixed, but increases with the increase in music intensity, showing a positive correlation [43]. Considering these results, soothing music with low intensity and exciting music with high intensity were reconstructed and combined, according to Figure 5. When soothing music and exciting music were reconstructed and combined, according to a 90% duty cycle, the music induced the brain most obviously. Among them, soothing music made the brain emotion relaxed, while exciting music made the brain emotion intense. The arousal and valence also confirmed this phenomenon. For each participant, a personalized reconfigurable music-EEG library was established, in order to provide a music sample library for subsequent reconfigurable music emotion induction. The library provided was a music sample library for subsequent reconfigurable music emotion induction. According to the goal of emotional regulation, reconstruction and combination were performed, according to the above-mentioned combination mode, and the emotion was adaptively induced.
As shown in Figure 8, as the SSAE algorithm can perform unsupervised pre-learning training on the feature vectors of unlabeled samples, compared with the other three considered methods, it significantly improved the emotion classification recognition rate corresponding to reconfigurable music segments. After pre-learning through the stack auto-encoder, the concentration and separability of samples were improved significantly, reflecting the advantages of double-hidden layer auto-encoders. The same phenomenon was observed for arousal and valence. Compared with the common NB, KNN, and SVM classification algorithms, the SSAE classification algorithm adopted in this paper has more obvious advantages when using a large number of segmented unlabeled samples.
The emotional dimension model used was based on arousal and valence, with the current common emotion classification systems using 2–4 dimensions [18,20,44]. The classification dimension used in this paper was 9-dimensional and the granularity of the divided emotional labels was more detailed, which led to more specific classification of the emotional labels, which inevitably led to a reduction in classification accuracy. The focus of this paper was on the effectiveness of the emotional approach. Improvement of the classification accuracy is our next key research direction.
According to the method of reconfigurable music combination, music of 5 s, 10 s, or 20 s duration was obtained from the personalized music fragment library. In Figure 9, the corresponding alpha and beta power changes with arousal induced by music of 10 s and 20 s duration can be seen, which is consistent with existing research results; that is, alpha and beta power are highly correlated with the arousal of emotion [38,39]. Music with a duration of 5 s may have too short of an induction time to effectively achieve emotional regulation, while music with a duration of 20 s may have a longer induction time while achieving the same emotional regulation. When the length of the reconstructed music was 10 s, a delicate balance between time and emotional goal could be achieved.
Compared with complete music, reconstructed music has obvious advantages in inducing emotions. As shown in Figure 10, in terms of time consumption, reconstructed music was significantly less time-consuming. In terms of emotional changeability, with the change of music through time, a number of emotional states will be produced; however, some emotional states are not what we hope to produce. Therefore, when the emotional states produced are more consistent with the target emotional states, there are fewer corresponding emotional states, leading to better emotional adjustment; that is, the fewer the irrelevant emotional states, the better. The reconfigurable music had no redundant music segments and short length, compared with complete music; consequently, the number of irrelevant emotional states was reduced by 69.92%. In terms of the adaptability of different participants, the recognition rate of the emotional state due to reconfigurable music segments increased by 31.32%, compared to complete music. The above phenomenon may have been caused by the long duration of complete music, which tends to cause changeable emotional states. After learning and training, the characteristic quantities extracted from it will also produce fluctuation deviation, resulting in a decrease in the correct recognition rate of emotional labels. Therefore, reconfigurable music had obvious advantages over complete music. The results of this study are encouraging and suggest that the approach could improve emotional regulation in the short-term, and could be extended to sleep systems, anxiety relief, and adaptive music therapy for different individuals.
5. Conclusions
In this paper, we proposed an adaptive emotional adjustment model for personalized reconfigurable music. By constructing a multi-channel EEG sensing network, a personalized reconfigurable music-EEG library corresponding to each participant was established. For each participant, the music fragments were reconstructed and combined, combined with SSAE to identify and classify the emotional state, and the corresponding adaptive emotional regulation model was established. The results showed that this method not only improved the effect of emotional classification, but also made it easy to obtain the data and greatly reduced the pressure on computing space and time. In addition, by expressing abstract emotional EEG data as specific emotional indicators, it is more objective and novel than the subjectively evaluated 2D-SAM scale and, at the same time, greatly reduces the difficulty of data processing. Finally, a corresponding personalized reconfigurable music-EEG database was established for each participant and, based on the SSAE emotion recognition model, the emotion of each participant could be adaptively adjusted. Therefore, the study of emotional EEG is expected to provide theoretical reference and a new technical direction for the application of emotional regulation.
On the other hand, the greater the number of emotion classification labels, the lower the classification accuracy. The emotion label classification can be optimized, according to specific emotion regulation scenarios, which can improve the performance of emotional classification. In addition, further optimization of the SSAE classification algorithm is an ongoing research direction.
Author Contributions
Y.L. and W.Z. proposed the experimental method and emotion classification algorithm, carried out experiments and data collection, and Y.L. drafted the paper. All authors have read and agreed to the published version of the manuscript.
Funding
Thanks for the project supported by the national natural science foundation of China (grant no. 61573073).
Institutional Review Board Statement
All methods in this study were approved by the ethics committee of Chongqing cancer hospital (approval no.: Ethical review 005, 2019), and all experimental procedures were in accordance with the ethical guidelines and Helsinki declaration stipulated by the ministry of health, labor and welfare (BMJ 1991; 302: 1194).
Informed Consent Statement
Informed consent was obtained from all subjects involved in the study.
Data Availability Statement
The datasets used and/or analyzed during the current study are available from the corresponding author on reasonable request.
Acknowledgments
We would like to thank the many participants for their assistance in the EEG recordings.
Conflicts of Interest
The authors declare no conflict of interest.
References
- Blanchette, I. The effect of emotion on interpretation and logic in a conditional reasoning task. Mem. Cogn. 2006, 34, 1112–1125. [Google Scholar] [CrossRef] [PubMed] [Green Version]
- Seth, A.K.; Friston, K.J. Active interoceptive inference and the emotional brain. Philos. Trans. R. Soc. B Biol. Sci. 2016, 371, 10. [Google Scholar] [CrossRef] [PubMed] [Green Version]
- Kong, R.; Li, J.W.; Orban, C.; Sabuncu, M.R.; Liu, H.; Schaefer, A.; Sun, N.; Zuo, X.-N.; Holmes, A.J.; Eickhoff, S.B.; et al. Spatial Topography of Individual-Specific Cortical Networks Predicts Human Cognition, Personality, and Emotion. Cereb. Cortex 2019, 29, 2533–2551. [Google Scholar] [CrossRef] [PubMed] [Green Version]
- Ito, T.A.; Cacioppo, J.T.; Lang, P.J. Eliciting affect using the international affective picture system: Trajectories through evaluative space. Pers. Soc. Psychol. Bull. 1998, 24, 855–879. [Google Scholar] [CrossRef]
- Bradley, M.M.; Lang, P.J. The International Affective Digitized Sounds. Affective Ratings of Sounds and Instruction Manual, 2nd ed.; Technical Report B-3; University of Florida: Gainesville, FL, USA, 2007. [Google Scholar]
- Plutchik, R. The Nature of Emotions—Human emotions have deep evolutionary roots, a fact that may explain their complexity and provide tools for clinical practice. Am. Sci. 2001, 89, 344–350. [Google Scholar] [CrossRef]
- Russell, J.A. Core affect and the psychological construction of emotion. Psychol. Rev. 2003, 110, 145–172. [Google Scholar] [CrossRef] [PubMed]
- Cannon, W.B. The James-Lange theory of emotions: A critical examination and an alternative theory. Am. J. Psychol. 1927, 39, 106–124. [Google Scholar] [CrossRef]
- Jatupaiboon, N.; Pan-ngum, S.; Israsena, P. Real-Time EEG-Based Happiness Detection System. Sci. World J. 2013, 2013, 1–12. [Google Scholar] [CrossRef]
- Badesa, F.J.; Diez, J.A.; Catalan, J.M.; Trigili, E.; Cordella, F.; Nann, M.; Crea, S.; Soekadar, S.R.; Zollo, L.; Vitiello, N.; et al. Physiological Responses During Hybrid BNCI Control of an Upper-Limb Exoskeleton. Sensors 2019, 19, 4931. [Google Scholar] [CrossRef] [Green Version]
- Bradley, M.M.; Lang, P.J. Measuring emotion—The self-assessment mannequin and the semantic differential. J. Behav. Ther. Exp. Psychiatry 1994, 25, 49–59. [Google Scholar] [CrossRef]
- Hamada, M.; Zaidan, B.B.; Zaidan, A.A. A Systematic Review for Human EEG Brain Signals Based Emotion Classification, Feature Extraction, Brain Condition, Group Comparison. J. Med. Syst. 2018, 42, 162. [Google Scholar] [CrossRef] [PubMed]
- Tseng, K.C.; Lin, B.-S.; Han, C.-M.; Wang, P.-S. Emotion Recognition of EEG Underlying Favourite Music by Support Vector Machine. In Proceedings of the 1st International Conference on Orange Technologies, Tainan, Taiwan, 12–16 March 2013; pp. 155–158. [Google Scholar]
- Khezri, M.; Firoozabadi, M.; Sharafat, A.R. Reliable emotion recognition system based on dynamic adaptive fusion of forehead biopotentials and physiological signals. Comput. Meth. Programs Biomed. 2015, 122, 149–164. [Google Scholar] [CrossRef]
- Naji, M.; Firoozabadi, M.; Azadfallah, P. Emotion classification during music listening from forehead biosignals. Signal. Image Video Process. 2015, 9, 1365–1375. [Google Scholar] [CrossRef]
- Cai, H.S.; Han, J.S.; Chen, Y.F.; Sha, X.; Wang, Z.; Hu, B.; Yang, J.; Feng, L.; Ding, Z.; Chen, Y.; et al. A Pervasive Approach to EEG-Based Depression Detection. Complexity 2018, 13. [Google Scholar] [CrossRef]
- Mohammadi, Z.; Frounchi, J.; Amiri, M. Wavelet-based emotion recognition system using EEG signal. Neural Comput. Appl. 2017, 28, 1985–1990. [Google Scholar] [CrossRef]
- Chanel, G.; Rebetez, C.; Betrancourt, M.; Pun, T. Emotion Assessment From Physiological Signals for Adaptation of Game Difficulty. IEEE Trans. Syst. Man Cybern. Part A Syst. Hum. 2011, 41, 1052–1063. [Google Scholar] [CrossRef] [Green Version]
- Murugappan, M.; Nagarajan, R.; Yaacob, S. Combining Spatial Filtering and Wavelet Transform for Classifying Human Emotions Using EEG Signals. J. Med. Biol. Eng. 2011, 31, 45–51. [Google Scholar] [CrossRef]
- Koelstra, S.; Muhl, C.; Soleymani, M.; Lee, J.-S.; Yazdani, A.; Ebrahimi, T.; Pun, T.; Nijholt, A.; Patras, I. DEAP: A Database for Emotion Analysis Using Physiological Signals. IEEE Trans. Affect. Comput. 2012, 3, 18–31. [Google Scholar] [CrossRef] [Green Version]
- Soleymani, M.; Lichtenauer, J.; Pun, T.; Pantic, M. A Multimodal Database for Affect Recognition and Implicit Tagging. IEEE Trans. Affect. Comput. 2012, 3, 42–55. [Google Scholar] [CrossRef] [Green Version]
- Lytridis, C.; Lekova, A.; Bazinas, C.; Manios, M.; Kaburlasos, V.G. WINkNN: Windowed Intervals’ Number kNN Classifier for Efficient Time-Series Applications. Mathematics 2020, 8, 413. [Google Scholar] [CrossRef] [Green Version]
- Murugappan, M.; Rizon, M.; Nagarajan, R.; Yaacob, S.; Hazry, D.; Zunaidi, I. Time-Frequency Analysis of EEG Signals for Human Emotion Detection. In Proceedings of the 4th Kuala Lumpur International Conference on Biomedical Engineering, Kuala Lumpur, Malaysia, 25–28 June 2008; Volume 21, pp. 262–265. [Google Scholar]
- Georgieva, O.; Milanov, S.; Georgieva, P.; Santos, I.M.; Pereira, A.T.; Silva, C.F. Learning to decode human emotions from event-related potentials. Neural Comput. Appl. 2015, 26, 573–580. [Google Scholar] [CrossRef]
- Zheng, W.-L.; Lu, B.-L. Investigating Critical Frequency Bands and Channels for EEG-Based Emotion Recognition with Deep Neural Networks. IEEE Trans. Auton. Ment. Dev. 2015, 7, 162–175. [Google Scholar] [CrossRef]
- Alarcao, S.M.; Fonseca, M.J. Emotions Recognition Using EEG Signals: A Survey. IEEE Trans. Affect. Comput. 2019, 10, 374–393. [Google Scholar] [CrossRef]
- Rajendran, V.G.; Teki, S.; Schnupp, J.W.H. Temporal Processing in Audition: Insights from Music. Neuroscience 2018, 389, 4–18. [Google Scholar] [CrossRef] [PubMed]
- Picard, R.W.; Vyzas, E.; Healey, J. Toward machine emotional intelligence: Analysis of affective physiological state. IEEE Trans. Pattern Anal. Mach. Intell. 2001, 23, 1175–1191. [Google Scholar] [CrossRef] [Green Version]
- Harmon-Jones, E.; Gable, P.A. On the role of asymmetric frontal cortical activity in approach and withdrawal motivation: An updated review of the evidence. Psychophysiology 2018, 55, 23. [Google Scholar] [CrossRef]
- Davidson, R.J. Emotion and affective style—hemispheric substrates. Psychol. Sci. 1992, 3, 39–43. [Google Scholar] [CrossRef]
- Henriques, J.B.; Davidson, R.J. Left frontal hypoactivation in depression. J. Abnorm. Psychol. 1991, 100, 535–545. [Google Scholar] [CrossRef]
- Ay, B.; Yildirim, O.; Talo, M.; Baloglu, U.B.; Aydin, G.; Puthankattil, S.D.; Acharya, U.R. Automated Depression Detection Using Deep Representation and Sequence Learning with EEG Signals. J. Med. Syst. 2019, 43, 12. [Google Scholar] [CrossRef]
- Albasri, A.; Abdali-Mohammadi, F.; Fathi, A. EEG electrode selection for person identification thru a genetic-algorithm method. J. Med. Syst. 2019, 43, 297. [Google Scholar] [CrossRef]
- Kumar, H.M.K.; Harish, B.S.; Darshan, H.K. Sentiment Analysis on IMDb Movie Reviews Using Hybrid Feature Extraction Method. Int. J. Interact. Multimed. Artif. Intell. 2019, 5, 109–114. [Google Scholar] [CrossRef] [Green Version]
- Bai, J.; Luo, K.; Peng, J.; Shi, J.; Wu, Y.; Feng, L.; Li, J.; Wang, Y. Music Emotions Recognition by Cognitive Classification Methodologies. In Proceedings of the IEEE 16th International Conference on Cognitive Informatics & Cognitive Computing, Oxford, UK, 26–28 July 2017; pp. 121–129. [Google Scholar]
- Seo, J.-H.; Tsuda, I.; Lee, Y.J.; Ikeda, A.; Matsuhashi, M.; Matsumoto, R.; Kikuchi, T.; Kang, H. Pattern Recognition in Epileptic EEG Signals via Dynamic Mode Decomposition. Mathematics 2020, 8, 481. [Google Scholar] [CrossRef] [Green Version]
- Othmana, E.; Bazi, Y.; Alajlan, N.; Alhichri, H.; Melgani, F. Using convolutional features and a sparse autoencoder for land-use scene classification. Int. J. Remote Sens. 2016, 37, 2149–2167. [Google Scholar] [CrossRef]
- Ramirez, R.; Planas, J.; Escude, N.; Mercade, J.; Farriols, C. EEG-Based Analysis of the Emotional Effect of Music Therapy on Palliative Care Cancer Patients. Front. Psychol. 2018, 9, 7. [Google Scholar] [CrossRef] [PubMed] [Green Version]
- Herrington, J.D.; Mohanty, A.; Koven, N.S.; Fisher, J.E.; Stewart, J.L.; Banich, M.T.; Webb, A.G.; Miller, G.A.; Heller, W. Emotion-modulated performance and activity in left dorsolateral prefrontal cortex. Emotion 2005, 5, 200–207. [Google Scholar] [CrossRef] [Green Version]
- Geethanjali, B.; Adalarasu, K.; Jagannath, M.; Seshadri, N.P.G.; Mohan, J. Music-Induced Brain Functional Connectivity Using EEG Sensors: A Study on Indian Music. IEEE Sens. J. 2019, 19, 1499–1507. [Google Scholar] [CrossRef]
- Jirayucharoensak, S.; Pan-Ngum, S.; Israsena, P. EEG-Based Emotion Recognition Using Deep Learning Network with Principal Component Based Covariate Shift Adaptation. Sci. World J. 2014, 2014, 1–10. [Google Scholar] [CrossRef] [Green Version]
- Jukic, S.; Saracevic, M.; Subasi, A.; Kevric, J. Comparison of Ensemble Machine Learning Methods for Automated Classification of Focal and Non-Focal Epileptic EEG Signals. Mathematics 2020, 8, 1481. [Google Scholar] [CrossRef]
- Schmidt, L.A.; Trainor, L.J. Frontal brain electrical activity (EEG) distinguishes valence and intensity of musical emotions. Cogn. Emot. 2001, 15, 487–500. [Google Scholar] [CrossRef]
- Lin, Y.-P.; Wang, C.-H.; Jung, T.-P.; Wu, T.-L.; Jeng, S.-K.; Duann, J.-R.; Chen, J.-H. EEG-Based Emotion Recognition in Music Listening. IEEE Trans. Biomed. Eng. 2010, 57, 1798–1806. [Google Scholar] [CrossRef]
Figure 1.
Emotional dimension model. On the left is the valence–arousal (V–A) plane dimensional model of emotion, and on the right is the classification of category labels on the V–A plane.
Figure 1.
Emotional dimension model. On the left is the valence–arousal (V–A) plane dimensional model of emotion, and on the right is the classification of category labels on the V–A plane.

Figure 2.
System structure diagram: (a) Experimental procedures; and (b) Emotional classification process.
Figure 2.
System structure diagram: (a) Experimental procedures; and (b) Emotional classification process.

Figure 3.
SSAE emotional recognition.

Figure 4.
Distribution characteristics of EEG in various emotional states: (a) shows the distribution characteristics of power spectral density under three typical emotional states (grey is the measured value and black is the mean value); and (b) is the distribution diagram of the change of the average power of each band of EEG relative to the baseline power under various emotional states (10log10 (P/Pbase)).

Figure 5.
The average power distribution of the music segment reconstructed with different duty cycles. The upper graph shows the distribution characteristics of the average power variation of the α-β band under different duty cycles; the lower graph shows the variation distribution characteristics of the quantized Arousal and Valence values (the light green broken line in the graph is the percentage of the normal frequency and the total number of experiments).

Figure 6.
Personalized reconfigurable music-EEG library.

Figure 7.
Similarity evaluation of eigenvectors between stacked sparse auto-encoder (SSAE0 pre-learning and original under different emotion labels. Left, self-similarity evaluation (concentration); right, evaluation of diff-similarity (separability).
Figure 7.
Similarity evaluation of eigenvectors between stacked sparse auto-encoder (SSAE0 pre-learning and original under different emotion labels. Left, self-similarity evaluation (concentration); right, evaluation of diff-similarity (separability).

Figure 8.
Relationship between self-similarity, similarity difference, and emotional recognition rate: (a,b) show the distribution of self-similarity and similarity difference in the V–A plane, respectively. (c) shows the variation trend of similarity difference and emotion recognition rate under different emotional labels; and (d) shows the recognition and comparison results of four commonly used emotion classification algorithms.

Figure 9.
The variation trend of alpha and beta power, corresponding to different length of reconfigurable music segments: (a) The power change ratio of alpha and beta, corresponding to 5 s reconfigurable music segment (10 × log10(P/Pbase)); (b) the power change ratio of alpha and beta, corresponding to 10 s reconfigurable music segment (10 × log10(P/Pbase)); and (c) the power change ratio of alpha and beta, corresponding to 20 s reconfigurable music segment (10 × log10(P/Pbase)).

Figure 10.
Contrast diagram of reconfigurable music and complete music: (a) a comparison chart of the duration of the two under different emotional labels; (b) comparison of the number of emotional states between reconstructed music and complete music for different participants; and (c) comparison diagram of the correct recognition rate of reconstructed music and complete music for different participants.


Table 1.
Joint features.
| Delta | Theta | Low Alpha | High Alpha | Low Beta | High Beta | |
|---|---|---|---|---|---|---|
| PSD | Pdelta | Ptheta | Plow_alpha | Phigh_alpha | Plow_beta | Phigh_beta |
| Frequency | Fdelta | Ftheta | Flow_alpha | Fhigh_alpha | Flow_beta | Fhigh_beta |
| Addition | Hurst index | Wavelet entropy | Sample entropy | Palpha/Pbeta |
Publisher’s Note: MDPI stays neutral with regard to jurisdictional claims in published maps and institutional affiliations. |
© 2021 by the authors. Licensee MDPI, Basel, Switzerland. This article is an open access article distributed under the terms and conditions of the Creative Commons Attribution (CC BY) license (http://creativecommons.org/licenses/by/4.0/).
Share and Cite
MDPI and ACS Style
Li, Y.; Zheng, W. Emotion Recognition and Regulation Based on Stacked Sparse Auto-Encoder Network and Personalized Reconfigurable Music. Mathematics 2021, 9, 593. https://0-doi-org.brum.beds.ac.uk/10.3390/math9060593
AMA Style
Li Y, Zheng W. Emotion Recognition and Regulation Based on Stacked Sparse Auto-Encoder Network and Personalized Reconfigurable Music. Mathematics. 2021; 9(6):593. https://0-doi-org.brum.beds.ac.uk/10.3390/math9060593
Chicago/Turabian StyleLi, Yinsheng, and Wei Zheng. 2021. "Emotion Recognition and Regulation Based on Stacked Sparse Auto-Encoder Network and Personalized Reconfigurable Music" Mathematics 9, no. 6: 593. https://0-doi-org.brum.beds.ac.uk/10.3390/math9060593
Note that from the first issue of 2016, this journal uses article numbers instead of page numbers. See further details here.