
Using Artificial Neural Networks in Predicting the Level of Stress among Military Conscripts


General Jonas Zemaitis Military Academy of Lithuania, Silo 5a, 10322 Vilnius, Lithuania
*
Author to whom correspondence should be addressed.
Mathematics 2021, 9(6), 626; https://0-doi-org.brum.beds.ac.uk/10.3390/math9060626
Submission received: 17 February 2021
/
Revised: 4 March 2021
/
Accepted: 10 March 2021
/
Published: 16 March 2021
(This article belongs to the Special Issue Recent Advances in Applications of Fuzzy Logic and Soft Computing)
Abstract
:The present study aims to elucidate the main variables that increase the level of stress at the beginning of military conscription service using an artificial neural network (ANN)-based prediction model. Random sample data were obtained from one battalion of the Lithuanian Armed Forces, and a survey was conducted to generate data for the training and testing of the ANN models. Using nonlinearity in stress research, numerous ANN structures were constructed and verified to limit the optimal number of neurons, hidden layers, and transfer functions. The highest accuracy was obtained by the multilayer perceptron neural network (MLPNN) with a 6-2-2 partition. A standardized rescaling method was used for covariates. For the activation function, the hyperbolic tangent was used with 20 units in one hidden layer as well as the back-propagation algorithm. The best ANN model was determined as the model that showed the smallest cross-entropy error, the correct classification rate, and the area under the ROC curve. These findings show, with high precision, that cohesion in a team and adaptation to military routines are two critical elements that have the greatest impact on the stress level of conscripts.
1. Introduction
The demand for artificial intelligence in human stress management is growing with a better understanding of the damage to human health caused by chronic stress. Long-term stress has been found to have a serious impact on the gastrointestinal system, affect brain activity, and lead to depression [1], kidney disease [2], or even to different types of cancer [3]. In the military, stress may lead to the development of a post-traumatic stress disorder [4], and thus considerably reduce the quality of life [5]. In response to these findings, researchers have already developed different methods for measuring stress and presented different approaches for the causes of stress. The variety and diversity of identified causes of stress testify to the fact that classical methods of linear analysis are no longer sufficient. Artificial intelligence needs to be used to analyze diverse stress stressors that are measured in a stressful environment, such as the beginning of military conscription service. The start of conscription is marked by “stressors of social experience” [6] due to the specific nature of the situation, such as distancing from family and friends, being in a masculine-warrior narrative [7], having a strict and busy daily routine [8], and doing physically-demanding tasks.
It should be noted that artificial neural networks (ANNs) analyze stress data much better than other methods, including machine learning algorithms. There is very good evidence that ANNs analyze accrued data better than traditional methods of analysis, confirmed by Li [9]. The researcher used the data collected by Schmidt et al. [10] and developed two deep neural networks. These two neural networks examined data on physiological signals from electromagnetic devices (chest-worn and wrist-worn sensors) and reached much better accuracy than the original linear analysis.
Similar results can be found in studies on other topics where artificial network application indicates high accuracy and reliability. For example, Taherdangkoo et al. [11] researched a training algorithm that led to excellent results in terms of the goodness-of-fit and independence test. This is especially important in stress measurements, where even minor deviations can indicate significant long-term health effects.
Artificial neural networks have one additional advantage in predicting the level of stress. It is the ability to discover pathways underlying a complex set of data and to find a hidden association between stress factors. Hence, according to Vinga [12], an artificial neural network can investigate the complex associations between the level of stress and various stress factors. For example, researchers [12] have found that not only anthropometric parameters (e.g., height, weight, and body mass index) and results from blood tests (e.g., cholesterol and triglycerides) have an effect on stress. Their connectivity maps have highlighted the job-related social factors that are no less important than physical health in relation to stress levels.
Using nonlinearity in stress research in military conscription opens up new directions of research. In terms of the development of the theory, the nonlinearity in stress management requires a rethinking of how the new environment is experienced and how the process of psychological adaptation changes [13]. The application of ANNs enables us to analyze a combination of stress factors that are usually analyzed separately: military service-related factors and non-service-related factors [14], personal/lifestyle dependent factors [15] and group cohesion factors [16], and leadership. Previous attempts to analyze the level of stress in the military using machine learning (ML) methods showed good results for example, Karstof et al. [17] provided a forecast for long-term post-traumatic stress responses with high accuracy using ML methods. Their ML forecasting algorithms identified soldiers at risk for post-traumatic stress disorder with 95% accuracy prior to and just after deployment [17]. A very similar accuracy level (91%) was achieved in a study by Pavlova et al. [18], where it was found that subjective feelings about mental conditions best predicted anxiety among military conscripts. All together, these studies show that machine learning algorithms provide deep insight into stress-related data with high accuracy.
The importance of research in stress among military conscripts has grown with the change in the security situation in Europe, involving strengthening or renewing conscription in almost a third of the countries in the region [19]. More and more young people (mostly young men) temporarily become soldiers and enter a new and stressful environment. Stress is a risk factor for mental and physical health disorders, and as NATO Science and Technology Organization (NATO STO) reports point out, long-term stress may negatively impact soldiers’ attitudes towards following the laws of armed conflict [20] and also increase the risk of suicide [21]. It can be argued that managing long-term stress in the military has become an important area of research.
There is not much research focused on conscripts’ level of stress as an outcome of military service-related and non-related stressors. In contrast, most studies treat the level of stress as a cause of other adverse events or diagnosis. For example, the findings of Crump et al. [22] suggested that high levels of stress among conscripts may lead to hypertension and high body mass index. Other researchers investigated the contribution of stress to the smoking habits among conscripts [23] and adjustment issues [24]. Only a few authors investigated stress levels as an outcome. For example, Nilsson [25] identified a positive association between early life influences and the psychological level of functioning during the military conscription, while Purre and Oja [6] found a negative association between voluntary military conscription and the level of stress. Based on the research, the level of stress is determined not only by social circumstances, but also by physical-natural parameters. In order to combine these diverse parameters into one study, nonlinear methods of analysis need to be used.
The main purpose of the present paper is to elucidate the main variables that increase the level of stress at the beginning of military conscription service using an ANN-based prediction model. The variables represent diverse causes of stress: individual factors, such as personality and values toward military service; adaptation; military service-related factors, such as group cohesion and leadership; as well as non-service-related factors. ANN techniques were applied to data analysis and modeling as a methodology, which also provided the best results in previous literature on stress-level prediction [12,26]. The results obtained allowed us to build a stress prediction model for conscription with appropriate accuracy and to determine the effect of the explanatory variables. This prediction is of great demand in the practice of conscript stress management, as compulsory conscription brings a large number of young men to the military environment, which could affect the mental health of the local population in the future.
After a review of the study methodology, discussing the ANN approach applied in this study, the article explains the data collection methods and measures. For the data collection, a random sample of 111 conscripts in the first month of service, when the stress level is the highest, was selected. The main findings of preliminary analysis and parameter description for the neural network training and testing are presented, followed by a display of the case processing results. At the end of the article, we present the discussion that lays out implications for theory and practice and suggestions for future research.
2. Study Methodology
IBM SPSS 27v was applied with its functions of the multilayer perceptron (MLP) neural network. This function is designed for the measurements that minimize the error in predicting default. In this study, the neural networks architecture involved three different layers, which typically are known as: an input layer, a hidden layer that covers the radially symmetric functions and unsupervised learning [20,21,22] to describe the hidden neurons, and an output layer with a categorical node that allows us to calculate the weighted sum from the hidden layer outputs [22,23] and to compute the index class for the input pattern.
The model building was based on experimentation with various combinations of nodes in one and two hidden layer(s). As an experiment, the different partition rates of the dataset were randomly assigned for training, testing, and holdout: ANN1 = 50%–30%–20%, ANN2 = 60%–20%–20%, and ANN3 = 70%–20%–10%. Taking into consideration that a neural network builds a model by learning from a potential correlation between two type of independent (cause criteria) and dependent (effect criteria) variables, ANNs are able to justify the model outcomes by linking the predicted values with the factual values. In such applications, neural network systems are better than traditional computing systems that follow a set of instructions to resolve a problem.
2.1. The ANN Approach
Artificial neural networks (ANNs) are widely used computation procedures to help resolve multifaceted problems by simulating animal brain processes in a shortened method [23]. Perceptron-type neural networks (PTNNs) cover the artificial neurons (nodes). These nodes are the information processing units in PTNNs. Moreover, artificial neurons are systematized in layers and interrelated by synaptic weights (connections). According to this information processing style, the neurons can screen and communicate the data in an in-demand administered style to construct an analytical model that is able to classify the data stored in the memory.
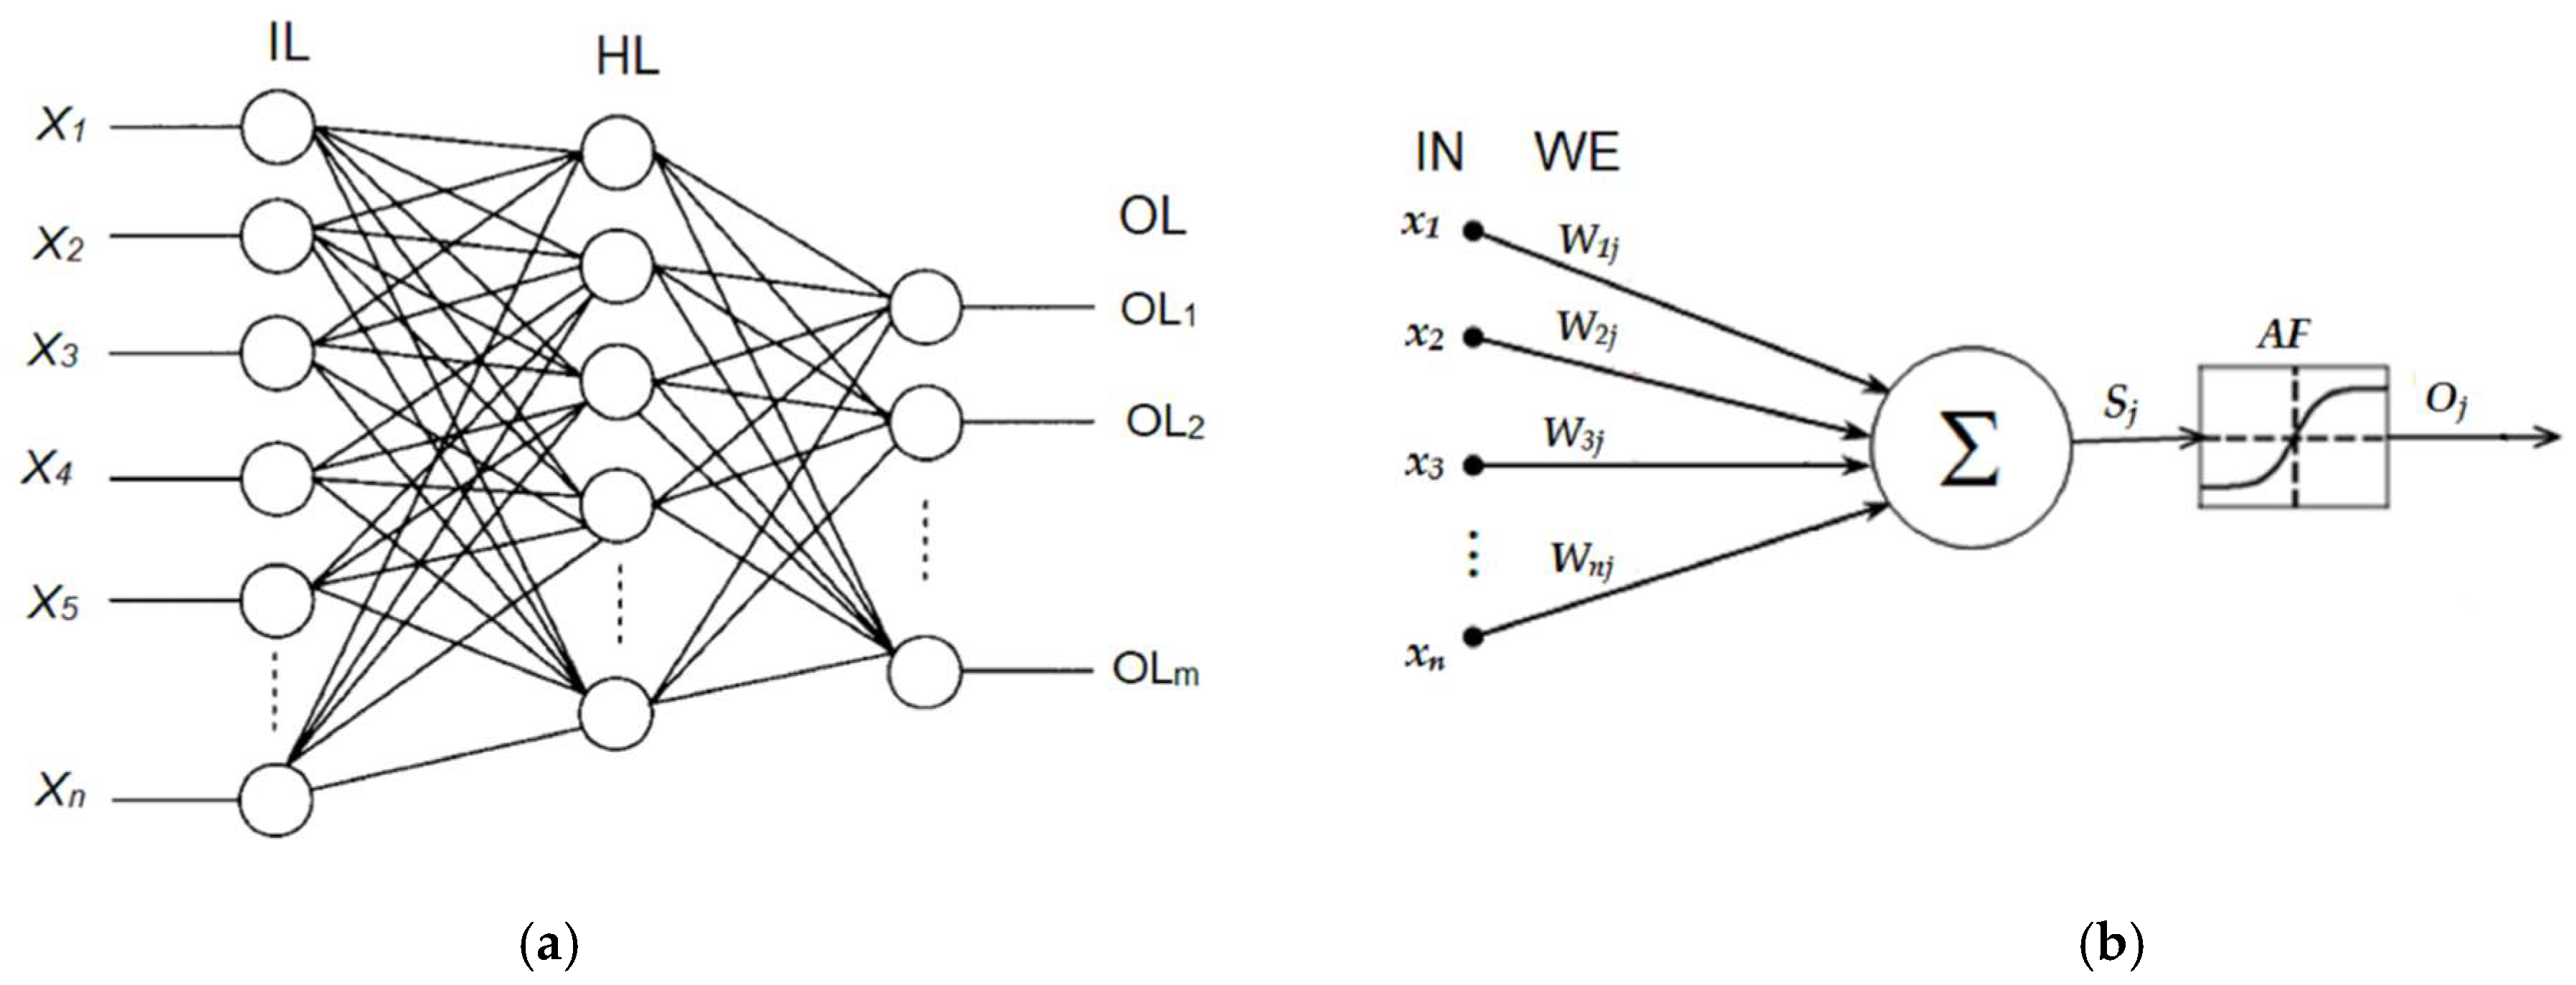
The ANNs typically are designed as three-layer network models of interconnected artificial neurons (the input layer, the hidden layer, and the output layer). It can be mentioned that there is the possibility for researchers to form one or more hidden layers between the input and output layers’ neurons. Moreover, the neurons belonging to the identical layer have no interconnections, but despite this, each neuron can be linked to another neuron in the subsequent layer (Figure 1).
The input layer collects statistics about variables from the constructed dataset, and then the hidden layer completes the data processing. The output layer is the layer that is designed to produce the categorical class label, and otherwise used to predict continuous measures (see Figure 1a). The input layer values toward the inside the hidden node are multiplied by weights, which are a set of prearranged values.
Later, all the measures are added to construct a single number, which is accepted as an argument to a nonlinear mathematical function, named in ANNs as the activation function (AF). The nonlinear AF returns the output as a number between 0 and 1. In Figure 1b, the net sum of the weighted input values entering node j and the output activation function (see Figure 1b) that converts the neuron’s weighted input to its output activation (the most frequently used is the sigmoid function) can be described by the subsequent equations:
The ANNs’ neurons have two process approaches—the training stage and the using stage. Throughout the training stage, datasets with authentic inputs and outputs are involved as examples to train the system to predict outputs. This controlled learning starts with random weights and, through the use of gradient origin examination algorithms such as back-propagation, corrects the weights to be applied to the problem at hand. The variance among target output measures and gotten measures is used in the error function to manage learning [12].
Moreover, the error function belongs on the weights, which must be improved in order to decrease the error. To explain the specified training dataset containing k designated pairs of n inputs and m dimensional paths, which can be described by n inputs and m outputs, and the error for each output neuron can be calculated using Equation (3):
and how to minimize the error function of the network can be presented by Equation (4):
where is the output yield when input design from the training dataset passes in the network, and is the target measure [24]. In the training stage, each weight is transformed by accumulating quantity to its earlier value:
where the learning rank is measured by constant γ. According to the rule, the higher learning rank shows faster convergence, but it is not very good decision to look for the high validation measures of data training, because this search path may wrap around the ideal explanation and convergence may turn out to be unrealizable. After a dataset of respectable weights has been originated, the neural network model can take an alternative set with unidentified output measures and forecast the corresponding outputs automatically.
2.2. The Multilayer Perceptron Approach
The perceptron-based model described above is fairly restricted; it is only typically appropriate for linearly identifiable data. In case of a non-linear dataset, the perceptron-based model is extended to a more multifaceted construction, specifically known as multilayer perceptron (MLP) [25,26,27,28]. Moreover, MLP can be described as a neural network with neuron layers that are interconnected, so that the output of a neuron in a layer is only allowed to be an input to neurons in the upper layer (see Figure 1). Furthermore, it means that, if non-linear activation functions, such as the sigmoid function, are used for those neurons (see Figure 1b), then
As such, the MLP neural network is capable of encompassing the high non-linearity of the dataset, which proves that it is possible to approximate any continuous function at the random minor error by applying complex-enough MLPs. The weight of the link from the i-th neuron in the l-th layer to the j-th neuron in the -th layer, or can be used in order to validate the i-th neuron in the l-th layer, which can be described by the equation:
where are the output, activation function, and bias, respectively; and is the number of neurons for the l-th layer. Additionally, that was symbolized as y0i ≡ xi. For simplicity, a neuron is activated by the sum of weighted outputs of the neurons in the lower layer. A MLP network training procedure is used to minimize an objective function with regard to its criteria (i.e., weights and biases), which is connected to the task that the MLP is used for. Moreover, the following target function for the binary classification can generally be used:
where D is a set of training data, can be presented as the MLP output of the prearranged input x, and θ is its dataset of weights and biases. In case of a need to reduce the objective function E(θ), the gradient method can be used, which states that the sum of an update for a parameter is negatively proportionate to the gradient at its current value.
The center point of the gradient descent method is used to compute the gradient σE/σw for all w ∈ θ, which is easily done using the chain rule:
That is the main idea of the back-propagation algorithm (BPA). The BPA changes ANN weights to lessen the mean squared error among the looked-for and the actual outputs of the network. BPA uses controlled learning in which the neural network is trained using a dataset for which the input, as well as the desired outputs, are known [29]. After the training process, the network weights are identified and then are used to compute the output measures for the original input samples.
The feedforward algorithm is the calculation method that allowed us to quickly complete the prediction by an MLP (Figure 1a). The algorithm indicates that x is primarily computed by the outputs of the neurons in the primary layer, and later the outputs of the neurons in the second layer are computed, and the process continues until the top layer is reached.
2.3. The Number of the Necessary Hidden Units
The computing of the essential number of hidden units (NHUs) in an MLP is important to realize a specified approximation order. Also, the NHUs influence both the achievement of the given approximation instruction for the randomly sufficient smooth function and the number of independent values to be adjusted by varying the network parameters.
Moreover, the computing of a number of MLP parameters is not so straightforward. Furthermore, the specified NHUs of the network parameters is not single. This situation can be described in case the hidden units are distributed in dissimilar hidden layers in numerous different ways. Meanwhile, the purpose is to find the essential NHUs, and it is also important to define the maximum quantity of the parameters when the number of hidden units is given [30].
In a multilayer perceptron neural network with one hidden layer, where n0 ∈ inputs and the smooth activation function can only implement an approximation order N ∈ for all functions f ∈ CN (K →), if at least n hidden units are used, the following equation can be obtained:
According to this main outcome, no limit on the quantity of hidden layers is expected. It has come to light that more than two hidden layers are not required. Typically, one hidden layer if sufficient, but in various situations the needed hidden units must be spread to two hidden layers in order to complete the required quantity of network constraints. This can be defined using the resulting Equation (13):
where n hidden units (Equation (14)) are important to complete approximation order N ∈ for all functions f ∈ CN (K →):
Otherwise, the hidden units necessary to achieve a given approximation order can be calculated using the Equation (15):
The multilayer perceptron neural network with one hidden layer can realize the required quantity of parameters, but if two hidden layers are used, the necessary number of parameters for the MLP neural networks can be found by Equations (16) and (17):
The presented equations (Equations (12)–(17)) can be appropriate for the computation of the quantity of the required hidden units and its variation to one or two hidden layers if the number of inputs is known [30].
3. Data Description
3.1. Ethical Statement
The investigation was accepted by the Vilnius Regional Biomedical Research Ethics Committee, protocol # 2020/10-1275-754. All participants provided informed written consent prior to data collection.
3.2. Sample and Data Collection
A random sample of 111 conscripts in their first months of service, when the stress level is the highest, was selected. The data were collected in one battalion of the Lithuanian Armed Forces during the COVID-19 pandemic, when additional restrictions were in place, in line with health safety guidelines. The majority of the sample had secondary education (73.0%) and the average age of 20.3 years. Research was performed using traditional paper questionnaires presented in the Lithuanian language.
3.3. Measures
Conscription-related stressors are measured using general and military-specific research instruments. The level of perceived stress (dependent variable) was analyzed in regard to: (1) the impact of individual factors [31], (2) adaptation [32,33], (3) group cohesion [34], (4) leadership [35], and (5) non-service-related stressors. Accordingly, we developed our own questionnaire composed of several parts.
The level of perceived stress (PS) was measured using the standardized Cohen’s 10-item Perceived Stress Scale (PSS-10) based on a five-point scale [36,37]. Originally developed in 1983, the PSS-10 is a classic stress assessment instrument that helps explain how events and changes affect perceived stress. The sum of 10 items ranges in the interval 0–40, with the higher value demonstrating higher perceived stress. According to the rule, all PSS scores were divided into three groups: the first group included scores varying from 0–13 (measured low stress); the second group had scores varying from 14–26 (measured moderate stress); and the third group had scores varying from 27–40 (measured high perceived stress). The Cronbach’s alpha for these 10 items was 0.853 in the current study, which is similar to the previously reported results ranging from 0.80 to 0.86 [36,38].
Personal attitude towards military (ATM) is another strong stressor during conscription and, according to Salo [39], it is associated with negative coping strategies. In our study, we used six items from his scale on commitment to military service, such as “it is important to me to perform well in the military”.
Adaptation was measured by a seven-item scale on adjustment to a new physical environment (ADJ). Additionally, engagement (ENG) into a new role was disclosed by means of the nine-item Utrecht Work Engagement Scale (UWES-9) [40], modified for the military context.
Group cohesion was measured using a list of 33 items. The items were developed using and adopting the Group Cohesion Scale-Revised [41,42] and the Scale of Team Learning Behavior in the Combined Joint Staff Exercise (CJSE) [43]. All cohesion items were divided into four groups: social cohesion (CTE), task cohesion (CPE), norm cohesion (CIN), and psychological safety in the squad (PSY). Squad leadership (SLE) was measured by a four-item scale of exemplary leadership. Exemplary leadership in the military is a background for moral influence and for military identification to occur [44], which leads to lower levels of stress [45].
Non-service and non-social military environment-related stressors (D1, D2, D3, D4, D5, and D6) were used to assess conscript stressors in a full spectrum and to not limit the study to only the stressors of military experience. A six-item scale was adopted from Salo’s [45] list of events outside military service, such as quarrels at home and similar events as well as other stressors that are not related to the social environment in the military.
To this end, one dependent variable, nine independent variables, and six events outside military service, or non-social military environment-related variables, were used. The variables and their explanation are presented in Table 1. For the conducted neural network investigations, individual factors, adaptation, group cohesion, leadership, and non-service-related factors were included as independent variables. The dependent variable was the level of perceived stress: low stress, moderate stress, and high stress.
4. Research Results
The IBM SPSS Statistics 27v was used to construct the neural network models and to examinate their precision. The investigations according the ANN models’ construction, training, and testing stages are presented below.
4.1. Preliminary Analysis
The analysis starts with the descriptive statistics of the nine variables, providing the frequency rates and percentages for the categorical variables (see Table A1 in Appendix A) and the means, standard deviations and skewness for the continuous variables. The results are shown below (see Table 2).
Additionally, the Pearson’s correlation coefficient was used to evaluate the relationships between the constructed variables. This analysis helped to identify a significant correlation between the perceived stress construct (variable) and other variables at the 0.01 level (two-tailed) (see Table 3).
The highest significant negative correlation was identified among the perceived stress scale (PSS) and the adjustment to a new physical environment (ADJ, r = −0.553, p < 0.001), while significant positive correlation with PSS scores showed psychological (un)safety in the group variable PSY (r = 0.313, p < 0.001). Also, a significant negative moderate correlation was observed between the PSS and the engagement (ENG, r = −0.497, p < 0.001), and between the PSS and the cohesion interpersonal result (CIN, r = −0.469, p < 0.001). Furthermore, significant positive high correlation coefficients were observed for the cohesion in performance (CPE) and the cohesion in team (CTE) (r = 0.681, p < 0.001); engagement (ENG) and the value for attitude towards military service (ATM) (r = 0.672, p < 0.001); and the adjustment to a new physical environment (ADJ) and engagement (ENG) (r = 0.654, p < 0.001).
The statistically significant correlation coefficients between the perceived stress construct and targeted variables suggests that the lower coefficients are the adjustment to a new physical environment, engagement, and interpersonal cohesion, and the higher coefficient is the stress level. Moreover, the correlation analysis demonstrated that psychological unsafety in the group is a positive significant factor in predicting the level of stress.
4.2. Parameter Description for Neural Network Training and Testing
It is important to establish an acceptable structure with the appropriate number of hidden layers and neurons, since too many neurons can result in over-fitting, while using too few neurons can be insufficient for data processing. With this in mind, the MLP neural networks were chosen for data analysis; they were trained using the back-propagation learning algorithm and the method of gradient descent was used to update weights in order to gradually minimize the error function. Different partition rates of the dataset were randomly assigned for training, testing, and holdout: ANN1 = 50%–30%–20%, ANN2 = 60%–20%–20%, and ANN3 = 70%–20%–10%. The logic of the conducted analysis was to evaluate the model functions under strict conditions and demonstrate the explicit and solid association.
Thus, the data training results of 50%, 60%, and 70% were tested with 30% and 20% iterations. The training sets were adopted to represent moderate and strict conditions for training, and moderate and low conditions for testing. Before training, all covariates were standardized using the formula (x−mean)/s.
The model building was determined using the scaled conjugate gradient algorithm with a few parameters: initial lambda, initial sigma, and interval center as well as the interval offset. Moreover, the parameters of interval center, ao and a, forced the simulated annealing algorithm to generate random weights between ao − a and ao + a, and as such repeatedly minimized the error function. Furthermore, the initial lambda was set to 0.0000005 and the initial sigma was set to 0.00005. Also, zero was defined as the interval center and the interval offset was established to ±0.5. The basic MLP configurations are summarized below in Section 4.3.
4.3. Results of Case Processing
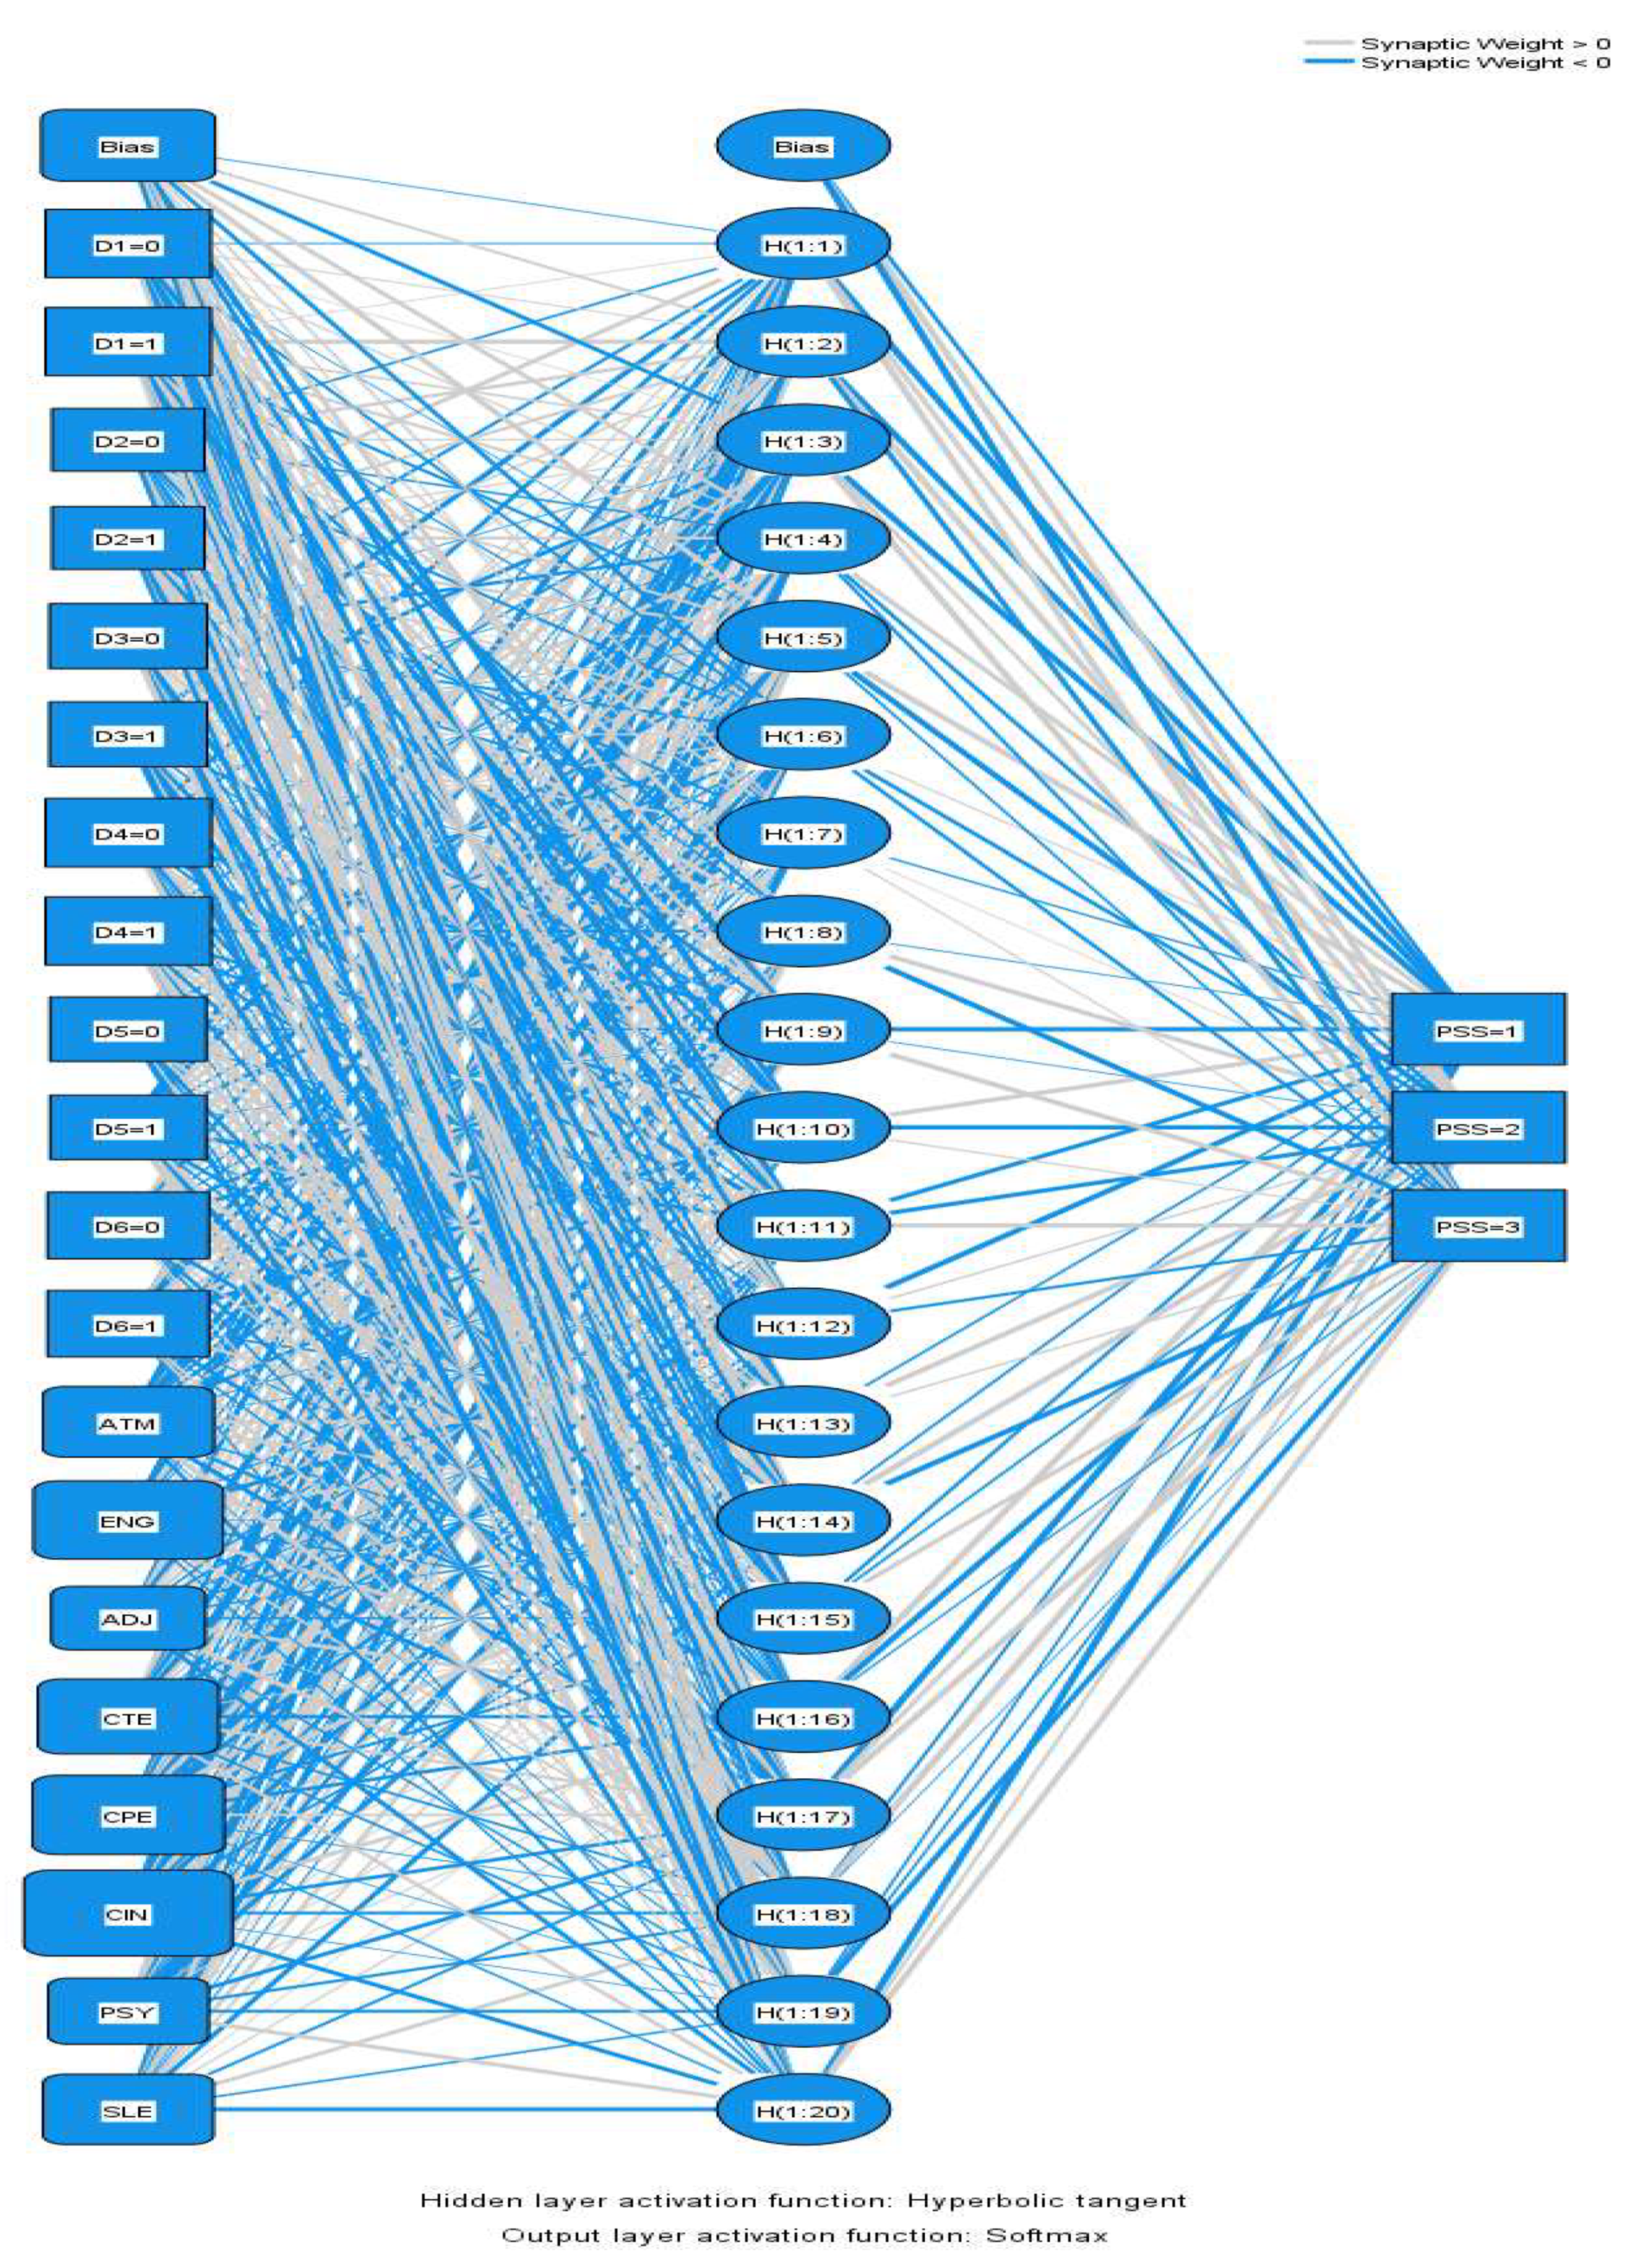
In this analysis we examined whether the MLP neural network identifies the main stressors of conscripts’ perceived stress by analyzing self-reported data. Table 1 provides information about the datasets used to build the three ANN models. Table 4 shows the number of neurons in each layer and 14 independent variables: ATM, ENG, ADJ, CTE, CPE, CIN, PSY, SLE, D1, D2, D3, D4, D5, and D6. The MLP neural network was designed by automatic architecture and had three nodes for the hidden layer computation and three nodes for the output layer to describe the dependent variable perceived stress results by categories. The different functions were used for different layers: the activation function was used as the hyperbolic tangent for the hidden layer, and the softmax function was used for the output layer. Furthermore, the model’s validation, in case of the use of the softmax function, was assessed by cross-entropy as the error function.
The IBM SPSS 27v program was used to predict perceived stress (variable PSS: 1 = low stress, 2 = moderate stress, and 3 = high perceived stress) using the 14 variables (see Table 1). The network diagram is shown in Figure A2 (see Appendix B), which represents the diagram with 14 input nodes, 20 hidden nodes, and 3 output nodes in the conscripts’ perceived stress measurement according to the three categories.
The summary for the designed models provides information on the results of the training (and testing) and holdout sample, as shown in Table 5.
The cross-entropy error was used for both the training and testing samples; meanwhile, it is the error function that the neural network minimizes throughout the training stage. Moreover, the ANN2 model was identified to have the smallest cross-entropy error value (7.422), indicating the model’s capability to predict the perceived level of stress. According to the research results, the ANN2 model’s percentages of inappropriate predictions constructed on the training and testing sample were 1.5% and 22.2%, respectively, while the degree of improper predictions in the holdout dataset equaled 32.0%. The training procedure was performed until one consecutive step with no decrease in the error function was achieved. Additionally, the synaptic weights, which were computed using the statistics of the training dataset only, are presented in Table S5.5, Supplementary Materials. A description of the ANN2 model case classification (i.e., the confusion matrix) for the PSS as a categorical dependent variable, by partition, and in total (see Table 6). The forecast outcome by the ANN2 model for each case was defined as correct if the predicted probability was bigger than 0.5. As seen in Table 6, the ANN2 network correctly classified 66 cases (out of 67) of stress measured by the three categories in the training data sample and 14 out of 18 variables in the testing sample. Overall, the designed model ANN2 properly classified 98.5% of the training cases and 77.8% of the testing cases.
In the holdout sample, the low stress rate (or low stress, moderate stress, or high perceived stress rate), assumed by the equation , was found to be 75.0%, the predicted moderate stress rate was 76.5%, and the high perceived stress rate, , was 50.0% with 72.0% accuracy of the model.
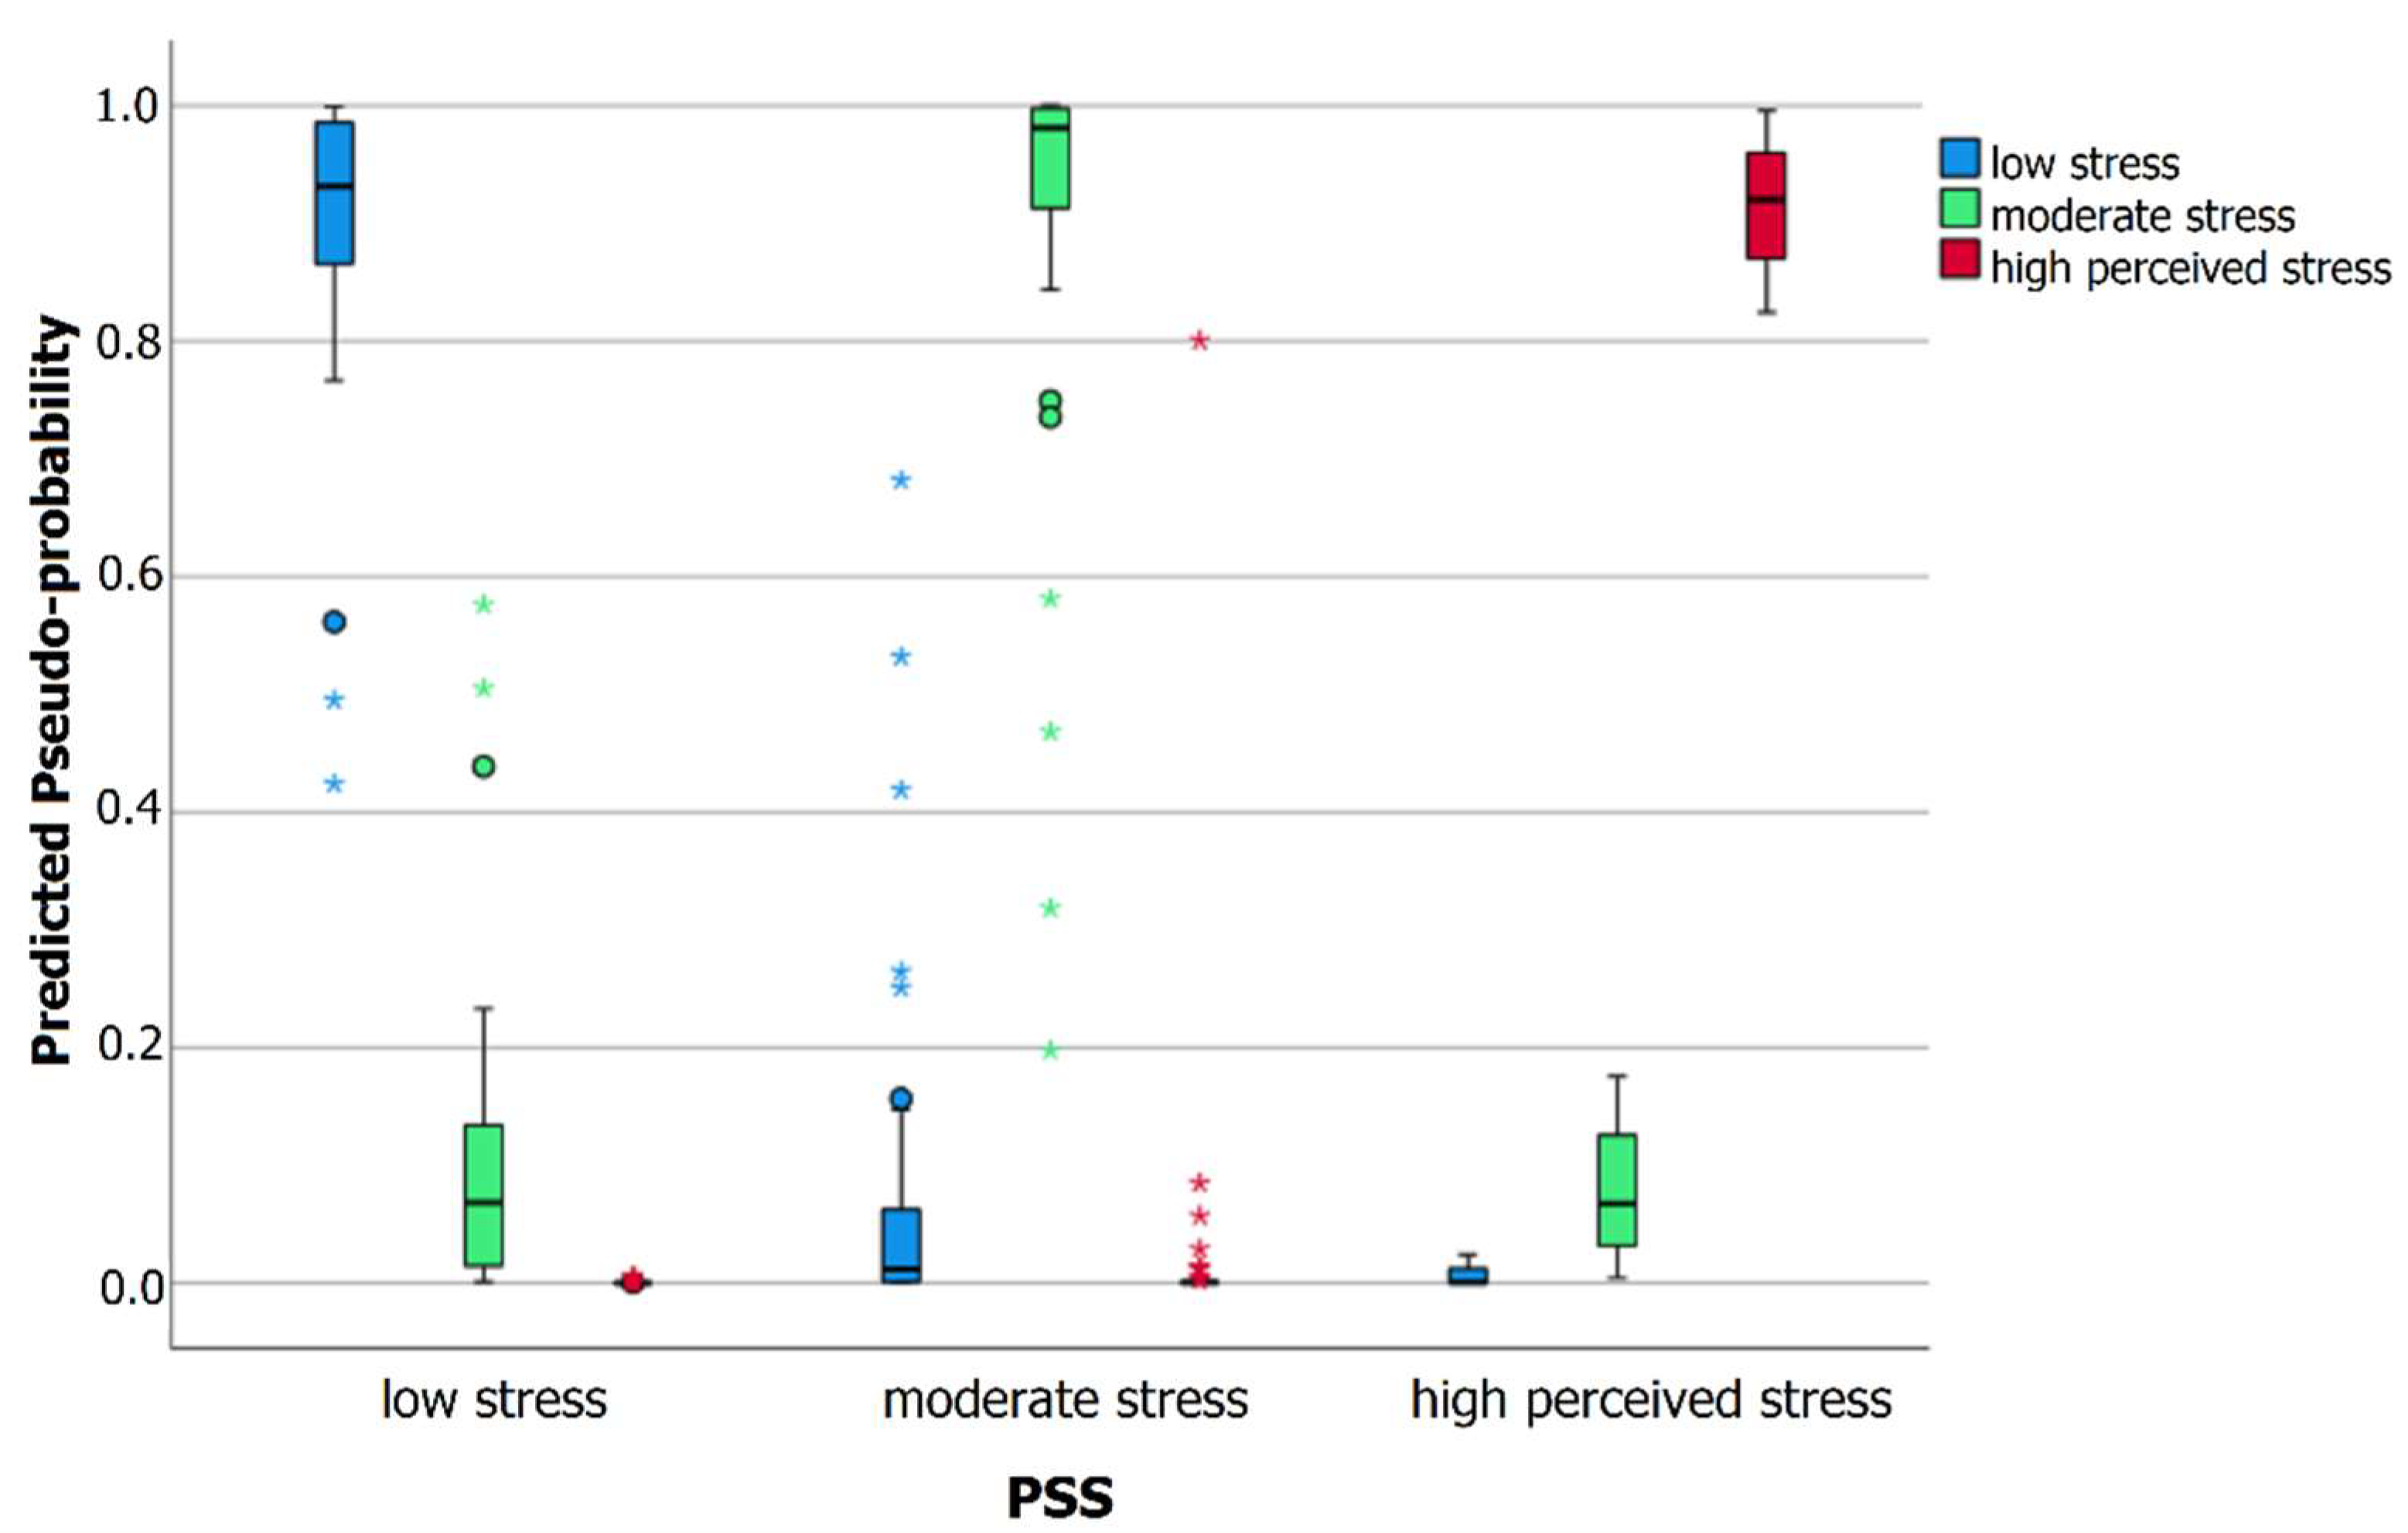
Additionally, the conducted analysis results from the IBM SPSS 27v software presented the ANN2 model’s predicted pseudo-probability for the three perceived stress categories of the PSS variable in a box-plot diagram. This specific graph separately illustrated the predictions for the three categories of the dependent variable PSS. Moreover, it should be pointed out that this diagram shows box plots that categorize the predicted pseudo-probabilities based on the whole analyzed dataset. According to the rule, for each box plot in each different category, the values above 0.5 can confirm the correct predictions.
Subsequently, the box plot developed on the ANN2 model showed the predicted probability of the observed level of stress in the three categories: low stress, moderate stress, and high perceived stress. The detailed analysis of the diagram should be started from left side, or the low stress category. The first box plot from the left indicated low levels of stress, while the second box plot demonstrated the probability for moderate perceived stress to be classified in the low stress category, although it actually was in the moderate stress category. The third box plot had the zero value for outcomes that are indicative of the high perceived stress category in the low stress category and in the moderate stress category. Furthermore, the probabilities predicted by the ANN2 model for all three stress groups in the high perceived stress category showed that the probability of the high perceived stress category was close to one, the low stress probability in the high stress group was equal to zero, and the moderate stress group probability was also close to zero. These findings let us concluded that the ANN2 model properly classified the cases (see Figure 2).
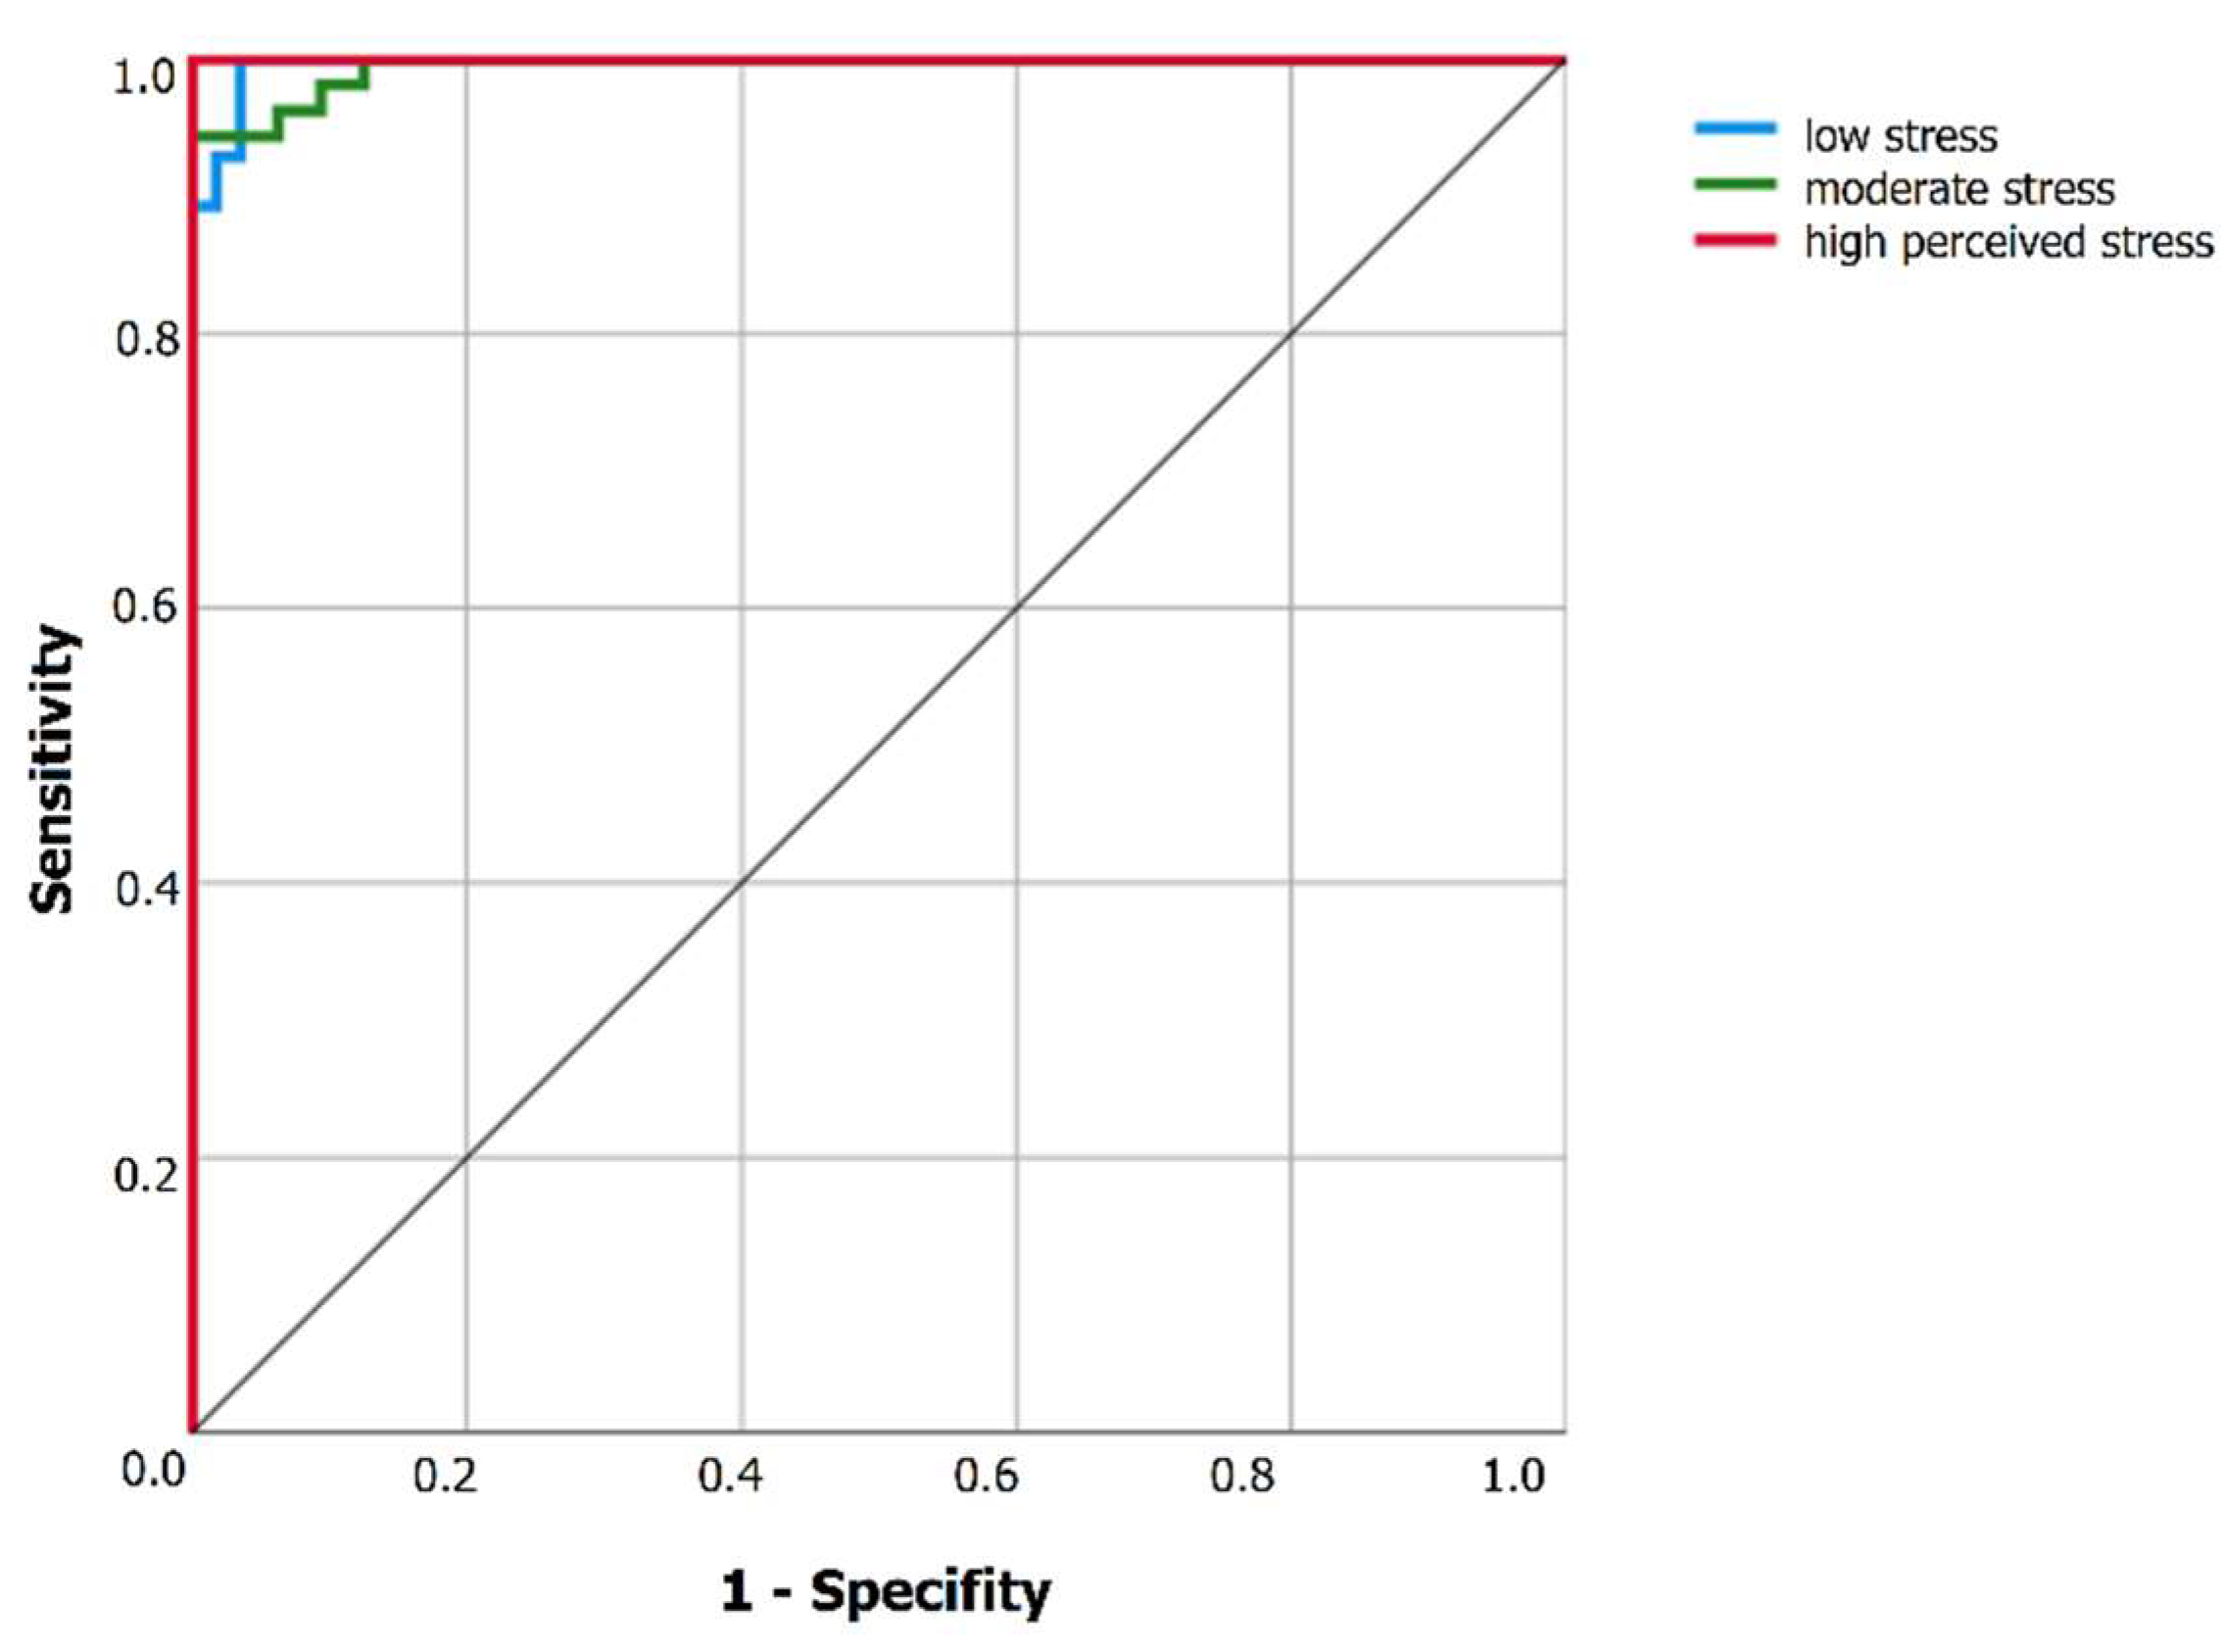
With further processing, the ANN2 model was validated by the ROC curve, which showed the classification performance for all possible cutoffs by a diagram of sensitivity versus specificity. The measures of sensitivity and specificity for the designed ANN1, ANN2, and ANN3 models were presented as an area under the curve (AUC), which presents the entire position of the ROC curve according to the PSS variable’s three stress categories: low stress, moderate stress, and high perceived stress (see Table 7).
The area under the curve, used as the dimensional index, helped to summarize the general location of the ROC curves for each designed ANN model according to the three perceived stress categories. This information was of great importance; meanwhile, it also has a meaningful explanation for scholars. The AUC presented in the Table 7 can be described as the probability that a randomly selected conscript can be rated or ranked correctly if he is more likely to perceive stress. This interpretation is based on non-parametric Mann–Whitney U statistics that are used in computing the AUC. Additionally, the maximum AUC = 1.000 (ANN2, PSS group 3, Table 7) showed that perceived stress measured by the chosen variables as a biomarker had high predictive ability to discriminate conscripts who had perceived high stress at the beginning of military conscription service.
Figure 3 gives the sensitivity and specificity (1—low stress, 2—moderate stress, and 3—high stress) diagram, constructed on the training and testing illustrations. The 45-degree line from the upper right angle of the chart to the lower left characterizes the situation of randomly guessing the category. The more the curve goes away from the 45-degree reference line, the more precise the classification. The area under the curve was measured and the best result of 1.000 appeared for the high-level stress category (0.995 for the moderate stress category and 0.997 for the low stress category). Figure 3 presents the results of the ANN2 model under the ROC curve with research data divided for analysis in the following way: training = 60%, testing = 20%, and holdout = 20%.
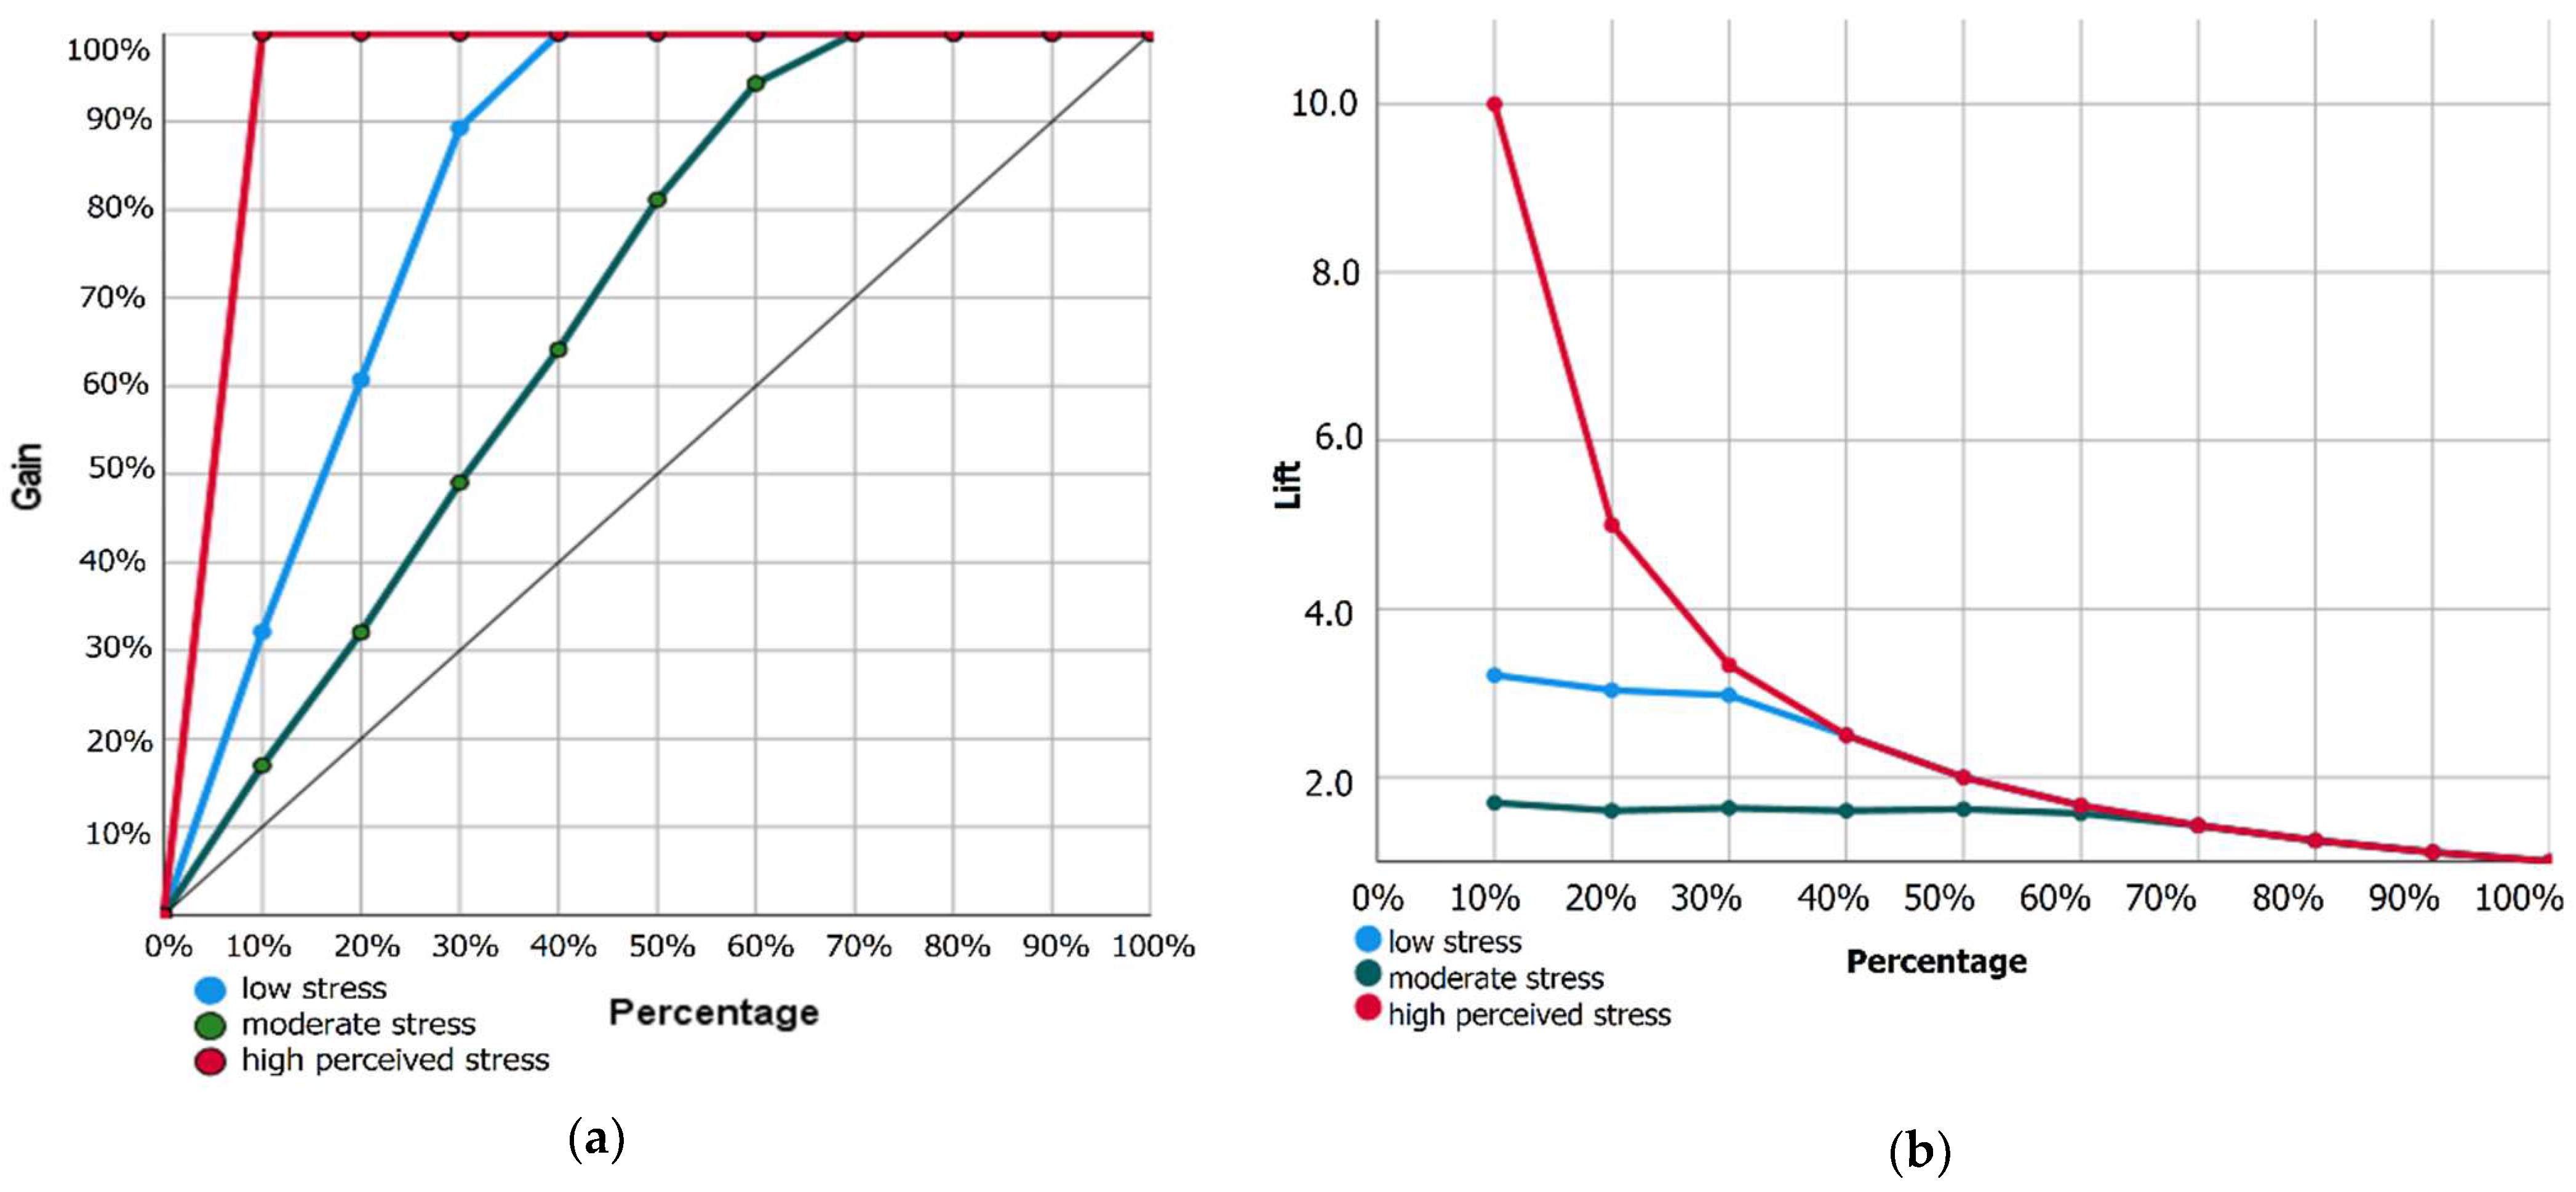
Furthermore, the cumulative gains, i.e., the illustration of the precise classifications found by the ANN model against the correct classifications that could be chance outcomes (i.e., without using the model), are shown for the ANN2 model in the chart in Figure 4.
The ANN2 model performance in the gain chart (see Figure 4a) illustrates that the high perceived stress category, according the third point on the curve, was at (10%, 100%); so, if the network scores these data and sorts all of the conscripts by the foreseen pseudo-probability of high stress, the top 10% would be expected to cover approximately 100% of all of the cases that take the high perceived stress category. Moreover, it is not important to select 100% of the scored data to find all of the identified high perceived stress samples in the dataset. This means that the gain chart displays the effectiveness of the classification calculated by the neural network model.
According to the baseline and the curve position, we can identify how great is the gain. It can be concluded from this rule and the chart in Figure 4a that the constructed model shows a higher overall gain and indicates perfect performance for the high perceived stress group and low stress group, but that the moderate stress group is not very precisely predicted.
Lift diagrams, as well as gain diagrams, are graphical supports for assessing the performance of classification models (see Figure 4b). Nevertheless, in dissimilarity to the confusion matrix that estimates models on the whole population, gain or lift diagrams only estimate model performance in a part of the population. Moreover, the lift graph uses a part of the data to give a clear view of the advantage to using a model, in contrast to not using a model. The measures from the gains chart were used to compute the lift aspect (i.e., the benefit): the lift at 100% for the high perceived stress group was 100%/10% = 10.
The importance of the assessment of independent variables in the designed neural network models is illustrated in Table 8. The conducted analysis showed that the CIN had the highest indication of all predictors (normalized importance=100%). This highest normalized importance for CIN was identified only in the constructed ANN2 model (see Table 8).
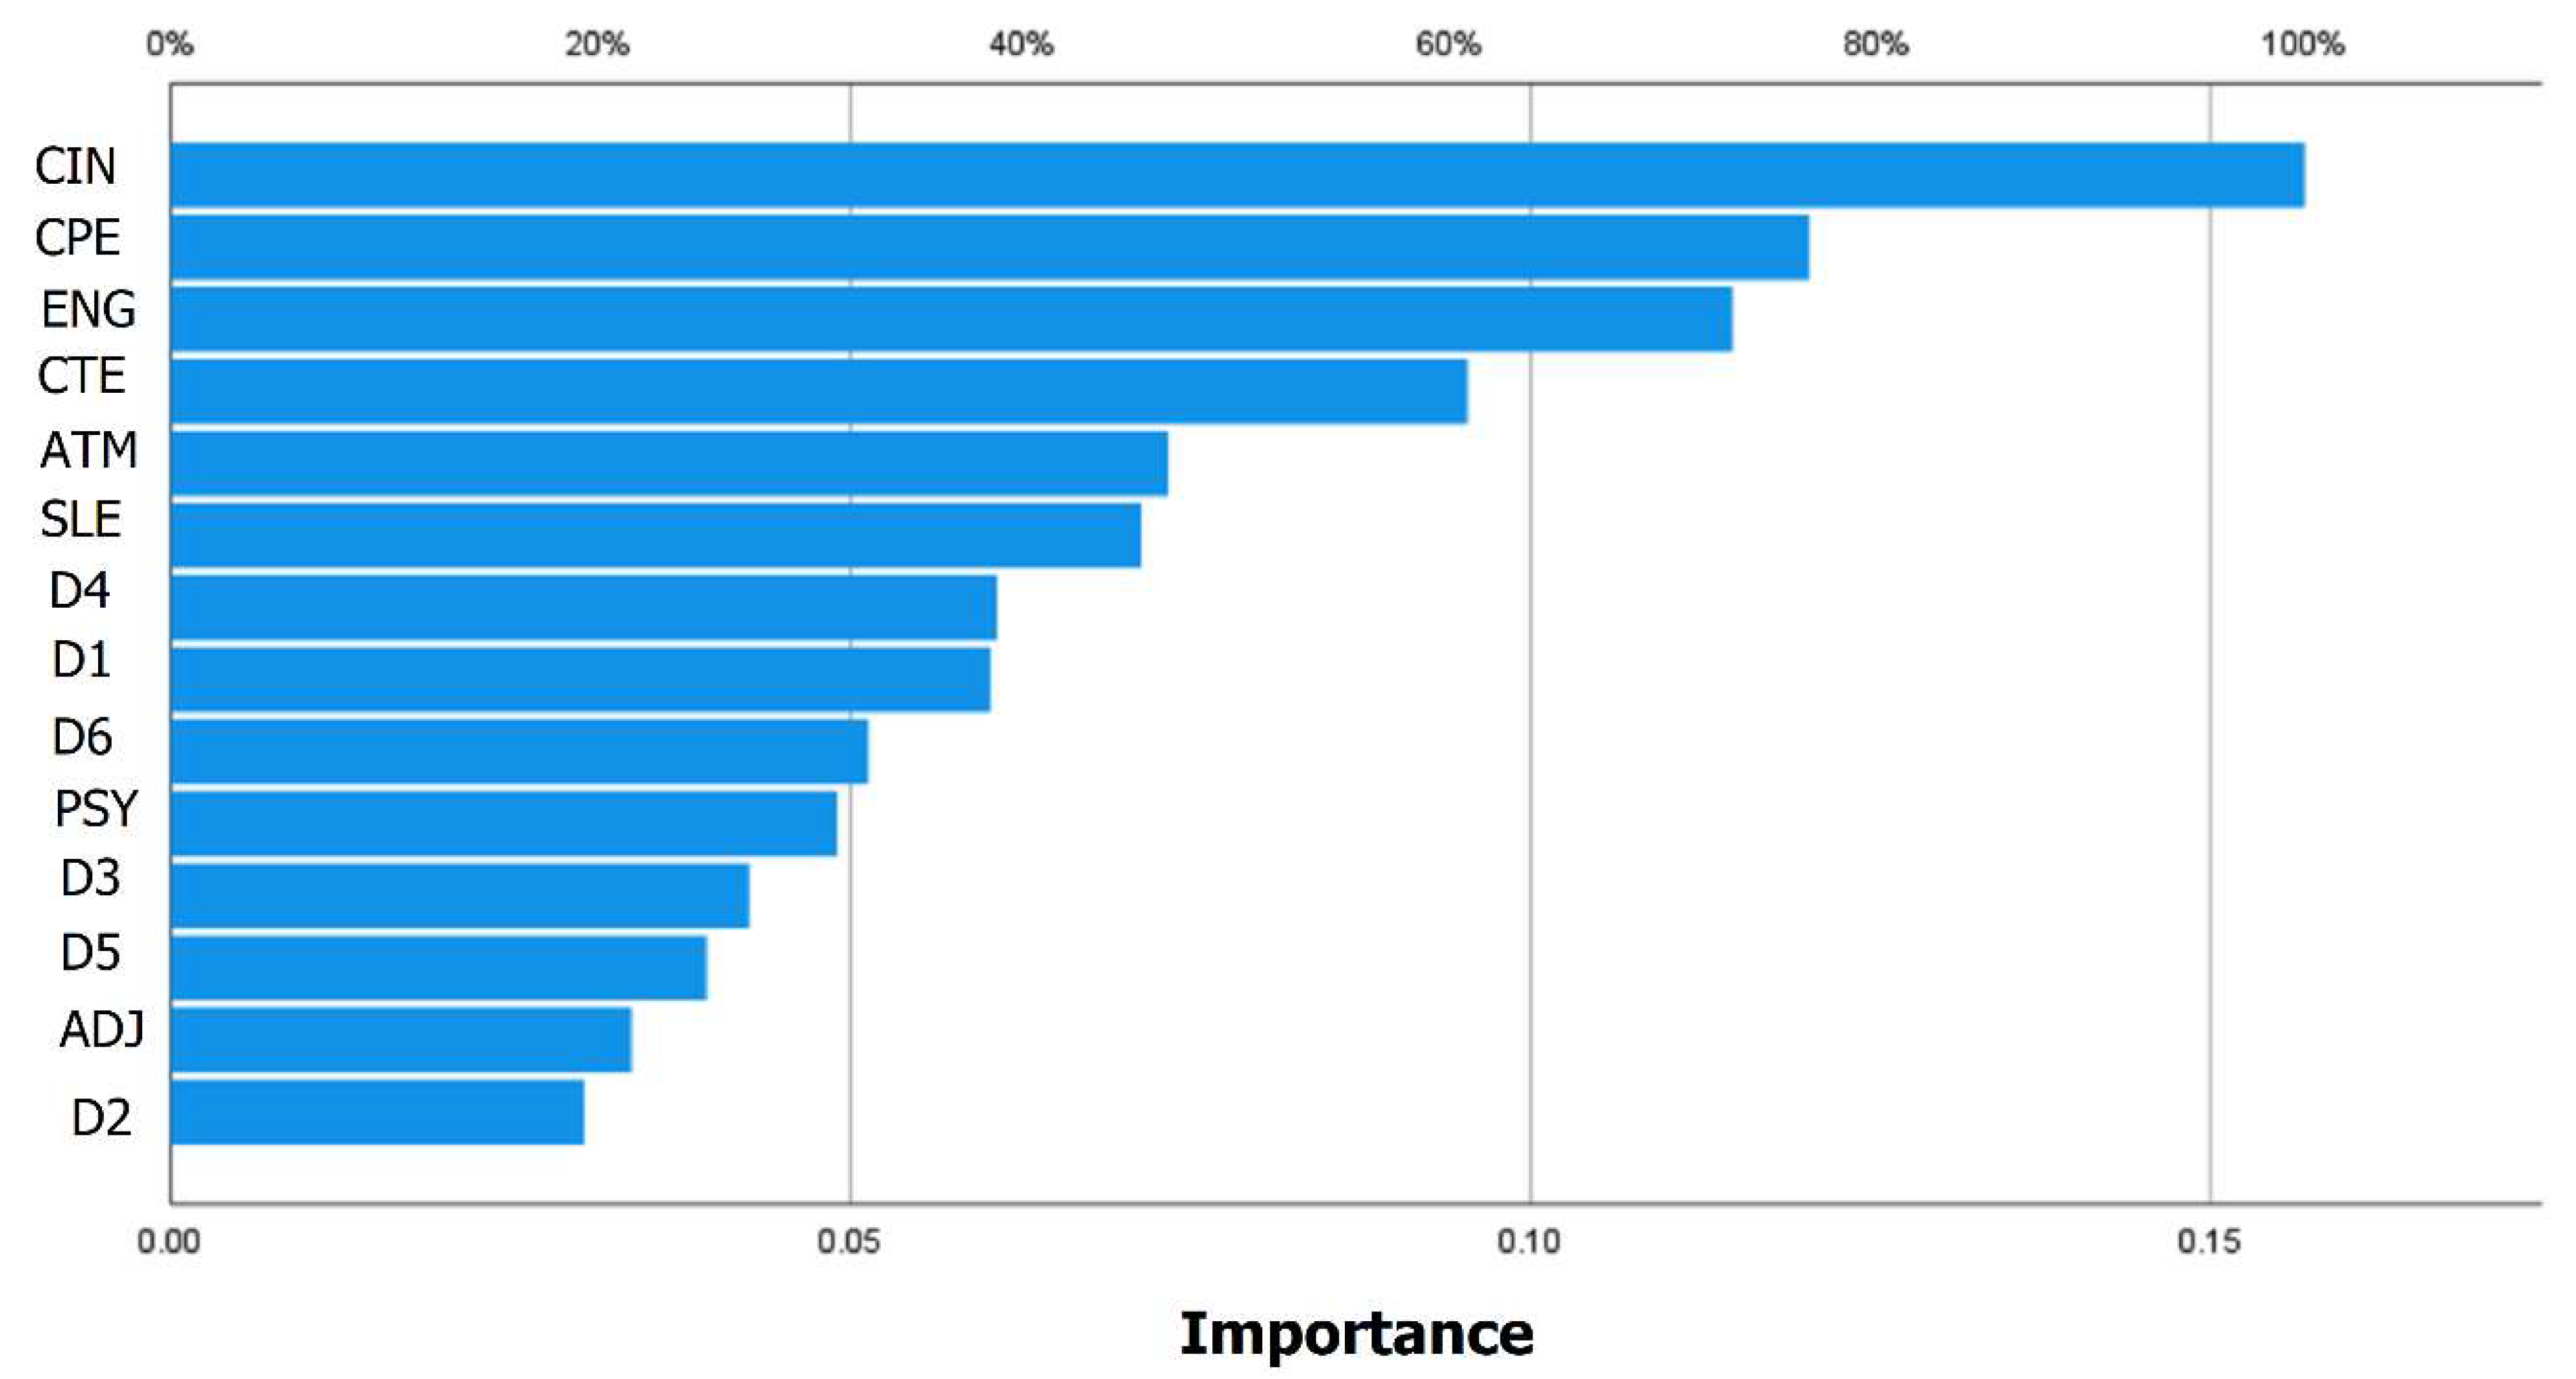
The impact of each independent variable, in terms of relative and normalized importance, identified in the designed ANN1, ANN2, and ANN3 models is displayed in Table 8. Additionally, the charts for the ANN1, ANN2, and ANN3 model are presented for a better illustration of the stressors and their importance for stress increases (see Figure A1, Appendix B).
When analyzing the results, it should be noted that CIN (norm cohesion) had the highest indication of all predictors (normalized importance=100%) in the designed neural network models in terms of assessing the importance of independent variables. Other predictors with the highest magnitude were task cohesion, indicated by CPE (normalized importance = 76.70%), engagement (ENG, normalized importance = 73.20%), and social cohesion (CTE, normalized importance = 60.80%). Next in the order of importance were two indicators found to be very close to the 50% threshold: attitude towards military service (ATM, normalized importance = 46.80%) and squad leadership (SLE, normalized importance = 45.50%). Other important predictors included conscripts’ personal negative experiences, such as quarrels with close persons (D4, normalized importance = 38.70%), financial problems (D1, normalized importance = 32.70%), and other strong negative experiences (D6, normalized importance = 32.70%). Surprisingly, psychological unsafety in a group was found to have low effects on the level of perceived stress (PSY, normalized importance = 31.20%). Moreover, the adaptation to military routines (ADJ, normalized importance = 21.60%) and disease or injury (D2 normalized importance = 19.40%) showed the lowest levels of stress (see Table 8).
5. Discussion
Using nonlinearity in stress research helps answer the complex question of which of the stressors are the most important in the situations when numerous and diverse stressors of social and physical experience occur.
A multilayer perceptron neural network was trained by the back-propagation algorithm to yield the main stressors that gradually increase the level of stress at the beginning of military conscription service. Though stress in the military has been widely explored in the scientific literature, especially in the field of military psychology, this study sought to predict what stressors are the most important in periods of a fundamentally changing social and physical environment in which civilians temporarily become soldiers. Specifically, we found that cohesion in a team and adaptation to military routines are two critical elements that have the greatest impact on the level of conscript stress. Given the inverse relationship between the level of stress and these two factors, we can predict that managing conscript-team cohesion and new-soldier adaptation in military units could prevent high levels of stress.
To develop a model based on neural network performance for the identification of main stressors, numerous ANN models in the MLP structure were created and tested to point out the ideal number of neurons, hidden layers, and transfer functions; these findings go in line with the results of other researches [46]. The study results, shown in Table 5, let us conclude that the most appropriate model was MLPNN (ANN2), trained with 14 middle components for the input parameters (6–2–2) with 14 input neurons, 20 hidden neurons, and 3 output factors. The outcomes of the model trained with a threshold function hyperbolic tangent showed the smallest cross-entropy error values (7.422 and 6.147) for training and testing, respectively. This indicated that the ANN2 model, in which data were divided for training, testing, and holdout by 60%–20%–20%, respectively, with hyperbolic tangent used as the activation function in the hidden layer and the softmax function used in the output layer, yielded a better validation result and proved the model’s high capability to predict the perceived level of stress in the three layers.
Moreover, establishing an acceptable construction with the appropriate number of hidden layers and neurons was significant for the precise identification of criteria for increasing stress. Also, the accuracy of the networks was measured using a ROC curve, cumulative gains, and lift charts, which are constructed on the combined training and testing examples and produce the best combination of sensitivity and specificity [47].
In fact, the importance of independent variables in the ANN2 model implied the prediction that high levels of stress depend on soldier engagement and three types of cohesion: norm cohesion (CIN, normalized importance = 100%), task cohesion (CPE, normalized importance = 76.70%), and social cohesion (CTE, normalized importance = 60.80%).
The study findings on the classical Truckman’s group dynamics model [48,49,50,51,52] are in line with the mainstream literature on small group research in the military, where “military cohesion” is used [53,54] as a general term to describe micro-level dynamics among soldiers that lead to greater combat efficiency [55,56,57].Together with this, the ANN2 model predicted different importance for task cohesion (CPE) and social cohesion (CTE), as these are two fundamentally different elements of the military environment. Our findings are in line with a theoretical hypothesis provided by Kirke [58]. The level of stress was more precisely determined by CPE, showed by its absence (normalized importance = 76.70%) more than by CTE (normalized importance = 60.80%) because of the nature of compulsory military service, where the functional hierarchical structure dominates. Attitude towards military service (ATM, normalized importance = 46.80%) and squad leadership (SLE, normalized importance = 45.50%) were two predictors with effects on the level of stress among conscripts that were very close to the 50% threshold, i.e., they can predict the level of stress with a 50% probability. These findings are close to the results of the study carried out by others [6], who analyzed stress tolerance among Swedish solders.
Several surprising results were observed in the ANN2 classification model. First, leadership is traditionally seen in military service as a very important factor [59]. In our study, squad leadership (SLE, normalized importance = 45.50%) was a moderate predictor for the level of stress among conscripts. Second, it is surprising that unsafety in the group (PSY, normalized importance = 31.20%) was found to be a low predictor for the level of stress at the beginning of military service. This contradicts a series of research findings in the field of workplace stress [59,60]. An explanation for this contradiction can be found in a study by Munsh et al. [61] that analyzed masculinity contest norms and found that, if group members are dominated by strength and stamina norms, ignorance and insecurity in the group is low.
It should be noted that the multilayer perceptron neural network as the ANN2 model predicted three PSS categories by 14 criteria, and the model validation tests proved the best results for high-level stress (with 90% probability), whereas its accuracy for medium-level stress was lower. This does not diminish the importance of the designed ANN2 model because the beginning of conscription military service is expected to increase the level of stress.
Although our research provided a very accurate prediction of stress levels, it had some limitations that should be characterized. First, data from a single source were used in the study. Although the single basis approach is typical and is employed in more than 80% of organizations’ studies, there are some issues of variance in the common approach [46]. To overcome this limitation, we performed a sophisticated data analysis and used three versions of data iteration. However, for future research, we suggest using diverse data sources for stress-level measurement and prediction. Second, the data were collected using self-reported information, where it is difficult to avoid bias in assessing situational factors. Despite these limitations, the self-reported information gathered during the survey was important because sensitive questions were not asked face-to-face.
The research also has a practical implication. For practitioners in the military, these results are interesting for gaining statistically significant results of stress-predicting factors associated with entry into conscription. Our findings point out that creating norms in conscripts’ groups (norm cohesion), shaping their attention and energy towards common tasks (task cohesion), and creating their interdependence (social cohesion) as well as helping them feel engaged could decrease the level of stress among conscripts and, most importantly, prevent stress from rising to a critically high level.
6. Conclusions
A multilayer perceptron neural network was trained by the back-propagation algorithm to specify the main stressors that remarkably increased the level of stress at the beginning of military conscription service.
Our findings demonstrate that the highest accuracy was attained using the multilayer perceptron neural network (MLPNN) with 6-2-2 partition, the standardized rescaling method for covariates, and the activation function—a hyperbolic tangent with 20 units in one hidden layer and the back-propagation algorithm. The best ANN model was identified by the smallest cross-entropy error value of 7.422, a correct classification rate of 82%, and the area under the ROC for each category with the predicted pseudo-probability (low stress = 0.997; moderate stress = 0.995; high stress = 1.000). Additionally, based on the outcomes, the MLPNN appeared to be the most acceptable ANN2 model for the three stress-level predictions. Nevertheless, the activation function and the number of hidden layers or neurons are very individual matters for individual-type estimates.
Furthermore, according to neural network analysis, the most powerful predictors of conscripts’ perceived stress were norm cohesion (CIN, normalized importance = 100%), task cohesion (CPE, normalized importance = 76.70%), and engagement (ENG, normalized importance = 73.20%).
Future studies on complex psychological constructs, such as perceived stress, should put additional focus on indicators or multifaceted methods that may better reflect how these cognitive processes elicit a response. Despite the strong indication that the proposed neural network model can be effectively implemented to predict conscript stress levels and support instructors to plan an environment that prevents the possibility for stress levels to rise to critical (high) levels, future studies need to validate these findings in larger and more diverse samples. Additionally, future studies could be extended to include other classifiers, such as support vector machines, and be used for testing other kernels different from Gaussians.
Supplementary Materials
The data supporting the reported results are available online at https://0-www-mdpi-com.brum.beds.ac.uk/2227-7390/9/6/626/s1, Table S5.5 Model ANN2 parameter estimates.xlsx.
Author Contributions
Conceptualization, S.B., R.S., and R.V.; methodology, S.B.; software, S.B.; validation, S.B.; formal analysis, S.B.; investigation, R.S. and R.V.; resources, R.S.; data curation, R.V.; writing—original draft preparation, S.B. and R.S.; writing—review and editing, R.S and S.B.; visualization, S.B.; supervision, S.B.; project administration, R.S.; funding acquisition, R.S. All authors have read and agreed to the published version of the manuscript.
Funding
This research was funded by the Research Council of Lithuania (LMTLT) under project agreement No S-MIP-20- 59.
Institutional Review Board Statement
The study was conducted according to the guidelines of the Declaration of Helsinki, and approved by the Institutional Review Board (or Ethics Committee) of the Vilnius Regional Biomedical Research Ethics Committee protocol # 2020/10-1275-754, 27-10-2020.
Informed Consent Statement
Informed written consent was obtained from all subjects involved in the study.
Data Availability Statement
The data supporting the reported results are archived in the National Open Access Research Data Archive (MIDAS) at www.midas.lt (accessed on 15 March 2021).
Conflicts of Interest
The authors declare no conflict of interest. The funders had no role in the design of the study, in the collection, analyses, or interpretation of the data, in the writing of the manuscript, or in the decision to publish the results.
Appendix A

Table A1.
Descriptive statistics for categorical variables.
| Variable | Category | Frequency | 1 Valid Percent |
|---|---|---|---|
| D1 | No | 70 | 63.1 |
| Yes | 41 | 36.9 | |
| D2 | No | 82 | 73.9 |
| Yes | 29 | 26.1 | |
| D3 | No | 53 | 47.7 |
| Yes | 58 | 52.3 | |
| D4 | No | 85 | 76.6 |
| Yes | 26 | 24.4 | |
| D5 | No | 97 | 87.4 |
| Yes | 14 | 12.6 | |
| D6 | No | 79 | 71.2 |
| Yes | 32 | 28.8 |
1 Notes: Valid N=111 listwise.
Appendix B
Figure A1.
Normalized importance by the artificial neural network (ANN2) model.

Figure A2.
ANN2 topology for cycle time with multilayered perceptron.

References
- Samele, C.; Lees-Manning, H.; Zamperoni, V.; Goldie, I.; Thorpe, L.; Wooster, E.; Giugliano, T.; O’sullivan, C.; Kousoulis, A.; Breedvelt, J.; et al. Stress: Are We Coping? Mental Health Foundation: London, UK, 2018. [Google Scholar]
- Nuhu, F.; Bhandari, S. Oxidative Stress and Cardiovascular Complications in Chronic Kidney Disease, the Impact of Anaemia. Pharmaceuticals 2018, 11, 103. [Google Scholar] [CrossRef] [Green Version]
- Saha, S.K.; Lee, S.B.; Won, J.; Choi, H.Y.; Kim, K.; Yang, G.M.; Dayem, A.A.; Cho, S.G. Correlation between Oxidative Stress, Nutrition, and Cancer Initiation. Int. J. Mol. Sci. 2017, 18, 1544. [Google Scholar] [CrossRef] [Green Version]
- Leightley, D.; Williamson, V.; Darby, J.; Fear, N.T. Identifying Probable Post-Traumatic Stress Disorder: Applying Supervised Machine Learning to Data from a UK Military Cohort. J. Ment. Health 2019, 28, 34–41. [Google Scholar] [CrossRef] [PubMed]
- Platania, S.; Castellano, S.; Petralia, M.C.; Digrandi, F.; Coco, M.; Pizzo, M.; di Nuovo, S. The Moderating Effect of the Dispositional Resilience on the Relationship between Post-Traumatic Stress Disorder and the Professional Quality of Life of the Military Returning from the Peacekeeping Operations. Mediterr. J. Clin. Psychol. 2020, 8, 1–21. [Google Scholar] [CrossRef]
- Purre, M.; Oja, L. Mental health in the military context: Emotional states and help-seeking behaviours during conscription. Est. J. Mil. Stud. 2018, 6, 196–222. [Google Scholar]
- Do, J.J.; Samuels, S.M. I Am a Warrior: An Analysis of the Military Masculine-Warrior Narrative Among U.S. Air Force Officer Candidates. Armed Forces Soc. 2021, 47, 25–47. [Google Scholar] [CrossRef]
- Bekesiene, S.; Hoskova-Mayerova, S.; Diliunas, P. Structural Equation Modeling Using the Amos and Regression of Effective Organizational Commitment Indicators in Lithuanian Military Forces. In Proceedings of the Aplimat—16th Conference on Applied Mathematics 2017 Proceedings, Bratislava, Slovakia, 31 January–2 February 2017; pp. 91–102. [Google Scholar]
- Song, Q.; Li, J.; Duan, H.; Yu, D.; Wang, Z. Towards to Sustainable Energy-Efficient City: A Case Study of Macau. Renew. Sustain. Energy Rev. 2017, 75, 504–514. [Google Scholar] [CrossRef]
- Schmidt, P.; Reiss, A.; Duerichen, R.; van Laerhoven, K. Introducing WeSAD, a Multimodal Dataset for Wearable Stress and Affect Detection. In Proceedings of the 20th ACM International Conference on Multimodal Interaction (ICMI 2018), Boulder, CO, USA, 16–20 October 2018; Association for Computing Machinery, Inc.: New York, NY, USA, 2018; pp. 400–408. [Google Scholar]
- Taherdangkoo, R.; Tatomir, A.; Taherdangkoo, M.; Qiu, P.; Sauter, M. Nonlinear Autoregressive Neural Networks to Predict Hydraulic Fracturing Fluid Leakage into Shallow Groundwater. Water 2020, 12, 841. [Google Scholar] [CrossRef] [Green Version]
- Vigna, L.; Brunani, A.; Brugnera, A.; Grossi, E.; Compare, A.; Tirelli, A.S.; Conti, D.M.; Agnelli, G.M.; Andersen, L.L.; Buscema, M.; et al. Determinants of Metabolic Syndrome in Obese Workers: Gender Differences in Perceived Job-Related Stress and in Psychological Characteristics Identified Using Artificial Neural Networks. Eat. Weight Disord. Stud. Anorex. Bulim. Obes. 2019, 24, 73–81. [Google Scholar] [CrossRef]
- Somers, M.J.; Birnbaum, D.; Casal, J. Supervisor Support, Control over Work Methods and Employee Well-Being: New Insights into Nonlinearity from Artificial Neural Networks. Int. J. Hum. Resour. Manag. 2018, 1–23. [Google Scholar] [CrossRef]
- Pihlajamäki, H.; Parviainen, M.; Kyröläinen, H.; Kautiainen, H.; Kiviranta, I. Regular Physical Exercise before Entering Military Service May Protect Young Adult Men from Fatigue Fractures. BMC Musculoskelet. Disord. 2019, 20, 126. [Google Scholar] [CrossRef]
- Kennedy, B.; Chen, R.; Fang, F.; Valdimarsdottir, U.; Montgomery, S.; Larsson, H.; Fall, K. Low Stress Resilience in Late Adolescence and Risk of Smoking, High Alcohol Consumption and Drug Use Later in Life. J. Epidemiol. Community Health 2019, 73, 496–501. [Google Scholar] [CrossRef]
- Smaliukiene, R.; Bekesiene, S. Towards Sustainable Human Resources: How Generational Differences Impact Subjective Wellbeing in the Military? Sustainability 2020, 12, 10016. [Google Scholar] [CrossRef]
- Karstoft, K.I.; Statnikov, A.; Andersen, S.B.; Madsen, T.; Galatzer-Levy, I.R. Early Identification of Posttraumatic Stress Following Military Deployment: Application of Machine Learning Methods to a Prospective Study of Danish Soldiers. J. Affect. Disord. 2015, 184, 170–175. [Google Scholar] [CrossRef] [PubMed]
- Pavlova, I.; Zikrach, D.; Mosler, D.; Ortenburger, D.; Góra, T.; Wąsik, J. Determinants of Anxiety Levels among Young Males in a Threat of Experiencing Military Conflict–Applying a Machine-Learning Algorithm in a Psychosociological Study. PLoS ONE 2020, 15, e0239749. [Google Scholar] [CrossRef]
- Rongé, J.; Abrate, G. Conscription in the European Union Armed Forces: National Trends, Benefits and EU Modernise; European Army Interoperability Center: Brussels, Belgium, 2019. [Google Scholar]
- NATO. Moral Decisions and Military Mental Health (Décisions Morales et Santé Mentale Dans l’armée) Final Report of Task Group HFM-179. Distribution and Availability on Back Cover; Final Report of Task Group HFM-179; NATO: Neuilly-Sur-Seine, France, 2018. [Google Scholar]
- Bekešienė, S.; Guščinskienė, J.; Dvilaitis, G. Intelligent applications in the development of death prevention by suicide while on active duty, active and reserve components. In Intelligent technologies in logistics and mechatronics systems ITELMS’2015. In Proceedings of the 10th international conference, Technologija, Lithuania, Kaunas, 21–22 May 2015; pp. 56–64. [Google Scholar]
- Crump, C.; Sundquist, J.; Winkleby, M.A.; Sundquist, K. Low Stress Resilience in Late Adolescence and Risk of Hypertension in Adulthood. Heart 2016, 102, 541–547. [Google Scholar] [CrossRef] [Green Version]
- Pantaewan, P.; Kengganpanich, M.; Tanasugarn, C.; Tansakul, S.; Termsirikulchai, L.; Nityasuddhi, D. Three Intervention Levels for Improving Smoking Behavior among Royal Thai Army Conscripts. Southeast Asian J. Trop. Med. Public Health 2012, 43, 1018–1024. [Google Scholar]
- Hansen-Schwartz, J.; Kijne, B.; Johnsen, A.; Steen Andersen, H. The Course of Adjustment Disorder in Danish Male Conscripts. Nord. J. Psychiatry 2005, 59, 193–197. [Google Scholar] [CrossRef]
- Nilsson, P.M.; Nyberg, P.; Östergren, P.-O. Increased Susceptibility to Stress at a Psychological Assessment of Stress Tolerance Is Associated with Impaired Fetal Growth. Int. J. Epidemiol. 2001, 30, 75–80. [Google Scholar] [CrossRef] [Green Version]
- Mohan, Y.; Chee, S.S.; Xin, D.K.P.; Foong, L.P. Artificial Neural Network for Classification of Depressive and Normal in EEG. In Proceedings of the IEEE-EMBS Conference on Biomedical Engineering and Sciences (IECBES 2016), Kuala Lumpur, Malaysia, 5–7 December 2016; Institute of Electrical and Electronics Engineers Inc.: Piscataway, NJ, USA, 2016; pp. 286–290. [Google Scholar]
- Lewis, F.L.; Huang, J.; Parisini, T.; Prokhorov, D.V.; Wunsch, D.C. Guest Editorial: Special Issue on Neural Networks for Feedback Control Systems. IEEE Trans. Neural Netw. 2007, 18, 969–972. [Google Scholar] [CrossRef]
- Norgaard, M.; Ravn, O.; Poulsen, N.K.; Hansen, L.K. Neural Networks for Modelling and Control of Dynamic Systems—A Practitioner’s Handbook; Springer: London, UK, 2000; ISBN 978-1-85233-227-3. [Google Scholar]
- Ludermir, T.B.; Yamazaki, A.; Zanchettin, C. An Optimization Methodology for Neural Network Weights and Architectures. IEEE Trans. Neural Netw. 2006, 17, 1452–1459. [Google Scholar] [CrossRef]
- McClelland, J.; Rumelhart, D.E.; Hinton, G.E. The appeal of parallel distributed processing. In Readings in Cognitive Science: A Perspective from Psychology and Artificial Intelligence; Collins, A.M., Smith, E.E., Eds.; Morgan Kaufmann Pub: San Mateo, CA, USA, 1988; pp. 52–72. ISBN 9781483214467. [Google Scholar]
- Rojas, R. Neural Networks: A Systematic Introduction; Springer Science & Business Media: Berlin/Heidelberg, Germany, 1996; ISBN 3540605053. [Google Scholar]
- Miller, J.C.; Miller, J.N. Statistics for Analytical Chemistry; Prentice Hall: Harlow, UK, 2010; ISBN 9780130309907. [Google Scholar]
- Pachepsky, Y.; Timlin, D.; Varallyay, G. Artificial Neural Networks to Estimate Soil Water Retention from Easily Measurable Data. Soil Sci. Soc. Am. J. 1996, 60, 727–733. [Google Scholar] [CrossRef]
- Malinova, T.; Guo, Z.X. Artificial Neural Network Modelling of Hydrogen Storage Properties of Mg-Based Alloys. Mater. Sci. Eng. A 2004, 365, 219–227. [Google Scholar] [CrossRef]
- Song, R.-G.; Zhang, Q.-Z.; Tseng, M.-K.; Zhang, B.-J. The Application of Artificial Neural Networks to the Investigation of Aging Dynamics in 7175 Aluminium Alloys. Mater. Sci. Eng. C 1995, 3, 39–41. [Google Scholar] [CrossRef]
- Baughman, D.R.; Liu, Y.A. Fundamental and Practical Aspects of Neural Computing. In Neural Networks in Bioprocessing and Chemical Engineering; Elsevier: Amsterdam, The Netherlands, 1995. [Google Scholar]
- Trenn, S. Multilayer Perceptrons: Approximation Order and Necessary Number of Hidden Units. IEEE Trans. Neural Netw. 2008, 19, 836–844. [Google Scholar] [CrossRef] [Green Version]
- Chung, E.K.; Jung, Y.; Sohn, Y.W. A Moderated Mediation Model of Job Stress, Job Satisfaction, and Turnover Intention for Airport Security Screeners. Saf. Sci. 2017, 98, 89–97. [Google Scholar] [CrossRef]
- Park; Sun-Hee. A Convergence Study on the Cultural Adaptation Stress and Self-Efficacy on Career Preparation Behavior of Foreign Students. J. Korea Converg. Soc. 2019, 10, 89–97. [Google Scholar] [CrossRef]
- Ha, J.H.; Jue, J.; Jang, Y. The Relationship Between Army Soldiers’ Perceived Stress and Army Life Adjustment: Focusing on the Mediating Effect of Stress Response and the Moderating Effect of Cohesion. Mil. Med. 2020, 185, e1743–e1749. [Google Scholar] [CrossRef] [PubMed]
- Jex, S.M.; Kain, J.; Park, Y. Situational factors and resilience: Facilitating adaptation to military stressors. In Building Psychological Resilience in Military Personnel: Theory and Practice; American Psychological Association: Washington, DC, USA, 2013. [Google Scholar]
- Harms, P.D.; Credé, M.; Tynan, M.; Leon, M.; Jeung, W. Leadership and Stress: A Meta-Analytic Review. Leadersh. Q. 2017, 28, 178–194. [Google Scholar] [CrossRef]
- Cohen, S.; Janicki-Deverts, D. Who’s Stressed? Distributions of Psychological Stress in the United States in Probability Samples from 1983, 2006, and 2009. J. Appl. Soc. Psychol. 2012, 42, 1320–1334. [Google Scholar] [CrossRef]
- Cohen, S.; Kamarck, T.; Mermelstein, R. A Global Measure of Perceived Stress. J. Health Soc. Behav. 1983, 24, 385–396. [Google Scholar] [CrossRef]
- Rezaei, A.; Mousanezhad Jeddi, E. Relationship between Wisdom, Perceived Control of Internal States, Perceived Stress, Social Intelligence, Information Processing Styles and Life Satisfaction among College Students. Curr. Psychol. 2020, 39, 927–933. [Google Scholar] [CrossRef]
- Bekesiene, S.; Meidute-Kavaliauskiene, I.; Vasiliauskiene, V. Accurate Prediction of Concentration Changes in Ozone as an Air Pollutant by Multiple Linear Regression and Artificial Neural Networks. Mathematics 2021, 9, 356. [Google Scholar] [CrossRef]
- ROC Curve. Available online: https://www.ibm.com/support/knowledgecenter/en/SSLVMB_23.0.0/spss/tutorials/mlp_bankloan_roc-curve_02.html (accessed on 17 February 2021).
- Balducci, C.; Fraccaroli, F.; Schaufeli, W.B. Psychometric Properties of the Italian Version of the Utrecht Work Engagement Scale (UWES-9). Eur. J. Psychol. Assess. 2010, 26, 143. [Google Scholar] [CrossRef] [Green Version]
- Paananen, S.; Häyhä, L.; Hedlund, E. Diversity in Teams: Perceptions of Team Learning Behaviour in a Military Staff Exercise. Scand. J. Mil. Stud. 2020, 3, 1–17. [Google Scholar] [CrossRef] [Green Version]
- Hedlund, E.; Börjesson, M.; Österberg, J. Team Learning in a Multinational Military Staff Exercise. Small Group Res. 2015, 46, 179–203. [Google Scholar] [CrossRef]
- Tuckman, B.W.; Jensen, M.A.C. Stages of Small-Group Development Revisited. Group Organ. Stud. 1977, 2, 419–427. [Google Scholar] [CrossRef]
- Bonebright, D.A. 40 Years of Storming: A Historical Review of Tuckman’s Model of Small Group Development. Hum. Resour. Dev. Int. 2010, 13, 111–120. [Google Scholar] [CrossRef]
- Käihkö, I. Broadening the Perspective on Military Cohesion. Armed Forces Soc. 2018, 44, 571–586. [Google Scholar] [CrossRef]
- Salo, M. Determinants of Military Adjustment and Attrition During Finnish Conscript Service. Ph.D. Thesis, University of Tampere, Helsinki, Finland, 2008. [Google Scholar]
- Bekešienė, S.; Hošková-Mayerová, Š.; Diliūnas, P. Identification of Effective Leadership Indicators in the Lithuania Army Forces. In Studies in Systems, Decision and Control: 104. Mathematical-Statistical Models and Qualitative Theories for Economic and Social Sciences; Springer International Publishing AG: Berlin/Heidelberg, Germany, 2017; pp. 107–122. [Google Scholar] [CrossRef]
- Wood, M.D.; Walker, T.; Adler, A.B.; Crouch, C.L. Post-Traumatic Growth Leadership: Mitigating Stress in a High-Risk Occupation. Occup. Health Sci. 2020, 4, 1–20. [Google Scholar] [CrossRef]
- Bartone, P.T. Resilience Under Military Operational Stress: Can Leaders Influence Hardiness? Mil. Psychol. 2006, 18, S131–S148. [Google Scholar] [CrossRef] [Green Version]
- Kirke, C. Orders Is Orders. Aren’t They? Rule Bending and Rule Breaking in the British Army. Ethnography 2010, 11, 359–380. [Google Scholar] [CrossRef] [Green Version]
- Dussault, M.; Deaudelin, C.; Royer, N.; Loiselle, J. Professional Isolation and Occupational Stress in Teachers. Psychol. Rep. 1999, 84, 943–946. [Google Scholar] [CrossRef]
- Chang, S.J.; van Witteloostuijn, A.; Eden, L. From the Editors: Common Method Variance in International Business Research. J. Int. Bus. Stud. 2010, 41, 178–184. [Google Scholar] [CrossRef]
- Munsch, C.L.; Weaver, J.R.; Bosson, J.K.; O’Connor, L.T. Everybody but Me: Pluralistic Ignorance and the Masculinity Contest. J. Soc. Issues 2018, 74, 551–578. [Google Scholar] [CrossRef]
Figure 1.
Schemes for the structure description of the artificial neural networks (ANNs): (a) Description of neural network architecture: IL —input layer, HL—hidden layer, and OL—output layer; (b) Description of neural network active node: IN—inputs, WE—weights, AF—activation function, Sj—sum of the weighted input, and Oj—output activation function.

Figure 2.
ANN2 model’s predicted pseudo-probability presented by a box-plot diagram for the three PSS variable categories.
Figure 2.
ANN2 model’s predicted pseudo-probability presented by a box-plot diagram for the three PSS variable categories.

Figure 3.
ROC curve for the ANN2 model.

Figure 4.
Model performance measurement: (a) cumulative gains that are the illustrations of accurate classifications gained by the ANN2 model; and (b) lift chart showing model performance in a portion of the population.
Figure 4.
Model performance measurement: (a) cumulative gains that are the illustrations of accurate classifications gained by the ANN2 model; and (b) lift chart showing model performance in a portion of the population.

Table 1.
Variables used in the study.
| Variable’s Code | Description of Measurement |
|---|---|
| Individual Factors: | |
| ATM | Attitude towards military service is evaluated after the aggregation of six items measured by the Likert scale from 1—totally disagree, to 7—totally agree; construct values vary in the interval [6–42]. |
| 1 Adaptation: | |
| ENG | Engagement result after the aggregation of nine items measured by the Likert scale from 1—almost never, to 6—always; construct values vary in the interval [9–54]. |
| ADJ | Adjustment to a new physical environment result after the aggregation of seven items measured by the Likert scale from 1—totally disagree, to 7—totally agree; construct values vary in the interval [7–49]. |
| 2 Group cohesion: | |
| CTE | Team Cohesion result after the aggregation of twelve items measured by the Likert scale from 1—totally disagree, to 7—totally agree; construct values vary in the interval [12–84]. |
| CPE | Task Cohesion result after the aggregation of eight items measured by the Likert scale from 1—totally disagree, to 7—totally agree; construct values vary in the interval [8–56]. |
| CIN | Norm Cohesion result after the aggregation of six items measured by the Likert scale from 1—totally disagree, to 7—totally agree; construct values vary in the interval [6–42]. |
| PSY | Psychological (un)safety in the group result after the aggregation of seven items measured by the Likert scale from 1—totally disagree, to 7—totally agree; construct values vary in the interval [7–49]. |
| Leadership: | |
| SLE | Squad leadership result after the aggregation of four items measured by the Likert scale from 1—totally disagree, to 7—totally agree; construct values vary in the interval [4–24]. |
| Events Outside Military Service or Non-Social Military Environment-Related Stressors: | |
| D1, D2, D3, D4, D5, D6 | Non-service and non-social military environment-related stressors measured by a dichotomous scale (0 = No; 1 = Yes): D1 = little or no money; D2 = disease or injury; D3 = sleeping disorders; D4 = quarrels outside military service; D5 = relationship that ended outside military service; D6 = other strong negative experiences. |
| 3 Level of stress: | |
| PSS | Perceived stress questionnaire formulated to ask about the respondent’s emotional state and opinions throughout the last month. |
| 1 = low stress; values vary in the interval [0–13]; | |
| 2 = moderate stress; values vary in the interval [14–26]; | |
| 3 = high perceived stress; values vary in the interval [27–40]. | |
Notes: 1 The nine-item Utrecht Work Engagement Scale; 2 Group Cohesion Scale-Revised and the Scale of Team Learning Behavior in the Combined Joint Staff Exercise; 3 Standardized Cohen’s 10-item Perceived Stress Scale based on a five-point scale.
Table 2.
Descriptive statistics for continuous variables.
| Variable | N | Minimum | Maximum | Mean | Std. Deviation | Variance | Skewness | |
|---|---|---|---|---|---|---|---|---|
| Statistic | Std. Error | |||||||
| ATM | 111 | 6 | 42 | 28.73 | 8.438 | 71.199 | −0.737 | 0.229 |
| ENG | 111 | 5 | 51 | 31.75 | 10.267 | 105.409 | −0.219 | 0.229 |
| ADJ | 111 | 10 | 49 | 34.23 | 9.679 | 93.690 | −0.524 | 0.229 |
| CTE | 111 | 31 | 84 | 61.86 | 12.171 | 148.124 | −0.356 | 0.229 |
| CPE | 111 | 23 | 52 | 39.77 | 6.226 | 38.758 | −0.316 | 0.229 |
| CIN | 111 | 8 | 42 | 31.78 | 7.743 | 59.953 | −0.780 | 0.229 |
| PSY | 111 | 7 | 42 | 16.74 | 8.300 | 68.886 | 0.954 | 0.229 |
| SLE | 111 | 1 | 28 | 22.71 | 7.233 | 52.316 | −0.566 | 0.229 |
| PSS | 110 | 1 | 3 | 1.78 | 0.565 | 0.319 | - | - |
| 1 Valid N | 110 | |||||||
Notes: 1 Valid N listwise.
Table 3.
Relationships between research variables.
| ATM | ENG | ADJ | CTE | CPE | CIN | PSY | SLE | PSS | |
|---|---|---|---|---|---|---|---|---|---|
| ATM | 1.000 | 0.672 ** | 0.500 ** | 0.567 ** | 0.469 ** | 0.352 ** | −0.494 ** | 0.471 ** | −0.287 ** |
| ENG | 0.672 ** | 1.000 | 0.654 ** | 0.566 ** | 0.557 ** | 0.458 ** | −0.469 ** | 0.472 ** | −0.497 ** |
| ADJ | 0.500 ** | 0.654 ** | 1.000 | 0.411 ** | 0.391 ** | 0.509 ** | −0.425 ** | 0.352 ** | −0.553 ** |
| CTE | 0.567 ** | 0.566 ** | 0.411 ** | 1.000 | 0.681 ** | 0.582 ** | −0.618 ** | 0.522 ** | −0.216 * |
| CPE | 0.469 ** | 0.557 ** | 0.391 ** | 0.681 ** | 1.000 | 0.514 ** | −0.503 ** | 0.398 ** | −0.317 ** |
| CIN | 0.352 ** | 0.458 ** | 0.509 ** | 0.582 ** | 0.514 ** | 1.000 | −0.621 ** | 0.268 ** | −0.469 ** |
| PSY | −0.494 ** | −0.469 ** | −0.425 ** | −0.618 ** | −0.503 ** | −0.621 ** | 1.000 | −0.458 ** | 0.313 ** |
| SLE | 0.471 ** | 0.472 ** | 0.352 ** | 0.522 ** | 0.398 ** | 0.268 ** | −0.458 ** | 1.000 | −0.226 * |
| PSS | −0.287 ** | −0.497 ** | −0.553 ** | −0.216 * | −0.317 ** | −0.469 ** | 0.313 ** | −0.226 * | 1.000 |
Notes: Pearson’s rho correlation is significant at the * 0.05 level and ** 0.01 level (two-tailed hypothesis test used).
Table 4.
Network information for case processing.
| Layer Description | Variable Description | |||
|---|---|---|---|---|
| Layer | Partitions | Number of Units | Activation Function | |
| ANN1: | ||||
| Input | 51.8% (57) | 14 | - | D1, D2, D3, D4, D5, D6, ATM, ENG, ADJ, CTE, CPE, CIN, PSY, SLE |
| Hidden | 28.2% (31) | 20 | Hyperbolic tangent | |
| Output | 20.0% (22) | 3 | Softmax | Dependent variable PSS: 1 = low stress, 2 = moderate stress, 3 = high perceived stress. |
| ANN2: 6–2–2 | ||||
| Input | 60.9% (67) | 14 | - | D1, D2, D3, D4, D5, D6, ATM, ENG, ADJ, CTE, CPE, CIN, PSY, SLE |
| Hidden | 16.4% (18) | 20 | Hyperbolic tangent | |
| Output | 22.7% (25) | 3 | Softmax | Dependent variable PSS: 1 = low stress, 2 = moderate stress, 3 = high perceived stress. |
| ANN3: | ||||
| Input | 68.2% (75) | 14 | - | D1, D2, D3, D4, D5, D6, ATM, ENG, ADJ, CTE, CPE, CIN, PSY, SLE |
| Hidden | 21.8% (24) | 20 | Hyperbolic tangent | |
| Output | 10.0% (11) | 3 | Softmax | Dependent variable PSS: 1 = low stress, 2 = moderate stress, 3 = high perceived stress. |
Notes: N= number of cases divided for calculations. Standardized rescaling method for covariates; Error Function = cross-entropy.
Table 5.
Summary for designed models.
| Layer Description | ANN1 | ANN2 | ANN3 | |
|---|---|---|---|---|
| 1 Training | Cross Entropy Error | 28.981 | 7.422 | 38.943 |
| Percent Incorrect Predictions | 22.2% | 1.5% | 17.3% | |
| Training Time | 0:00:00.03 | 0:00:00.02 | 0:00:00.03 | |
| Testing | Cross Entropy Error | 32.096 | 6.147 | 10.356 |
| Percent Incorrect Predictions | 43.2% | 22.2% | 15.8% | |
| Holdout | Percent Incorrect Predictions | 26.3% | 28.0% | 30.0% |
1 Notes: Stopping rule used = consecutive step(s) with no decrease in error. Dependent variable: perceived stress scale (PSS): 1 = low stress, 2 = moderate stress, and 3 = high perceived stress. Error computations are based on the testing sample.
Table 6.
Survey sample classification of the ANN2 model.
| Sample | Observed | 1 Predicted PSS | |||
|---|---|---|---|---|---|
| Low Stress | Moderate Stress | High Stress | Percent Correct | ||
| Training | 1 low stress | 20 | 1 | 0 | 95.2% |
| 2 moderate stress | 0 | 42 | 0 | 100.0% | |
| 3 high perceived stress | 0 | 0 | 4 | 100.0% | |
| Overall Percent | 29.9% | 64.2% | 6.0% | 98.5% | |
| Testing | 1 low stress | 6 | 1 | 0 | 85.7% |
| 2 moderate stress | 2 | 8 | 1 | 72.7% | |
| 3 high perceived stress | 0 | 0 | 0 | 0.0% | |
| Overall Percent | 44.4% | 50.0% | 5.6% | 77.8% | |
| Holdout | 1 low stress | 3 | 1 | 0 | 75.0% |
| 2 moderate stress | 4 | 13 | 0 | 76.5% | |
| 3 high perceived stress | 0 | 2 | 2 | 50.0% | |
| Overall Percent | 28.0% | 64.0% | 8.0% | 72.0% | |
1 Notes: Dependent variable: PSS: 1 = low stress, 2 = moderate stress, 3 = high perceived stress.
Table 7.
Area under the curve.
| ANN1 50%–30%–10% | ANN2 60%–20%–20% | ANN3 70%–20%–10% | ||
|---|---|---|---|---|
| Area | Area | Area | ||
| PSS | 1 = low stress | 0.836 | 0.997 | 0.827 |
| 2 = moderate stress | 0.746 | 0.995 | 0.754 | |
| 3 = high perceived stress | 0.785 | 1.000 | 0.916 | |
Table 8.
Independent variable importance.
| Variables | ANN1 50%–30%–10% | ANN2 60%–20%–20% | ANN3 70%–20%–10% | |||
|---|---|---|---|---|---|---|
| Importance | Normalized Importance | Importance | Normalized Importance | Importance | Normalized Importance | |
| D1 | 0.096 | 45.0% | 0.060 | 38.4% | 0.171 | 100.0% |
| D2 | 0.021 | 9.8% | 0.030 | 19.4% | 0.070 | 40.7% |
| D3 | 0.060 | 28.1% | 0.043 | 27.1% | 0.042 | 24.5% |
| D4 | 0.013 | 6.3% | 0.061 | 38.7% | 0.084 | 49.2% |
| D5 | 0.049 | 23.0% | 0.039 | 25.1% | 0.024 | 14.1% |
| D6 | 0.212 | 100.0% | 0.051 | 32.7% | 0.140 | 81.9% |
| ATM | 0.027 | 12.9% | 0.073 | 46.8% | 0.084 | 49.2% |
| ENG | 0.091 | 42.8% | 0.115 | 73.2% | 0.052 | 30.5% |
| ADJ | 0.165 | 77.5% | 0.034 | 21.6% | 0.087 | 51.0% |
| CTE | 0.034 | 16.0% | 0.095 | 60.8% | 0.050 | 29.0% |
| CPE | 0.013 | 6.3% | 0.120 | 76.7% | 0.109 | 64.0% |
| CIN | 0.055 | 25.8% | 0.157 | 100.0% | 0.008 | 4.4% |
| PSY | 0.115 | 53.9% | 0.049 | 31.2% | 0.048 | 27.9% |
| SLE | 0.050 | 23.3% | 0.071 | 45.5% | 0.031 | 18.1% |
Publisher’s Note: MDPI stays neutral with regard to jurisdictional claims in published maps and institutional affiliations. |
© 2021 by the authors. Licensee MDPI, Basel, Switzerland. This article is an open access article distributed under the terms and conditions of the Creative Commons Attribution (CC BY) license (http://creativecommons.org/licenses/by/4.0/).
Share and Cite
MDPI and ACS Style
Bekesiene, S.; Smaliukiene, R.; Vaicaitiene, R. Using Artificial Neural Networks in Predicting the Level of Stress among Military Conscripts. Mathematics 2021, 9, 626. https://0-doi-org.brum.beds.ac.uk/10.3390/math9060626
AMA Style
Bekesiene S, Smaliukiene R, Vaicaitiene R. Using Artificial Neural Networks in Predicting the Level of Stress among Military Conscripts. Mathematics. 2021; 9(6):626. https://0-doi-org.brum.beds.ac.uk/10.3390/math9060626
Chicago/Turabian StyleBekesiene, Svajone, Rasa Smaliukiene, and Ramute Vaicaitiene. 2021. "Using Artificial Neural Networks in Predicting the Level of Stress among Military Conscripts" Mathematics 9, no. 6: 626. https://0-doi-org.brum.beds.ac.uk/10.3390/math9060626
Note that from the first issue of 2016, this journal uses article numbers instead of page numbers. See further details here.