Article

A Comparative Ranking Model among Mexican Universities Using Pattern Recognition

by
Daniel Edahi Urueta
1,*,
Pedro Lara
2,
Miguel Ángel Gutiérrez
2,
Sergio Gerardo de-los-Cobos
2,
Eric Alfredo Rincón
3 and
Román Anselmo Mora
3
1
Posgrado en Ciencias y Tecnologías de la Información, Departamento de Ingeniería Eléctrica, Universidad Autónoma Metropolitana-Iztapalapa, Av. San Rafael Atlixco 186, Col. Vicentina, Del. Iztapalapa, Ciudad de México C.P. 09340, Mexico
2
Departamento de Ingeniería Eléctrica, Universidad Autónoma Metropolitana-Iztapalapa, Av. San Rafael Atlixco 186, Col. Vicentina, Del. Iztapalapa, Ciudad de México C.P. 09340, Mexico
3
Departamento de Sistemas, Universidad Autónoma Metropolitana-Azcapotzalco, Av. San Pablo 180, Colonia Reynosa Tamaulipas, Ciudad de México C.P. 02200, Mexico
*
Author to whom correspondence should be addressed.
Submission received: 6 June 2021 / Revised: 4 July 2021 / Accepted: 5 July 2021 / Published: 8 July 2021
(This article belongs to the Special Issue Fuzzy Sets in Business Management, Finance, and Economics)

Abstract

:
The evaluation of quality in higher education is today a matter of great importance in most countries because the allocation of resources should be in accordance with the quality of universities. Due to this, there are numerous initiatives to create instruments and evaluation tools that can offer a quality comparison among institutions and countries, the results of these efforts used to be called international rankings. These rankings include some that are “reputational” or subjective, based on opinion polls applied to groups that, which is estimated, can issue authorized views. There are also “objective” rankings, based on performance indicators, which are calculated from a certain set of empirical data; however, on many occasions these indicators are sponsored by universities with the desire to appear among the best universities and emphasize some characteristics more than others, which makes them untrustworthy and very variable between each other. In this sense, we considered the Comparative Study of Mexican Universities (CSMU), a database of statistical information on education and research of Mexican higher education institutions, this database allows users to be responsible for establishing comparisons and relationships that may exist among existing information items, or building indicators based on their own needs and analysis perspectives (Márquez, 2010). This work develops an unsupervised alternative model of ranking among universities using pattern recognition, specifically clustering techniques, which are based on public access data. The results of the CSMU database are obtained by analyzing 60 universities as a first iteration, but to present the final results UNAM is excluded.

1. Introduction

The quality of higher learning and research in a university is usually measured by prestige or by publicity, even opinion surveys directed at certain audiences are frequent: general [1], academic [2] or alumni and students [3]. These surveys show results that are consistent with each other, and on many occasions are based on the prestige of an institution, current advertising on social networks and classic mass media (radio, television and print). For this reason, it is common for them to have a bias from a government or a university that is using those studies to self-advertise. An ideal characteristic to avoid this type of bias is the use of unsupervised classification systems, which allow finding the “natural” groups of a set of items to classify them according to their inherent properties, because the groups formed are due to the closeness in their attributes.
All Mexican universities have characteristics which are comparable to each other, such as: full-time professors, number of members in the National System of Researchers (SNI) and number of articles published in journals in different international indexes, among others. In this article, a classification of the 60 largest universities in Mexico was made using the obtained information from the comparative study of Mexican universities carried out by the National Autonomous University of Mexico (UNAM), which is based on the collection, organization and analysis of information obtained from official sources and recognized databases (SEP, CONACYT, INDAUTOR, IMPI, WoS, Scopus, among others). This database is available at www.execum.unam.mx (accessed on 8 February 2019). This information was divided into two groups: higher learning and research. In the first one registered students (technical professional, bachelor’s degree, specialty, master’s degree and doctorate) were taken into account, as well as the study degree and type of contract that professors have. On the research side, papers in different indexed journals (SCI, Scopus, CONACYT journal quality index) and patents were also considered. Despite the fact that there is a work related to this database in literature [4], it is limited to analyzing a single year. For the present study the available data was used ranging from 2009 to 2017, this range allows to analyze what is the tendency of the Mexican university system, observing the transitions of some universities among different groups over the years.
In this study three well-known classification techniques: k-means, Gaussian mixture method (GMM), and spectral clustering were used to analyze the database. Likewise, principal component analysis (PCA) was used, which is a fast and flexible unsupervised method for reducing dimensionality in data [5].
Just as there are different opinion polls, where some emphasize which are the best elements, some others highlight which are the bad elements, in the same way the classifying algorithms will emphasize either the good or bad characteristics.
This article is divided as follows: Section 1 describes the considered classification techniques in this paper. In Section 2 the database and its attributes used are described. Section 3 describes the proposed matrix model (higher learning and research axis and generated sectors). Section 4 includes the application of the model to the case of 60 Mexican universities. Section 5 shows the results obtained and finally conclusions are presented.

2. Technical Classification by Clustering

Clustering algorithms are methods that divide a set of data into groups in such a way that members of the same group are more similar to each other than members of different groups [6].

2.1. k-means Algorithm

Given a data set, the objective of this algorithm is to set k groups to classify them, where k represents the number of groups previously specified by the analyst or by some method to select the ideal number of classes. When k-means classifies the objects, the objects within the same group are as similar as possible, while the objects in different groups are as different as possible; each group is represented by the center or middle of the data points that belong to the group [7]. The basic pseudocode is:
  • Begin
  • 1. Randomly choose k cluster centers
  • 2. While points stop changing assignment to centroids
    • assign each data point to the nearest cluster center.
    • Set the new cluster centroids based on the average (mean) position of each centroid point.
  • 3. End While
  • End
Formally, let us consider that n observations must be partitioned in c groups. Let x i and μ c be the i - th observation, 1 i n , and the mean of group 1 c k , respectively. The goal of k-means is to minimize the sum of the squared error over all groups denoted by J ( C ) ; Thus, the objective function is stated as:
J ( C ) = c = 1 k x i c | | x i μ c | | 2 .
Minimizing this objective function is an NP-Hard problem, even for k = 2 [8]. Therefore, k-means, is a greedy algorithm, this means, that it builds up a solution choosing the best option at every step so it can be expected to converge to a local minimum. k-means starts with an initial partition with k groups and assigns observations to groups to reduce the squared error. Since the squared error tends to decrease with an increase in the number of k groups (with J(C) = 0 when k = n), it is minimized for a fixed number of groups [9].
A k-means algorithm requires some user-specified parameters such as the number of clusters: typically, k-means runs independently for different values of k and the partition that appears the most meaningful to the human expert is selected. Besides, different initializations can lead to different final clusters because k-means can only converge to local minima. Another user-specified parameter is the metric, while it is true that the most used metric for computing the distance between points and cluster centers is the Euclidean distance, which is why k-means is limited to linear cluster boundaries; however, some other metrics such as the Mahalanobis distance metric has been used to detect hyperellipsoidal clusters [10]. Moreover, it has a limitation about the number of observations, because k-means assumes that each group has roughly the same cardinality.
Due in k-means there is no assurance that it will lead to the global best solution, k-means run for multiple starting guesses, and it improves the result in each step. However, k-means is used because it is broadly easy and fast to code and implement it.

2.2. Gaussian Mixture Model

A Gaussian mixture model is a probabilistic model that assumes all the data points are generated from a mixture of a finite number of Gaussian distributions with unknown parameters. A GMM can be seen as a k-means generalization which incorporates information about the covariance structure of the data, as well as the centers of the latent Gaussians [11]. GMM attempts to find a mixture of multi-dimensional Gaussian probability distributions that best model any input dataset. The pseudocode is:
  • Begin
  • 1. Choose starting guesses for the location and shape
  • 2. While the convergence is not reached:
    • For each point, find weights encoding the probability of membership in each cluster.
    • For each cluster, update its location, normalization, and shape based on all data points, making use of the weights.
  • 3. End While
  • End
Formally, let k and n be the number of clusters and the total number of observations, respectively. Let   μ c , Σ c and π c be the mean, covariance, and the mixing probability of cluster c , 1 c k . For GMM,   μ c is the center of cluster c , Σ c which represents its width and π c defines how large or small the Gaussian function will be.
Then the probability that x i , 1 i n is in the cluster c is given by:
γ i c = π c N ( x i   |   μ c ,   Σ c )     c = 1 k π c N ( x i   |   μ c   ,   Σ c )    
where N ( x   |   μ ,   Σ ) describes the multivariable Gaussian.
γ i c gives the probability that x i is in cluster c , divided by the sum of the probabilities that x i is in cluster c , for all 1 c k ., so if x i is very close to a Gaussian c, it will have high values of γ i c and relatively low values for any other case.
As a second step, for each cluster c: the total weight m c is calculated (which can be considered as the fraction of points assigned to group c) and π c ,   μ c and Σ c are updated using γ i c with:
m c = i = 1 n γ i c  
π c = m c m
  μ c = 1 m c i = 1 n γ i c x i
Σ c = 1 m c i = 1 n γ i c ( x i μ c ) T ( x i μ c )
Finally, the first and second steps are repeated until convergence is reached [12]. The result of this is that each cluster is associated not with a hard-edged sphere, but with a smooth Gaussian model. Although GMM is categorized as a clustering algorithm, it is technically a generative probabilistic model describing the distribution of the data; due to this property, there are two important limitations with GMM: the first one is about its computation complexity because it is necessary to calculate the distributions, and whereby the algorithm can fail if the dimensionality of the problem is too high; the second limitation is that in many instances, the number of groups is unknown and it may be necessary to experiment with a number of different groups in order to find the most suitable.

2.3. Spectral Clustering

Spectral clustering is a technique whose goal is to cluster data that is connected, but not necessarily clustered within convex boundaries, so it has no limitations on the shape of data and can detect linearly non-separable patterns. The basic idea is to construct a weighted graph from the initial dataset where each node represents a pattern, and each weighted edge simply considers the similarity between two patterns [13]. In this context, this clustering problem can be seen as a graph cut problem, which can be tackled by means of the spectral graph theory. The core of this theory is the eigenvalue decomposition of the Laplacian matrix of the weighted graph obtained from data. The pseudocode is:
  • Begin
  • 1. Compute A, the n × n affinity matrix
  • 2. Get the eigensystem of A:
    • Compute the first k eigenvectors of its Laplacian matrix to define a feature vector for each object:
    • Set U = n × k matrix containing the normalized eigenvectors of the k largest eigenvalues of A in its columns
  • 3. Apply k-means on the row space of U to find the k cluster
  • End
Formally, let n be the number of data points to be grouped and W = [ w i ,   j ] n x n the weight matrix where each w i ,   j is the similarity between x i and x j data points. So, a clustering problem can be formulated into the minimum cut problem, i.e.,
q * = arg   min q { 1 ,   1 } n i ,     j = 1 n w i ,   j   ( q i q j ) 2 = q T L q
where q = ( q 1 ,   q 2 , ,   q n ) is a vector for binary memberships and if we express a partition (A, B) as the vector q i , each q i can be 1 if i A or −1 i B . L is the Laplacian matrix, defined as L = D W , where D = [ d i ,   i ] n x n is a diagonal matrix with each element d i ,   i = δ i ,   j j = 1 n w i ,   j .
For grouping into several classes, the objective function can be defined as:
J n o r m _ m c ( q ) = z = 1 k z z C z ,     z ,   ( q ) D z   ( q )
where k is the number of clusters, q { 1 ,   2 ,   ,   k } n , C z ,     z , = i ,   j = 1 n δ ( q i , z ) δ ( q j ,   z , ) w i ,   j and D z   = i = 1 n j = 1 n δ ( q i , z ) w i ,   j . However, efficiently finding the solution that minimizes the above equation is quite difficult. Therefore, a common strategy is to first get the smallest v eigen-vectors of the Laplacian matrix L (excluding the one with zero eigen-value), and project the data points in the low-dimensional space spanning the v eigen-vectors. Then, a standard clustering algorithm, such as k-means, is applied to the cluster data points in this low-dimensional space [14].
In short terms, spectral clustering is based on two main steps: first embedding the data points in a space in which clusters are more “obvious” (using the eigenvectors of a Gram matrix), and then applying a classical clustering algorithm such as k-means [15]. The affinity matrix M is formed using a kernel such as the Gaussian kernel. To obtain m clusters, the first m principal eigenvectors of M are computed, and k-means is applied on the unit-norm coordinates. So, if we consider a data set which consists of n data points, the time complexity of spectral clustering is O ( n 3 ) , which makes it prohibitive for large-scale data application [16]. Moreover, there is evidence [13] that spectral clustering can be quite sensitive to changes in the similarity graph so noisy datasets can cause problems.
Choosing the number k of clusters is a general problem for all clustering algorithms, and just like k-means and GMM, it requires the number of clusters to be specified.

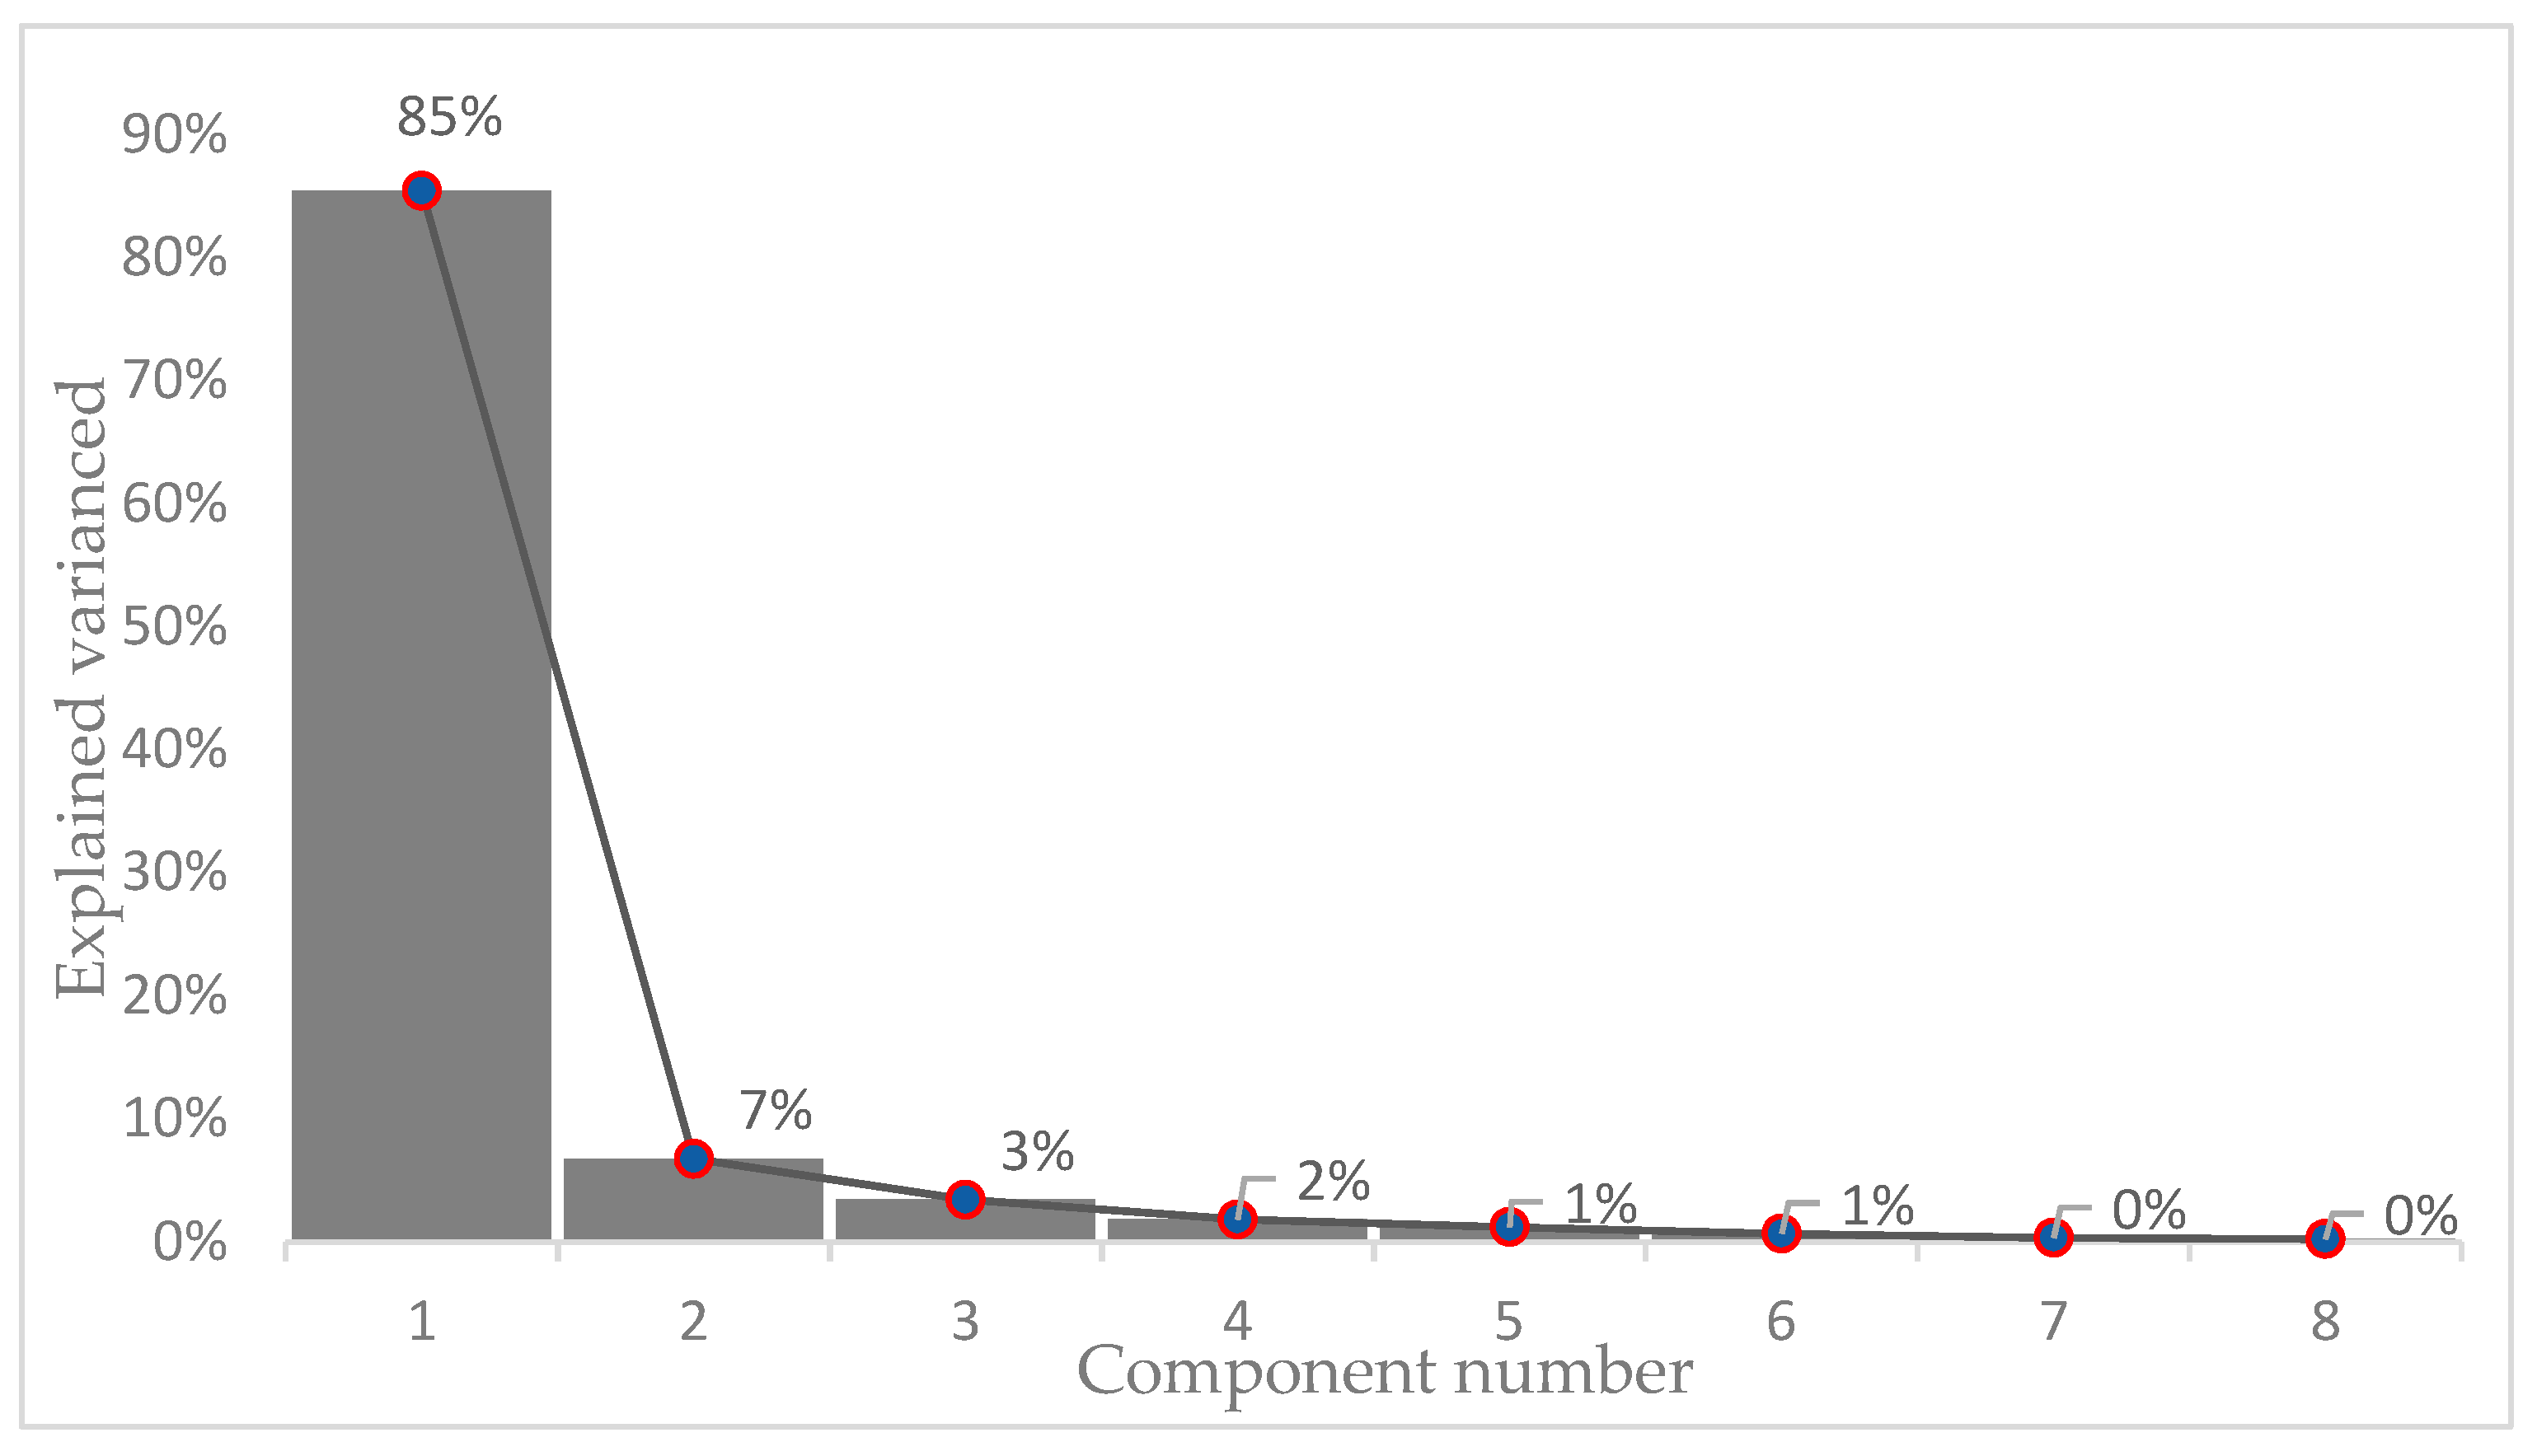
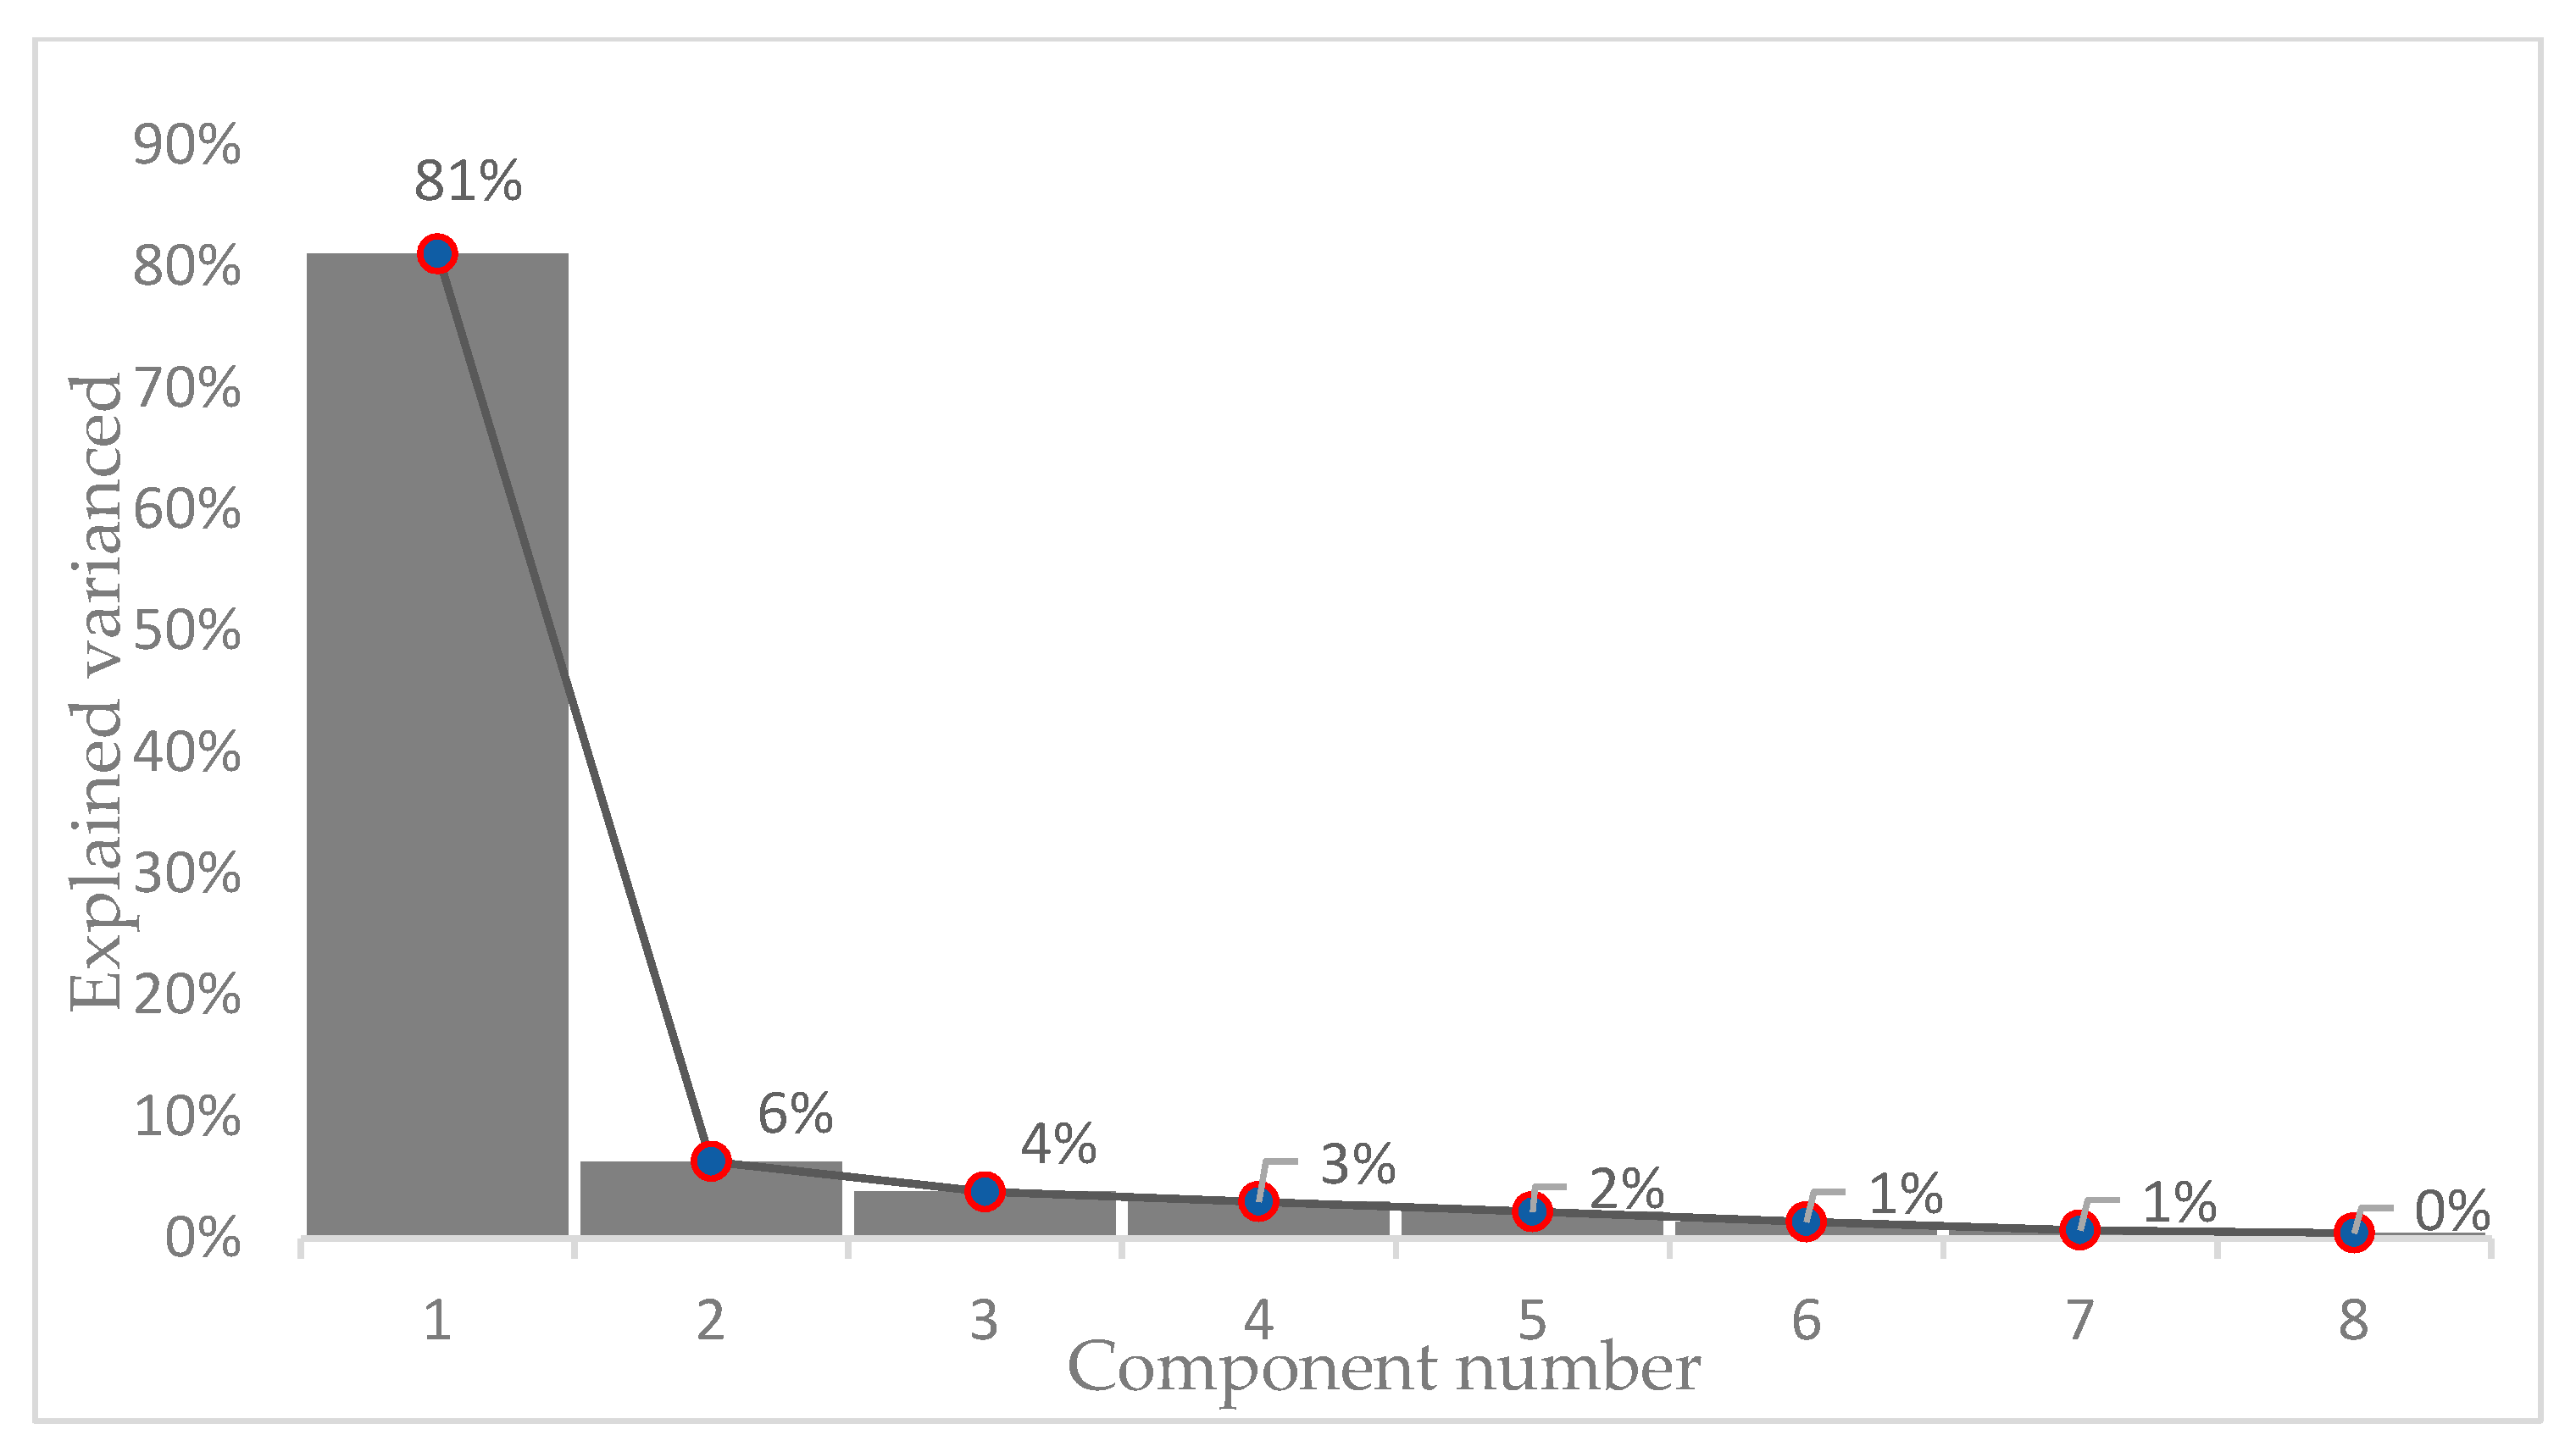
2.4. Principal Component Analysis

Principal component analysis (PCA) is a linear dimensionality reduction technique that can be used to extract information from a high-dimensional space by projecting it onto a lower-dimensional subspace. It tries to preserve the essential parts that have more variation of the data and eliminate the non-essential parts with less variation. It does this through a statistical procedure that uses an orthogonal transformation to convert a set of observations of possibly correlated variables (entities each of which takes on several numerical values) into a set of linearly uncorrelated variable values called principal components. In short, what the algorithm does is [5]:
  • Standardize the input data (or normalize the variables).
  • Get the eigenvectors and eigenvalues of the covariance matrix.
  • Sort eigenvalues from high to low and choose d eigenvectors that correspond to d higher eigenvalues (where d is the dimensionality of the new features subspace).
  • Construct the projection matrix W with the d eigenvectors selected.
  • Transform the original X standardized database via W to obtain the new d-dimensional characteristics.
Thanks to the PCA you can get:
  • A measure of how each variable is associated with the others (covariance matrix)
  • The direction in which our data is scattered (eigenvectors)
  • The relative importance of these different directions (eigenvalues).
In summary, PCA dimensionality reduction causes the least important attribute information to be removed, leaving only the data components with the highest variance, that is, the resulting data retains the maximum data variance. For this reason, although PCA is used to reduce the dimensionality in the data, may also be useful as a visualization tool, for filtering noise and for feature extraction.

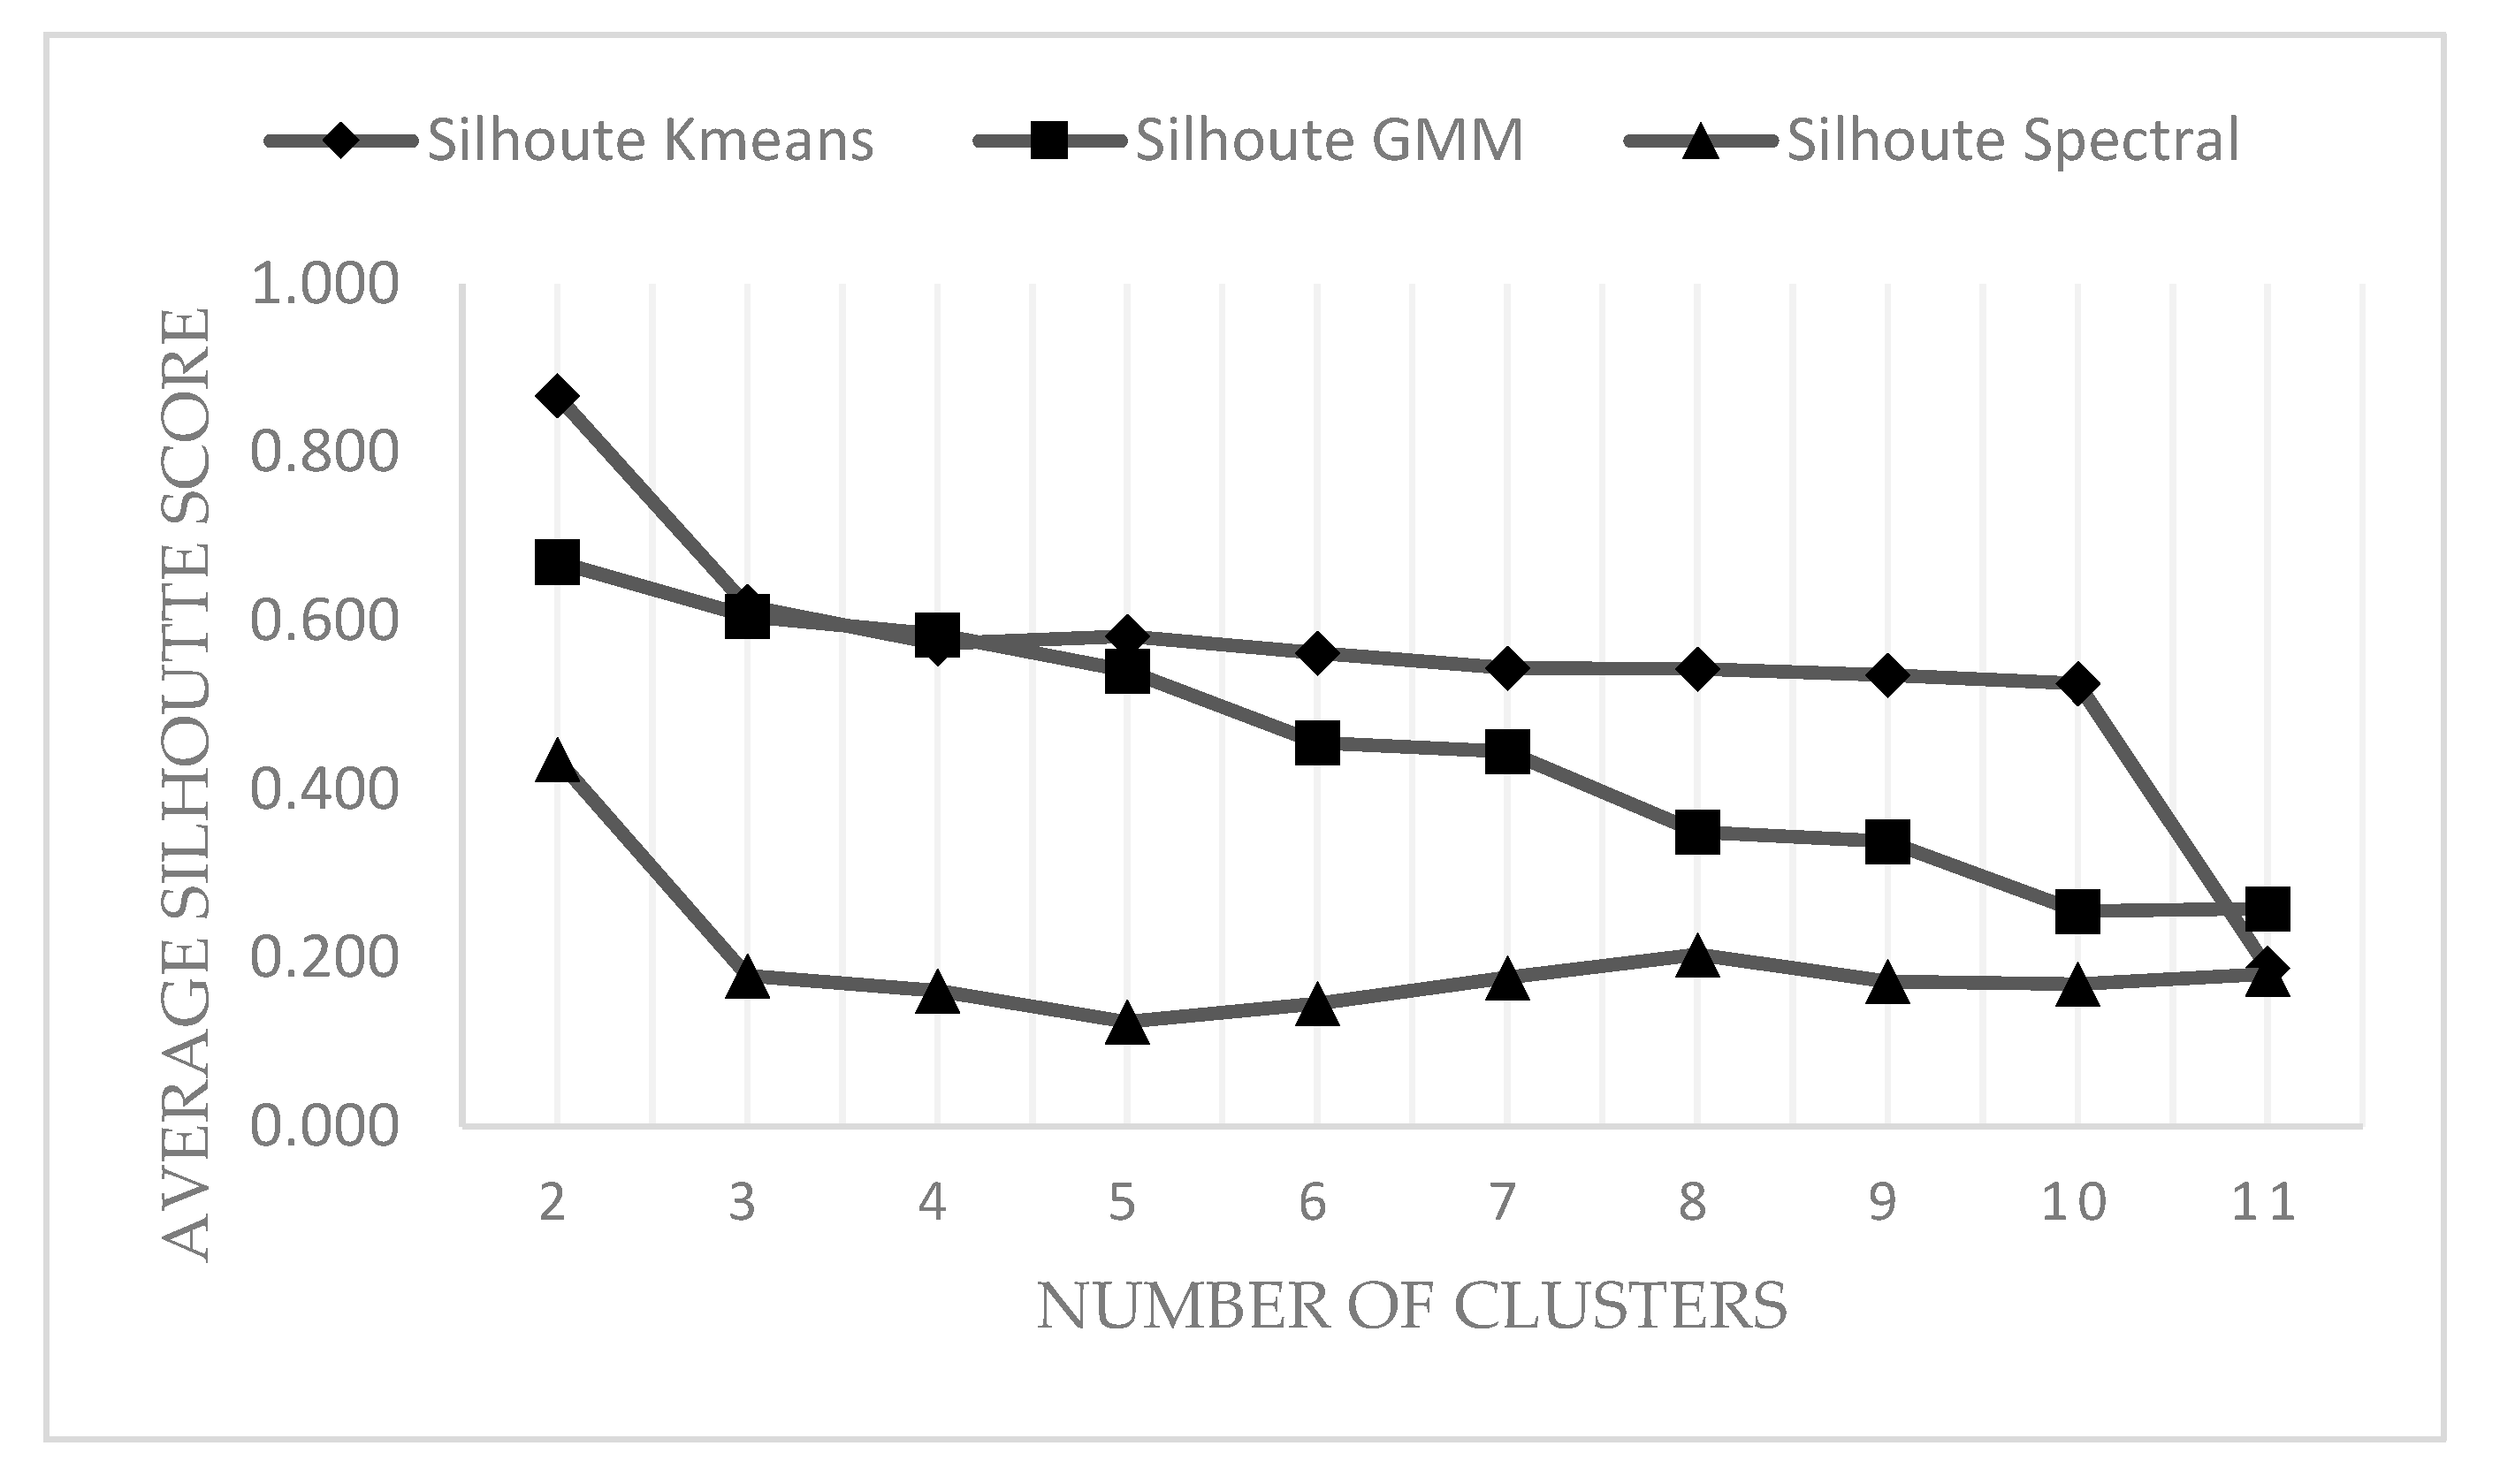
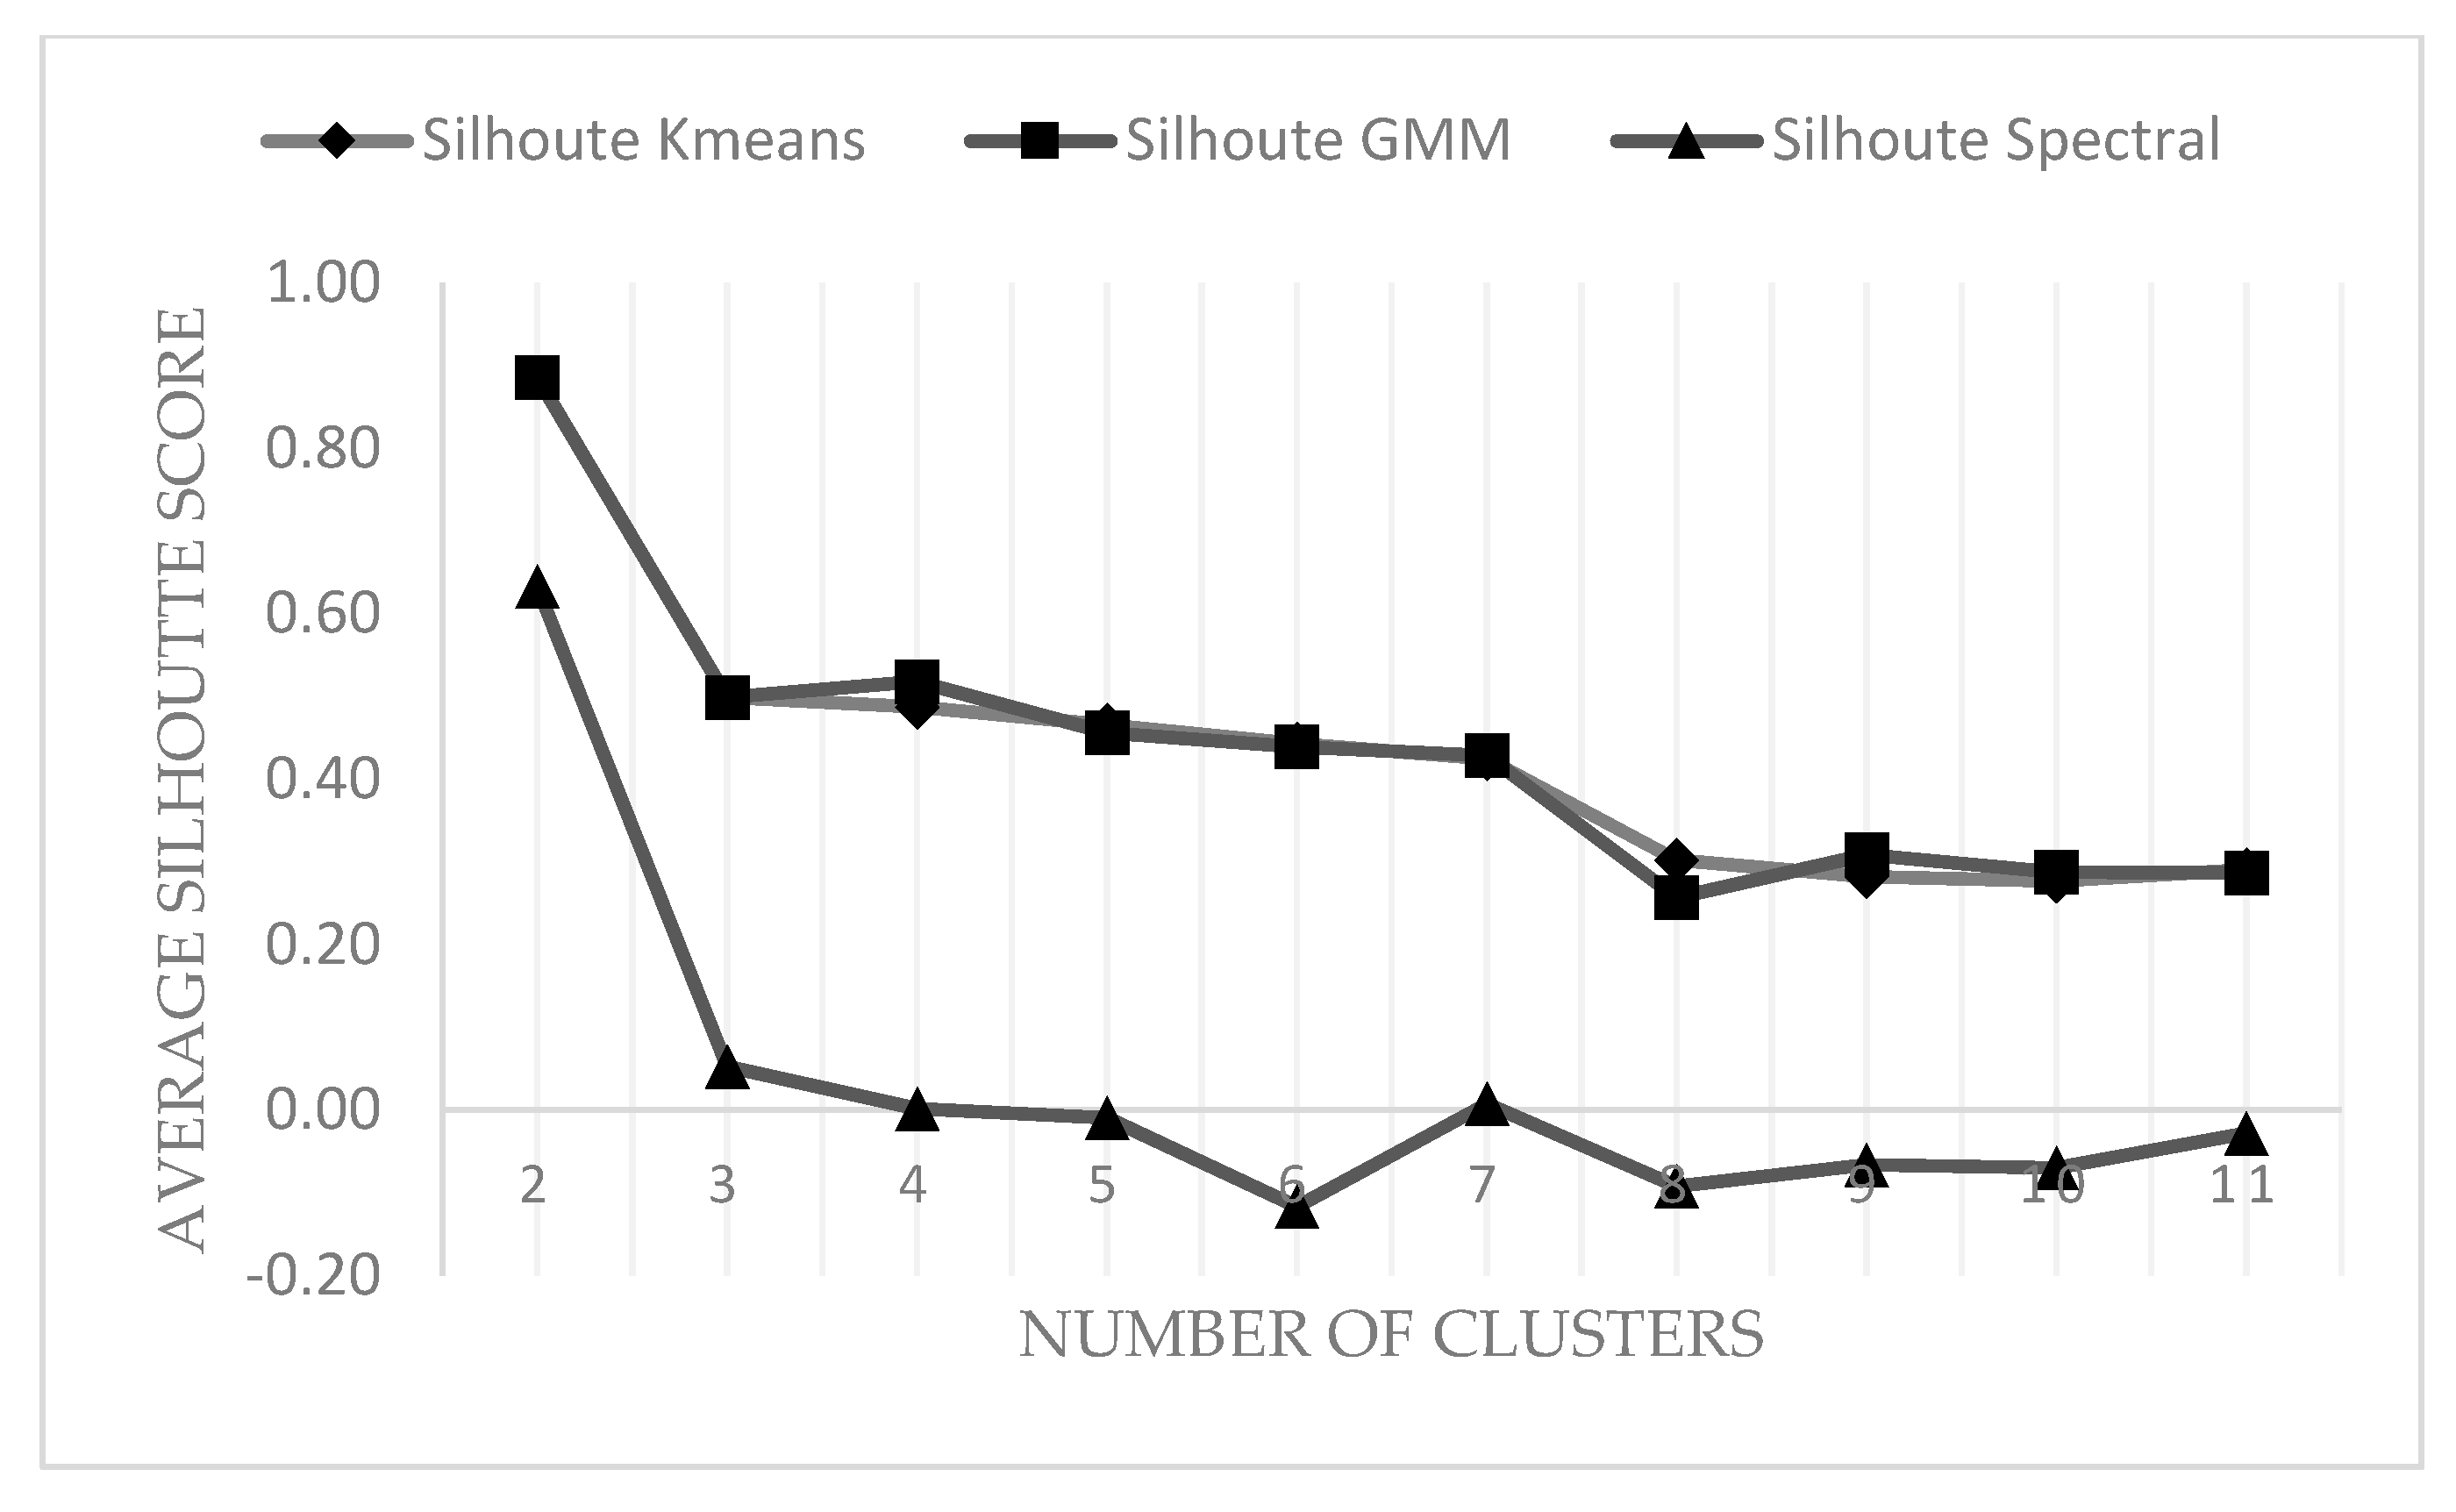
2.5. Determine the Number of Clusters and Evaluate Clustering Performance: Silhouette Coefficient

Silhouette Coefficient or silhouette score is a cluster validity measure for evaluating clustering performance. To calculate the Silhouette score for each observation/data point, the following distances need to be found out for each observation belonging to all the clusters.
  • Mean distance between the observation and all other data points in the same cluster. This distance can also be called a mean intra-cluster distance. This mean distance is denoted by a ( i )
  • Mean distance between the observation and all other data points of the next nearest cluster. This distance can also be called a mean nearest-cluster distance. The mean distance is denoted by b ( i )
Silhouette score, s ( i ) , for each sample is calculated using the following formula:
s ( i ) = b ( i ) a ( i ) max { a ( i ) b ( i ) }
Silhouette coefficient values ranges from −1 to 1. Silhouette coefficients near +1 indicate that clusters are well apart from each other and clearly distinguished. A value of 0 indicates that the clusters are indifferent, or we can say that the distance between clusters is not significant and negative values indicate that clustering configuration may have too many or too few clusters. Since silhouette coefficients are used to study the separation distance between the resulting clusters it is possible to use it to select the number of clusters for clustering techniques.

3. Materials & Methods

3.1. Comparative Study of Mexican Universities

The Comparative Study of Mexican Universities [17] is a research project developed by the General Directorate of Institutional Evaluation of the National Autonomous University of Mexico (UNAM) that systematizes, analyzes, and disseminates statistical series, compiled in official sources and recognized databases, which allow to contrast the development of Mexican universities in their substantive functions: higher learning, research, and dissemination of culture.
The CSMU is not a hierarchical classification (ranking) of Mexican higher education institutions but rather it is presented as an alternative to the existing rankings; because its objective is not to rate the universities or build regulations under certain assumptions about the quality or prestige of the institutions and their programs, in contrast, it seeks to provide items of information from public access sources, objective data that covers both the characteristics of institutions such as the substantive functions of university activities.
In this sense, the CSMU favors the presentation of raw data without the use of groupings or weightings, because this type of practice causes the results to always end up being questioned. These characteristics of the CSMU allow users to be responsible for establishing the comparisons and relationships that may exist among the different existing information items, or building indicators based on their own needs and analysis perspectives. Likewise, users are responsible for adapting their interpretations to the different characteristics that Mexican universities have among them [18].
The CSMU data in this study include 60 Mexican universities (45 public and 15 private) but the UNAM from 2009 to 2017. These universities concentrate more than 50 percent of Mexico’s higher education enrollment. The database provides information on the following items:
  • Teachers, tuition, and academic programs.
  • Production of patents by Mexican institutions. It includes data on patents applied for and granted, according to the records of the Mexican Institute of Industrial Protection (MIIP).
  • Participation of institutions in documents, articles and citations indexed in international bibliographic databases: ISI, Web of Knowledge, SciVerse, Scopus, etc.
  • Participation of institutions in documents and articles indexed in the regional databases (Latin American citations in social sciences and humanities) and Periódica (index of Latin American journals in science).
  • Academics of the institutions in the National System of Researchers (SNI) of the National Council of Science and Technology (CONACYT).
  • Research journals indexed by Latindex (Latin American Index of Serial Scientific Publications) and the CONACYT Index.
  • Academic bodies recognized in the National Program for the Improvement of Teachers (PROMEP), currently known as the Program for Teacher Professional Development (PRODEP) of the Ministry of Public Education (SEP).
  • Postgraduate programs recognized in CONACYT’s National Register of Quality Postgraduate Programs (PNPC).
  • Higher education programs evaluated by the Inter-Institutional Committees for the Evaluation of Higher Education (CIEES) and programs accredited by agencies recognized by the Council for the Accreditation of Higher Education (COPAES).
The results of the study for each of these nine items are published on a dynamic web page with systematized information, which can be consulted through the Data Explorer of the Comparative Study of Mexican Universities.

3.2. Application Instance: 60 ExECUM Universities

The ExECUM database was split into two independent databases taking into account the factors of higher learning and research. The information contained into the higher learning independent database is as follows:
Teachers instructing
  • Contract: Full time, 3/4-time, 1/2-time, hourly hired.
  • Academic degree: Higher Technical University, bachelor’s degree, specialty, master’s degree, doctorate.
Number of graduated students.
  • Level: Bachelor’s degree, specialty, master’s degree, doctorate.
Academic programs offered.
  • Level: Bachelor’s degree, specialty, master’s degree, doctorate.
On the other hand, the information contained into the research independent database is described below:
SNI researchers
  • Researchers: Candidate, level I, level II, level III
PROMEP academic bodies
  • Consolidated, in consolidation, in formation.
ISI
  • Articles: Institutional production, analysis by author, collaborators, citations.
  • Documents: Institutional production, analysis by author, collaborators, citations.
SCOPUS
  • Articles: Institutional production, analysis by author, collaborators, citations.
  • Documents: Institutional production, analysis by author, collaborators, citations.
Patents
  • Pending or granted journals.
  • Latindex or CONACYT index
PNPC postgraduates
  • Doctorate: International competence, consolidated, developing, newly created
  • Master’s Degree: International competence, consolidated, developing, newly created.
  • Specialty: International competence, consolidated, developing, newly created

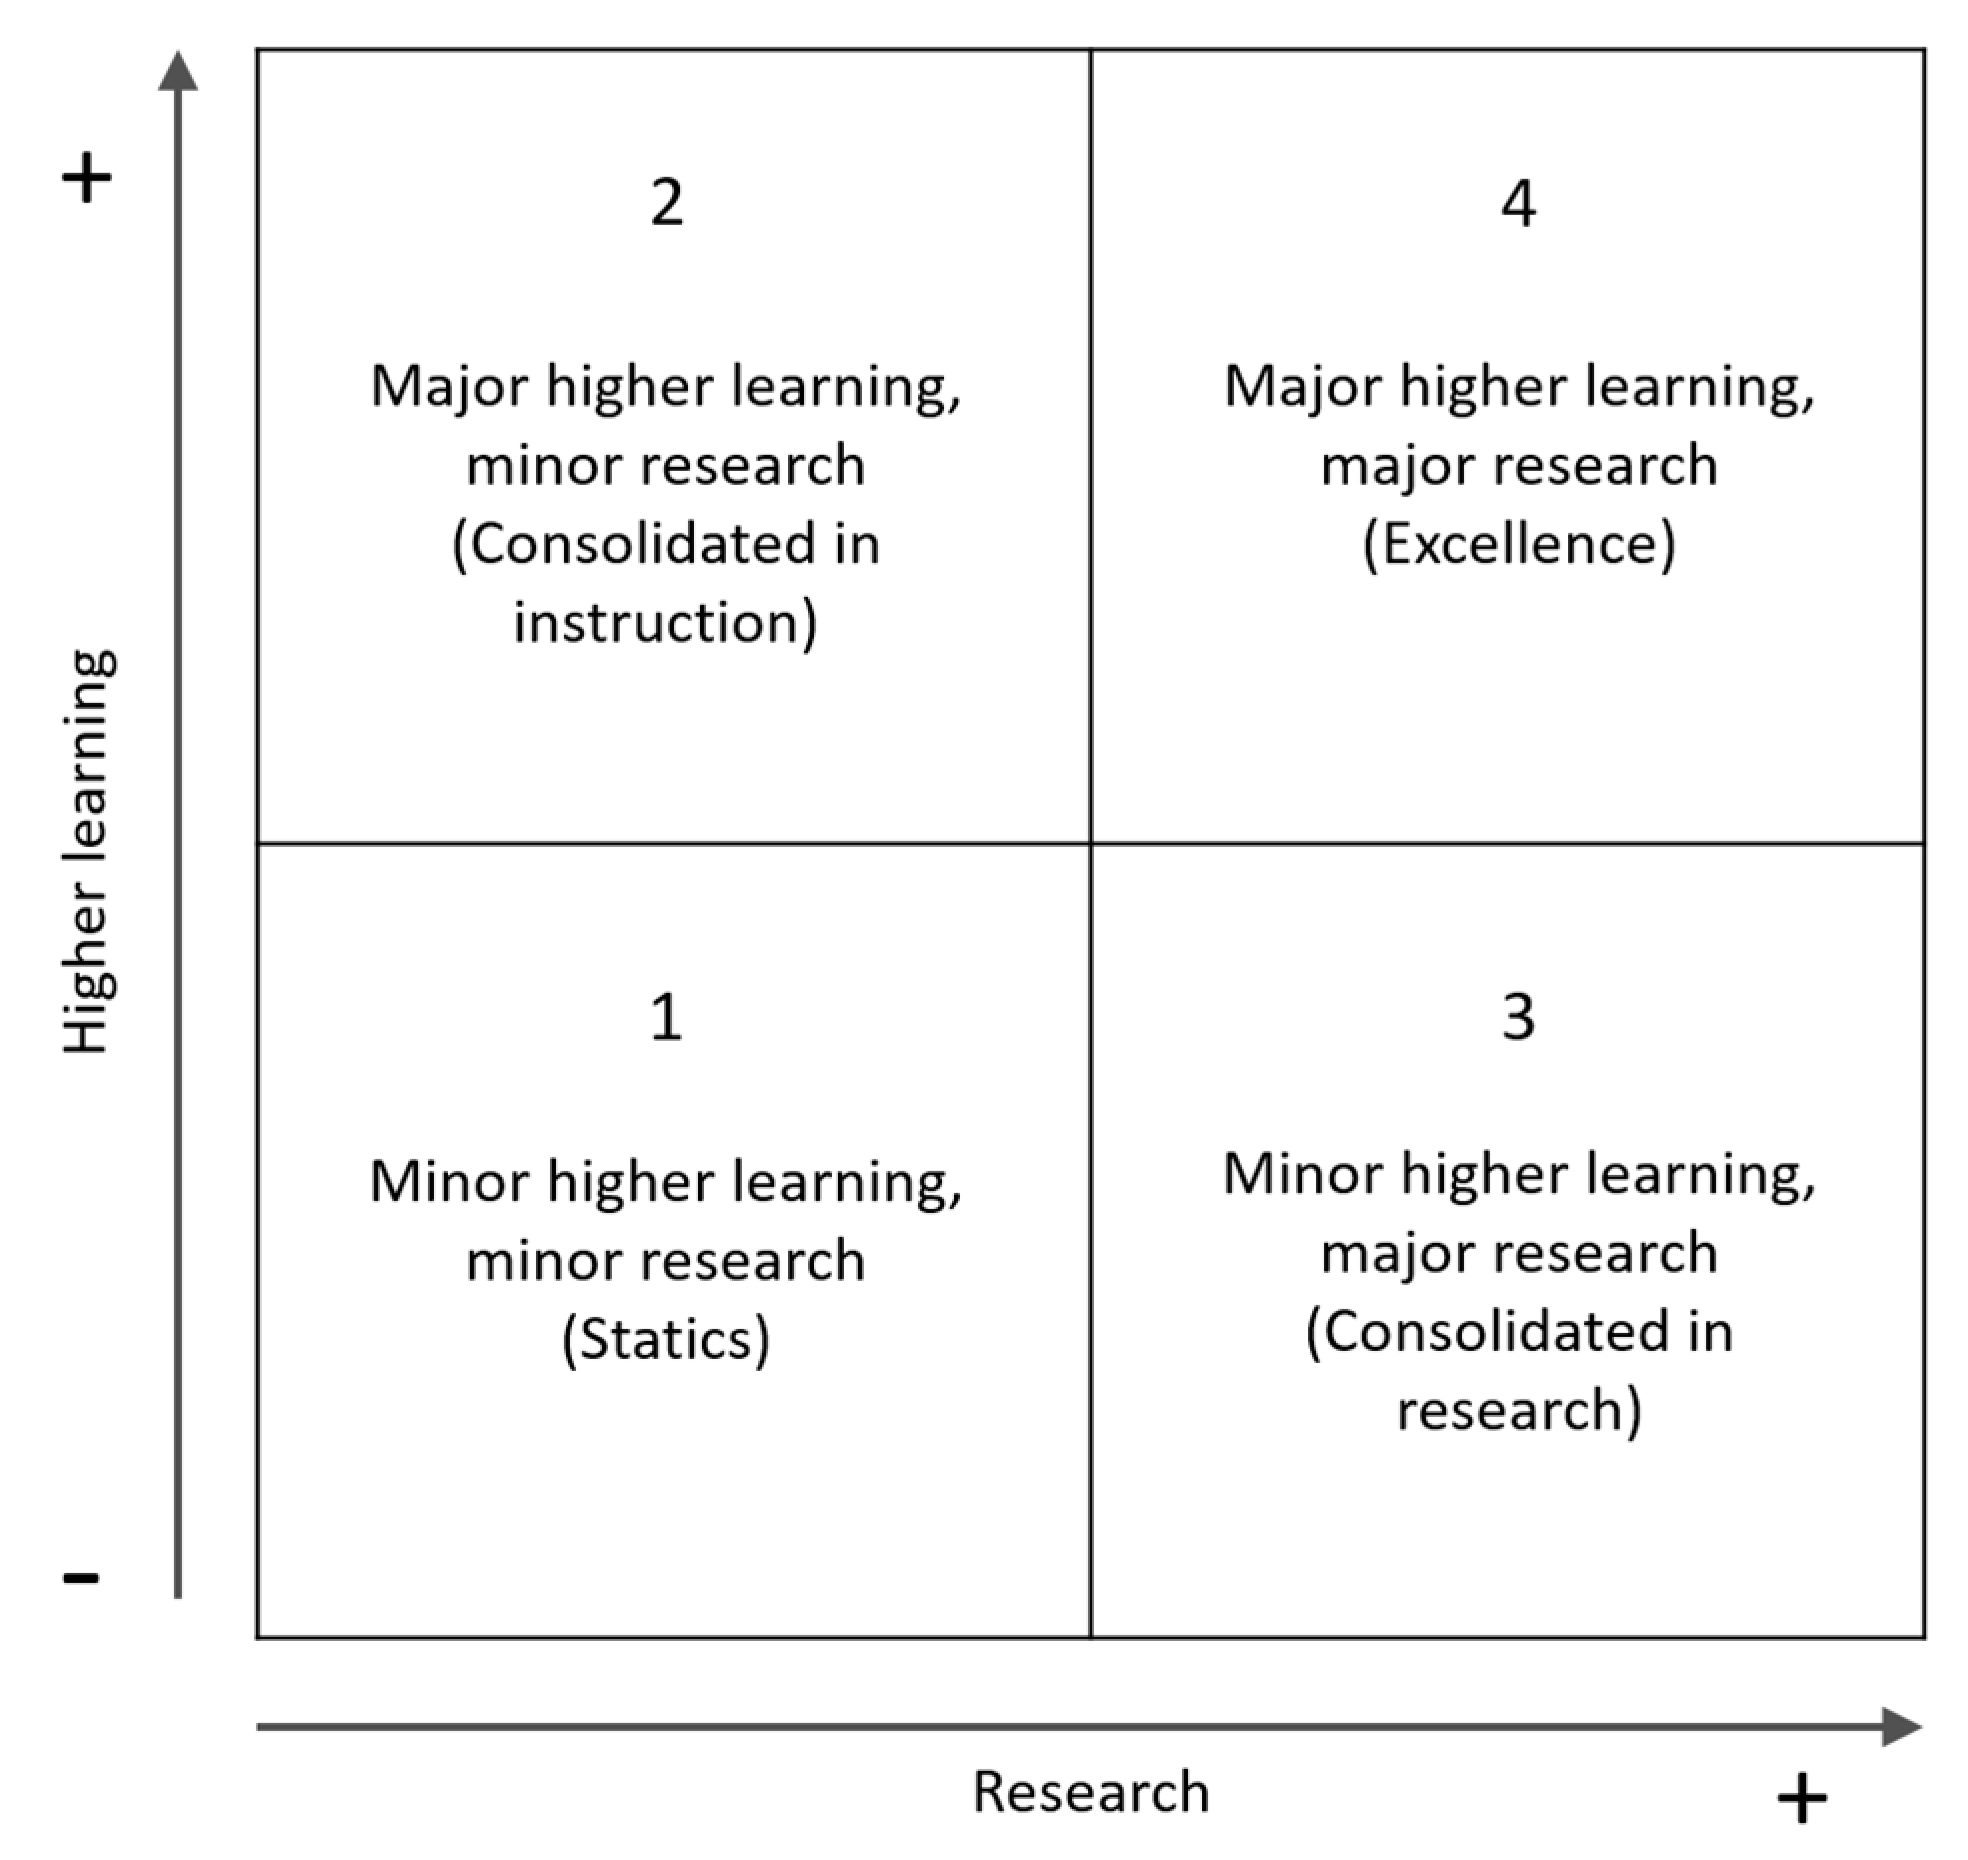
3.3. Proposed Matrix Model

Among many activities that take place within a university (management, dissemination of culture, sports activities, among others), the most important areas were the training of undergraduate and graduate students, as well as research. Only these two last items were taken into consideration for the proposed model. The available data referring to higher learning were used, such as: number of full-time or part-time teachers, maximum degree of studies, number of enrolled students, number of graduated students, and academic programs offered. While in research part, the number of research articles that are in different international indexes (JCR, ISI, Scopus, Latindex, Zentralblat Math, among others) can be considered, as well as the number of patents generated or citations in international journals.
Universities can be classified using the clustering strategies previously described and historical data. From available data it is possible to assign an order from highest to lowest; for example, considering the distance of the centroids with respect to the origin, the centroids closest to the origin imply a lower performance (fewer graduate students or fewer research articles generated).
Considering the dimensions already described, a matrix can be structured where the classification according to higher learning can be shown in the vertical axis and research in the horizontal axis, see Figure 1.
This model is divided into four classification quadrants: the first quadrant will contain static institutions, that is, with minor higher learning and minor research. The second quadrant will have consolidated institutions in higher learning; that is, those institutions with minor research and major higher learning. The third one will house consolidated research institutions, that is, with major research and minor higher learning. Finally, in the fourth quadrant will be the excellence institutions, this means that those universities on this site have the best results in both higher learning and research.
As mentioned above, and in order to locate the institutions, the original database was divided in two parts: part 1 corresponding to higher learning and part 2 corresponding to research. Each part was solved separately using the aforementioned clustering algorithms. In this way, the cases in Table 1 will be had for each clustering technique:
Using the matrix in Figure 1, arrows will be used to show existing the institutions transitions among the quadrants, indicating at the top of each one the year in which they occurred; on the other hand, the highlighted institutions will be those that remained in the same group throughout the study.
Regarding evaluation, two different types of results were obtained: those that include the UNAM and those that do not include it, its presence represents an imbalance for the instances since this institution is quite far from the others in terms of size and, hence, in their higher learning and research capacity, whereby the distances between this institution and the others are shortened.
To demonstrate the above, first PCA analysis was applied on the databases from higher studies and research, and then, it was analysed how many dimensions are necessary to maintain the largest possible variance of both databases. The results of the PCA analysis based on higher studies database from the years 2009 to 2017 are shown in Figure 2:
As it can be seen on Figure 2, only one component represents 85% of variance of the higher studies database. Similarly, an analysis using PCA considering research database is shown in Figure 3:
In Figure 3 is shown that only one component represents around 81% of data variance of the research database. After PCA analysis and considering results in Figure 2 and Figure 3, the graph that can be seen in Figure 4 was created; it might seem remarkable that the sum of the variation in this graph exceeds 100%. This is because, as commented in previous paragraphs, the CSMU database was separated into two databases corresponding to higher learning and research and then, reducing all the higher learning database dimensions to a single principal component that is projected on the ordered axis and reducing all the research database dimensions to a principal component which is projected on the abscissa axis; the graph was created maintaining a total data variance of 85% and 81% for every database respectively, for this reason the sum of both axes exceeds 100%.
As it can be seen in Figure 4, UNAM is far away from other institutions and it causes that all of them are seen into a single group; however, by eliminating UNAM, as it can be seen in the Figure 5, a separation among the institutions becomes clear. At first glance the IPN, UAM and CINVESTAV appear to be the best institutions in research, whereas IPN and UdeG are the best universities in higher learning. It should be mentioned that the previous graphs are only representative of the total data in a certain percentage of the total available information, because, in the case of the component under research, PCA maintains a total data variance of 81% for research database, while in higher learning component, a total data variance of 85% for higher learning database is maintained.
After setting aside UNAM from the instance, the number of groups to cluster were determined using the silhouette coefficient method. It was applied over research and higher learning instances to determine the number of clusters. The comparisons for the three clustering techniques are on Figure 6 and Figure 7.
The results given by the silhouette coefficient method show in Figure 6 and Figure 7 that best number to classify the instances is 2. Moreover, this analysis is helpful for evaluating clustering performance where the highest values mean a better performance.

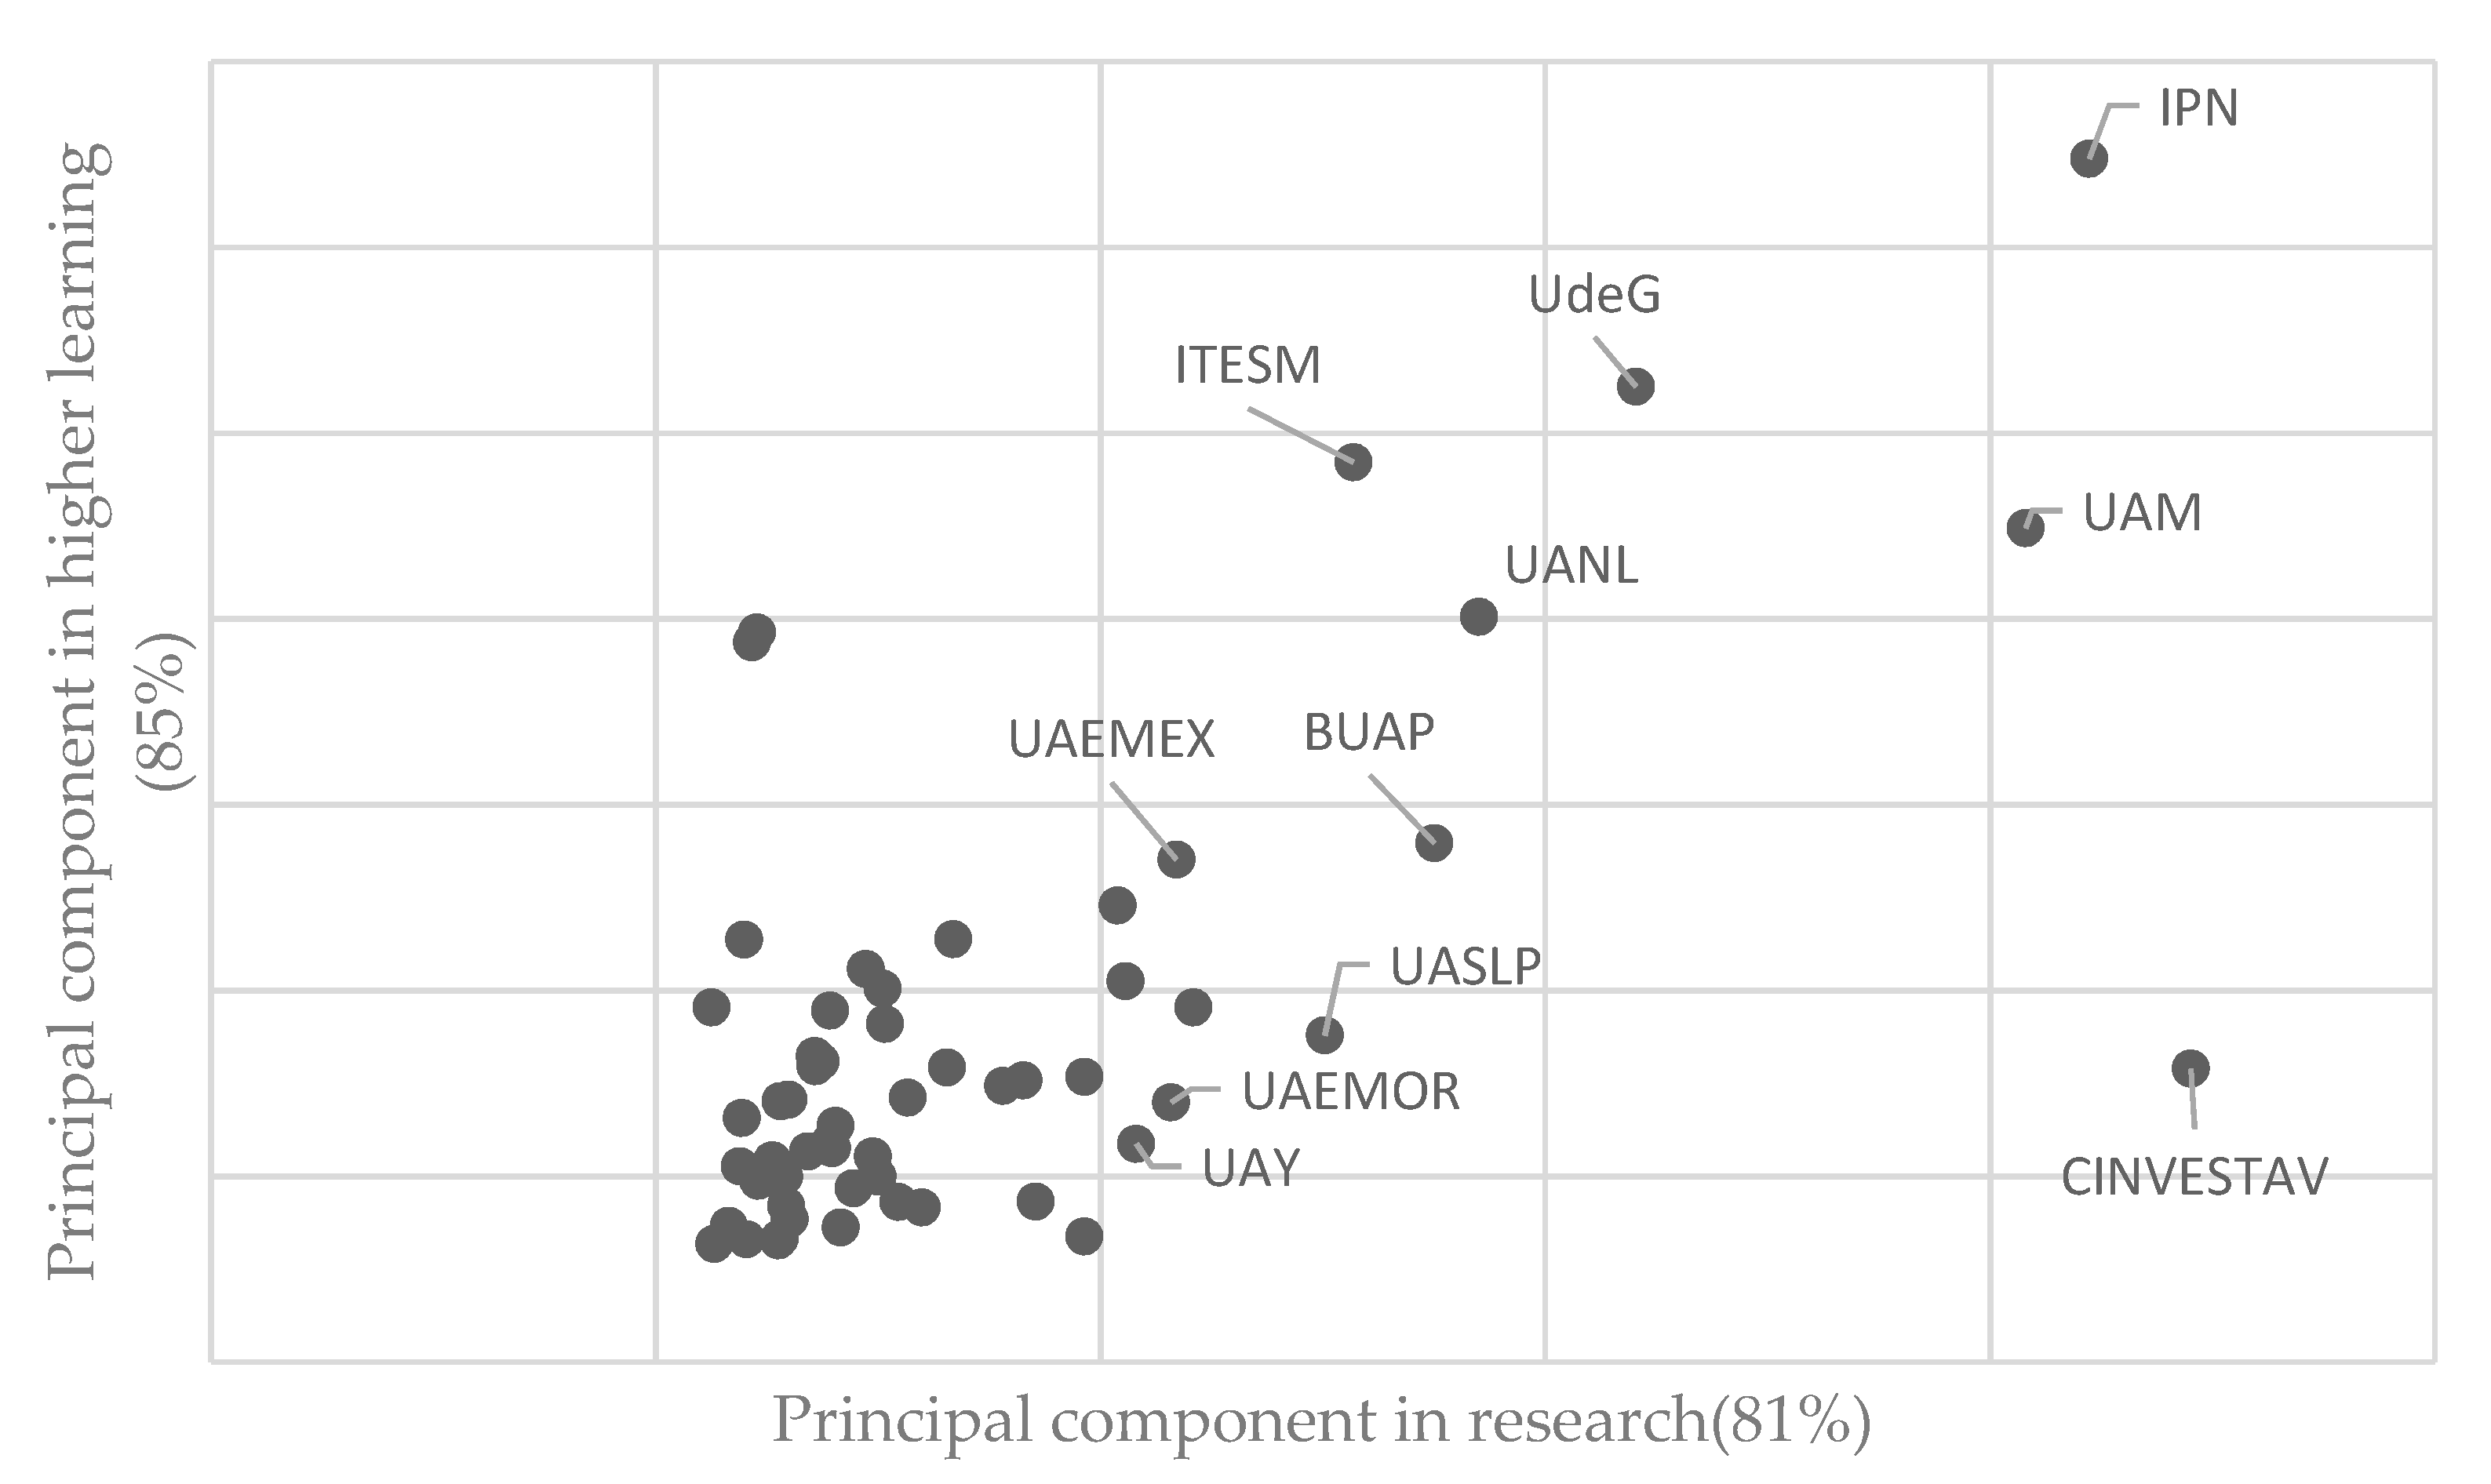
4. Results and Analysis

4.1. k-means Results

This section may be divided by subheadings. It should provide a concise and precise description of the experimental results, their interpretation, as well as the experimental conclusions that can be drawn.
The result of this is that each cluster is associated not with a hard-edged sphere, but with a smooth Gaussian model. Although GMM is categorized as a clustering algorithm, it is technically a generative probabilistic model describing the data distribution; due to this property, there are two important limitations with GMM: the first one is about its computation complexity because it is necessary to calculate the distributions, and whereby the algorithm can fail if the dimensionality of the problem is too high; the second limitation is that in many instances, the number of groups is unknown and it may be necessary to experiment with a number of different groups in order to find the most suitable.
Table 2 shows the classification with k-means. Items not included belong to quadrant 1, which includes institutions that are not good in either of the two areas. It can be seen at first glance that there are institutions that remain there throughout time such as The National Polytechnic Institute (IPN), the Metropolitan Autonomous University (UAM) and the University of Guadalajara (UdeG); Likewise, in 2011 the Autonomous University of Nuevo León (UANL) entered this zone and, like the previous institutions, remained there until the last year analyzed. In addition to the UANL, there are two more institutions that follow the same trend, the Monterrey Institute of Technology and Higher Education (ITESM), which has been in this position since 2014, while the Meritorious Autonomous University of Puebla (BUAP) does so from 2015. During the last year of analysis, the Autonomous University of Mexico State (UAMEX) was added to the list. Other institutions can be seen that also vary their position during the analyzed period; these transitions can be observed in Figure 8, where the effort of the institutions to maintain or improve their status is evident throughout the study.

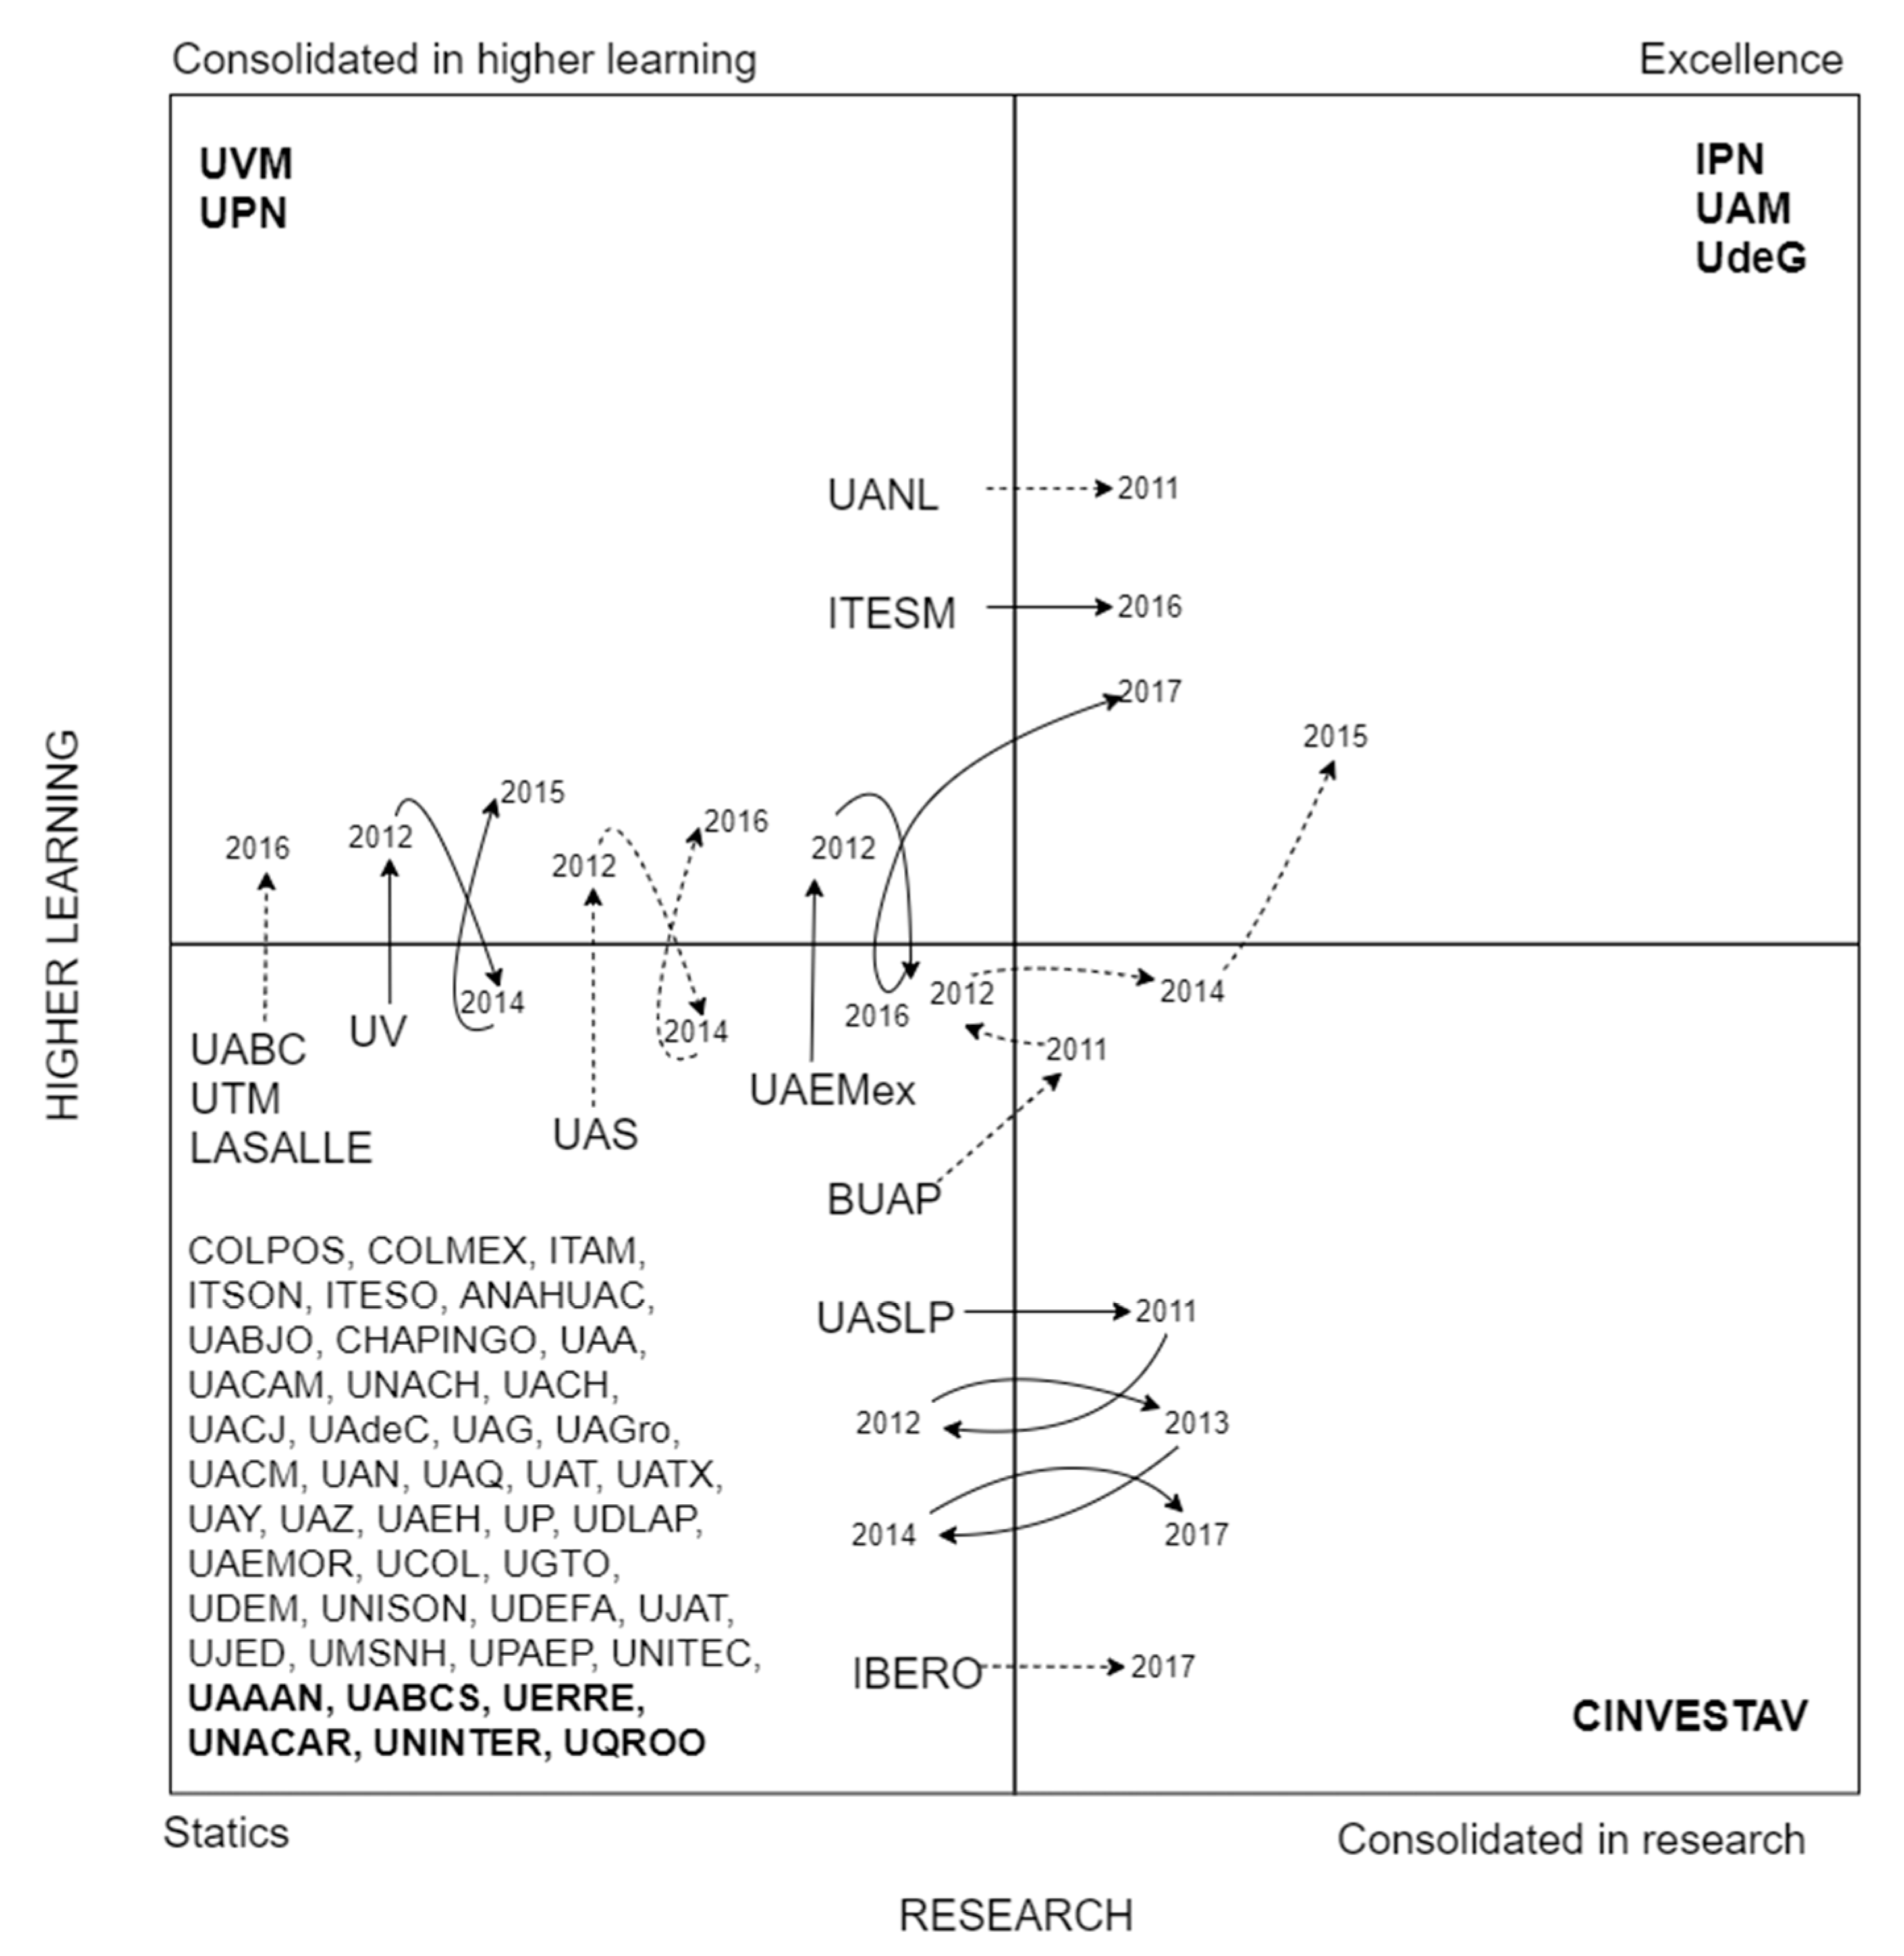
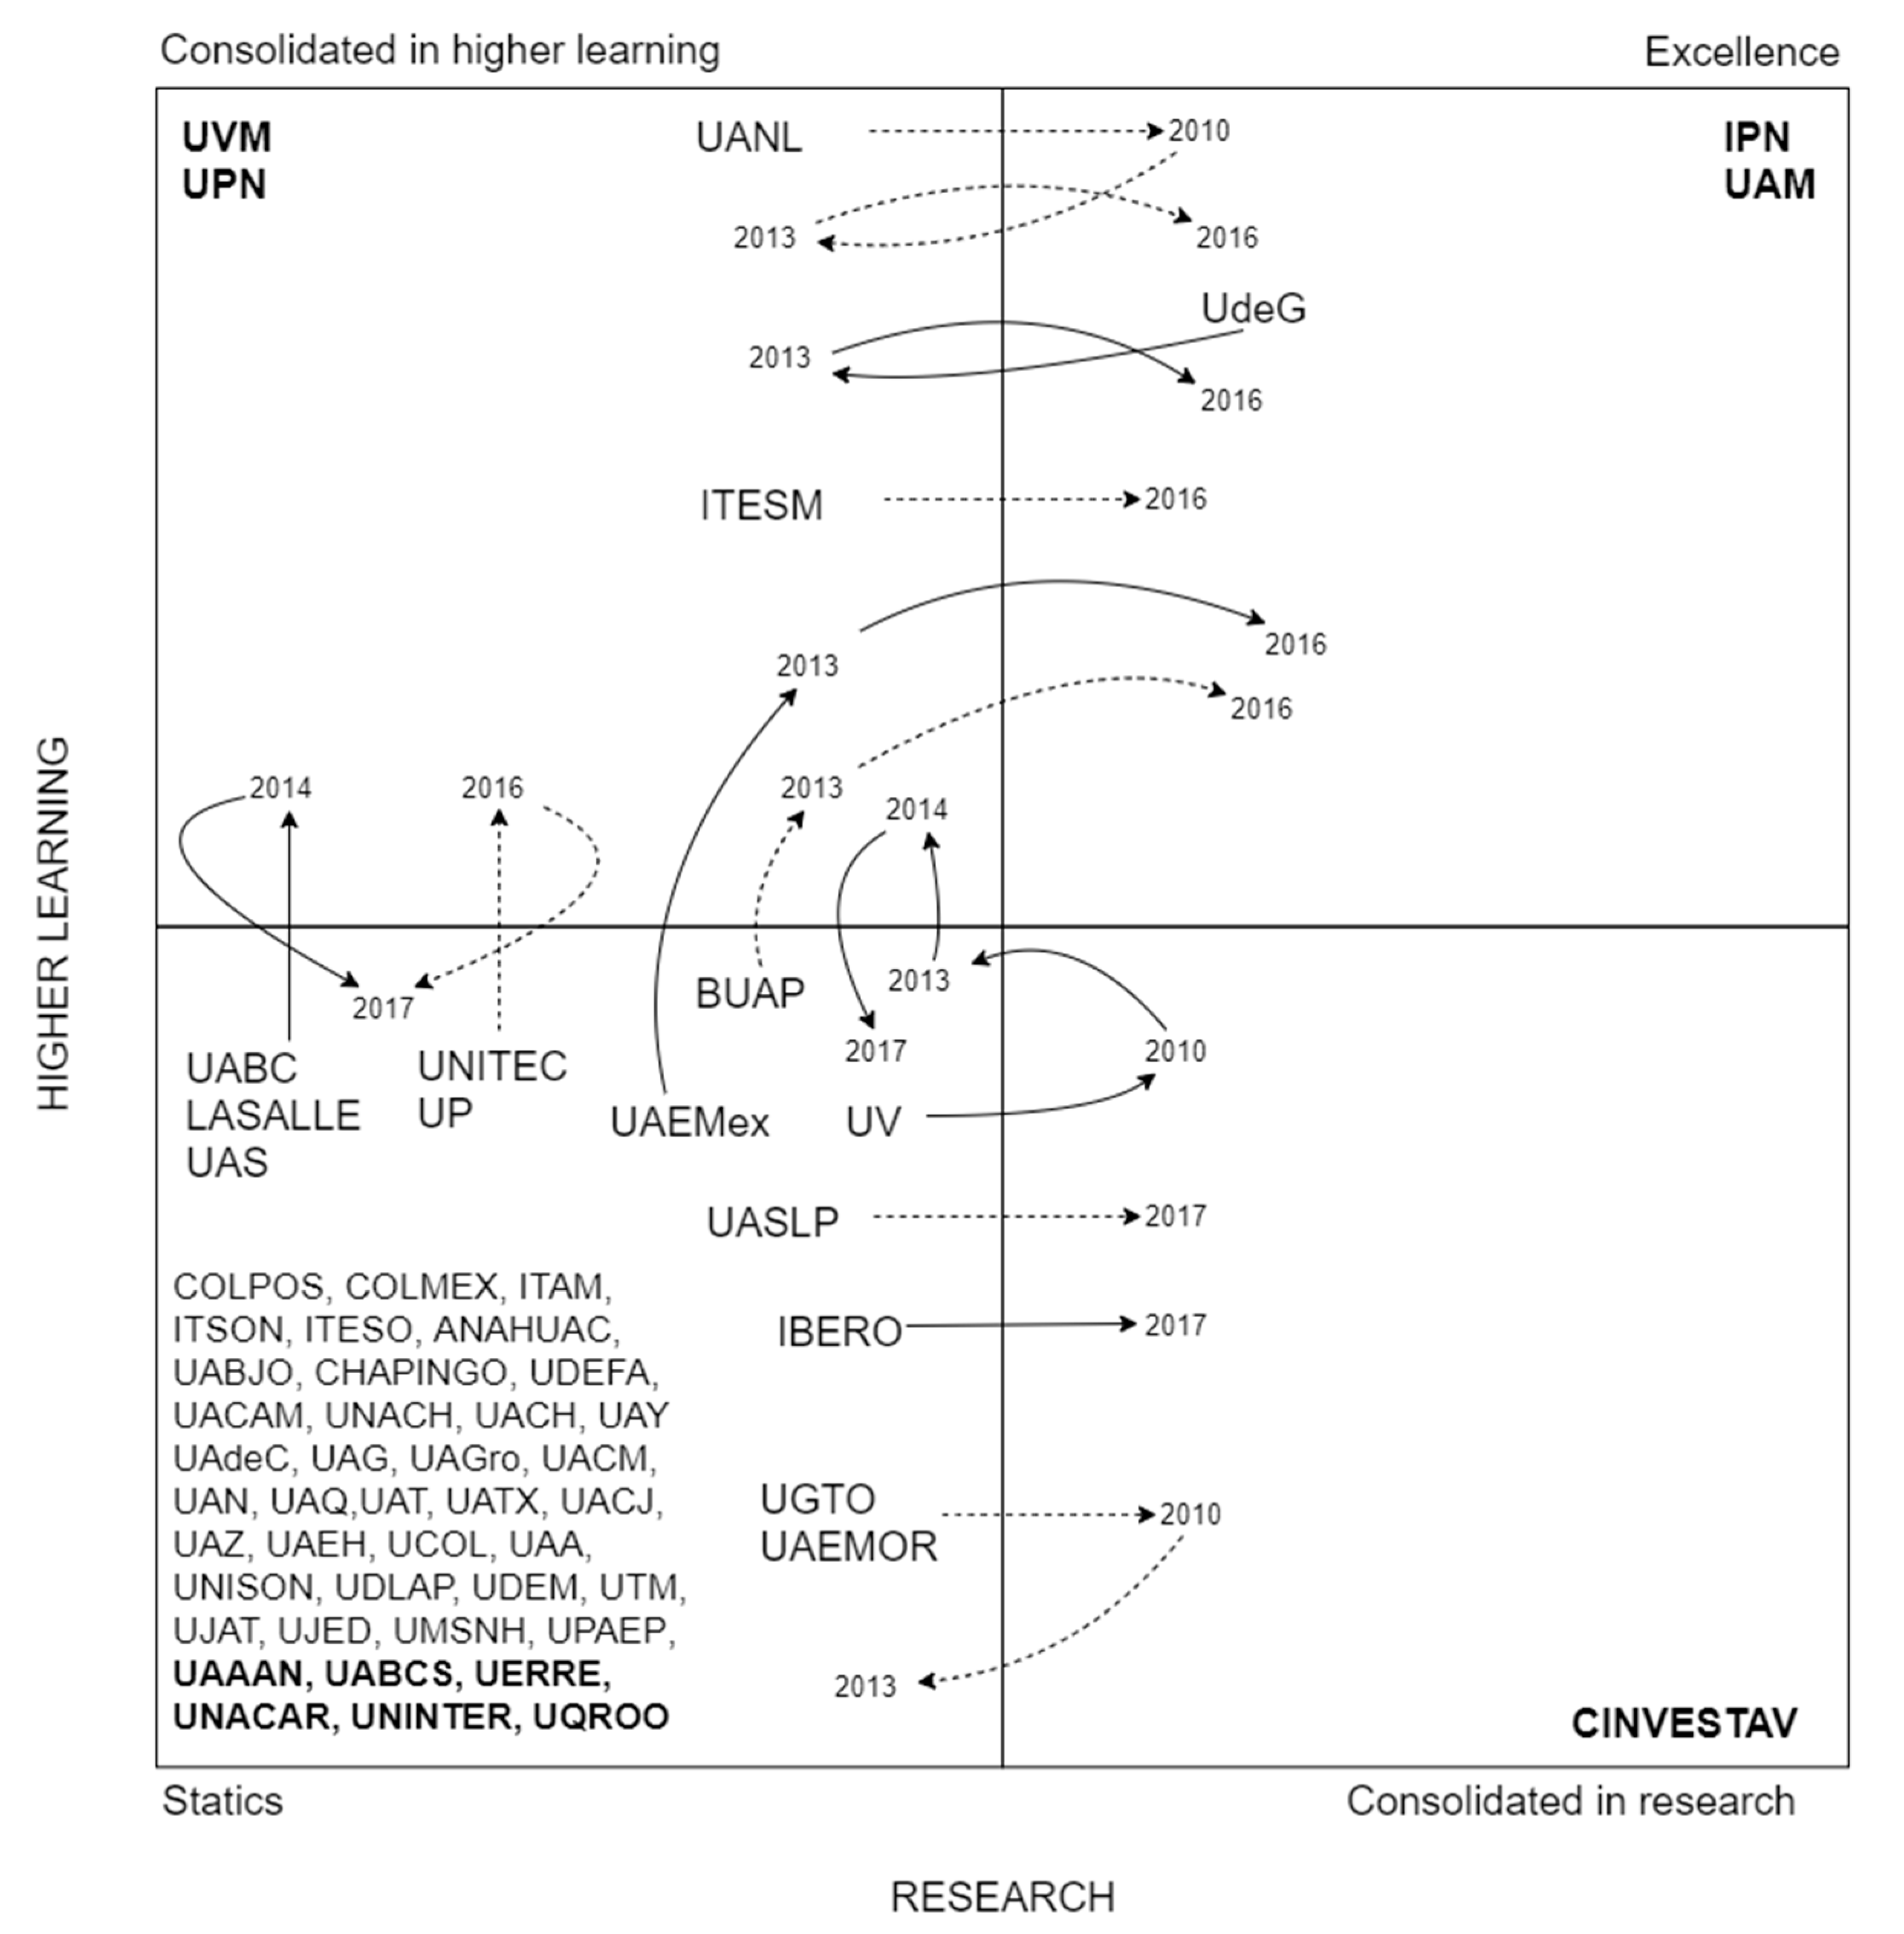
4.1.1. Invariable Universities in k-Means Analysis

  • Excellence
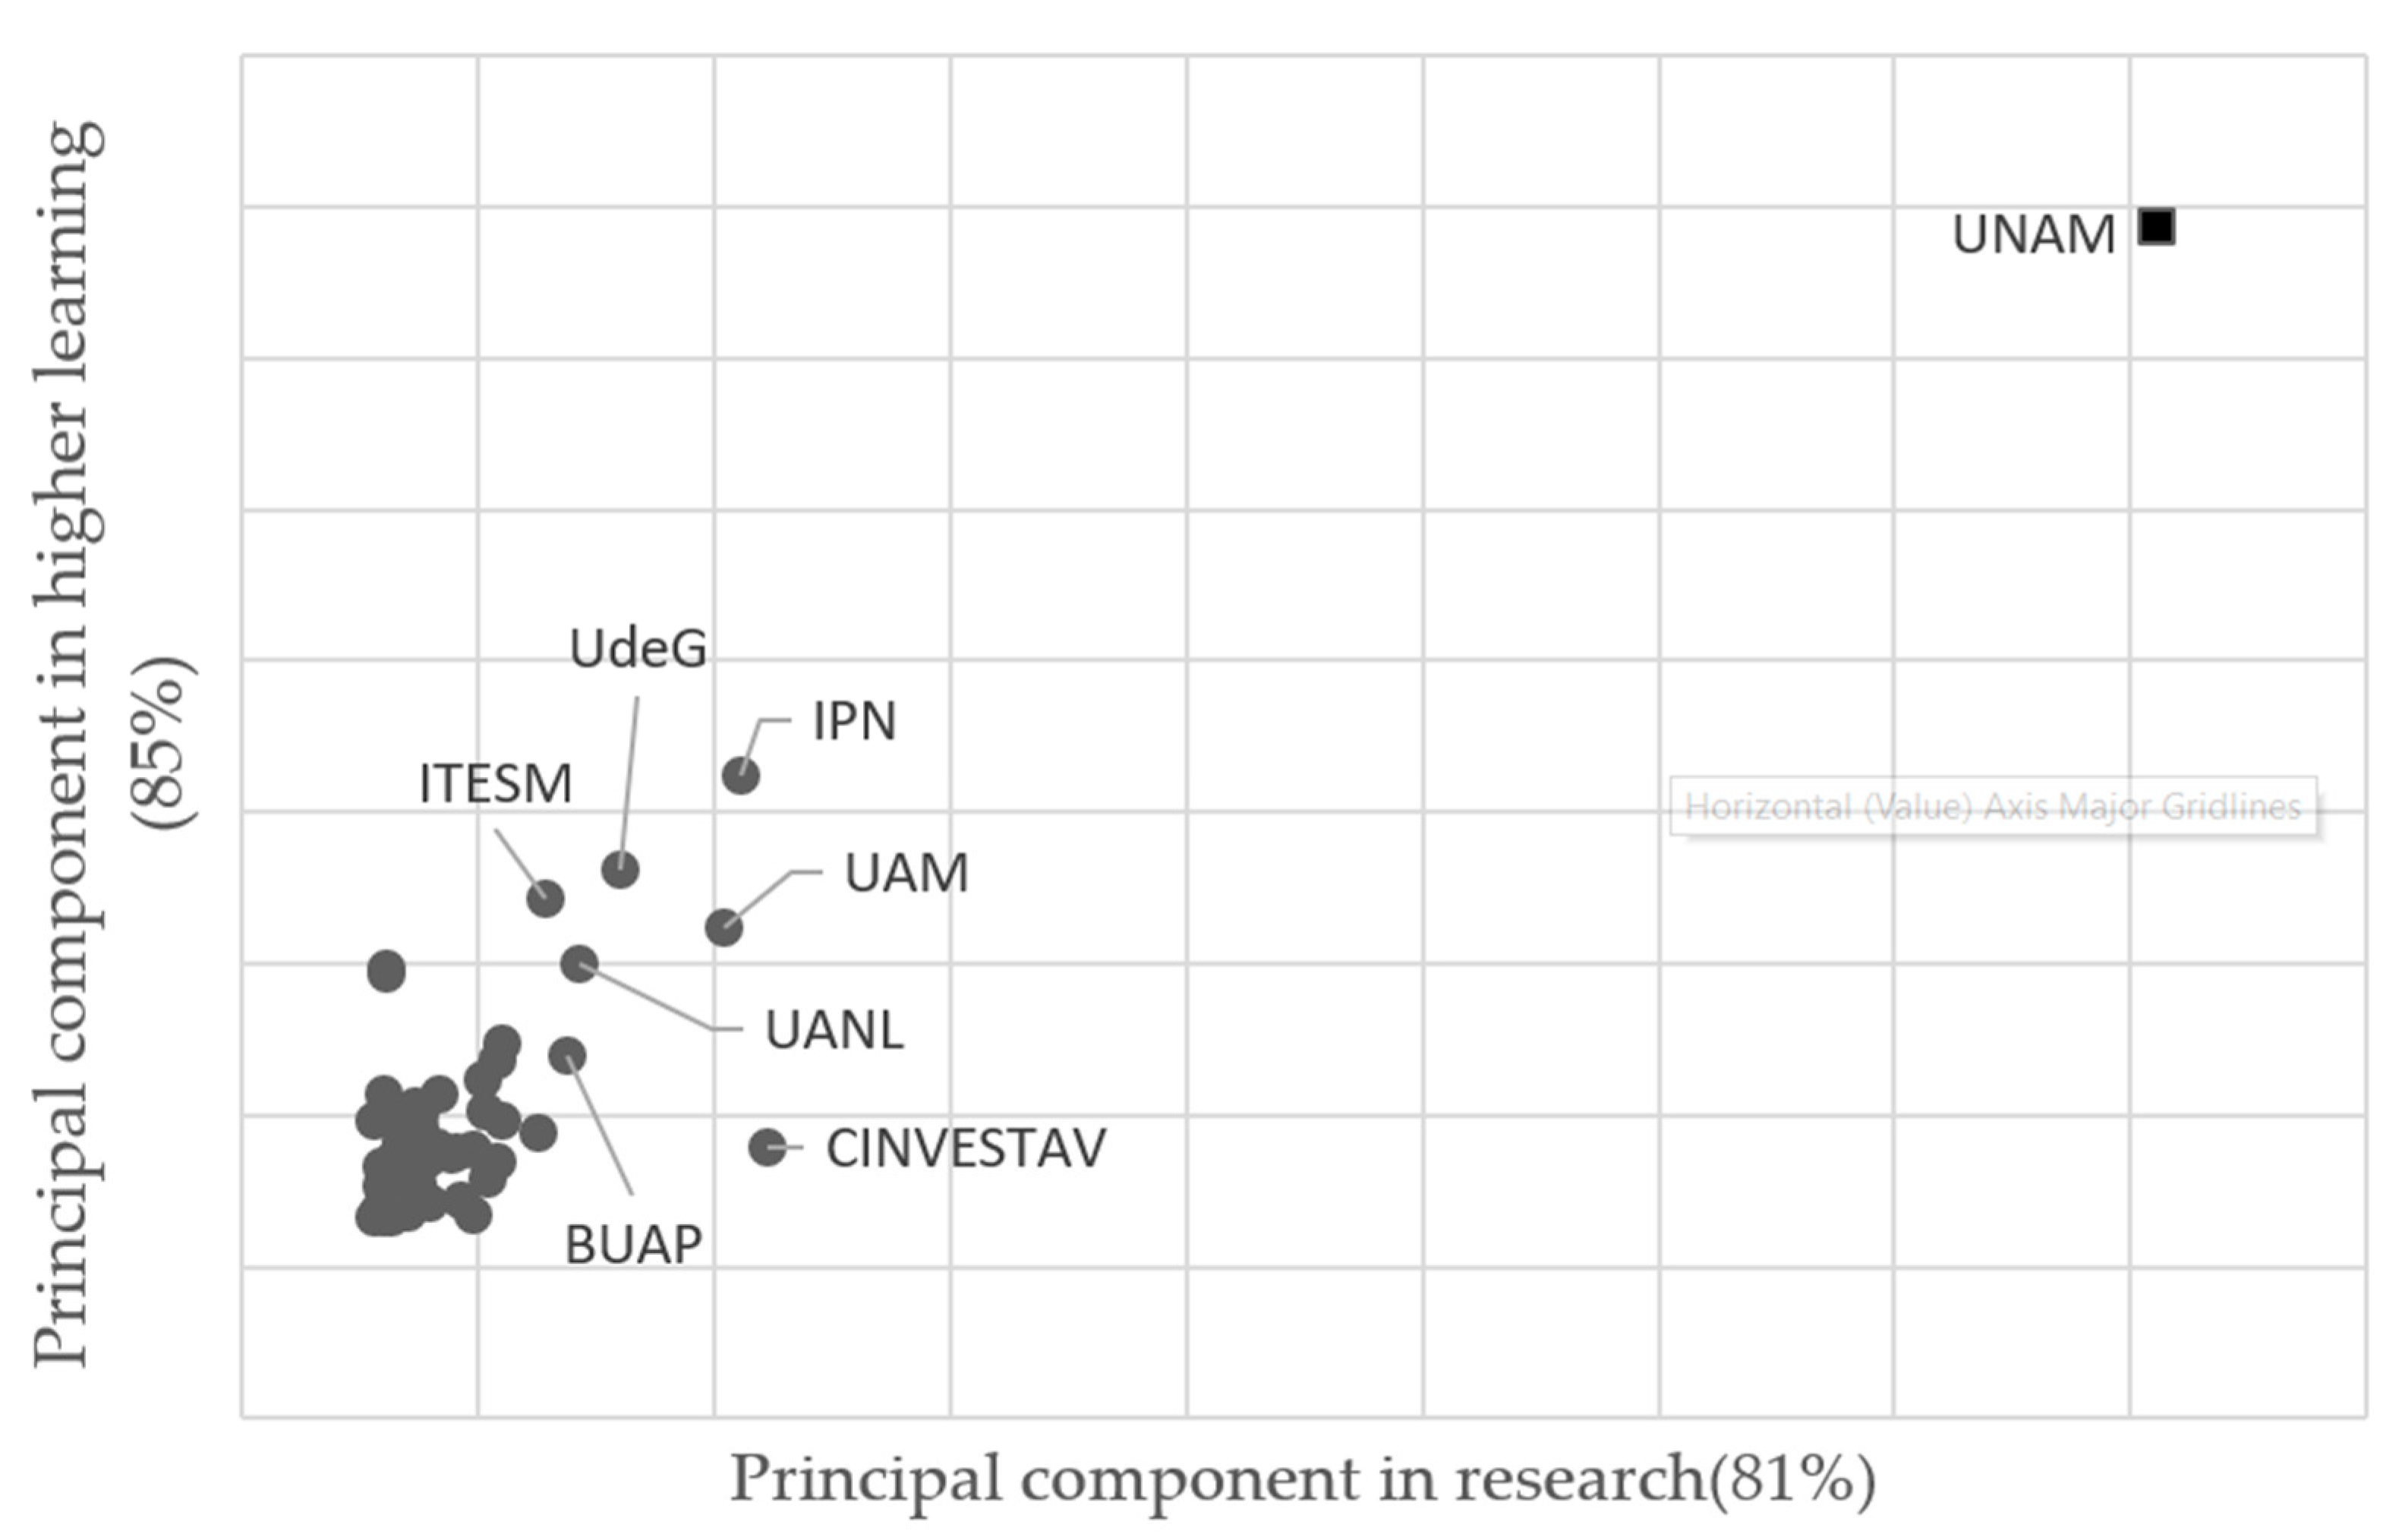
    • The invariable universities consolidated in excellence are those that, throughout the analyzed period, that is, from 2009 to 2017, excel in both higher learning and research. These are: The National Polytechnic Institute (IPN), the Metropolitan Autonomous University (UAM) and the University of Guadalajara (UdeG).
  • Consolidated only in higher learning.
    • The invariable universities consolidated in higher learning are: The University of the Mexican Valley (UVM) and the National Pedagogical University (UPN).
  • Consolidated in research.
    • The only institution considered invariably consolidated in research is the Center for Research and Advanced of the IPN (CINVESTAV).
  • Static.
    • According to k-means classification, approximately 70 percent of educational institutions fall into this category (41 of them). Their names are shown in the lower left of Figure 6.

4.1.2. Universities in Transition in k-Means Analysis

  • Universities that have improved in higher learning:
    • In 2016 La Salle University (LASALLE), the Autonomous University of Baja California (UABC) and the Technological University of Mexico (UNITEC) became part of the consolidated universities in higher learning.
    • The Autonomous University of Sinaloa (UAS) shows a tendency to consolidate higher learning because it begins hovering between static universities at the beginning of the study, and although for 2012 it is consolidated into higher learning, in 2014 it returns to the place where it started; finally, in 2016 it was consolidated again in higher learning and remained on the site until the last year analyzed.
  • Universities that have improved in research:
    • During the first years of analysis, though the Autonomous University of San Luis Potosí (UASLP) is a static institution, in 2011 it was consolidated in research, the following year it was once again part of the static ones; and this behavior is repeated in the following two years until it remains from 2014 to 2016 as a static institution and during the last year analyzed it is consolidated again in research. This behavior of constant transitions makes evident their interest in consolidating in research.
    • The Iberoamerican University (IBERO) remains among the static institutions for almost the entire period analyzed and it is not until the last year that this institution is consolidated in research.
  • Universities that became of excellence:
    • There are institutions such as the Autonomous University of Nuevo León (UANL) and the Monterrey Institute of Technology and Higher Education (ITESM) which begin the study as consolidated in higher learning, the study shows their interest in being of excellence, achieving their goal for the year 2011 and 2016, respectively.
    • The Meritorious Autonomous University of Puebla (BUAP) went from being a static university to one with a better research quality in 2011; However, by 2012 it was once again part of the static institutions, where it remained until 2013. During 2014 its research quality improved again and for the following year it was able to be part of the excellence institutions, maintaining that position until the last year of analysis.
    • The Autonomous University of Mexico State (UAMEX) is another institution that begins located among the static universities, but in 2012 it became consolidated in higher learning and only became static again during 2016, because for the following year it passes to be part of the excellence group.

4.2. GMM Results

Table 3 shows the classification with GMM and the elements not included belong to the static institutions, that is, minor in higher learning and research. It is evident that there are institutions that are maintained throughout the time such as: National Polytechnic Institute (IPN), Autonomous Metropolitan University (UAM) in the case of institutions of excellence; the UPN and UVM for the consolidated institutions in higher learning and the CINVESTAV as the only consolidated institution in research. Likewise, other institutions that are in transition can be observed, as shown in Figure 9, where the efforts of the institutions to maintain or improve their status is evident.
It should be mentioned that the results of this classifier algorithm are quite similar to those of the k-means algorithm; however, perhaps the biggest difference is that the GMM appears to be more sensitive to increases and decreases in the databases.

4.2.1. Invariable Universities in GMM Analysis

  • Excellence
    • Two of the invariable universities consolidated in excellence by the GMM method coincide with those obtained by k-means.
    • For this method, there are two invariable universities consolidated in excellence, these are: IPN and UAM.
  • Consolidated in higher learning
    • The results of the invariable universities consolidated in higher learning coincide with the results obtained by k-means since they only have UVM and NUP.
  • Consolidated in research
    • As with the k-means, the only institution regarded as invariable consolidated research is the CINVESTAV.
  • Static
    • Using GMM, the list of institutions is rather similar to the one provided by k-means; the only changes are UAMOR, UGTO, UP and UNITEC. The first two leaves the first quadrant in 2010 and return in 2013; while the last two leave in 2016 to return in the following year.

4.2.2. Universities in Transition in GMM Analysis

  • Universities that have improved in research.
    • In this analysis, the IBERO and the UASLP begin being static and during 2017 they were consolidated in research.
  • Universities that became of excellence:
    • Even though UdeG begins as part of the universities of excellence, it does not remain unchanged in its position, because during the period from 2013 to 2015, it is located with the consolidated institutions in higher learning, and it is until 2016 when it finally returns to be part of the excellence institutions.
    • The ITESM begins as a consolidated university in higher learning, but its interest focuses on being part of the group of excellence; thus, by 2016 it achieves its goal and becomes a fourth quadrant institution.
    • The UANL is a university with a behavior that shows its interest in being part of the g excellence group because it begins being consolidated in higher learning, for 2010 it becomes of excellence and although for the following year until 2015 it returns to the group where it started, in 2016 it is once again part of the group of excellence.
    • The BUAP and UAMEX are institutions that, despite starting out as static, focused first on consolidating themselves in higher learning, a group to which they belonged from 2013 to 2015, and then gave the highest to the universities of the fourth quadrant in 2016.
  • Universities that became static:
    • The UABC, LASALLE and the UAS are institutions that begin as part of the static group, but there is an interest in consolidating themselves in higher learning, and although they achieve their goal in the period from 2013 to 2016; finally, in the last year of analysis, these institutions became static again.
    • The UNITEC and UP are in a similar case, with the only difference that the period in which they are consolidated into higher learning corresponds only to 2016 and return to the static group in 2017.
    • The University of Guanajuato (UGTO) and the Autonomous University of Morelos State (UAMOR) are institutions that are initially part of the static group and are consolidated in research, in the period that corresponds from 2010 to 2012; after this period, they return to be static institutions until the last year analyzed.
    • The Veracruzana University (UV) is characterized by its constant transitions; in 2010 it went from being a static university to a consolidated one in research, in 2013 it returned to its starting point; the following year it consolidated its higher learning position, a place where it remained until 2016 and during 2017 it became static again.

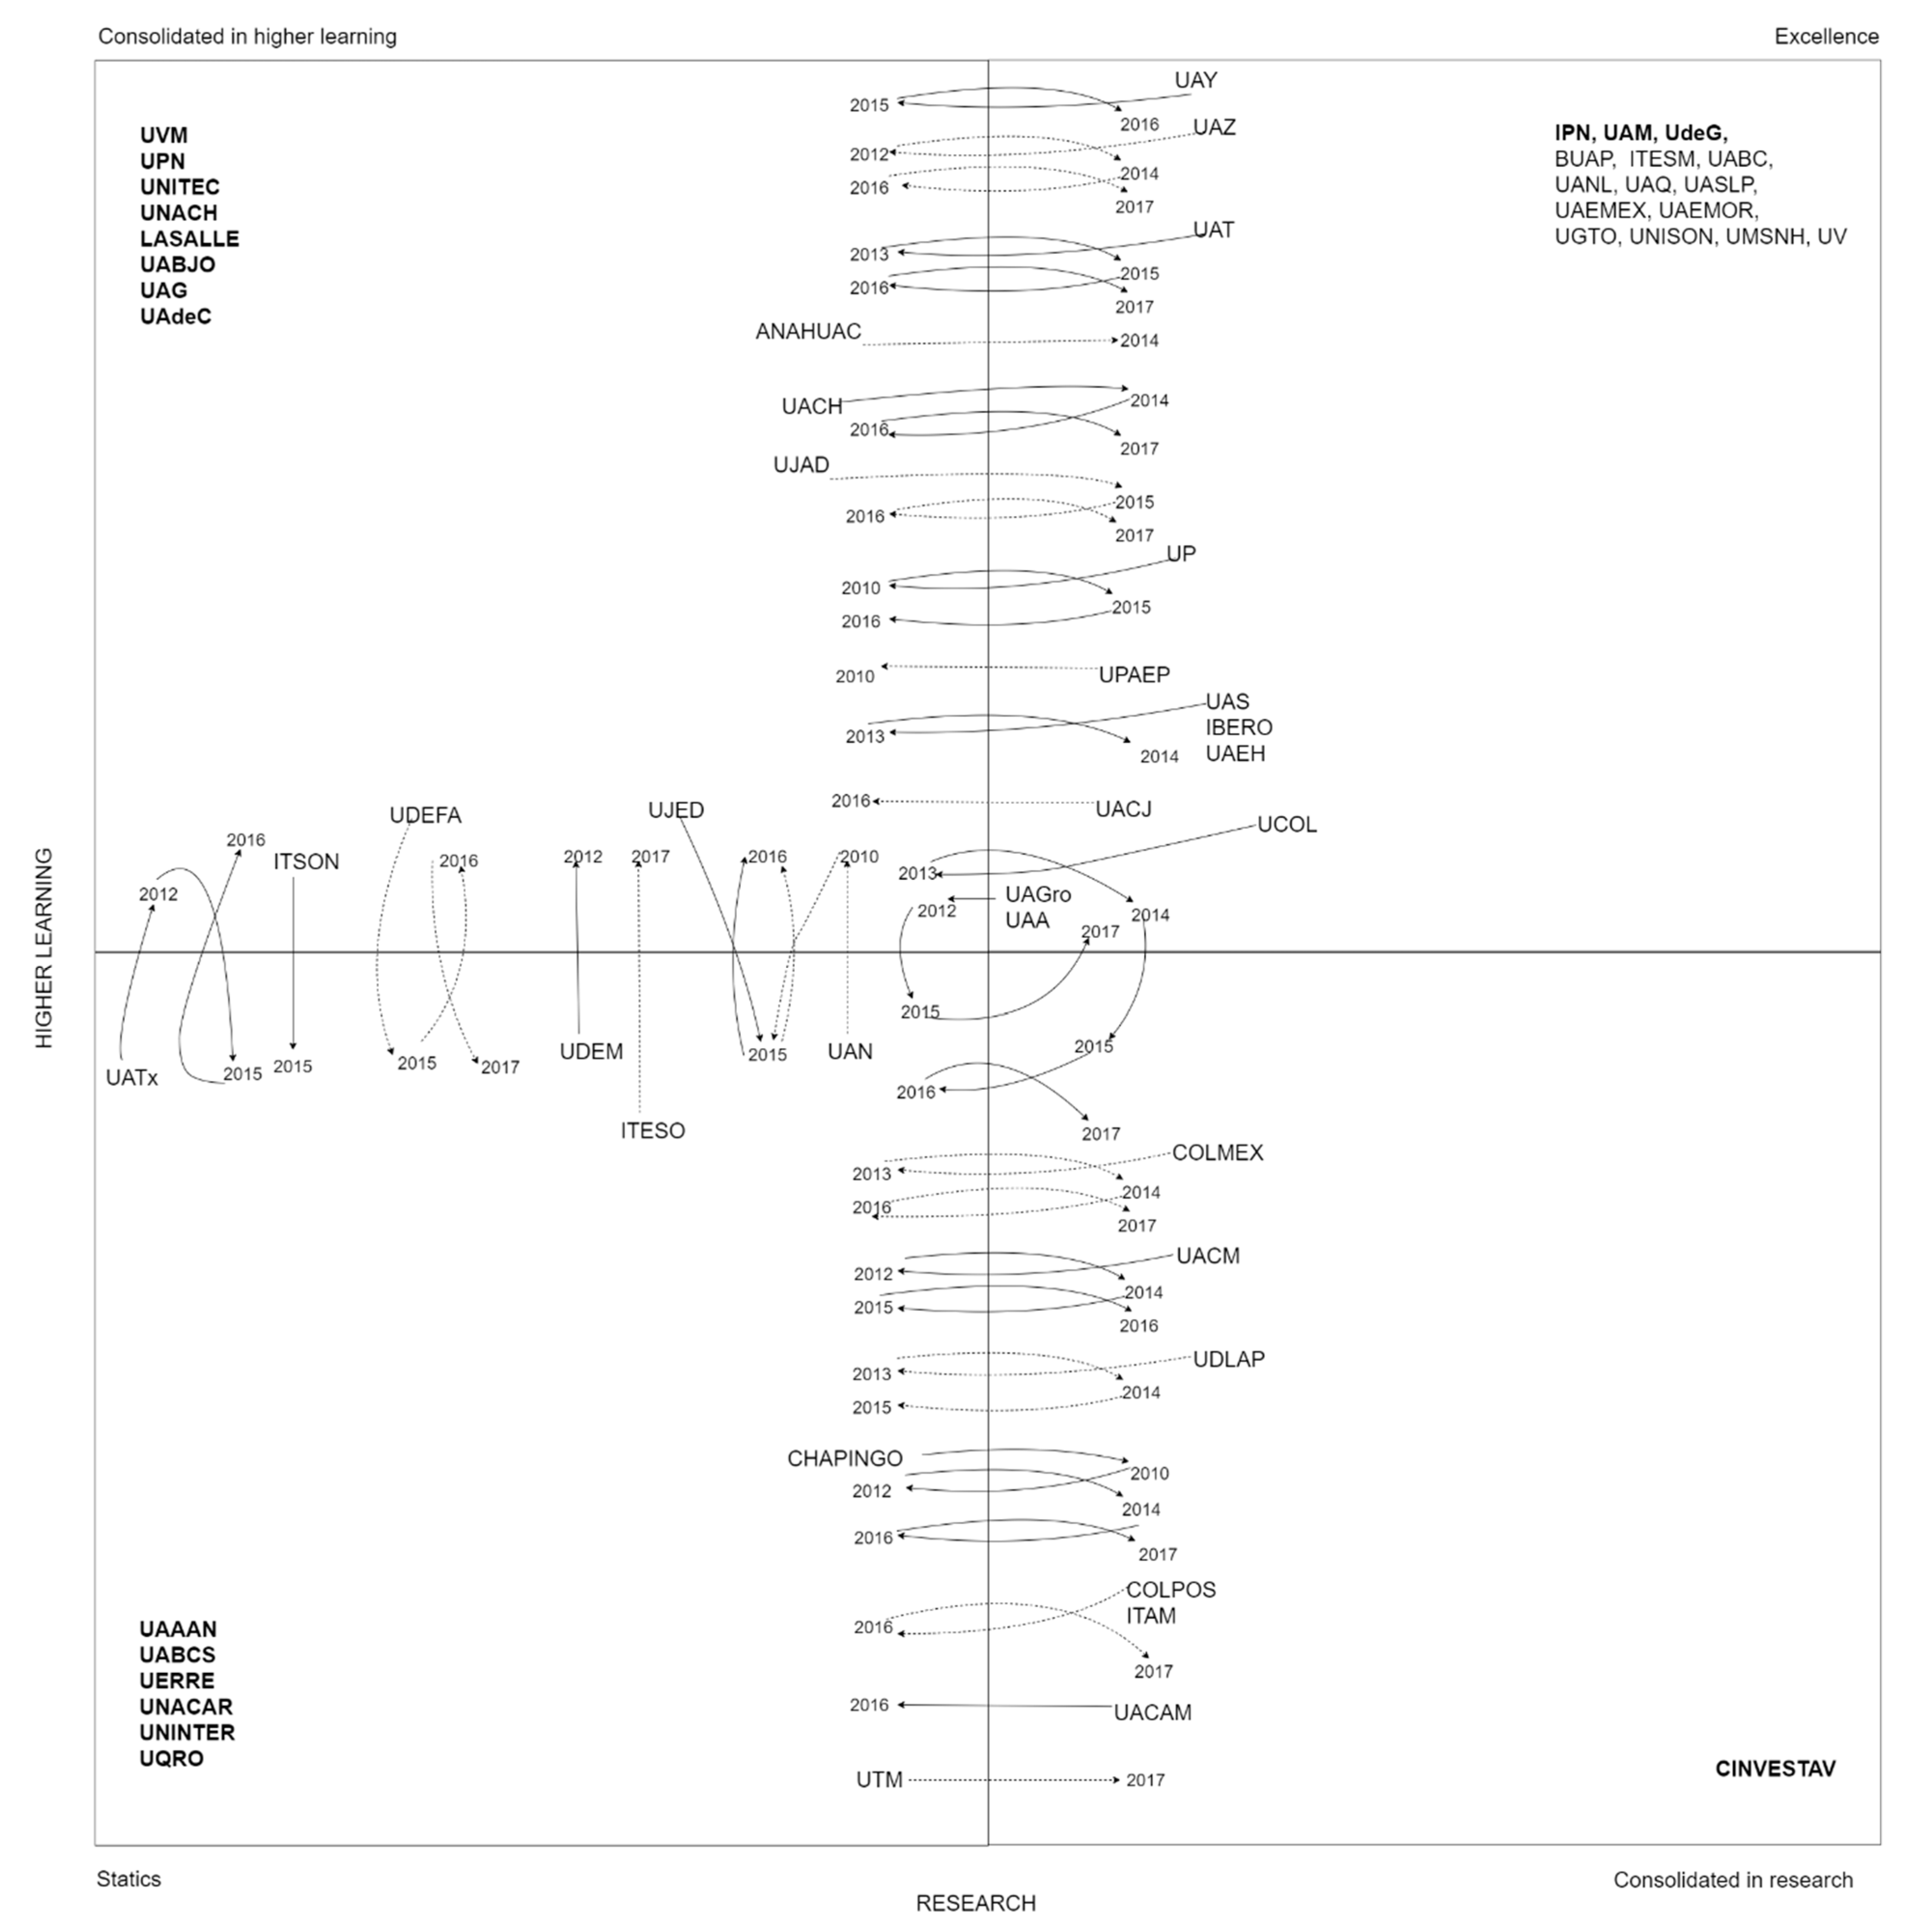
4.3. Spectral Clustering Results

Regarding to the results obtained by the k-means and GMM algorithms, these have a certain relationship, since it turns out that both are consistent with each other; however, the results of the spectral grouping (see Table 4 and Figure 10) are complementary to the two techniques already mentioned and analyzed, this is because the spectral grouping emphasizes the changes in the less favored universities; where it is shown that some universities in the first quadrant want to improve, either in higher learning or in research, although their efforts are more modest.

4.3.1. Universities in Transition in Spectral Clustering Analysis

Regarding the place where the institutions with good results in research and not so favorable results in higher learning reside, there are the College of Postgraduates (COLPOS) and Autonomous Technological Institute of Mexico (ITAM), which appear from 2009 to 2015 and in 2017; the College of México (COLMEX) that appeared from 2009 to 2012 and from 2014 to 2015; the Autonomous University of Campeche (UACAM) that is presented from 2009 to 2011 and in 2015; the UACM from 2009 to 2011 and from 2014 to 2015; the University of the Americas Puebla (UDLAP) from 2009 to 2012 and in 2014 and Chapingo Autonomous University (CHAPINGO) from 2010 to 2011, from 2014 to 2015 and in 2017. Likewise, the University of Colima (UCOL) only appears twice, in 2015 and 2017 and at the Autonomous University of Yucatán (UAY) only entered in 2015.
A particularity of this area occurs in 2016, when the group with minor higher learning and major research had no members.
For the sector with the most outstanding achievements in higher learning rather than in research, the institutions UPN, UVM, LASALLE, Autonomous University Benito Juarez of Oaxaca (UABJO), Autonomous University of Guadalajara (UAG), Autonomous University of Coahuila (UAdeC), Autonomous University of Chiapas (UANCH) and UNITEC get this place every year, Anahuac University (ANAHUAC) does from 2009 to 2013 and from 2015 to 2016; the University of the Mexican Army and Air force (UDEFA) and the Juarez Autonomous University of Tabasco (UJAT) shown in this place in the years 2009 to 2014 and 2016; the Technological Institute of Sonora (ITSON) from 2009 to 2014; the Autonomous University of Chihuahua (UACH) in the years 2009 to 2013; the Juarez University of Durango State (UJED) from 2009 to 2014 and from 2016 to 2017. The Popular Autonomous University of Puebla State (UPAEP) in the corresponding years from 2010 to 2017; the Autonomous University of Nayarit (UAN) and the UP in the years 2010 to 2014 and 2016 to 2017; the University of Monterrey (UDEM) in the years 2013 to 2017 and the Autonomous University of Tlaxcala (UATX) in the years 2013 to 2014 and 2016 to 2017. There are some other institutions which were not considered because they were not repeated more than three times in the entire period from 2009 to 2017.

4.3.2. Static Universities in Spectral Clustering Analysis

Finally, the results obtained by the spectral classifier with respect to disadvantaged institutions both in research and higher learning aspects. show that the Autonomous Agrarian University Antonio Narro (UAAAN), Autonomous University of Baja California Sur (UABCS), Regiomontana University (UERRE), Autonomous University del Carmen (UNACAR), UNINTER and the University of Querétaro (UQROO) have this site all years; Western Institute of Technology and Higher Studies (ITESO) does so in the period from 2009 to 2016; CHAPINGO in the years 2009, 2012, 2013 and 2016; UATX and UDEM in the period from 2009 to 2011, but reappeared in 2015 and in 2013. The UACAM from 2012 to 2017 and the UDLAP from 2013 and during the period from 2015 to 2017. Although there are other institutions that occupy this place, these were not mentioned because their presence was not repeated for at least four years.

5. Conclusions

The analysis of the data with k-means shows congruent results year after year, this is demonstrated with the institutions of excellence that remain unchanged, such as: National Polytechnic Institute (IPN), the Metropolitan Autonomous University (UAM) and the University of Guadalajara (UdeG). The group of excellence was joined by the Autonomous University of Nuevo León (UANL) in 2011, the Monterrey Institute of Technology and Higher Education (ITESM) in 2014, the Meritorious Autonomous University of Puebla (BUAP) in 2015 and the Autonomous University of Mexico State (UAMEX) in 2017.
The k-means results also indicate that the IPN Center for Research and Advanced Studies (CINVESTAV) remains unchanged within the group of consolidated research institutions; BUAP enters this group, although intermittently in 2011 and 2014; as well as the Autonomous University of San Luis Potosí (UASLP) in the years 2011, 2013, 2014 and 2017. Also, for the last year analyzed, the Iberoamerican University (IBERO) enters the group.
Regarding to the group of institutions consolidated in higher learning, the invariable members are: The National Pedagogical University (UPN) and the University of the Mexican Valley (UVM). The Autonomous University of Baja California (UABC), La Salle University (LASALLE), the Technological University of Mexico (UNITEC) and the Autonomous University of Sinaloa (UAS) were added to it in 2016.
As with k-means, the results with GMM also show to be consistent from year to year. for example, in the institutions of excellence that remain unchanged there are two: the IPN and the UAM. This group is joined by the UdeG that occupies this position from 2009 to 2012 and from 2016 to 2017; the UANL which appears in the years 2010 to 2012 and in 2016 and 2017; as well as the ITESM, the BUAP and the UAMEX who enter during the year 2016.
Regarding the group of consolidated research institutions, CINVESTAV is an invariable member; IBERO and UASLP, which entered in the last year of analysis; while the Autonomous University of Morelos State (UAMOR), the University of Guanajuato (UGTO) and the UV only occupy this place from 2010 to 2012 and do not occupy it again in subsequent years.
In contrast, the consolidated institutions in higher learning that remain unchanged are: the UPN and the UVM and although there are also other institutions in the group, they have occupied this place only in certain periods; Such is the case of the Autonomous University of Sinaloa (UAS) in conjunction with LASALLE and the UABC, which are integrated in the period from 2014 to 2016; BUAP and UAMEX only in 2013 and UNITEC with UP, who only joined in 2016.
Just as k-means and Gauss highlight which are the best institutions, the spectral grouping highlights which are the institutions with the lowest levels of higher learning and research. That is why, despite showing grouped results in a different way, this technique also shows congruent results in the same way as k-means and GMM.
For spectral grouping, in the institutions with good higher learning results, but few research results, there are La Salle University (LASALLE), the Autonomous University Benito Juarez of Oaxaca (UABJO), and the Autonomous University of Guadalajara (UAG), the Autonomous University of Coahuila (UAdeC), the Autonomous University of Chiapas (UANCH), the Technological University of Mexico (UNITEC), the UP and the UVM as permanent members throughout the analyzed period; other institutions such as the Technological Institute of Sonora (ITSON), the Autonomous University of Aguascalientes (UAA), the Autonomous University of Chihuahua (UACH), the University of the Mexican Army and Air force (UDEFA), the Juarez Autonomous University of Tabasco (UJAT), Juarez University of Durango State (UJED), Autonomous University of Nayarit (UAN), Popular Autonomous University of Puebla State (UPAEP), Autonomous University of Tlaxcala (UATX), University of Monterrey (UDEM) they have a consistent presence, although not continuous within the group, in addition to these there are others that due to their small number of appearances within the group were not mentioned.
In the case of institutions with less higher learning and more research, there is none that appears uninterruptedly within the group, because in 2016, the group was empty; However, the College of Postgraduates (COLPOS) and the Autonomous Technological Institute of Mexico (ITAM), are constant members of this group except for the mentioned year; other institutions that also appear frequently within this group are the College of México (COLMEX), the Chapingo University (CHAPINGO), the Autonomous University of Mexico City (UACM) and the University of the Americas Puebla (UDLAP).
Finally, in the least prominent group in higher learning and research, there are the Autonomous Agrarian University Antonio Narro (UAAAN), the Autonomous University of Baja California Sur (UABCS), the Regiomontana University (UERRE), the Autonomous University del Carmen (UNACAR), the International University (UNINTER) and the University of Quintana Roo (UQROO) as permanent members, on the other hand, CHAPINGO, Western Institute of Technology and Higher Studies (ITESO), the UATX, although they are not permanent participants, they appear with some frequency; that is, they have more than four appearances in the group.
The results found by k-means and GMM show the constant effort of the institutions to consolidate themselves in higher learning, research or being of excellence; Despite the fact that k-means and GMM are techniques with different approaches, both highlight the best institutions, this is the reason why the results obtained between both are consistent; for example, in the case of institutions of excellence, the IPN and the UAM are constant in both analyzes, as is the CINVESTAV for consolidated research institutions. As for the consolidated institutions in higher learning and static, the universities that remain unchanged are exactly the same in both techniques, these are: UVM and UPN for the first group and CINVESTAV for the second.
The results provided by the spectral grouping emphasize the institutions and their constant effort to improve or maintain their status, whether in aspects of higher learning, research or both subject to the resources they possess.
In contrast to all the results shown, it must be said that the National Autonomous University of Mexico (UNAM) is in all years the best institution in both higher learning and research.

Author Contributions

Conceptualization, S.G.d.-l.-C.; Formal analysis, E.A.R.; Funding acquisition, R.A.M.; Investigation, D.E.U.; Project administration, M.Á.G.; Software, D.E.U.; Supervision, P.L.; Validation, D.E.U. and S.G.d.-l.-C.; Writing—original draft, D.E.U.; Writing—review & editing, P.L., M.Á.G. and E.A.R. All authors have read and agreed to the published version of the manuscript.

Funding

This research received no external funding.

Institutional Review Board Statement

Not applicable.

Informed Consent Statement

Not applicable.

Data Availability Statement

Estudio Comparativo de las Universidades Mexicanas—Explorador de datos (ExECUM). Is available at http://www.execum.unam.mx/ (accessed on 5 January 2020). ExECUM 2009–2017. Is available at https://github.com/crownirv/execum (accessed on 2 July 2021).

Conflicts of Interest

The authors declare no conflict of interest.

Abbreviations

ANAHUACAnahuac University (Sistema Universidad Anahuac)
BUAPMeritorious Autonomous University of Puebla (Benemérita Universidad Autónoma de Puebla)
CINVESTAVIPN Center for Research and Advanced Studies (Centro De Investigación y de Estudios Avanzados del IPN)
COLMEXThe School of Mexico (El Colegio De México)
COLPOSPostgraduate College (Colegio de Posgraduados)
CHAPINGOChapingo Autonomous University (Universidad Autónoma Chapingo)
IBEROIberoamerican University System (Sistema Universidad Iberoamericana)
IPNNational Polytechnic Institute (Instituto Politécnico Nacional)
ITAMAutonomous Technological Institute of Mexico (Instituto Tecnológico Autónomo De México)
ITESMMonterrey Institute of Technology and Higher Education (Sistema Instituto Tecnológico y de Estudios Superiores de Monterrey)
ITESOEstudios Superiores de Occidente)
ITSONTechnological Institute of Sonora (Instituto Tecnológico de Sonora)
LASALLELa Salle University (Sistema Universidad La Salle, AC)
UAAAutonomous University of Aguascalientes (Universidad Autónoma de Aguascalientes)
UAAANAutonomous Agrarian University Antonio Narro (Universidad Autónoma Agraria Antonio Narro)
UABCAutonomous University of Baja California (Universidad Autónoma de Baja California)
UABCSAutonomous University of Baja California Sur (Universidad Autónoma de Baja California Sur)
UABJOAutonomous University Benito Juarez of Oaxaca (Universidad Autónoma Benito Juárez de Oaxaca)
UACAMAutonomous University of Campeche (Universidad Autónoma de Campeche)
UACJAutonomous University of Juarez City (Universidad Autónoma de Ciudad Juárez)
UACMAutonomous University of Mexico City (Universidad Autónoma de la Ciudad de México)
UACHAutonomous University of Chihuahua (Universidad Autónoma de Chihuahua)
UAdeCAutonomous University of Coahuila (Universidad Autónoma de Coahuila)
UAEHAutonomous University of Hidalgo State (Universidad Autónoma del Estado de Hidalgo)
UAGAutonomous University of Guadalajara (Universidad Autónoma de Guadalajara)
UAGROAutonomous University of Guerrero (Universidad Autónoma de Guerrero)
UAMMetropolitan Autonomous University (Universidad Autónoma Metropolitana)
UAEMEXAutonomous University of Mexico State (Universidad Autónoma del Estado de México)
UAEMORAutonomous University of Morelos State (Universidad Autónoma del Estado de Morelos)
UANAutonomous University of Nayarit (Universidad Autónoma de Nayarit)
UANLAutonomous University of Nuevo Leon (Universidad Autónoma de Nuevo León)
UAQAutonomous University of Queretaro (Universidad Autónoma de Querétaro)
UASAutonomous University of Sinaloa (Universidad Autónoma de Sinaloa)
UASLPAutonomous University of San Luis Potosi (Universidad Autónoma de San Luis Potosí)
UATAutonomous University of Tamaulipas (Universidad Autónoma de Tamaulipas)
UATXAutonomous University of Tlaxcala (Universidad Autónoma de Tlaxcala)
UAYAutonomous University of Yucatan (Universidad Autónoma de Yucatán)
UAZAutonomous University of Zacatecas (Universidad Autónoma de Zacatecas)
UCOLUniversity of Colima (Universidad de Colima)
UDEFAUniversity of The Mexican Army and Air force (Universidad del Ejército y Fuerza Aérea Mexicana)
UdeGUniversity of Guadalajara (Universidad de Guadalajara)
UDEMUniversity of Monterrey (Universidad de Monterrey)
UDLAPUniversity of The Americas Puebla (Universidad de Las Américas Puebla, AC)
UERRERegiomontana University (Universidad Regiomontana, AC)
UGTOUniversity of Guanajuato (Universidad de Guanajuato)
UICIntercontinental University (Universidad Intercontinental)
UJATJuarez Autonomous University of Tabasco (Universidad Juárez Autónoma de Tabasco)
UJEDJuarez University of Durango State (Universidad Juárez del Estado de Durango)
UMSNHMichoacana University of San Nicolas from Hidalgo (Universidad Michoacana de San Nicolás de Hidalgo)
UNNaval University (Universidad Naval)
UNACARAutonomous University Del Carmen (Universidad Autónoma del Carmen)
UNACHAutonomous University of Chiapas (Universidad Autónoma de Chiapas)
UNAMNational Autonomous University of Mexico (Universidad Nacional Autónoma de México)
UNISONUniversity of Sonora (Universidad de Sonora)
UNITECTechnological University of Mexico (Universidad Tecnológica de México)
UPPanamerican University (Universidad Panamericana)
UPAEPPopular Autonomous University of Puebla State (Universidad Popular Autónoma del Estado de Puebla)
UPNNational Pedagogical University (Universidad Pedagógica Nacional)
UQROOUniversity of Quintana Roo (Universidad de Quintana Roo)
UTMTechnological University of La Mixteca (Universidad Tecnológica de la Mixteca)
UVVeracruz University (Universidad Veracruzana)
UVMUniversity of The Mexican Valley (Sistema Universidad del Valle de México)

References

  1. Palma, E. Percepción y Valoración de la Calidad Educativa de Alumnos y Padres en 14 Centros Escolares de la Región Metropolitana de Santiago de Chile. REICE Rev. Iberoam. Sobre Calid. Efic. Cambio Educ. 2016, 6, 1. Available online: http://www.redalyc.org/articulo.oa?id=55160106 (accessed on 5 January 2020).
  2. Jiménez Galán, M.; Hernández Jaime, M.; Ortega Pacheco, M. ¿Forman los programas de formación docente? Rev. Investig. Educ. 2014, 19, 1–27. [Google Scholar] [CrossRef]
  3. Espinosa, E.M.; Gutiérrez, F.C.; Muñoz, V.M.R. Estudiantes Frente al Espejo: Percepciones de la Calidad Educativa en Programas de Licenciatura y Posgrado en México. Universidad de Guadalajara. 2015. Available online: http://www.sinectica.iteso.mx/index.php?cur=38&art=38_07 (accessed on 7 January 2020).
  4. Montes, E.; Mora, R.A.; Obregón, B.; de-los-Cobos, S.G.; Rincón, E.A.; Lara, P.; Gutiérrez, M.Á. Mexican University Ranking Based on Maximal Clique. In Educational Networking; Peña-Ayala, A., Ed.; Springer International Publishing: Berlin/Heidelberg, Germany, 2020; pp. 327–395. [Google Scholar] [CrossRef]
  5. Van der Plas, J. Python Data Science Handbook: Essential Tools for Working with Data; O’Reilly Media, Inc.: Sebastopol, CA, USA, 2016; ISBN 9781491912058. [Google Scholar]
  6. Ripley, B.D. Pattern Recognition and Neural Networks; Cambridge University Press: New York, NY, USA, 2007. [Google Scholar] [CrossRef]
  7. MacQueen, J.B. Some Methods for Classification and Analysis of Multivariate Observations. In Proceedings of the 5th Berkeley Symposium on Mathematical Statistics and Probability, Berkeley, CA, USA, 27 December 1965–7 January 1966; University of California Press: Berkeley, CA, USA, 1967; Volume 1, pp. 281–297. Available online: https://projecteuclid.org/euclid.bsmsp/1200512992 (accessed on 7 January 2020).
  8. Drineas, P.; Frieze, A.M.; Kannan, R.; Vempala, S.; Vinay, V. Clustering in Large Graphs and Matrices. In Proceedings of the SODA’99: Proceedings of the Tenth Annual ACM-SIAM Symposium on Discrete Algorithms, Baltimor, MA, USA, 17–19 January 1999; Available online: https://0-dl-acm-org.brum.beds.ac.uk/doi/10.5555/314500.314576 (accessed on 7 January 2020).
  9. Jain, A.K.; Dubes, R.C. Algorithms for Clustering Data; Prentice-Hall, Inc.: Upper Saddle River, NJ, USA, 1988; Available online: https://0-dl-acm-org.brum.beds.ac.uk/doi/book/10.5555/46712 (accessed on 7 January 2020).
  10. Mao, J.; Jain, A.K. A self-organizing network for hyperellipsoidal clustering (HEC). IEEE Trans. Neural Netw. 1996, 7, 16–29. [Google Scholar] [CrossRef] [PubMed]
  11. Bilmes, J.A. A Gentle Tutorial of the EM Algorithm and Its Application to Parameter Estimation for Gaussian Mixture and Hidden Markov Models; International Computer Science Institute: Berkeley, CA, USA, 1998. [Google Scholar]
  12. Bishop, P. Pattern Recognition and Machine Learning; Springer: Berlin/Heidelberg, Germany, 2006; p. 430. Available online: https://0-search-ebscohost-com.brum.beds.ac.uk/login.aspx?direct=true&db=cat07429a&AN=ulpgc.547268&lang=es&site=eds-live&scope=site (accessed on 6 January 2020).
  13. Von Luxburg, U. A tutorial on spectral clustering. Stat. Comput. 2007, 17, 395–416. [Google Scholar] [CrossRef]
  14. Jin, R.; Kang, F.; Ding, C.H. A Probabilistic Approach for Optimizing Spectral Clustering. In Advances in Neural Information Processing Systems; The MIT Press: Cambridge, MA, USA, 2006; pp. 571–578. Available online: http://papers.nips.cc/paper/2952-a-probabilistic-approach-for-optimizing-spectral-clustering.pdf (accessed on 5 January 2020).
  15. Ng, A.; Jordan, M.; Weiss, Y. On spectral clustering: Analysis and an algorithm. Adv. Neural Inf. Process. Syst. 2001, 14, 849–856. [Google Scholar]
  16. Yin, W.; Zhu, E.; Zhu, X.; Yin, J. Landmark-Based Spectral Clustering with Local Similarity Representation. In Theoretical Computer Science; Du, D., Li, L., Zhu, E., He, K., Eds.; Springer: Singapore, 2017; Volume 768, pp. 198–207. [Google Scholar] [CrossRef]
  17. Estudio Comparativo de las Universidades Mexicanas—Explorador de datos (ExECUM). 2017. Available online: http://www.execum.unam.mx/ (accessed on 7 January 2020).
  18. Márquez, A. Estudio comparativo de universidades mexicanas (ECUM): Otra mirada a la realidad universitaria. Rev. Iberoam. Educ. Super. 2010, I, 148–156. [Google Scholar] [CrossRef]
Figure 1. Graphic illustration of the matrix model proposed.
Mathematics 09 01615 g001
Figure 2. PCA analysis per component from 2009 to 2017 applied to higher learning database.
Mathematics 09 01615 g002
Figure 3. PCA analysis per component from 2009 to 2017 applied to research database.
Mathematics 09 01615 g003
Figure 4. Average PCA from 2009 to 2017 applied to higher learning and research with UNAM.
Mathematics 09 01615 g004
Figure 5. Average PCA from 2009 to 2017 applied to higher learning and research without UNAM.
Mathematics 09 01615 g005
Figure 6. Silhouette coefficient comparisons for three clustering techniques solving research database.
Mathematics 09 01615 g006
Figure 7. Silhouette coefficient comparisons for three clustering techniques solving higher learning database.
Mathematics 09 01615 g007
Figure 8. Visual representation of the results from 2009 to 2017 applying k-means.
Mathematics 09 01615 g008
Figure 9. Visual representation of the results from 2009 to 2017 applying GMM.
Mathematics 09 01615 g009
Figure 10. Visual representation of the results from 2009 to 2017 applying Spectral clustering.
Mathematics 09 01615 g010
Table 1. Decision table used to locate an institution.
Does It Belong to the Outstanding Group in Higher Learning? (Part 1)Does It Belong to the Outstanding Group in Research? (Part 2)Quadrant Where It Will Be Located
NoNo1
YesNo2
NoYes3
YesYes4
Table 2. Results from 2009 to 2017 applying k-means.
k-Means Results Summary
200920102011201220132014201520162017
Major higher learning, major
research
IPN,
UAM,
UdeG
IPN,
UAM,
UdeG
IPN,
UAM, UANL, UdeG
IPN,
UAM,
UANL, UdeG
IPN,
UAM,
UANL,
UdeG
IPN,
ITESM,
UAM,
UANL,
UdeG
BUAP,
IPN,
ITESM, UAM,
UANL,
UdeG
BUAP,
IPN,
ITESM,
UAM,
UANL,
UdeG
BUAP,
IPN,
ITESM,
UAEMex, UAM,
UANL,
UdeG
Major higher learning, minor
research
ITESM, UANL,
UPN,
UVM
ITESM, UANL,
UPN,
UVM
ITESM,
UPN,
UVM
BUAP,
ITESM,
LASALLE, UABC,
UAEMex, UAS,
UP,
UPN,
UV,
UVM
ITESM, UABC,
UAEMex, UAS,
UPN,
UV,
UVM
UAEMex, UPN,
UVM
UABC, UAEMex, UPN,
UV,
UVM
LASALLE, UABC,
UAS,
UP,
UPN,
UTM,
UV,
UVM
LASALLE, UABC,
UAS,
UPN,
UTM,
UV,
UVM
Minor higher learning, major researchCINVESTAVCINVESTAVBUAP,
CINVESTAV, UASLP
CINVESTAVCINVESTAV, UASLPBUAP,
CINVESTAV, UASLP
CINVESTAVCINVESTAVUASLP, IBERO,
CINVESTAV
Table 3. Results from 2009 to 2017 applying GMM.
GMM Results Summary
200920102011201220132014201520162017
Major higher learning, major
research
IPN,
UAM,
UdeG
IPN,
UAM,
UANL,
UdeG
IPN,
UAM,
UANL,
UdeG
IPN,
UAM,
UANL,
UdeG
IPN,
UAM
IPN,
UAM
IPN,
UAM
IPN,
UAM,
BUAP,
ITESM,
UAEMex, UANL,
UdeG
IPN,
UAM,
BUAP,
ITESM,
UAEMex, UANL,
UdeG
Major higher learning, minor
research
ITESM, UANL,
UPN,
UVM
ITESM,
UPN,
UVM
ITESM,
UPN,
UVM
ITESM,
UPN,
UVM
BUAP,
ITESM, UANL, UPN, UAEMex, UVM, UdeG
BUAP,
ITESM,
LASALLE, UABC, UAEMex, UANL,
UAS,
UPN,
UV,
UVM,
UdeG
BUAP,
ITESM,
LASALLE, UABC, UAEMex, UANL,
UAS,
UPN,
UV,
UVM,
UdeG
LASALLE, UABC,
UAS, UNITEC,
UP,
UPN,
UV,
UVM
Minor higher learning, major
research
CINVESTAVCINVESTAV, UAEMOR, UGTO,
UV
CINVESTAV, UAEMOR, UGTO,
UV
CINVESTAV, UAEMOR, UGTO,
UV
CINVESTAVCINVESTAVCINVESTAVCINVESTAVCINVESTAV, IBERO, UASLP
Table 4. Results from 2009 to 2017 applying Spectral clustering.
Spectral Clustering Results Summary
200920102011201220132014201520162017
Major higher learning,
major
research
ANAHUAC,
ITSON,
LASALLE,
UAA,
UABJO,
UACH,
UAG,
UAdeC,
UDEFA,
UJAT,
UJED,
UNACH, UNITEC,
UPN,
UVM
ANAHUAC,
ITSON,
LASALLE,
UABJO,
UACH,
UAG,
UAN,
UAdeC,
UDEFA,
UJAT,
UJED,
UNACH, UNITEC,
UP,
UPAEP,
UPN,
UVM
ANAHUAC,
ITSON,
LASALLE,
UABJO,
UACH,
UAG,
UAN,
UAdeC,
UDEFA,
UJAT,
UJED,
UNACH, UNITEC,
UP,
UPAEP,
UPN,
UVM
ANAHUAC,
ITSON,
LASALLE,
UAA,
UABJO,
UACH,
UAG,
UAGro,
UAN,
UATx,
UAZ,
UAdeC,
UDEFA,
UDEM,
UJAT,
UJED,
UNACH, UNITEC,
UP,
UPAEP,
UPN,
UVM
ANAHUAC, IBERO,
ITSON,
LASALLE,
UAA,
UABJO,
UACH,
UAEH,
UAG,
UAGro,
UAN,
UAS,
UAT,
UATx,
UAZ,
UAdeC,
UCOL,
UDEFA,
UDEM,
UJAT,
UJED,
UNACH, UNITEC,
UP,
UPAEP,
UPN,
UVM
ITSON,
LASALLE,
UAA,
UABJO,
UAG,
UAGro,
UAN,
UAT,
UATx,
UAdeC,
UDEFA,
UDEM,
UJAT,
UJED,
UNACH, UNITEC,
UP,
UPAEP,
UPN,
UVM
ANAHUAC, LASALLE, UABJO,
UAG,
UAdeC,
UDEM, UNACH, UNITEC, UPAEP,
UPN,
UVM
ANAHUAC, LASALLE, UABJO,
UACH,
UACJ,
UAG,
UAN,
UAT,
UATx,
UAY,
UAZ,
UAdeC,
UDEFA,
UDEM,
UJAT,
UJED,
UNACH, UNITEC,
UP,
UPAEP,
UPN,
UVM
ITESO,
LASALLE,
UAA,
UABJO,
UACJ,
UAG,
UAN,
UATx,
UAdeC,
UDEM,
UJED,
UNACH, UNITEC,
UP,
UPAEP, UPN,
UVM
Minor higher learning, major
research
COLMEX,
COLPOS,
ITAM,
UACAM, UACM,
UDLAP
CHAPINGO, COLMEX,
COLPOS,
ITAM,
UACAM, UACM,
UDLAP
CHAPINGO, COLMEX, COLPOS,
ITAM,
UACAM, UACM, UDLAP
COLMEX,
COLPOS,
ITAM,
UDLAP
COLPOS,
ITAM
CHAPINGO, COLMEX, COLPOS,
ITAM,
UACM,
UDLAP
CHAPINGO, COLMEX, COLPOS,
ITAM,
UACM,
UAY,
UCOL
CHAPINGO, COLPOS,
UTM,
ITAM,
UCOL
Minor higher learning, minor
research
CHAPINGO, ITESO,
UAAAN,
UABCS,
UAN,
UATx,
UDEM,
UERRE,
UNACAR,
UNINTER, UQROO
ITESO,
UAAAN,
UABCS,
UATx,
UTM,
UDEM,
UERRE,
UNACAR, UNINTER, UQROO
ITESO,
UAAAN,
UABCS,
UATx,
UTM,
UDEM,
UERRE,
UNACAR, UNINTER, UQROO
CHAPINGO, ITESO,
UAAAN,
UABCS,
UTM,
UACAM,
UACM,
UERRE,
UNACAR,
UNINTER, UQROO
CHAPINGO, COLMEX, ITESO,
UAAAN,
UABCS,
UTM,
UACAM,
UACM,
UDLAP,
UERRE,
UNACAR,
UNINTER, UQROO
ITESO, UAAAN,
UABCS,
UTM,
UACAM,
UERRE,
UNACAR, UNINTER, UQROO
ITESO,
ITSON,
UAA,
UAAAN,
UABCS,
UTM,
UACAM,
UAGro,
UAN,
UATx,
UDEFA,
UDLAP,
UERRE,
UJED,
UNACAR, UNINTER, UQROO
CHAPINGO, COLMEX, COLPOS,
ITAM,
ITESO,
ITSON,
UTM,
UAA,
UAGro, UAAAN,
UABCS,
UACAM, UACM,
UCOL,
UDLAP,
UERRE,
UNACAR, UNINTER, UQROO
COLMEX,
ITSON, UAAAN,
UABCS,
UACAM, UACM,
UDEFA,
UDLAP,
UERRE,
UNACAR, UNINTER, UQROO
Publisher’s Note: MDPI stays neutral with regard to jurisdictional claims in published maps and institutional affiliations.

