
COVID-19 Emergency Remote Teaching Opinions and Academic Performance of Undergraduate Students: Analysis of 4 Students’ Profiles. A Case Study


Abstract
: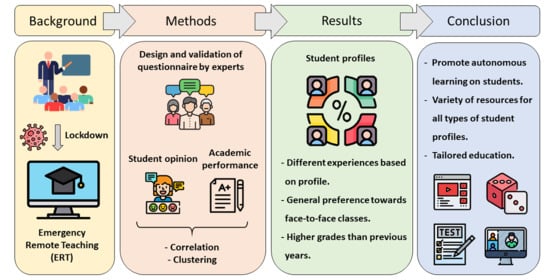
1. Introduction
1.1. Quality of Education during ERT
1.2. Learning Strategies and Student Profiles
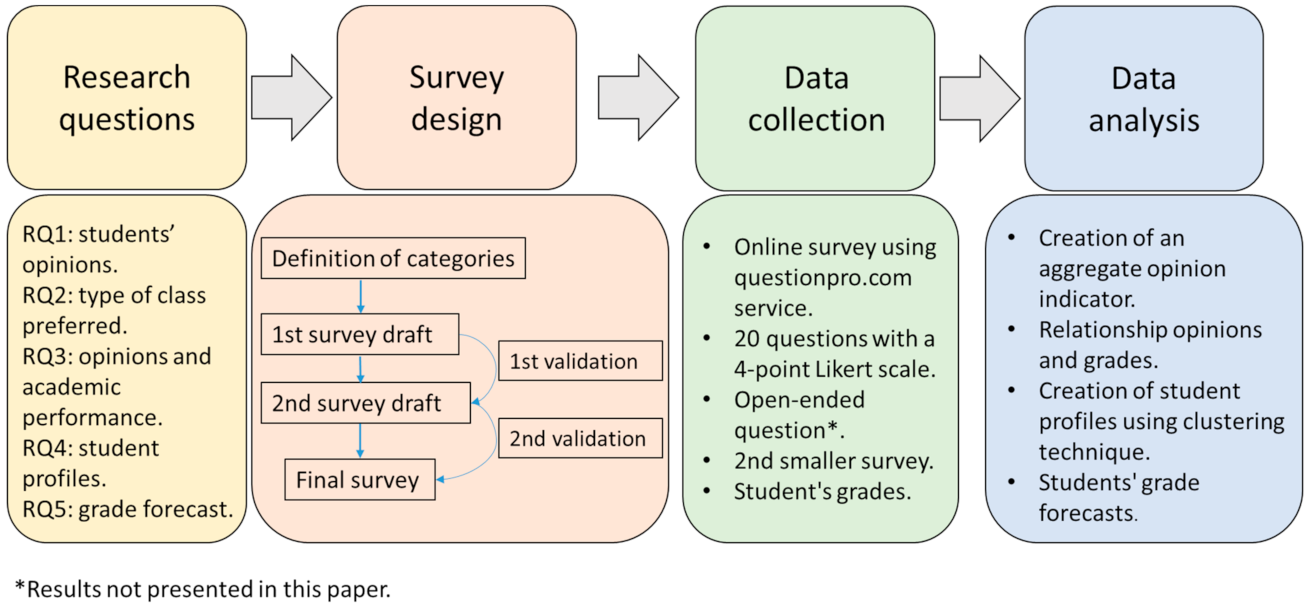
2. Materials and Methods
2.1. Case Study
2.2. Research Questions
- (1)
- What are the students’ opinions on a series of categories in the Chemistry subject during the ERT period?
- (2)
- What type of classes do students prefer after lockdown?
- (3)
- Do correlation exist between students’ opinions and their academic performance?
- (4)
- Can students be classified according to their opinion-academic performance combinations during ERT?
- (5)
- What are the students’ grade forecasts depending on whether the Chemistry course is face-to-face or remote?
2.2.1. Research Questions 1&2
2.2.2. Research Question 3
2.2.3. Research Question 4
- The opinions expressed in the 20 questions of the survey;
- The grade obtained in the continuous assessment;
- The final exam grade, and
- The course grade obtained.
2.2.4. Research Question 5
- Question 1: What final grade do you think you will obtain in the Chemistry course?
- Question 2: What final grade do you think you would have obtained in the Chemistry course if it had been entirely face-to-face?
3. Results and Discussion
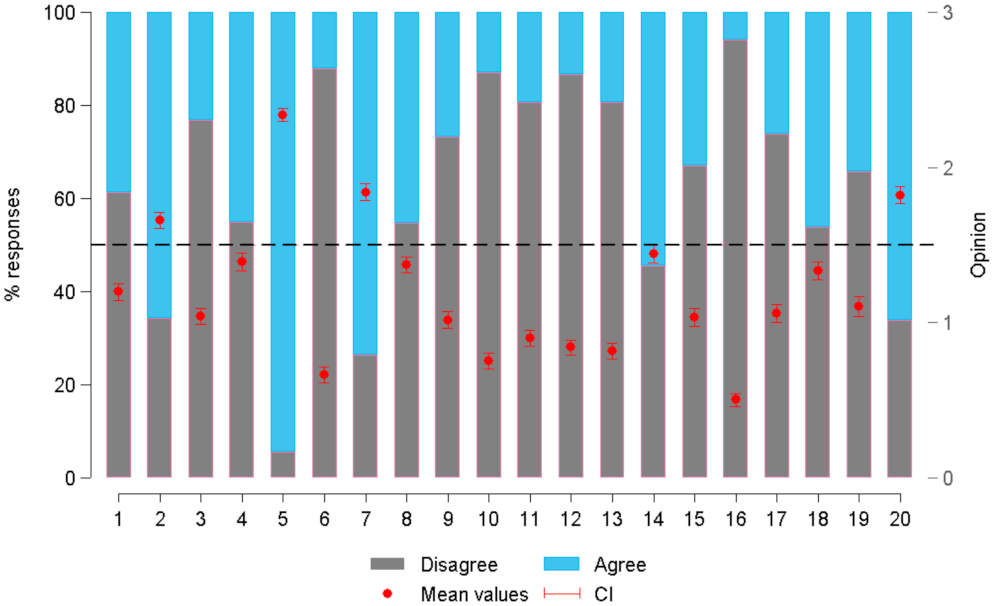
3.1. Exploratory Analysis and Aggregate Opinion Indicator
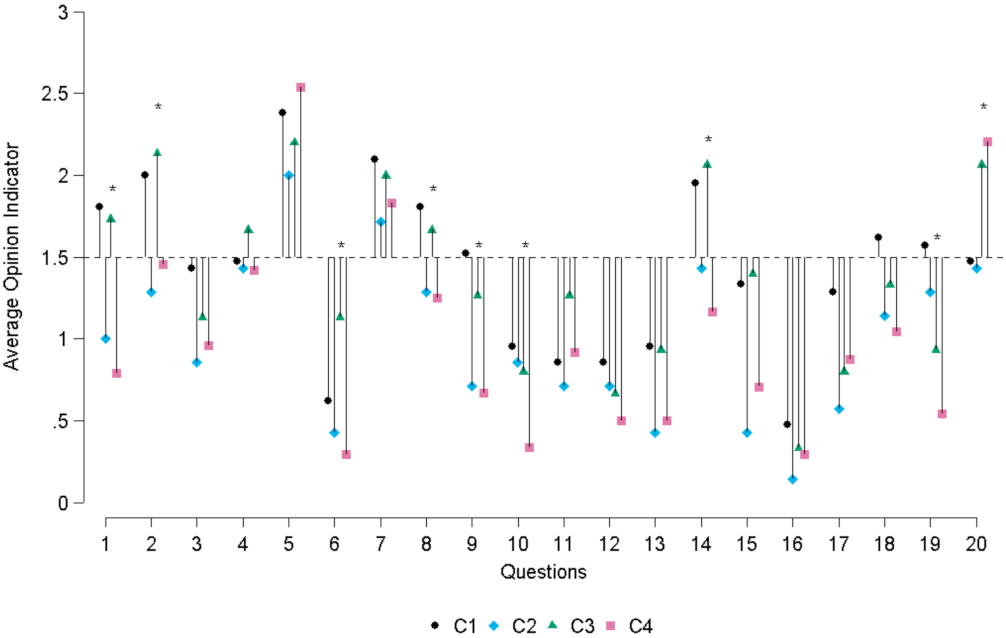
3.2. RQ1: What Are the Students’ Opinions on a Series of Categories during the ERT Period Regarding the Chemistry Subject?
3.3. RQ2: What Type of Classes Do Students Prefer after Lockdown?
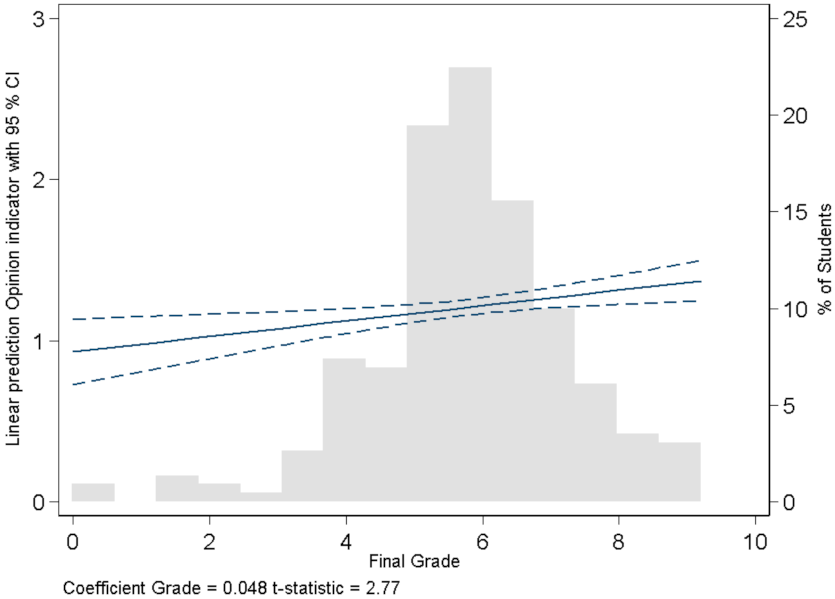
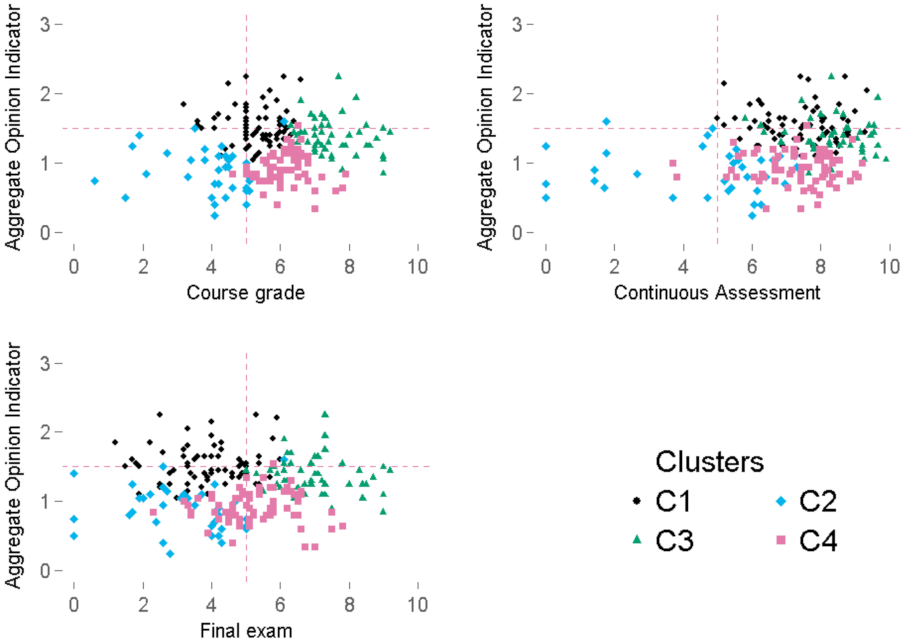
3.4. RQ3: Do Correlation Exist between Students’ Opinions and Their Academic Performance?
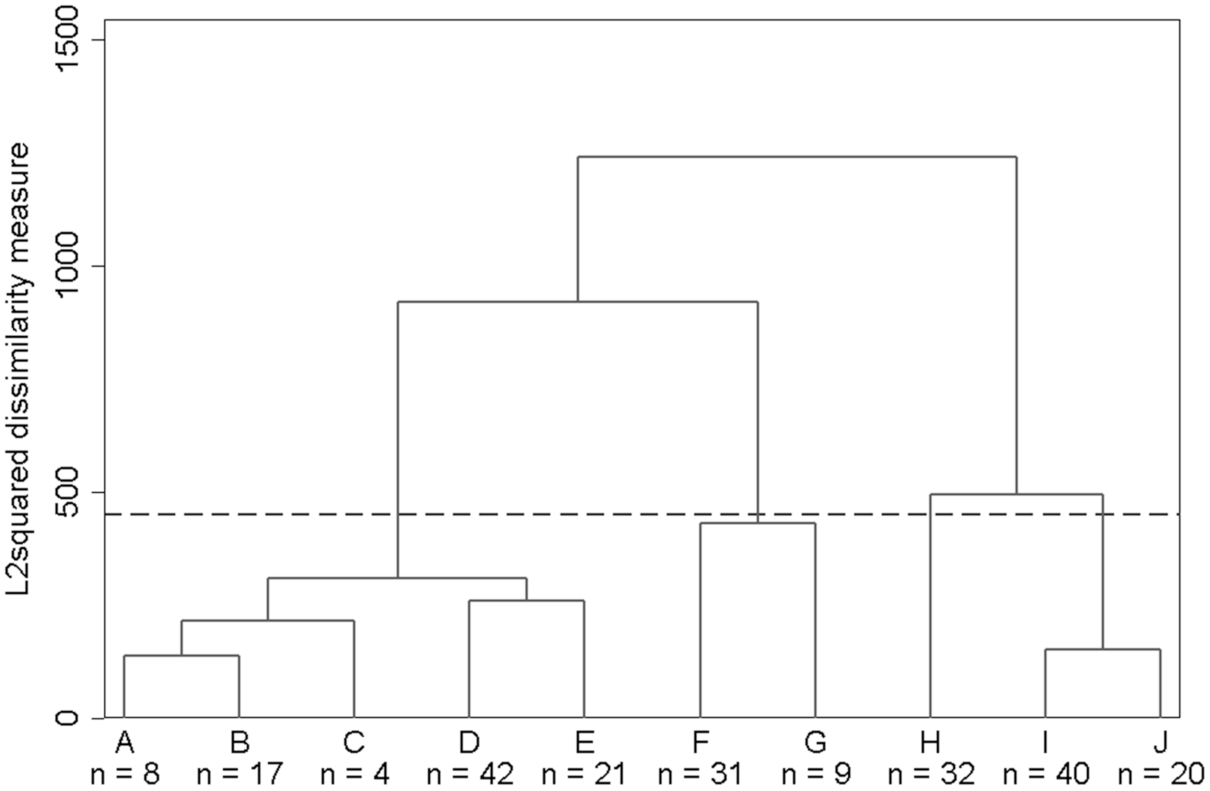
3.5. RQ4: Can Students Be Classified According to Their Behavior during ERT?
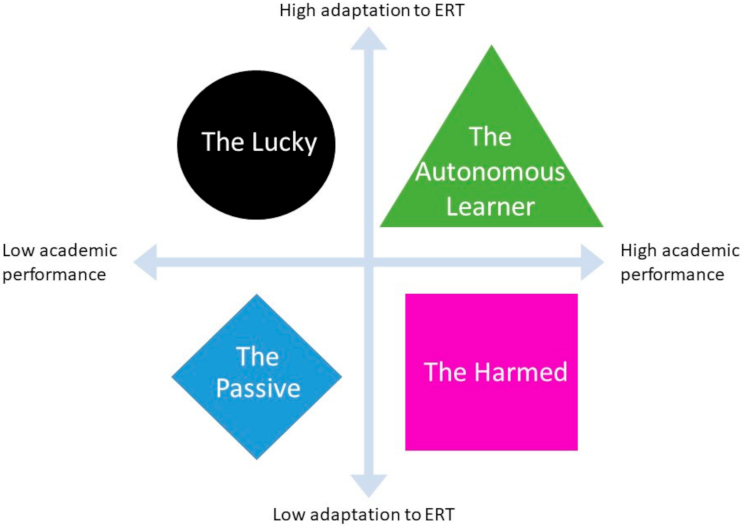
- Profile 1: ‘The Lucky’. Cluster 1 contains those students most in favor of remote teaching (aggregate indicator 1.53/3). On average, they pass with grades close to five, although 19.12% did pass the subject. These students pass the subject thanks to the continuous assessment, but failed the final exam. They could be considered lucky students, as the lockdown situation has benefited them grade-wise. In a regular semester, they would probably have failed the course. They believe the face-to-face class does not provide much added value, considering what they are capable of doing by themselves with a remote methodology. They also prefer remote classes with slides rather than via videocall, and do not consider visual contact with the teacher as important as the other student profiles.
- Profile 2: ‘The Passive’. Cluster 2 includes students that have a poor opinion about remote teaching (0.85/3) and who in general fail the subject (77.78%) and the final exam (80%), although few of them passed continuous assessment (20%). It is worth emphasizing they did not feel equally communicated with either teacher or peers, and they do not think email communication is sufficient to solve their doubts during remote teaching. In addition, these students prefer to study with a previously solved exercise rather than trying to solve it by themselves. This last point is in accordance with their low grades in continuous assessment, which students could easily overcome simply by handing in exercises they had to solve on their own and guided by a model exercise. A low grade in the continuous assessment is due to the failure to deliver assignments.
- Profile 3: ‘The Autonomous Learner’. Cluster 3 gathers those students who have a relatively favorable opinion towards remote teaching compared to Clusters 2 and 4 (1.36/3), and all of them passed the subject. Their performance in the final exam is much better than the other clusters, but not significantly better than the other profiles in the continuous assessment. These students have acquired the necessary competencies in the subject during the ERT semester, while their opinions score almost as high as Profile 1 students with regard to remote methodology. Therefore, they prove to be good autonomous learners, capable of a good performance under these exceptional circumstances, but who express their preference for face-to-face classes.
- Profile 4: ‘The Harmed’. Cluster 4 consists of students that have a poor opinion about remote teaching (0.87/3) and almost all of them passed the subject (98.61%), although almost a half of them failed the final exam (43.06%). These students exhibit potential as good students, achieving higher grades than Clusters 1 and 2. However, their answers to the survey reveal a deep dislike for the methodology they experienced. These students strongly prefer face-to-face classes, especially for the theoretical part of the subject, and if remote learning is compulsory, they would rather follow online classes instead of prerecorded videos. For this reason, these students are potentially the most harmed by to the change in methodology occasioned by the COVID-19 lockdown.
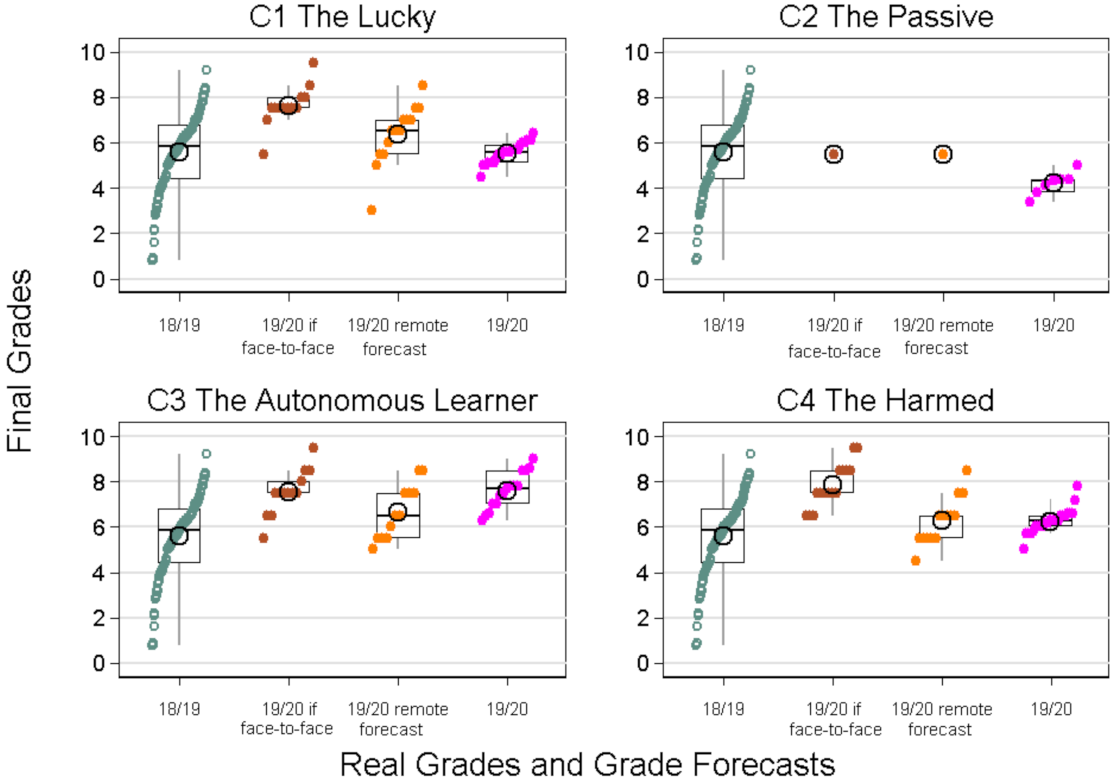
3.6. RQ5: What Are the Students’ Grade Forecast of the Chemistry Course Depending on Whether It Is Face-to-Face or Remote?
3.7. Limitations of This Work
3.8. Further Actions and Research
4. Conclusions
Author Contributions
Funding
Institutional Review Board Statement
Informed Consent Statement
Data Availability Statement
Acknowledgments
Conflicts of Interest
Appendix A


| Anova Test | Scheffe Post-Hoc Test | |||
|---|---|---|---|---|
| F | p | Compar. | Mean Diff. | p |
| 6.06 | 0.000 | 18/19 vs. C1 19/20 | −0.309 | 0.982 |
| 18/19 vs. C2 19/20 | −1.476 | 0.527 | ||
| 18/19 vs. C3 19/20 | 2.357 | 0.002 | ||
| 18/19 vs. C4 19/20 | 0.827 | 0.511 | ||
| C1 19/20 vs. C2 19/20 | −1.167 | 0.822 | ||
| C1 19/20 vs. C3 19/20 | 2.666 | 0.011 | ||
| C1 19/20 vs. C4 19/20 | 1.136 | 0.545 | ||
| C2 19/20 vs. C3 19/20 | 3.832 | 0.005 | ||
| C2 19/20 vs. C4 19/20 | 2.302 | 0.192 | ||
| C3 19/20 vs. C4 19/20 | −1.530 | 0.332 | ||
References
- Hodges, C.; Moore, S.; Lockee, B.; Trust, T.; Bond, A. The Difference Between Emergency Remote Teaching and Online Learning. Educause: 2020. Available online: https://er.educause.edu/articles/2020/3/the-difference-between-emergency-remote-teaching-and-online-learning (accessed on 21 July 2021).
- UNESCO. Global Education Coalition for COVID-19 Response. Available online: https://en.unesco.org/covid19/educationresponse/globalcoalition (accessed on 15 July 2020).
- Chickering, A.W.; Gamson, Z.F. Seven Principles for Good Practice in Undergraduate Education. Wingspread J. 1987, 9, 1–10. [Google Scholar]
- Cheng, L.; Ritzhaupt, A.D.; Antonenko, P. Effects of the flipped classroom instructional strategy on students’ learning outcomes: A meta-analysis. Educ. Technol. Res. Dev. 2019, 67, 793–824. [Google Scholar] [CrossRef]
- Lo, C.K.; Hew, K.F. The impact of flipped classrooms on student achievement in engineering education: A meta-analysis of 10 years of research. J. Eng. Educ. 2019, 108, 523–546. [Google Scholar] [CrossRef]
- Parra-González, M.E.; Belmonte, J.L.; Segura-Robles, A.; Cabrera, A.F. Active and emerging methodologies for ubiquitous education: Potentials of flipped learning and gamification. Sustainability 2020, 12, 602. [Google Scholar] [CrossRef] [Green Version]
- Izagirre-Olaizola, J.; Morandeira-Arca, J. Business management teaching–learning processes in times of pandemic: Flipped classroom at a distance. Sustainability 2020, 12, 137. [Google Scholar] [CrossRef]
- Fernández-Martín, F.-D.; Romero-Rodríguez, J.-M.; Gómez-García, G.; Ramos Navas-Parejo, M. Impact of the Flipped Classroom Method in the Mathematical Area: A Systematic Review. Mathematics 2020, 8, 2162. [Google Scholar] [CrossRef]
- Hong, Y.C.; Choi, I. Relationship between student designers’ reflective thinking and their design performance in bioengineering project: Exploring reflection patterns between high and low performers. Educ. Technol. Res. Dev. 2019, 67, 337–360. [Google Scholar] [CrossRef]
- Nguyen, H.; Wu, L.; Fischer, C.; Washington, G.; Warschauer, M. Increasing success in college: Examining the impact of a project-based introductory engineering course. J. Eng. Educ. 2020, 109, 384–401. [Google Scholar] [CrossRef]
- Fischer, C.; Xu, D.; Rodriguez, F.; Denaro, K.; Warschauer, M. Effects of course modality in summer session: Enrollment patterns and student performance in face-to-face and online classes. Internet High. Educ. 2020, 45, 100710. [Google Scholar] [CrossRef]
- Baker, J.D. An investigation of relationships among instructor immediacy and affective and cognitive learning in the online classroom. Internet High. Educ. 2004, 7, 1–13. [Google Scholar] [CrossRef]
- Boling, E.C.; Hough, M.; Krinsky, H.; Saleem, H.; Stevens, M. Cutting the distance in distance education: Perspectives on what promotes positive, online learning experiences. Internet High. Educ. 2012, 15, 118–126. [Google Scholar] [CrossRef]
- Galikyan, I.; Admiraal, W. Students’ engagement in asynchronous online discussion: The relationship between cognitive presence, learner prominence, and academic performance. Internet High. Educ. 2019, 43, 100692. [Google Scholar] [CrossRef]
- Rovai, A.P. Development of an instrument to measure classroom community. Internet High. Educ. 2002, 5, 197–211. [Google Scholar] [CrossRef]
- Felder, R.; Silverman, L. learning and teaching styles in engineering education. Eng. Educ. 1988, 78, 674–681. [Google Scholar]
- Trujillo-Torres, J.-M.; Hossein-Mohand, H.; Gómez-García, M.; Hossein-Mohand, H.; Hinojo-Lucena, F.-J. Estimating the Academic Performance of Secondary Education Mathematics Students: A Gain Lift Predictive Model. Mathematics 2020, 8, 2101. [Google Scholar] [CrossRef]
- Pété, E.; Leprince, C.; Lienhart, N.; Doron, J. Dealing with the impact of the COVID-19 outbreak: Are some athletes’ coping profiles more adaptive than others? Eur. J. Sport Sci. 2021, 1–11. [Google Scholar] [CrossRef] [PubMed]
- Laursen, B.; Hoff, E. Person-centered and variable-centered approaches to longitudinal data. Merrill. Palmer. Q. 2006, 52, 377–389. [Google Scholar] [CrossRef]
- Kusurkar, R.A.; Mak-van der Vossen, M.; Kors, J.; Grijpma, J.W.; van der Burgt, S.M.E.; Koster, A.S.; de la Croix, A. ‘One size does not fit all’: The value of person-centred analysis in health professions education research. Perspect. Med. Educ. 2020, 1–7. [Google Scholar] [CrossRef]
- Pintrich, P.R. Multiple goals, multiple pathways: The role of goal orientation in learning and achievement. J. Educ. Psychol. 2000, 92, 544–555. [Google Scholar] [CrossRef]
- Van Rooij, E.C.M.; Jansen, E.P.W.A.; Van De Grift, W.J.C.M. First-year university students’ academic success: The importance of academic adjustment. Eur. J. Psychol. Educ. 2018, 33, 749–767. [Google Scholar] [CrossRef] [Green Version]
- Heidari, E.; Mehrvarz, M.; Marzooghi, R.; Stoyanov, S. The role of digital informal learning in the relationship between students’ digital competence and academic engagement during the COVID-19 pandemic. J. Comput. Assist. Learn. 2021. [Google Scholar] [CrossRef]
- Alam, M.K.; Ali, F.B.; Banik, R.; Yasmin, S.; Salma, N. Assessing the mental health condition of home-confined university level students of Bangladesh due to the COVID-19 pandemic. J. Public Health 2021, 1–8. [Google Scholar] [CrossRef]
- Pozo, J.-I.; Pérez Echeverría, M.-P.; Cabellos, B.; Sánchez, D.L. Teaching and Learning in Times of COVID-19: Uses of Digital Technologies During School Lockdowns. Front. Psychol. 2021, 12, 656776. [Google Scholar] [CrossRef]
- Broadbent, J.; Fuller-Tyszkiewicz, M. Profiles in self-regulated learning and their correlates for online and blended learning students. Educ. Technol. Res. Dev. 2018, 66, 1435–1455. [Google Scholar] [CrossRef]
- Sáiz-Manzanares, M.C.; Rodríguez-Díez, J.J.; Díez-Pastor, J.F.; Rodríguez-Arribas, S.; Marticorena-Sánchez, R.; Ji, Y.P. Monitoring of student learning in learning management systems: An application of educational data mining techniques. Appl. Sci. 2021, 11, 2677. [Google Scholar] [CrossRef]
- Oates, S. The Importance of Autonomous, Self-Regulated Learning in Primary Initial Teacher Training. Front. Educ. 2019, 4. [Google Scholar] [CrossRef] [Green Version]
- Bolumole, M. Student life in the age of COVID-19. High. Educ. Res. Dev. 2020, 39, 1357–1361. [Google Scholar] [CrossRef]
- Wild, D.A.; Yeung, A.; Loedolff, M.; Spagnoli, D. Lessons Learned by Converting a First-Year Physical Chemistry Unit into an Online Course in 2 Weeks. J. Chem. Educ. 2020, 97, 2389–2392. [Google Scholar] [CrossRef]
- Pócsová, J.; Mojžišová, A.; Takáč, M.; Klein, D. The Impact of the COVID-19 Pandemic on Teaching Mathematics and Students’ Knowledge, Skills, and Grades. Educ. Sci. 2021, 11, 225. [Google Scholar] [CrossRef]
- Mansour Almusharraf, N.; Bailey, D.; Daniel Bailey, C. Online engagement during COVID-19: Role of agency on collaborative learning orientation and learning expectations. J. Comput. Assist. Learn. 2021. [Google Scholar] [CrossRef]
- Lottero-Perdue, P.S.; Lachapelle, C.P. Engineering mindsets and learning outcomes in elementary school. J. Eng. Educ. 2020, 109, 640–664. [Google Scholar] [CrossRef]
- Martin, F.; Wang, C.; Sadaf, A. Student perception of helpfulness of facilitation strategies that enhance instructor presence, connectedness, engagement and learning in online courses. Internet High. Educ. 2018, 37, 52–65. [Google Scholar] [CrossRef]
- Malhotra, S.; Kumar, A.; Dutta, R. Effect of integrating IoT courses at the freshman level on learning attitude and behaviour in the classroom. Educ. Inf. Technol. 2020, 26, 2607–2621. [Google Scholar] [CrossRef]
- Virtanen, M.A.; Kääriäinen, M.; Liikanen, E.; Haavisto, E. The comparison of students’ satisfaction between ubiquitous and web-basedlearning environments. Educ. Inf. Technol. 2017, 22, 2565–2581. [Google Scholar] [CrossRef]
- Chyung, S.Y.Y.; Roberts, K.; Swanson, I.; Hankinson, A. Evidence-Based Survey Design: The Use of a Midpoint on the Likert Scale. Perform. Improv. 2017, 56, 15–23. [Google Scholar] [CrossRef] [Green Version]
- Adelson, J.L.; McCoach, D.B. Measuring the Mathematical Attitudes of Elementary Students: The Effects of a 4-Point or 5-Point Likert-Type Scale. Educ. Psychol. Meas. 2010, 70, 796–807. [Google Scholar] [CrossRef]
- Borgers, N.; Hox, J.; Sikkel, D. Response effects in surveys on children and adolescents: The effect of number of response options, negative wording, and neutral mid-point. Qual. Quant. 2004, 38, 17–33. [Google Scholar] [CrossRef]
- Armstrong, R.L. The Midpoint on a Five-Point Likert-Type Scale. Percept. Mot. Skills 1987, 64, 359–362. [Google Scholar] [CrossRef]
- Raaijmakers, Q.A.W.; Van Hoof, A.; ’T Hart, H.; Verbogt, T.F.M.A.; Vollebergh, W.A.M. Adolescents’ midpoint responses on Likert-type scale items: Neutral or missing values? Int. J. Public Opin. Res. 2000, 12, 207–215. [Google Scholar] [CrossRef] [Green Version]
- Faber, C.J.; Kajfez, R.L.; McAlister, A.M.; Ehlert, K.M.; Lee, D.M.; Kennedy, M.S.; Benson, L.C. Undergraduate engineering students’ perceptions of research and researchers. J. Eng. Educ. 2020, 109, 780–800. [Google Scholar] [CrossRef]
- Dringenberg, E.; Purzer, Ş. Experiences of First-Year Engineering Students Working on Ill-Structured Problems in Teams. J. Eng. Educ. 2018, 107, 442–467. [Google Scholar] [CrossRef]
- Gore, P. Cluster Analysis. In Handbook of Applied Multivariate Statistics and Mathematical Modeling; Brown, S.D., Tinsley, H.E.A., Eds.; Academic Press: Cambridge, MA, USA, 2000; Volume 366, pp. 297–321. [Google Scholar]
- Peck, L.R. Using cluster analysis in program evaluation. Eval. Rev. 2005, 29, 178–196. [Google Scholar] [CrossRef]
- Ward, J.H. Hierarchical Grouping to Optimize an Objective Function. J. Am. Stat. Assoc. 1963, 58, 236–244. [Google Scholar] [CrossRef]
- Bischof, D. New graphic schemes for stata: Plotplain and plottig. Stata J. 2017, 17, 748–759. [Google Scholar] [CrossRef] [Green Version]
- Cohen, J. Statistical Power Analysis for the Behavioral Sciences, 2nd ed.; Lawrence Erlbaum Associates: Mahwah, NJ, USA, 1988; ISBN 0-8058-0283-5. [Google Scholar]
- Kruger, J.; Dunning, D. Unskilled and unaware of it: How difficulties in recognizing one’s own incompetence lead to inflated self-assessments. J. Pers. Soc. Psychol. 1999, 77, 1121–1134. [Google Scholar] [CrossRef]


| Comparative of Spring 2020 Semester Methodologies | |
|---|---|
| Before COVID-19 (Face-to-Face Course) | Emergency Remote Teaching during Lockdown |
| Theory lessons (lectures) in class | Slides with voice-overs available online |
| Problem solving in class | Solved exercises available online |
| Mid-semester test | Weekly online deliveries |
| Final exam | Final exam (online) |
| Student tutoring | E-mail support and resolution of doubts |
| Category | Question to Be Answered |
|---|---|
| Socialization and contact with the instructor and peers | Have students experienced the same feeling of contact with peers and teachers? |
| Learning sensation | Do students feel they learn more with the ERT than face to face classes? |
| Keeping up with the subject | With the ERT methodology, do students know whether or not they can keep abreast of the subject? |
| General preference | Do students prefer ERT to face-to-face classes? |
| Grade forecast | Do students forecast a higher grade with ERT than with a regular face-to-face course? |
| Evolution over time | Did students’ opinion on the ERT improve as the semester advanced? |
| Motivation | Do students feel equally motivated towards the subject with ERT and face-to-face classes? |
| Category | Question Number | Question |
|---|---|---|
| Questions about Chemistry | ||
| Socialization and contact with the instructor and peers | 1 | During the period of remote classes, I feel that communication with the teacher was similar to that during the period of face-to-face classes. |
| 2 | Direct email communication with the teacher helps me clarify doubts and solve problems. | |
| 3 | During the period of remote classes, I feel that connection with my classmates was similar to that during the period of face-to-face classes. | |
| Learning sensation | 4 | I learn better by trying to solve an exercise by myself rather than studying with an exercise already solved. |
| 5 | Testing myself before the exam without any effect on my grade helps me learn. | |
| 6 | I feel that I am learning more with this remote methodology than with the face-to-face methodology (first five weeks of semester). | |
| Keeping up with the subject | 7 | Delivering exercises weekly through the virtual campus helps me obtain constant feedback. |
| 8 | With the remote methodology I know if I am following the subject properly. | |
| 9 | The available material (presentations with voice, solved exercises, etc.) has been sufficient. | |
| General preference | 10 | In this subject, I prefer to study the theory through slides with voice at home rather than attending face-to-face theory classes. |
| 11 | In this subject, I prefer to practice the exercises autonomously at home rather than attending a face-to-face class in which problems are solved. | |
| 12 | The face-to-face classes in this subject do not provide added value compared to what I can do on my own with a remote methodology. | |
| Grade forecast | 13 | I think I will get a better grade in the subject than I would have done if the whole semester had been conducted in-person. |
| Evolution over time | 14 | As the semester has progressed, my opinion on the remote methodology of this subject has improved. |
| Motivation | 15 | I am equally motivated for the subject regardless of whether the classes are face-to-face or remote. |
| Questions about Your Preference for Subjects in General (not just Chemistry) Considering a Normal Situation without Lockdown. | ||
| Projection without lockdown | 16 | I prefer to take remote classes (both theory and problems) and only attend in person for the exams. |
| 17 | I prefer to do the theory remotely and dedicate face-to-face classes to solving exercises and taking exams. | |
| Type of remote teaching | 18 | The reason why I prefer remote classes is the freedom to access the material at the time I choose. |
| 19 | I prefer slides with voice rather than doing live classes by videocall. | |
| 20 | In the remote methodology, I prefer to have visual contact with the teacher when doing the classes. | |
| Observations/clarifications | At the end of the questionnaire, there is an open-ended question for students to add comments. | |
Publisher’s Note: MDPI stays neutral with regard to jurisdictional claims in published maps and institutional affiliations. |
© 2021 by the authors. Licensee MDPI, Basel, Switzerland. This article is an open access article distributed under the terms and conditions of the Creative Commons Attribution (CC BY) license (https://creativecommons.org/licenses/by/4.0/).
Share and Cite
Hidalgo, G.I.; Sánchez-Carracedo, F.; Romero-Portillo, D. COVID-19 Emergency Remote Teaching Opinions and Academic Performance of Undergraduate Students: Analysis of 4 Students’ Profiles. A Case Study. Mathematics 2021, 9, 2147. https://0-doi-org.brum.beds.ac.uk/10.3390/math9172147
Hidalgo GI, Sánchez-Carracedo F, Romero-Portillo D. COVID-19 Emergency Remote Teaching Opinions and Academic Performance of Undergraduate Students: Analysis of 4 Students’ Profiles. A Case Study. Mathematics. 2021; 9(17):2147. https://0-doi-org.brum.beds.ac.uk/10.3390/math9172147
Chicago/Turabian StyleHidalgo, Gádor Indra, Fermín Sánchez-Carracedo, and Daniel Romero-Portillo. 2021. "COVID-19 Emergency Remote Teaching Opinions and Academic Performance of Undergraduate Students: Analysis of 4 Students’ Profiles. A Case Study" Mathematics 9, no. 17: 2147. https://0-doi-org.brum.beds.ac.uk/10.3390/math9172147