Article

A Transdisciplinary Approach for Analyzing Stress Flow Patterns in Biostructures

1
US Army Engineer Research and Development Center, Vicksburg, MS 39180, USA
2
Department of Aerospace Engineering, Mississippi State University, Starkville, MS 39762, USA
3
Center for Advanced Vehicular Systems (CAVS), Mississippi State University, Starkville, MS 39762, USA
4
School of Mathematics and Statistics, University of Melbourne, Parkville, Victoria 3010, Australia
*
Author to whom correspondence should be addressed.
Math. Comput. Appl. 2019, 24(2), 47; https://0-doi-org.brum.beds.ac.uk/10.3390/mca24020047
Submission received: 27 March 2019 / Revised: 22 April 2019 / Accepted: 24 April 2019 / Published: 26 April 2019

Abstract

:
This work presents a transdisciplinary, integrated approach that uses computational mechanics experiments with a flow network strategy to gain fundamental insights into the stress flow of high-performance, lightweight, structured composites by investigating the rostrum of paddlefish. Although computational mechanics experiments give an overall distribution of stress in the structural systems, stress flow patterns formed at nascent stages of loading a biostructure are hard to determine. Computational mechanics experiments on a complex model will involve a high degree of freedom thereby making the extraction of finer details computationally expensive. To address this challenge, the evolution of the stress in the rostrum is formulated as a network flow problem generated by extracting the node and connectivity information from the numerical model of the rostrum. The flow network is weighted based on the parameter of interest, which is stress in the current research. The changing kinematics of the system is provided as input to the mathematical algorithm that computes the minimum cut of the flow network. The flow network approach is verified using two simple classical problems. When applied to the model of the rostrum, the flow network approach identifies strain localization in tensile regions, and buckling/crushing in compressive regions.

1. Introduction

A fundamental understanding of the response of a structural system to external loading conditions is important in determining if the design is able to withstand the prescribed external load. Numerous methods are available to quantify the response of a structural system to external loads. Existing methods, such as acoustic emission [1,2,3,4,5,6,7] and digital image correlation [8,9,10,11,12,13,14,15,16,17], offer the capability to experimentally measure/quantify/determine strains/deformations. From a modelling perspective, there are continuum-based [18,19,20] and discrete- or lattice-based [21,22,23] approaches that not only satisfy the physical laws governing the systems, but also provide abundant information required for structural analysis. Finite element analysis has been used to study the mechanical properties of bioinspired structures. Flores-Johnson et al. [24] carried out simulations on bioinspired, nacre-like composite plates. Nacre, found in mollusk shells, is a biological material that shows remarkable mechanical performance because of its hierarchical geometry spanning multiple length scales [25]. Flores-Johnson et al. [24] found that the nacre-like plates demonstrated superior performance as compared to standard bulk plates under blast loadings. Tran et al. [26] conducted a study to analyze the response of a bioinspired composite plate based on nacre structure subjected to underwater impulsive loading. They discovered that the bioinspired composite structure spread the damage over a larger area, thereby decreasing stress. Although a considerable amount of research is performed on biostructures and bioinspired structures, there is yet a lack of understanding on what imparts superior performance to biostructures. Numerical analysis provides the overall response of the structural system under an external loading condition. However, additional information is required to understand the influence of the local topology on the global structural response and overall performance of the system. To our knowledge, advanced mathematical algorithms have not been used with continuum-based models to gain fundamental insight into the structural response of biostructures. Since biostructures are geometrically optimized at the coarsest level of hierarchy, the information obtained at the local topology level provides insights that could be used to identify optimal geometrical configurations that impart superior characteristics to biostructures.
Any conceivable problem dealing with the transmission of information can be solved by abstraction to a network or a graph [27]. These abstractions involve representing the system in terms of a transmission medium and the internal details that block the information flow, i.e., flow bottlenecks. From this viewpoint, maximum flow and minimum cut are two of the most widely used algorithmic approaches in network flow theory [27]. Maximum flow governs the amount of information that can be transmitted through the network. Minimum cut embodies a set of edges in the network that form the bottlenecks to transmission. Tordesillas et al. examined the formation of bottlenecks in transmission of force through the contact network by applying network flow theory [27,28,29]. The location and formation of the bottlenecks are influenced by the local as well as global characteristics of the structural system. The early identification of bottlenecks in force transmission opens new avenues for detection, as well as manipulation of the approaching failure in granular systems.
Lefort et al. [30] used image analysis that employed an integration of a numerical model with Ripley’s function [31] to identify patterns in the fracture process zone (FPZ) in a quasibrittle material. Macrocracks in a quasibrittle material are formed by the combination of microcrack propagation, interaction, and coalescence, situated within the FPZ. Ripley’s function is used to characterize randomness in the spatial spreading of point distributions and to identify the spreading and development of diverse patterns, e.g., cell migration [31], tree [32] and plant [33] dissemination, and disease transmission [34]. Lefort’s research could open up new paths that would result in nonlocal continuum modeling at the macroscale level.
The mathematical approaches used for dense granular systems and quasibrittle materials demonstrate that local topological interactions are a major contributor to the global structural response. To gain an understanding of failure mechanisms, it is essential to capture the activity around the failure site at the nascent stage of loading. Obtaining this insight at the onset of loading may provide insight into failure mechanisms and possibly suggest novel approaches to alter the process and location of failure. Additionally, if the location of the failure is identified earlier, there is a possibility of developing a relationship that aids in quantifying the external force required for the structural system to fail at that location. This knowledge can be used for designing new structural systems, and for the assessment of existing critical infrastructure.
Biostructures have, in general, demonstrated superior characteristics as they evolved to serve multiple and specific functions [35]. The biostructure of interest here is the snout, or rostrum, of the paddlefish (Polyodon spathula). This large North American freshwater fish is related to sturgeons. Unlike those fish with their short thick rostra, the paddlefish has an elongated, flattened rostrum that in adults may be in the range of 29–59% of its body length, and in breadth in the range of 8–17% of body length [36]. The rostrum was once believed to be a simple digging or stirring implement, but is now known to be a complex hydrodynamic and electrosensory structure [37]. This prominent structure is easily observed and is supported internally by a distinctive skeleton of ossified cartilage comprised of large axial rods with two posterior buttresses at the base and with numerous small stellate elements lateral to the axis (Figure 1).
The rostrum’s lattice-like architecture with complex geometry appears to contribute to its unique strength and resilience. This research is motivated by an earlier feasibility study that concluded that the nonuniform geometry of the rostrum is one of its toughening mechanisms used to mitigate failure [38]. Since biostructures in general and the paddlefish rostrum in particular are made of heterogeneous materials and also have hierarchical geometry, it is difficult to identify the major contributor to their superior structural response. A fundamental understanding of how this lattice-like architecture functions has the potential to provide novel insights into applications over a wide range of disciplines (e.g., protective panels, novel building materials, body and vehicle armor, and ship design, among other possible uses). This research seeks to use an integrated transdisciplinary approach that feeds information from computational mechanics experiments on biostructures to a mathematical algorithm to identify the patterns formed at the early stages of loading of the biostructure.
Patel et al. developed the methodology of using network theory with finite element analysis in their previous work [39], which used a single source and sink combination to analyze the stress flow pattern on the rostrum. They also presented the procedure of preparing the data in an appropriate format from finite element binary database files to an abstract mathematical domain in their recent publication [40]. Patel et al. have also developed bioinspired structural systems to analyze the relationship of structural resiliency and geometrical complexity [39]. This work extends their previous research to include a multiple combination of source and sink. Since the material is in the linearly elastic regime, the solution from the mathematical algorithm can be superimposed. The addition of this aspect to the current analysis assisted in capturing the shear and flexure pattern in a four point bending of a simply supported concrete beam.
The paper is organized as follows. In Section 2, a brief introduction to network flow is provided, and Section 3 describes the procedure to formulate the biostructure as a network flow problem. In Section 4, the proposed approach is verified using two classical problems. Details of the computational mechanics experiments are discussed in Section 5, followed by results in Section 6, and conclusions follow in Section 7.

2. Network Flow

A brief introduction of the basic concepts of network flow is now provided. A flow network is a directed graph with two distinguished vertices, called a source and a sink, coupled with a non-negative real-valued function called the capacity function [27,41,42].
A network N is defined as a set comprising:
  • directed graph G (V, E), where V is a finite set of vertices, and E is a subset of ordered pairs of vertices representing the edges;
  • vertex s ∈ V that has only outgoing edges represented as the source node;
  • vertex t ∈ V that has only incoming edges represented as the sink node; and
  • positive function c: ER+ called the capacity function.
Flow f on a network N is defined by real-valued function f: ER+. Flow f is a feasible flow vector if it satisfies the following constraints:
  • Capacity constraint ∀u, v ∈ V requires that f(u, v) ≤ c(u, v); flow cannot exceed the capacity of the respective edge.
  • Conservation of flow ∀u, v ∈ V − (s, t) requires that
    (a)
    v ϵ V f ( u , v ) = 0 ,
    (b)
    the total flow entering a node must equal the total flow leaving that node provided the node is not a source or sink node, and
  • the total flow leaving the source node s must be equal to the total flow entering sink node t.
Given a flow network G(V, E), with source s and sink t, such that there are no incoming edges at the source and no outgoing edges at the sink, the maximum flow problem involves finding a function f that satisfies the capacity and conservation constraints described above; its value is defined as follows:
val(f) = max(f)
A cut of a flow network G(V,E) is defined as a set of vertices (E1, E2) that partition V into E1 and E2= VE1, such that s ∈ E1 and t ∈ E2. If f is a flow, then the net flow across the cut (E1, E2) is defined as f (E1, E2). The capacity of the cut (E1, E2) is c(E1, E2).
A minimum E1E2 cut problem involves minimizing c(E1, E2). That would mean the identification of E1 and E2 in such a manner so as to find the minimal capacity of the (E1, E2) cut.
In combinatorial optimization theory, the maximum-flow/minimum-cut theorem states that in a flow network G(V, E), the maximum quantity of flow f travelling from source node s to sink node t is identical to the total weight of the edges in the minimum cut. Essentially speaking, the maximum flow in the network is equal to the smallest total weight of the edges that, if removed, would cause the source to be totally disconnected from the sink.
The network flow approach has previously been applied to characterize stress transmission in various synthetic and natural materials with complex microstructures, for example, sand [29,43], photoelastic disks [29], and concrete [5]. In these studies, microstructural data on the internal connectivity and edge capacities were obtained from high-resolution imaging experiments (e.g., X-ray CT, birefringence analysis) and discrete-element (DEM) models.

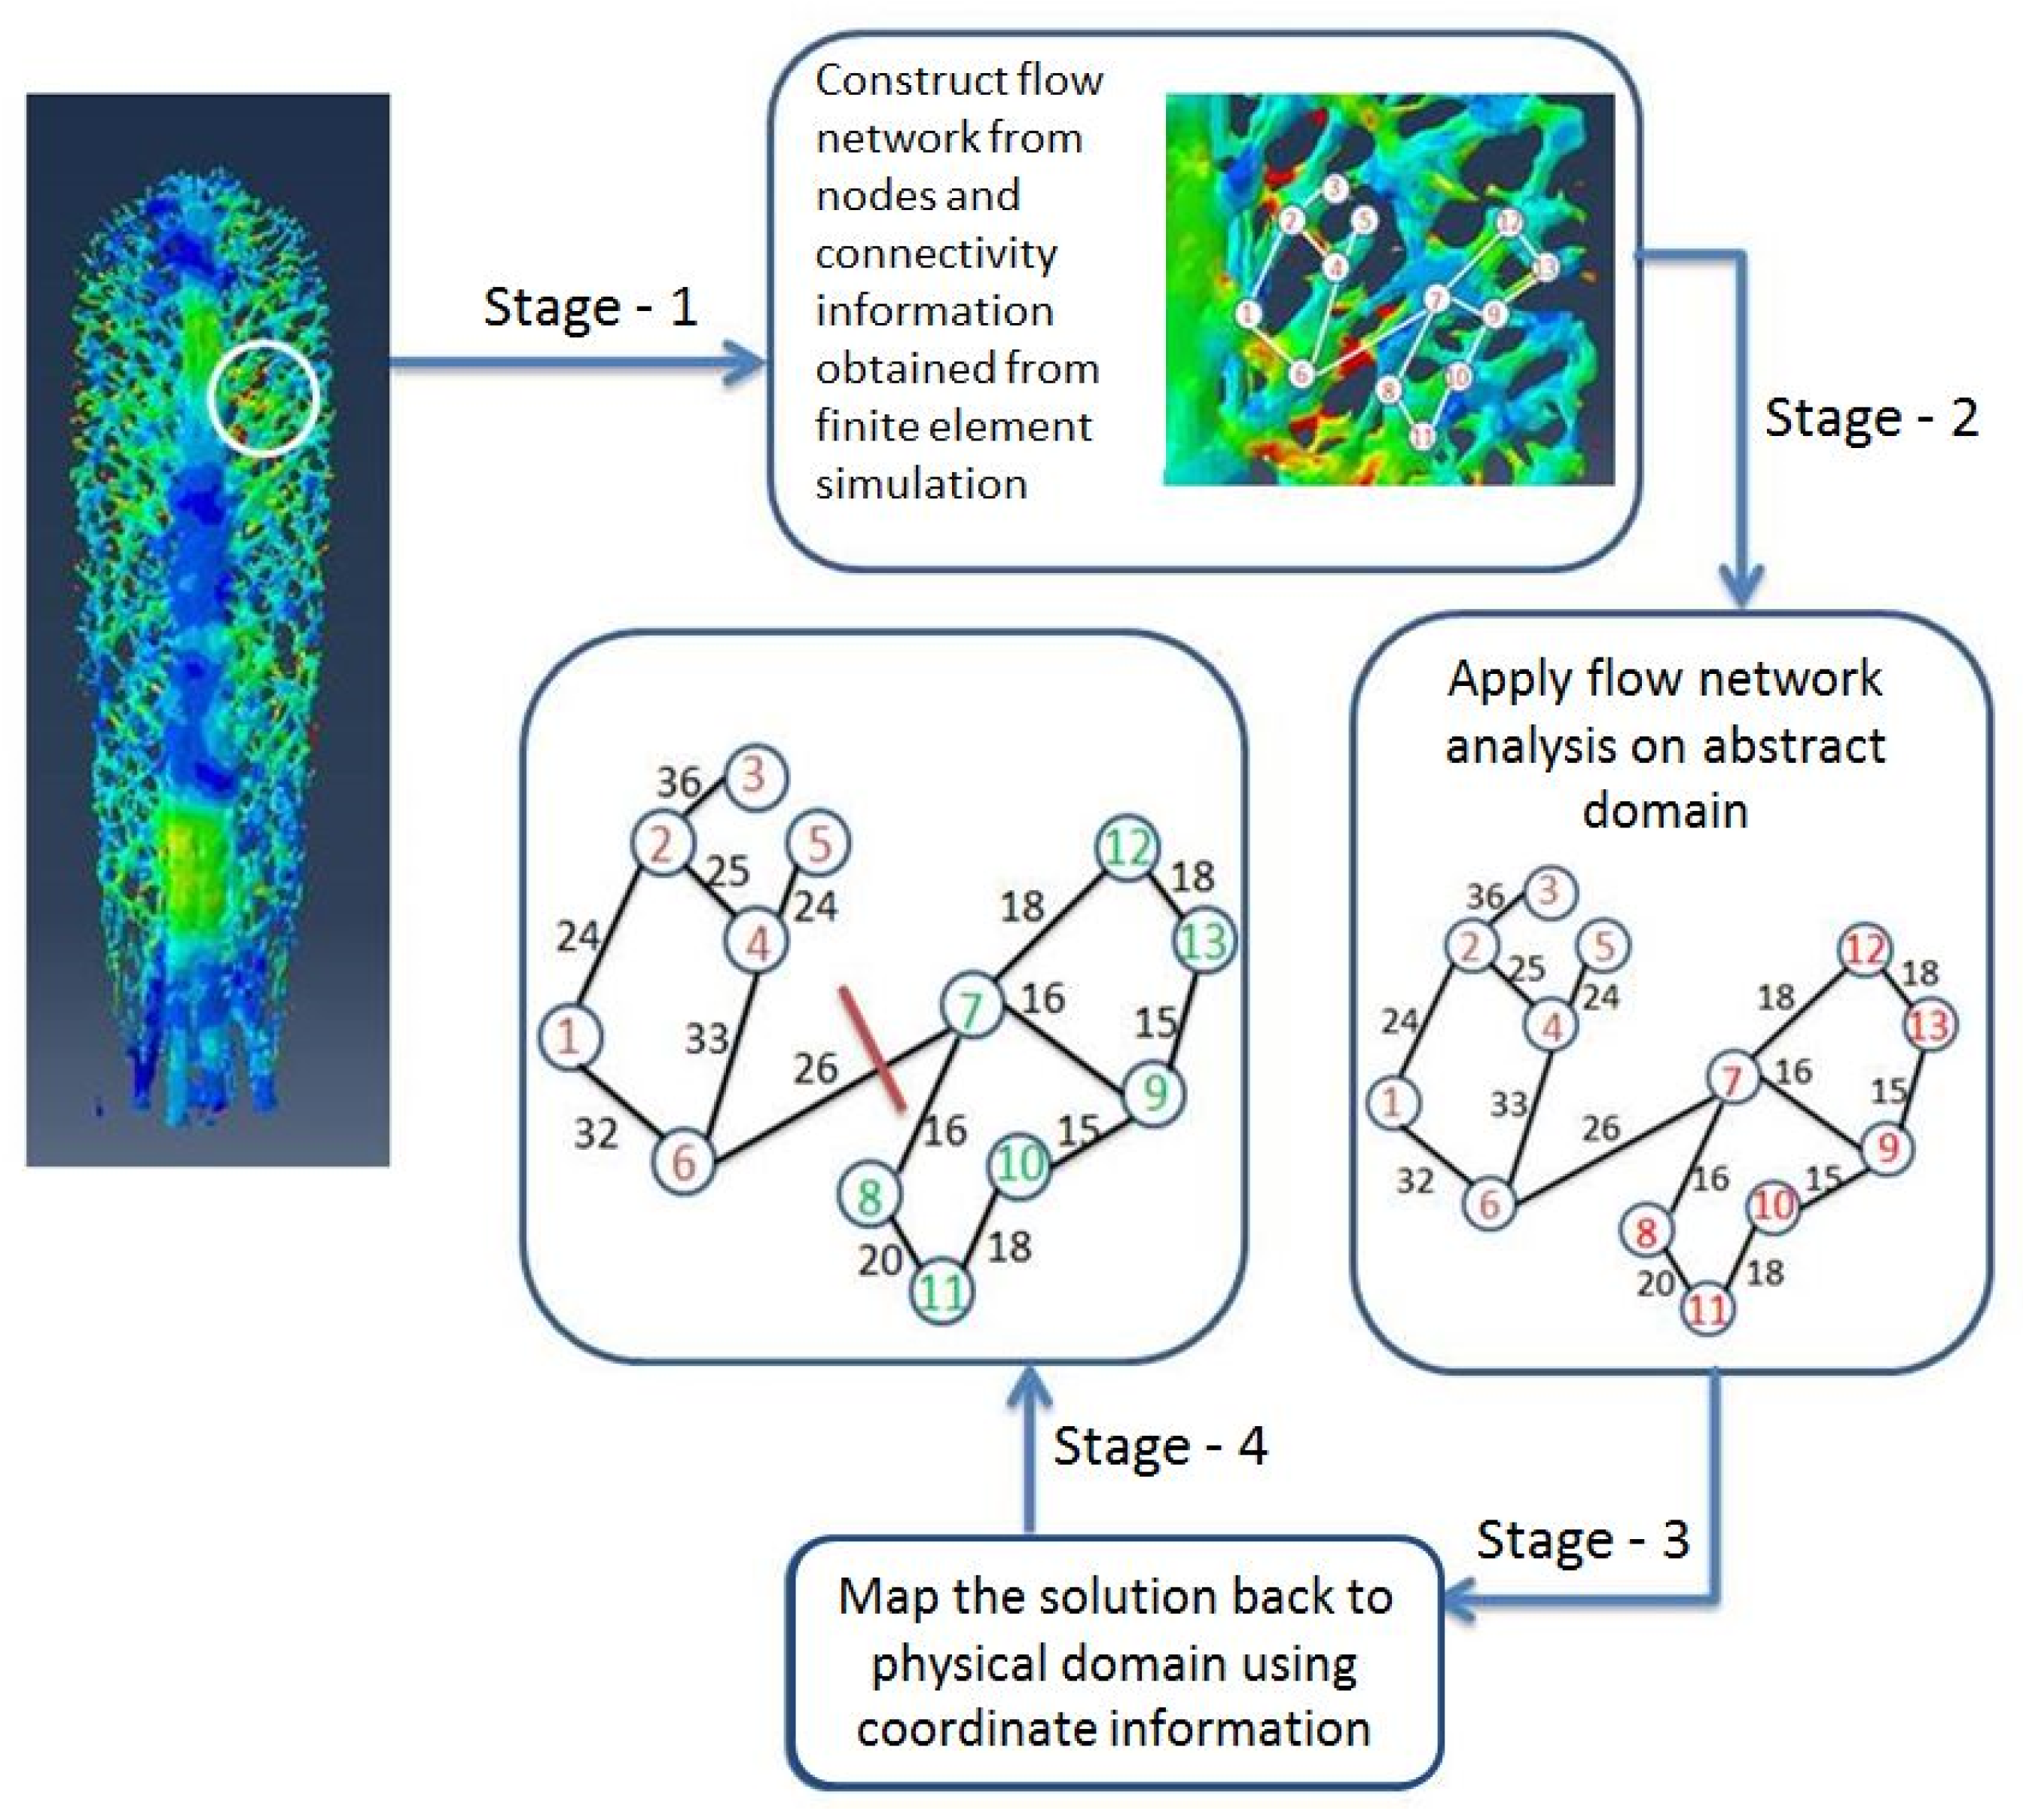
3. Formulation of the Biostructure as Network Flow Problem

The flow of stress in a structural system can be interpreted as a directed graph that facilitates the investigation of failure mechanisms. Intuitively, the transmission of information at a given point in the structural system is the rate at which the information (i.e., variables such as stress, displacement, kinetic energy, elastic or plastic strain in the structural system) travels. Each edge in a directed graph can be compared to a channel through which information is transmitted. Each edge has a corresponding capacity that is representative of the maximum rate at which information can be passed through the edge. Vertices of the graph are the points where the edges connect. Two special nodes identified as source and sink govern the flow. The edges connected to these special nodes are assigned infinite capacity [27,29]. The selection of these special nodes is dependent on the type of boundary conditions implemented on the model. For example, if the model is subjected to constant uniform pressure in the vertical direction, the nodes on the top or bottom surface of the model are chosen to act as the source and sink, respectively. Since the flow of stress is symmetric, altering the assignment of source and sink does not change the flow pattern.
A flow network N (V, E, A, U, s, t) [27,29] is constructed from the computational-mechanics model, such that:
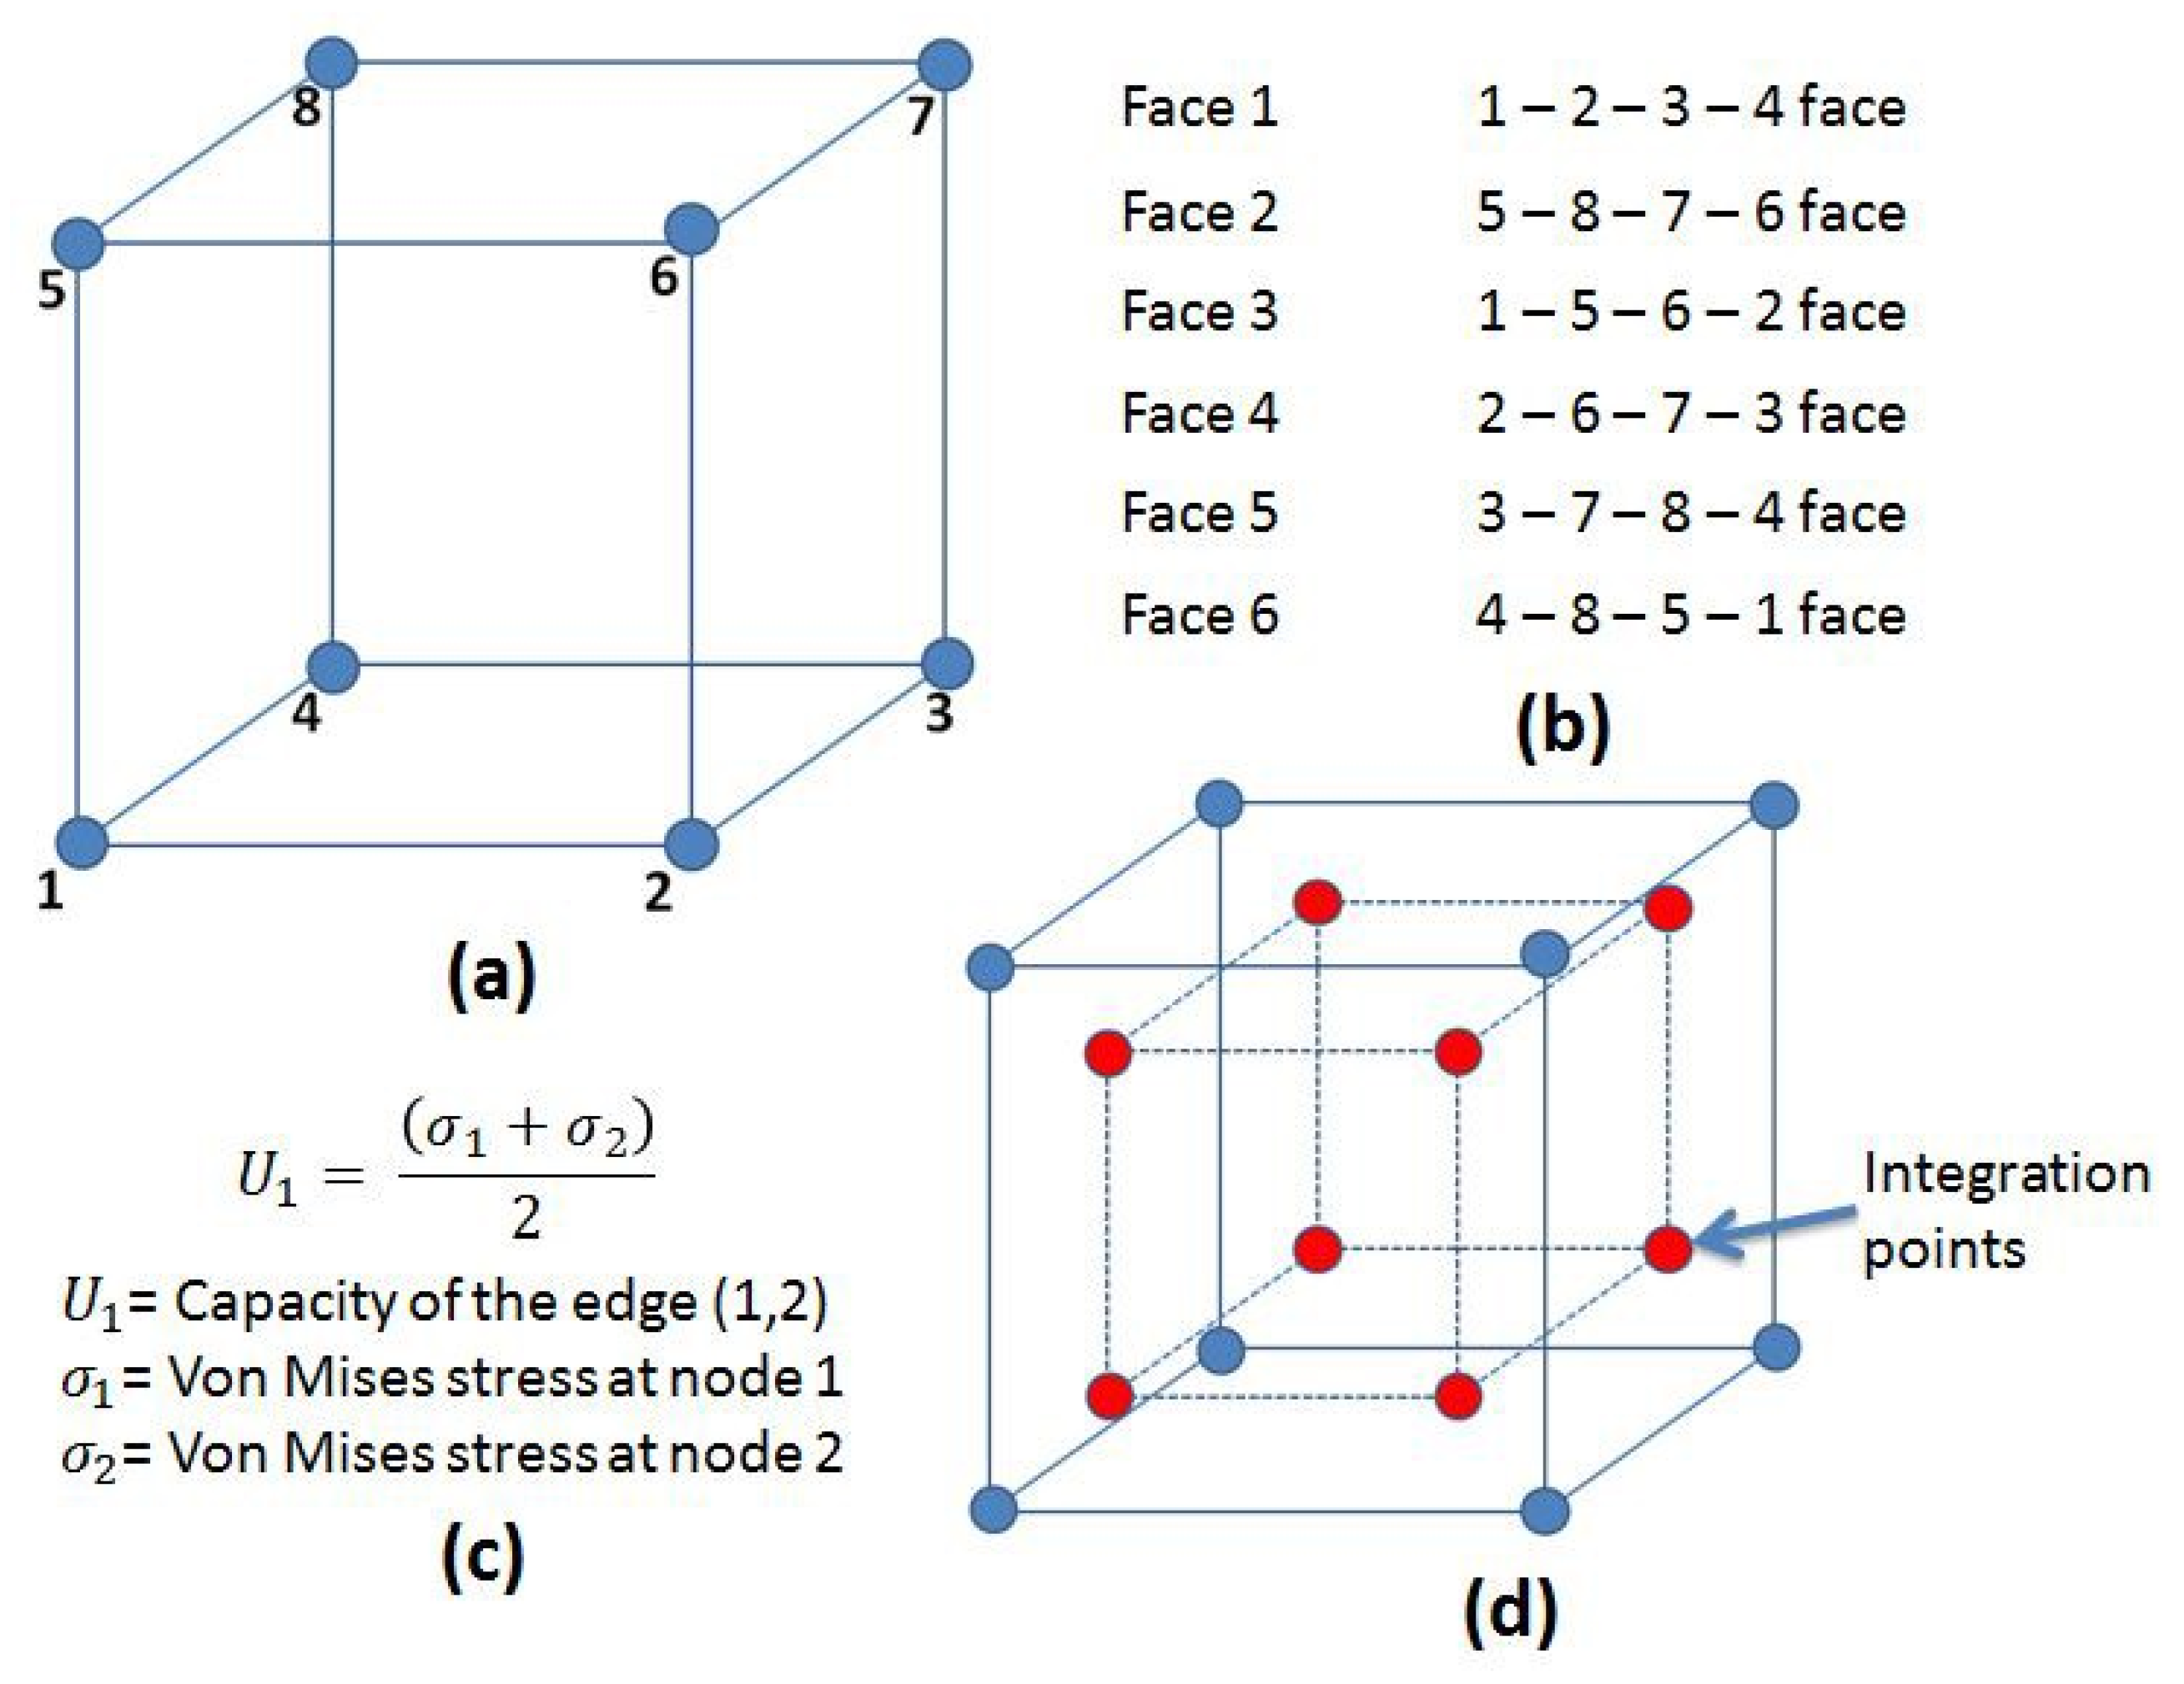
  • V represents the nodes obtained from the finite element model of the biostructure. As shown in Figure 2a, for a hexahedral element in a finite element model, nodes are 1, 2, …, 8.
  • E represents the edges, connecting the nodes in V, indicating connectivity A between the nodes. The edges of a hexahedral element, as shown in Figure 2a, are {(1, 2), (2, 3), (3, 4), (4, 1)} for Face 1.
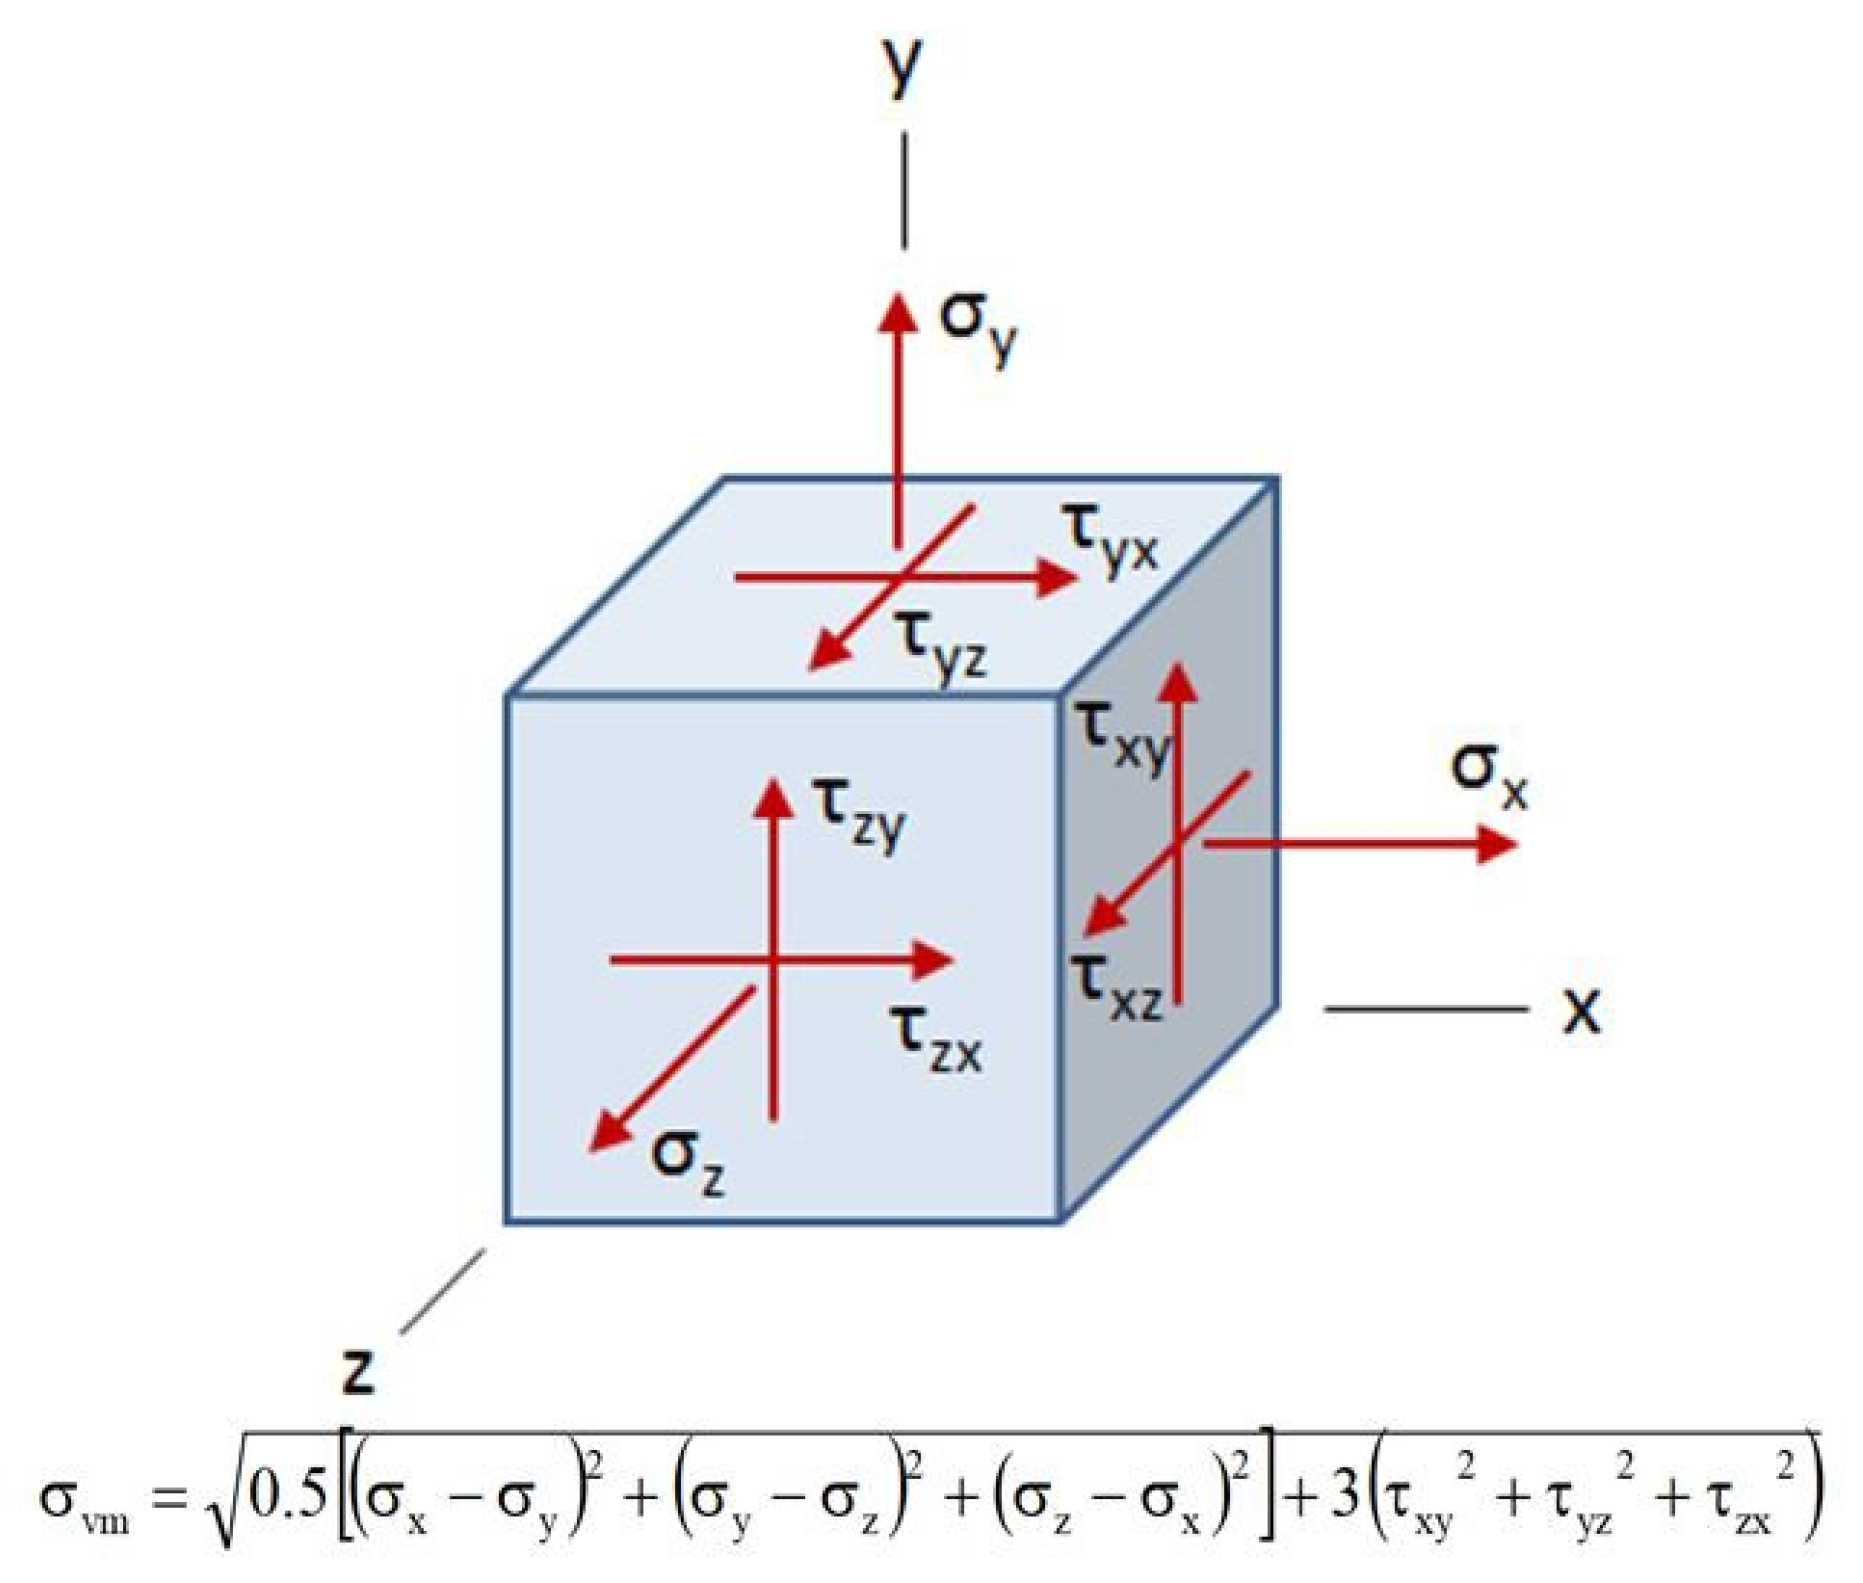
  • Each edge (u, v) ∈ E has a capacity U associated with it that is representative of the maximum amount of flow that could be transmitted through the edge. Capacity calculation for Edge (1, 2) is shown in Figure 2c. Capacity for Edge (1, 2) is the average of the von Mises stresses at Nodes 1 and 2.
  • Von Mises stresses (as shown in Figure 3) at each node are calculated using the average of the integration points shown in Figure 2d.
Each time frame from the computational-mechanics experiment is constructed as a network flow graph, where each graph depicts the flow of the variable of interest in response to the external loading condition. For each network, the maximum flow and minimum cut is calculated. As stated by the maximum-flow/minimum-cut theorem, the value of the maximum flow is equal to the capacity of the minimum cut.
The procedure outlined above for the proposed flow network approach is outlined in the flowchart shown in Figure 4. As shown in Figure 4, the flow network is constructed using the nodes and connectivity information from the computational mechanics experiment. Capacity C of the flow network was obtained from the Von Mises stresses produced from the binary output database files of the computational-mechanics experiment. The mathematical algorithm was executed on the abstract domain. The solution obtained from the mathematical algorithm was mapped back to the physical domain using the coordinate information of the nodes. Paraview was used for visualizing the solution of the mathematical algorithm. As mentioned above, the procedure of formulating the solution from finite element analysis as a flow network graph was carried out in four stages. As shown in Figure 4, in Stage 1, the flow network was constructed using the nodes and connectivity information from finite element analysis. In Stage 2, the weight of the flow network was obtained using the parameter of interest (stresses, in the current study, were also acquired from finite element analysis). In Stage 3, the flow network graph was created. In Stage 4, the flow network graph was provided as input to the mathematical algorithm that computes the minimum cut of the flow network graph. The details of the procedure involved in the four stages mentioned above is described in the previous work of Patel et al. [40].
The flow network graph in the current study was developed using data obtained from finite element simulation. The Abaqus/Standard solver was used for conducting static analysis. The choice of Abaqus/Standard for performing these analyses is justified based on the algorithm that it employs for static and low-speed dynamic events, where highly accurate stress solutions are required. Analysis was executed in two steps. Gravity load (self-weight) is applied to the models in the initialization stage. Pressure load was applied to the models in the second stage. The pressure load applied to the model was obtained by multiplying the total load with the time increment of the finite element simulation. Geometric nonlinearity was taken into account in the simulations.

4. Verification of Approach on Known Datasets

The customary method for verifying a new approach is to use a problem that is simple enough to have an analytical solution and similar enough to the phenomena that are being simulated so that a meaningful extrapolation to the actual problem is feasible. By doing so, numerical and analytical solutions can be compared, and the fundamental shortcomings of the numerical approach used to solve the problem can be identified. To verify the current research methodology, two simple problems were chosen. The problem descriptions and methodology implementations follow in the subsections below.

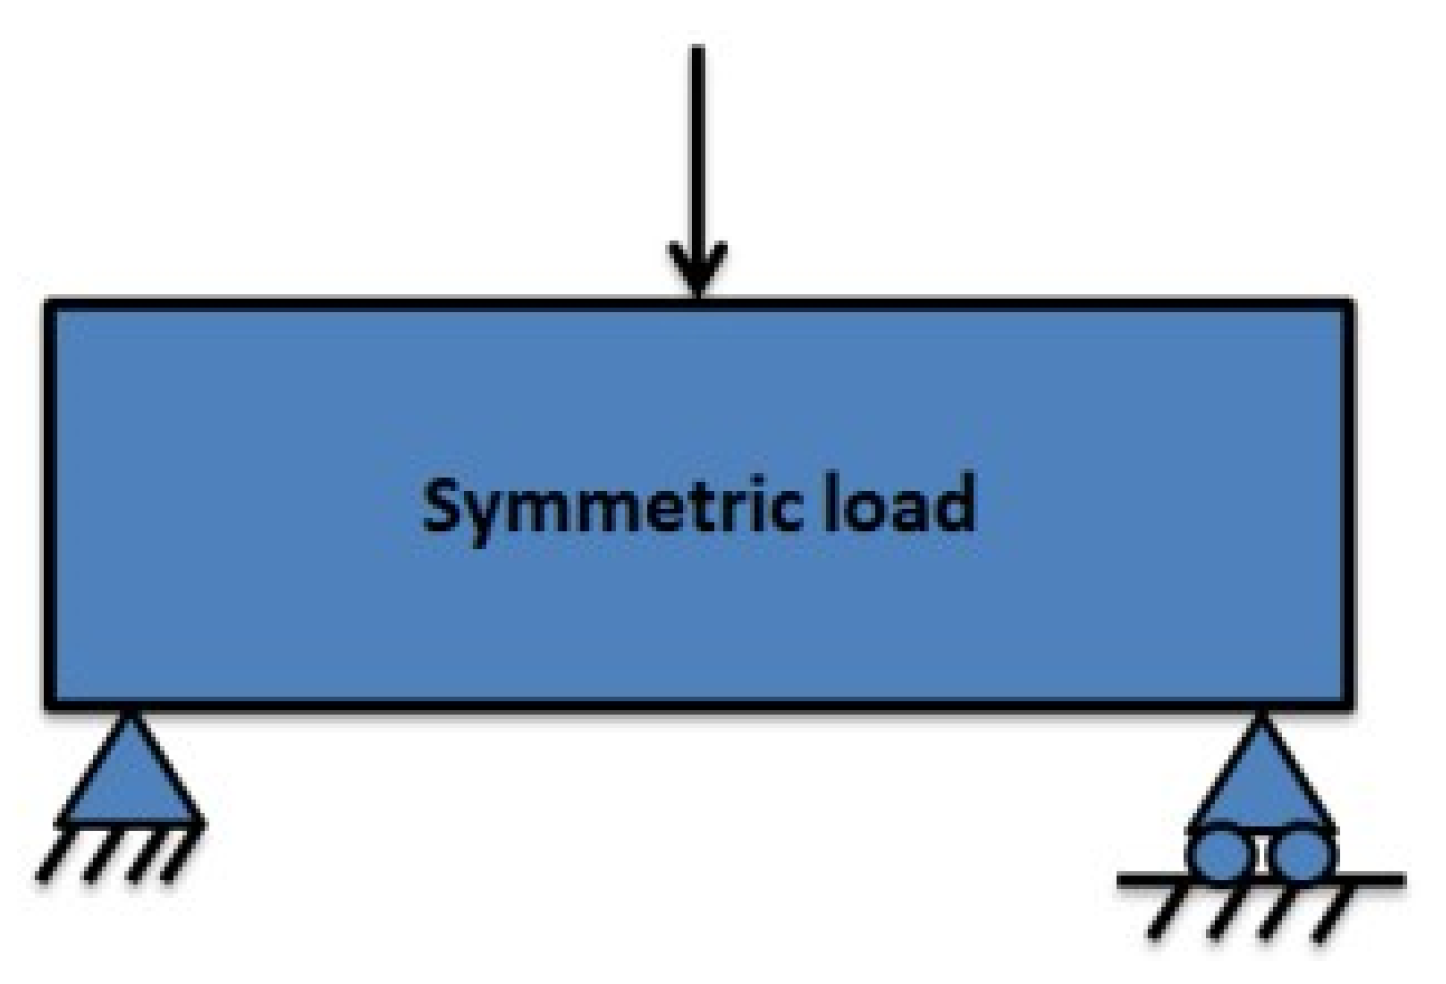
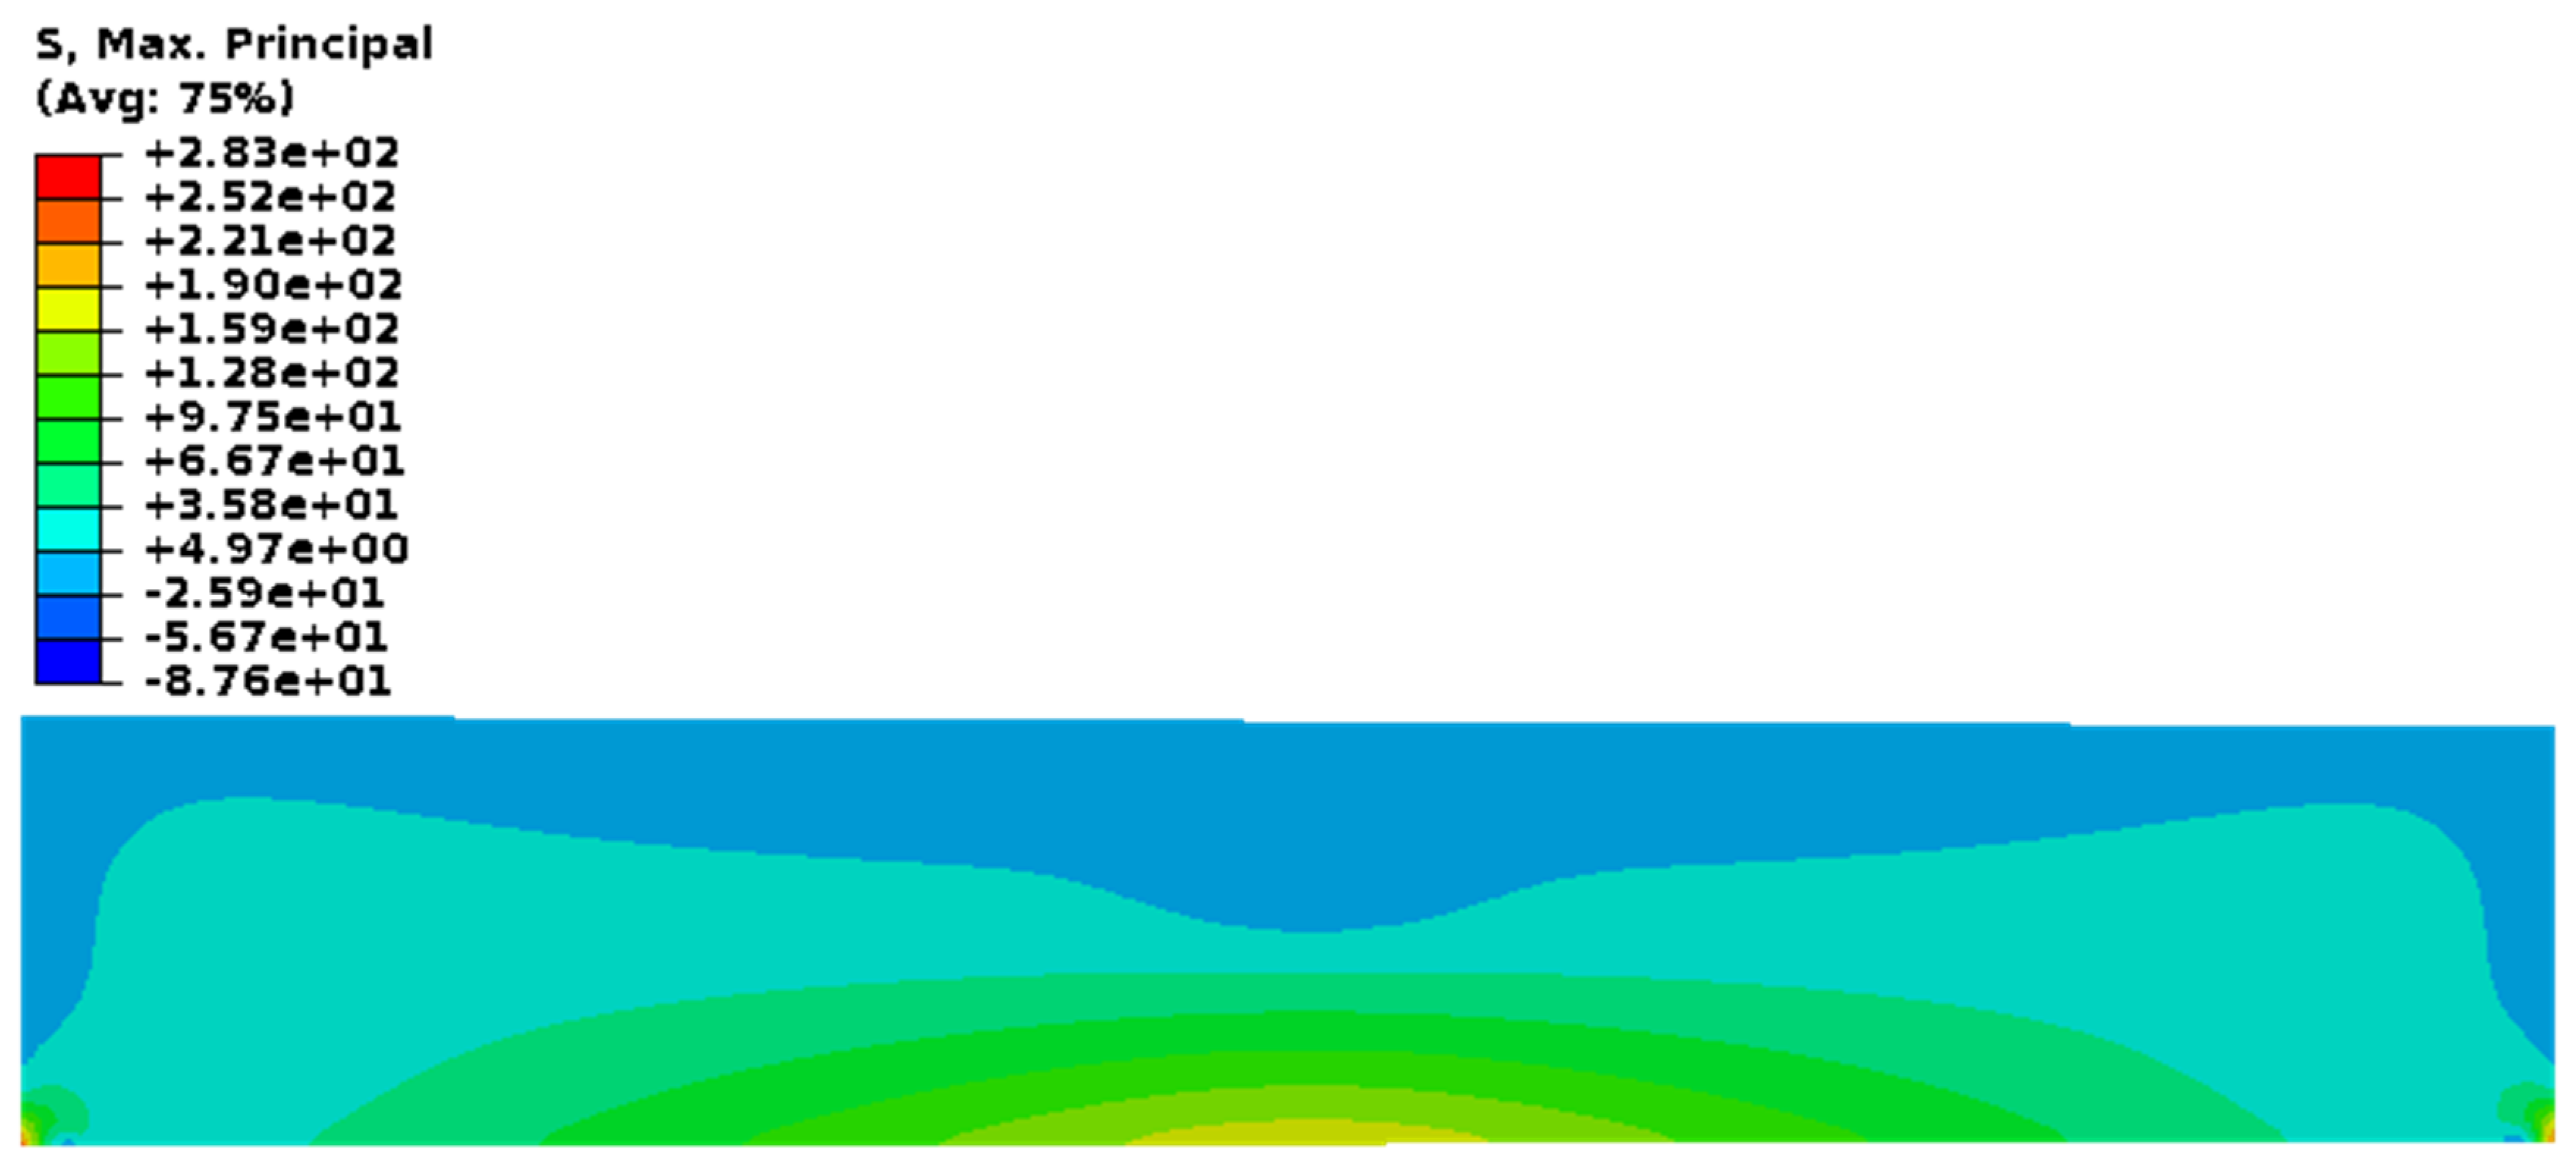
4.1. Problem 1: Three-Point Bending of a Simply Supported Beam

The Abaqus/Standard solver [44] was used to carry out a computational-mechanics experiment on a simply supported concrete beam. The length of the beam was 216 inches, the width was 36 inches, and the thickness was 6 inches. A mass density of 8.67 × 10⁻¹¹ slug/in3, Young’s modulus of 3 × 10⁶ psi, and Poisson’s ratio of 0.3 were used for the concrete material model [45,46]. The Abaqus mesh consisted of 73,278 quadratic tetrahedral elements comprising 117,709 nodes. The schematic of the loading condition on the simply supported concrete beam is displayed in Figure 5.
The maximum principal stresses obtained from the computational-mechanics experiment are plotted in Figure 6, which gives the overall stress distribution in the beam subjected to a concentrated load of 100 MPa at the center. The simulation was carried out using the dynamic, explicit method in Abaqus for a total time of 0.005 s. Geometric nonlinearity effects were included. The node and connectivity information were extracted from the computational mechanics model to construct a flow network. The network was weighted based on the Von Mises stress values from the Abaqus output database file. The von Mises stresses are equivalent tensile stresses derived from the stress deviator [47].
Source and sink combinations were selected from high-stress areas. The result of the network flow analysis is shown in Figure 7. The source in this case was chosen in the area where the load was applied. The sink was selected in the area where maximum deformation occurs for this classical problem (i.e., the midpoint of the beam parallel to where the source was selected). Figure 7 shows the result of network flow analysis. The minimum cut identified by the mathematical algorithm is represented by the blue line in Figure 7. The minimum cut denotes a set of edges in the flow network that inhibit flow transmission or form transmission bottlenecks, i.e., flow network analysis highlights the members of the beam where the failure mechanism initiates. For this problem, network analysis shows the typical behavior of a beam subjected to a concentrated load at the center line. A failure for this classical problem initiates with a crack at the bottom face sheet at the beams midspan and continues to grow as the load increases. Hence, the proposed methodology for detecting the failure mechanisms at the nascent stage of loading from the computational-mechanics experiment and flow network approach was verified using a simple problem with a known solution.

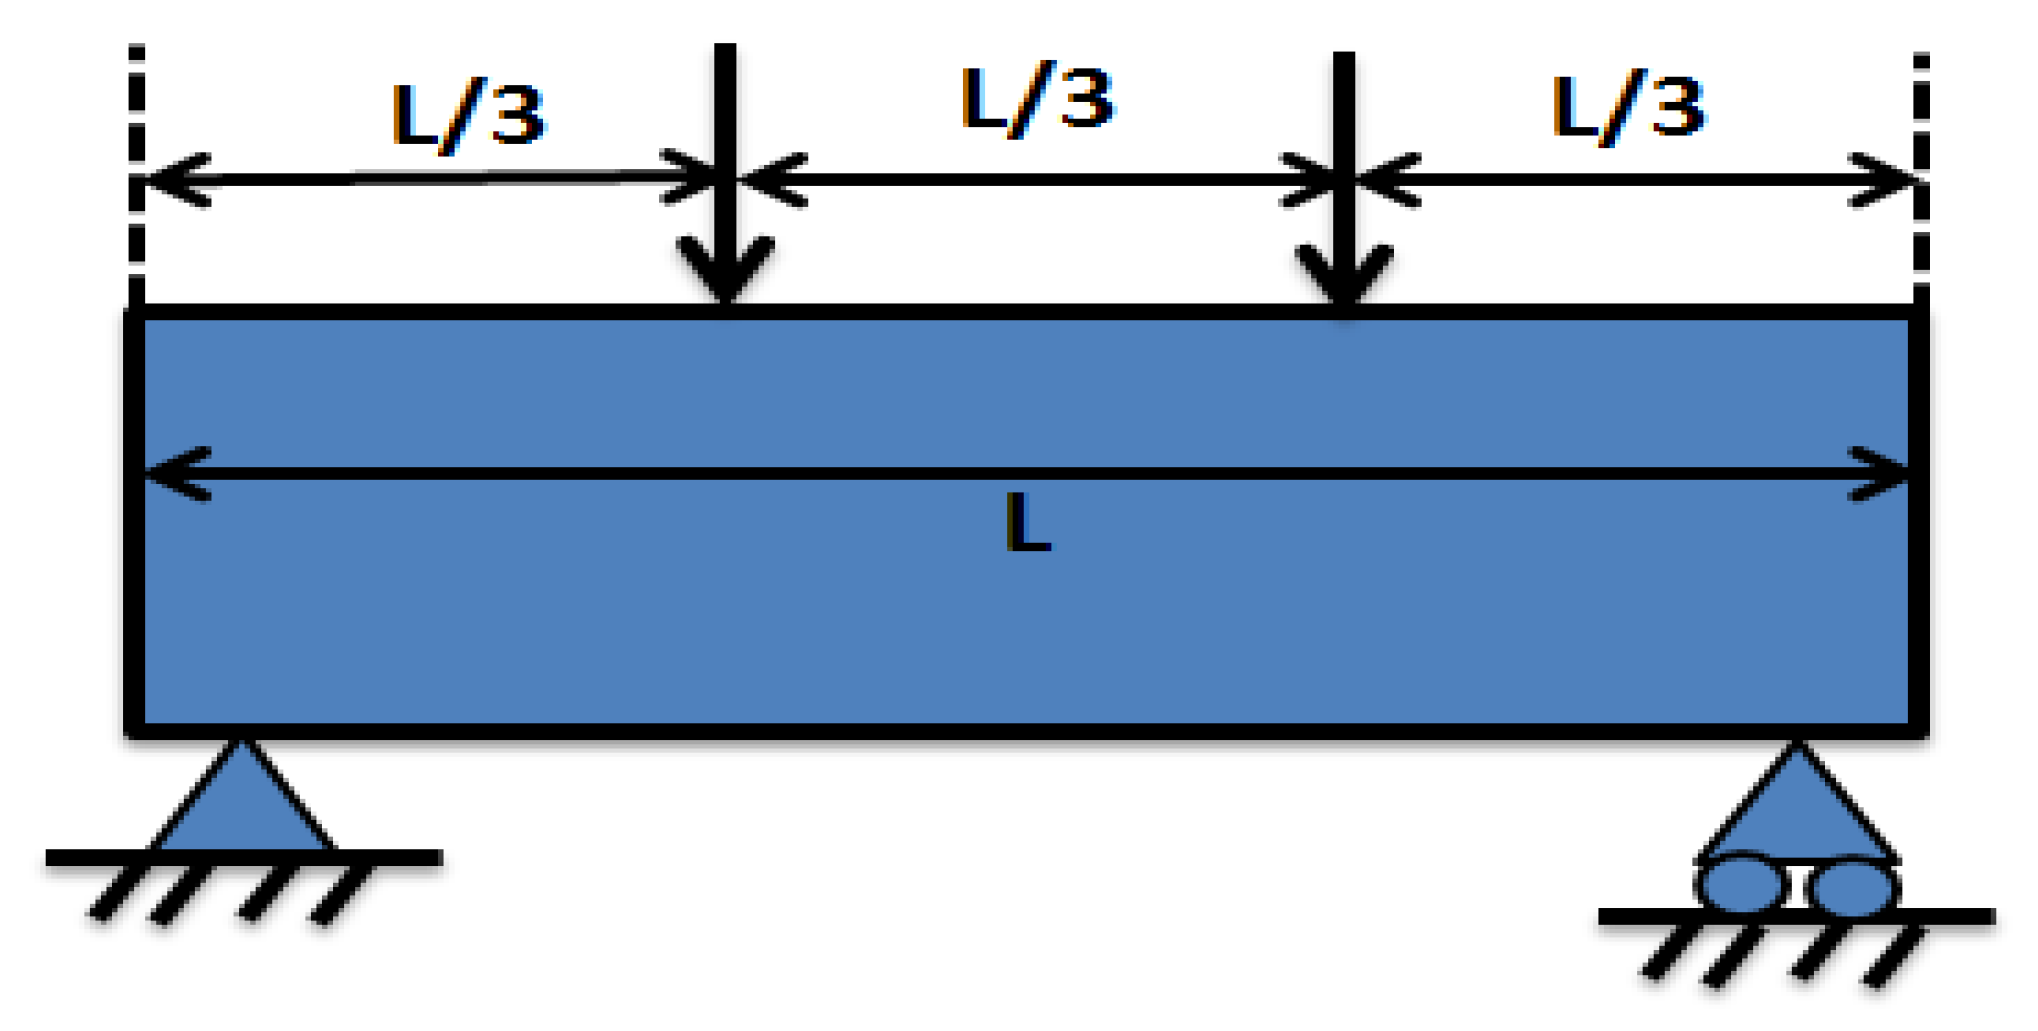
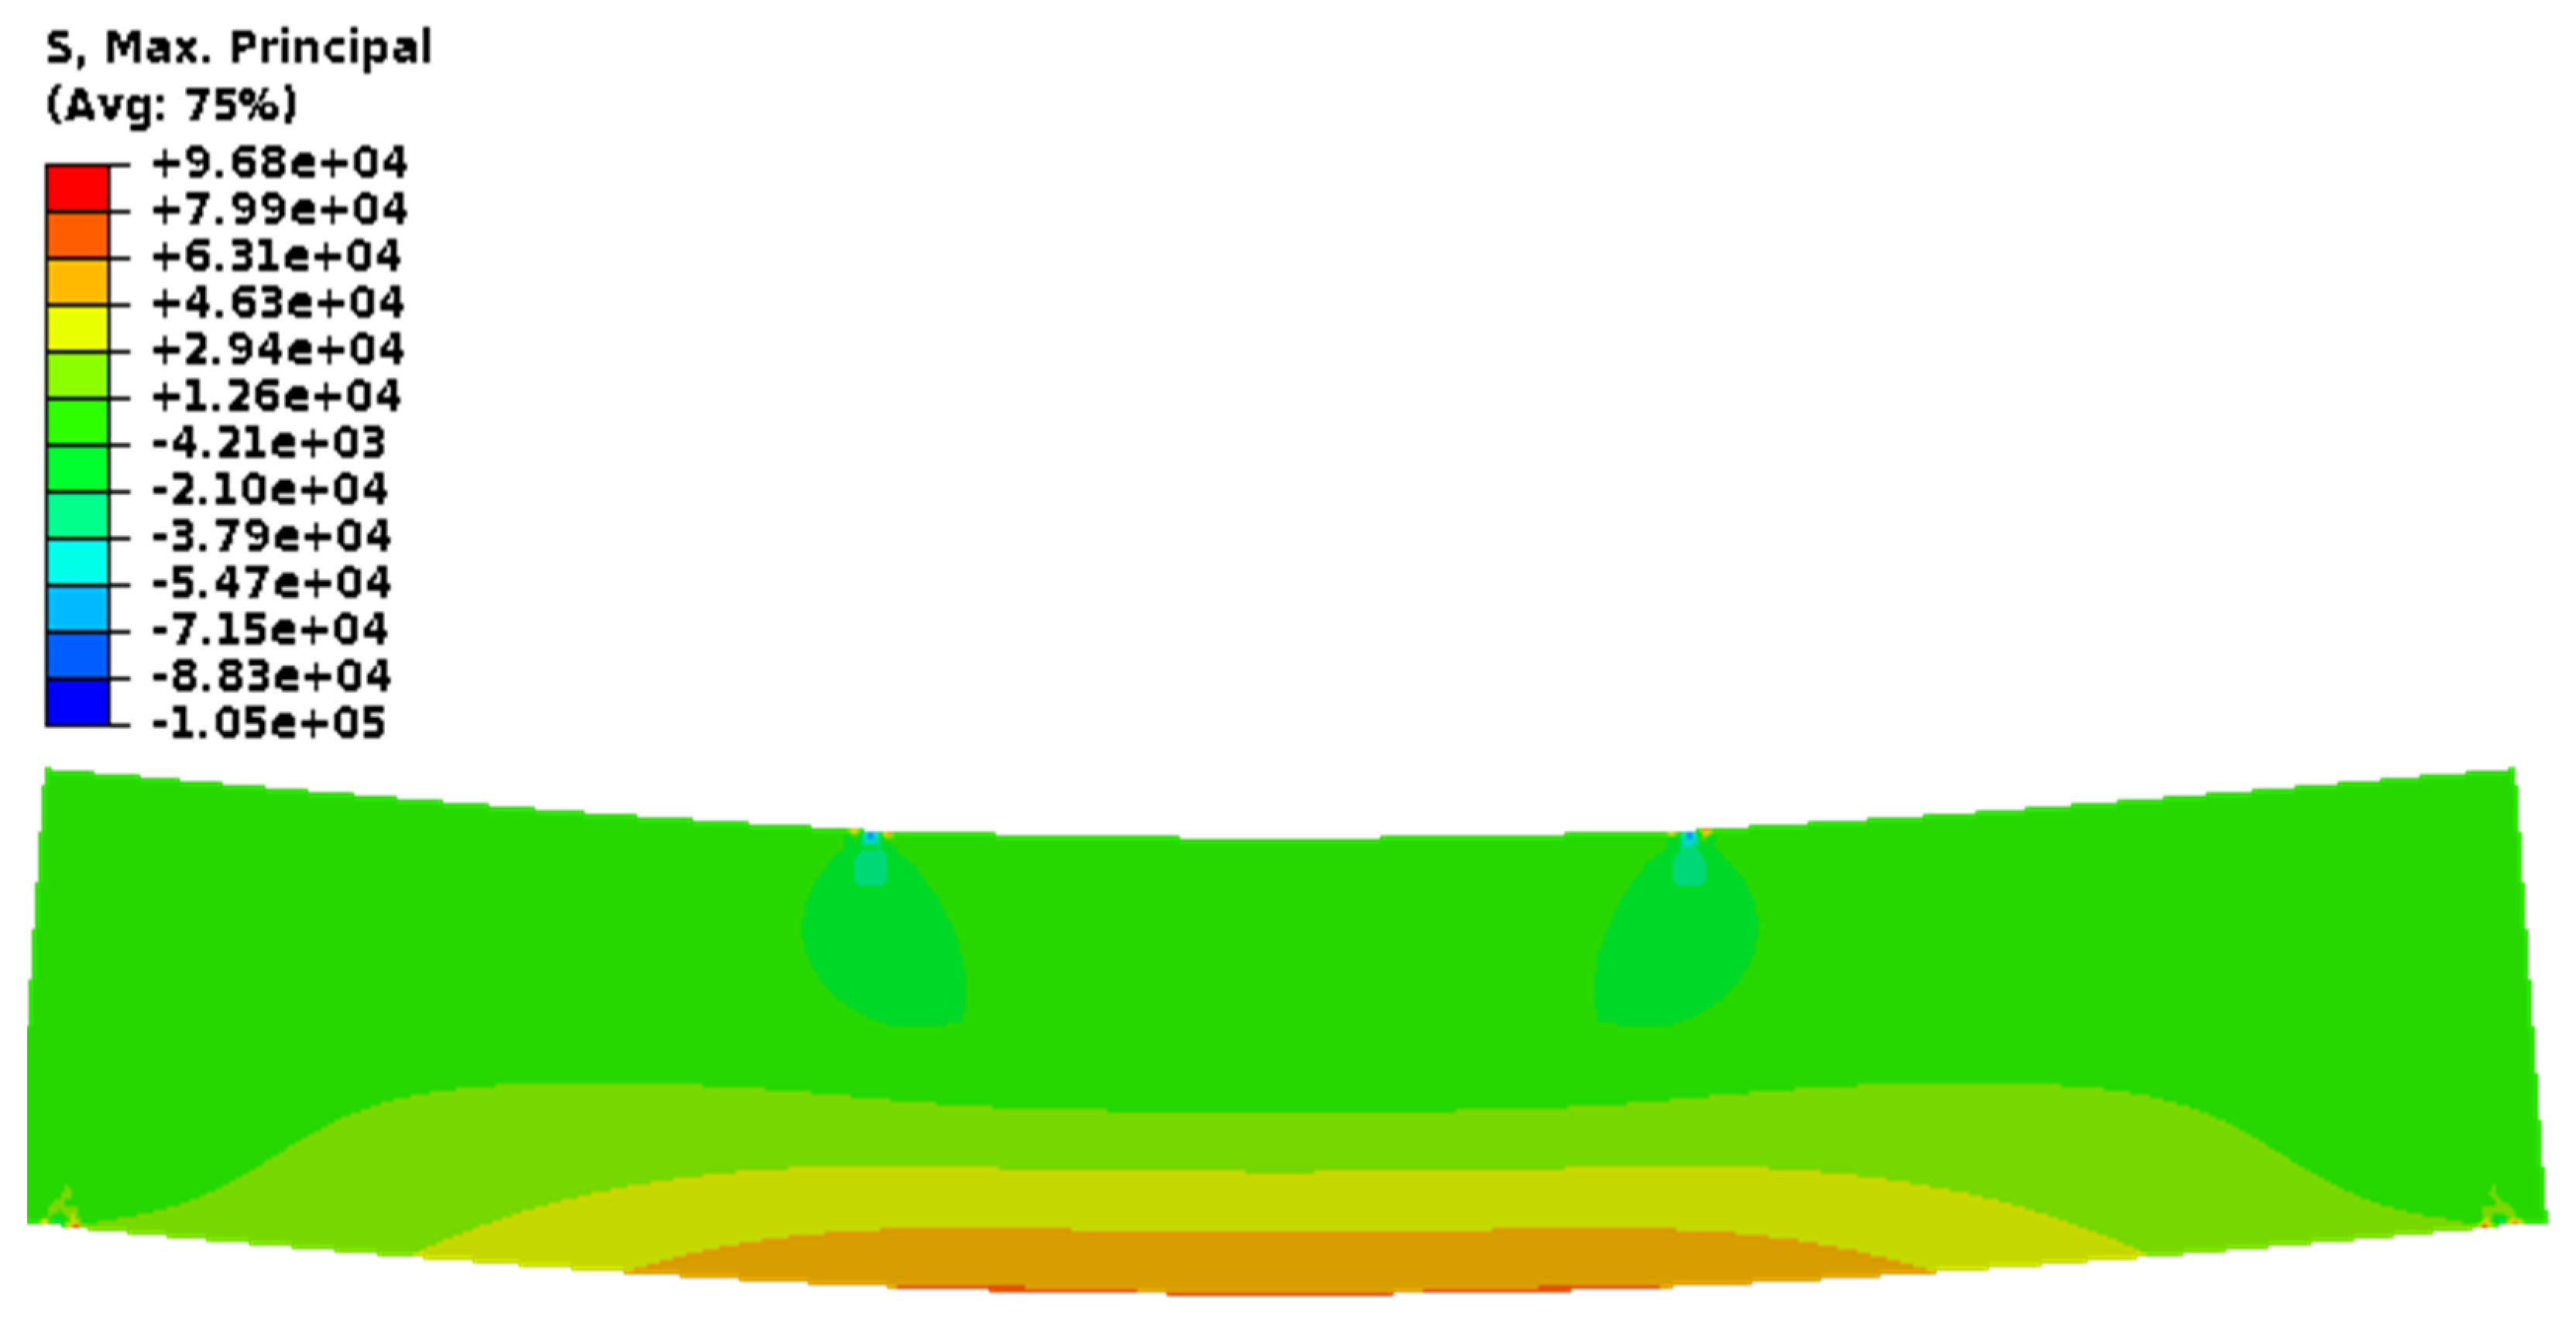
4.2. Problem 2: Four-Point Bending of a Simply Supported Beam

The dimensions and material of the model used for Problem 2 are identical to the concrete beam used in Problem 1. For this problem, the concrete beam was a simply supported beam with two equal forces applied equidistant from the supports, as shown in Figure 8 [45,46].
The maximum-flow/minimum-cut algorithm was executed in seven scenarios. The source node in each scenario was chosen to be a vertex where the force is applied while the sink node in each scenario was chosen to be a point in an area where a stress transition was visually identified. The sink nodes were selected by looking at the maximum principal stresses, shown in Figure 9. Seven sink nodes were selected. The mathematical algorithm was executed seven times using this source–sink combination. The results were superimposed as the material is in the linear elastic regime.
Figure 10 shows the superimposed result obtained by running the maximum-flow/minimum-cut algorithm. The minimum cut clearly identified the shear patterns on the left and right corners, and flexure patterns in the center are highlighted by the white lines in Figure 10. These shear and flexure patterns govern the phenomena of the failure mechanism in this classical problem. The network flow strategy identified these patterns at the onset of loading when the material was still in the linear elastic regime.

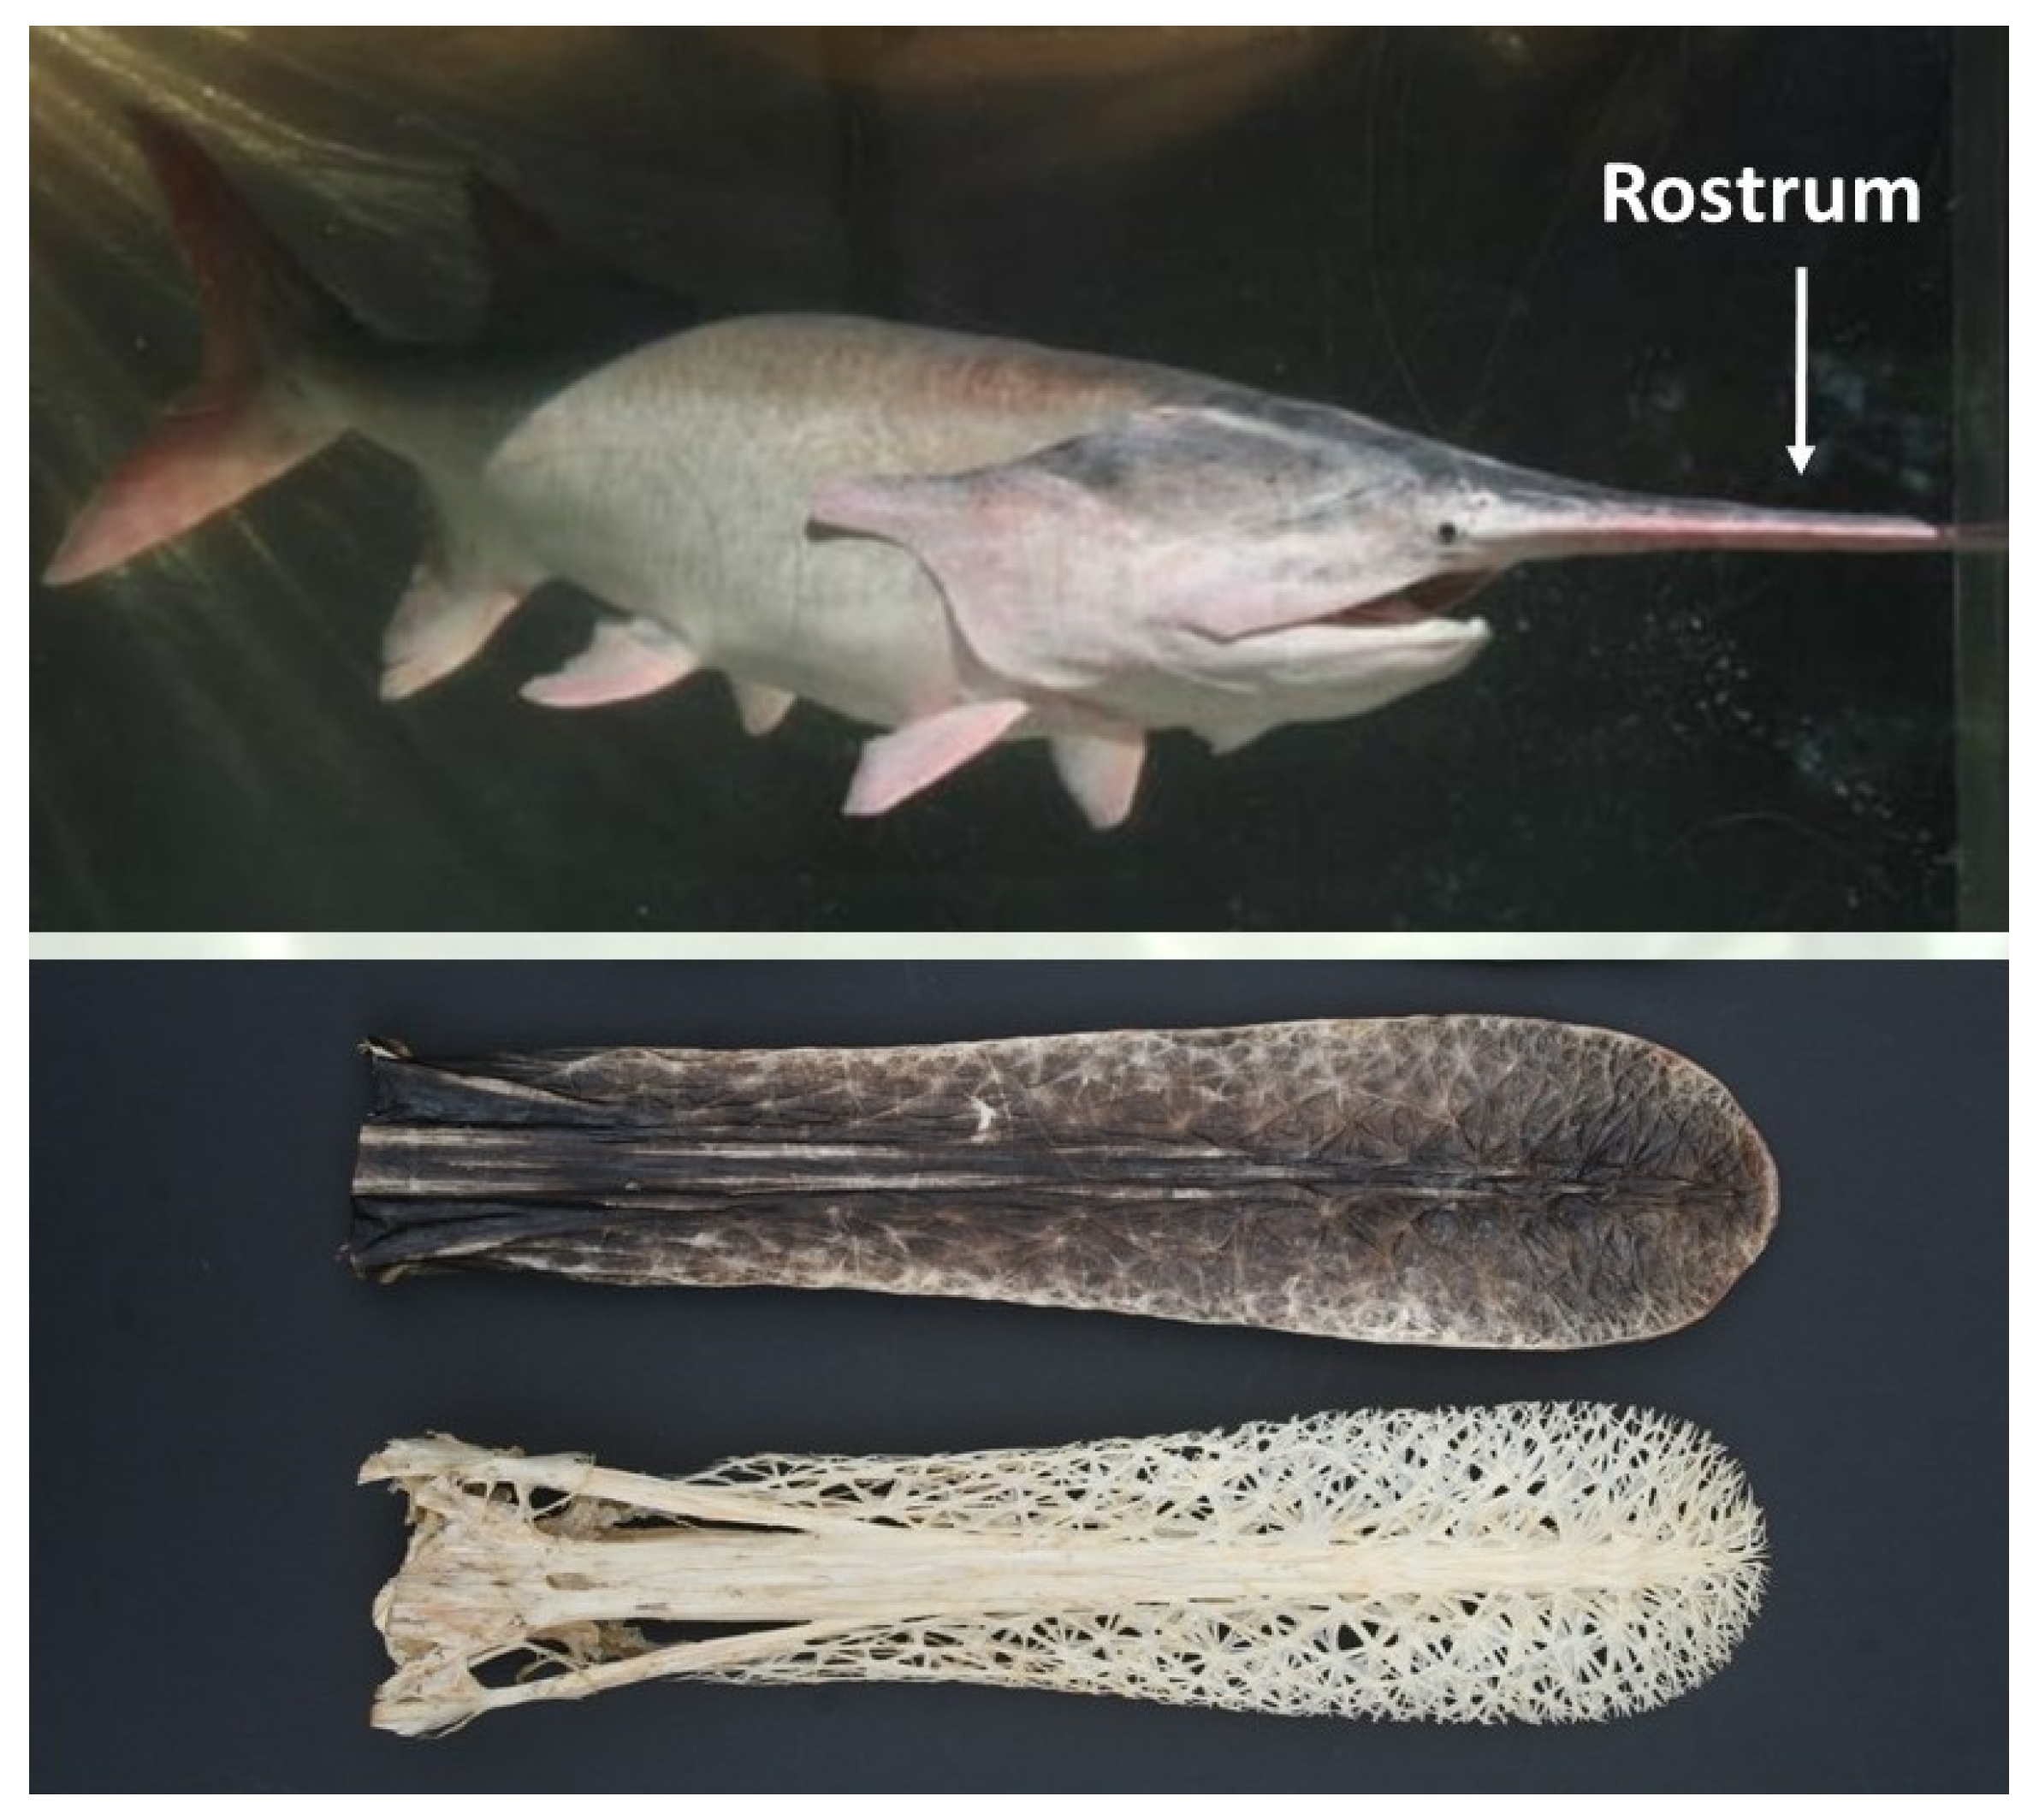
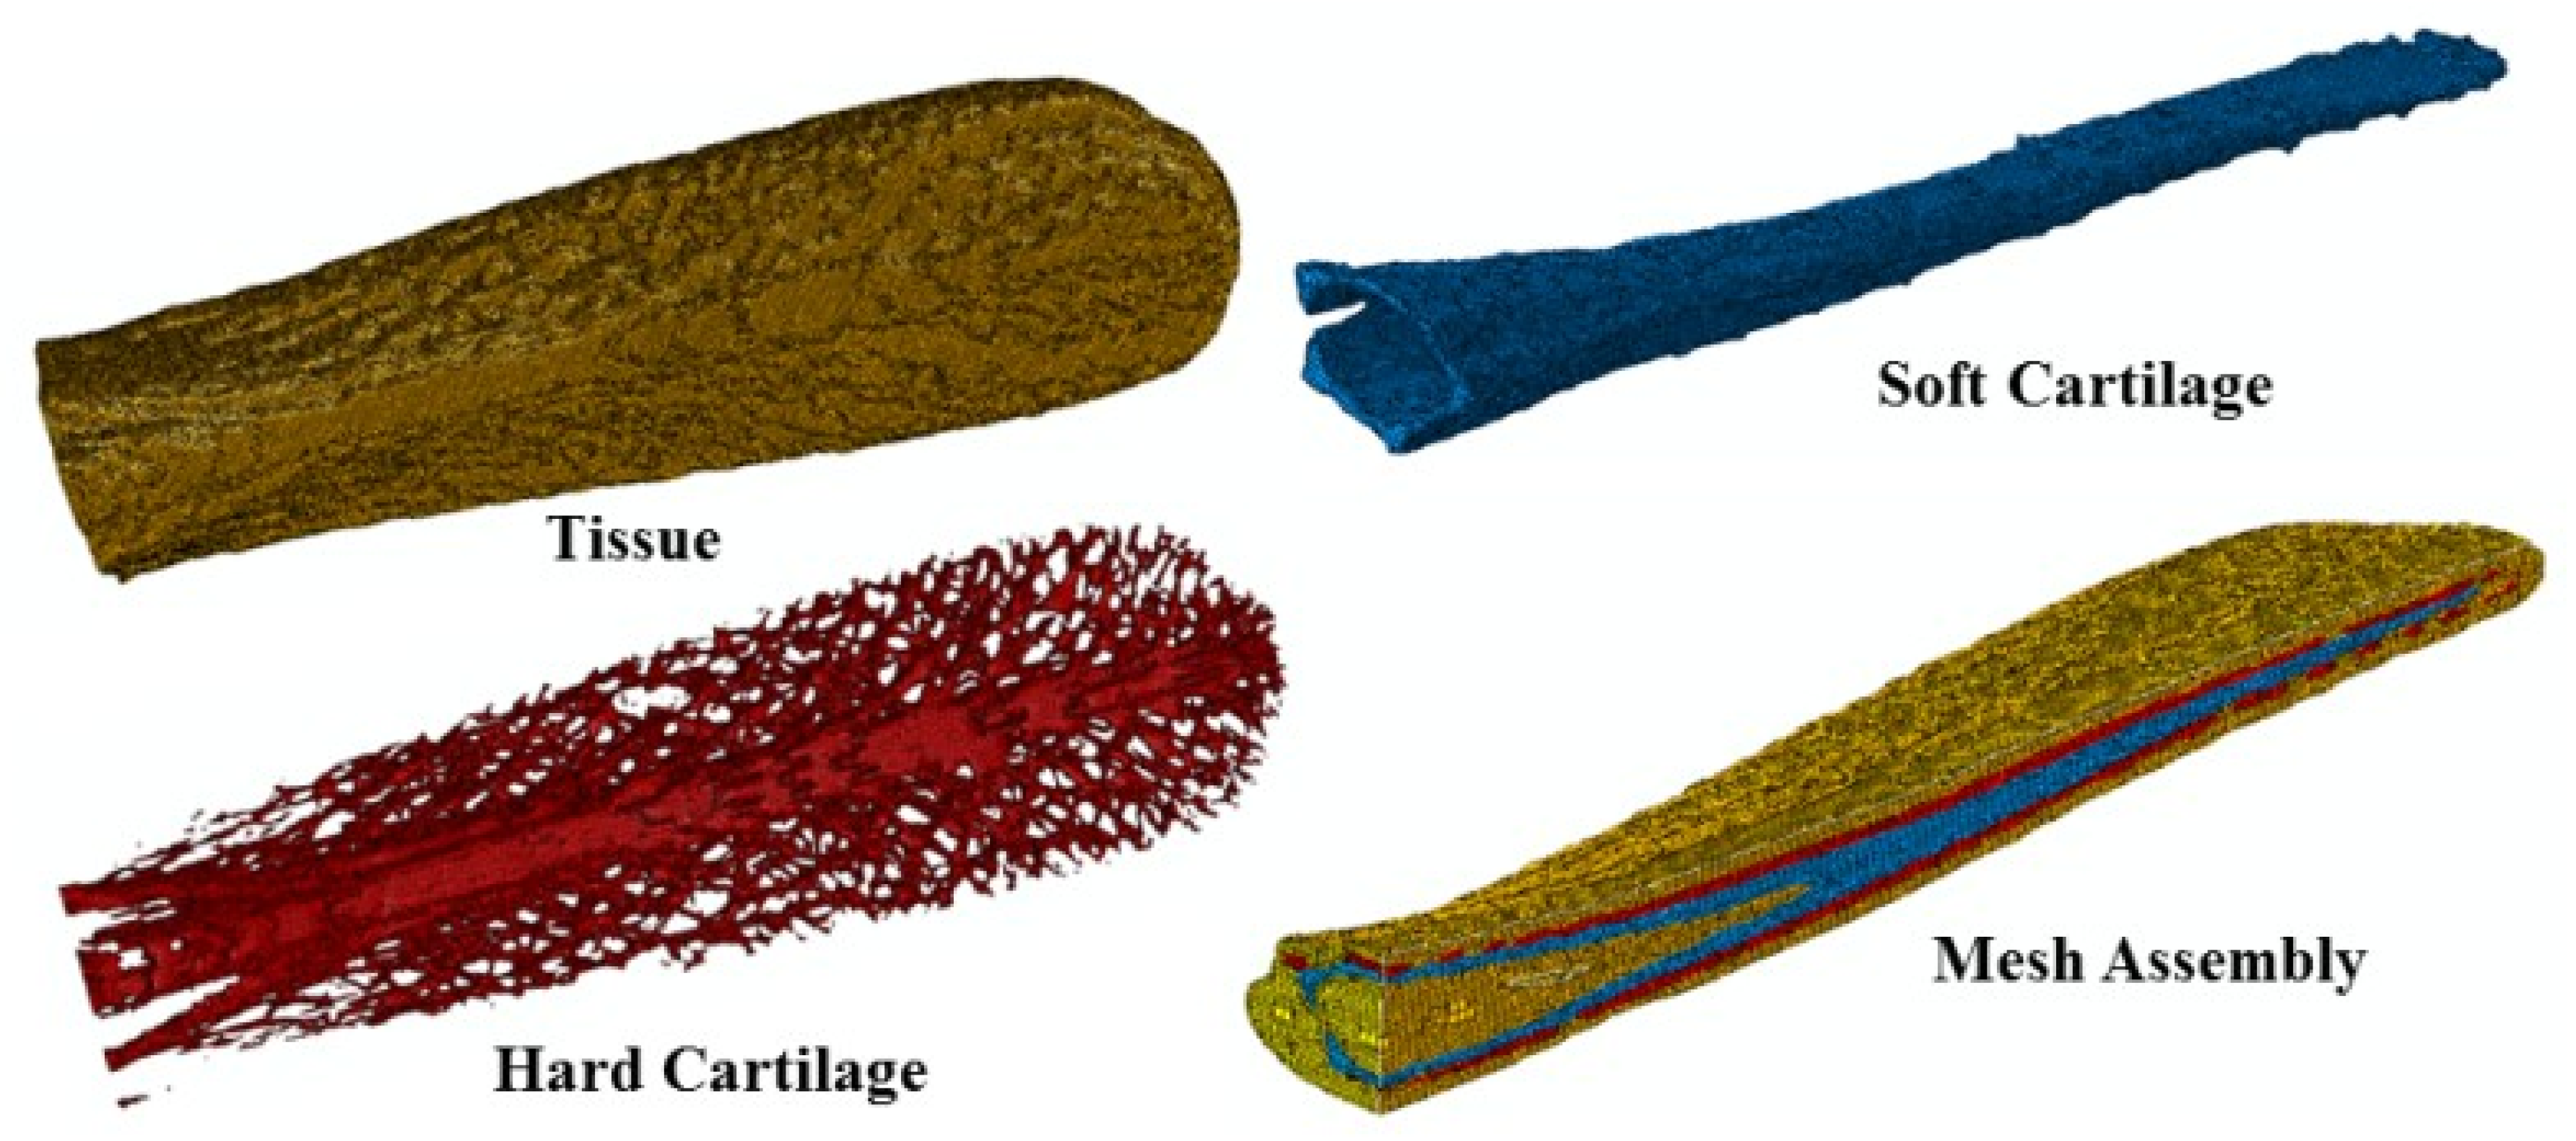
5. Computational Mechanics Experiments on the Rostrum

Computational mechanics experiments were carried out on the rostrum of the paddlefish. Simulations were performed in the U.S. Army Engineer Research and Development Centers High Performance Computing facilities located in Vicksburg, MS. The computational model was generated from the tomography (CT scan) of the paddlefish rostrum. The grey tones of the scanned image of the rostrum helped identify the three parts of the rostrum (tissue, hard cartilage, and soft cartilage). Figure 11 shows the tissue component of the rostrum. The tissue is the outermost layer of the rostrum that encompasses the hard cartilage, shown in Figure 11. The soft cartilage is located in the central portion of the rostrum. The mesh assembly cross-section shows the location of the three components of the rostrum in the actual model. The component parts of the rostrum were individually imported into commercial software Abaqus. The parts were meshed using a combination of hexahedral and tetrahedral elements. The model used in the current research comprises 119,712 hexahedral elements, 1,300,451 tetrahedral elements, 375,361 nodes, and 1,126,083 total degrees of freedom.

5.1. Material Properties

Nano-indentation experiments carried out on the rostrum revealed the material properties of the components of the rostrum [48]. The three parts of the rostrum, as shown in Figure 11, have considerably different material properties [49]. Taking this into consideration, a similar variation in material properties was maintained when selecting the materials for finite element analysis. Table 1 shows the three commercially available materials selected to represent the rostrum components shown in Figure 11.

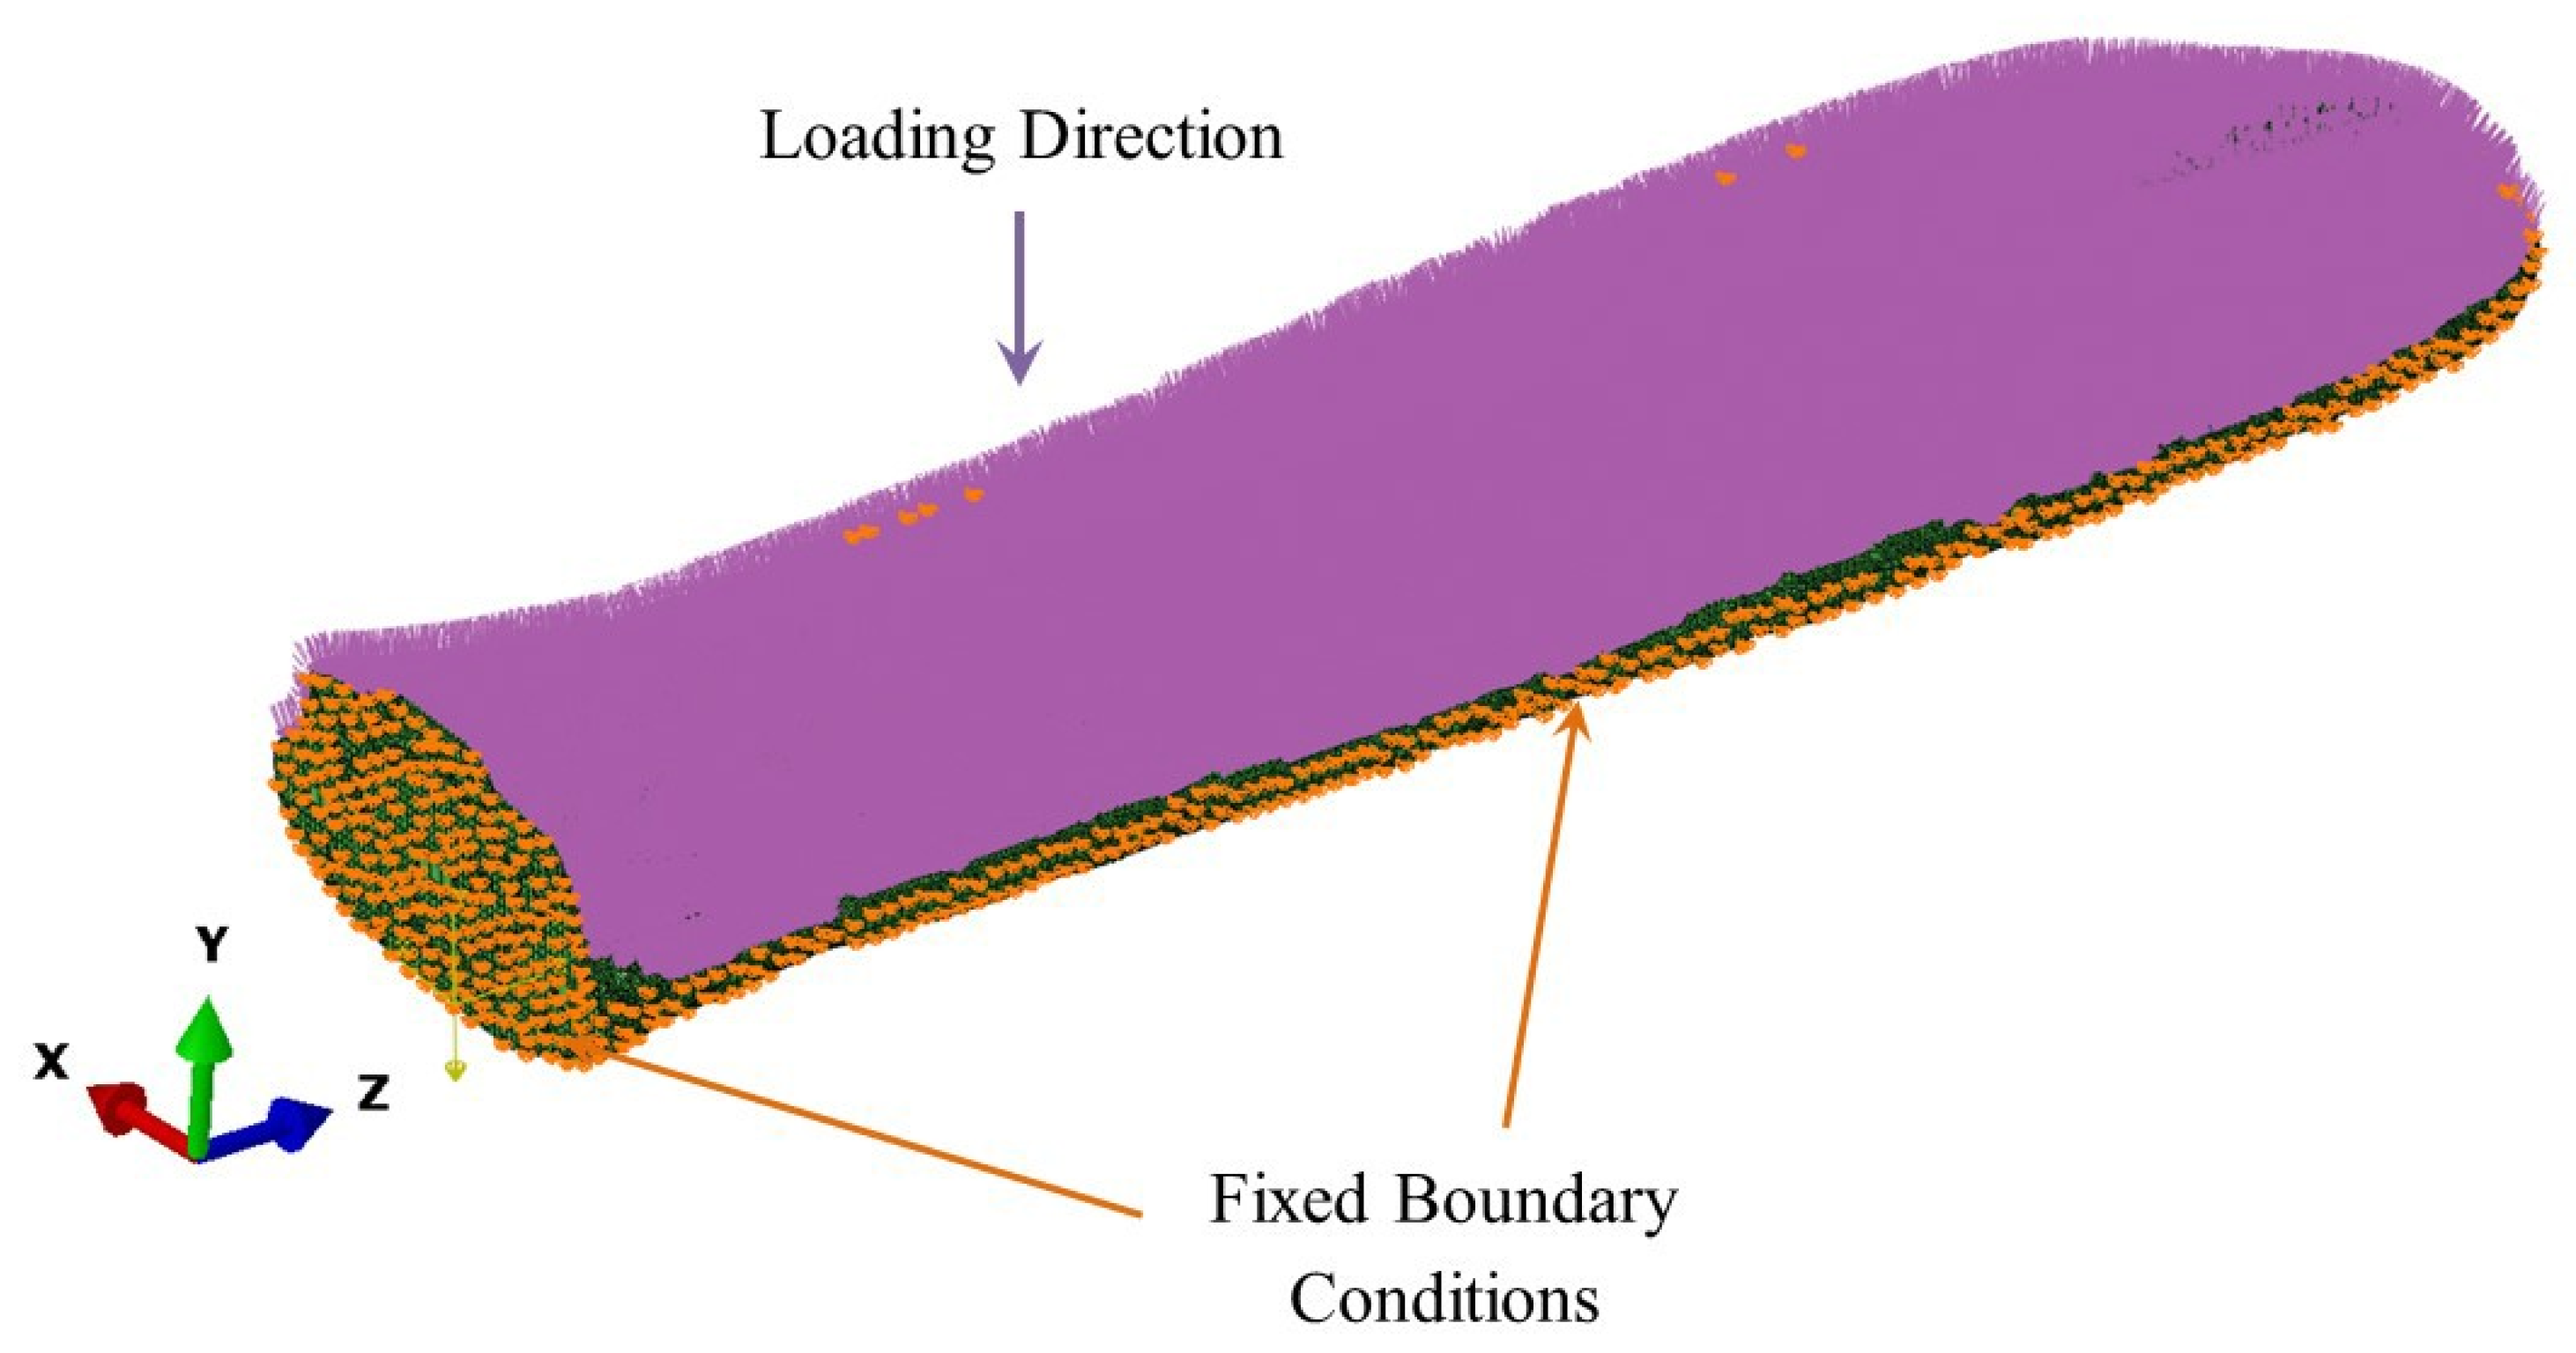
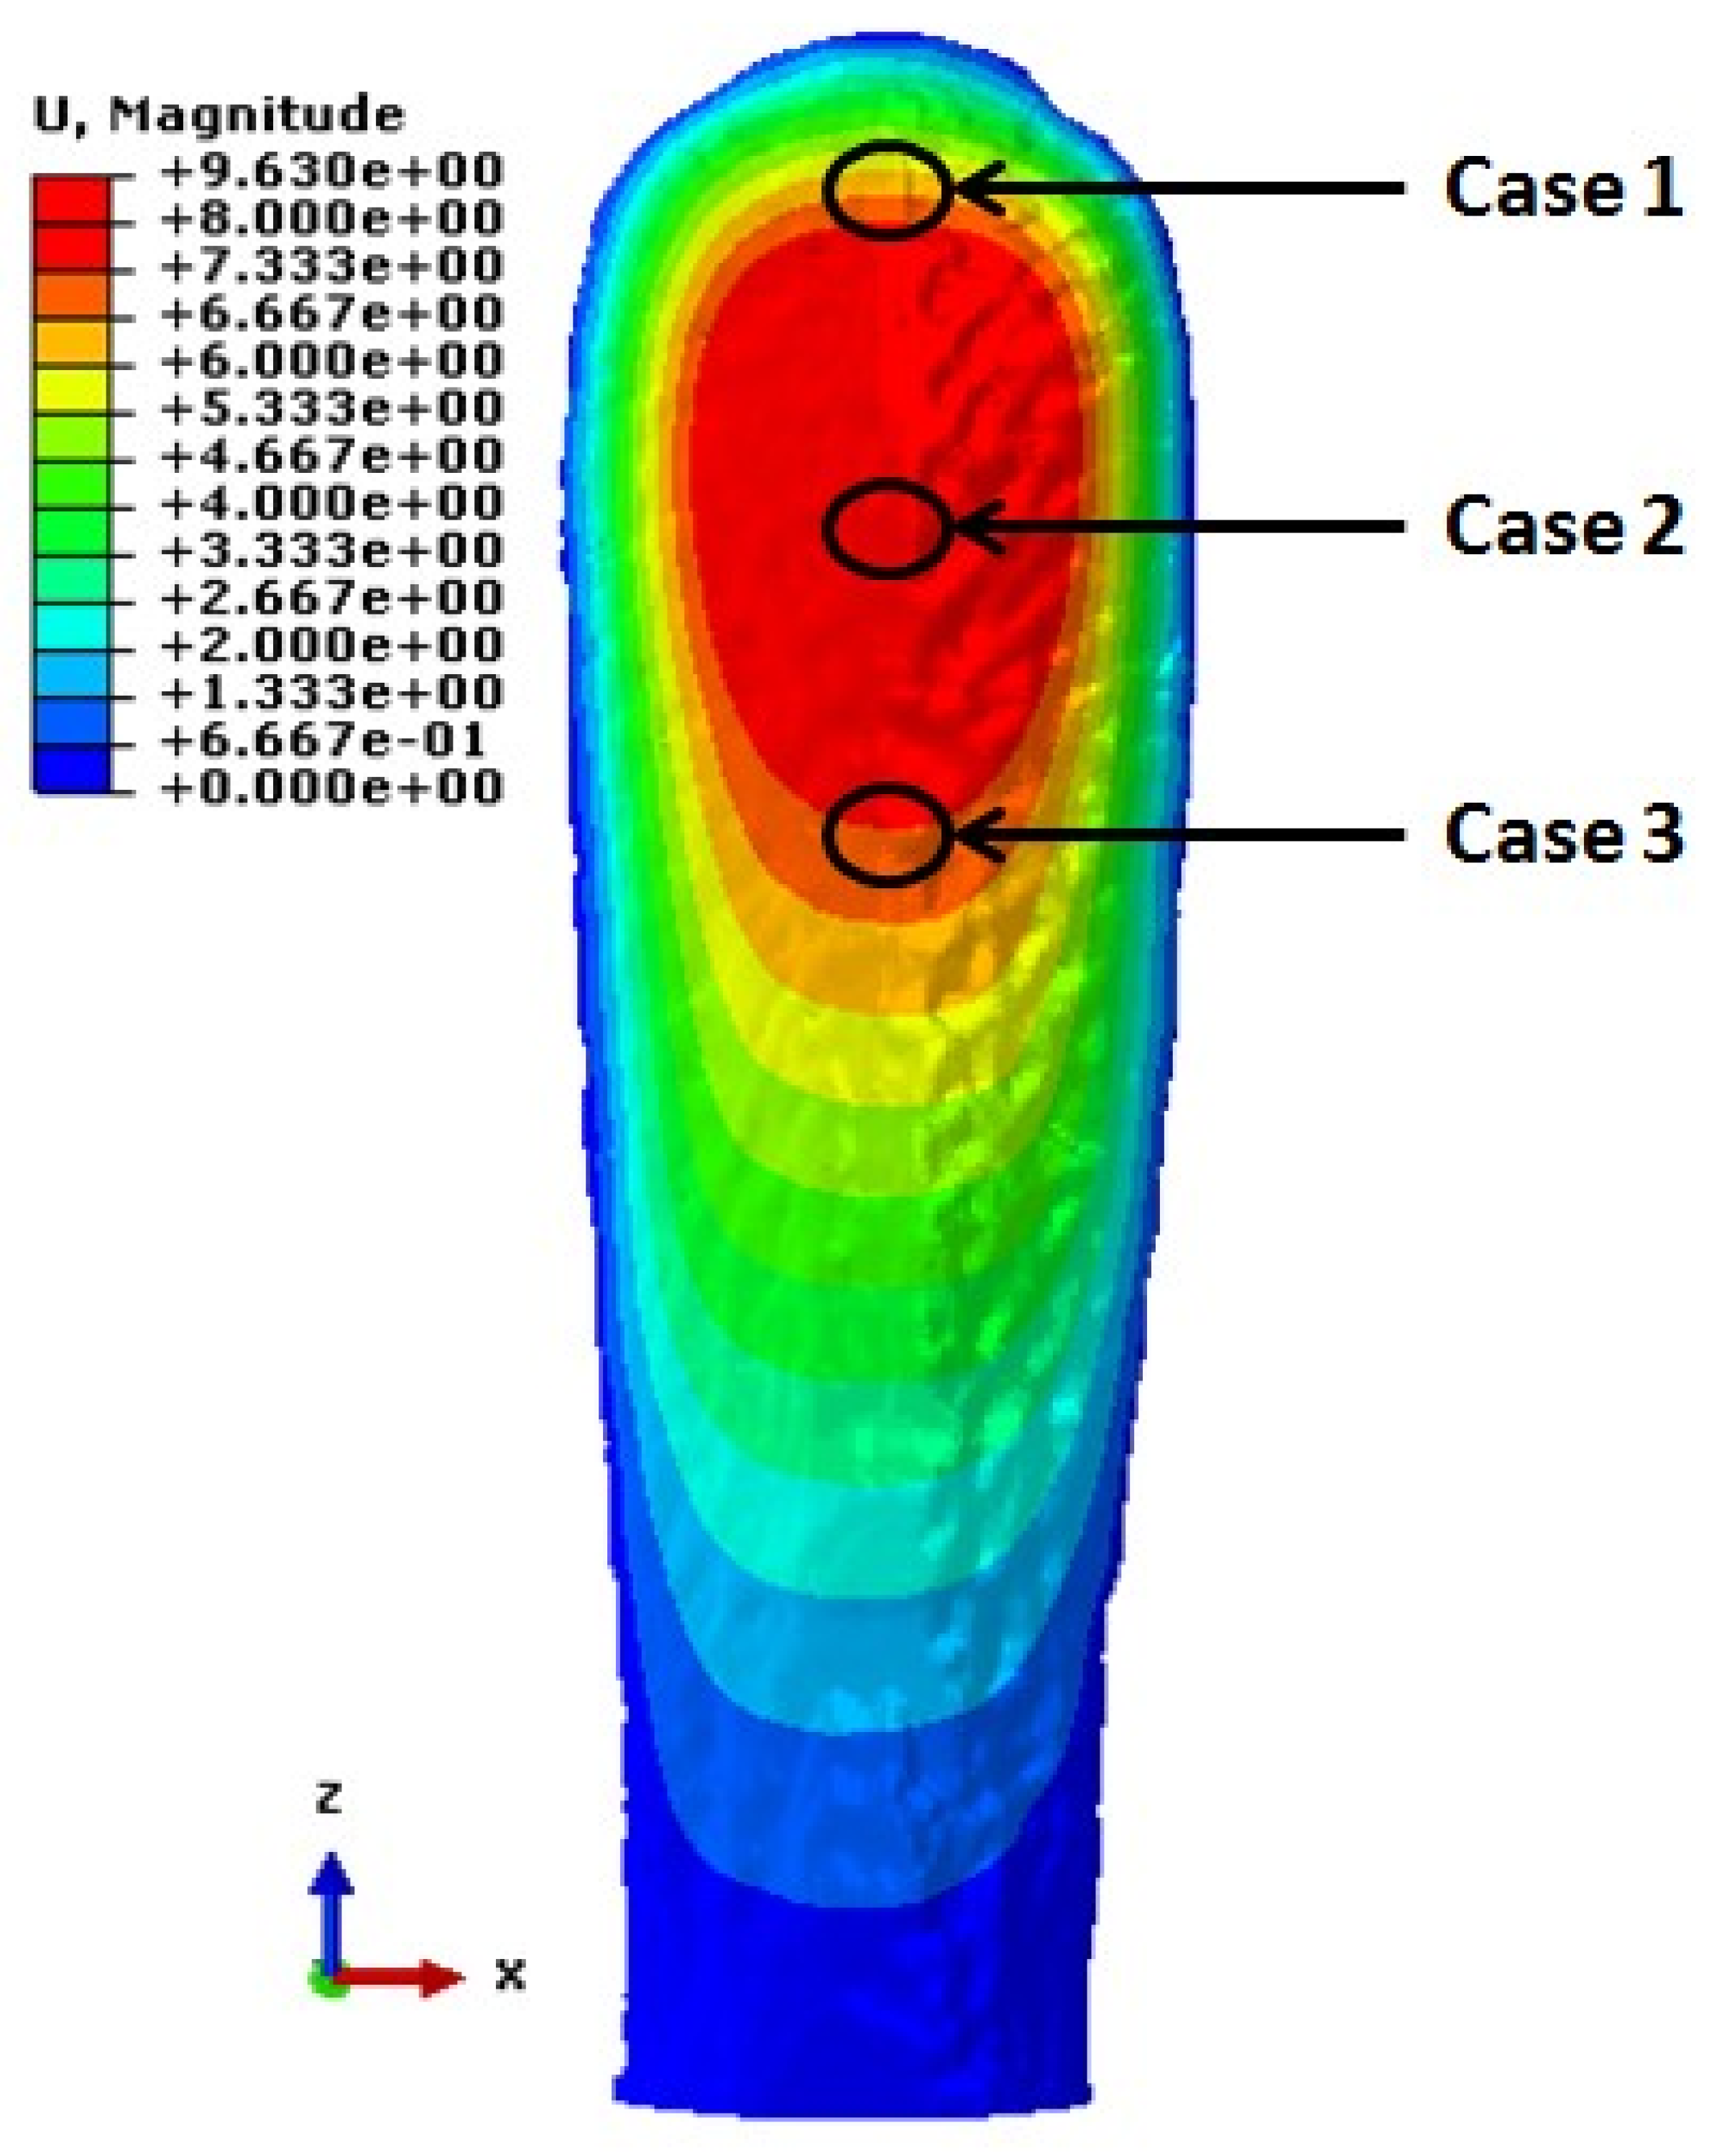
5.2. Force and Displacement Boundary Conditions
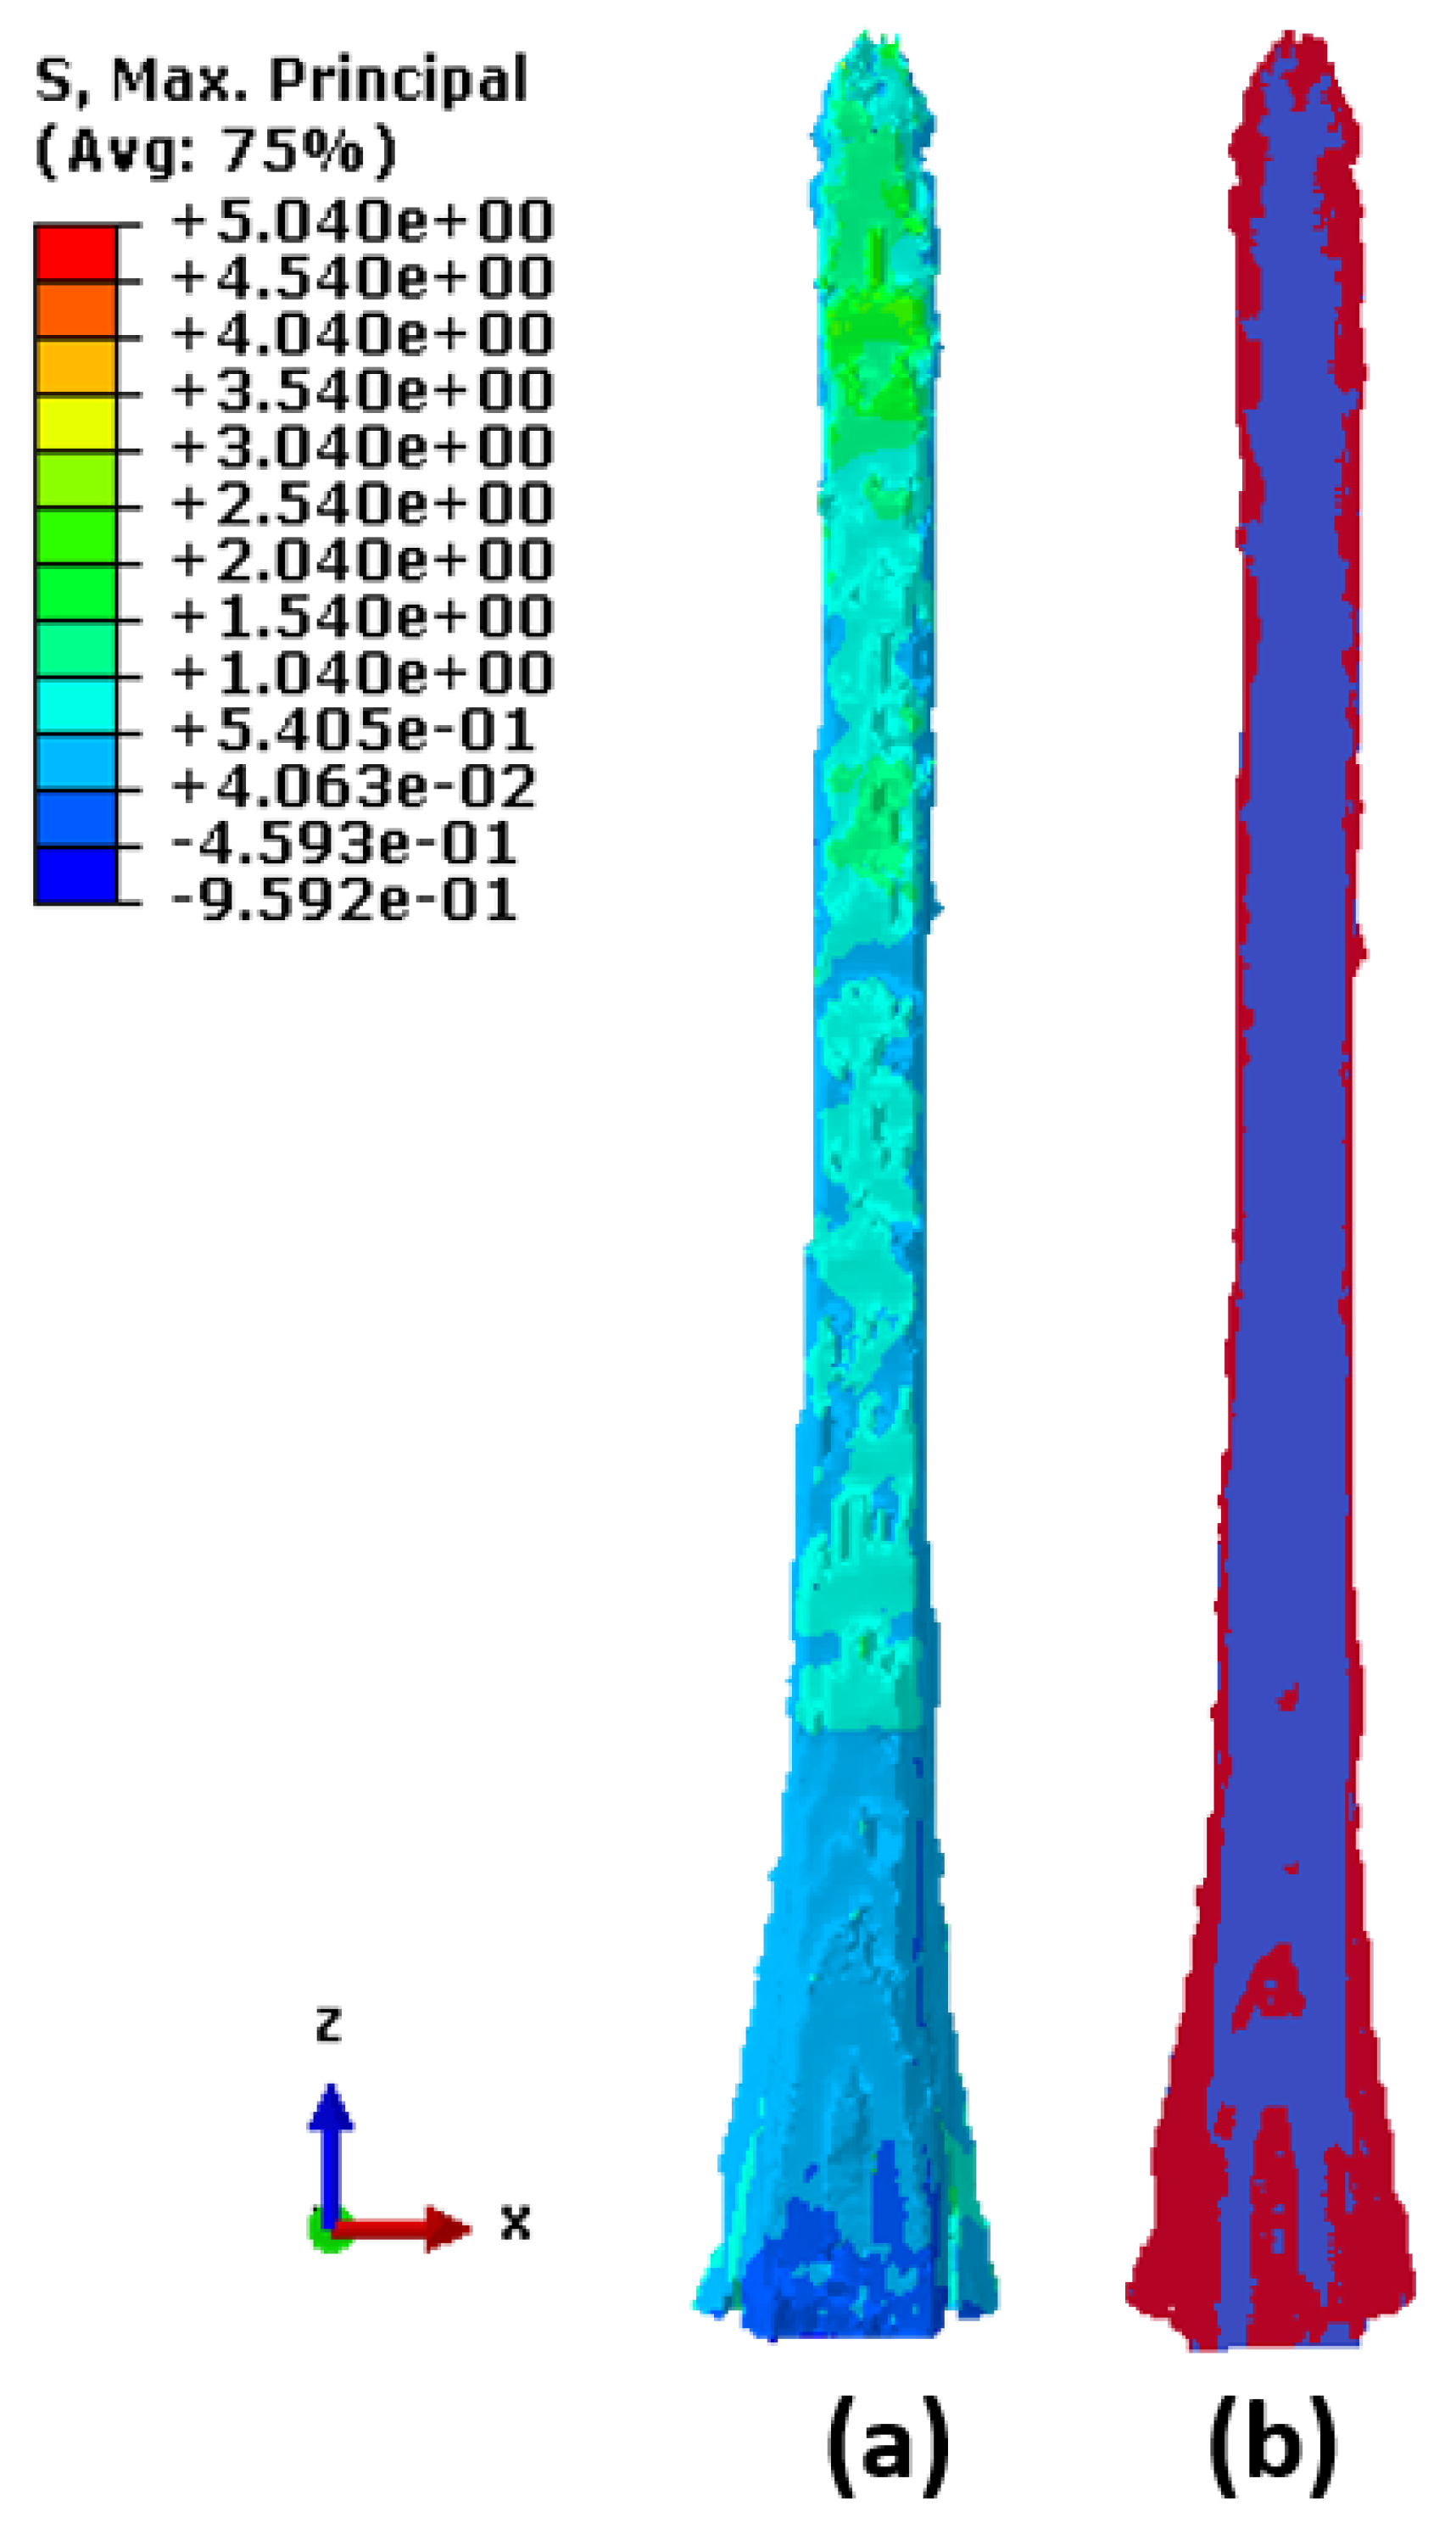
A uniform pressure was applied on the top surface of the rostrum, displayed in purple shading in Figure 12. A fixed-plate boundary condition was implemented on the rostrum by restraining the three components of displacement. A uniform pressure of 50 MPa was applied in the loading direction, shown in Figure 12. Pressure was applied perpendicular to each element face on the top surface of the rostrum, displayed in purple shading in Figure 12, thereby following the surface contour.

6. Results

Although computational-mechanics experiments provide the overall distribution of stresses in the structural system, information about stress-flow patterns formed at nascent stages of loading is missing. Identification of the stress-flow patterns in the linear elastic regime may lead to novel insight into failure mechanisms through identification of the location of stress concentration areas developed due to change in geometry and material properties. To obtain these stress patterns, the rostrum is formulated as a network flow model by utilizing node and connectivity information from the computational-mechanics model. The network is weighted based on the Von Mises stresses obtained from the output database file produced from the computational-mechanics experiments on the rostrum. The maximum-flow/minimum-cut algorithm described in Reference [39] was used to identify the stress-flow patterns when the rostrum is subjected to a uniform pressure load. A seamless, platform-independent interface was developed to formulate the rostrum as a network flow problem and compute the maximum flow/minimum cut of the network.
Source and sink nodes were identified and provided as input to the maximum-flow/minimum-cut algorithm. For the rostrum, these nodes were selected based on the displacement contours shown in Figure 13. The source and sink nodes were identified at the edges and center of the maximum displacement area on the top and bottom surfaces of the rostrum, represented by red coloring in Figure 13. As verified earlier in Problem 2, the mathematical algorithm was executed three times using the source/sink combination shown in Figure 13. The results were superimposed, as the material was in the linear elastic regime. Reversing the selection of source and sink nodes on the top and bottom surfaces does not change the result obtained using the maximum-flow/minimum-cut algorithm.

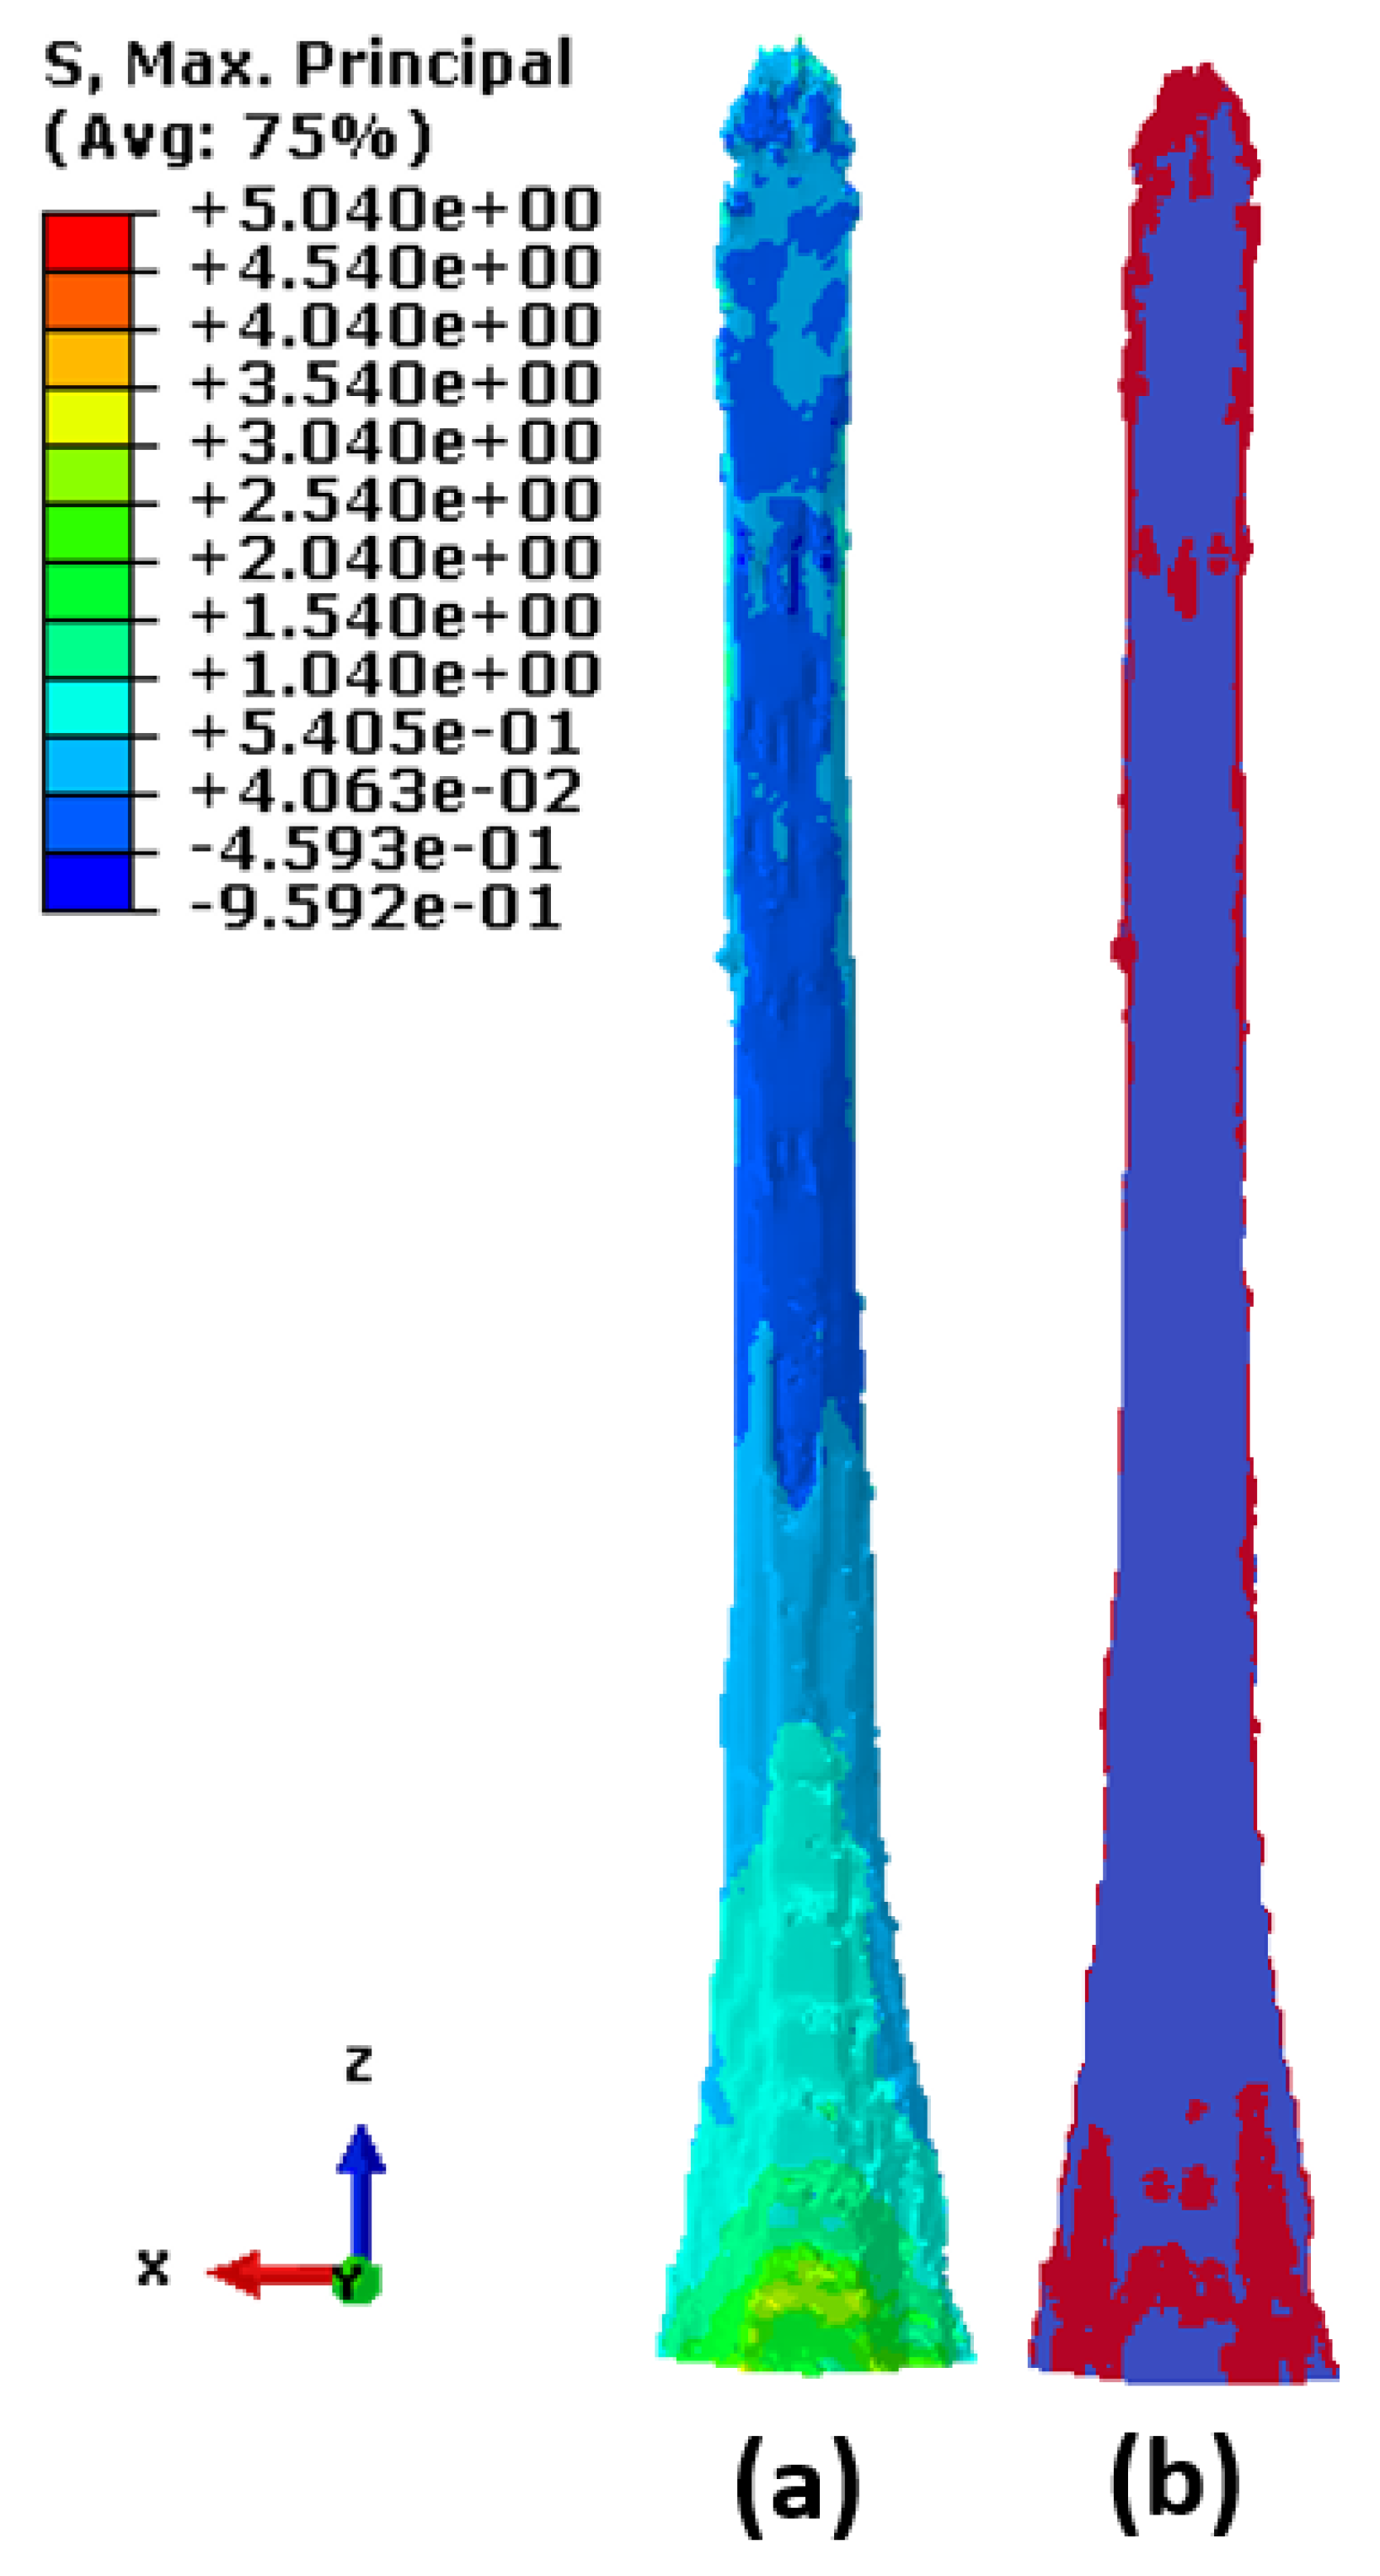
6.1. Flow Network Analysis on Soft Cartilage of the Rostrum

Figure 14a shows the maximum principal stresses on the bottom surface of the soft-cartilage part of the rostrum. Although stresses progressively increased in the early stages of loading, they were evenly distributed across the entire bottom surface, thereby providing no insight into the phenomena of the failure mechanism. In contrast, Figure 14b displays the output obtained by executing the maximum-flow/minimum-cut algorithm using the source/sink combination, shown earlier in Figure 9, and superimposing the results as validated in Problem 2. The minimum cut embodies a set of vertices that inhibit the transmission of information, i.e., stresses in the current analysis. The minimum cut on the bottom surface of the soft cartilage is along the edges where there is a change in material properties. The failure initiates at this position owing to change in geometry and material properties. The red regions at the tip and base of the bottom surface are also located at the areas where material properties change. The maximum-flow/minimum-cut algorithm detected the failure sites at nascent stages of loading.
Figure 15a shows the maximum principal stresses on the top surface of the soft-cartilage part of the rostrum. As observed earlier in Figure 14a, finite element analysis shows stresses progressively increasing as the external load increases, as expected. On the other hand, Figure 15b shows the minimum cut obtained by running the maximum-flow/minimum-cut algorithm. The interface between the red and blue nodes is the location of the failure site. The failure for the top surface of the rostrum initiates along the edges where there is a change in the material properties. The red region at the base of the top surface falls in areas where there is contact between components with varying material properties. Hence, the flow network strategy successfully identified the local regions where failure mechanisms were expected to initiate.

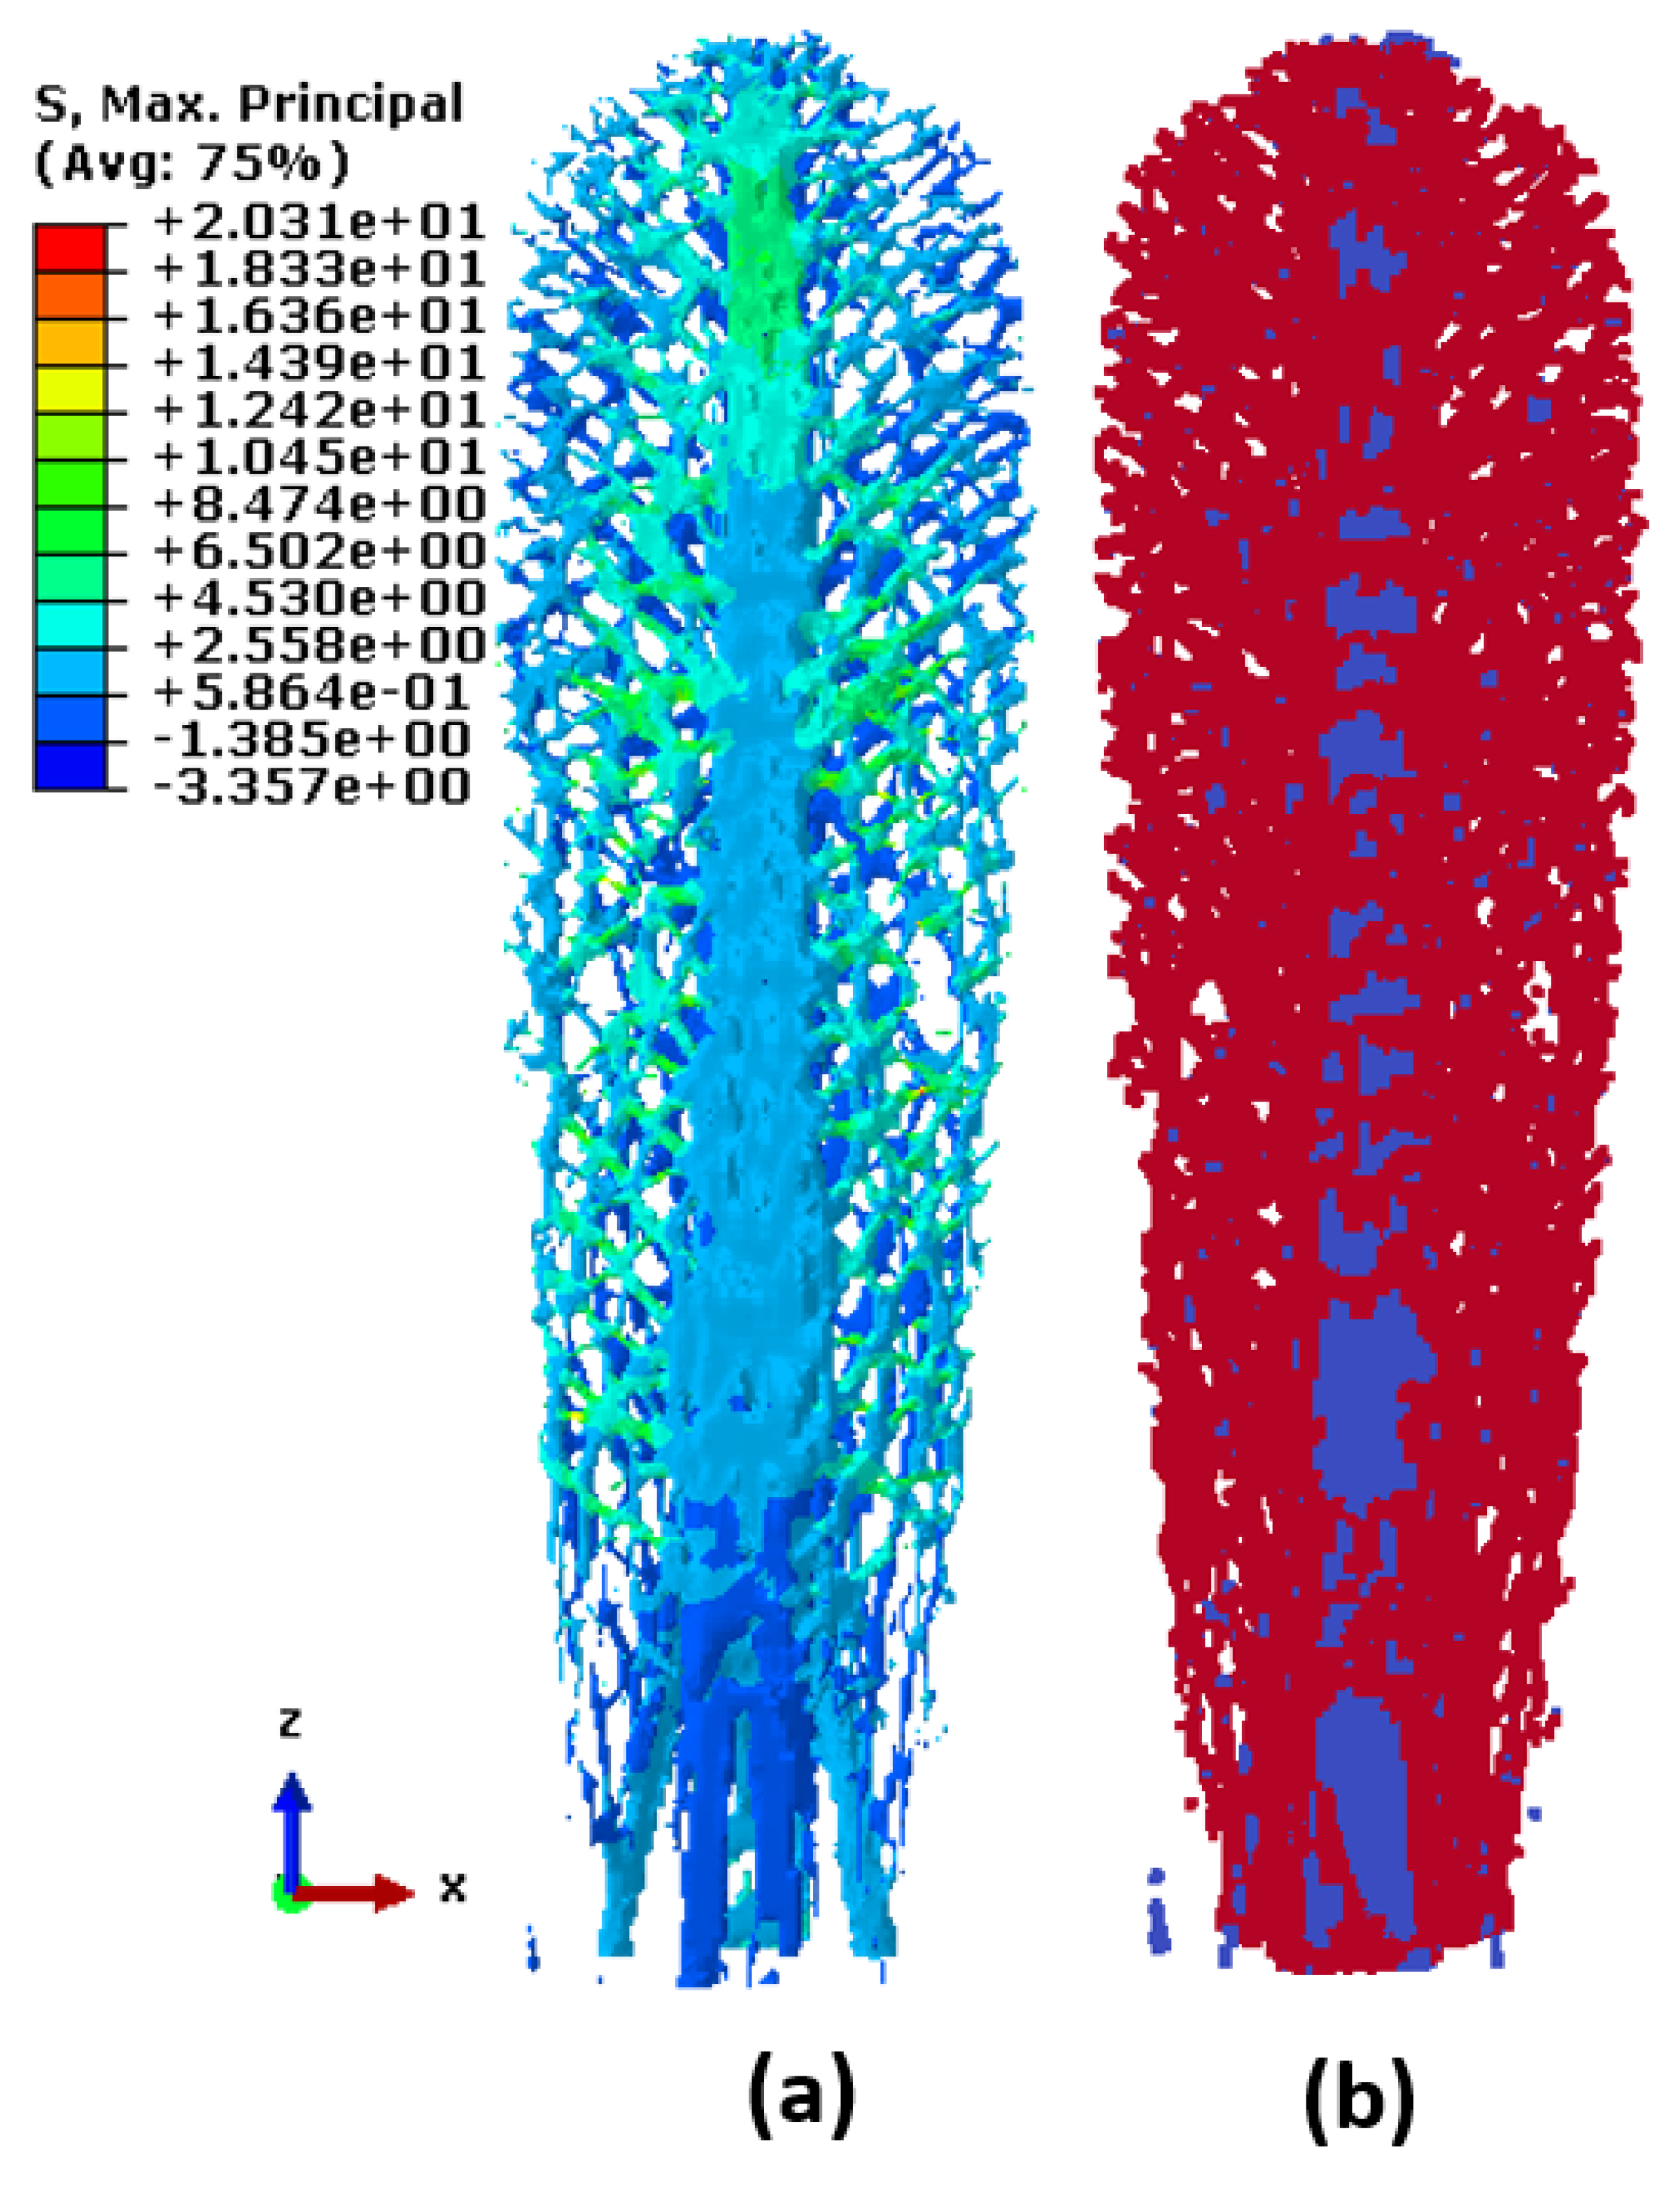
6.2. Flow Network Analysis on Hard Cartilage of Rostrum

Figure 16a shows the maximum principal stresses on the bottom surface of the hard-cartilage part of the rostrum. Overall stresses progressively increased with the increase in external loading, as expected. Figure 16b displays the minimum cut obtained from the maximum-flow/minimum-cut algorithm. Nodes are colored by their respective locations on the source (red) or sink (blue) side of the minimum cut. The failure sites are located in the interface between the red and blue nodes. As seen in Figure 16b, these regions are located in the center part of the hard cartilage. Since the lattice region of the hard cartilage is not a continuous pattern, failure does not travel though the lattice region. The minimum cut picks up a region in the lattice where stress concentration is high and nodes are prone to failure. The center part of Figure 16b clearly displays strain localization, which is a typical mode of failure of a structural system under tensile loading. Hence, the research strategy implemented in the current work successfully identified the failure mechanisms at the nascent stages of loading.
Figure 17a displays the maximum principal stresses on the top surface of the hard-cartilage part of the rostrum. Although finite element analysis gives the overall distribution of stresses in the structural system, the underlying details that govern the phenomena of failure mechanism are hard to determine from the stresses. Figure 17b, on the contrary, shows the minimum cut obtained by executing the maximum-flow/minimum-cut algorithm. The central part of Figure 17b clearly highlights the crushing/buckling behavior that is typically seen in compressive failure. A major part of the failure sites in this case were also located in the region where there was a change in geometry and material properties, which is a typical region where failure initiates. Again, the current methodology successfully identified the sites of failure at the nascent stages of loading.

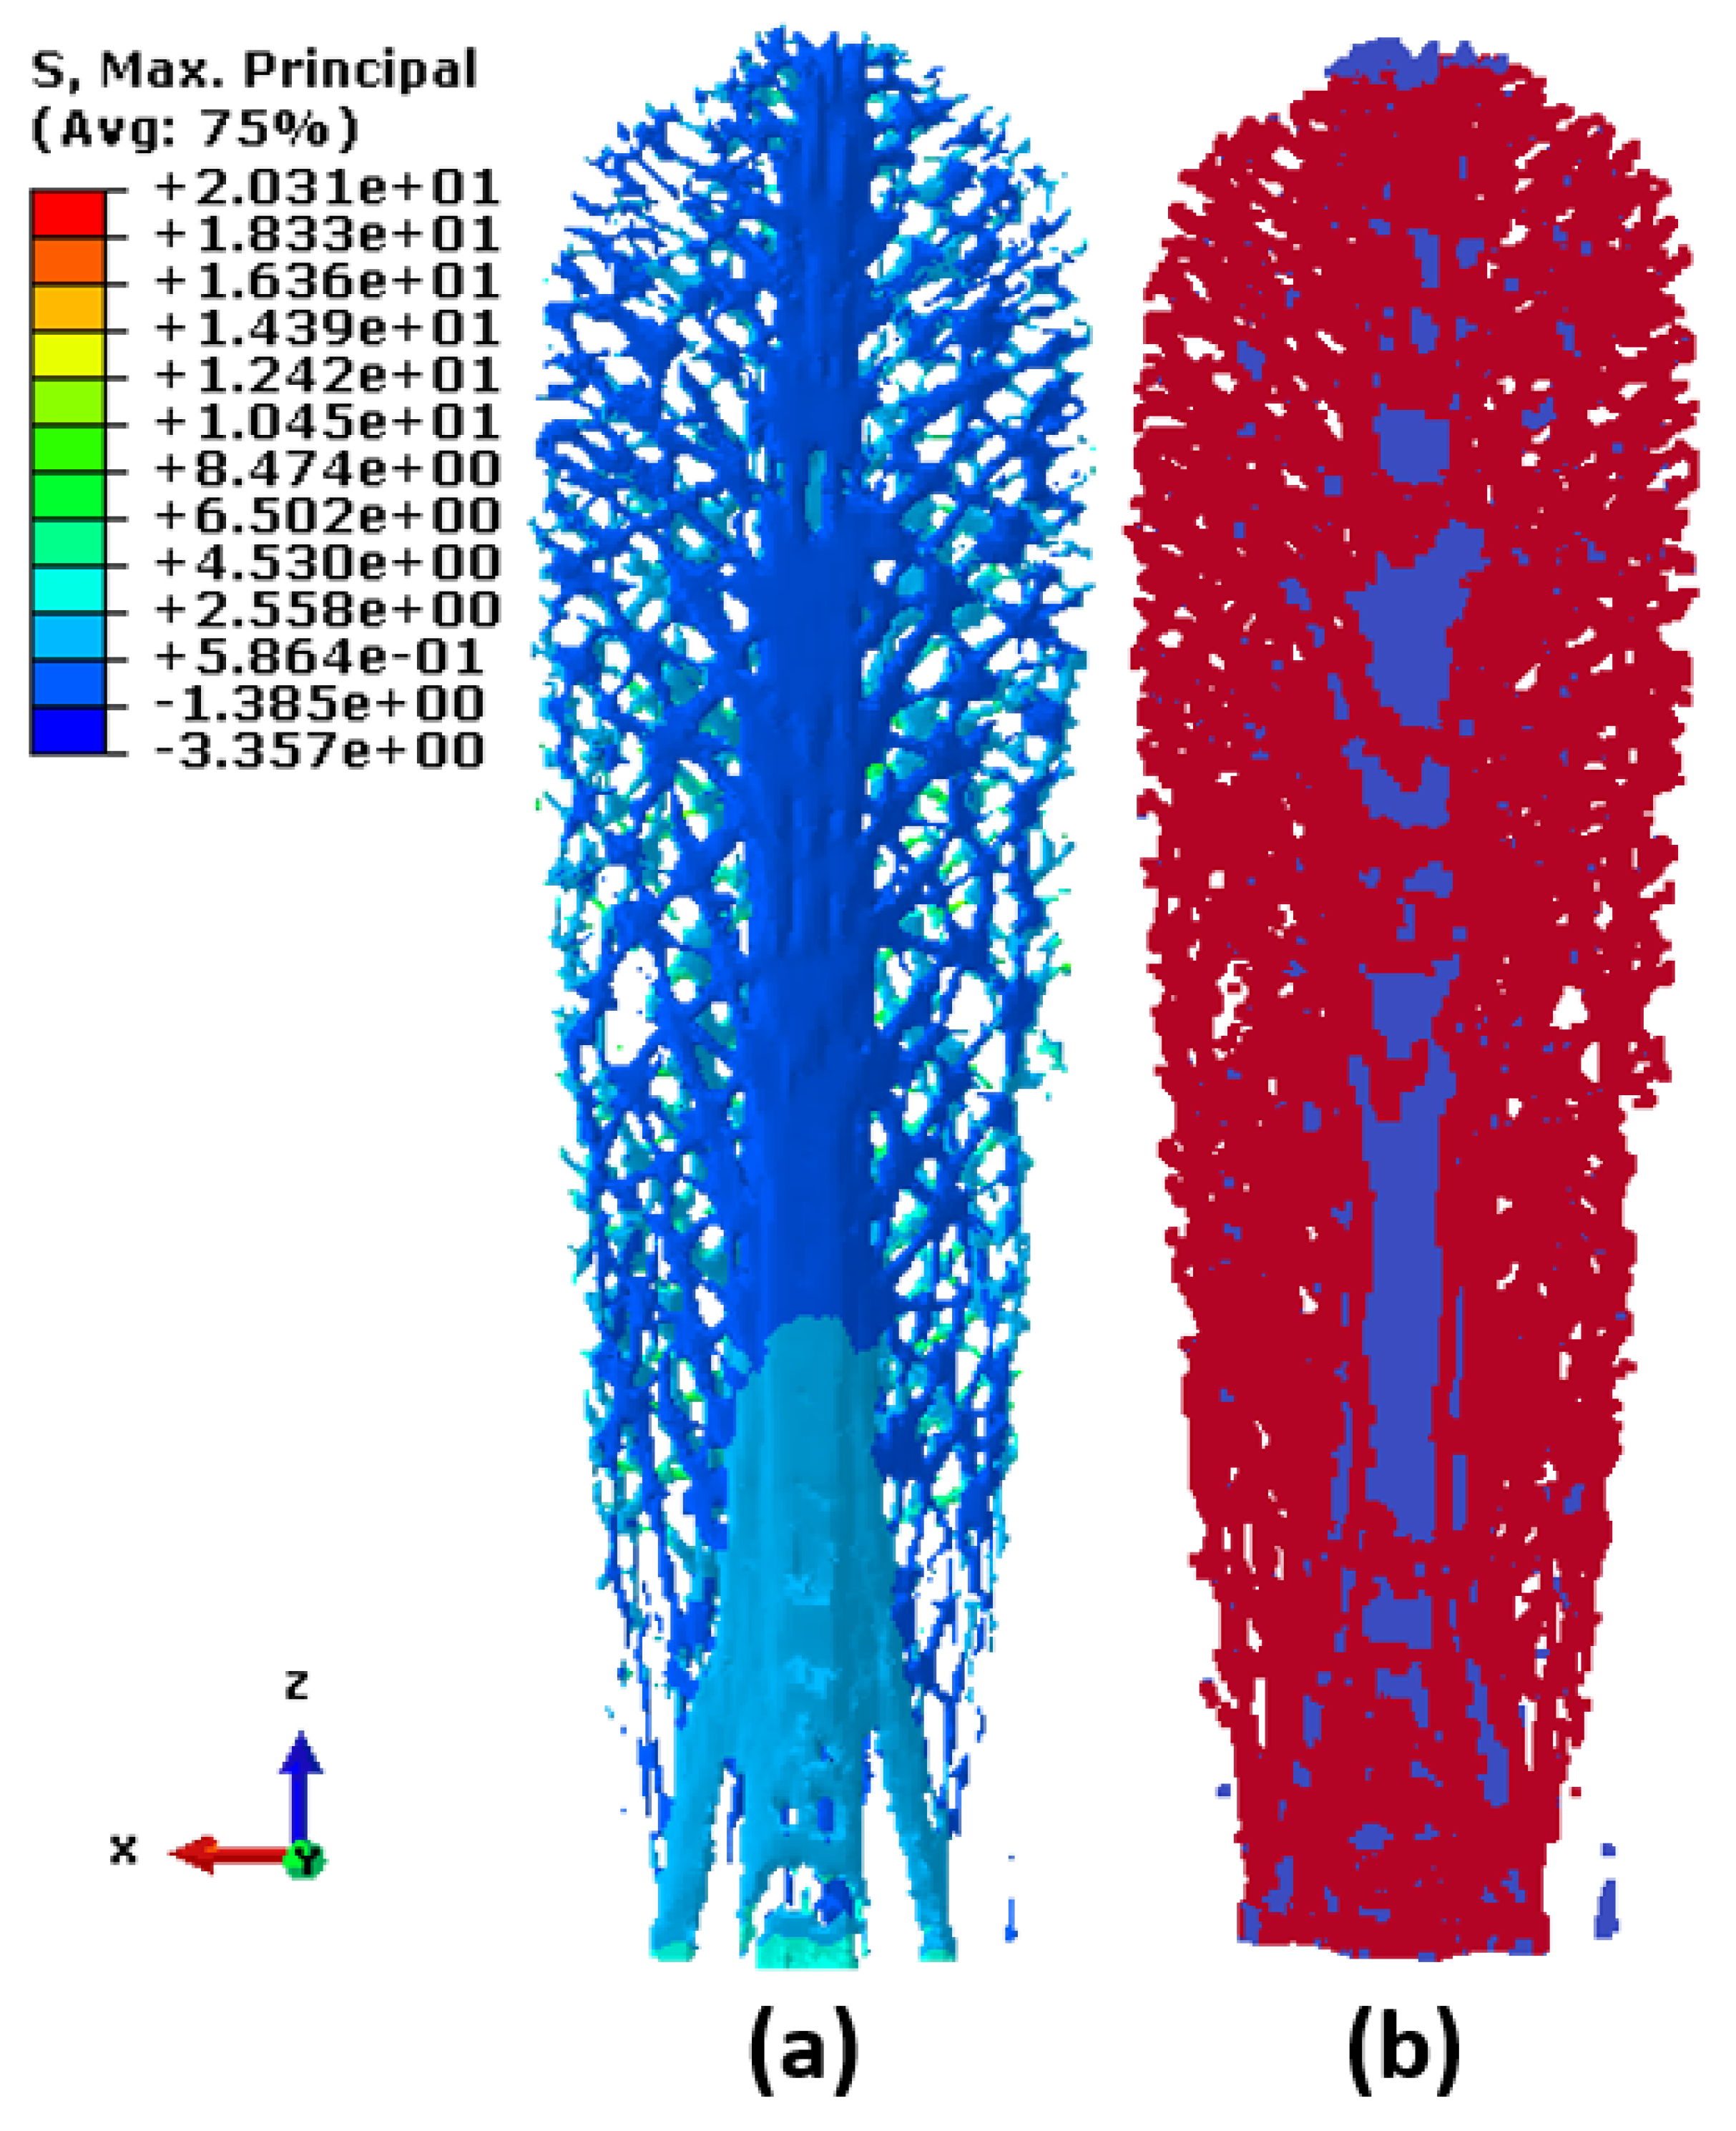
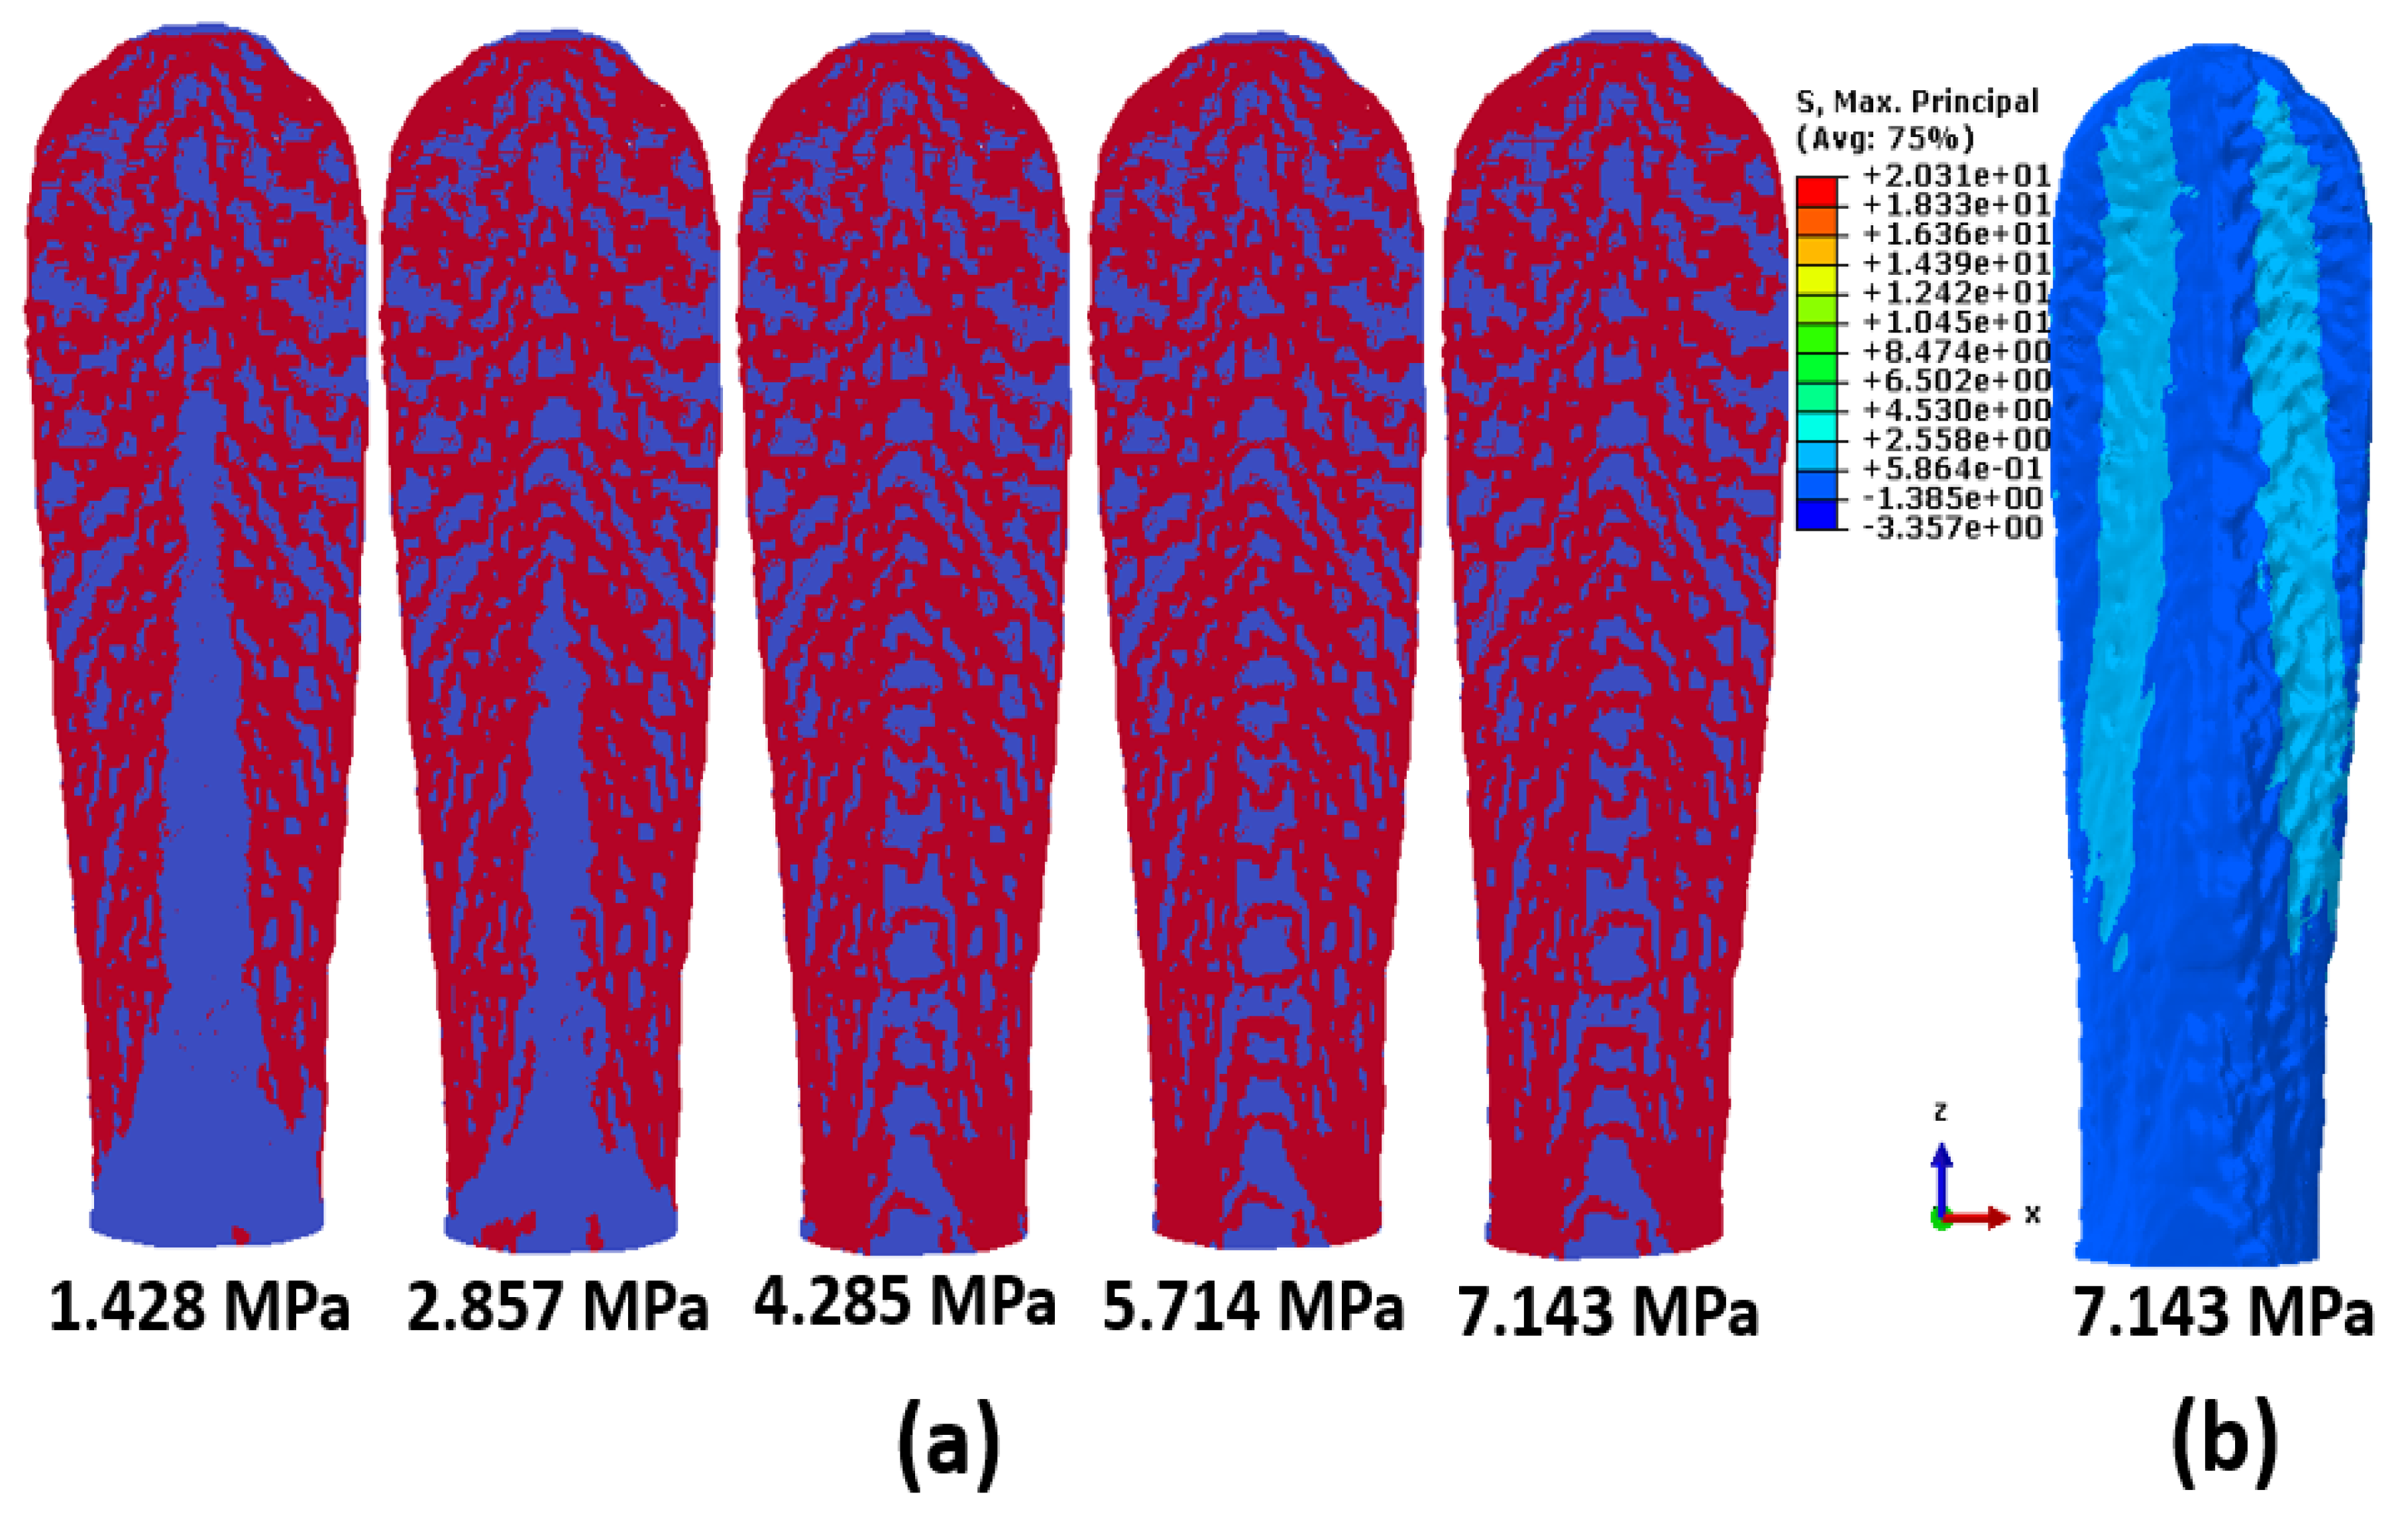
6.3. Flow Network Analysis on Rostrum Tissue

Figure 18a shows the minimum cut obtained from flow network analysis on the bottom surface of the rostrum using the source–sink combination shown Figure 9. As seen in Figure 18a, the flow network captured the failure patterns at much earlier stages of loading that were not evident in the computational-mechanics results shown in Figure 18b. At low pressure levels, the strain localization patterns are captured on the tip of the central region of Figure 18a. As pressure increases, the strain-localization patterns are formed all along the central region of the rostrum tissue. Trusslike patterns are captured on the tissue part of the rostrum, as seen in Figure 18a. In contrast, the maximum principal stresses seen in Figure 18b did not show evidence of such patterns. The strain localization patterns captured through the flow network strategy are typically observed in a structural system under tensile loading. At a pressure of 7.143 MPa, Figure 18a also does not show any failure sites at the base of the tissue part of the rostrum indicative of it being stronger than the remaining part of the rostrum. This is the region that is attached to the mouth of the paddlefish, and this particular structural system is optimized for performance in this area. The flow network strategy captured this pattern at nascent stages, when the material was still in the linearly elastic regime.
Figure 19a displays the minimum cut obtained by using the flow network approach on the top surface of the rostrum. As seen in Figure 19a, at lower stresses the minimum cut is clearly formed in the right and left side of the rostrum. This is the region where the material properties of this component of the rostrum drastically change. As pressure increases, patterns are formed in the center and base region. As pressure increases in Figure 19a, there is also an absence of failure sites at the left and right corners of the base region of the rostrum. This behavior is similar to the one observed on the top surface of the rostrum. This is indicative of the identification of the stronger part of the rostrum at the nascent stage of loading.

7. Conclusions

This work successfully used the maximum-flow/minimum-cut algorithm for early detection of failure mechanisms in the paddlefish rostrum under uniform pressure loading and a fixed plate boundary condition. The transdisciplinary approach proposed in the current study was verified using two classical problems before implementing it on the complex biostructure.
The flow network approach was able to identify failure for the problem involving the three-point bending of a simply supported concrete beam. The proposed approach was able to identify the shear and flexure patterns for four-point bending of a simply supported concrete beam. The shear and flexure patterns identified by the flow network approach govern the phenomena of the failure mechanism in this classical problem. Failure patterns were identified at the onset of loading when the material was still in the linear elastic regime.
When applied to a complex biostructure, the flow network strategy was able to identify the strain localization in the tensile region, and the crushing behavior in the compressive region of the rostrum. Additionally, the flow network approach was able to identify the failure sites at locations where the material properties as well as the geometry of the component parts of the rostrum change, i.e., at the interface regions. The interface regions are typically where the failure initiates. This information can be used to efficiently design smart structural systems. The guidance regarding the selection of the source and sink nodes was obtained from the stress and deformation contours obtained from the computational mechanics experiments.

8. Comments on the Transdisciplinary Approach

This work successfully identified the stress-flow patterns in a complex biostructure through efficient use of flow network strategy. The approach used in the current work reduces the computational time, and cost since it is not required to run finite element analysis to failure. Stress patterns were identified when the material was in the linearly elastic regime. This approach laid the foundation of an efficient design–test–build cycle for the rapid prototyping of bioinspired structures. The flow network approach reduces the size of the problem since we concentrate on the parameter of interest, i.e., stress in the current study.

Author Contributions

Investigation, R.P.; resources, A.T.; supervision, G.R.; writing—review and editing, G.R., D.T., E.P., J.J.H., and J.P.

Acknowledgments

The authors acknowledge the financial support provided by U.S. Army Engineer Research and Development Center (ERDC) under PE 0601102, Project T22 “Research in Soil and Rock Mechanics”, Task 01. The support and resources from the Engineer Research and Development Center Department of Defense Supercomputing Resource Center (ERDC DSRC) under the subproject Environmental Quality Modeling and Simulation are gratefully acknowledged. Permission was granted by the Director of the Information Technology Laboratory to publish this information.

Conflicts of Interest

The authors declare no conflict of interest.

References

  1. Aggelis, D.G. Classification of cracking mode in concrete by acoustic emission parameters. Mech. Res. Commun. 2011, 38, 153–157. [Google Scholar] [CrossRef]
  2. Carpinteri, A.; Lacidogna, G.; Niccolini, G.; Puzzi, S. Critical defect size distributions in concrete structures detected by the acoustic emission technique. Meccanica 2008, 43, 349–363. [Google Scholar] [CrossRef]
  3. Farhidzadeh, A.; Salamone, S.; Singla, P. A probabilistic approach for damage identification and crack classification in reinforced concrete structures. J. Intell. Mater. Syst. Struct. 2013, 24, 1722–1735. [Google Scholar] [CrossRef]
  4. Farhidzadeha, A.; Mpalaskasb, A.C.; Matikasb, T.E.; Farhidzadehc, H.; Aggelis, D.G. Fracture mode identification in cementitious materials using supervised pattern recognition of acoustic emission features. Constr. Build. Mater. 2014, 67, 129–138. [Google Scholar] [CrossRef]
  5. Kageyama, K.; Murayama, H.; Ohsawa, I.; Kanai, M.; Nagata, K.; Machijima, Y. Acoustic emission monitoring of a reinforced concrete structure by applying new fiber-optic sensors. Smart Mater. Struct. 2005, 14, s52–s59. [Google Scholar] [CrossRef]
  6. Ohtsu, M.; Uchida, M.; Okamoto, T.; Yuyama, S. Damage assessment of reinforced concrete beams qualified by acoustic emission. ACI Struct. J. 2002, 99, 411–417. [Google Scholar]
  7. Shiotani, T.; Aggelis, D.G.; Makishima, O. Global monitoring of large concrete structures using acoustic emission and ultrasonic techniques: Case study. J. Bridge Eng. 2009, 14, 188–192. [Google Scholar] [CrossRef]
  8. Bahlouli, N.; Guil, S.M.; Ahzi, S.; Laberge, M. Stress-strain response of biomaterials by a digital image correlation method: Application to tecoflex. J. Mater. Sci. Technol. 2004, 20, 114–116. [Google Scholar]
  9. Carroll, J.; Efstathiou, C.; Lambros, J.; Sehitoglu, H.; Hauber, B.; Spottswood, S.; Chona, R. Investigation of fatigue crack closure using multiscale image correlation experiments. Eng. Fract. Mech. 2009, 76, 2384–2398. [Google Scholar] [CrossRef]
  10. Fazzini, M.; Mistou, S.; Karama, M. Identification of elastomers by digital image correlation. In Proceedings of the 5th European Conference on Constitutive Models for Rubber, Paris, France, 4–7 September 2007. [Google Scholar]
  11. Goh, C.P.; Ratnam, M.M.; Ismail, H. Large in-plane deformation mapping and determination of young’s modulus of rubber using scanner-based digital image correlation. Exp. Tech. 2015, 40, 1117–1127. [Google Scholar] [CrossRef]
  12. Gonzáles, G.L.; González, J.A.; Castro, J.T.; Freire, J.L. A J-integral approach using digital image correlation for evaluating stress intensity factors in fatigue cracks with closure effects. Theor. Appl. Fract. Mech. 2017, 90, 14–21. [Google Scholar] [CrossRef]
  13. Lopez-Crespo, P.; Shterenlikht, A.; Yates, J.; Patterson, E.; Withers, P. Some experimental observations on crack closure and crack-tip plasticity. Fatigue Fract. Eng. Mater. Struct. 2009, 32, 418–429. [Google Scholar] [CrossRef]
  14. Mudassar, A.A.; Butt, S. Improved digital image correlation method. Opt. Lasers Eng. 2016, 87, 156–167. [Google Scholar] [CrossRef]
  15. Sutton, M.A.; McNeill, S.R.; Helm, J.D.; Chao, Y.J. Advances in Two-Dimensional and Three Dimensional Computer Vision. In Photomechanics; Springer: Berlin/Heidelberg, Germany, 2000; pp. 323–372. [Google Scholar]
  16. Sutton, M.A.; Orteu, J.J.; Schreier, H. Image Correlation for Shape, Motion and Deformation Measurements: Basic Concepts, Theory and Applications; Springer Science and Business Media: New York, NY, USA, 2009. [Google Scholar]
  17. Vasco-Olmo, J.; Díaz, F.; García-Collado, A.; Dorado-Vicente, R. Experimental evaluation of crack shielding during fatigue crack growth using digital image correlation. Fatigue Fract. Eng. Mater. Struct. 2015, 38, 223–237. [Google Scholar] [CrossRef]
  18. Hallgren, M.; Bjerke, M. Non-linear finite element analyses of punching shear failure of column footings. Cem. Concr. Compos. 2002, 24, 491. [Google Scholar] [CrossRef]
  19. Mamede, N.F.; Ramos, A.P.; Faria, D.M. Experimental and parametric 3D nonlinear finite element analysis on punching of flat slabs with orthogonal reinforcement. Eng. Struct. 2013, 48, 442–457. [Google Scholar] [CrossRef]
  20. Shu, J.; Plos, M.; Zandi, K.; Johansson, M.; Nilenius, F. Prediction of punching behavior of RC slabs using continuum non-linear FE analysis. Eng. Struct. 2016, 15, 15–25. [Google Scholar] [CrossRef]
  21. Borderie, C.L.; Lawrence, C.; Menou, A. Approche mésoscopique du comportement du béton: Apport de la représentation géométrique. Revue Européenne de Génie Civil 2007, 11, 407–421. [Google Scholar] [CrossRef]
  22. Grassl, P.; Grégoire, D.; Rojas-Solano, L.B.; Pijaudier-Cabot, G. Meso-scale modelling of the size effect on the fracture process zone of concrete. Int. J. Solids Struct. 2012, 49, 1818–1827. [Google Scholar] [CrossRef] [Green Version]
  23. Grégoire, D.; Verdon, L.B.; Lefort, V.; Grassl, P.; Saliba, J.; Regoin, J.P.; Loukili, A.; Pijaudier-Cabot, G. Mesoscale analysis of failure in quasi-brittle materials: Comparison between lattice model and acoustic emission data. Int. J. Numer. Anal. Methods Geomech. 2015, 39, 1639–6164. [Google Scholar] [CrossRef]
  24. Flores-Johnson, E.; Shen, L.; Guiamatsia, I.; Nguyen, G.D. A numerical study of bioinspired nacre-like composite plates under blast loading. Compos. Struct. 2015, 126, 329–336. [Google Scholar] [CrossRef] [Green Version]
  25. Flores-Johnson, E.; Shen, L.; Guiamatsia, I.; Nguyen, G.D. Numerical investigation of the impact behavior of bioinspired nacre-like aluminum composite plates. Compos. Sci. Technol. 2014, 96, 13–22. [Google Scholar] [CrossRef]
  26. Tran, P.; Ngo, T.D.; Mendis, P. Bioinspired composite structures subjected to under water impulsive loading. Comput. Mater. Sci. 2014, 82, 134–139. [Google Scholar] [CrossRef]
  27. Bertsekas, D.P. Network Optimization: Continuous and Discrete Models (Optimization, Computation, and Control); Athena Scientific: Nashua, NH, USA, 1998. [Google Scholar]
  28. Lin, Q.; Tordesillas, A. Towards an optimization theory for deforming dense granular materials: Minimum cost maximum flow solutions. J. Ind. Manag. Optim. 2014, 10, 337. [Google Scholar] [CrossRef]
  29. Tordesillas, A.; Tobin, S.T.; Cil, M.; Alshibli, K.; Behringer, R.P. Network flow model of force transmission in unbonded and bonded granular media. Phys. Rev. E 2015, 91, 062204. [Google Scholar] [CrossRef]
  30. Lefort, V.; Pijaudier-Cabot, G.; Grégoire, D. Analysis by Ripley’s function of the correlations involved during failure in quasi-brittle materials: Experimental and numerical investigations at the mesoscale. Eng. Fract. Mech. 2015, 147, 449–467. [Google Scholar] [CrossRef]
  31. Ripley, B.D. Modelling spatial patterns. J. R. Stat. Soc. Ser. B Methodol. 1977, 39, 172–212. [Google Scholar] [CrossRef]
  32. Duncan, R.P. Flood disturbance and the coexistence of species in a lowland podocarp forest, south Westland, New Zealand. J. Ecol. 1993, 81, 403–416. [Google Scholar] [CrossRef]
  33. Stamp, N.E.; Lucas, J.R. Spatial Patterns and Dispersal Distances of Explosively Dispersing Plants in Florida Sandhill Vegetation. J. Ecol. 1990, 78, 589–600. [Google Scholar] [CrossRef]
  34. Diggle, P.J.; Chetwynd, A.G. Second-Order Analysis of Spatial Clustering for Inhomogeneous Populations. Biometrics 1991, 47, 1155–1163. [Google Scholar] [CrossRef]
  35. Weiner, S.; Wagner, H.D. The material bone: Structure-Mechanical Function Relation. Annu. Rev. Mater. Sci. 1998, 28, 271–298. [Google Scholar] [CrossRef]
  36. Hoover, J.J.; George, S.G.; Killgore, K.J. Rostrum size of paddlefish (Polyodon spathula) (Acipenseiformes: Polyodontidae) from the Mississippi Delta. Copeia 2000, 1, 288–290. [Google Scholar] [CrossRef]
  37. Kuhajda, B.R. Polyodontidae: Paddlefishes; Johns Hopkins University Press: Baltimore, MD, USA, 2014. [Google Scholar]
  38. Riveros, G.A.; Patel, R.R.; Hoover, J.J. Swimming and Energy Dissipation Enhancement Induced by the Rostrum of the Paddlefish (Polyodon spathula): A Multiphysics, Fluid-Structure Interaction Analysis. In Proceedings of the Materials Research Society Fall Meeting, Boston, MA, USA, 29 November–4 December 2015. [Google Scholar]
  39. Patel, R.R.; Riveros, G.A.; Thompson, D.S.; Acosta, F.J.; Perkins, E.J.; Hoover, J.J.; Peters, J.F.; Tordesillas, A. Early Detection of Failure Mechanisms in Resilient Biostructures: A Network Flow Study; ERDC: Vicksburg, MS, USA, 2017. [Google Scholar]
  40. Patel, R.R.; Valles, D.; Riveros, G.A.; Thompson, D.S.; Perkins, E.J.; Hoover, J.J.; Peters, J.F.; Tordesillas, A. Stress flow analysis of biostructures using the finite element method and the flow network approach. Finite Elem. Anal. Des. 2018, 152, 46–54. [Google Scholar] [CrossRef]
  41. Bondy, J.A.; Murty, U.S.R. Graph Theory. In Graduate Texts in Mathematics; Springer: New York, NY, USA, 2008. [Google Scholar]
  42. Jungnickel, D. Graphs, Networks and Algorithms. In Algorithms and Computation in Mathematics 5, 3rd ed.; Springer: Berlin, Germany, 2008. [Google Scholar]
  43. Tordesillas, A.; Pucilowski, S.; Tobin, S.; Kuhn, M.R.; Ando, E.; Viggiani, G.; Druckrey, A.; Alshibli, K. Shear bands as bottlenecks in force transmission. Eur. Phys. Lett. 2015, 110, 58005. [Google Scholar] [CrossRef] [Green Version]
  44. Dassault Systems. Abaqus 6.13 Using Abaqus Online Documentation. Available online: http://dsk.ippt.pan.pl/docs/abaqus/v6.13/pdf_books/HELP.pdf (accessed on 26 April 2019).
  45. Riveros, G.A.; Gopalaratnam, V.S. Fracture response of reinforced concrete deep beams finite element investigation of strength and beam size. Appl. Math. 2013, 4, 1568. [Google Scholar] [CrossRef]
  46. Riveros, G.A.; Gopalaratnam, V.S. Shear Response of Reinforced Concrete Deep Beam: Validating Fracture Mechanics Based Numerical Modelling with Experiments; American Concrete Institute: Farmington Hills, MI, USA, 2015. [Google Scholar]
  47. Segalman, D.J.; Fulcher, C.W.G.; Reese, G.M.; Field, R.V., Jr. An Efficient Method for Calculating RMS von Mises Stress in a Random Vibration Environment. J. Sound Vib. 1998, 230, 393–410. [Google Scholar] [CrossRef]
  48. Deang, J.; Horstemeyer, M.; Williams, L.; Perkins, E.; Allison, P.; Riveros, G. Paddlefish rostrum as a structure for bioinspiration: Analysis and modeling of the of the stress state and strain rate dependence behavior of cartilage. In Proceedings of the TMS Annual Meeting and Exhibition, Nashville, TN, USA, 14–18 February 2016. [Google Scholar]
  49. Allison, P.G.; Deang, J.F.; Diaz, A.J.; Poda, A.R.; Hoover, J.J.; Horstemeyer, M.F.; Perkins, E.J. Characterization of paddlefish (Polyodon spathula) rostrum stellate bones. Bioinspired Biomim. Nanobiomater. 2013, 3, 63–68. [Google Scholar] [CrossRef]
Figure 1. Paddlefish from the lower Mississippi River showing the unique rostrum of the species. (Upper photo) Adult fish 1 m long contained in a mobile swim tunnel; (lower photo) dried and skeletonized rostrum. Photo taken by Dr. Jan Jeffrey Hoover, USACE.
Mca 24 00047 g001
Figure 2. (a) Node numbering in an eight-node hexahedral element. (b) Hexahedral element faces in an eight-node hexahedral element. (c) Capacity calculation for edges in flow network graph. (d) Integration points on an eight-node hexahedral.
Mca 24 00047 g002
Figure 3. Von Mises stress equation expressed by the six stress components.
Mca 24 00047 g003
Figure 4. Flowchart depicting the steps involved in formulating a small part of rostrum as a network flow problem.
Mca 24 00047 g004
Figure 5. Schematics of three-point bending of a simply supported concrete beam.
Mca 24 00047 g005
Figure 6. Maximum principal stresses for three-point bending of a simply supported concrete beam.
Mca 24 00047 g006
Figure 7. Flow network analysis for three-point bending of a simply supported concrete beam.
Mca 24 00047 g007
Figure 8. Schematics of four-point bending of a simply supported concrete beam.
Mca 24 00047 g008
Figure 9. Maximum principal stresses for four-point bending of a simply supported concrete beam.
Mca 24 00047 g009
Figure 10. Flow network analysis of four-point bending of a simply supported concrete beam.
Mca 24 00047 g010
Figure 11. Abaqus mesh model of the rostrum. Dorsal view of tissue and hard cartilage on the left, lateral view of soft cartilage and oblique lateral sagittal section of mesh assembly on the right.
Mca 24 00047 g011
Figure 12. Force and displacement boundary conditions implemented on the rostrum.
Mca 24 00047 g012
Figure 13. Displacement contours of the rostrum subjected to uniform pressure loading with a fixed plate boundary condition showing the location of source/sink. Cases 1 and 3 were chosen at the edges, and Case 2 in the center of the maximum displacement contour. Dorsal view of rostrum.
Mca 24 00047 g013
Figure 14. Soft cartilage of paddlefish rostrum. (a) Maximum principal stress obtained from finite element analysis. (b) Minimum cut obtained from mathematical analysis on bottom surface of rostrum’s soft cartilage. Nodes are colored by their respective locations on the source (red) or sink (blue) side of the minimum cut.
Mca 24 00047 g014
Figure 15. Soft cartilage of paddlefish rostrum. (a) Maximum principal stress obtained from finite element analysis. (b) Minimum cut obtained from mathematical analysis on top surface of rostrum’s soft cartilage. Nodes are colored by their respective locations on the source (red) or sink (blue) side of the minimum cut.
Mca 24 00047 g015
Figure 16. Hard cartilage of paddlefish rostrum. (a) Maximum principal stress obtained from finite element analysis. (b) Minimum cut obtained from mathematical analysis on bottom surface of rostrum’s hard cartilage. Nodes are colored by their respective locations on the source (red) or sink (blue) side of the minimum cut.
Mca 24 00047 g016
Figure 17. Hard cartilage of paddlefish rostrum. (a) Maximum principal stress obtained from finite element analysis. (b) Minimum cut obtained from mathematical analysis on top surface of rostrum’s hard cartilage. Nodes are colored by their respective locations on the source (red) or sink (blue) side of the minimum cut.
Mca 24 00047 g017
Figure 18. Tissue of paddlefish rostrum. (a) Network flow analysis on the bottom surface of rostrum subjected to uniform pressure loading with a fixed plate boundary condition. Nodes are colored by their respective locations on the source (red) or sink (blue) side of the minimum cut. (b) Maximum principal stresses on the bottom surface of rostrum.
Mca 24 00047 g018
Figure 19. Tissue of paddlefish rostrum. (a) Network flow analysis on the top surface of the rostrum subjected to uniform pressure loading with a fixed plate boundary condition. Nodes are colored by their respective locations on the source (red) or sink (blue) side of the minimum cut. (b) Maximum principal stresses on the top surface of rostrum.
Mca 24 00047 g019
Table 1. Commercial materials selected to model the rostrum.
PartCommercial MaterialElastic Modulus
TissueVinyl ester epoxy2.9 GPa
Hard cartilagePolyethylene fibers66 GPa
Soft cartilagePolyethylene/epoxy(as isotropic)49,762 MPa

