
Investigation on the Mathematical Relation Model of Structural Reliability and Structural Robustness


1
School of Civil Engineering and Architecture, Henan University of Technology, 100 Lianhua Road, Zhengzhou 450001, China
2
School of Highway, Chang’an University, Middle-Section of Nan’er Huan Road, Xi’an 710064, China
3
School of Engineering, University of British Columbia, 3333 University Way, Kelowna, BC V1V 1V7, Canada
4
National Engineering Laboratory for Bridge Structural Safety Technology, Chang’an University, Middle-Section of Nan’er Huan Road, Xi’an 710064, China
*
Authors to whom correspondence should be addressed.
Math. Comput. Appl. 2021, 26(2), 26; https://0-doi-org.brum.beds.ac.uk/10.3390/mca26020026
Submission received: 6 February 2021
/
Revised: 25 March 2021
/
Accepted: 26 March 2021
/
Published: 28 March 2021
(This article belongs to the Special Issue Mathematical and Computational Modelling in Mechanics of Materials and Structures)
Abstract
:Structural reliability and structural robustness, from different research fields, are usually employed for the evaluative analysis of building and civil engineering structures. Structural reliability has been widely used for structural analysis and optimization design, while structural robustness is still in rapid development. Several dimensionless evaluation indexes have been defined for structural robustness so far, such as the structural reliability-based redundancy index. However, these different evaluation indexes are usually based on subjective definitions, and they are also difficult to put into engineering practice. The mathematical relational model between structural reliability and structural robustness has not been established yet. This paper is a quantitative study, focusing on the mathematical relation between structural reliability and structural robustness so as to further develop the theory of structural robustness. A strain energy evaluation index for structural robustness is introduced firstly by considering the energy principle. The mathematical relation model of structural reliability and structural robustness is then derived followed by a further comparative study on sensitivity, structural damage, and random variation factor. A cantilever beam and a truss beam are also presented as two case studies. In this study, a parabolic curve mathematical model between structural reliability and structural robustness is established. A significant variation trend for their sensitivities is also observed. The complex interaction mechanism of the joint effect of structural damage and random variation factor is also reflected. With consideration of the variation trend of the structural reliability index that is affected by different degrees of structural damage (mild impairment, moderate impairment, and severe impairment), a three-stage framework for structural life-cycle maintenance management is also proposed. This study can help us gain a better understanding of structural robustness and structural reliability. Some practical references are also provided for the better decision-making of maintenance and management departments.
1. Introduction
Structural reliability is commonly used in structural evaluation analysis and optimization design. Many engineering applications have been obtained, such as the reliability evaluation or assessment of in-service structure [1,2]. On the other hand, a series of studies have also been carried out so as to minimize the loss caused by structural damage effects and even safety accidents. One example is structural robustness (closely relevant to the disproportionate collapse of in-service structure) [3,4,5]. It is increasingly being used in structural robustness design [6], structural system robustness checking [7], and robustness-based assessment [8].
Different from structural reliability, structural robustness is in urgent need of further development. Actually, robustness was originally widely used in the field of statistics and system control in the 1970s, employed to reflect the non-sensitivity of a system or structure subjected to external environment interference and internal uncertainties [5,9,10]. Up to now, robustness still has a great influence in the field of structural vibration control [11,12]. While structural robustness, the ability of the system to suffer an amount of damage not disproportionate with respect to the causes of structural damage itself (Eurocode 1 in ISO 22111), can be traced back to the pressure test on a gable wall in the 1980s [13]. A series of studies on structural vulnerability (opposition to structural robustness) is firstly carried out and further developed at Bristol University, aiming to locate structural weak members or components rather than structural response theory under load effect [10,14,15]. In the last few years, structural robustness has been greatly promoted by Joint Committee on Structural Safety (aided by COST Actions TU601). One example is the general consensus on the physical significance of structural robustness [16,17]. Structural robustness is actually the adaptability of system strategy choice, and it is broader (higher-level cognitive processes) than stability [18]. Structural robustness can be used to reflect the tolerance capacity of a structure subjected to load effect. The structural robustness of a system can also be regarded as the ratio of non-direct risk to total risk [19]. It is the severe consequences of structural damage and the high efficiency of design execution that makes structural robustness of vital importance [20].
Structural robustness, a part of structural resilience [21] (the other part is structural recoverability), is not only closely related to structural redundancy and ductility but also has a close relation with structural reliability and probability analysis [4,22,23,24]. The sensitivity of structural robustness, structural reliability, and structural redundancy is also further analyzed [10,25]. Meanwhile, several dimensionless evaluation indexes of structural robustness have also been defined, such as the risk-based evaluation index and the sensitivity-based evaluation index [9,20]. Structural redundancy is also selected as the evaluation index of structural robustness, such as the residual redundancy coefficient and the residual intensity ratio [5,9,10,14,20]. Some redundancy evaluation indexes are also further defined based on structural reliability index. For example, supposing and represent the reliability index of collapsed and yielded structure. Structural robustness can be reflected by the ratio of () and [24,26]. However, these evaluation indexes for structural robustness are mostly subjectively defined based on the different levels of understanding of physical meanings. Further study on structural robustness evaluation index still needs to be carried out. Moreover, although both structural robustness and structural reliability can be used to analyze and evaluate structural performance, the specific mathematical relational model between structural robustness and structural reliability has not been established yet.
Currently, it is generally acknowledged that smaller structural robustness usually means weaker structural resistance and a higher level of vulnerability. The weak members or components can then be located for more targeted reinforcement, maintenance, and management. For example, the in-service bridges structural health monitoring (SHM) measure points based on structural robustness rather than traditional experiences can be more targeted and systematic [27,28]. With consideration of different damage degrees, different damage locations, and even different vehicle moving speeds, the hierarchical arrangement of SHM measure points can be further realized [29]. Implementing design for structural robustness is still a gray area and more so when it comes to defining means to quantify structural robustness [16]. Many in-service structures, especially for the structure after a long-term service, are usually accompanied by complex interaction mechanisms of the joint effect of structural damage effects and random variation factors. Therefore, it is still difficult to reflect the real status of this kind of structure only by structural robustness, and it is necessary to consider a combined analysis of multiple methods for a higher-level in-service structural maintenance and management.
In this paper, the comparative analysis of structural reliability and structural robustness is firstly introduced, followed by a widely accepted evaluation index for structural robustness by considering the energy principle. The mathematical relation model of structural robustness evaluation index and structural reliability index is derived. A further comparison between structural reliability and structural robustness is also carried out with consideration of damage effects and random effects. The sensitivities of structural robustness evaluation index and structural reliability index are also analyzed. This study can make us a better understanding of structural robustness. With consideration of different degrees of structural damage (including mild impairment, moderate impairment, and severe impairment), a more targeted three-stage decision-making framework rather than traditional engineering experiences is proposed. Some recommendations are also provided for the structure after a long-term service, and then a new perspective for structural life-cycle maintenance and management can be further expected.
2. Mathematical Expression of Structural Reliability Index and Structural Robustness Evaluation Index
In this section, some differences (both physical significance and mathematical meaning) of structural robustness and structural reliability are firstly summarized [10]. Specifically, structural robustness focuses on the safety reserve or residual tolerance capacity of a structure subjected to load effect. The dimensionless evaluation indexes are usually based on subjective definition, and a simpler computational process is usually involved, while structural reliability is usually used to reflect the probability of structurally maintaining the normal service under load effect. It is usually based on probability statistical method, and the parameters are usually considered as random variables. The calculation process involving probability statistical analysis is more complex. Themathematical expression analysis of structural reliability index and structural robustness evaluation indexis described in the following subsections.
2.1. Mathematical Expression of Structural Reliability Index
Structural reliability is commonly based on statistical analysis, aiming to reveal the probability that the structure retains its overall performance.The basic analysis process is shown as follows [30]:
Supposing the number of a random variable is represented by the symbol n. Structural (member or element) failure probability () can also be further developed by the following multi-dimensional integrals:
In Equation (1), represents structural load effect. , , and represent structural dependable status, structural ultimate status, and structuralfailure status. It is generally recognized that structural status function has a close connection with load effect () and structural resistance (). Supposing and are the random variables of normal distribution (approximation analysis and simplification analysis are usually needed for the description of different variables in engineering practice). The general capacity minus demand function is shown as follow (, and , represent the mean and standard deviation of and ):
The probability density function () is expressed as follows (, ):
The failure probability is expressed as follow:
Supposing is the structural reliability index (), and the reliable probability () can be shown as follows:
According to Equation (5), the structural reliability index can be further calculated.
2.2. Mathematical Expression of Structural Robustness Evaluation Index
With consideration of an extensive comparative analysis on the mathematical expression of different evaluation indexes of structural robustness, a general mathematical expression form of these different indexes is observed. The mathematical expression is shown as follows [10]:
In Equation (6), is structural ultimate or initial status. is structural response corresponding to load effect. Specifically, several structural parameters are also proposed for and , such as the stiffness matrix, strain energy, and carrying capacity coefficient. Different physical meanings of the general expression can also be further reflected by different structural parameters.
According to the universal applicability of the energy principle, we consider the strain energy parameter as the evaluation index of structural robustness. Supposing is the strain energy of the structure subjected to load effect, is the structural initial strain energy, and is the structural ultimate strain energy ( is the ultimate strain energy corresponding to the truss beam member). Different mathematical expressions can then be defined as follows:
In Equations (7)–(10), and represent the strain energy variation of the structure subjected to load effect. and represent the strain energy variation with consideration of the initial and external load effect. Therefore, Equation (7) not only has a simpler expression for the value interval but also can clearly represent the strain energy variation of a structure subjected to load effect, and then it can be employed in this study.
3. Mathematical Relation Model Deduction of Structural Reliability and Structural Robustness
3.1. Establishment of Mathematical Relation Model
In this section, the strength is a uniform distribution along with the length of structural member or element, and the ultimate bending moment of structural member or element is . With consideration of the moment effect , the mathematical expression of the performance function of structural reliability of structural member or elementis shown as follows:
The reliability index () of structural member or element is shown as follows:
According to the static force and mathematical relation, the bending strain energy () generated by the moment is ( represents structural stiffness, and is the length). The structural robustness evaluation index () of structural member or element subjected to the average moment value effect is shown as follows:
The mathematical relation expression of structural robustness evaluation index and structural reliability index is shown as follow:
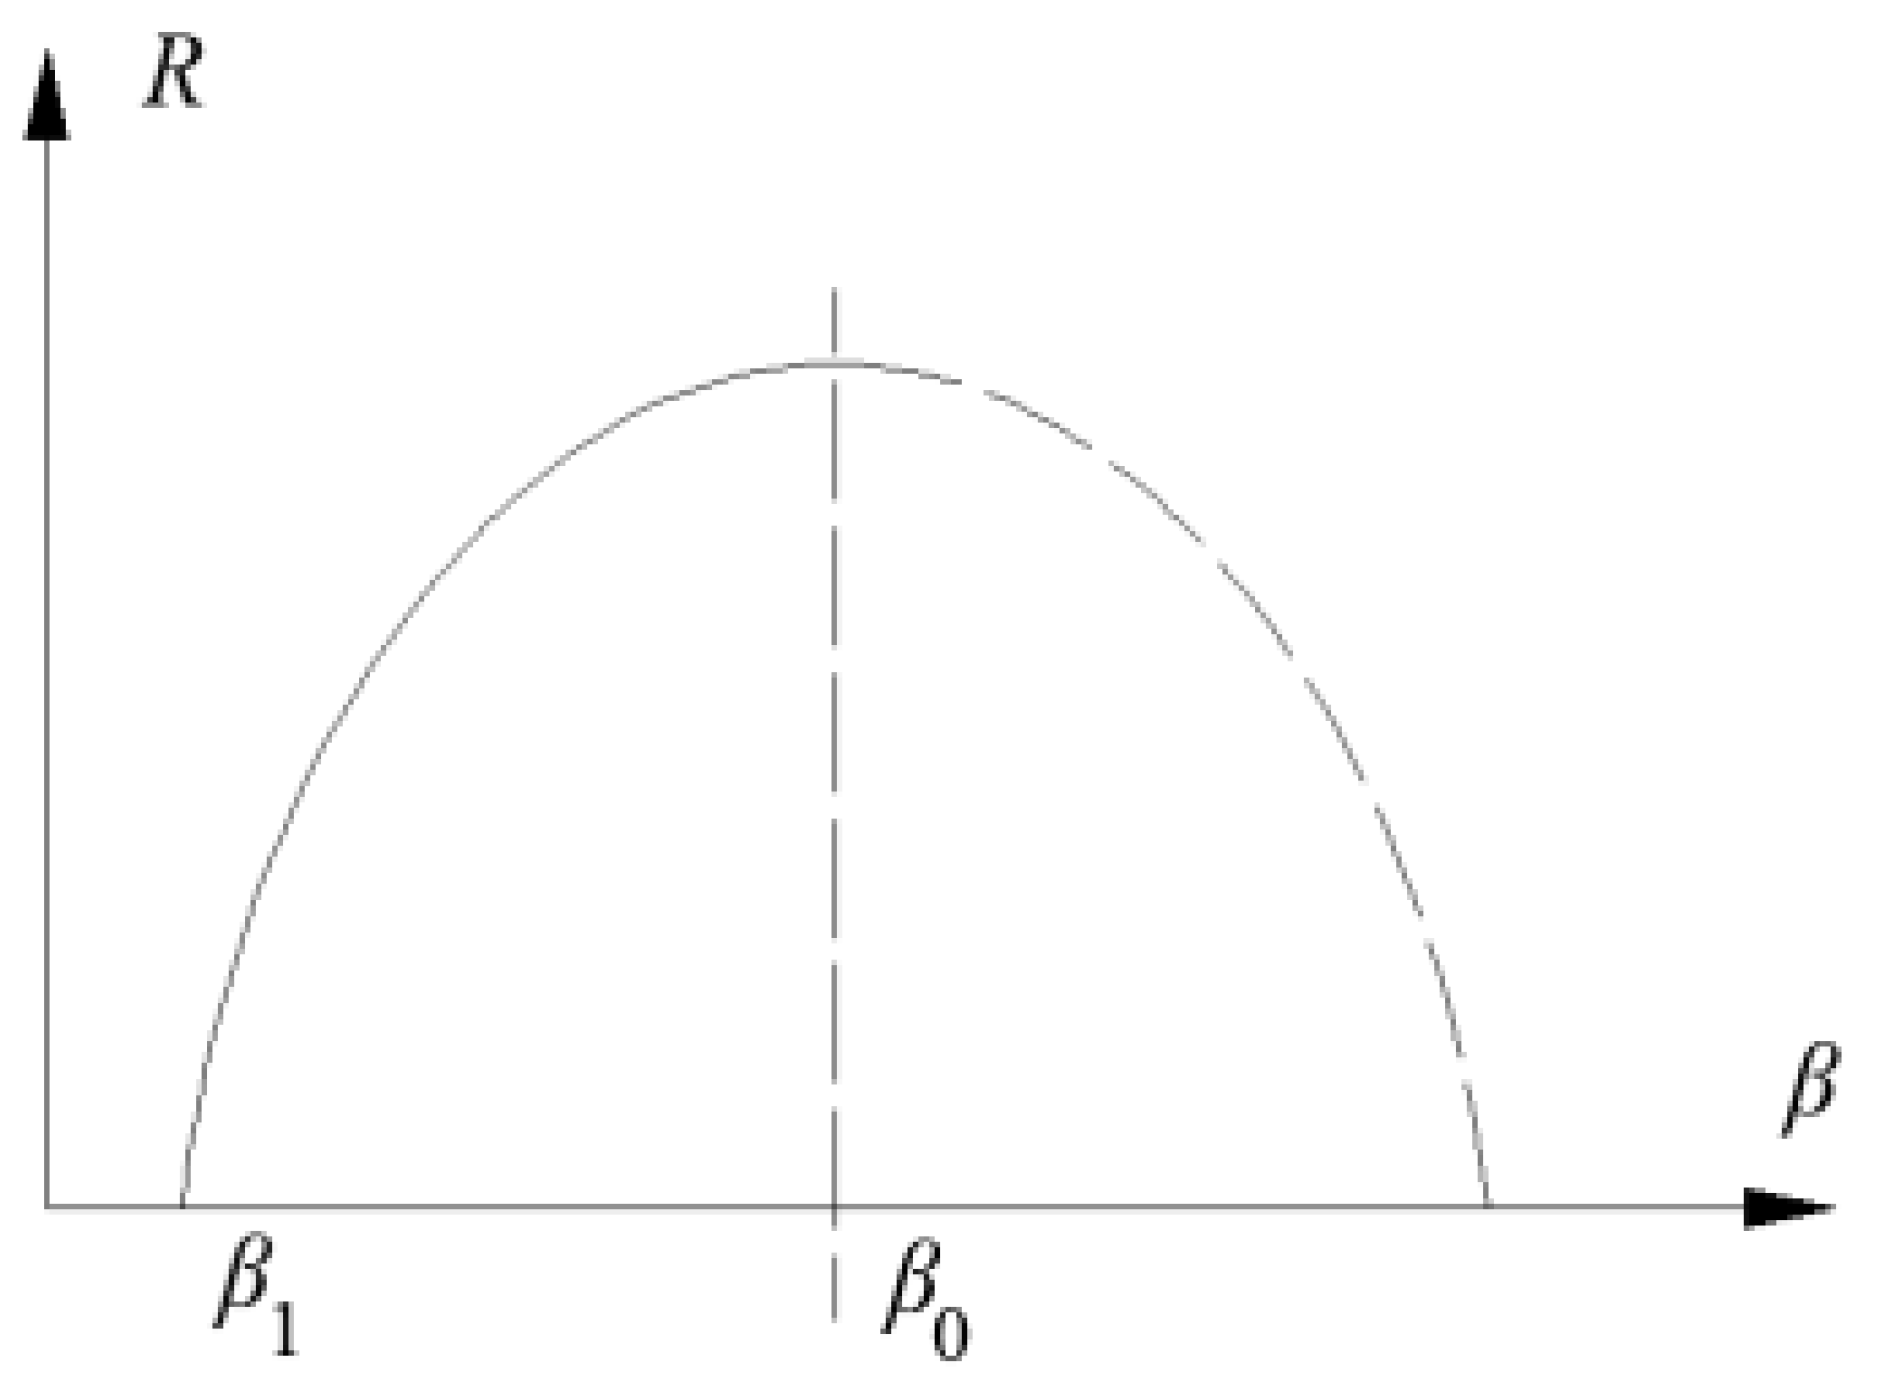
In terms of a specific and given structure, supposing the length is , the bending stiffness is , and the ultimate bending moment is . The average value and standard deviation of the bending moment are and . The mathematical expression of structural reliability index is shown in Equation (15), and the mathematical expression of structural robustness evaluation index can also be shown in Equation (16). The corresponding diagram is also supplemented and shown in Figure 1 (, the vertex coordinate corresponding to the axis of symmetry is the maximum of the parabola).
In Figure 1, the parabolic function is expressed with an independent variable () and dependent variable (). The structural robustness evaluation index () increases with the increase of structural reliability index (). The mathematical relation model of structural robustness evaluation index and structural reliability index is then established.
3.2. Effect of Structural Damage, Random Variation Factor, and Sensitivity
Most of the building and civil structures will suffer different damage effects after a long-term service, and these will also be affected by different randomvariation factors. The study on damage effects and random variation effects for structural robustness and structural reliability plays an important role in the normal service of in-service structures. Moreover, different sensitivities can also be employed for the further decision-making of different evaluation indexes.
Supposing and are the random variation coefficients of the ultimate bending moment and the external load effect of structural member or element. is the structural damage effect. The mathematical expressions are shown as follows:
Substituting Equations (17) and (18) into Equation (12), the mathematical expression of structural reliability index is shown as follows:
Substituting Equation (19) into (14), the mathematical expression of structural robustness evaluation index is shown as follows:
Making the derivation of the mean value of the ultimate bending moment in Equations (19) and (20), the sensitivity of structural robustness evaluation index and structural reliability index can then be further calculated.
4. Two Case Studies
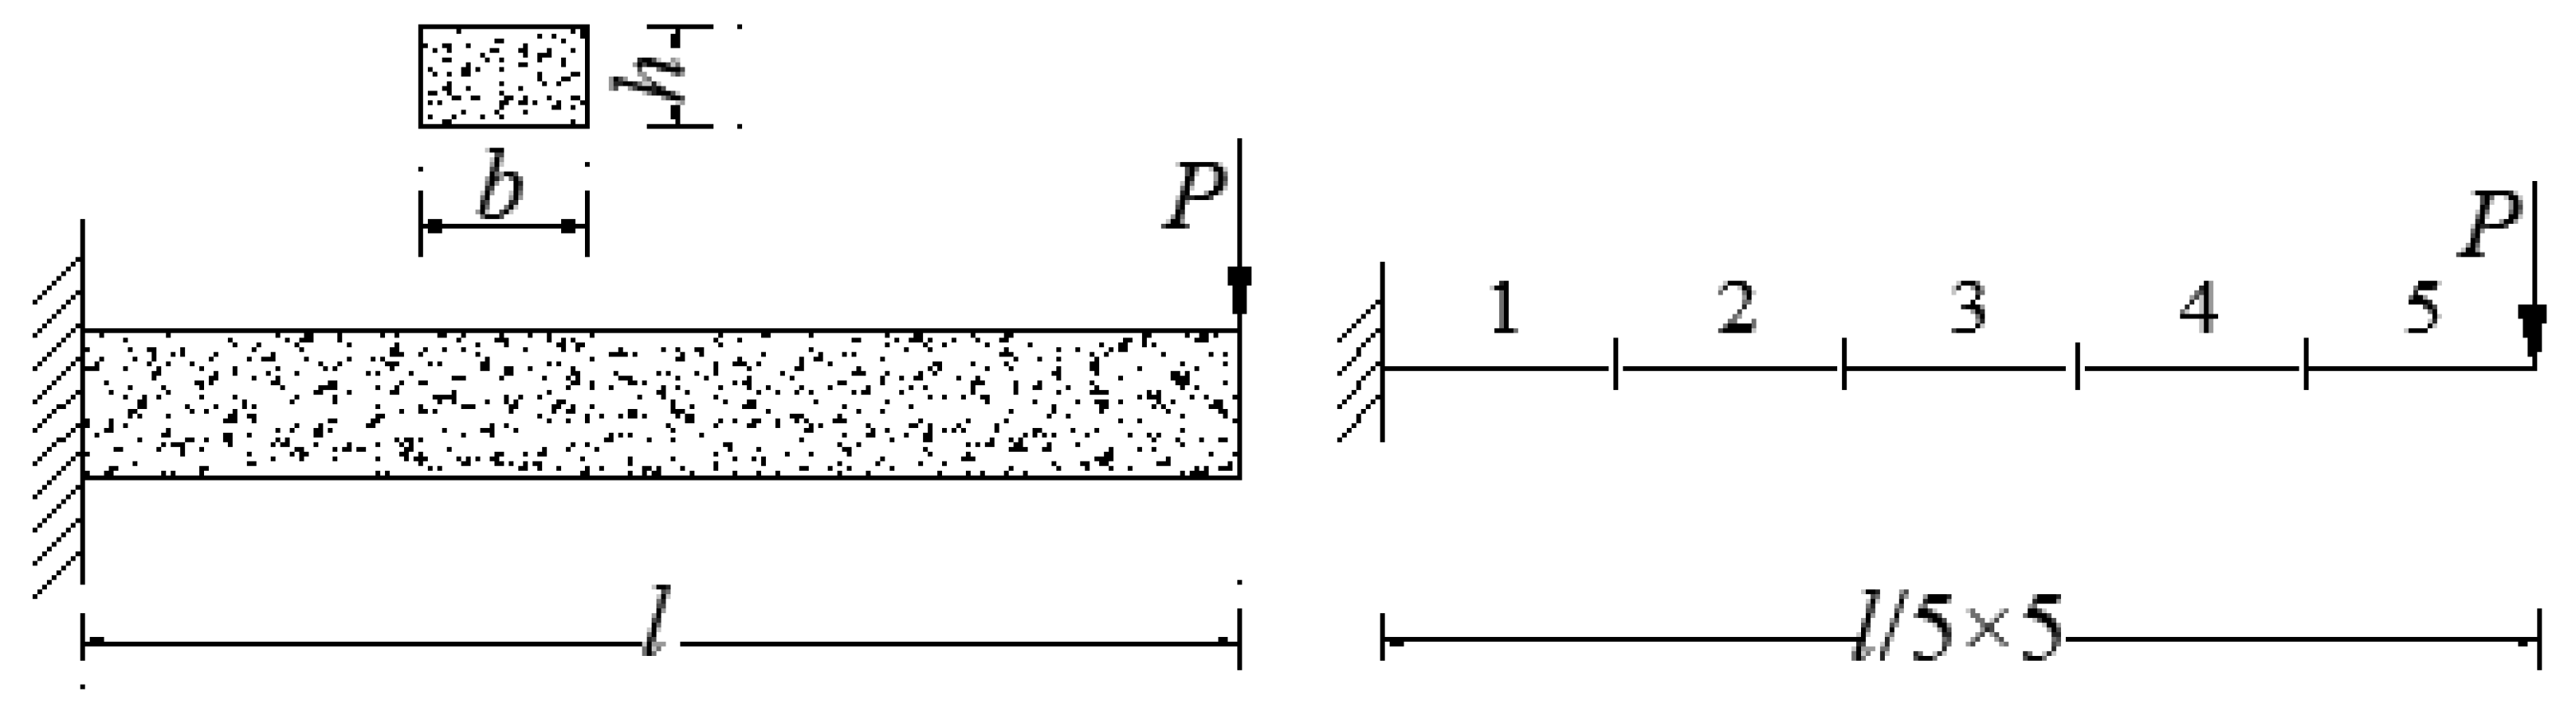
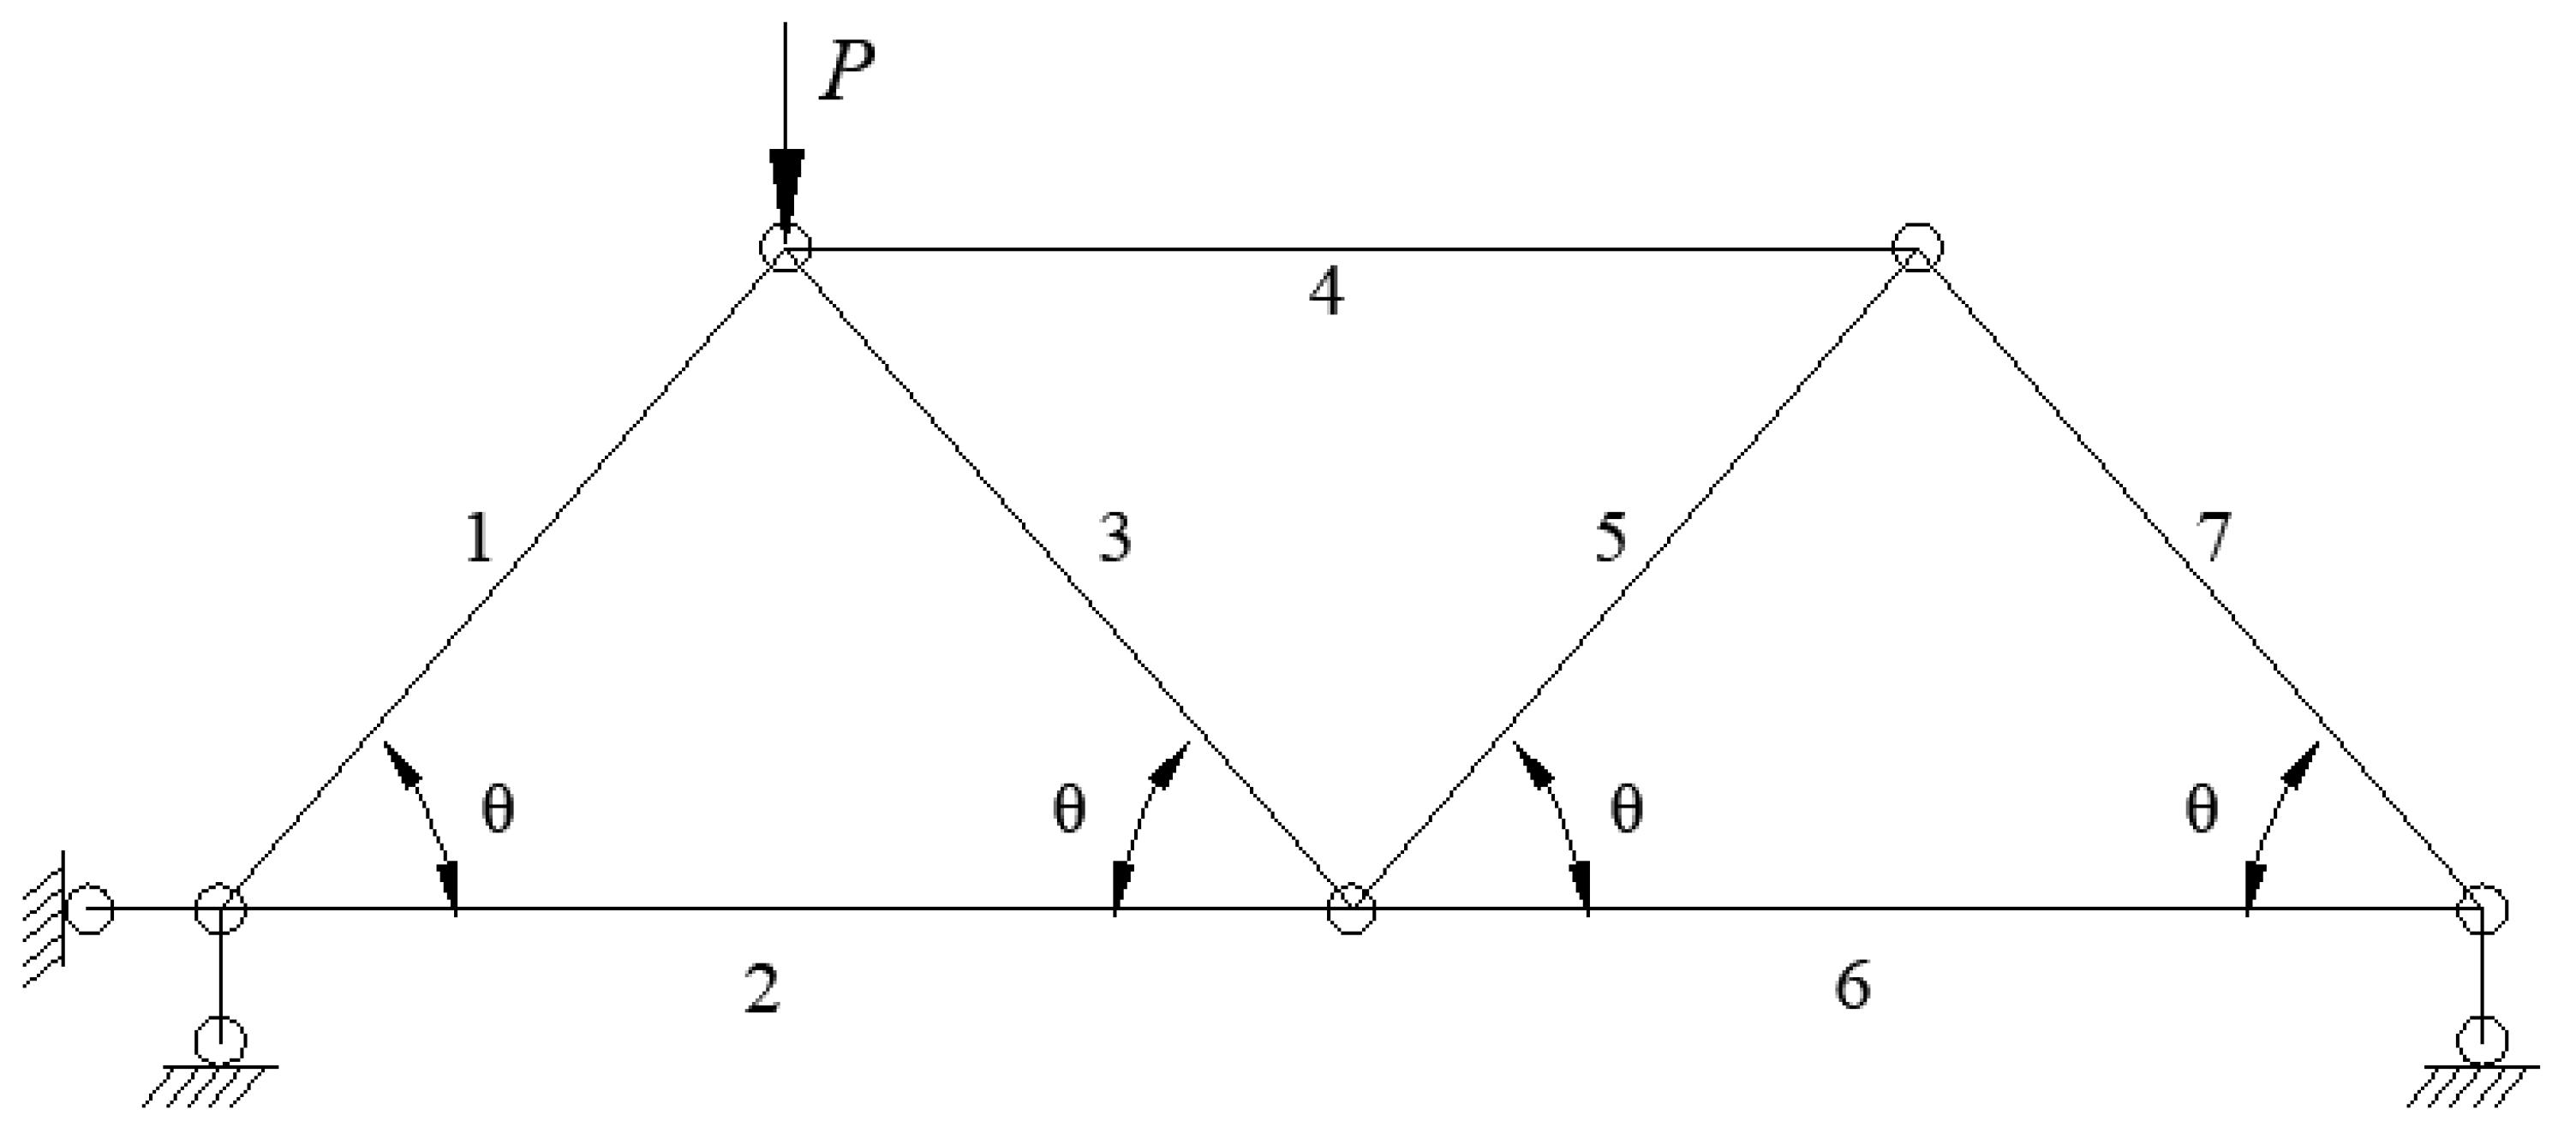
In this section, we take a rectangular cross-section cantilever beam subjected to the external load effect as an example ( and are the width and height). The beam is discretized into five elements, the strength is uniform distribution along with the rod length , and the random variables are assumed as normal distribution (Figure 2). , , , and . The ultimate bending moment of the cross-section is . The variation coefficient of the designed section resistance and external load effect is 0.1. Moreover, a truss beam subjected to the external load effect is also taken as another example (). The random variables are assumed as normal distribution (Figure 3). The length of the horizontal and inclined member is and . , and . The ultimate tension resistance of members 3 and 5 is . The ultimate tension resistance of the rest members is . The variation coefficient of resistance (, ) and external load effect () is 0.0625 and 0.1.
4.1. Verification for Mathematical Relation Model
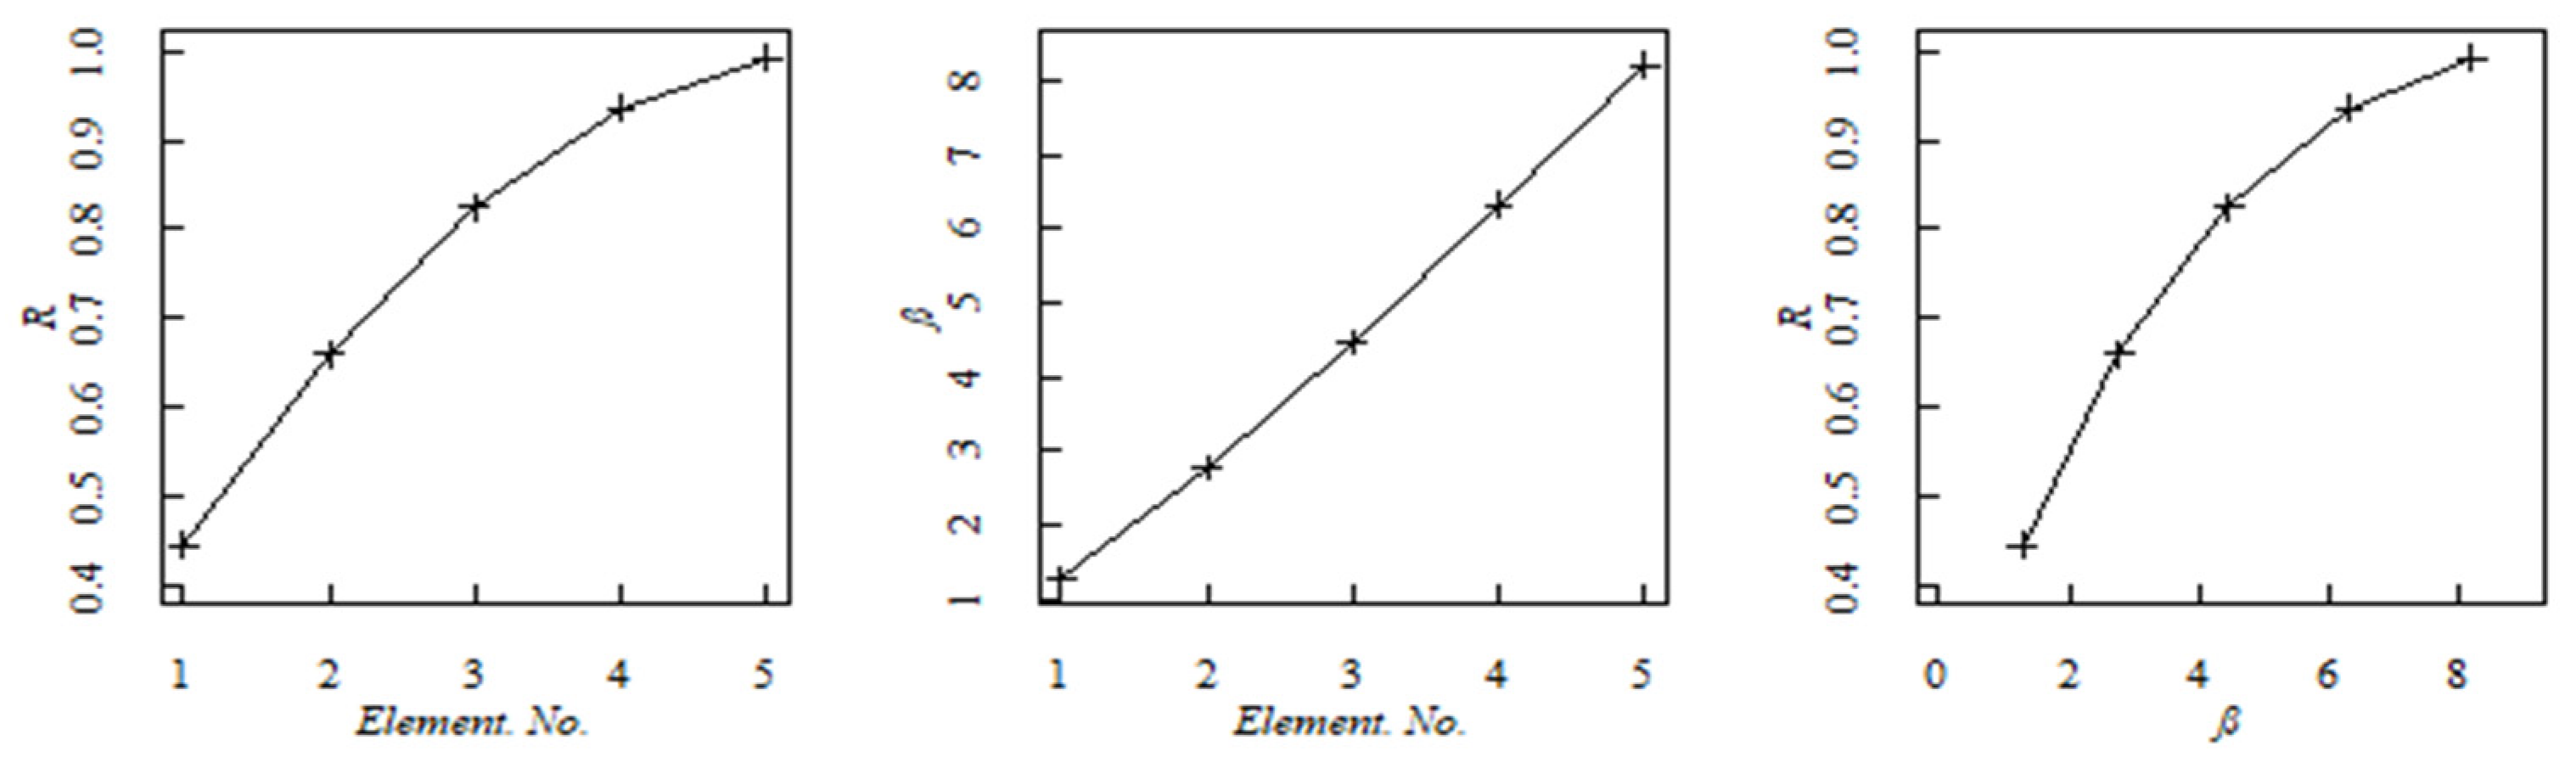
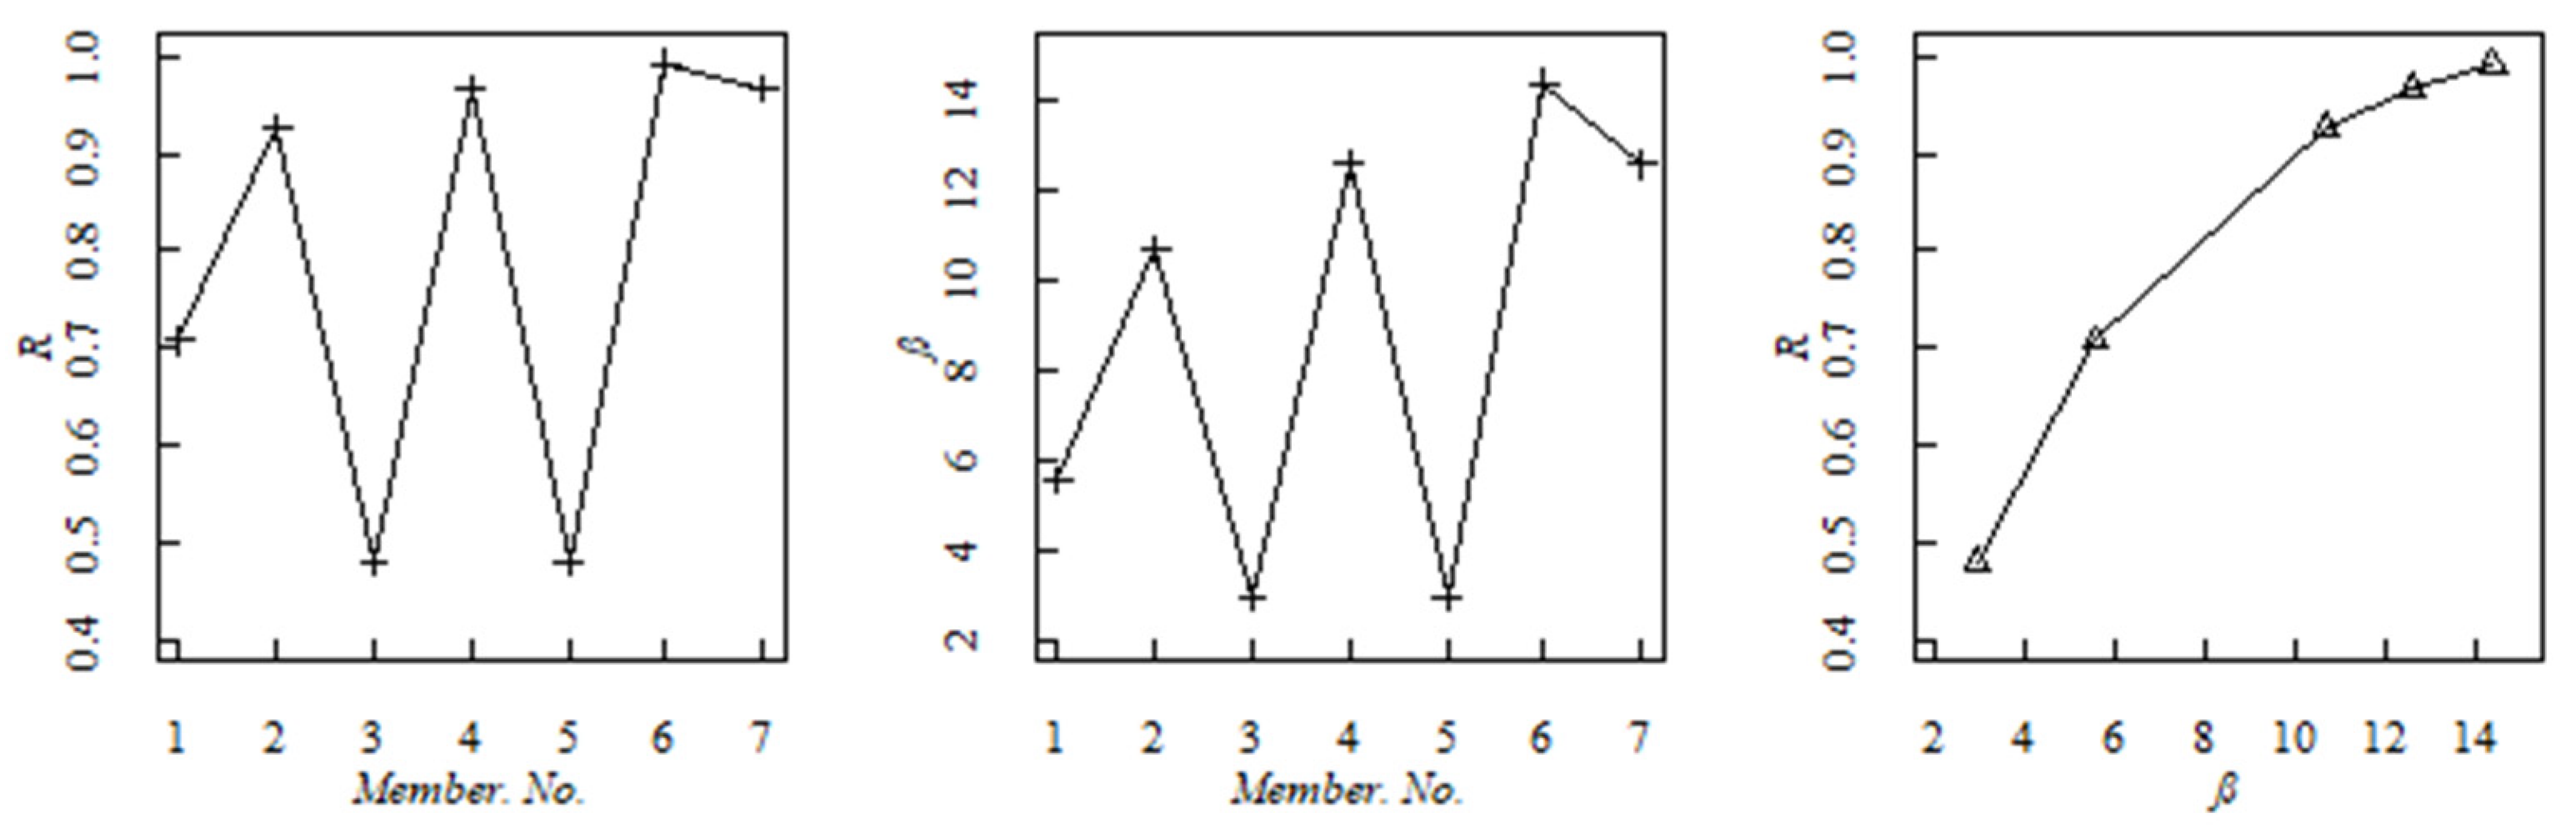
The mathematical expressions of structural robustness evaluation index and structural reliability index with consideration of the ultimate bending moment effect are shown in Equations (21) and (22) (, representing different elements of the cantilever beam, and are the constant terms). The mathematical expressions of structural robustness evaluation index and structural reliability index by considering the ultimate axial force effect are shown in Equations (23) and (24) (, representing the member number of the truss beam, and are the constant terms). Structural robustness evaluation index, structural reliability index, and the fitting curves of the cantilever beam and the truss beam subjected to the external load effect are shown in Figure 4 and Figure 5.
In Figure 4, with consideration of the external load effect , a significant parabolic increase trend for structural robustness evaluation index is observed, while the structural reliability index almost has a linear increase trend. A consistent variation tendency is also observed for structural robustness evaluation index and structural reliability index. Element 1 (the fixed end) has the smallest structural robustness and structural reliability, while element 5 (the free end) has a significant structural robustness and structural reliability. Figure 5 shows that for different members of the truss beam subjected to the external load effect , a similar variation tendency is observed for structural robustness evaluation index and structural reliability index. Members 3 and 5 have the smallest structural robustness and structural reliability, while member 6 has the significant structural robustness and structural reliability.
This is consistent with traditional mechanical analysis. With respect to the ultimate strain energy of a given member or element, the greater the stress, the greater the strain energy, and the lower the reliability index and structural robustness will be. Local failures will also be noticed when strain energy exceeds the ultimate value (please see the structural reliability index of the cantilever beam in Figure 6). Moreover, structural robustness evaluation index increases with the increase of structural reliability index. A parabolic variation curve for structural robustness evaluation index and structural reliability index is also fitted. The structural robustness evaluation index is regarded as a variable, and the structural reliability index is regarded as an independent variable.
4.2. Effect of Structural Damage and Random Variation Factor
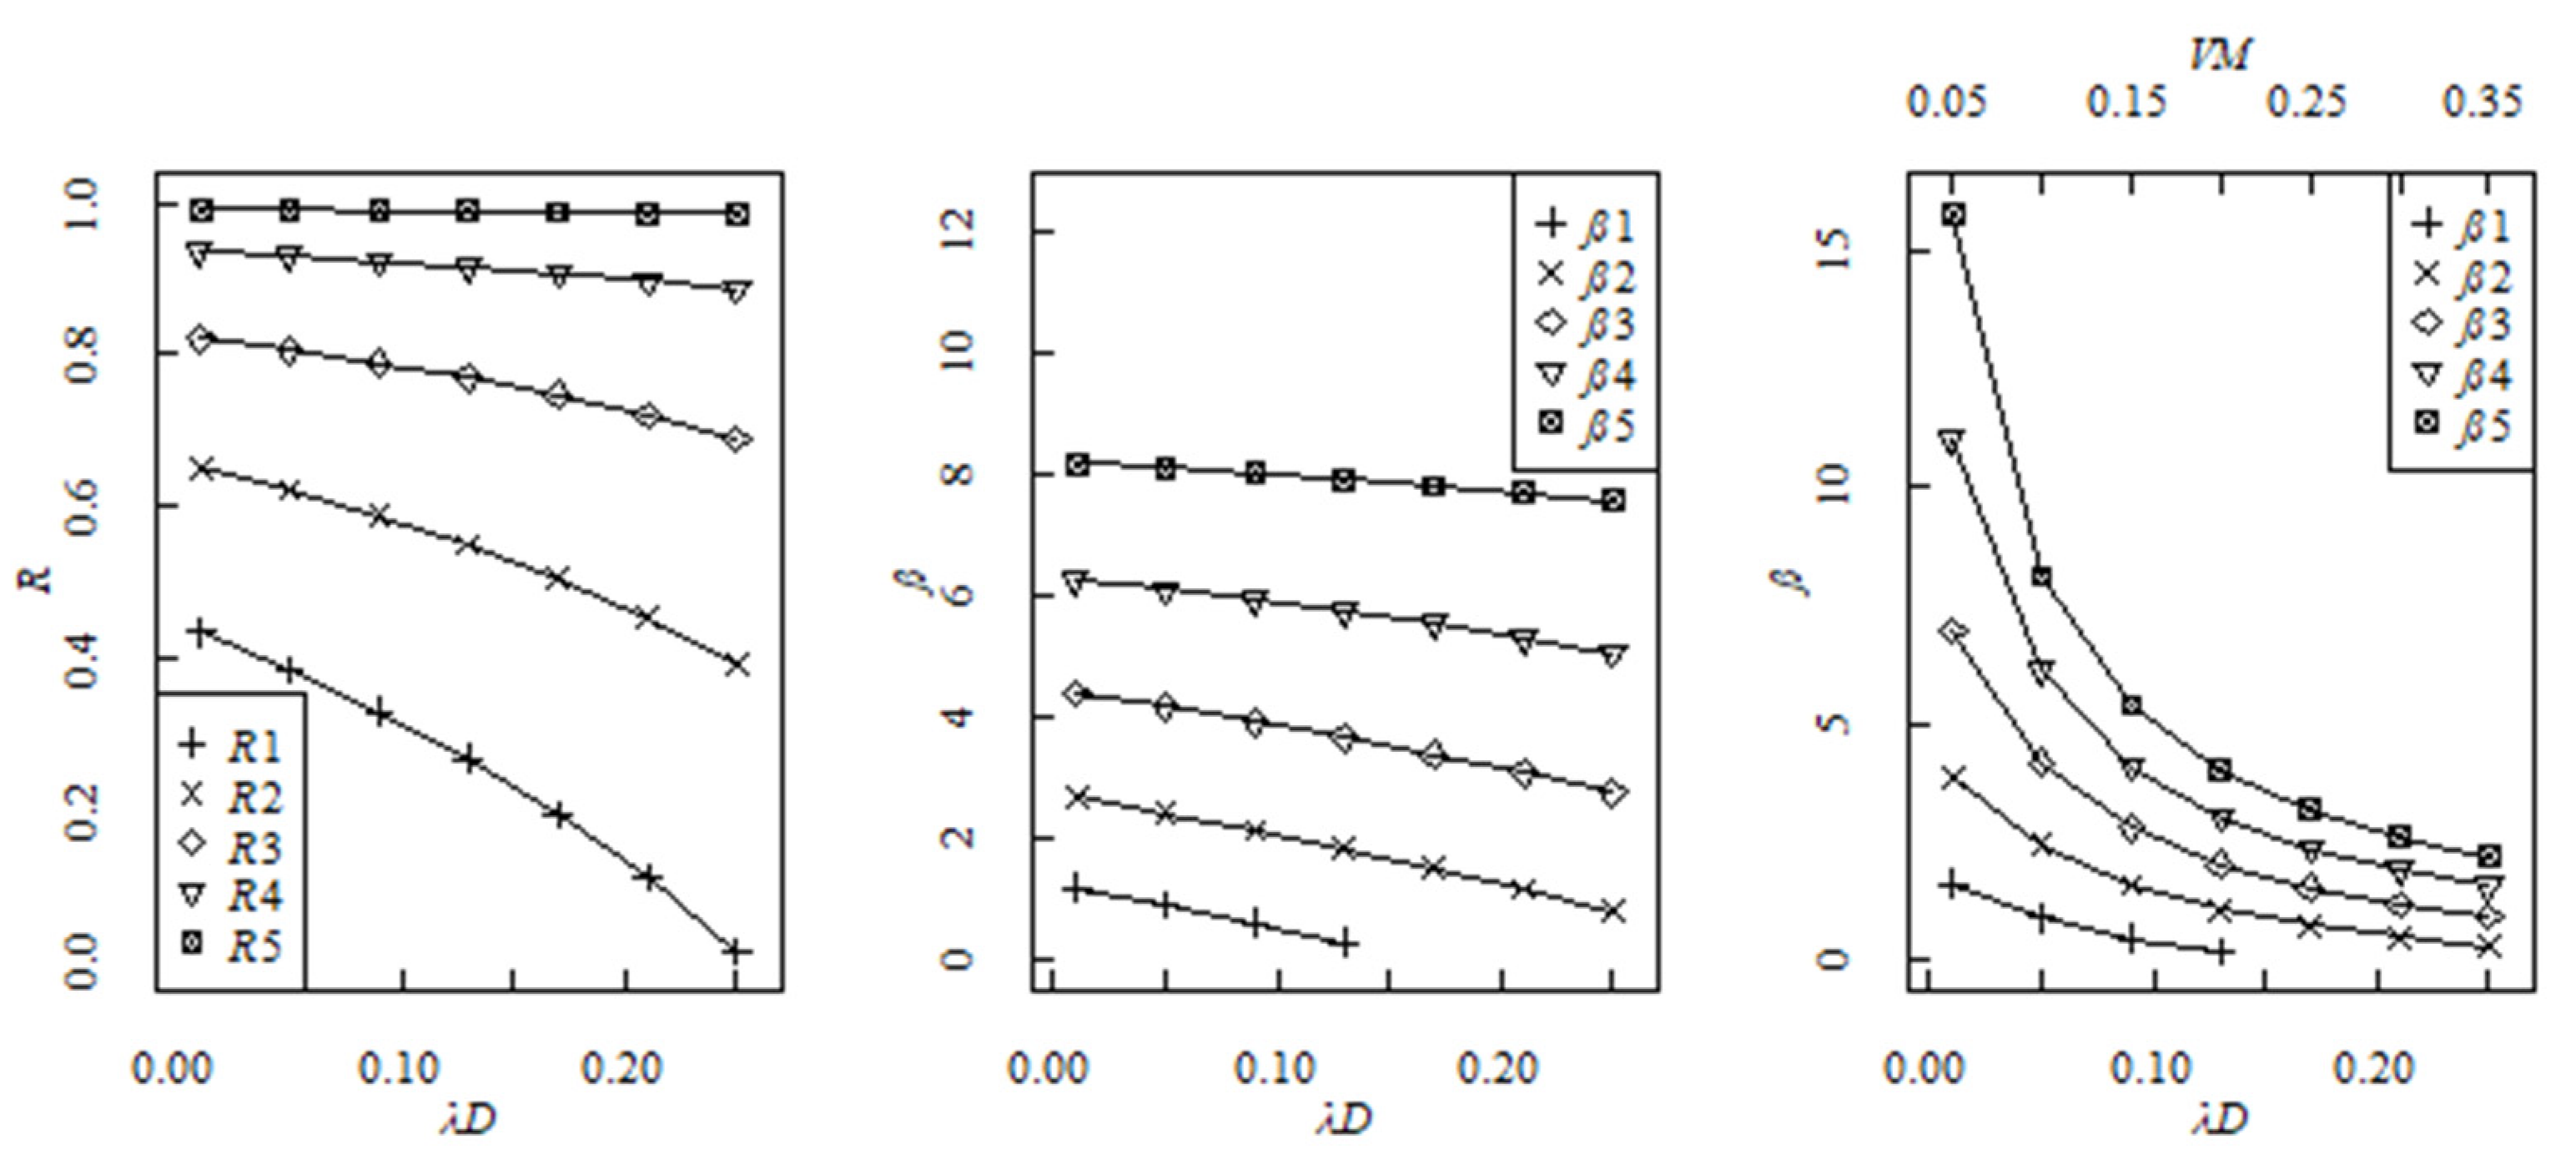
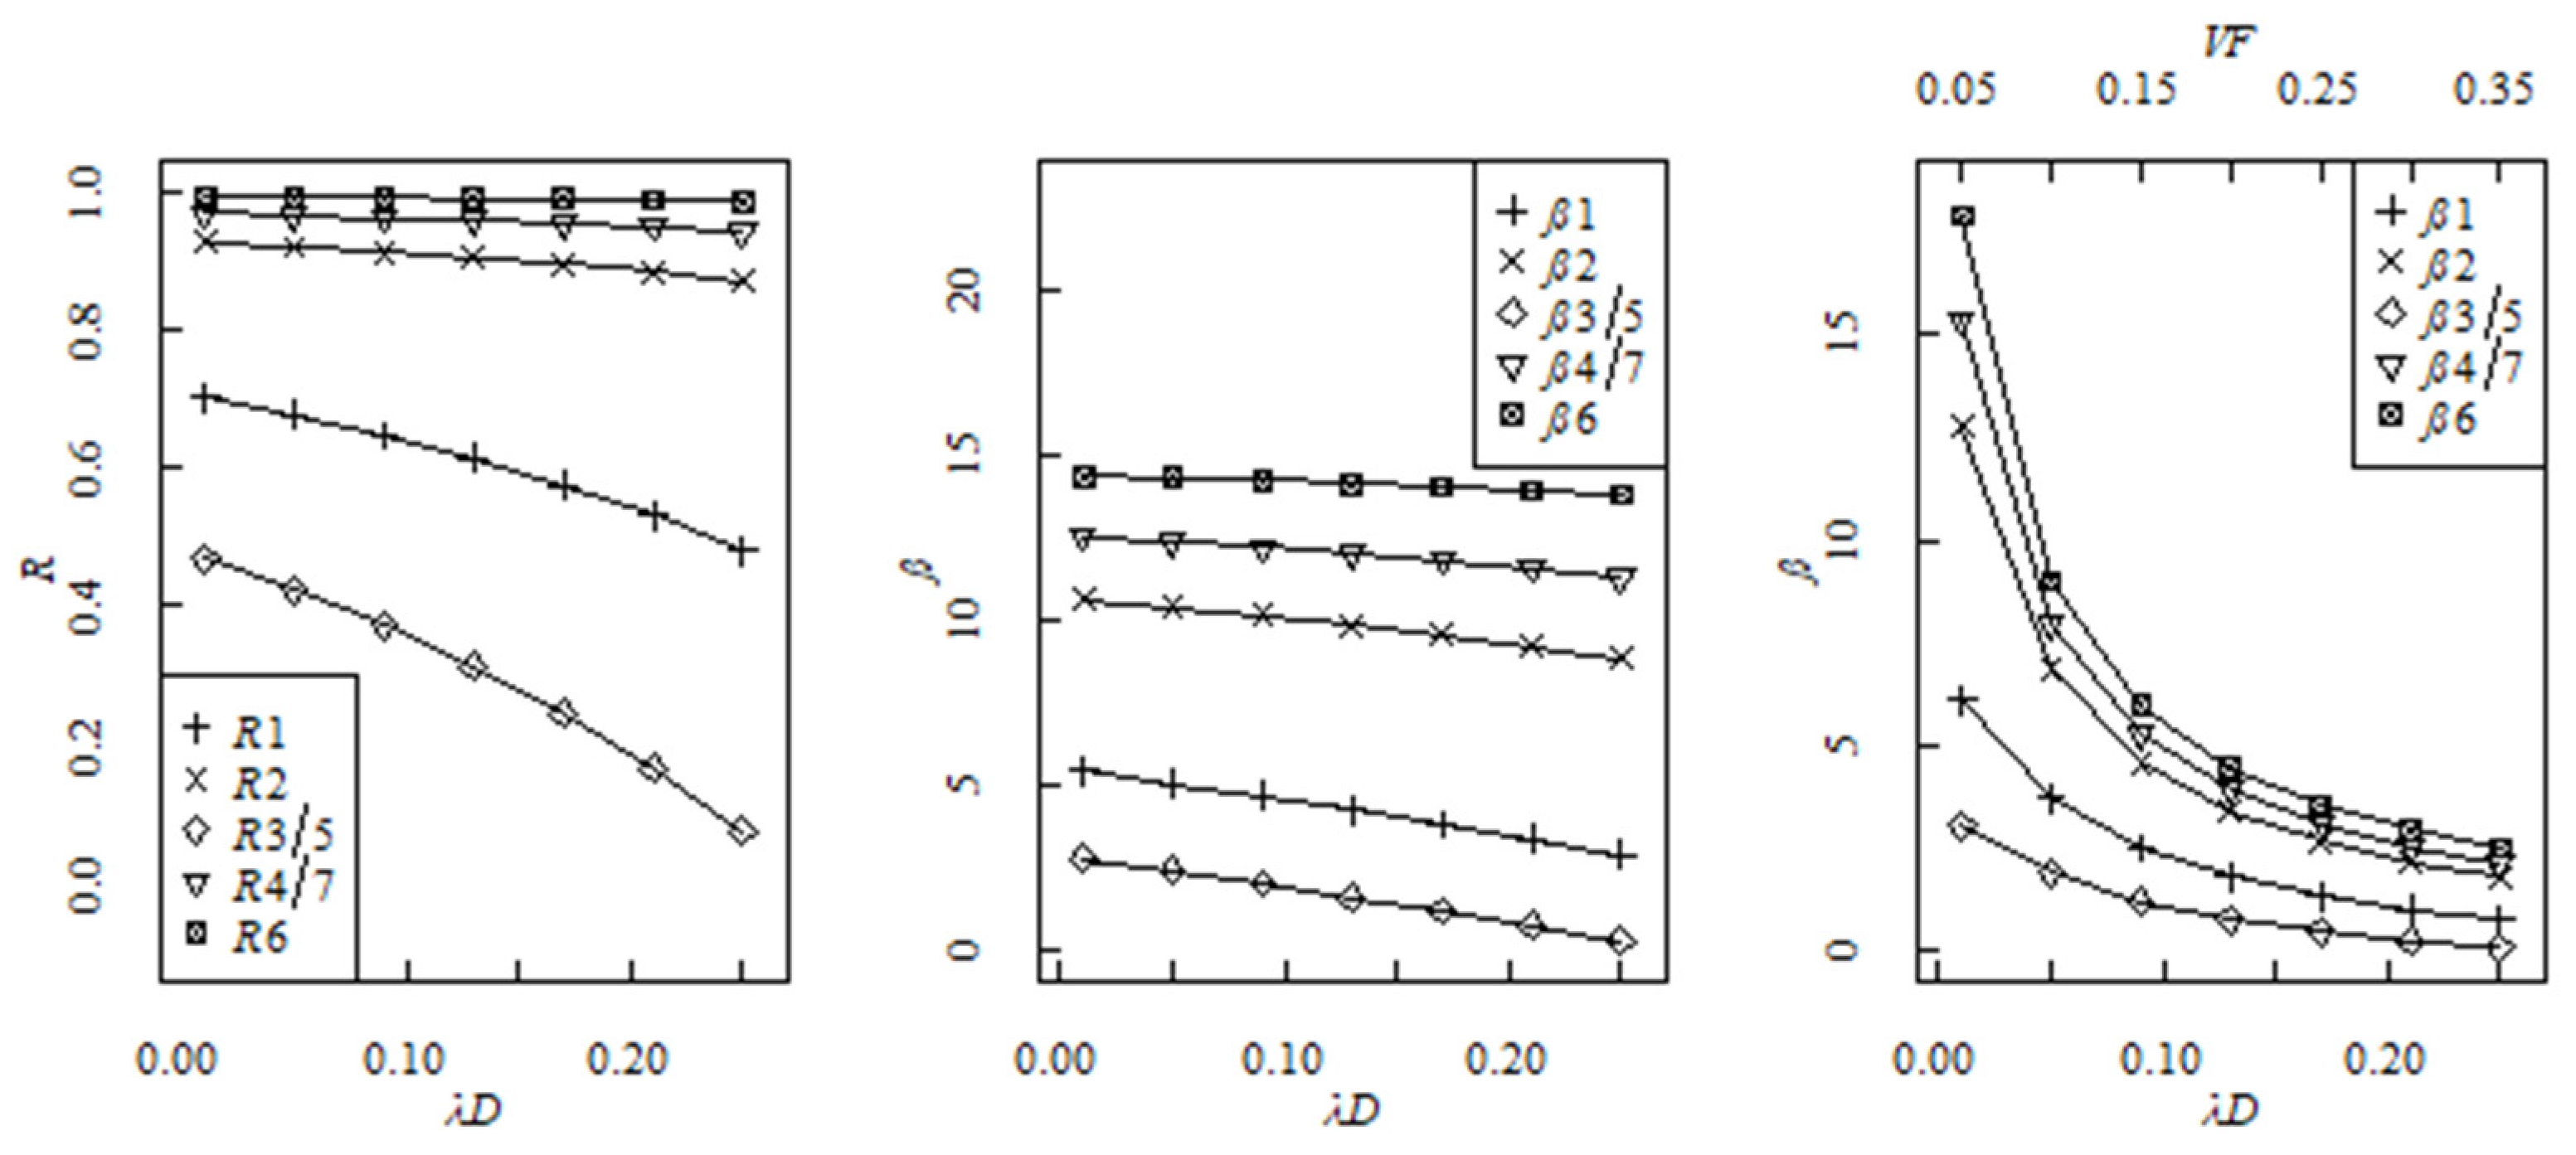
Supposing (0.01, 0.05, 0.09, 0.13, 0.17, 0.21, 0.25) and (0.05, 0.10, 0.15, 0.20, 0.25, 0.30, 0.35) are structural damage and random variation coefficients. With consideration of structural damage and random variation factor, the structural robustness evaluation index and structural reliability index of different elements of the cantilever beam and the truss beam are shown in Figure 6 and Figure 7 ( is less than 0, which means the failure of the discrete element).
Figure 6 and Figure 7 indicate that affected by different damage effects, the variation curves of structural robustness evaluation index and structural reliability index show a decreasing trend. In terms of the cantilever beam, element 1 (the fixed end) has the smallest structural robustness and structural reliability, while element 5 (the free end) has a significant structural robustness and structural reliability index. As for the truss beam, members 3 and 5 have the smallest structural robustness and structural reliability, while member 6 has a significant structural robustness and structural reliability. Only part of the curve of structural robustness is of parabola variation. It is reflected that the damage effect only has a limited influence on structural robustness and structural reliability.
With the joint effect of structural damage and random variation factor, a significant decline tendency is observed for structural reliability index, and then the variation tendency tends to be stable gradually.The complexity of the joint effect of structural damage effect and random effect should be worthy of our attention. Specifically, according to the variation trend of structural reliability index, three kinds of damage stages can also be further developed, including mild impairment, moderate impairment, and severe impairment. In the mild impairment stage ( and ), the numerical value of structural reliability index differs significantly from each other. As for the moderate impairment stage ( and ), the difference of the numerical value of structural reliability index is getting smaller and smaller. Along with the service time increase, it can be expected that the degree of structural damage will continue to increase (i.e., ), and this is the severe impairment.
Moreover, in the mild impairment stage, the reliability index of the truss beam is still at a higher level. A gradual decline for the reliability index of the truss beam can also be observed in the moderate impairment stage. While in the severe impairment stage, structural robustness and structural reliability decrease significantly and gradually become stable. Some local failures can also be further observed. Taking the structural reliability index of the cantilever beam case study in Section 4 as an example, when the structural damage effect () is greater than 0.15, is observed to be negative. This means that the cantilever beam will be accompanied by local failure.
4.3. Sensitivity Analysis
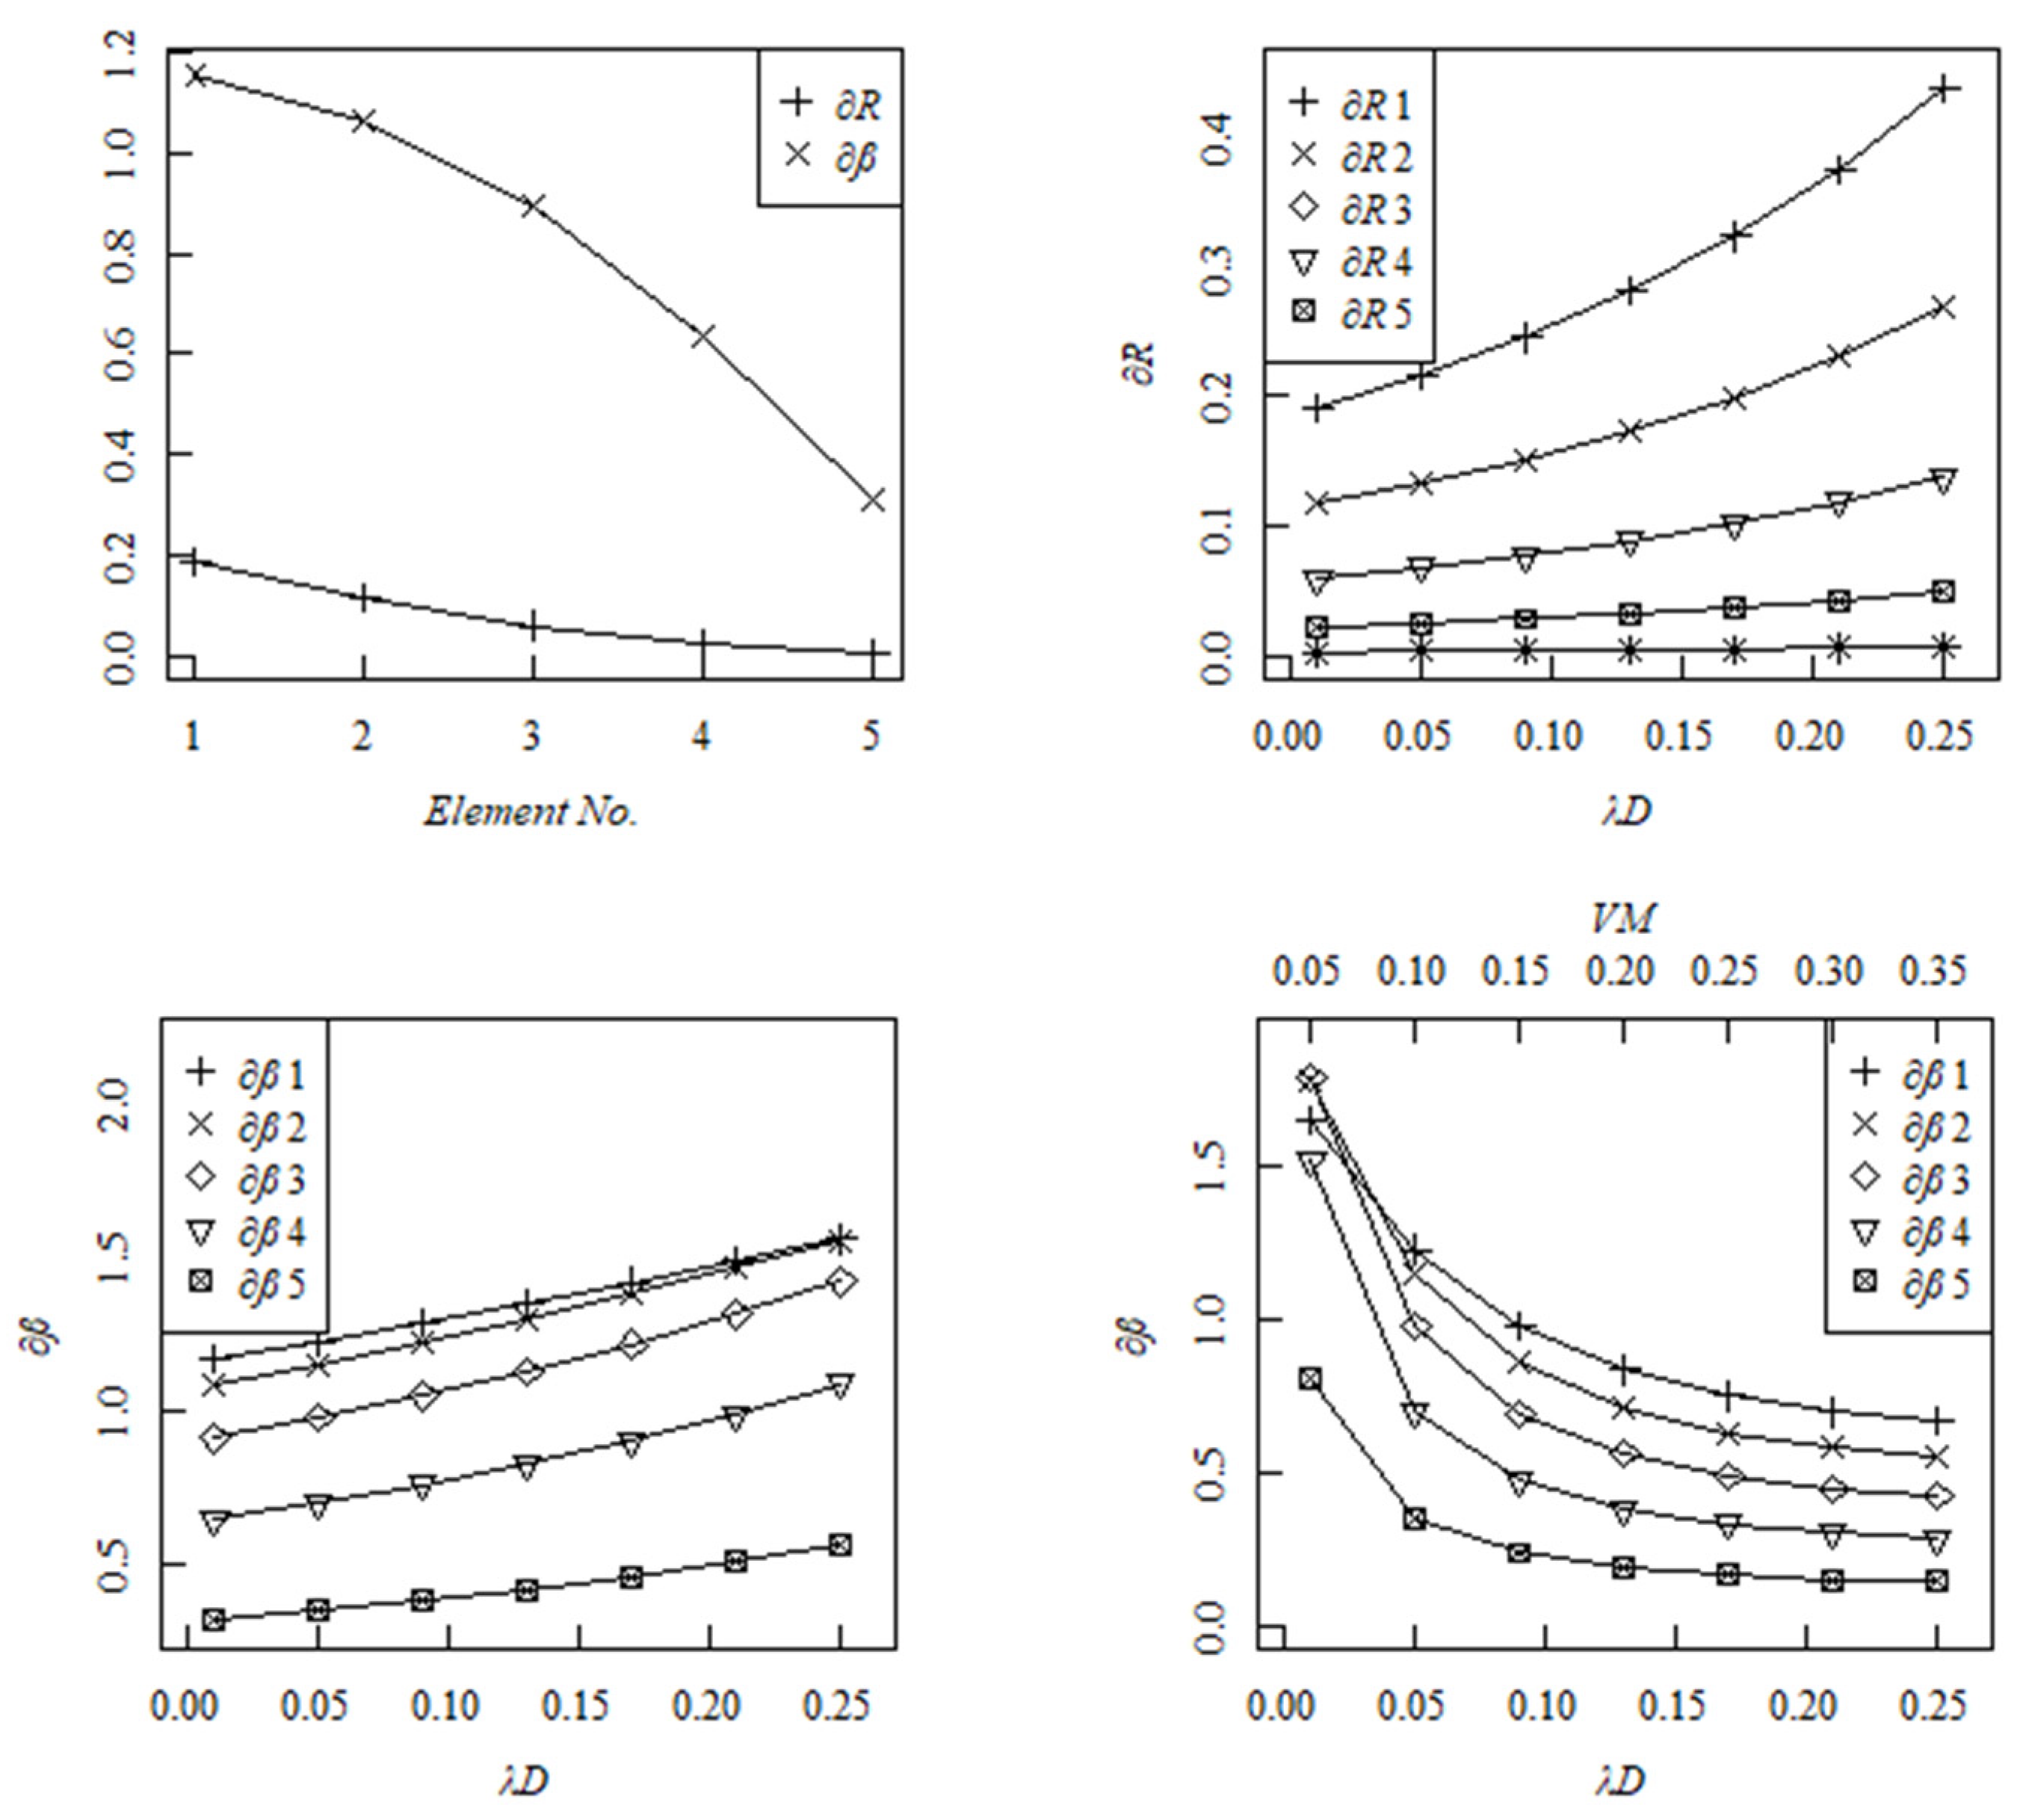
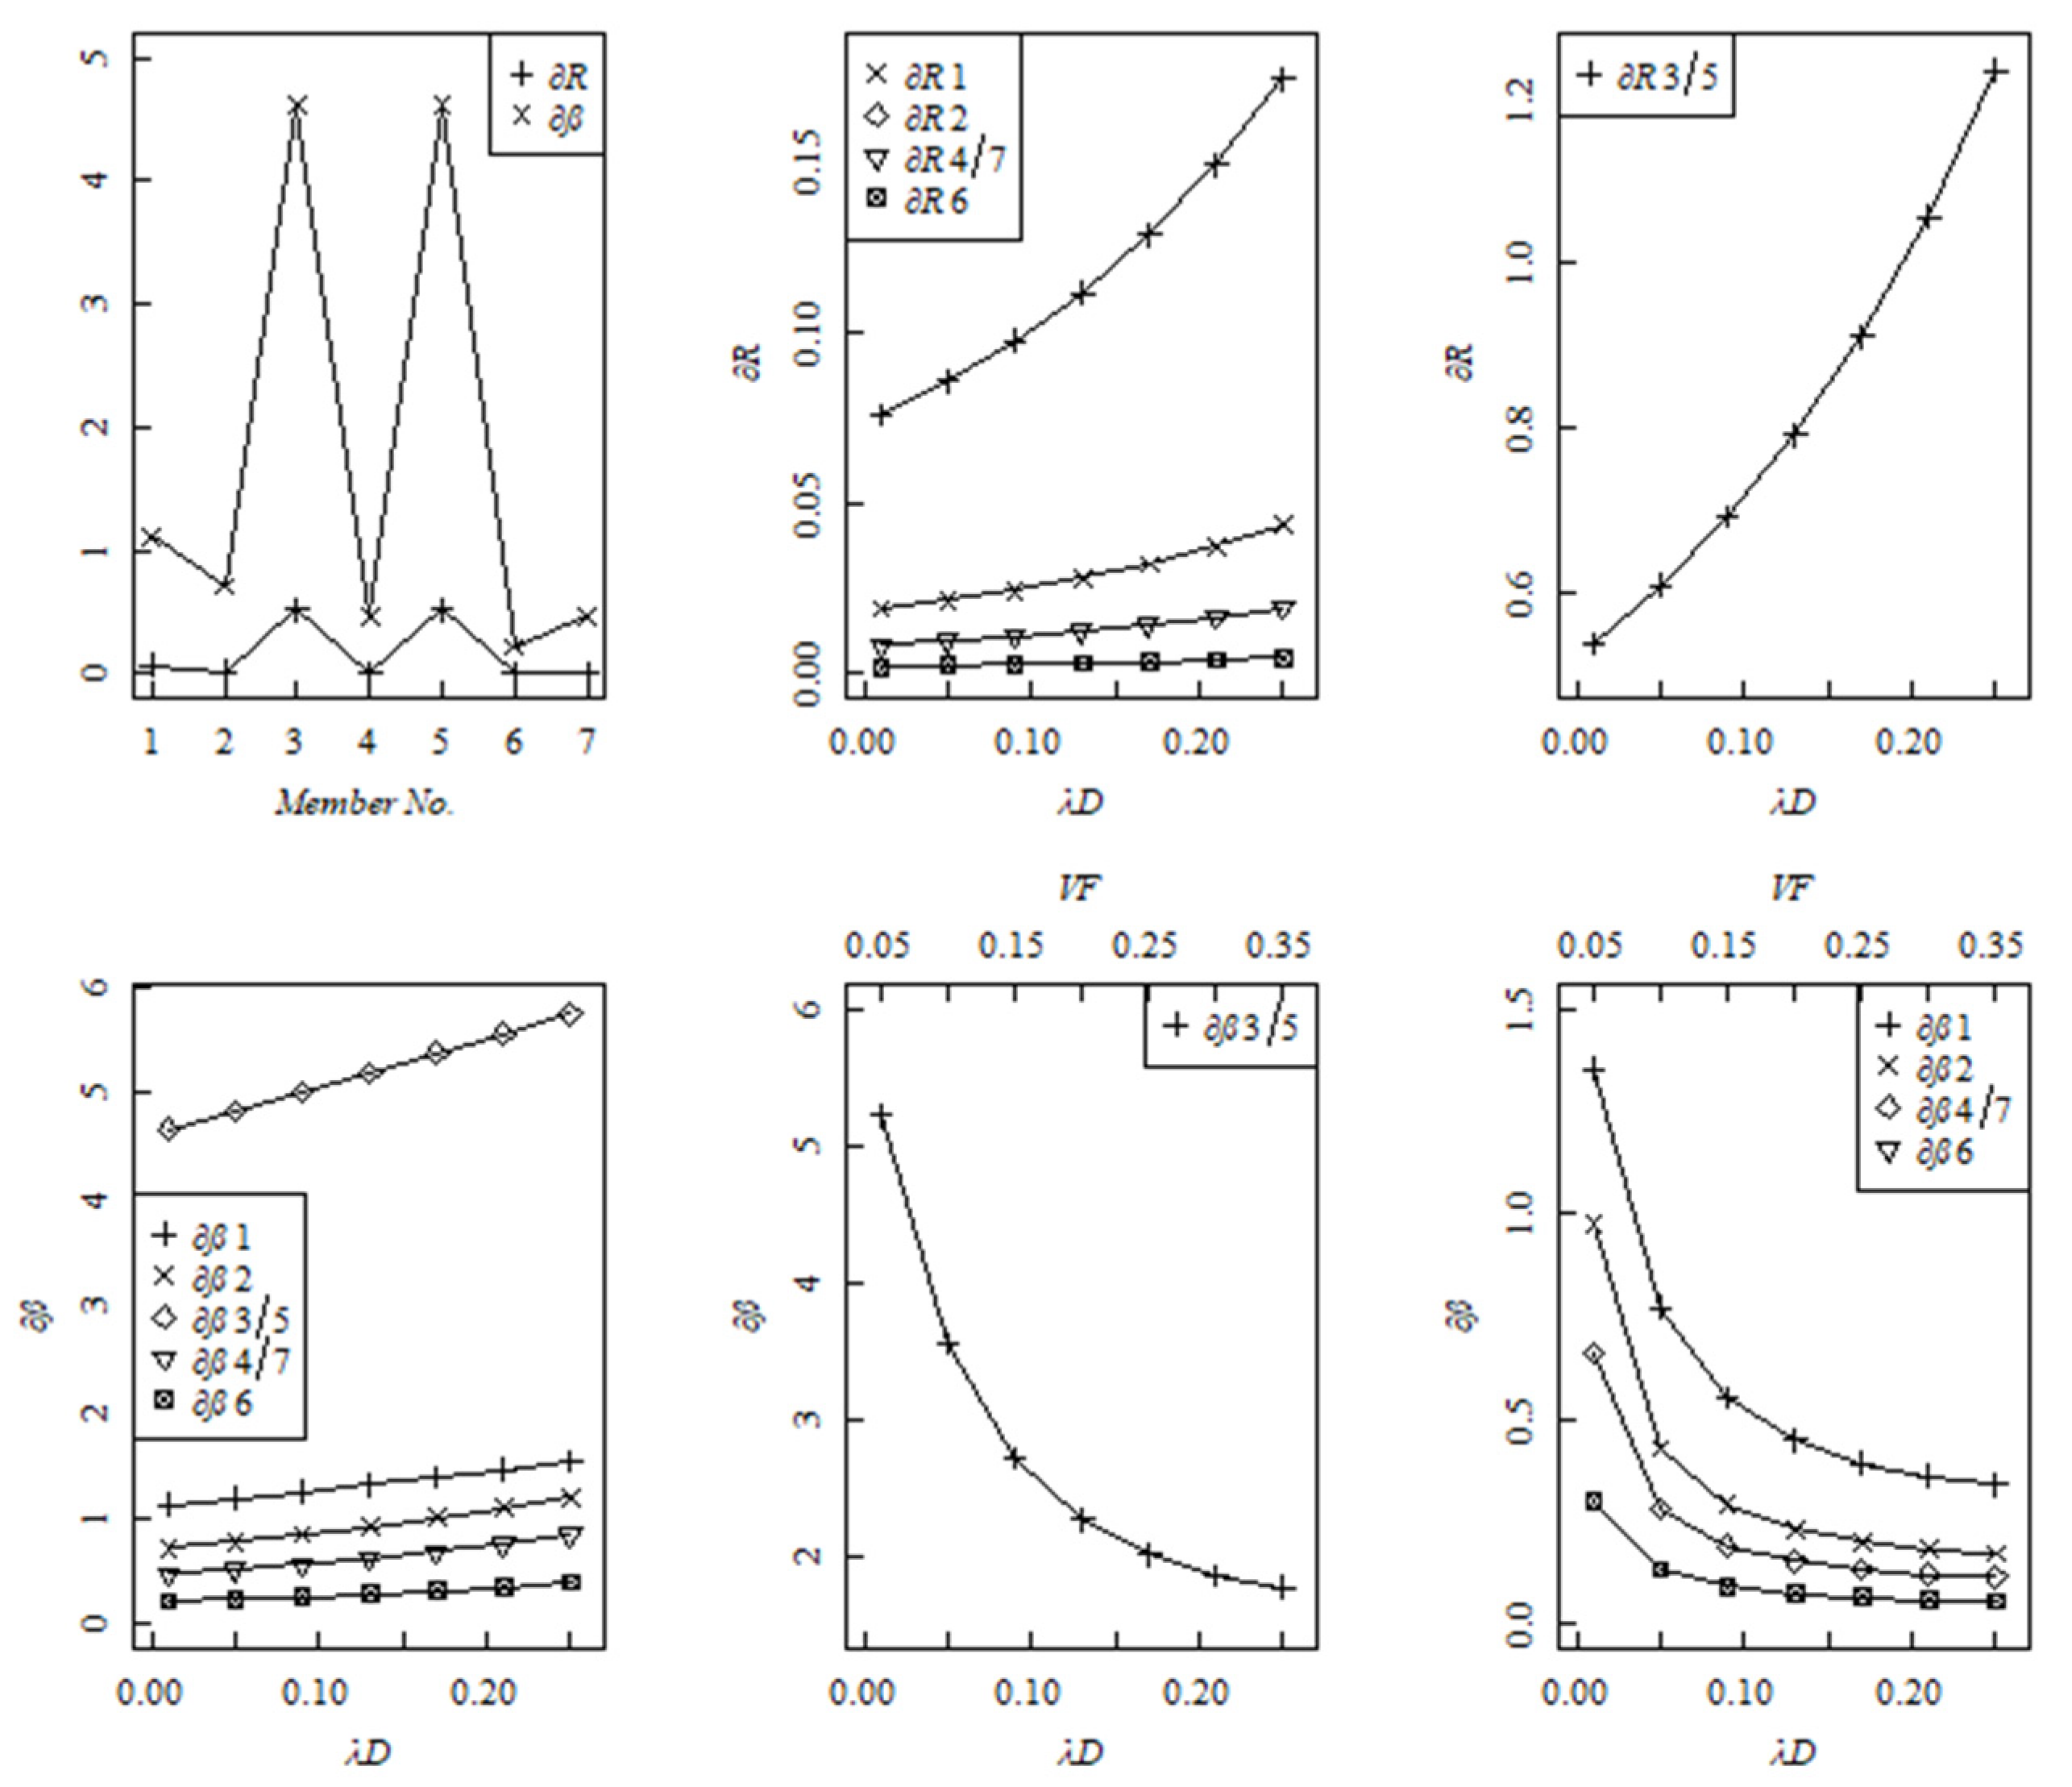
In this section, (0.01, 0.05, 0.09, 0.13, 0.17, 0.21, 0.25) and (0.05, 0.10, 0.15, 0.20, 0.25, 0.30, 0.35) are still taken as the structural damage and random variation coefficients. Making the derivation of the mean value of the ultimate bending moment in Equations (21) and (22), as well as the ultimate axial force and its’ mean value in Equations (23) and (24). The sensitivities of structural robustness evaluation index and structural reliability index of the cantilever beam and the truss beam with consideration of structural damage and random variation factor can be shown in Figure 8 and Figure 9.
According to Figure 8 and Figure 9, the sensitivity of structural robustness evaluation index is overall smaller than the sensitivity of structural reliability index. In regards to the cantilever beam, both of them fall from the fixed end to the free end. As for the truss beam, members 3 and 5 have the largest sensitivity while member 6 has the smallest sensitivity. Affected by different damage effects (in different damage stages), an increase trend for the sensitivities of structural robustness evaluation index and structural reliability index is also observed. Moreover, with consideration of the joint effect of structural damage and random variation factor, the sensitivity of structural reliability index has a significant decline tendency, and then the variation tendency tends to be stable gradually. The complexity of the joint effect of structural damage effect and random effect should be worthy of our attention.
5. Summary
In this study, theoretical deriving analysis (Section 3) and validation case studies (Section 4) indicate that a new mathematical relation model of structural reliability and structural robustness can be established. A three-stage framework for structural life-cycle maintenance management is further proposed. Details are shown as follows:
The structural robustness evaluation index increases with the increase of structural reliability index. A parabolic curve model between structural robustness evaluation index and structural reliability index is established. The structural robustness evaluation index is regarded as a variable and the structural reliability index is regarded as an independent variable. The structural damage effect has a limited influence on structural robustness evaluation index and structural reliability index, as well as their sensitivities. While with consideration of the joint effect of structural damage and random variation factor, a significant decline tendency for structural reliability index, as well as the sensitivity of structural reliability index is observed. The difference in the numerical value of structural reliability index is also getting smaller and smaller. These new findings can give us a better understanding of structural reliability and structural robustness in different damage stages, as well as allow better decision-making. More attention should also be paid to the structure after a long term of service and even an extended service (severe impairment). As the materials of this kind of structure will suffer different degrees of deterioration, the random influencing factors will increase significantly.
Moreover, a three-stage framework can also be further proposed for structural life-cycle maintenance management by considering the variation trend of the structural reliability index that is affected by different degrees of structural damage (mild impairment, moderate impairment, and severe impairment). The first stage is defined from initial health status to minor injury status. It refers to those structures that have not been in-service for a long time or have not suffered any safety accidents. The structural reliability index is still at a higher level. The second stage can be considered from mild impairment to moderate impairment. In this stage, in-service structures have been in operation for years and even decades. Structural damage and safety accidents can be observed from time to time. A gradual decline in structural reliability index is also observed. The third stage is from moderate impairment to severe impairment. In-service structures, after a long-term service and even extended service, are usually accompanied by different cross-section losses and material deteriorations. Structural robustness and structural reliability will decrease significantly and gradually become stable.
In terms of practical project applications (i.e., in-service bridge SHM sensor measure point arrangement), structural robustness analysis can be carried out firstly. With consideration of different random variation coefficients, structural reliability analysis can also be further employed if necessary. Specifically, it is proposed that either structural robustness or structural reliability analysis can be employed in the first stage. The structural element or member with a smaller structural robustness or structural reliability should be worthy of our attention. Structural robustness can be performed for the second stage. More attention should be paid to the element or member with a smaller structural robustness. While in the third stage, the ultimate status analysis should be carried out. Some reinforcement measures should also be further implanted for the structural element or member with a smaller ultimate tension or pressure.
Author Contributions
Conceptualization, methodology, and software: Z.L., S.-H.H., and Q.-W.J.; validation and writing—original draft preparation: Q.-W.J.; writing—review and editing: Q.-W.J., S.-H.H., and Z.L. All authors have read and agreed to the published version of the manuscript.
Funding
This research was funded by Henan University of Technology, grant number 2019BS047.
Acknowledgments
Support from Hefei University of Technology is gratefully acknowledged.
Conflicts of Interest
The authors declare no conflict of interest.
References
- Lu, N.; Liu, Y.; Beer, M. System reliability evaluation of in-service cable-stayed bridges subjected to cable degradation. Struct. Infrastruct. Eng. 2018, 14, 1486–1498. [Google Scholar] [CrossRef]
- Dey, A.; Miyani, G.; Sil, A. Reliability assessment of reinforced concrete (RC) bridges due to service loading. Innov. Infrastruct. Solut. 2019, 4, 9. [Google Scholar] [CrossRef]
- Domaneschi, M.; Cimellaro, G.P.; Scutiero, G. Disproportionate collapse of a cable-stayed bridge. In Proceedings of the Institution of Civil Engineers—Bridge Engineering; Thomas Telford Ltd.: London, UK, 2019; Volume 172, pp. 13–26. [Google Scholar]
- Ren, W.X.; Jin, Q.W. Structural robustness, redundancy, and vulnerability. J. Harbin Inst. Technol. 2018, 5, 1–10. [Google Scholar]
- Li, L.L.; Li, G.Q.; Lu, Y.; Chen, S.W. A review on the research of robustness of civil structures. Prog. Steel Build. Struct. 2015, 17, 5–17. [Google Scholar]
- Canisius, T.D.G.; Baker, J.; Diamantidis, D. Structural Robustness Design for Practising Engineers; COST Action TU0601 Robustness of Structures: Brussels, Belgium, 2011. [Google Scholar]
- Tur, A.; Tur, V.; Derechennik, S.; Lizahub, A. An innovative safety format for structural system robustness checking. Bud. Arch. 2020, 19, 67–84. [Google Scholar] [CrossRef]
- Neiva, D.; Moreira, V.N.; Matos, J.C.; Oliveira, D.V. Robustness-based assessment of railway masonry arch bridges. In Proceedings of the IABSE Symposium, Vancouver 2017: Engineering the Future; International Association for Bridge and Structural Engineering (IABSE): Zurich, Switzerland, 2017; pp. 2848–2855. [Google Scholar]
- Dagang, L.; Song, P.; Cui, S.; Wang, M. Structural robustness and its assessment indicators. J. Build. Struct. 2011, 11, 44–54. [Google Scholar]
- Jin, Q.W. Application Study on Bridge Structural Health Monitoring with Consideration of Structural Robustness Analysis Energy Method and Data Mining Technology. Ph.D. Thesis, Hefei University of Technology, Hefei, China, 2019. [Google Scholar]
- Domaneschi, M.; Martinelli, L.; Po, E. Control of wind buffeting vibrations in a suspension bridge by TMD: Hybridization and robustness issues. Comput. Struct. 2015, 155, 3–17. [Google Scholar] [CrossRef]
- Zhang, C.; Wang, H. Robustness of the Active Rotary Inertia Driver System for Structural Swing Vibration Control Subjected to Multi-Type Hazard Excitations. Appl. Sci. 2019, 9, 4391. [Google Scholar] [CrossRef] [Green Version]
- Edgell, G.J.; De Vekey, R.C. The Robustness of the Domestic House, Part 1: Compressive Loading Test on Walls; British Ceramic Research Association Ltd: Stoke-on-Trent, UK, 1983; Volume 350, pp. 2–7. [Google Scholar]
- Yu, G. Structural Vulnerability Analysis and Its Application on Bridge Health Monitoring. Ph.D. Thesis, Tongji University, Shanghai, China, 2009. [Google Scholar]
- Agarwal, J.; Blockley, D.I.; Woodman, N.J. Vulnerability of Systems. Civ. Eng. Environ. Syst. 2001, 18, 141–165. [Google Scholar] [CrossRef]
- Andre, J. Structural robustness: A revisit. Struct. Eng. Mech. 2020, 76, 193–205. [Google Scholar]
- Faber, M.H. Robustness of Structures: Final Report of COST Action TU0601; Czech Technical University: Prague, Czech, 2011. [Google Scholar]
- Jen, E. Stable or robust? What’s the difference? Complex 2003, 8, 12–18. [Google Scholar] [CrossRef] [Green Version]
- Baker, J.W.; Schubert, M.; Faber, M.H. On the assessment of robustness. Struct. Saf. 2008, 30, 253–267. [Google Scholar] [CrossRef]
- Sørensen, J.D.; Rizzuto, E.; Narasimhan, H.; Faber, M.H. Robustness: Theoretical Framework. Struct. Eng. Int. 2012, 22, 66–72. [Google Scholar] [CrossRef] [Green Version]
- Domaneschi, M.; Martinelli, L. Earthquake-Resilience-Based Control Solutions for the Extended Benchmark Cable-Stayed Bridge. J. Struct. Eng. 2016, 142, 4015009. [Google Scholar] [CrossRef]
- Okasha, N.M.; Frangopol, D.M. Lifetime-oriented multi-objective optimization of structural maintenance considering system reliability, redundancy and life-cycle cost using GA. Struct. Saf. 2009, 31, 460–474. [Google Scholar] [CrossRef]
- Zhu, B.; Frangopol, D.M. Reliability, redundancy and risk as performance indicators of structural systems during their life-cycle. Eng. Struct. 2012, 41, 34–49. [Google Scholar] [CrossRef]
- Fu, G.; Frangopol, D.M. Balancing weight, system reliability and redundancy in a multiobjective optimization framework. Struct. Saf. 1990, 7, 165–175. [Google Scholar] [CrossRef]
- Pandey, P.C.; Barai, S.V. Structural Sensitivity as a Measure of Redundancy. J. Struct. Eng. 1997, 123, 360–364. [Google Scholar] [CrossRef]
- Frangopol, D.M.; Curley, J.P. Effects of Damage and Redundancy on Structural Reliability. J. Struct. Eng. 1987, 113, 1533–1549. [Google Scholar] [CrossRef]
- Jin, Q.; Liu, Z. In-service bridge SHM point arrangement with consideration of structural robustness. J. Civ. Struct. Health Monit. 2019, 9, 543–554. [Google Scholar] [CrossRef]
- Liu, D.; Sun, L.M.; Yu, G. Vulnerability analysis of a PC continuous girder bridge and optimization of SHM sensor allocation. Highw. Transp. Inn. Mong. 2017, 3, 1–5. [Google Scholar]
- Jin, Q.; Liu, Z. Measure point arrangement strategy for in-service continuous girder bridge SHM with consideration of structural robustness (Special Issue of ICAST 2019). J. Intell. Mater. Syst. Struct. 2021. [Google Scholar] [CrossRef]
- Wu, S.W. Structural Reliability Analysis; Peoples’ Communications Publishing House: Beijing, China, 1990. [Google Scholar]
Figure 1.
Mathematical relation model of structural robustness evaluation index () and structural reliability index ().
Figure 1.
Mathematical relation model of structural robustness evaluation index () and structural reliability index ().

Figure 2.
Cantilever beam subjected to external load effect ().

Figure 3.
Truss beam subjected to external load effect ().

Figure 4.
Structural robustness evaluation index (), structural reliability index (), and the fitting curve of the cantilever beam (Left: vs. Element No., middle: vs. Element No., and right: vs. ).
Figure 4.
Structural robustness evaluation index (), structural reliability index (), and the fitting curve of the cantilever beam (Left: vs. Element No., middle: vs. Element No., and right: vs. ).

Figure 5.
Structural robustness evaluation index (), structural reliability index (), and the fitting curve of the truss beam (Left: vs. Member No., middle: vs. Member No., and right: vs. ).
Figure 5.
Structural robustness evaluation index (), structural reliability index (), and the fitting curve of the truss beam (Left: vs. Member No., middle: vs. Member No., and right: vs. ).

Figure 6.
Different variation trends of structural robustness evaluation index () and structural reliability index () of the cantilever beam subjected to damage effect () and variation factor () (Left: vs. , middle: vs. ,and right: vs. ).
Figure 6.
Different variation trends of structural robustness evaluation index () and structural reliability index () of the cantilever beam subjected to damage effect () and variation factor () (Left: vs. , middle: vs. ,and right: vs. ).

Figure 7.
Structural robustness evaluation index () and structural reliability index () of the truss beam subjected to damage effect () and variation factor () (Left: vs. , middle: vs. , and right: vs. ).
Figure 7.
Structural robustness evaluation index () and structural reliability index () of the truss beam subjected to damage effect () and variation factor () (Left: vs. , middle: vs. , and right: vs. ).

Figure 8.
Different sensitivities of the structural robustness evaluation index () and structural reliability index () of the cantilever beam subjected to damage effect () and variation factor () (Top Left: and vs. Element No., top right: vs. . Bottom left: vs. , bottom right: vs. and ).
Figure 8.
Different sensitivities of the structural robustness evaluation index () and structural reliability index () of the cantilever beam subjected to damage effect () and variation factor () (Top Left: and vs. Element No., top right: vs. . Bottom left: vs. , bottom right: vs. and ).

Figure 9.
Different sensitivities of the structural robustness evaluation index () and structural reliability index () of the truss beam subjected to damage effect () and variation factor () (Top left: and vs. Member No., top middle and right: vs. . Bottom left: vs. , bottom middle and right: vs. and ).

Publisher’s Note: MDPI stays neutral with regard to jurisdictional claims in published maps and institutional affiliations. |
© 2021 by the authors. Licensee MDPI, Basel, Switzerland. This article is an open access article distributed under the terms and conditions of the Creative Commons Attribution (CC BY) license (http://creativecommons.org/licenses/by/4.0/).
Share and Cite
MDPI and ACS Style
Jin, Q.-W.; Liu, Z.; He, S.-H. Investigation on the Mathematical Relation Model of Structural Reliability and Structural Robustness. Math. Comput. Appl. 2021, 26, 26. https://0-doi-org.brum.beds.ac.uk/10.3390/mca26020026
AMA Style
Jin Q-W, Liu Z, He S-H. Investigation on the Mathematical Relation Model of Structural Reliability and Structural Robustness. Mathematical and Computational Applications. 2021; 26(2):26. https://0-doi-org.brum.beds.ac.uk/10.3390/mca26020026
Chicago/Turabian StyleJin, Qi-Wen, Zheng Liu, and Shuan-Hai He. 2021. "Investigation on the Mathematical Relation Model of Structural Reliability and Structural Robustness" Mathematical and Computational Applications 26, no. 2: 26. https://0-doi-org.brum.beds.ac.uk/10.3390/mca26020026