The Inhibitory Effect of Propylene Glycol Alginate Sodium Sulfate on Fibroblast Growth Factor 2-Mediated Angiogenesis and Invasion in Murine Melanoma B16-F10 Cells In Vitro

 and
and 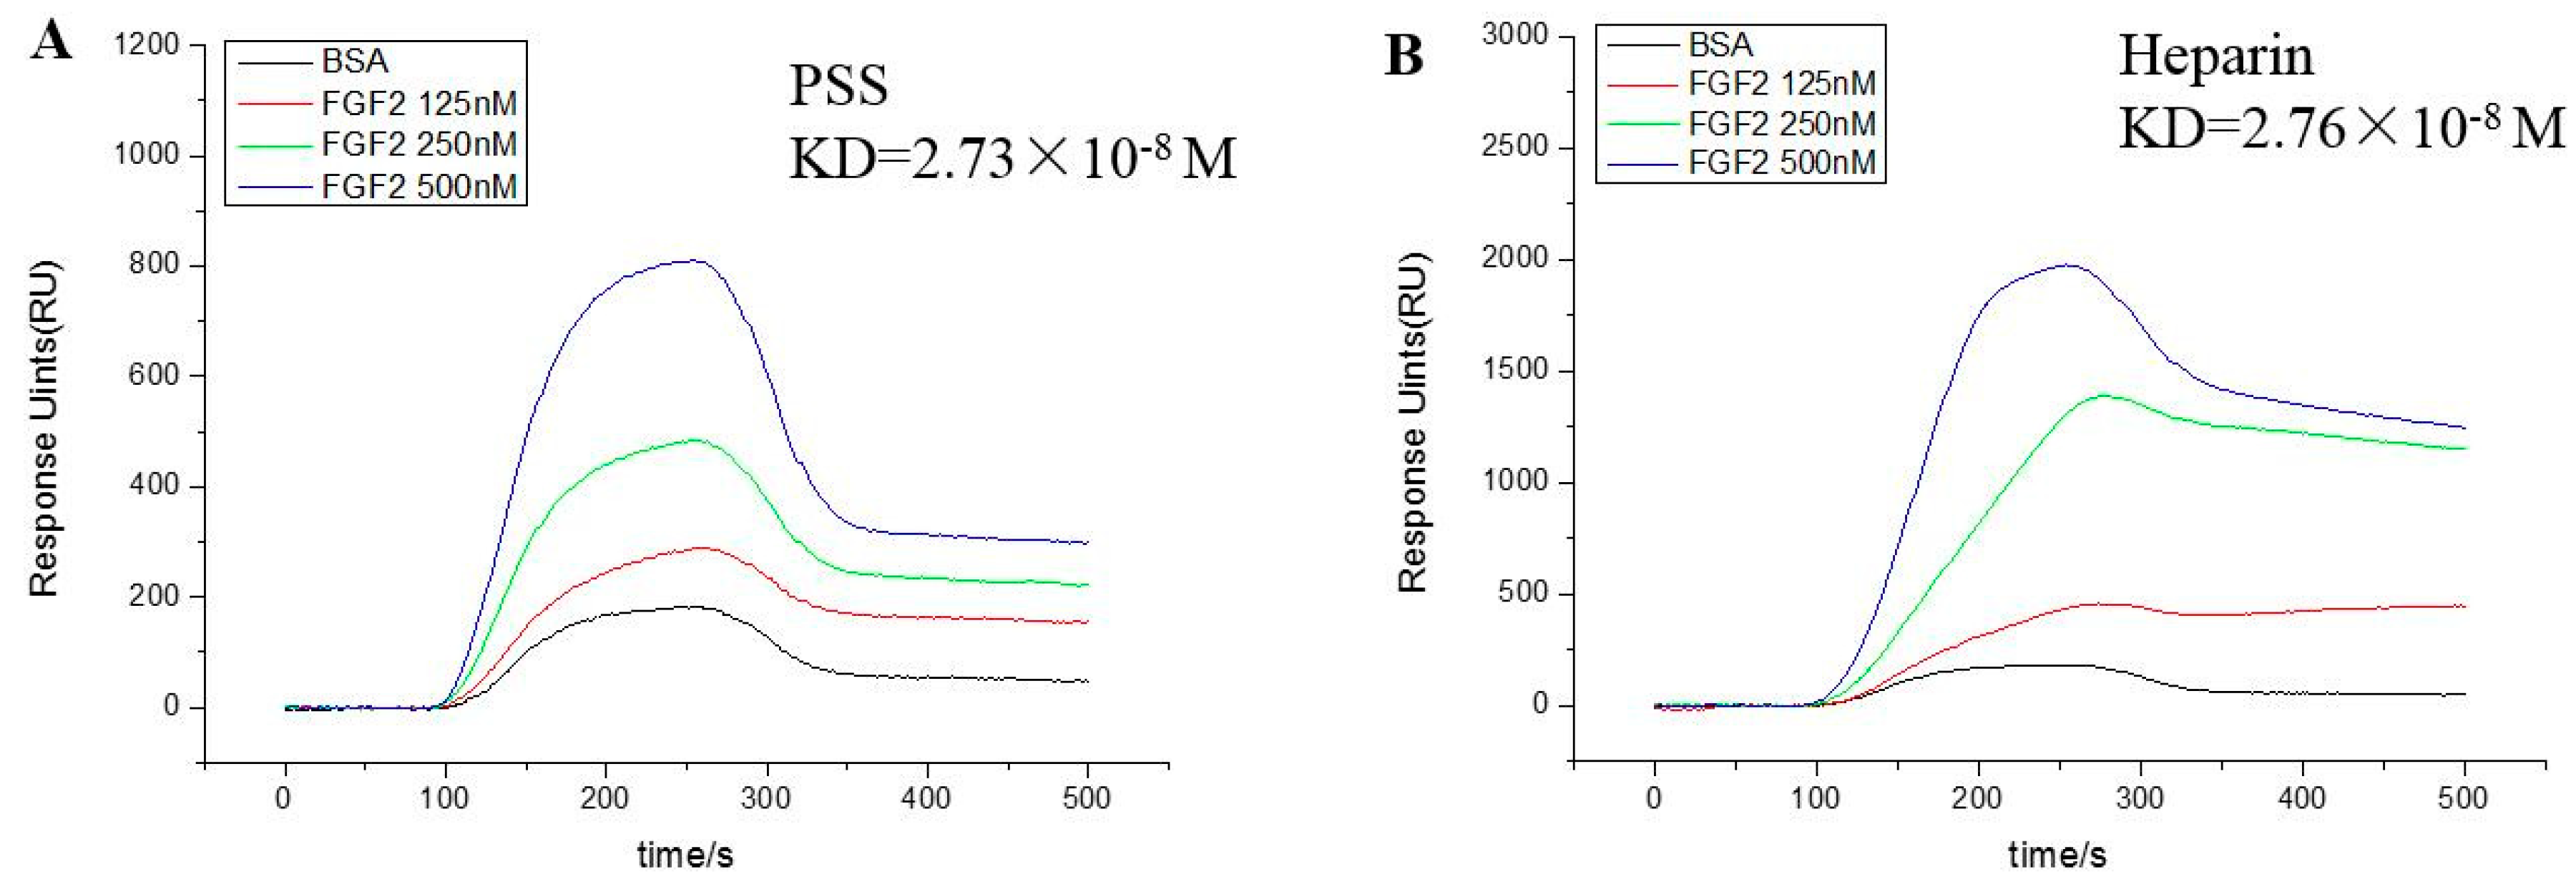
Abstract
:1. Introduction
2. Results
2.1. Fibroblast Growth Factor 2 Bound to Propylene Glycol Alginate Sodium Sulfate with High Affinity
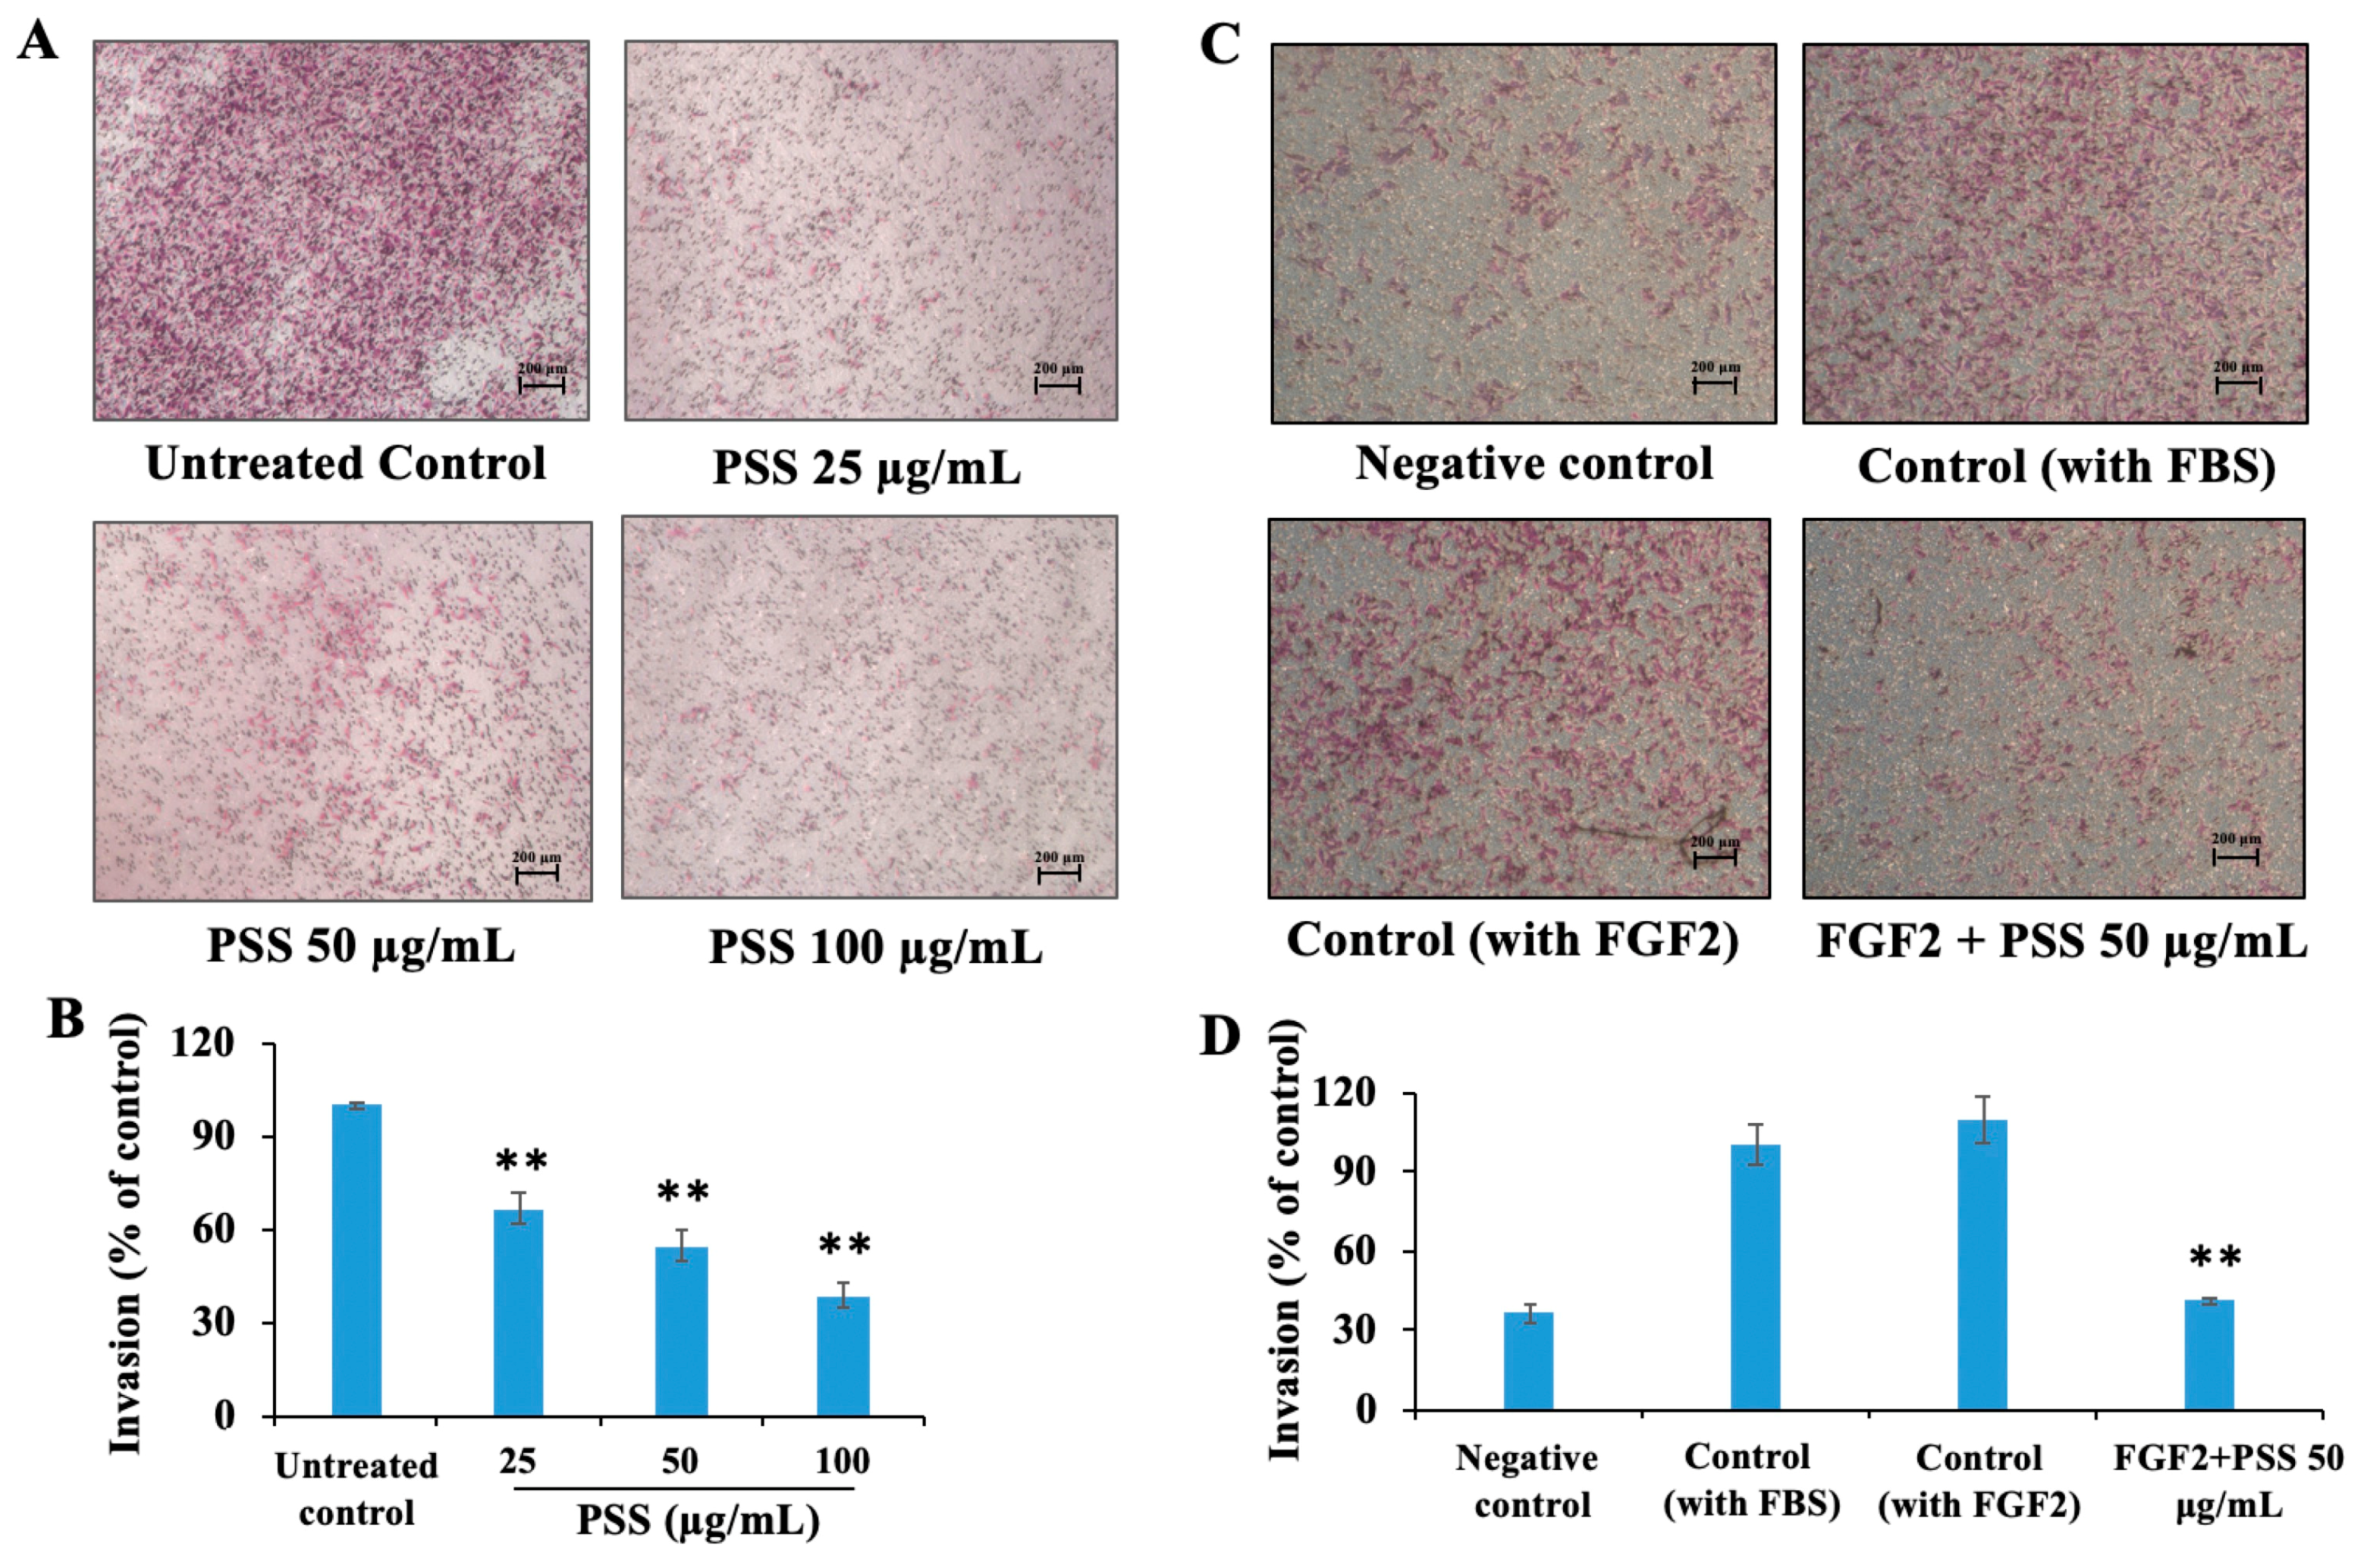
2.2. Propylene Glycol Alginate Sodium Sulfate Inhibited the Fibroblast Growth Factor 2-Induced Invasion of B16-F10 Cells
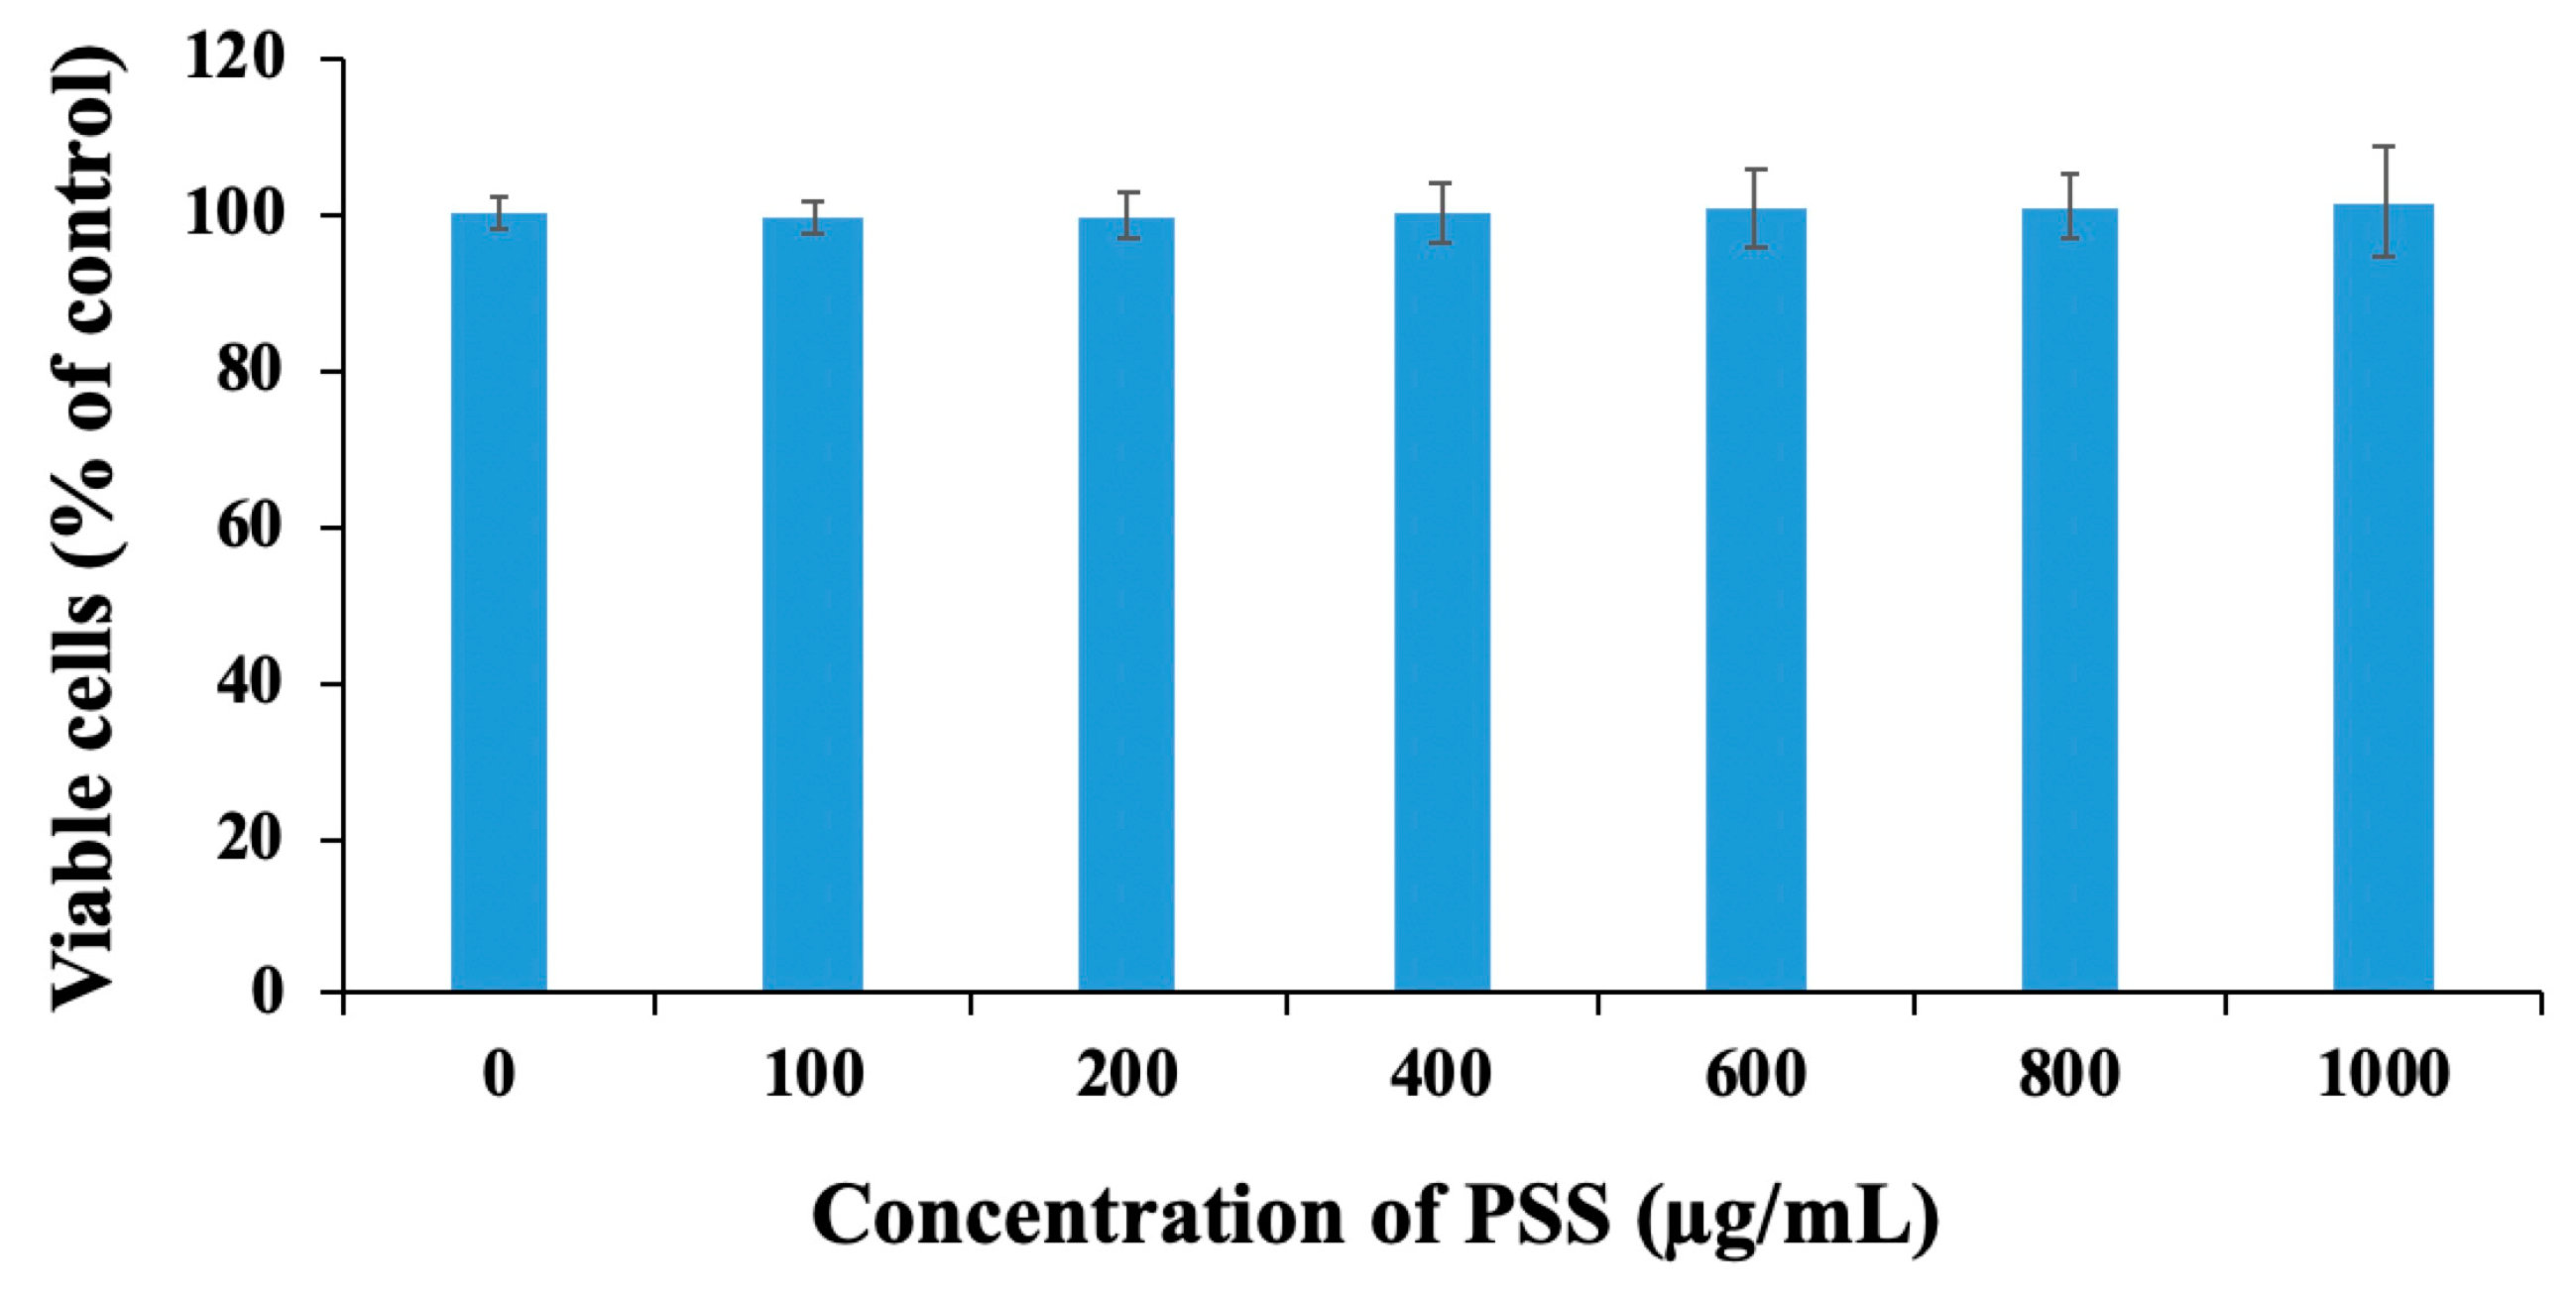
2.3. Propylene Glycol Alginate Sodium Sulfate Had No Effect on Cell Viability
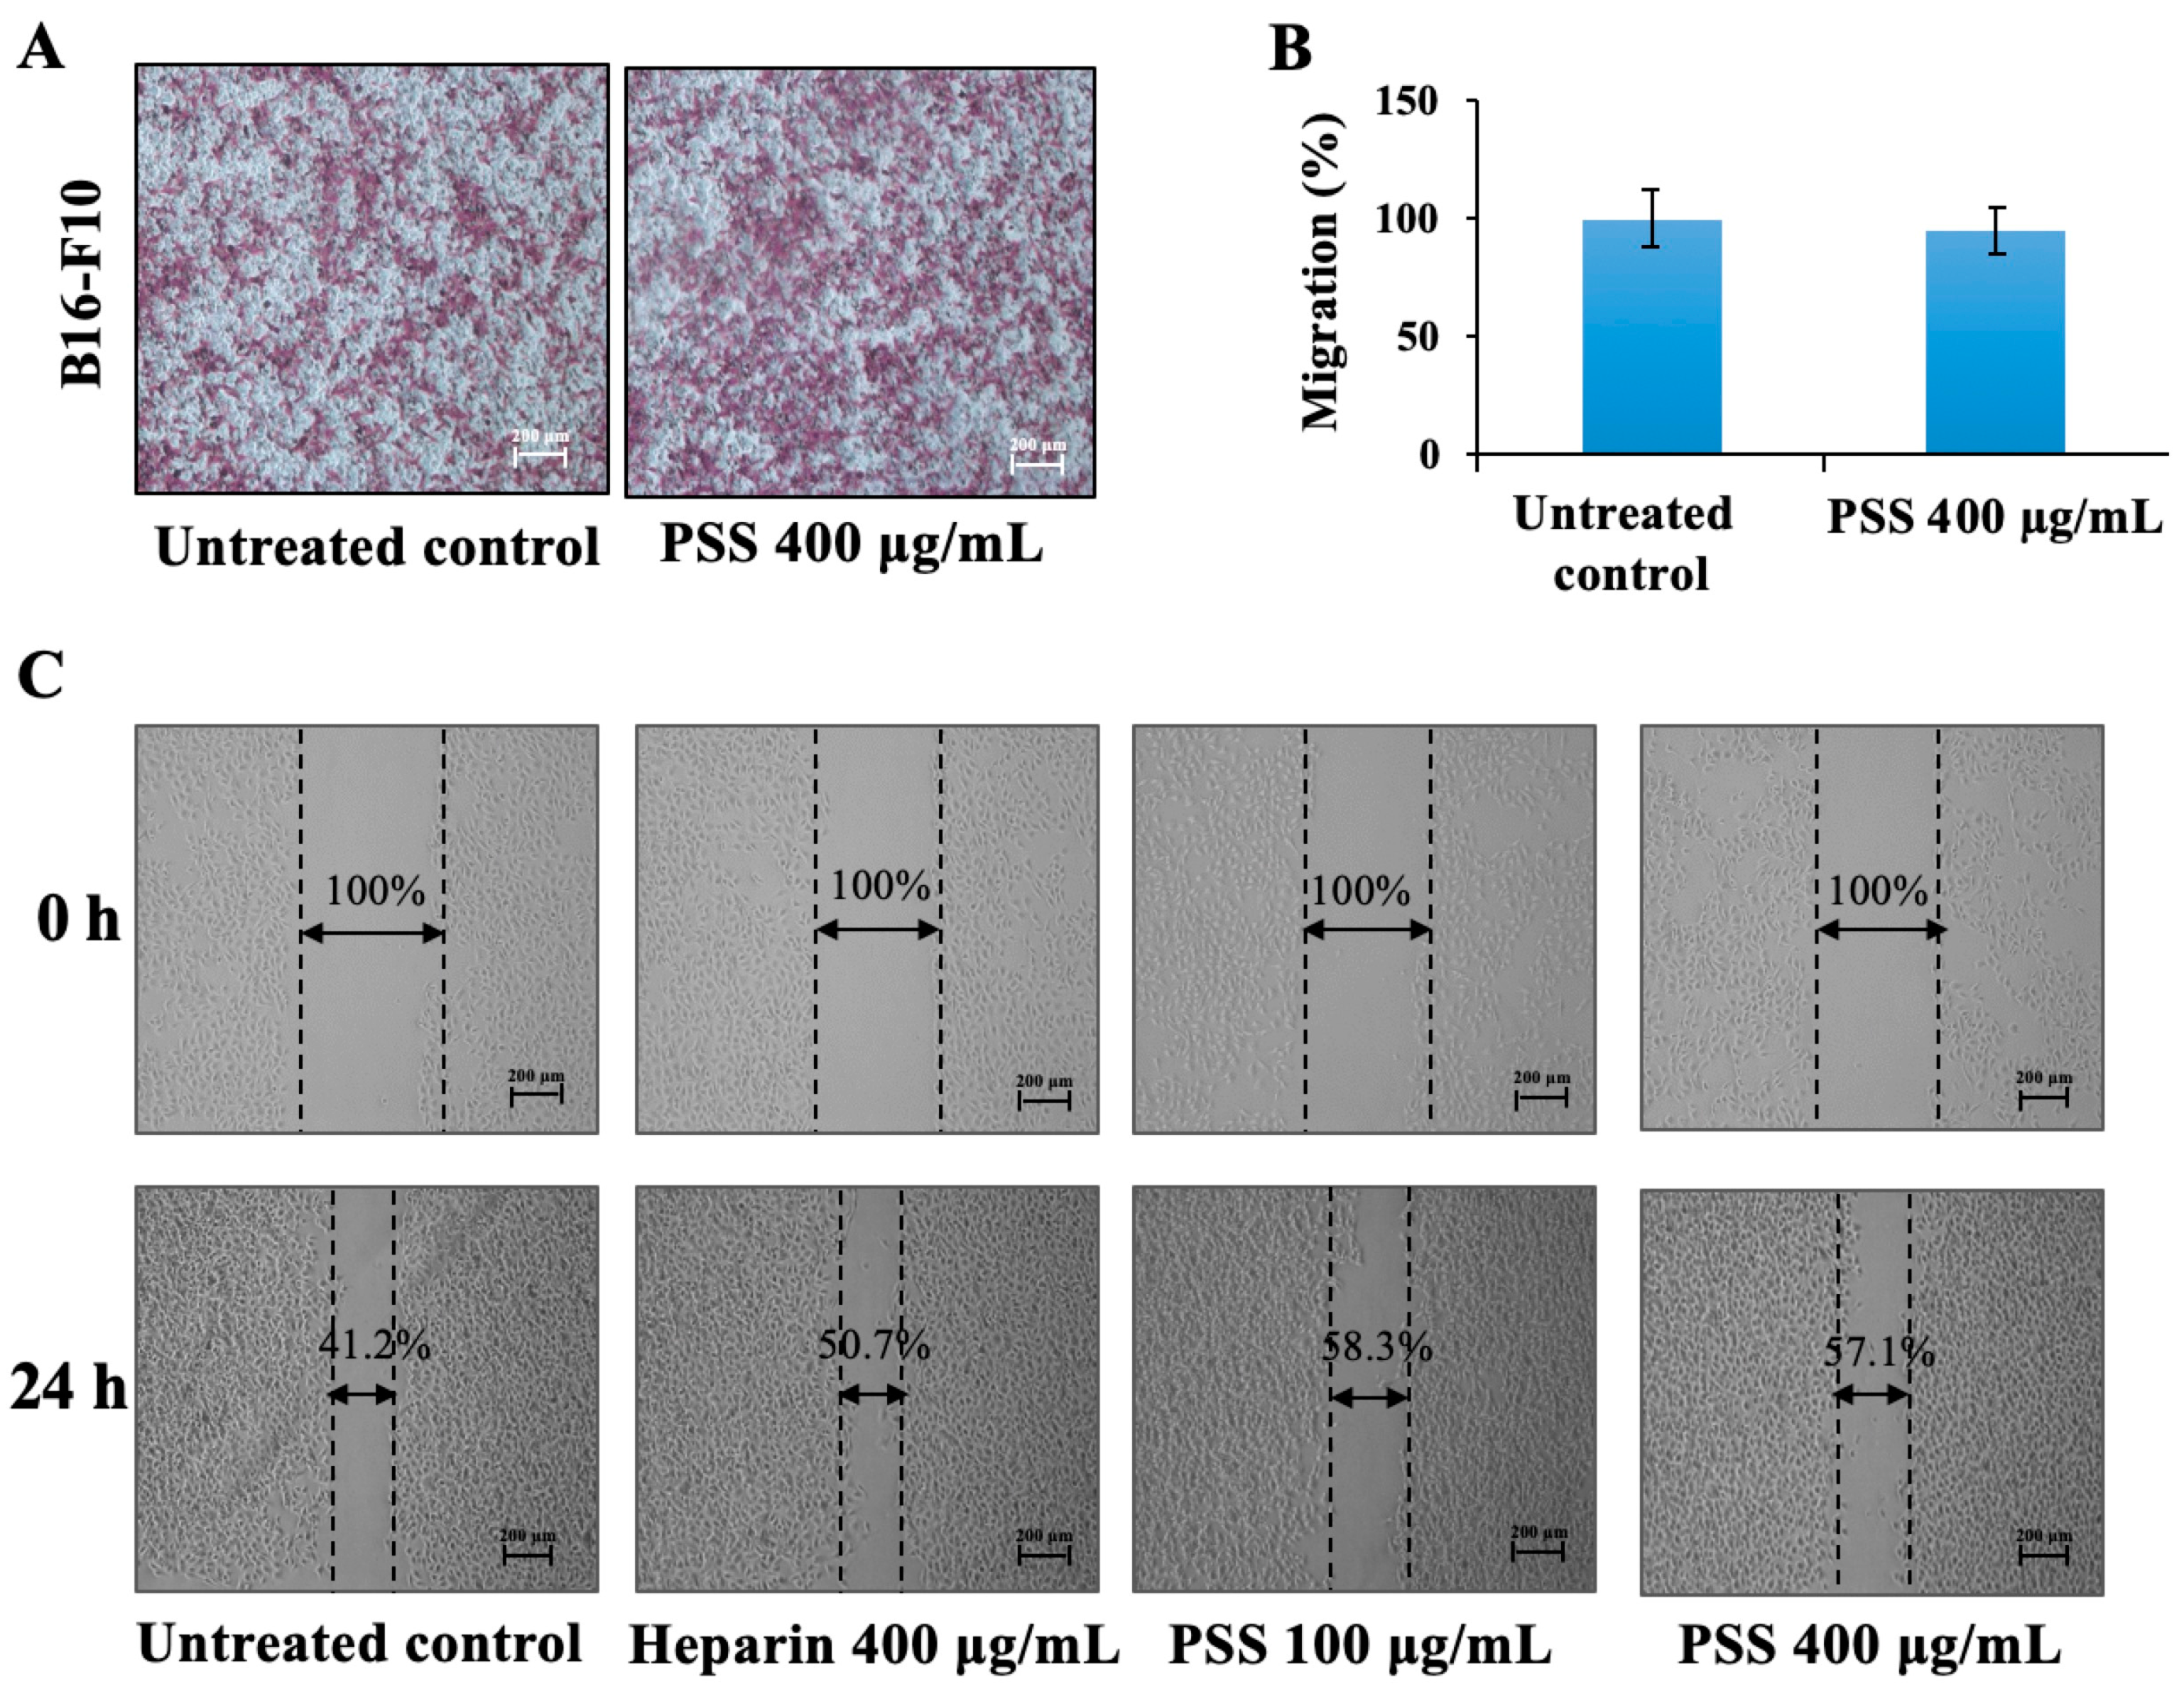
2.4. Propylene Glycol Alginate Sodium Sulfate Had No Effect on the Migration of B16-F10 Cells
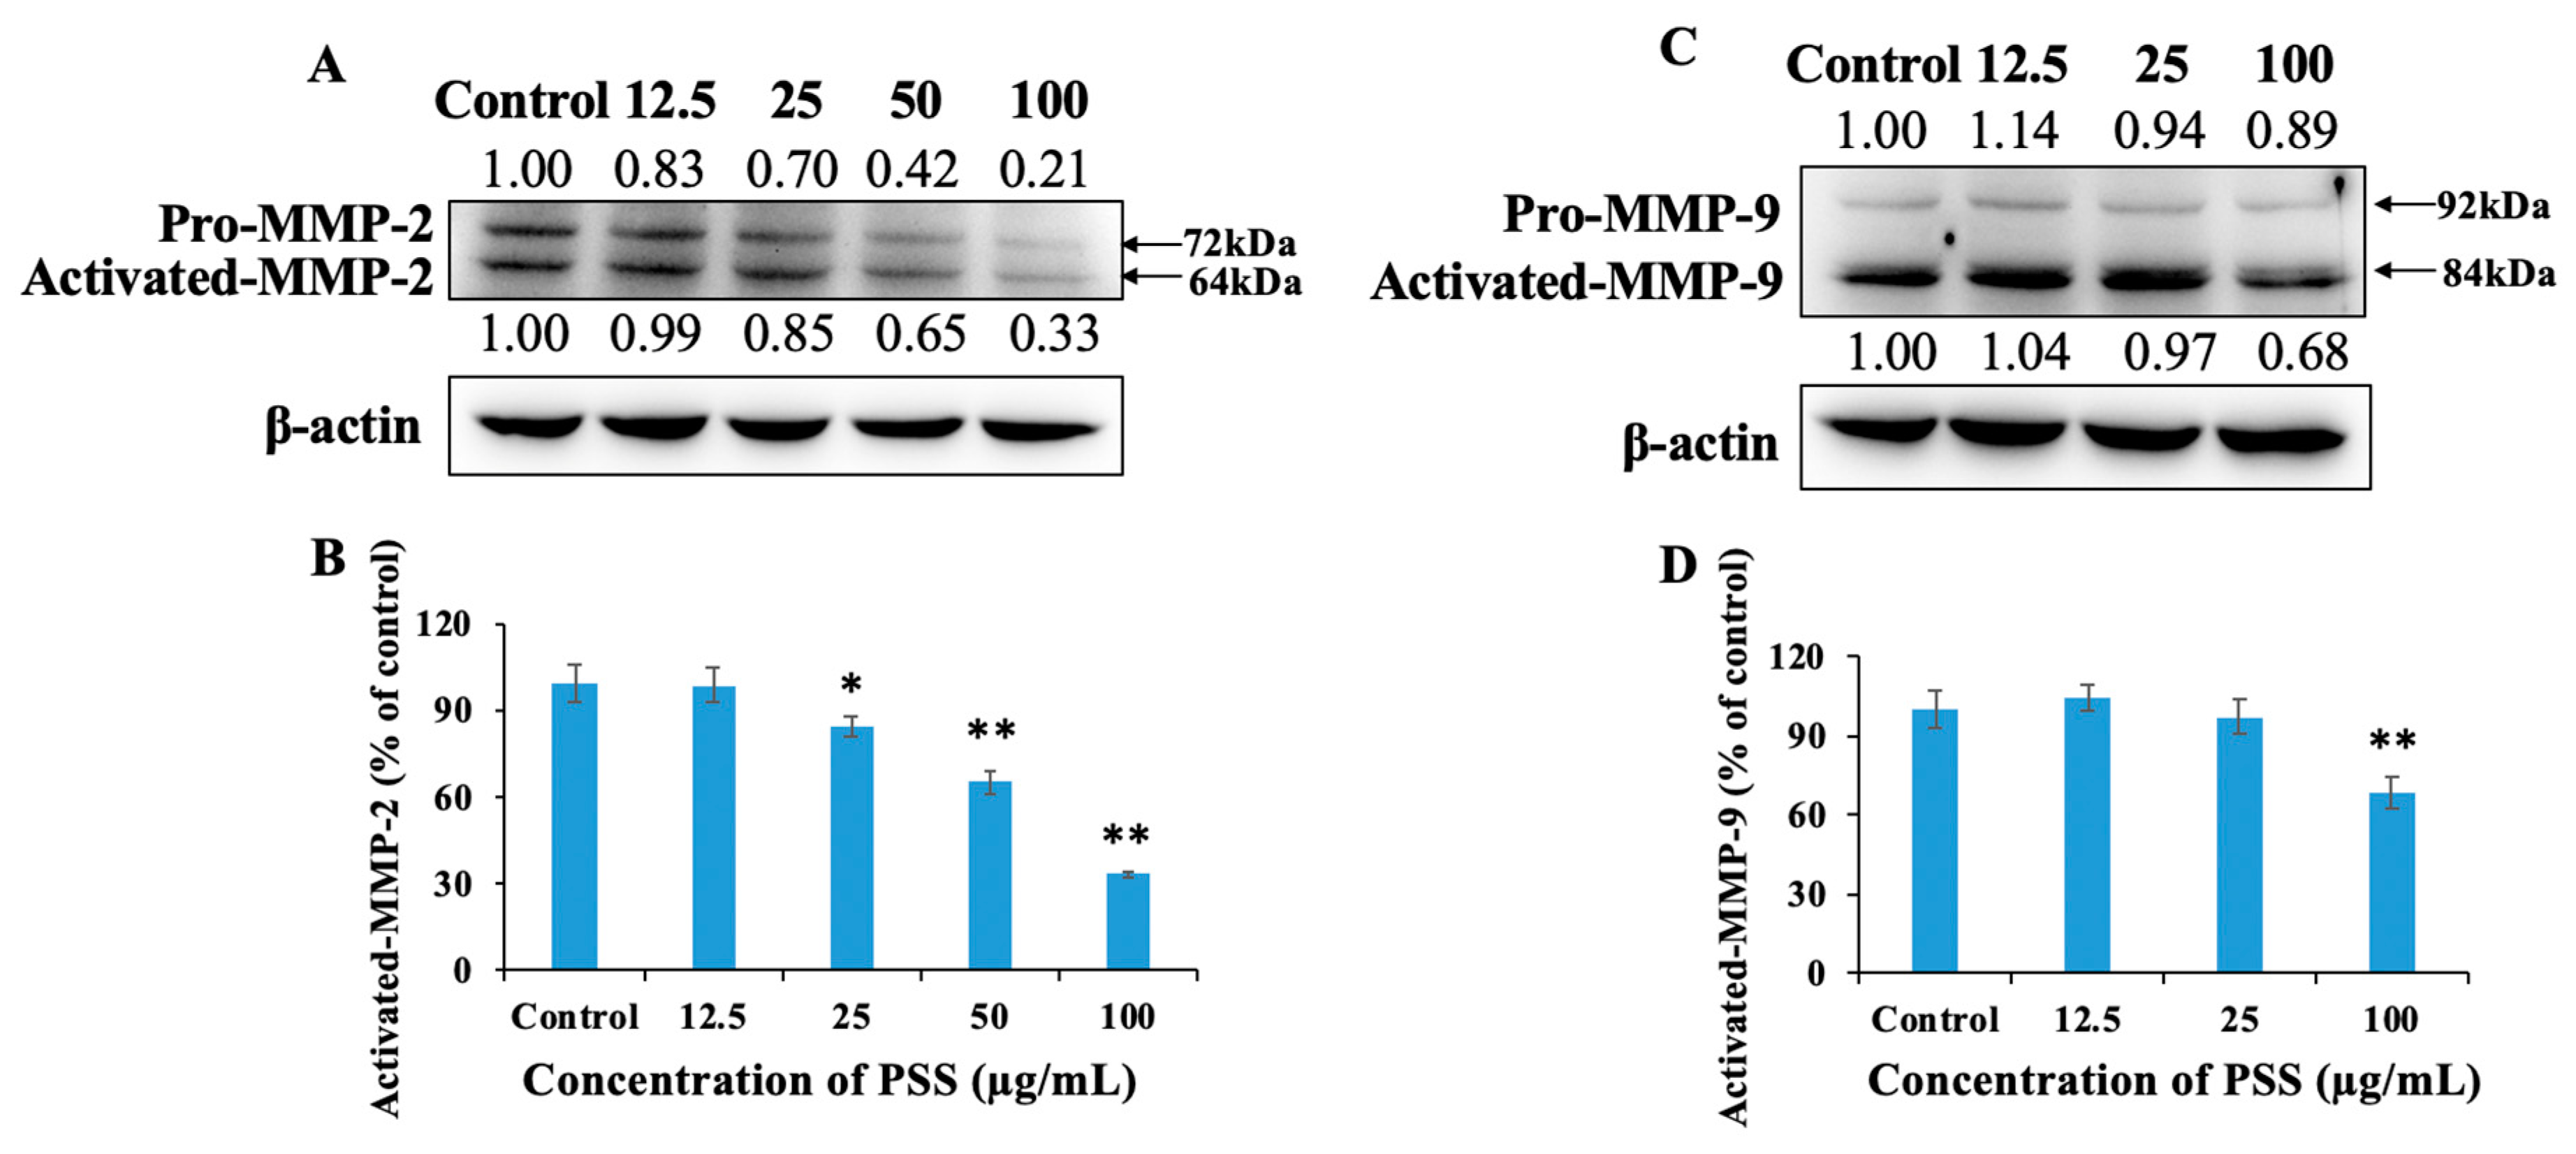
2.5. Propylene Glycol Alginate Sodium Sulfate Down-Regulated the Expression of Activated Matrix Metalloproteinase 2 and Matrix Metalloproteinase 9
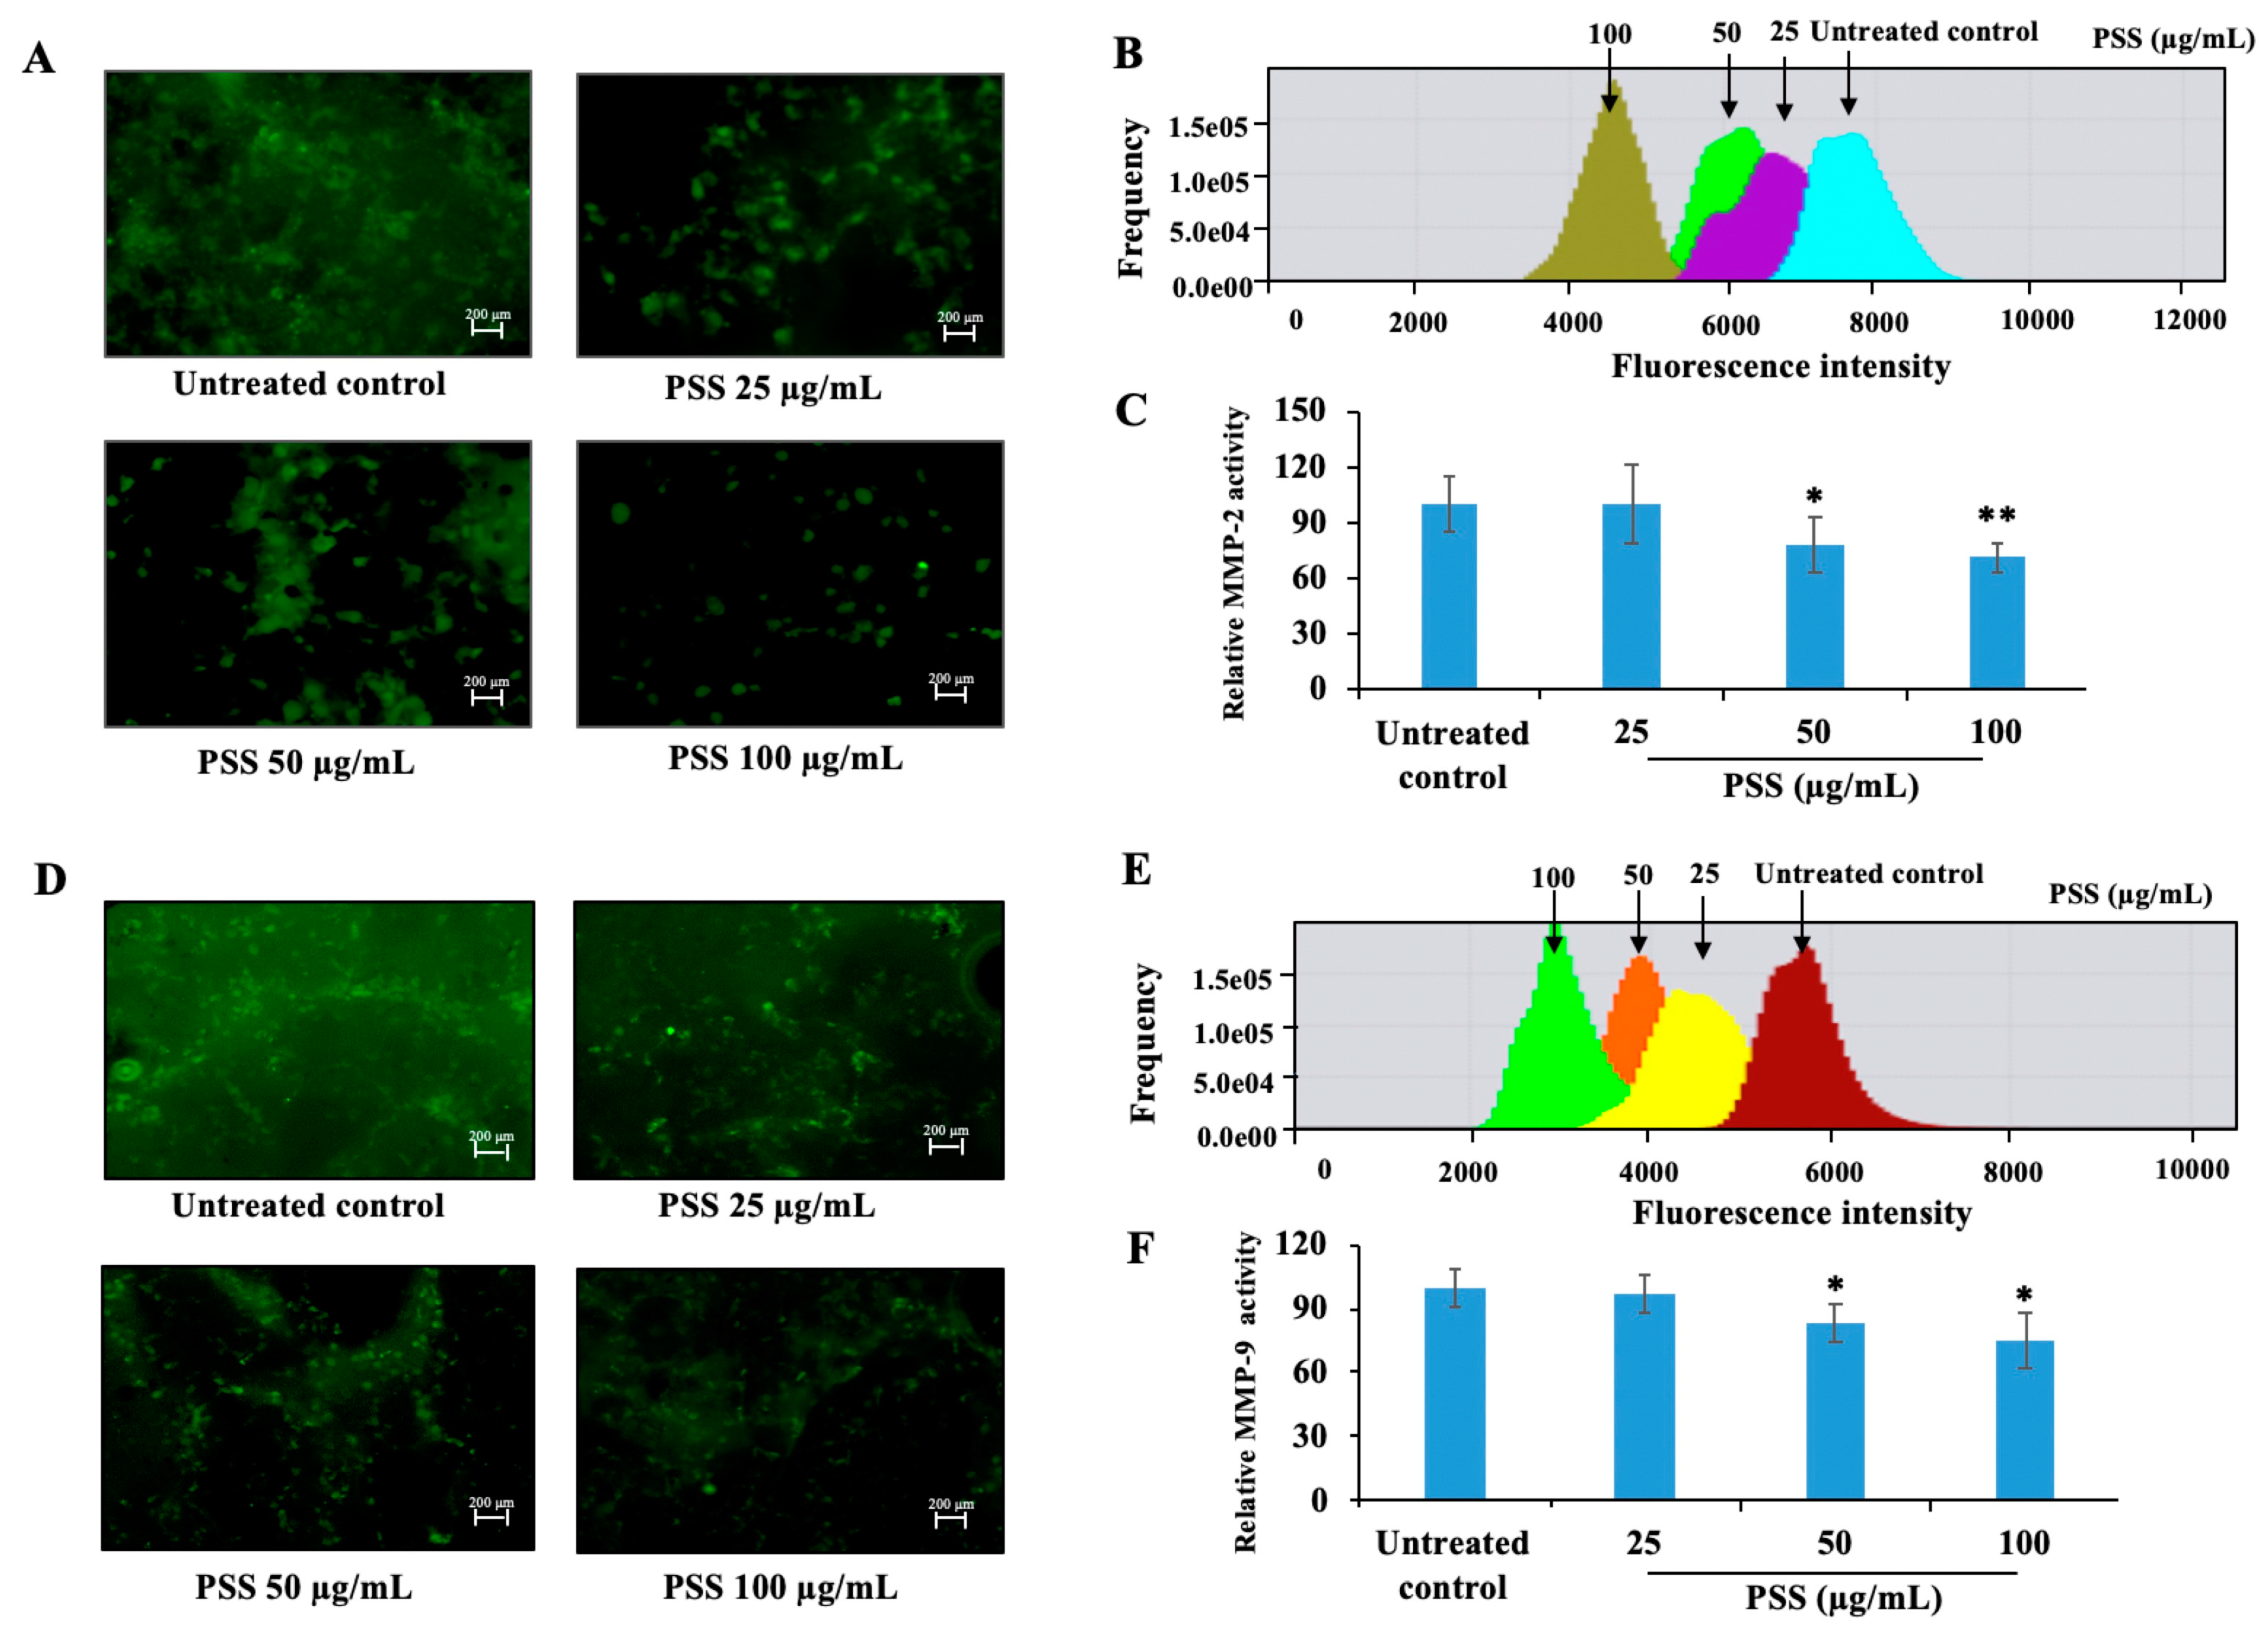
2.6. Propylene Glycol Alginate Sodium Sulfate Decreased the Activity of Matrix Metalloproteinase 2 and Matrix Metalloproteinase 9
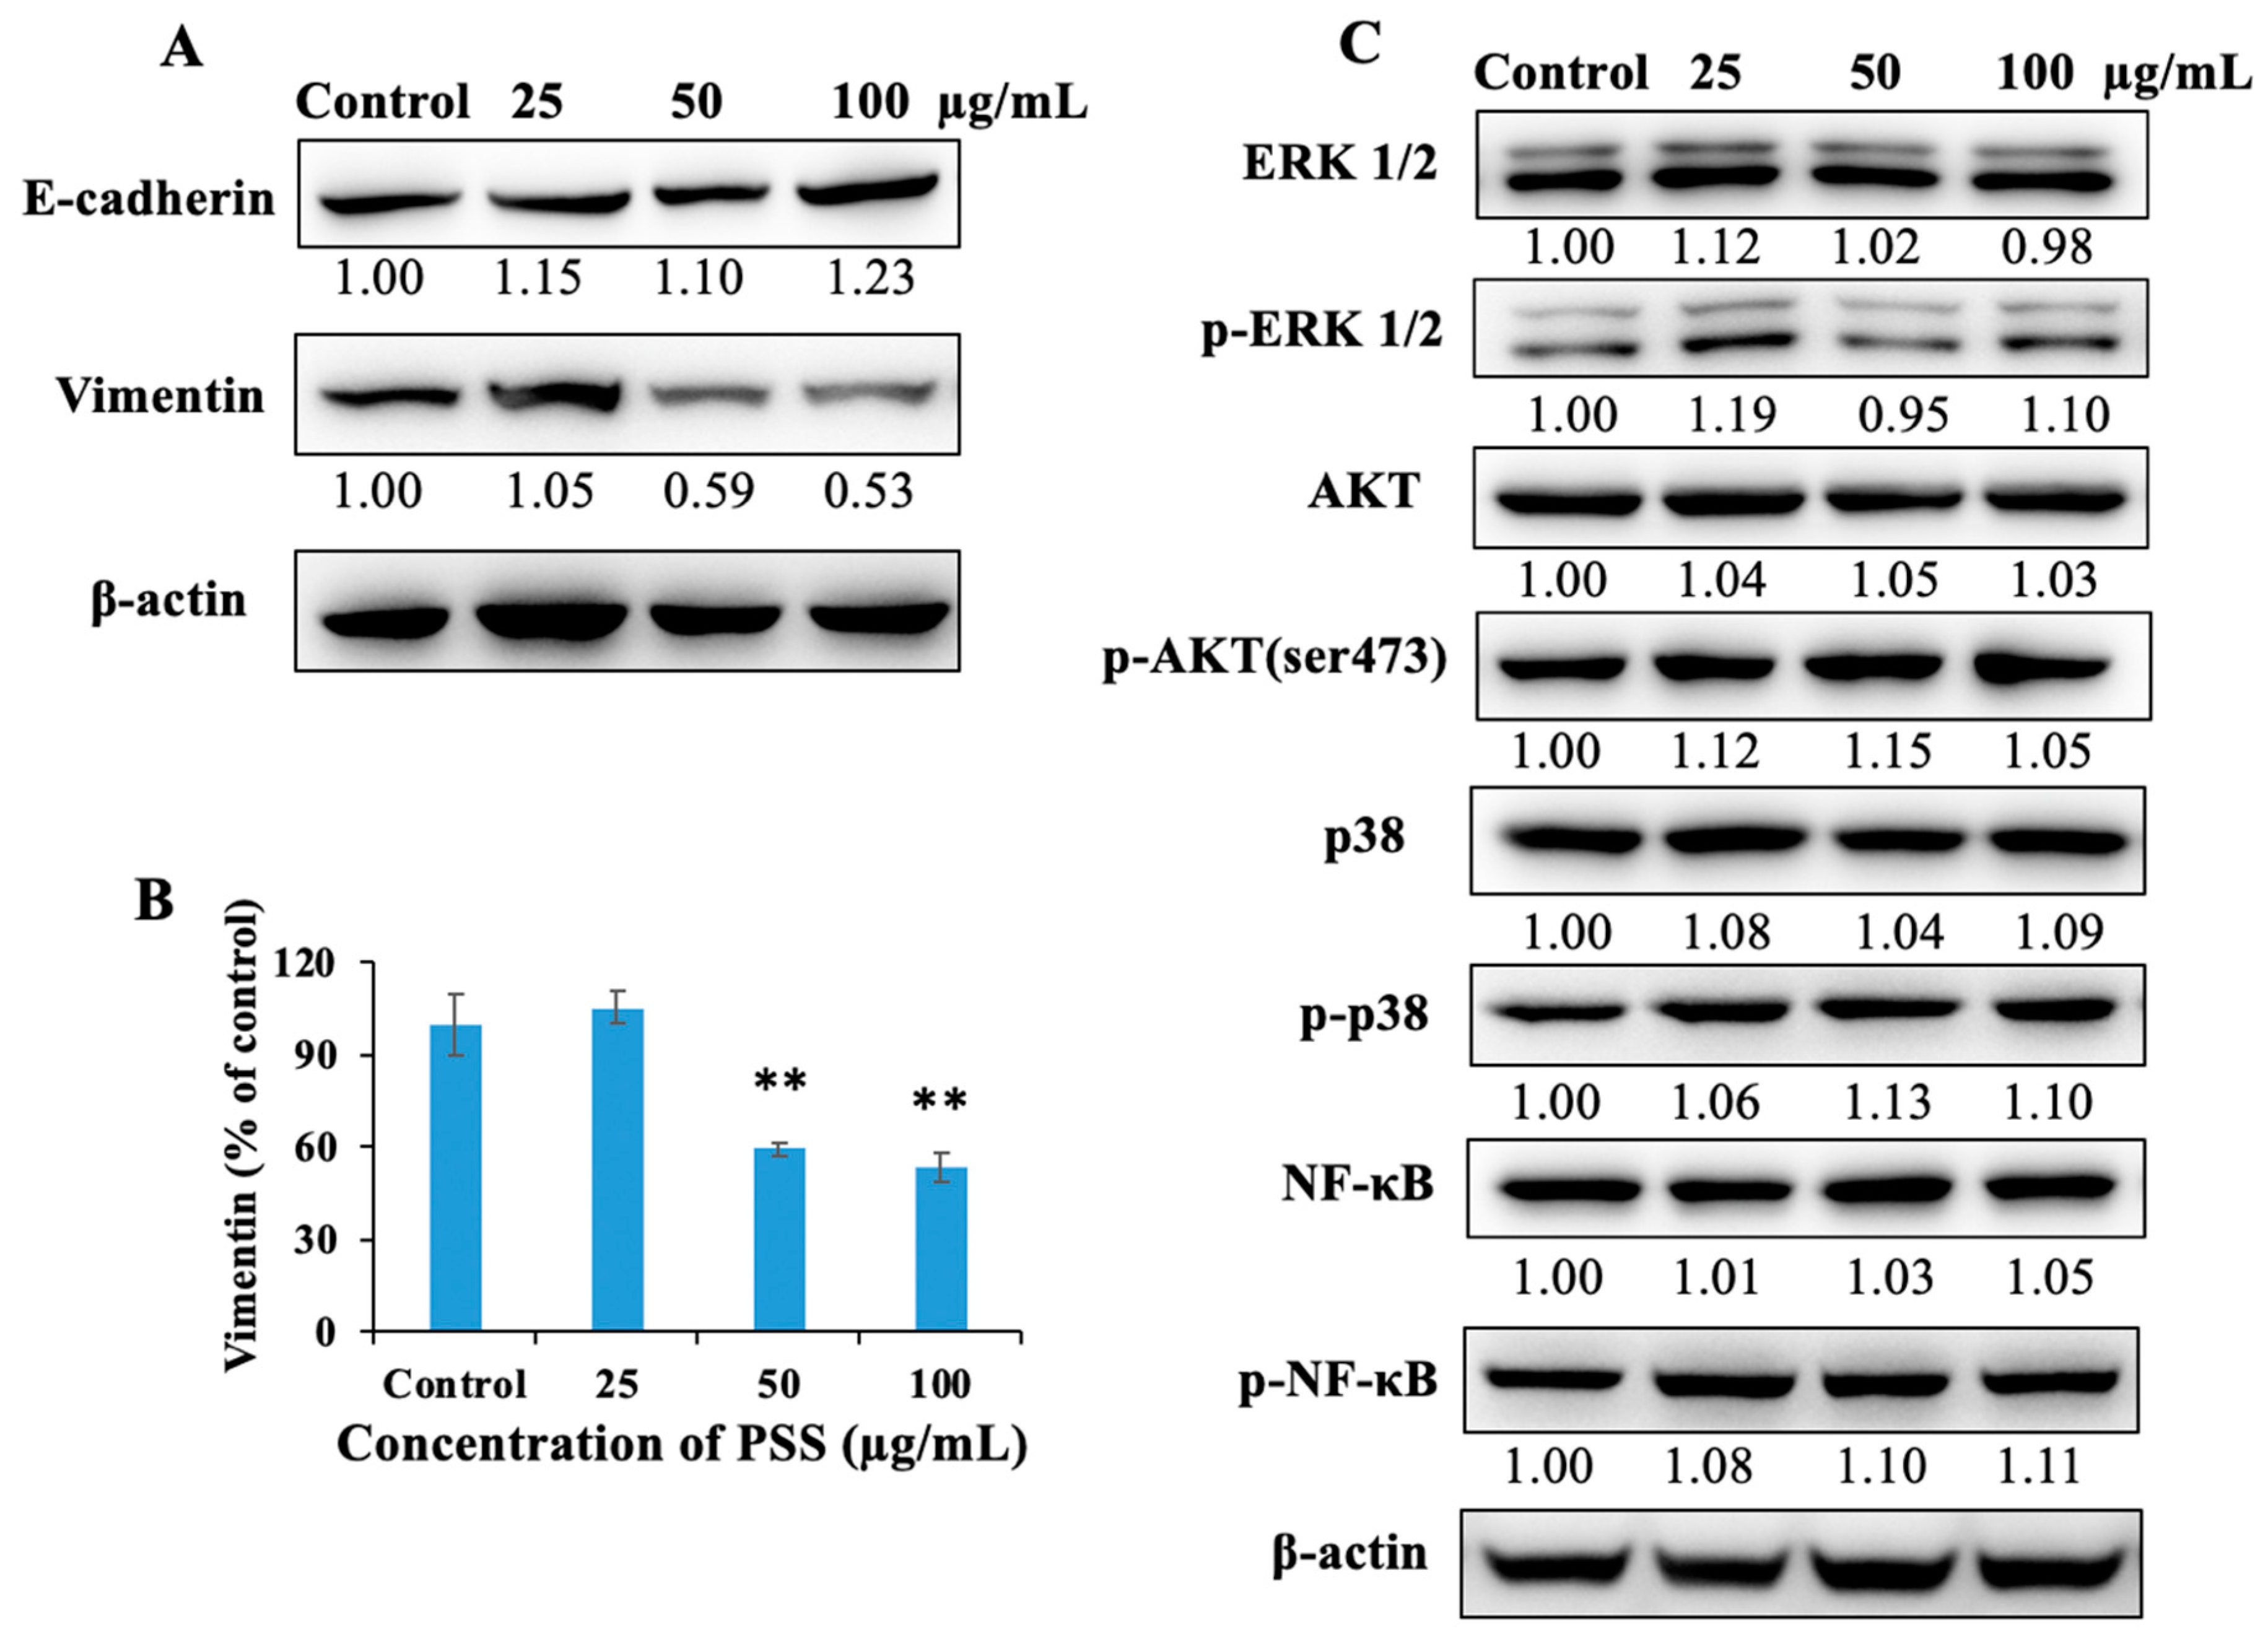
2.7. Propylene Glycol Alginate Sodium Sulfate Down-Regulated the Protein Expression of Vimentin
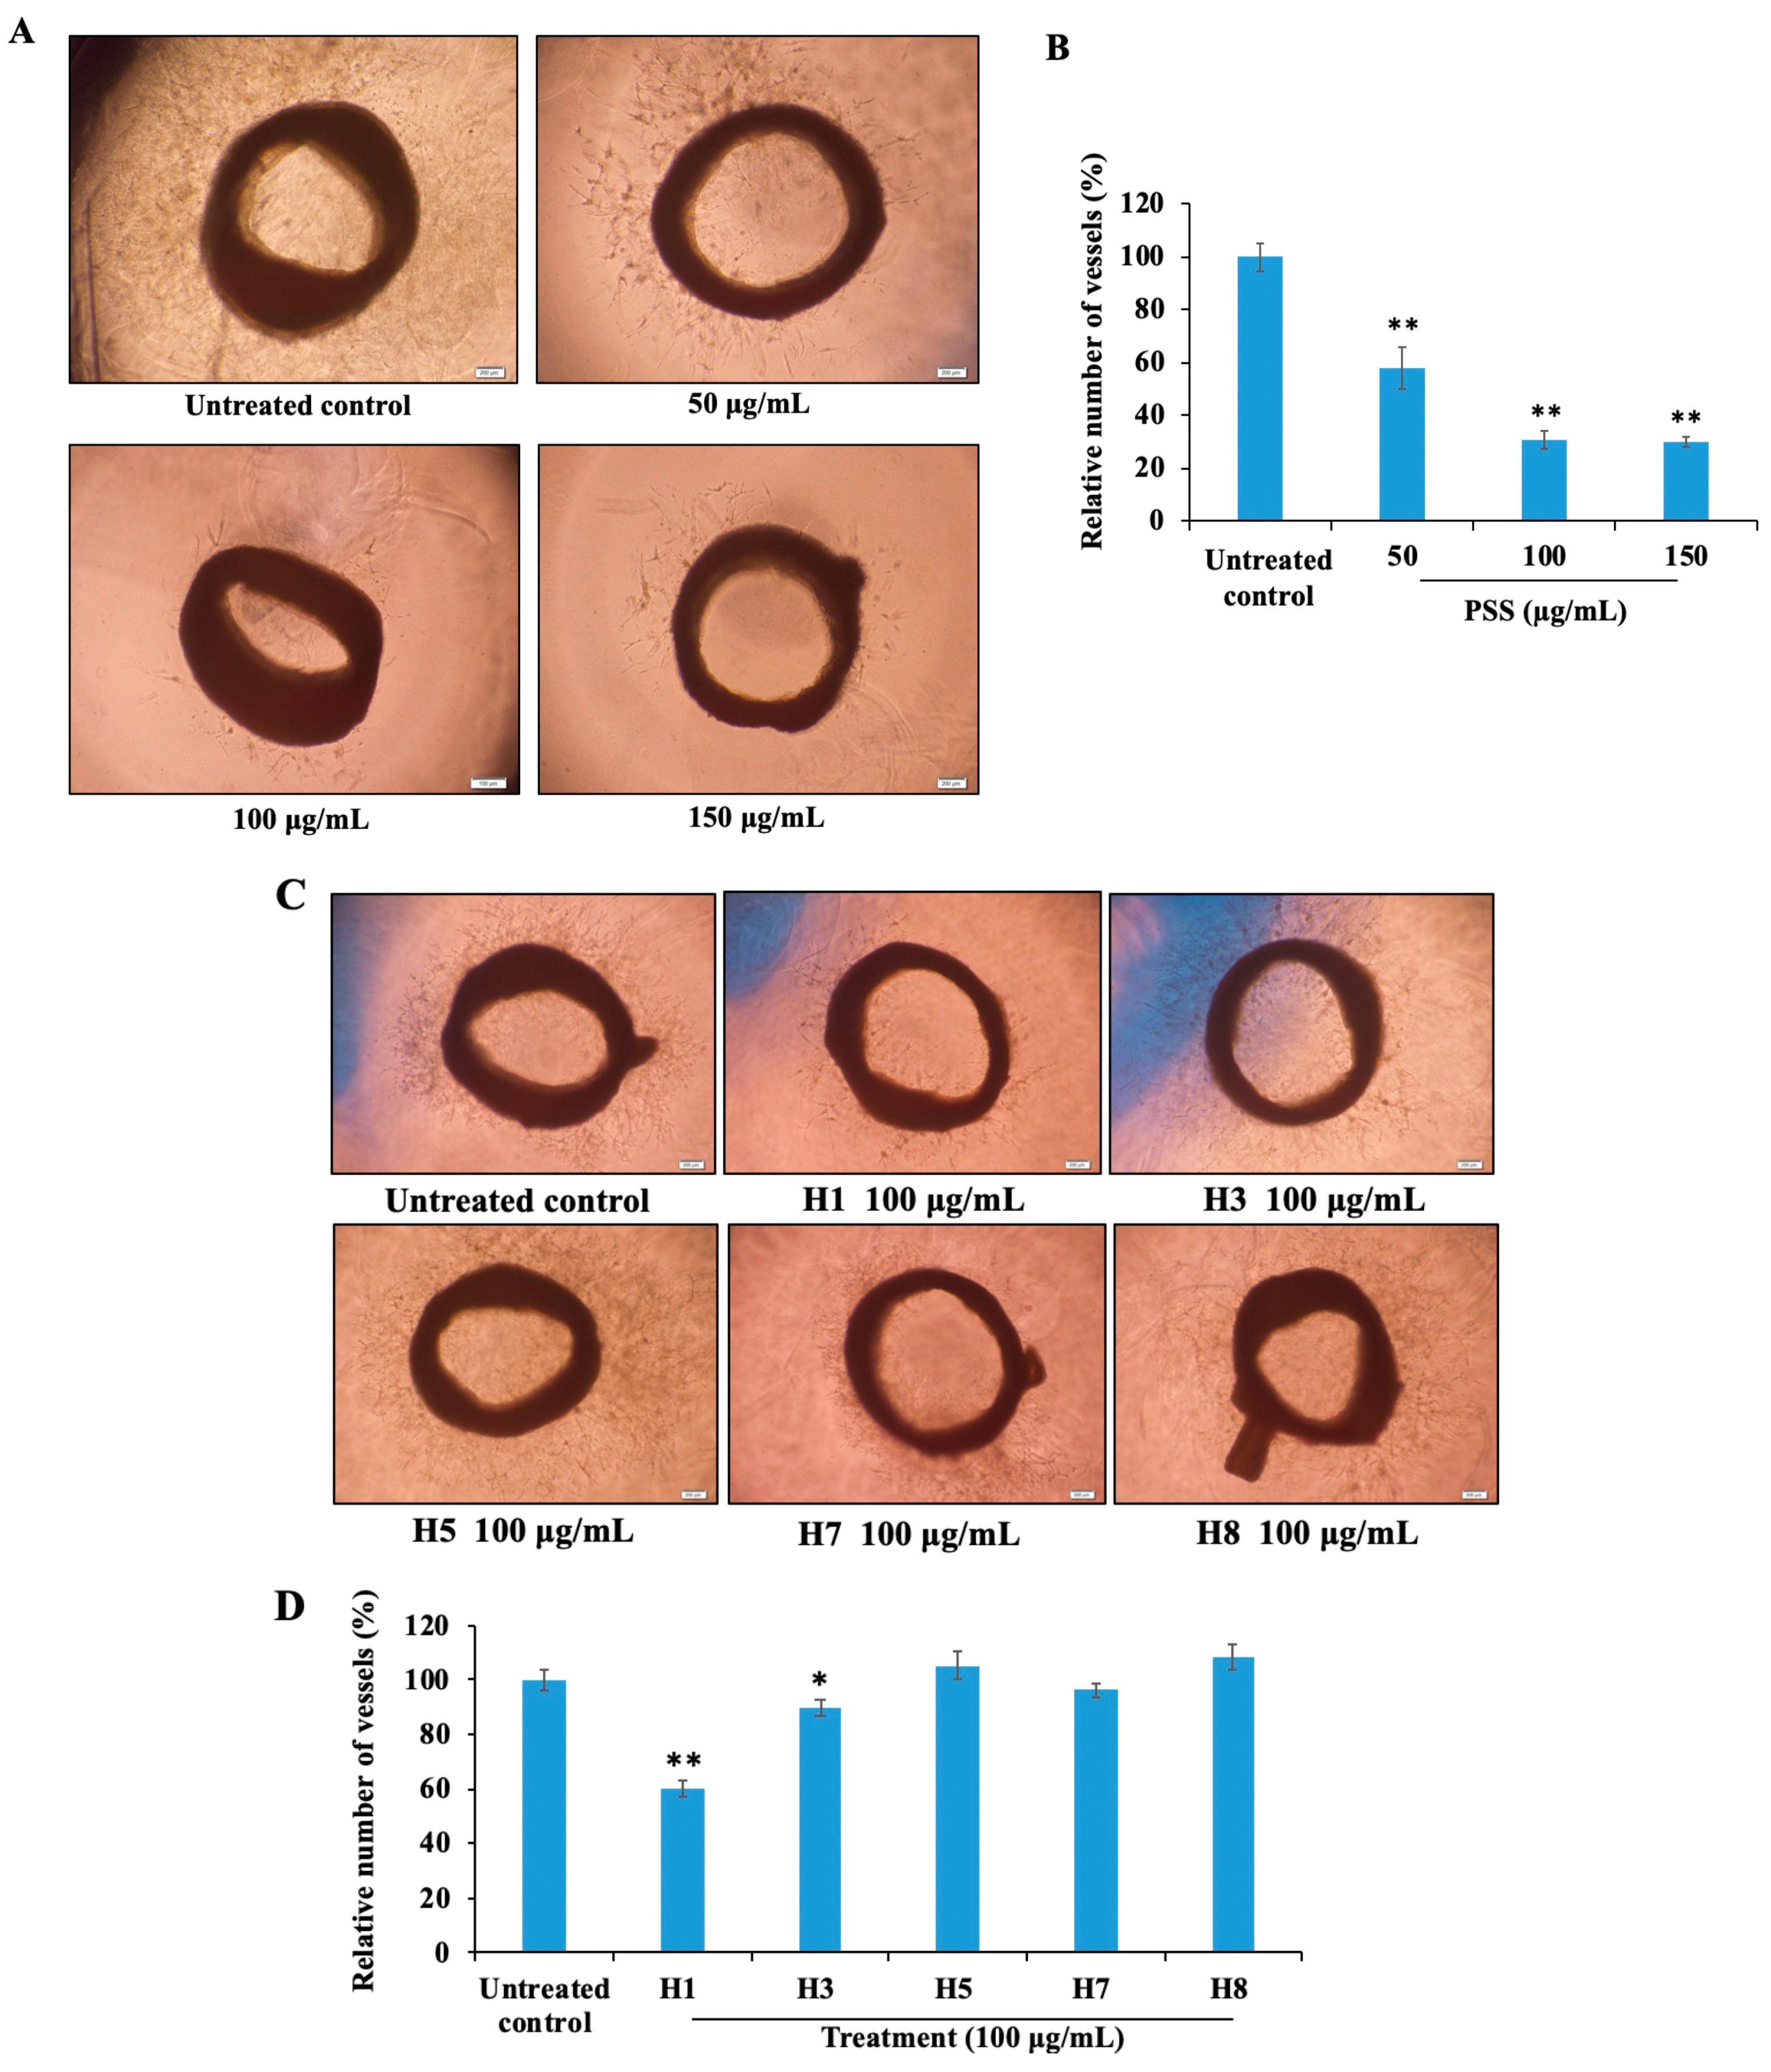
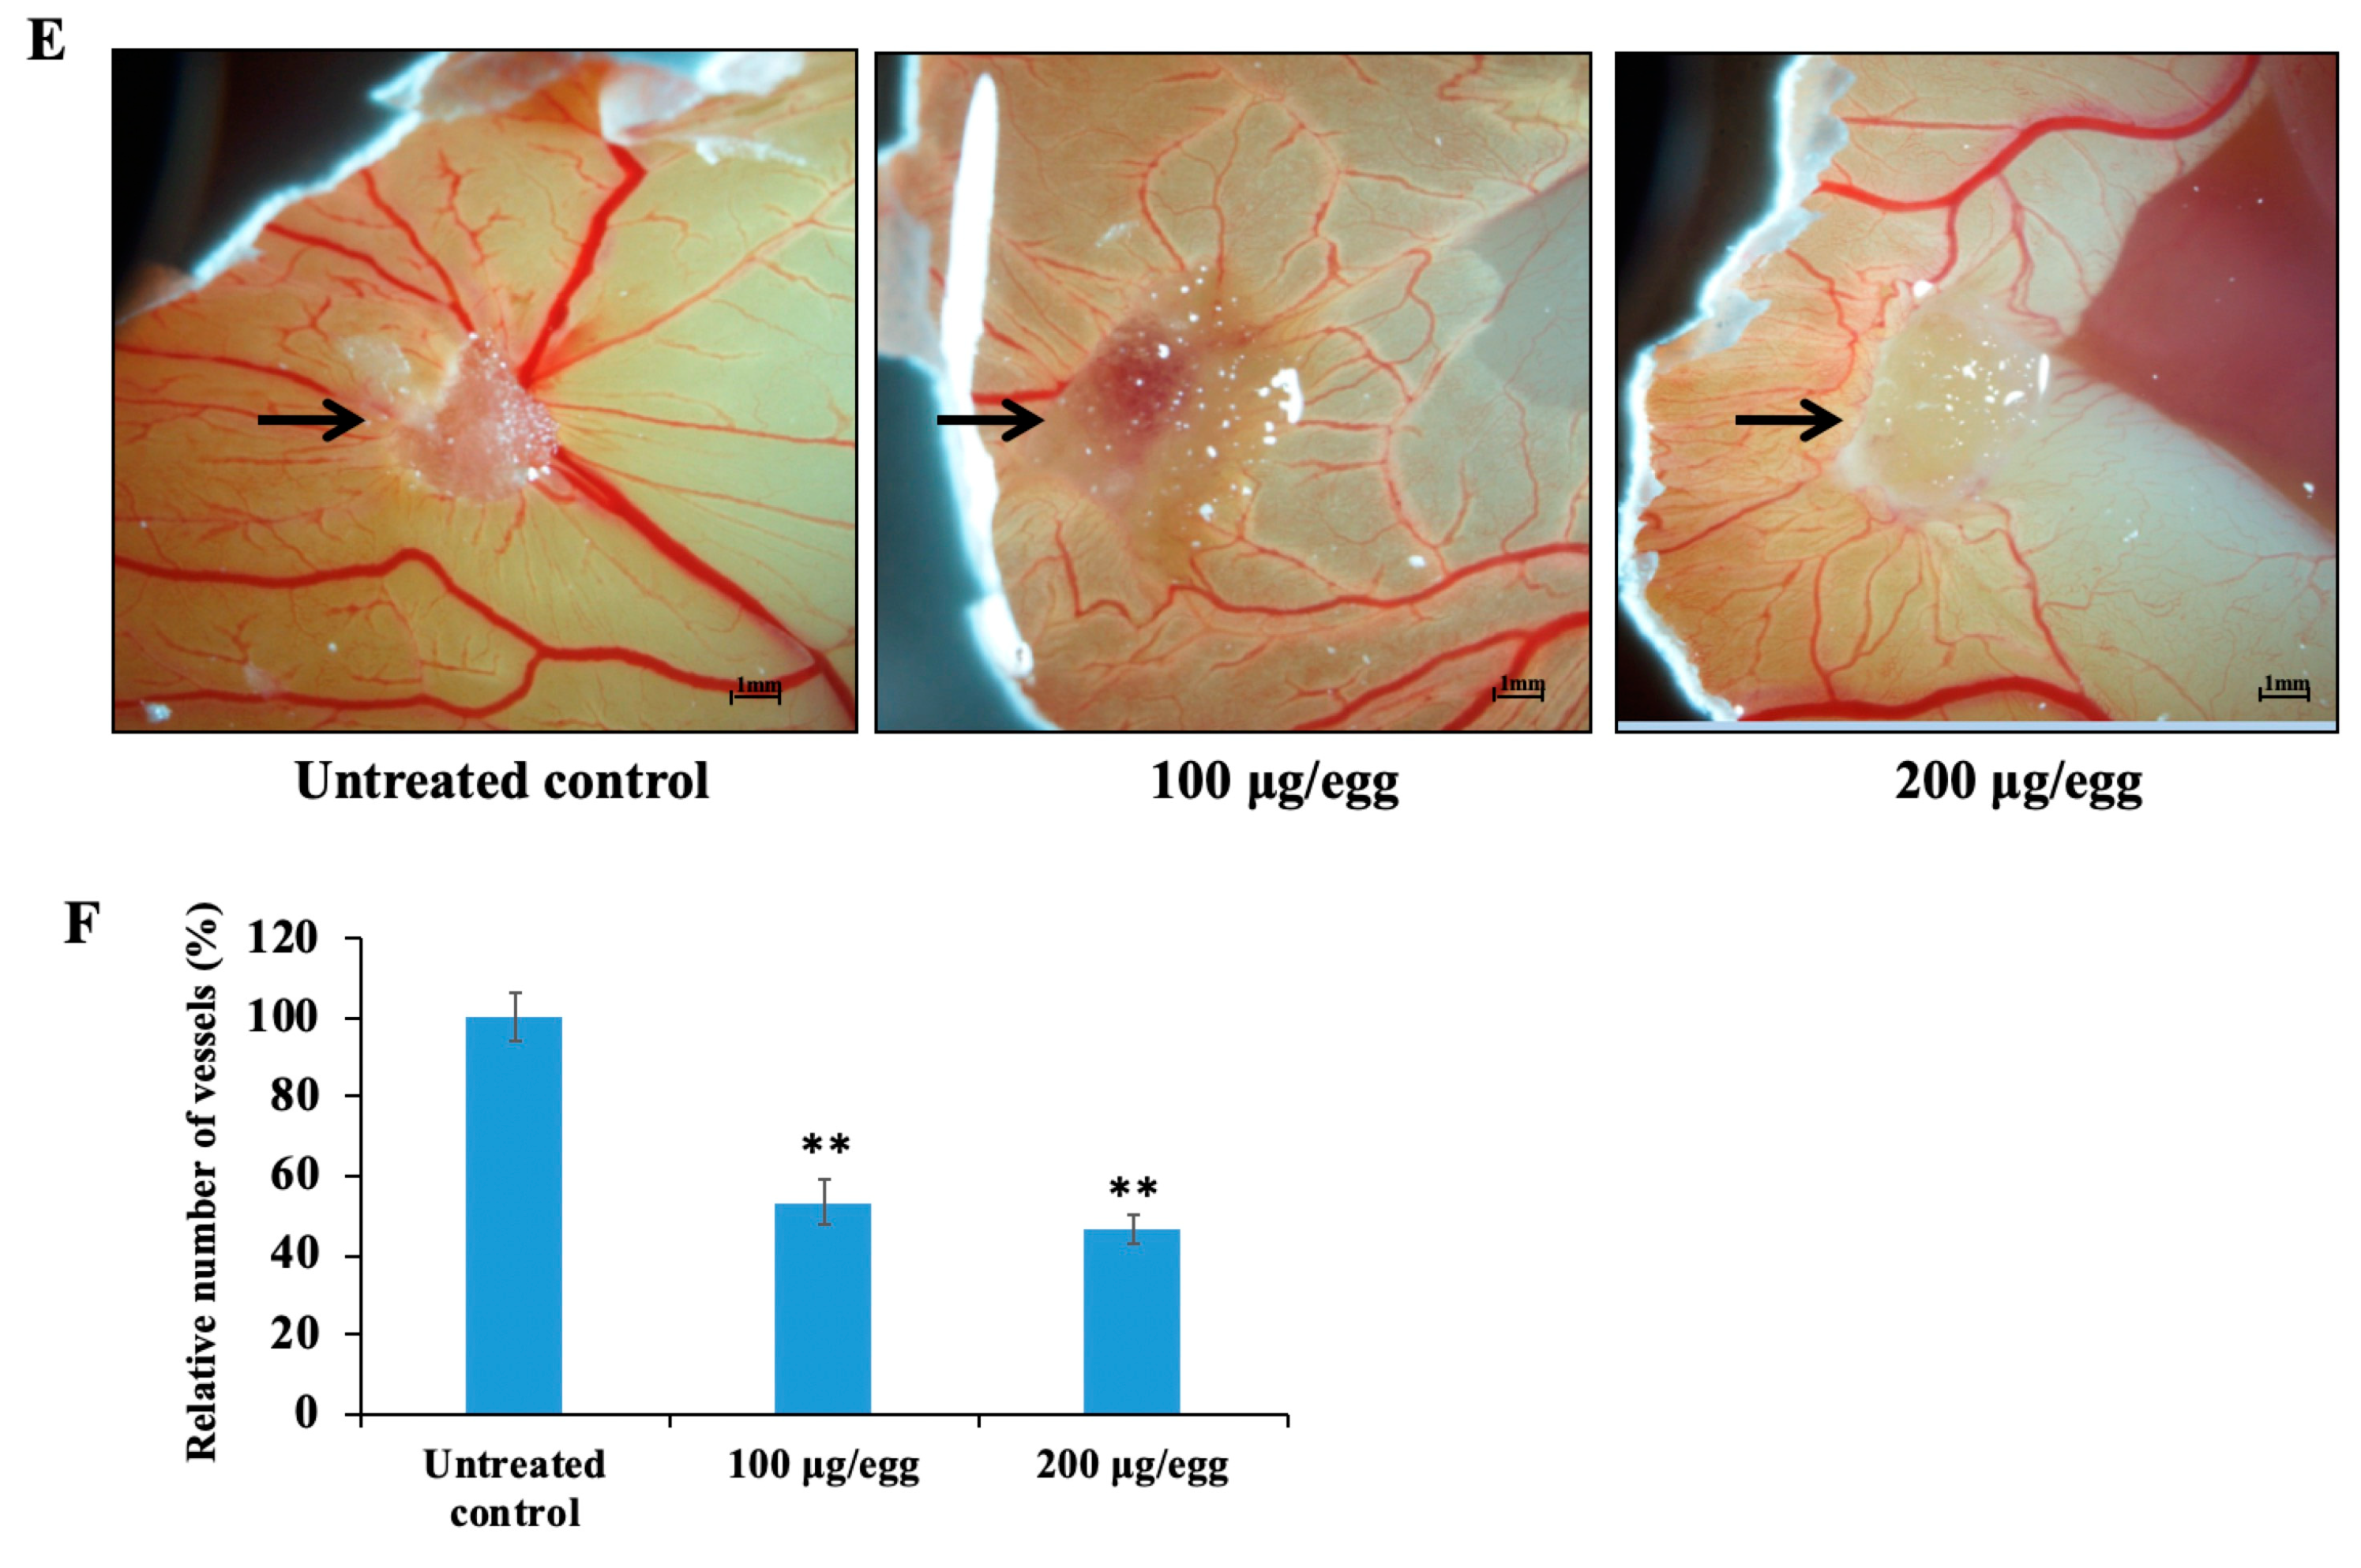
2.8. Propylene Glycol Alginate Sodium Sulfate Inhibited Angiogenesis
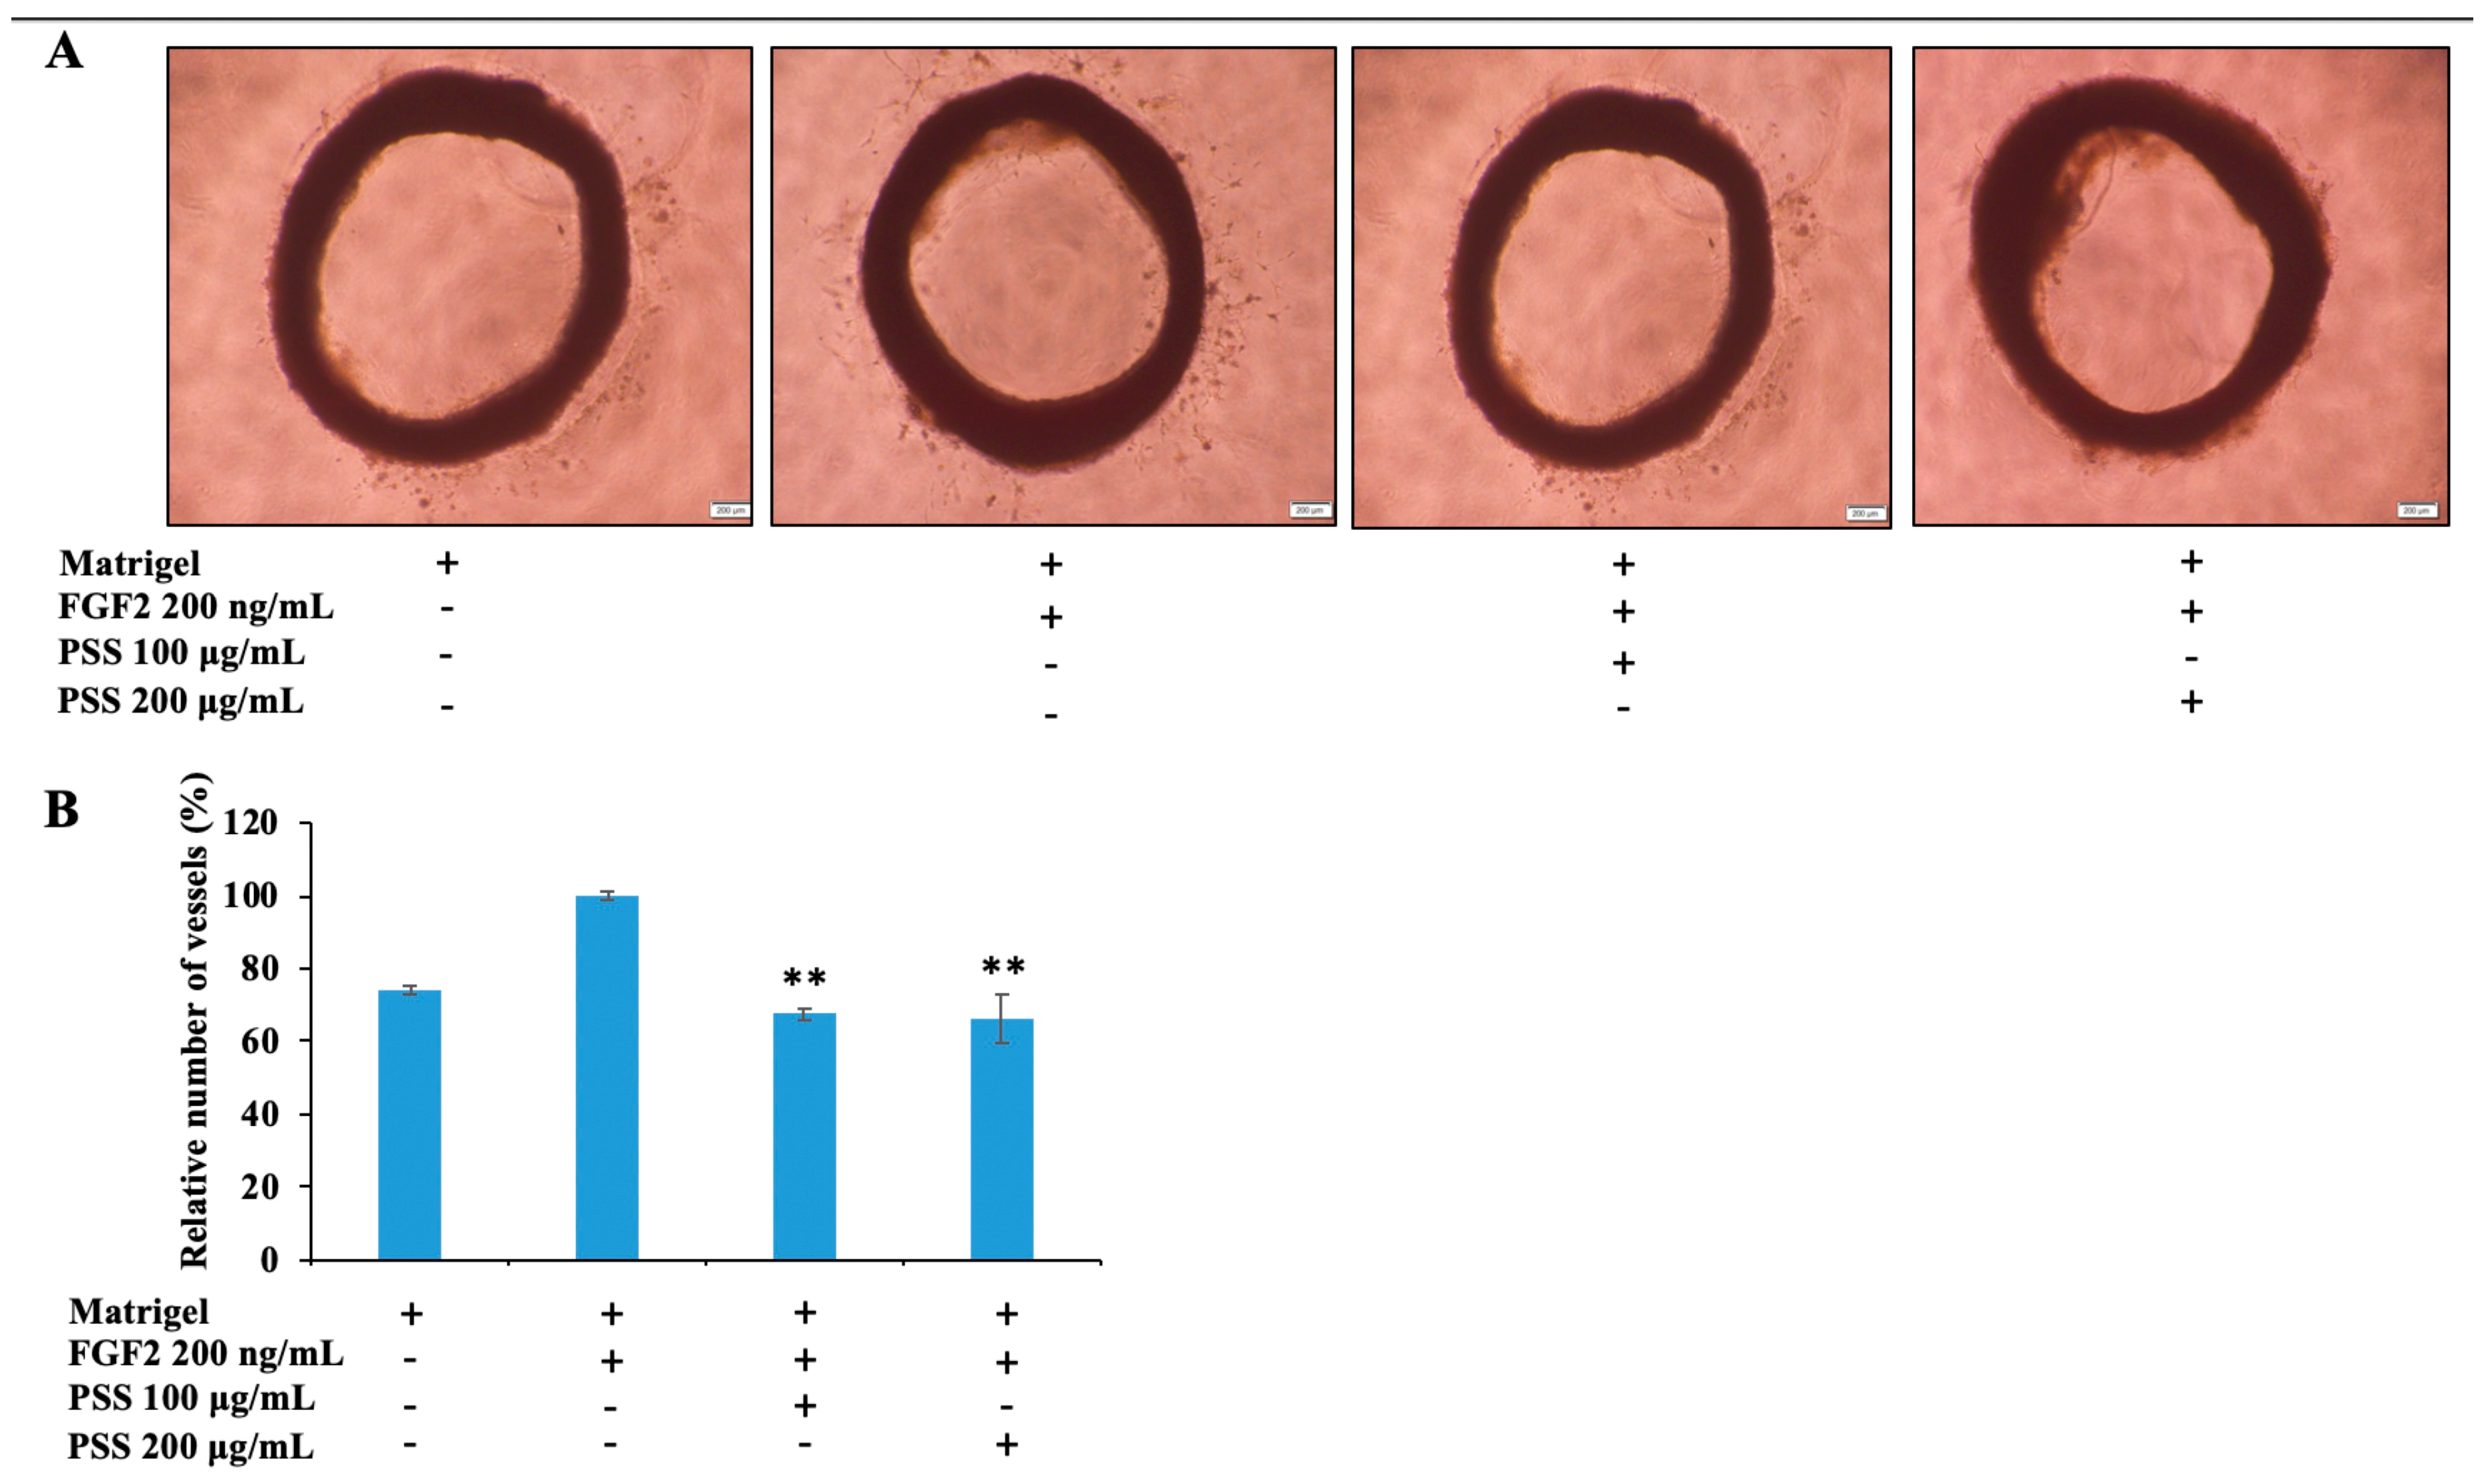
2.9. Propylene Glycol Alginate Sodium Sulfate Inhibited Fibroblast Growth Factor 2-Mediated Angiogenesis
3. Discussion
4. Materials and Methods
4.1. Cell Culture and Reagents
4.2. The Binding Kinetics of Propylene Glycol Alginate Sodium Sulfate and Fibroblast Growth Factor 2
4.3. Cell Invasion
4.4. Cell Proliferation Assay
4.5. Cell Migration
4.6. The Wound Healing Assay
4.7. Western Blot Analysis
4.8. In Situ Zymography Localization of Matrix Metalloproteinase 2 and Matrix Metalloproteinase 2 Activity
4.9. Rat Aortic Ring Assay
4.10. Chick Chorioallantoic Membrane Assay
4.11. Statistical Analysis
Supplementary Materials
Author Contributions
Funding
Conflicts of Interest
Abbreviations
| PSS | propylene glycol alginate sodium sulfate |
| CAM | chick chorioallantoic membrane |
| EMT | epithelial–mesenchymal transition |
| KD | dissociation constant |
| FGF | fibroblast growth factor |
| FGF2 | fibroblast growth factor 2 |
| FGFRs | fibroblast growth factor receptors |
| MMP-2 | matrix metalloproteinase 2 |
| MMP-9 | matrix metalloproteinase 9 |
| SPR | surface plasmon resonance |
| HS | heparan sulfate |
| HSPG | heparan sulfate proglycan |
| M | mannuronic acid |
| G | guluronic acid |
| HUVECs | human umbilical vein endothelial cells |
References
- De Aguiar, R.B.; Parise, C.B.; Souza, C.R.; Braggion, C.; Quintilio, W.; Moro, A.M.; Navarro Marques, F.L.; Buchpiguel, C.A.; Chammas, R.; de Moraes, J.Z. Blocking FGF2 with a new specific monoclonal antibody impairs angiogenesis and experimental metastatic melanoma, suggesting a potential role in adjuvant settings. Cancer Lett. 2016, 371, 151–160. [Google Scholar] [CrossRef] [PubMed]
- Rodeck, U.; Melber, K.; Kath, R.; Menssen, H.D.; Varello, M.; Atkinson, B.; Herlyn, M. Constitutive expression of multiple growth factor genes by melanoma cells but not normal melanocytes. J. Investig. Dermatol. 1991, 97, 20–26. [Google Scholar] [CrossRef] [PubMed]
- Rusnati, M.; Presta, M. Fibroblast growth factors/fibroblast growth factor receptors as targets for the development of anti-angiogenesis strategies. Curr. Pharm. Des. 2007, 13, 2025–2044. [Google Scholar] [CrossRef]
- Bikfalvi, A.; Klein, S.; Pintucci, G.; Rifkin, D.B. Biological roles of fibroblast growth factor-2. Endocr. Rev. 1997, 18, 26–45. [Google Scholar] [PubMed]
- Compagni, A.; Wilgenbus, P.; Impagnatiello, M.A.; Cotten, M.; Christofori, G. Fibroblast growth factors are required for efficient tumor angiogenesis. Cancer Res. 2000, 60, 7163–7169. [Google Scholar] [PubMed]
- Itoh, N.; Ornitz, D.M. Evolution of the Fgf and Fgfr gene families. Trends Genet. 2004, 20, 563–569. [Google Scholar] [CrossRef] [PubMed]
- Ibrahimi, O.A.; Zhang, F.; Hrstka, S.C.; Mohammadi, M.; Linhardt, R.J. Kinetic model for FGF, FGFR, and proteoglycan signal transduction complex assembly. Biochemistry 2004, 43, 4724–4730. [Google Scholar] [CrossRef]
- Brown, A.; Robinson, C.J.; Gallagher, J.T.; Blundell, T.L. Cooperative heparin-mediated oligomerization of fibroblast growth factor-1 (FGF1) precedes recruitment of FGFR2 to ternary complexes. Biophys. J. 2013, 104, 1720–1730. [Google Scholar] [CrossRef] [PubMed]
- Jaye, M.; Schlessinger, J.; Dionne, C.A. Fibroblast growth factor receptor tyrosine kinases: Molecular analysis and signal transduction. Biochim. Biophys. Acta 1992, 1135, 185–199. [Google Scholar] [CrossRef]
- Sterner, E.; Masuko, S.; Li, G.; Li, L.; Green, D.E.; Otto, N.J.; Xu, Y.; DeAngelis, P.L.; Liu, J.; Dordick, J.S.; et al. Fibroblast growth factor-based signaling through synthetic heparan sulfate blocks copolymers studied using high cell density three-dimensional cell printing. J. Biol. Chem. 2014, 289, 9754–9765. [Google Scholar] [CrossRef] [PubMed]
- Strutz, F.; Zeisberg, M.; Ziyadeh, F.N.; Yang, C.Q.; Kalluri, R.; Muller, G.A.; Neilson, E.G. Role of basic fibroblast growth factor-2 in epithelial-mesenchymal transformation. Kidney Int. 2002, 61, 1714–1728. [Google Scholar] [CrossRef] [Green Version]
- Liu, J.F.; Crepin, M.; Liu, J.M.; Barritault, D.; Ledoux, D. FGF-2 and TPA induce matrix metalloproteinase-9 secretion in MCF-7 cells through PKC activation of the Ras/ERK pathway. Biochem. Biophys. Res. Commun. 2002, 293, 1174–1182. [Google Scholar] [CrossRef]
- Chung, S.W.; Bae, S.M.; Lee, M.; Al-Hilal, T.A.; Lee, C.K.; Kim, J.K.; Kim, I.S.; Kim, S.Y.; Byun, Y. LHT7, a chemically modified heparin, inhibits multiple stages of angiogenesis by blocking VEGF, FGF2 and PDGF-B signaling pathways. Biomaterials. 2015, 37, 271–278. [Google Scholar] [CrossRef] [PubMed]
- Zeng, Y.; Yang, D.; Qiu, P.; Han, Z.; Zeng, P.; He, Y.; Guo, Z.; Xu, L.; Cui, Y.; Zhou, Z.; et al. Efficacy of Heparinoid PSS in Treating Cardiovascular Diseases and Beyond-A Review of 27 Years Clinical Experiences in China. Clin. Appl. Thromb. Hemost. 2016, 22, 222–229. [Google Scholar] [CrossRef]
- Xue, Y.T.; Ren, L.; Li, S.; Wang, L.L.; He, X.X.; Zhao, X.; Yu, G.L.; Guan, H.S.; Li, C.X. Study on quality control of sulfated polysaccharide drug, propylene glycol alginate sodium sulfate (PSS). Carbohydr. Polym. 2016, 144, 330–337. [Google Scholar] [CrossRef] [PubMed]
- Xin, M.; Ren, L.; Sun, Y.; Li, H.H.; Guan, H.S.; He, X.X.; Li, C.X. Anticoagulant and antithrombotic activities of low-molecular-weight propylene glycol alginate sodium sulfate (PSS). Eur. J. Med. Chem. 2016, 114, 33–40. [Google Scholar] [CrossRef] [PubMed]
- Ma, H.; Qiu, P.; Xin, M.; Xu, X.; Wang, Z.; Xu, H.; Yu, R.; Xu, X.; Zhao, C.; Wang, X.; et al. Structure-activity relationship of propylene glycol alginate sodium sulfate derivatives for blockade of selectins binding to tumor cells. Carbohydr. Polym. 2019, 210, 225–233. [Google Scholar] [CrossRef]
- Wu, J.; Zhang, M.; Zhang, Y.; Zeng, Y.; Zhang, L.; Zhao, X. Anticoagulant and FGF/FGFR signal activating activities of the heparinoid propylene glycol alginate sodium sulfate and its oligosaccharides. Carbohydr. Polym. 2016, 136, 641–648. [Google Scholar] [CrossRef]
- Li, L.Y.; Seddon, A.P. Fluorospectrometric analysis of heparin interaction with fibroblast growth factors. Growth Factors 1994, 11, 1–7. [Google Scholar] [CrossRef] [PubMed]
- Kamei, K.; Wu, X.; Xu, X.; Minami, K.; Huy, N.T.; Takano, R.; Kato, H.; Hara, S. The analysis of heparin-protein interactions using evanescent wave biosensor with regioselectively desulfated heparins as the ligands. Anal. Biochem. 2001, 295, 203–213. [Google Scholar] [CrossRef]
- Lee, M.K.; Lander, A.D. Analysis of affinity and structural selectivity in the binding of proteins to glycosaminoglycans: Development of a sensitive electrophoretic approach. Proc. Natl. Acad. Sci. USA 1991, 88, 2768–2772. [Google Scholar] [CrossRef] [PubMed]
- Cochran, S.; Li, C.; Fairweather, J.K.; Kett, W.C.; Coombe, D.R.; Ferro, V. Probing the interactions of phosphosulfomannans with angiogenic growth factors by surface plasmon resonance. J. Med. Chem. 2003, 46, 4601–4608. [Google Scholar] [CrossRef]
- Faham, S.; Hileman, R.E.; Fromm, J.R.; Linhardt, R.J.; Rees, D.C. Heparin structure and interactions with basic fibroblast growth factor. Science. 1996, 271, 1116–1120. [Google Scholar] [CrossRef] [PubMed]
- Turnbull, J.E.; Fernig, D.G.; Ke, Y.; Wilkinson, M.C.; Gallagher, J.T. Identification of the basic fibroblast growth factor binding sequence in fibroblast heparan sulfate. J. Biol. Chem. 1992, 267, 10337–10341. [Google Scholar]
- Guimond, S.; Maccarana, M.; Olwin, B.B.; Lindahl, U.; Rapraeger, A.C. Activating and inhibitory heparin sequences for FGF-2 (basic FGF). Distinct requirements for FGF-1, FGF-2, and FGF-4. J. Biol. Chem. 1993, 268, 23906–23914. [Google Scholar]
- Pye, D.A.; Vives, R.R.; Turnbull, J.E.; Hyde, P.; Gallagher, J.T. Heparan sulfate oligosaccharides require 6-O-sulfation for promotion of basic fibroblast growth factor mitogenic activity. J. Biol. Chem. 1998, 273, 22936–22942. [Google Scholar] [CrossRef]
- Zhao, W.; McCallum, S.A.; Xiao, Z.; Zhang, F.; Linhardt, R.J. Binding affinities of vascular endothelial growth factor (VEGF) for heparin-derived oligosaccharides. Biosci. Rep. 2012, 32, 71–81. [Google Scholar] [CrossRef]
- Stevenson, J.L.; Choi, S.H.; Varki, A. Differential metastasis inhibition by clinically relevant levels of heparins--correlation with selectin inhibition, not antithrombotic activity. Clin. Cancer Res. 2005, 11, 7003–7011. [Google Scholar] [CrossRef]
- Duan, Y.; Zhao, X.; Ren, W.; Wang, X.; Yu, K.F.; Li, D.; Zhang, X.; Zhang, Q. Antitumor activity of dichloroacetate on C6 glioma cell: In vitro and in vivo evaluation. Onco. Targets Ther. 2013, 6, 189–198. [Google Scholar]
- Xin, H.; Liang, W.; Mang, J.; Lin, L.; Guo, N.; Zhang, F.; Xu, Z. Relationship of gelatinases-tight junction proteins and blood-brain barrier permeability in the early stage of cerebral ischemia and reperfusion. Neural Regen. Res. 2012, 7, 2405–2412. [Google Scholar] [PubMed]
- Wang, Z.; Chen, Z.; Yang, J.; Yang, Z.; Yin, J.; Duan, X.; Shen, H.; Li, H.; Wang, Z.; Chen, G. Treatment of secondary brain injury by perturbing postsynaptic density protein-95-NMDA receptor interaction after intracerebral hemorrhage in rats. J. Cereb. Blood Flow Metab. 2018. [Google Scholar] [CrossRef] [PubMed]


© 2019 by the authors. Licensee MDPI, Basel, Switzerland. This article is an open access article distributed under the terms and conditions of the Creative Commons Attribution (CC BY) license (http://creativecommons.org/licenses/by/4.0/).
Share and Cite
Ma, H.; Qiu, P.; Xu, H.; Xu, X.; Xin, M.; Chu, Y.; Guan, H.; Li, C.; Yang, J. The Inhibitory Effect of Propylene Glycol Alginate Sodium Sulfate on Fibroblast Growth Factor 2-Mediated Angiogenesis and Invasion in Murine Melanoma B16-F10 Cells In Vitro. Mar. Drugs 2019, 17, 257. https://0-doi-org.brum.beds.ac.uk/10.3390/md17050257
Ma H, Qiu P, Xu H, Xu X, Xin M, Chu Y, Guan H, Li C, Yang J. The Inhibitory Effect of Propylene Glycol Alginate Sodium Sulfate on Fibroblast Growth Factor 2-Mediated Angiogenesis and Invasion in Murine Melanoma B16-F10 Cells In Vitro. Marine Drugs. 2019; 17(5):257. https://0-doi-org.brum.beds.ac.uk/10.3390/md17050257
Chicago/Turabian StyleMa, He, Peiju Qiu, Huixin Xu, Ximing Xu, Meng Xin, Yanyan Chu, Huashi Guan, Chunxia Li, and Jinbo Yang. 2019. "The Inhibitory Effect of Propylene Glycol Alginate Sodium Sulfate on Fibroblast Growth Factor 2-Mediated Angiogenesis and Invasion in Murine Melanoma B16-F10 Cells In Vitro" Marine Drugs 17, no. 5: 257. https://0-doi-org.brum.beds.ac.uk/10.3390/md17050257