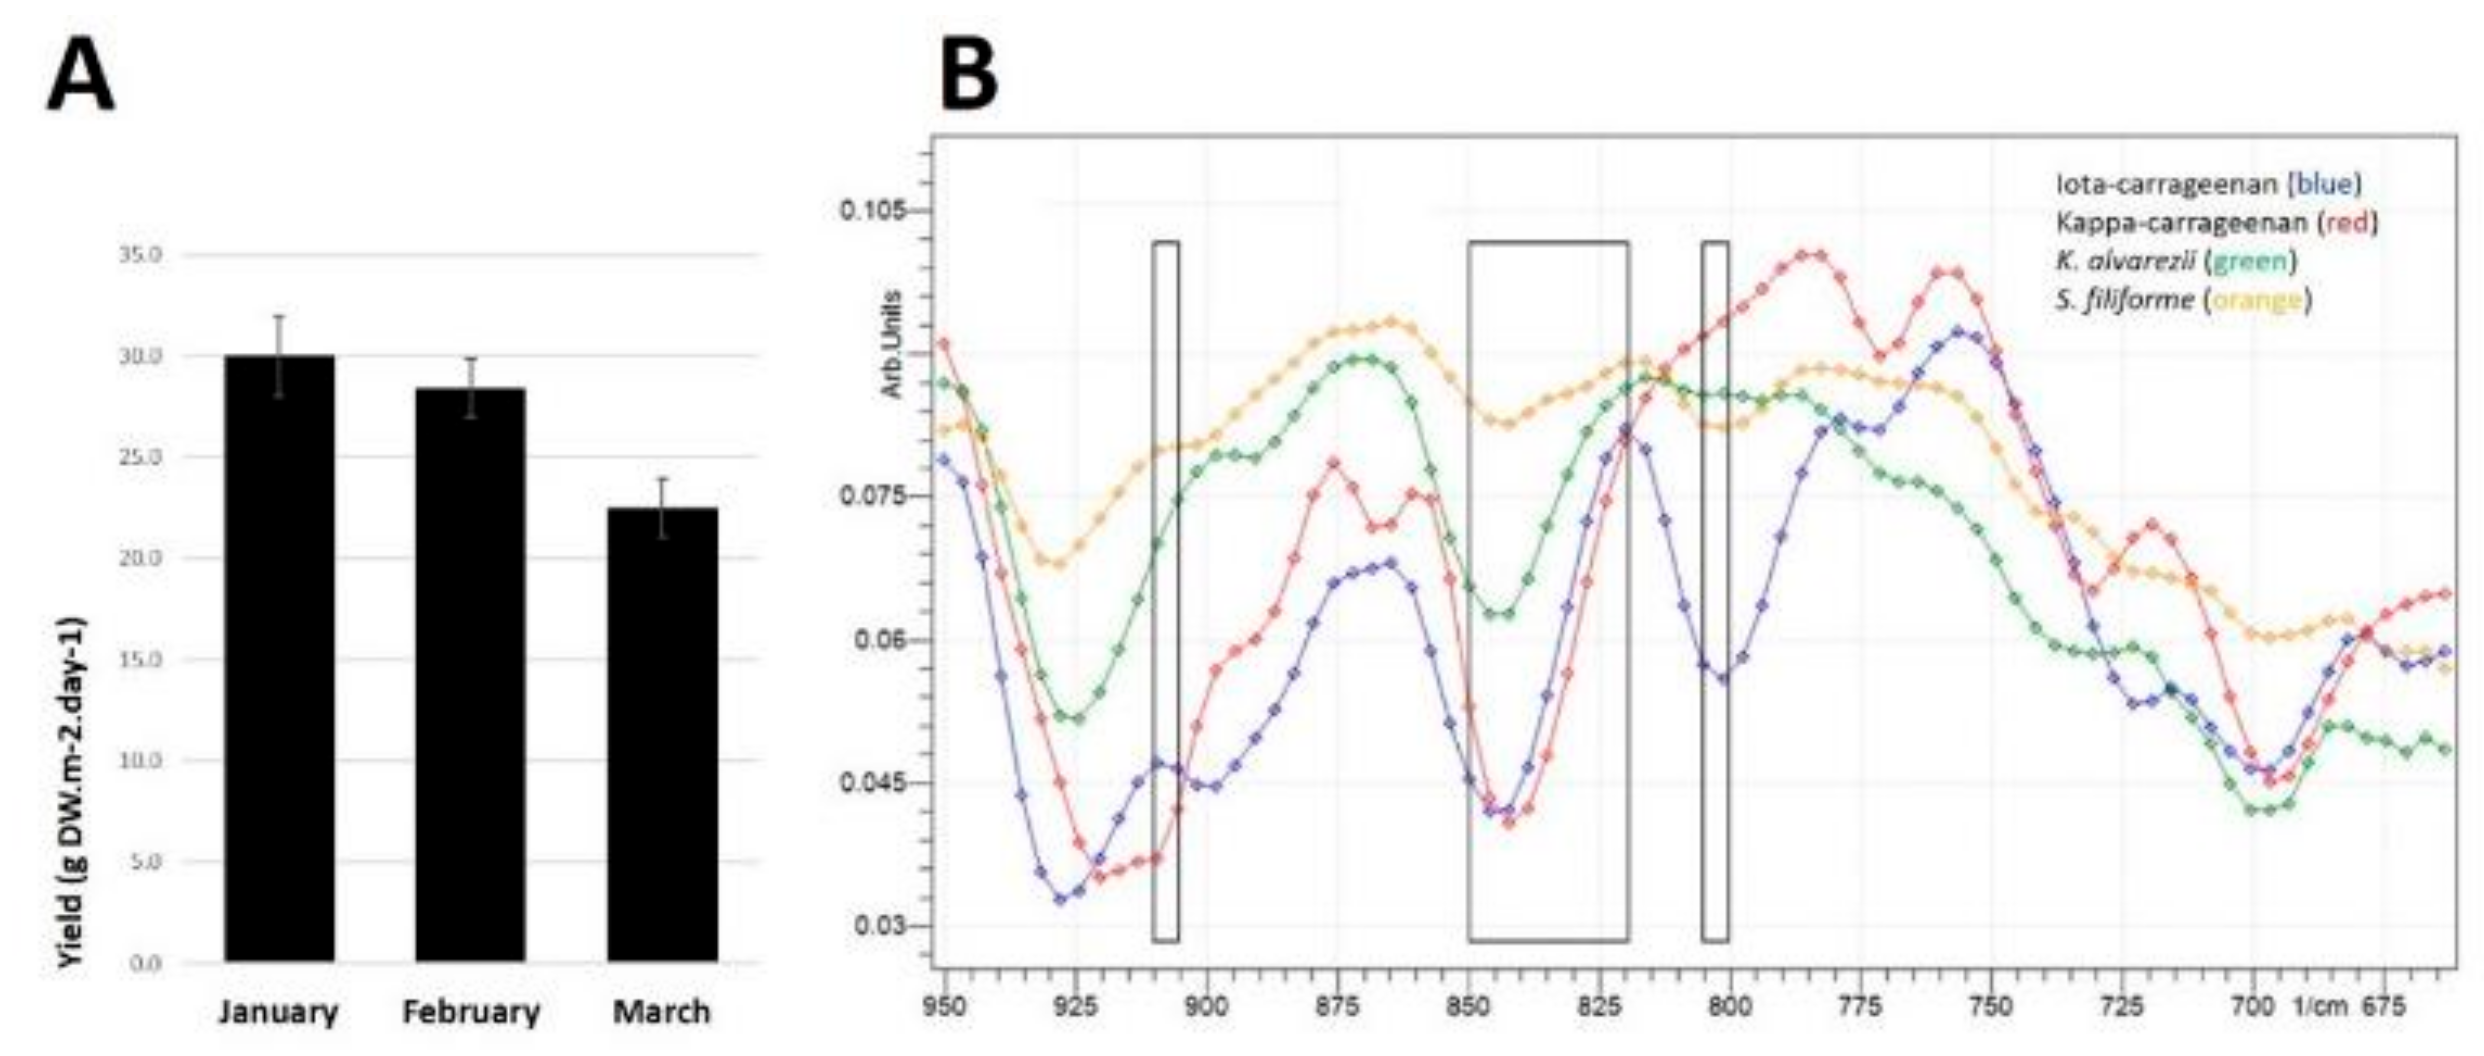
Figure 1.
(A) Biomass yields of Sarconema filiforme between January and March 2018. Data show means ± SEM, n = 20–27 weekly growth measurements from 1000 L outdoor tanks from each month. (B) Attenuated Total Reflectance-Fourier-Transform Infrared Spectroscopy (ATR-FTIR) transmittance from 950 to 675 cm−1 of ι-carrageenan (blue line), κ-carrageenan (red line), Kappaphycus alvarezii (green line) and Sarconema filiforme (orange line). Far left rectangle showing 900–905 cm−1, middle rectangle showing 820-850 cm−1 and far right rectange showing 800–805 cm−1.
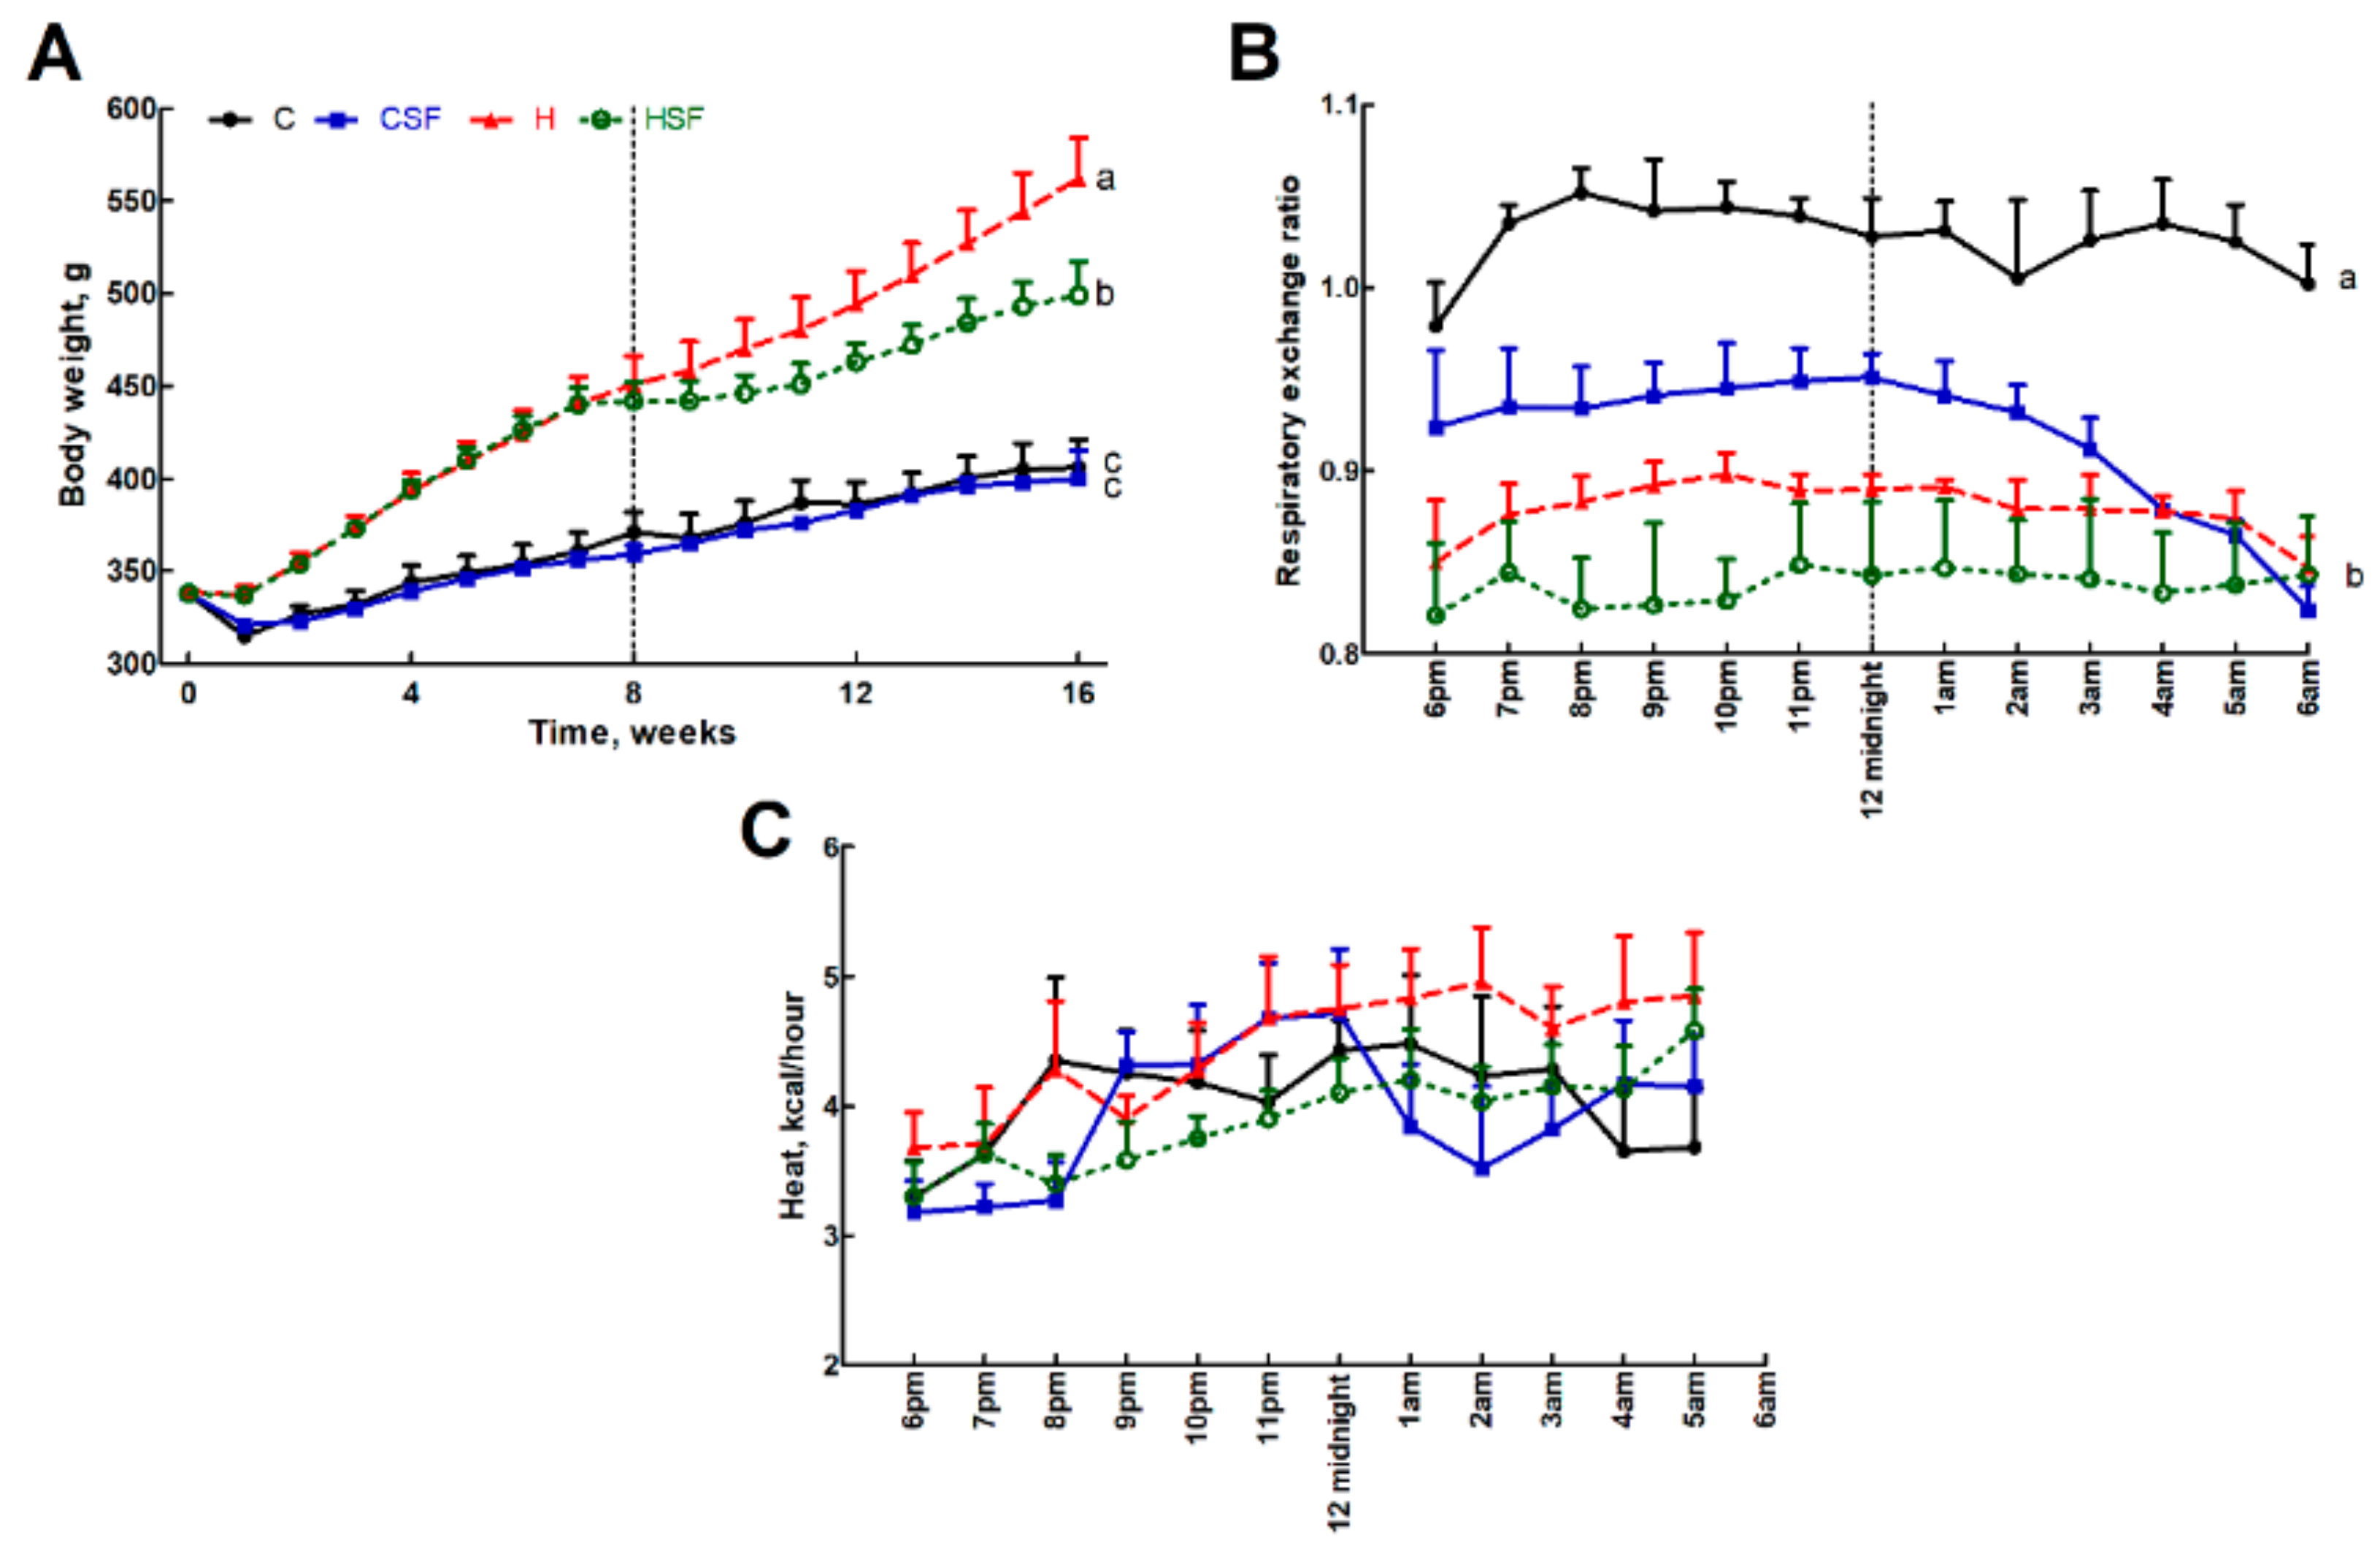
Figure 2.
(A) Body weight, (B) 12-hour indirect calorimeter data for respiratory exchange ratio and (C) heat production in corn starch diet-fed rats (C), corn starch diet-fed rats supplemented with Sarconema filiforme (CSF), high-carbohydrate, high-fat diet-fed rats (H) and high-carbohydrate, high-fat diet-fed rats supplemented with Sarconema filiforme (HSF). End-point means with unlike superscripts differ (a, b or c), p < 0.05.
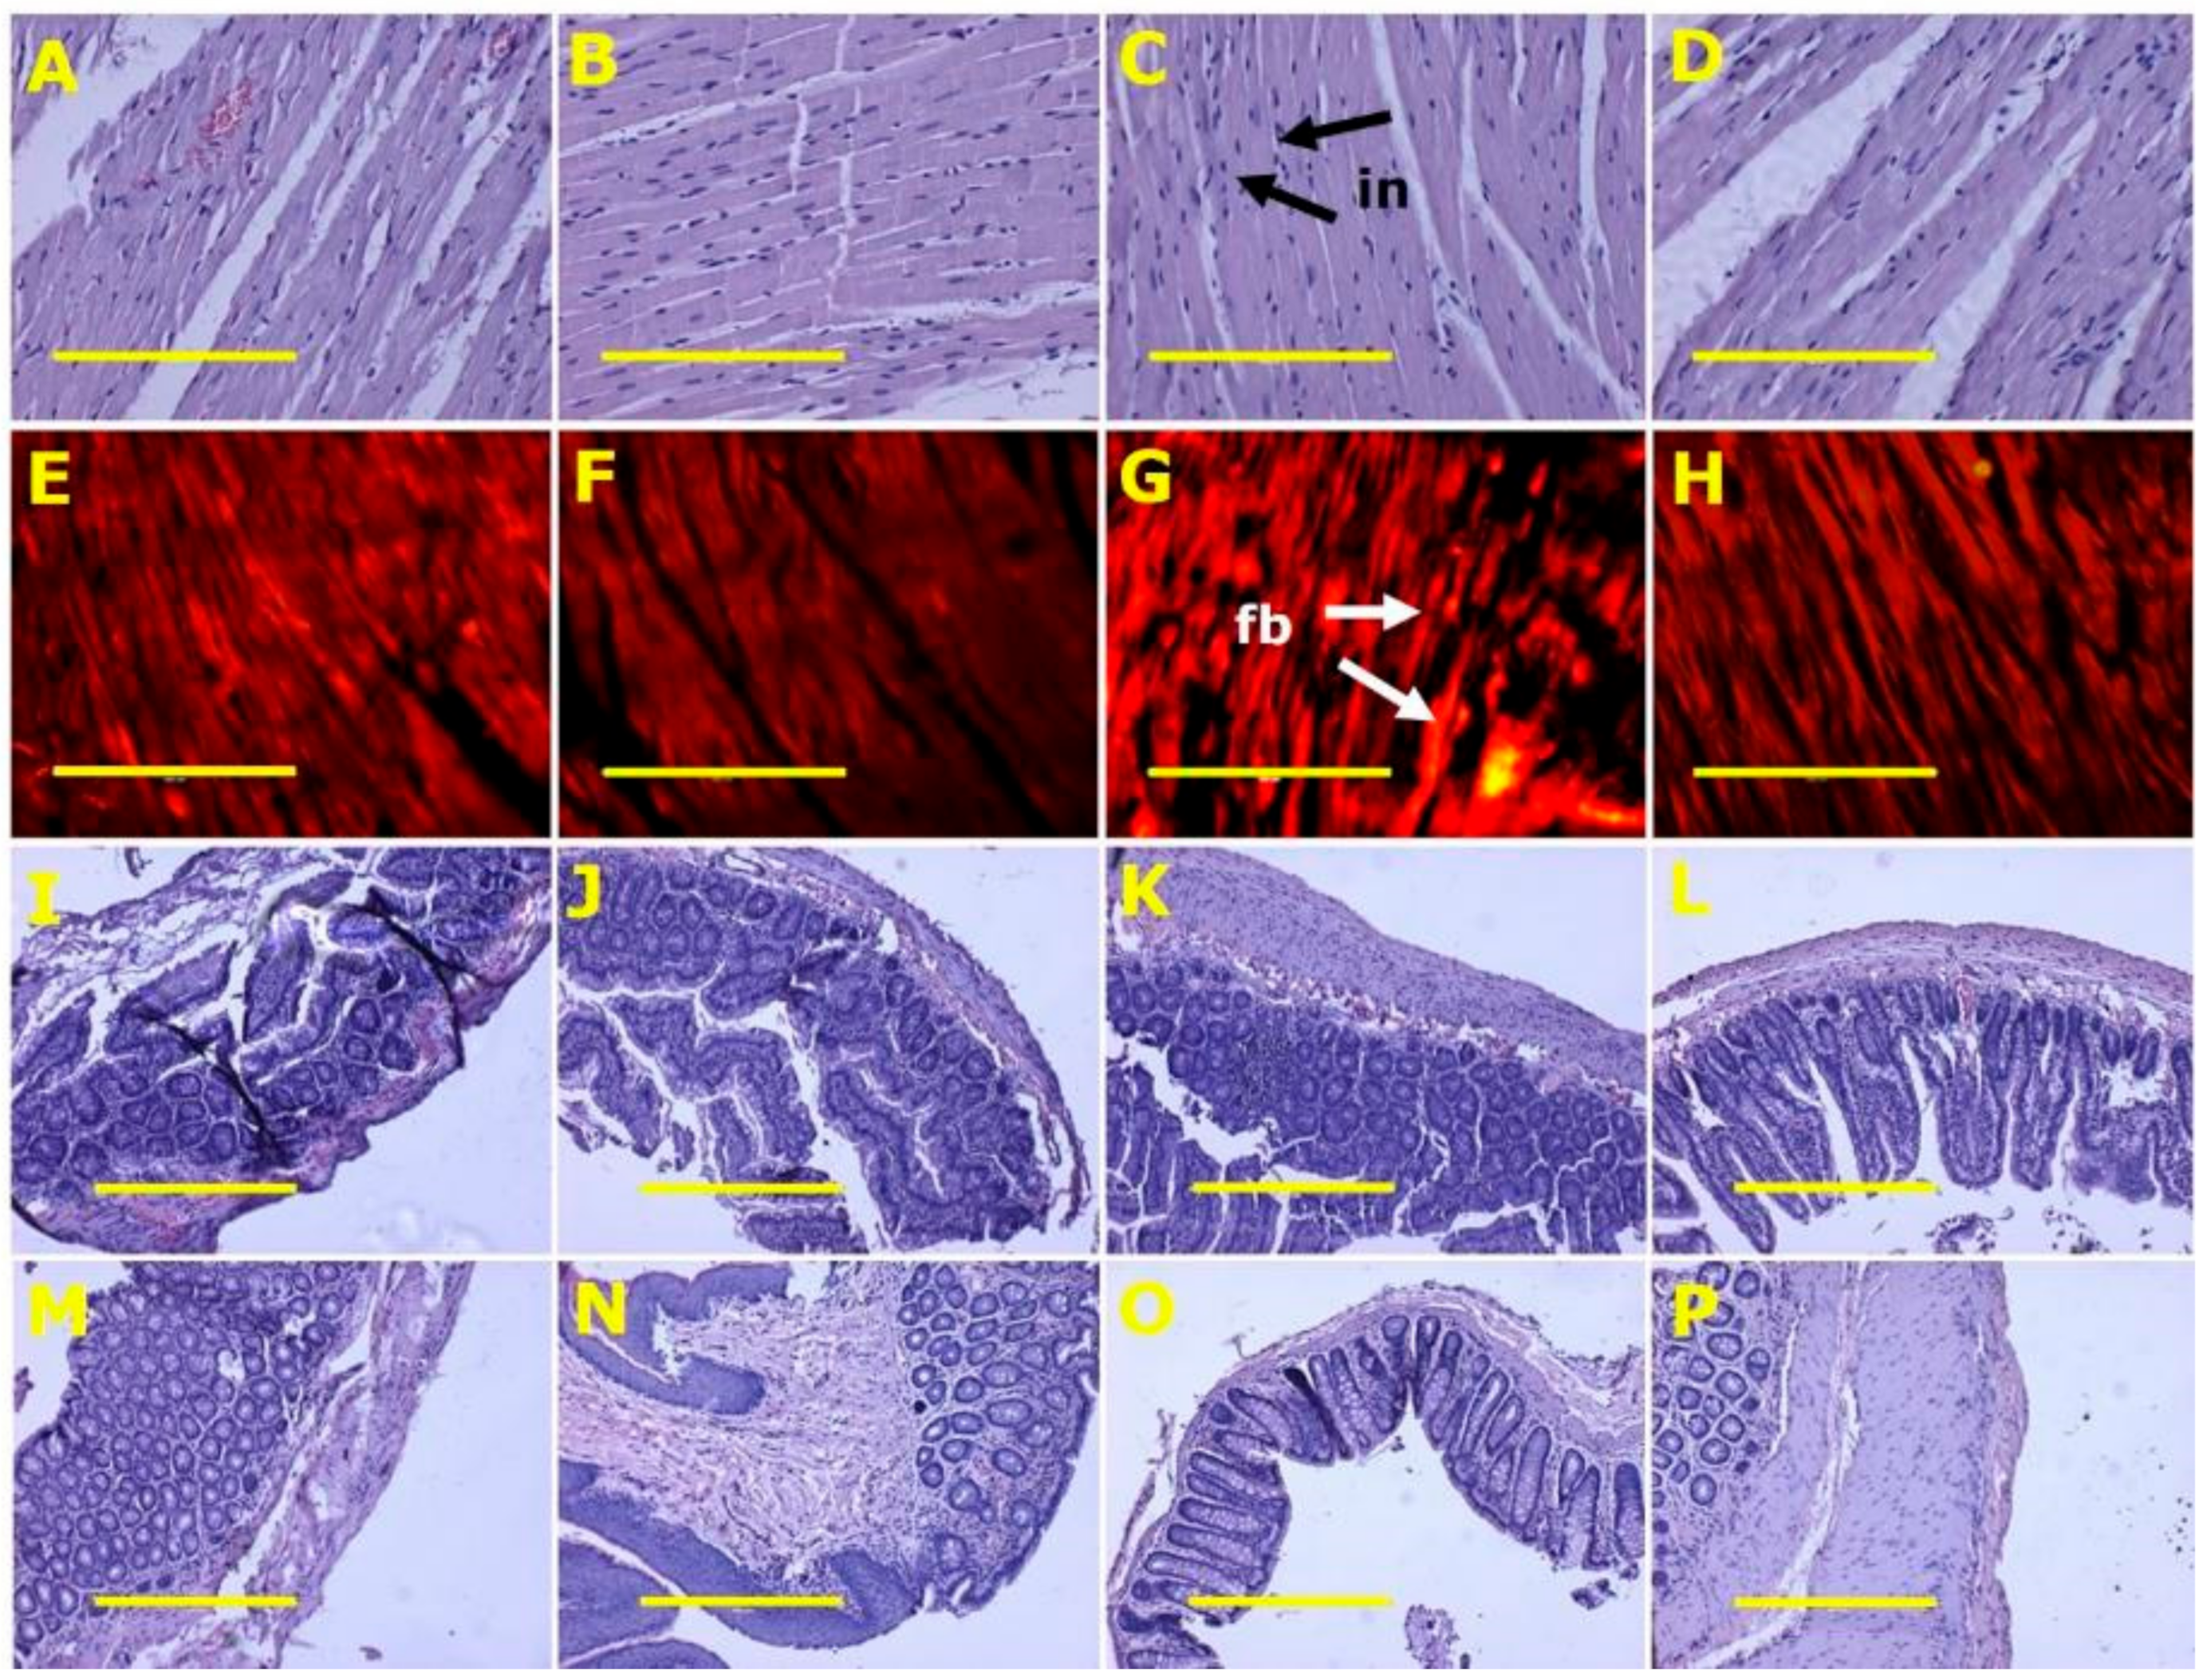
Figure 3.
Heart inflammation (A–D) using haematoxylin and eosin stain; heart fibrosis (E–H) using picrosirius red stain; ileum (I–L) and colon (M–P) structure using haematoxylin and eosin stain in corn starch diet-fed rats (A,E,I,M), corn starch diet-fed rats supplemented with Sarconema filiforme (B,F,J,N), high-carbohydrate, high-fat diet-fed rats (C,G,K,O) and high-carbohydrate, high-fat diet-fed rats supplemented with Sarconema filiforme (D,H,L,P). Fibrosis = fb; inflammation = in. Scale bar for images A-H is 200µm (20×) and for images I-P is 100µm (10×).
Figure 4.
Fat vacuoles (A–D) and inflammation (E–H) using haematoxylin and eosin and liver fat using oil red O stain (I–L) in corn starch diet-fed rats (A,E,I), corn starch diet-fed rats supplemented with Sarconema filiforme (B,F,J), high-carbohydrate, high-fat diet-fed rats (C,G,K) and high-carbohydrate, high-fat diet-fed rats supplemented with Sarconema filiforme (D,H,L). Fat vacuole containing cells = fc; inflammatory cells = in. Scale bar is 200µm (20×).
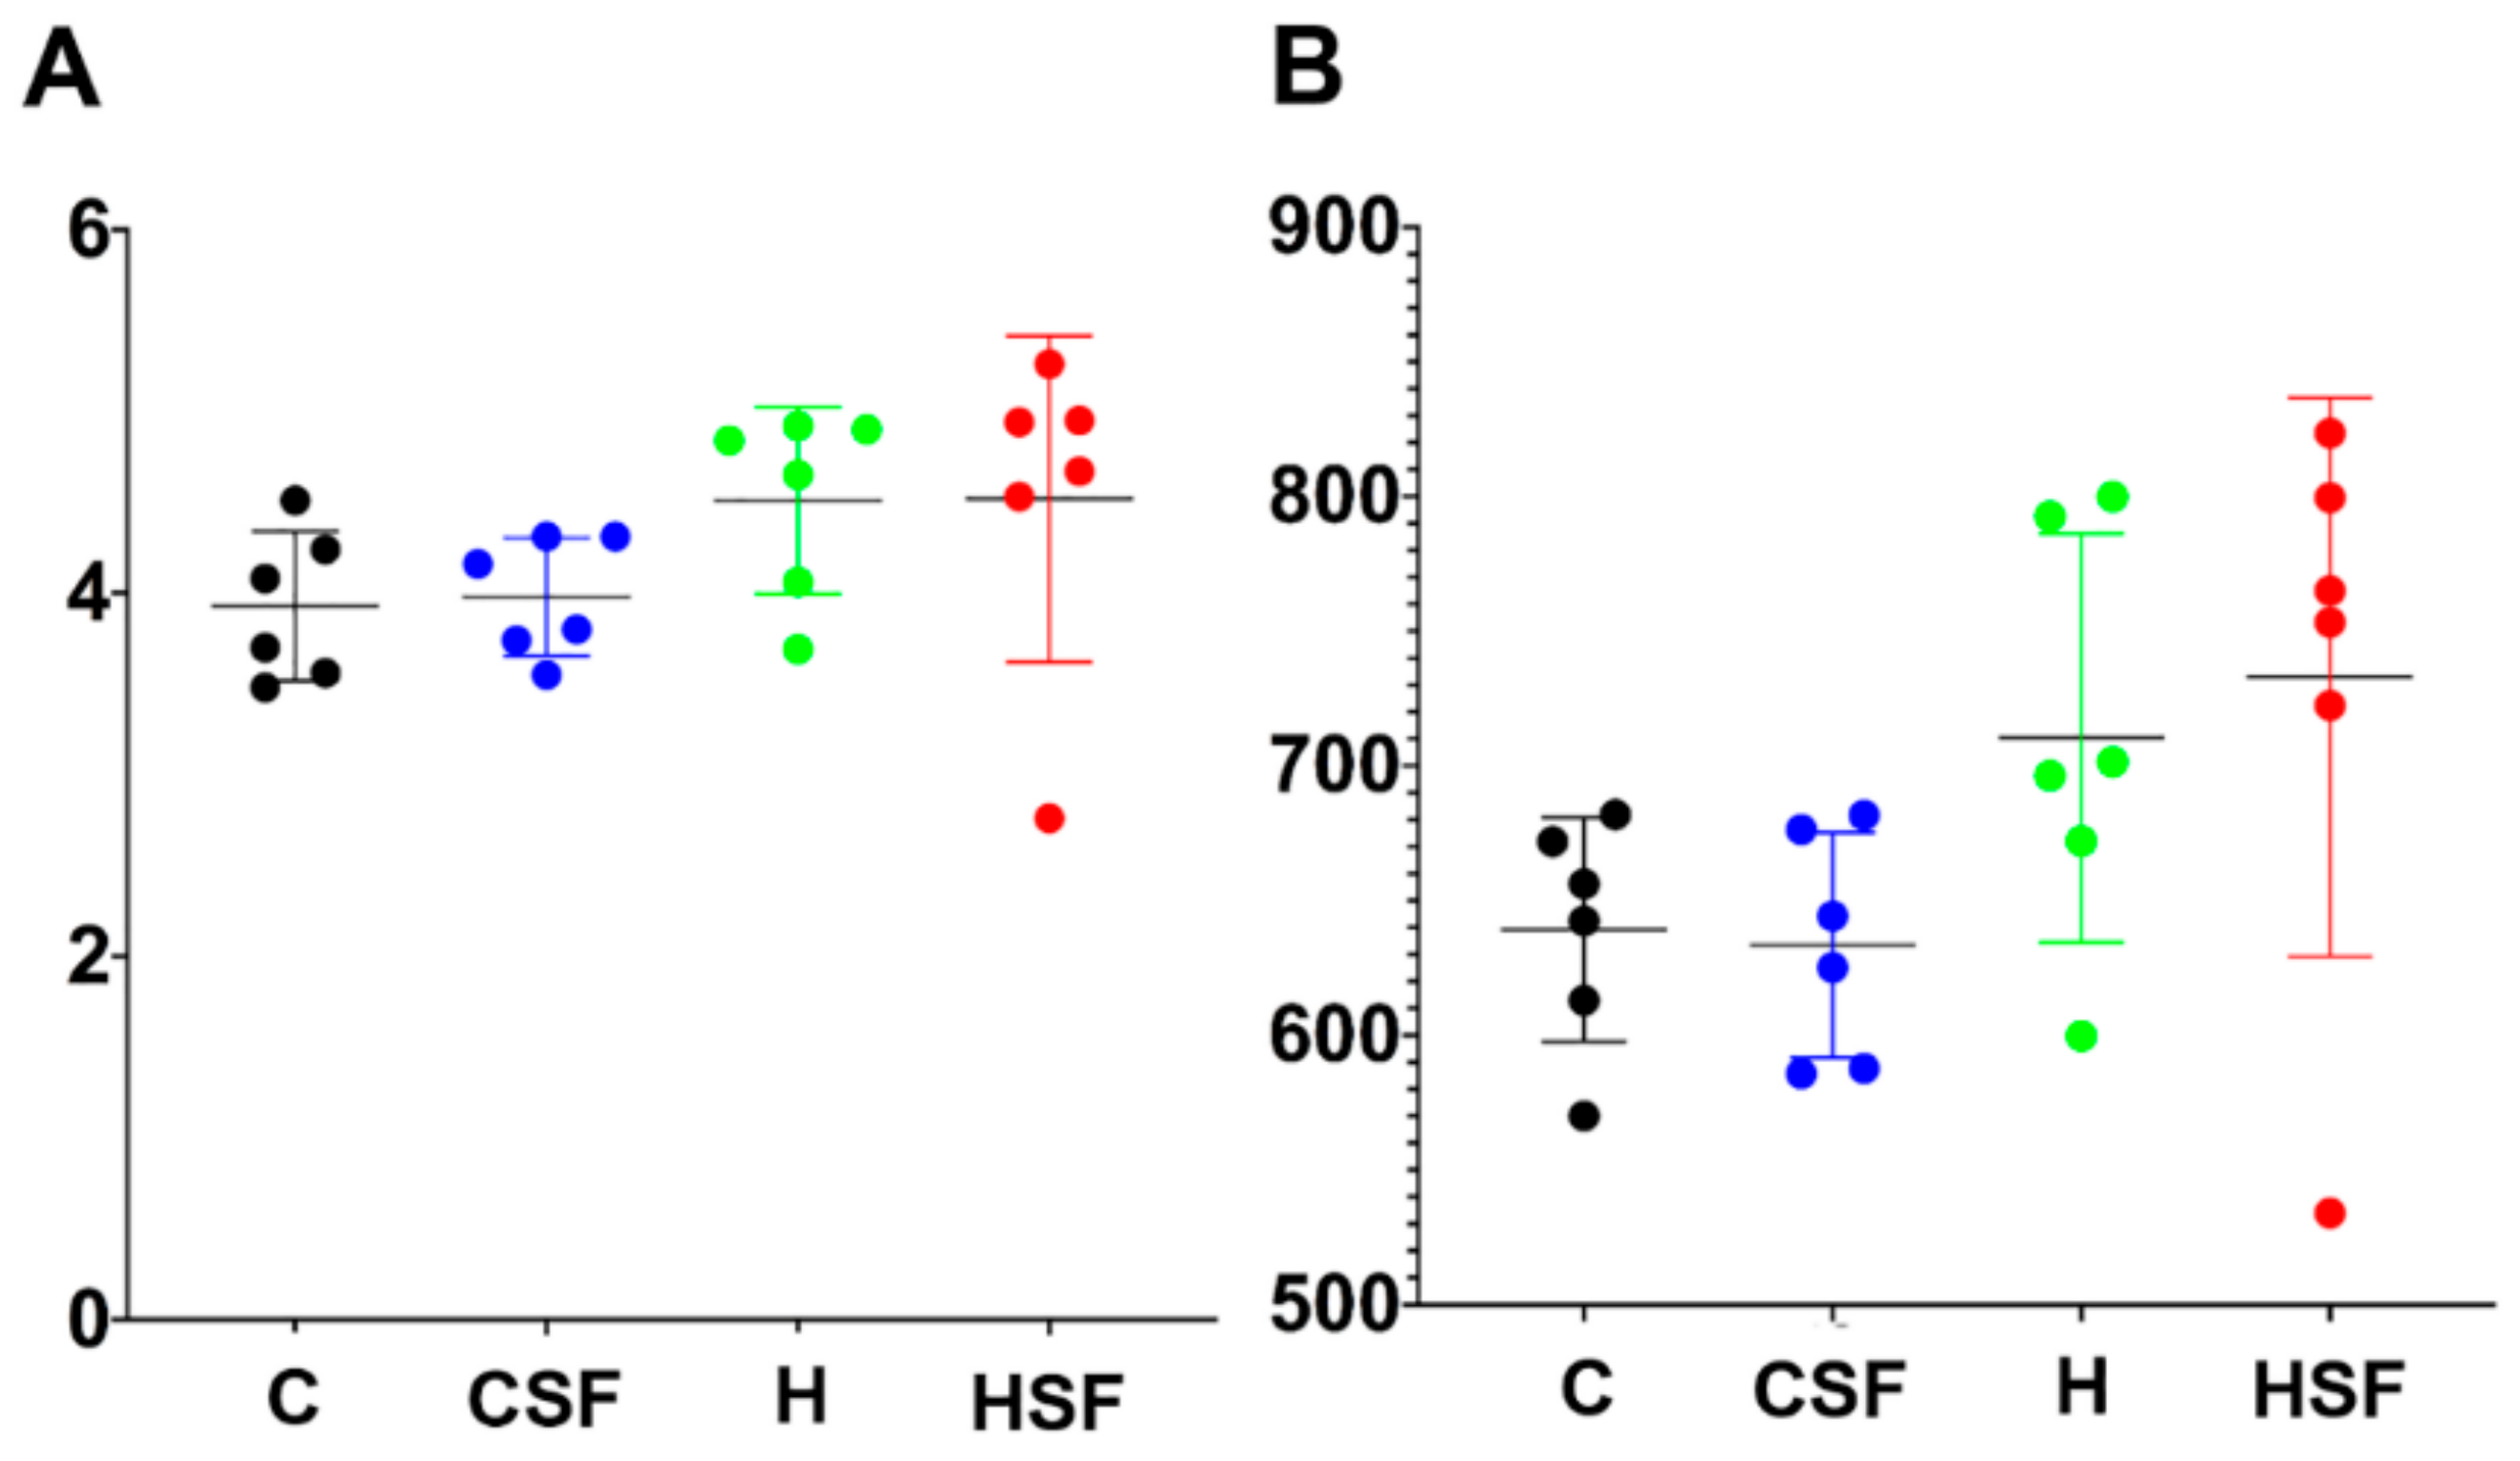
Figure 5.
(A) Shannon diversity and (B) richness of faecal samples. C, corn starch diet-fed rats; CSF, corn starch diet-fed rats supplemented with Sarconema filiforme; H, high-carbohydrate, high-fat diet-fed rats; HSF, high-carbohydrate, high-fat diet-fed rats supplemented with Sarconema filiforme.
Figure 5.
(A) Shannon diversity and (B) richness of faecal samples. C, corn starch diet-fed rats; CSF, corn starch diet-fed rats supplemented with Sarconema filiforme; H, high-carbohydrate, high-fat diet-fed rats; HSF, high-carbohydrate, high-fat diet-fed rats supplemented with Sarconema filiforme.
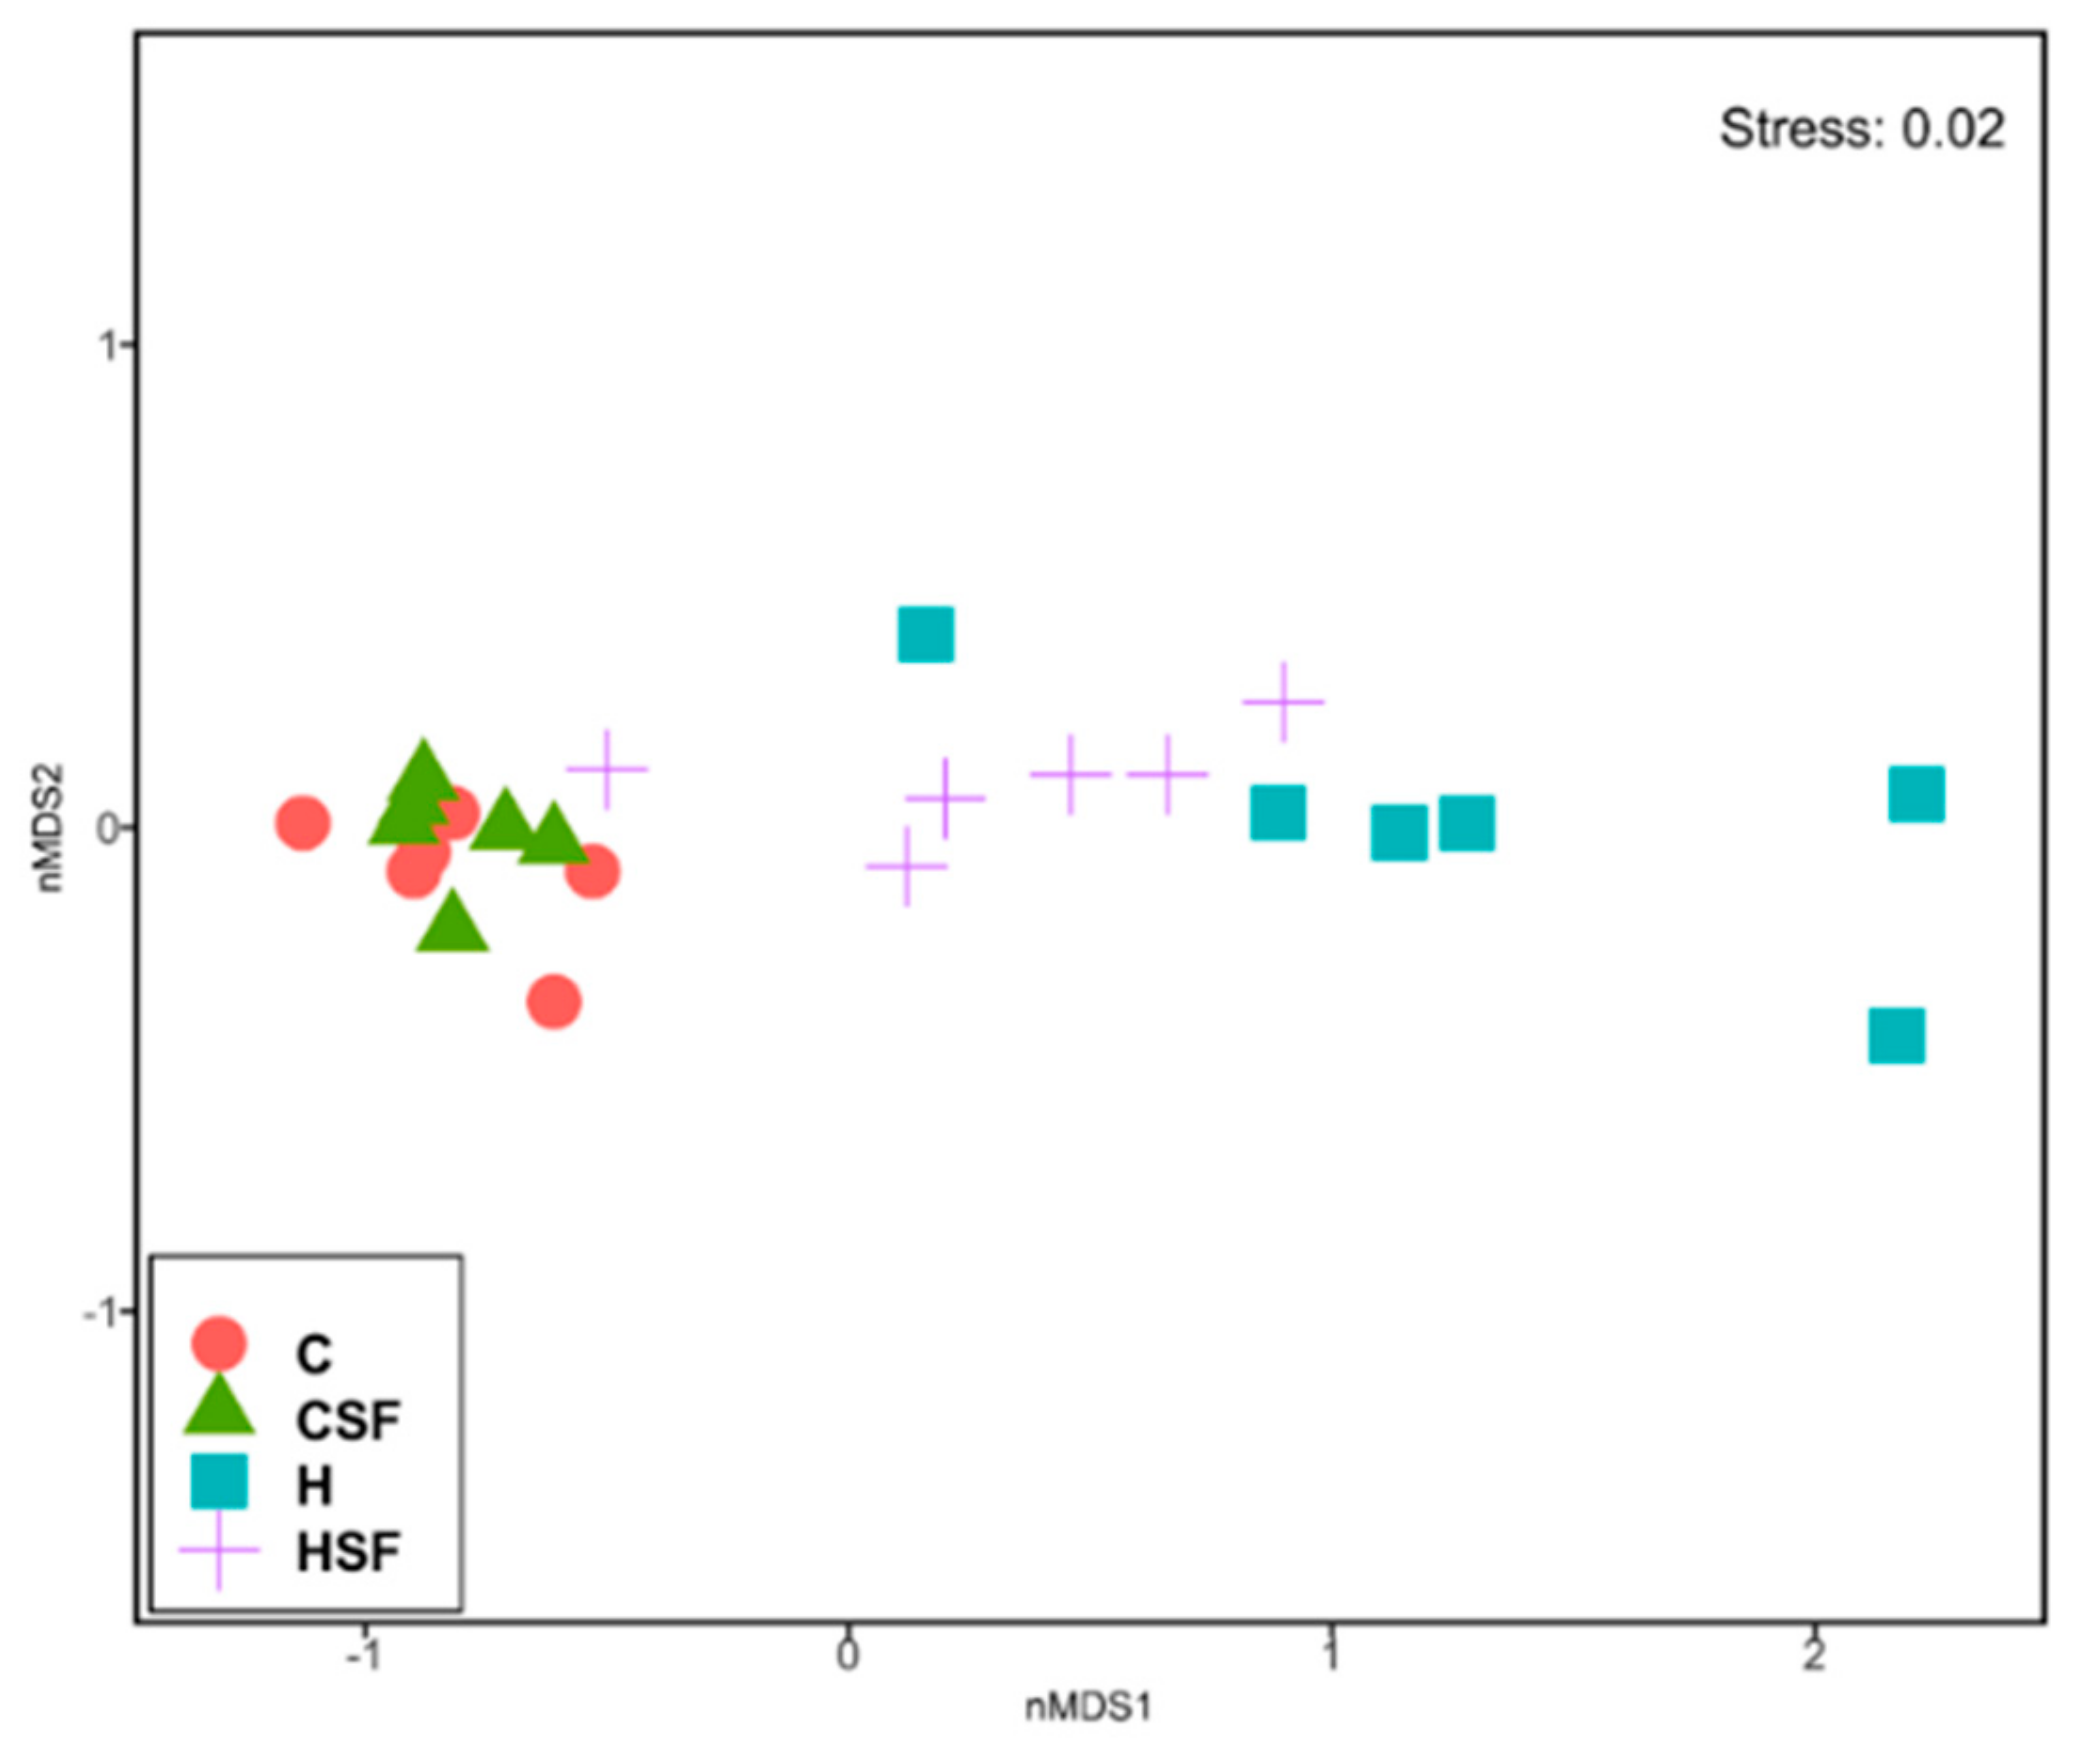
Figure 6.
Multi-disciplinary scaling (MDS) plot of bacterial community structure of faecal samples from different feeding regimes. C, corn starch diet-fed rats; CSF, corn starch diet-fed rats supplemented with Sarconema filiforme; H, high-carbohydrate, high-fat diet-fed rats; HSF, high-carbohydrate, high-fat diet-fed rats supplemented with Sarconema filiforme.
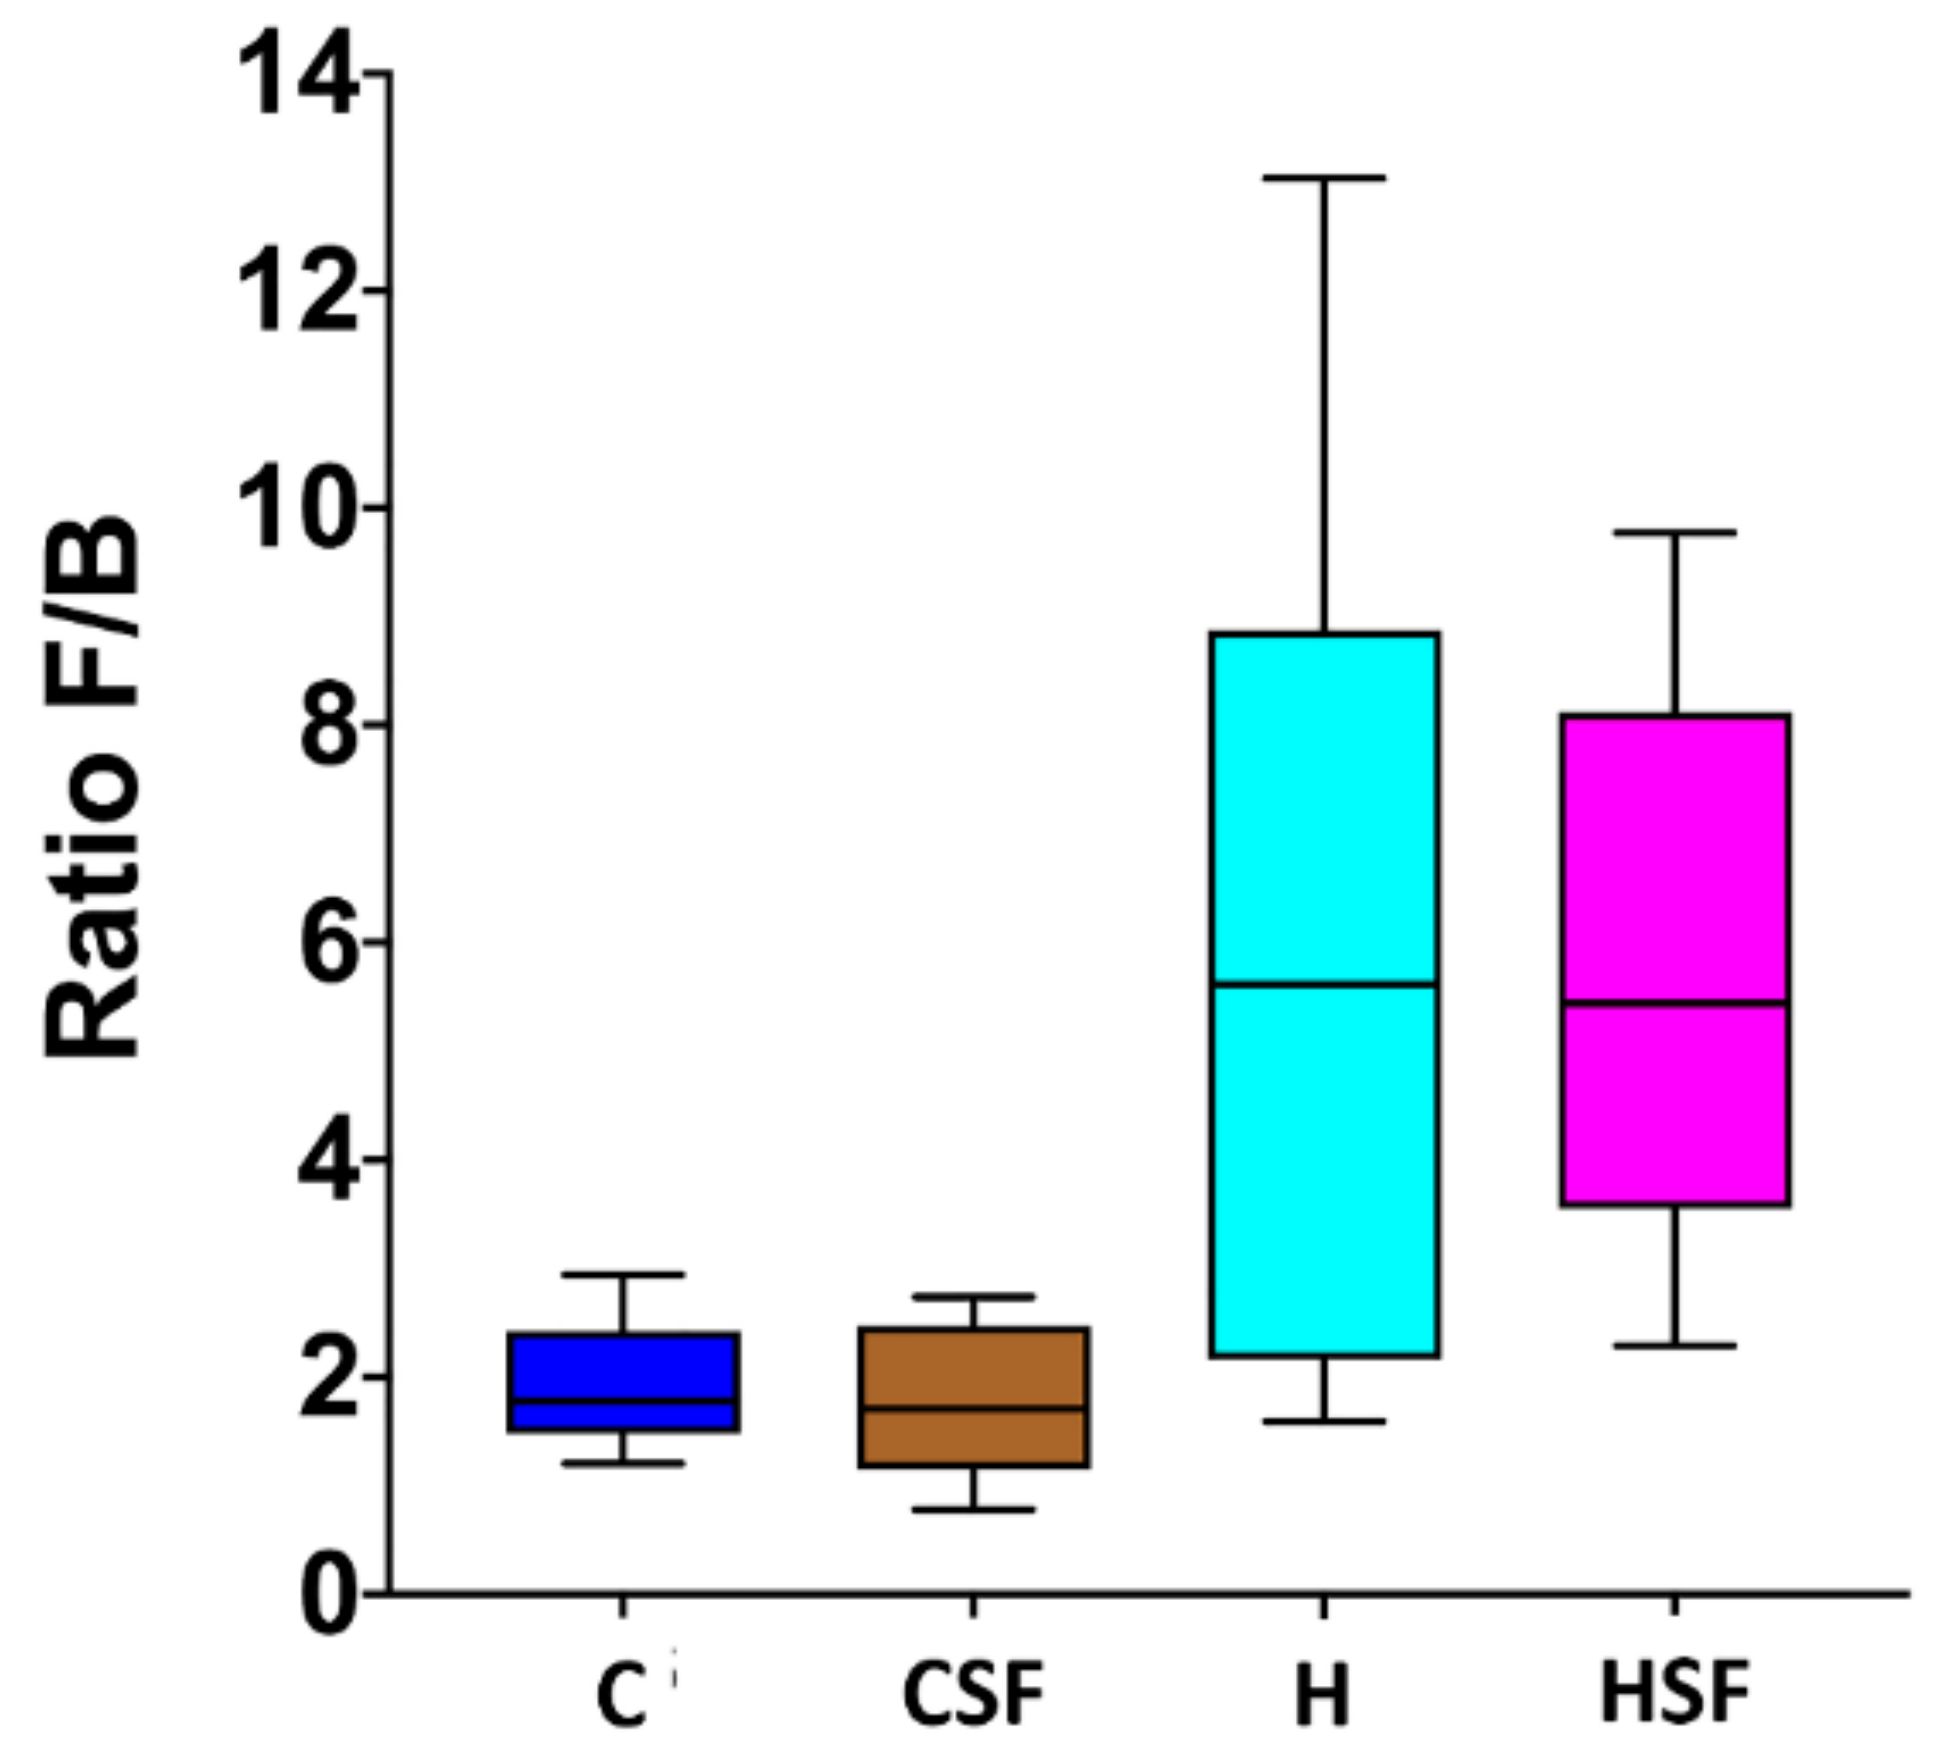
Figure 7.
Effect of supplementation of diet (C or H) with Sarconema filiforme on the ratio of Firmicutes and Bacteroidetes abundances in rat faecal samples. Statistical analysis performed using ANOVA with Tukey’s post hoc test for multiple comparisons. C, corn starch diet-fed rats; CSF, corn starch diet-fed rats supplemented with Sarconema filiforme; H, high-carbohydrate, high-fat diet-fed rats; HSF, high-carbohydrate, high-fat diet-fed rats supplemented with Sarconema filiforme.
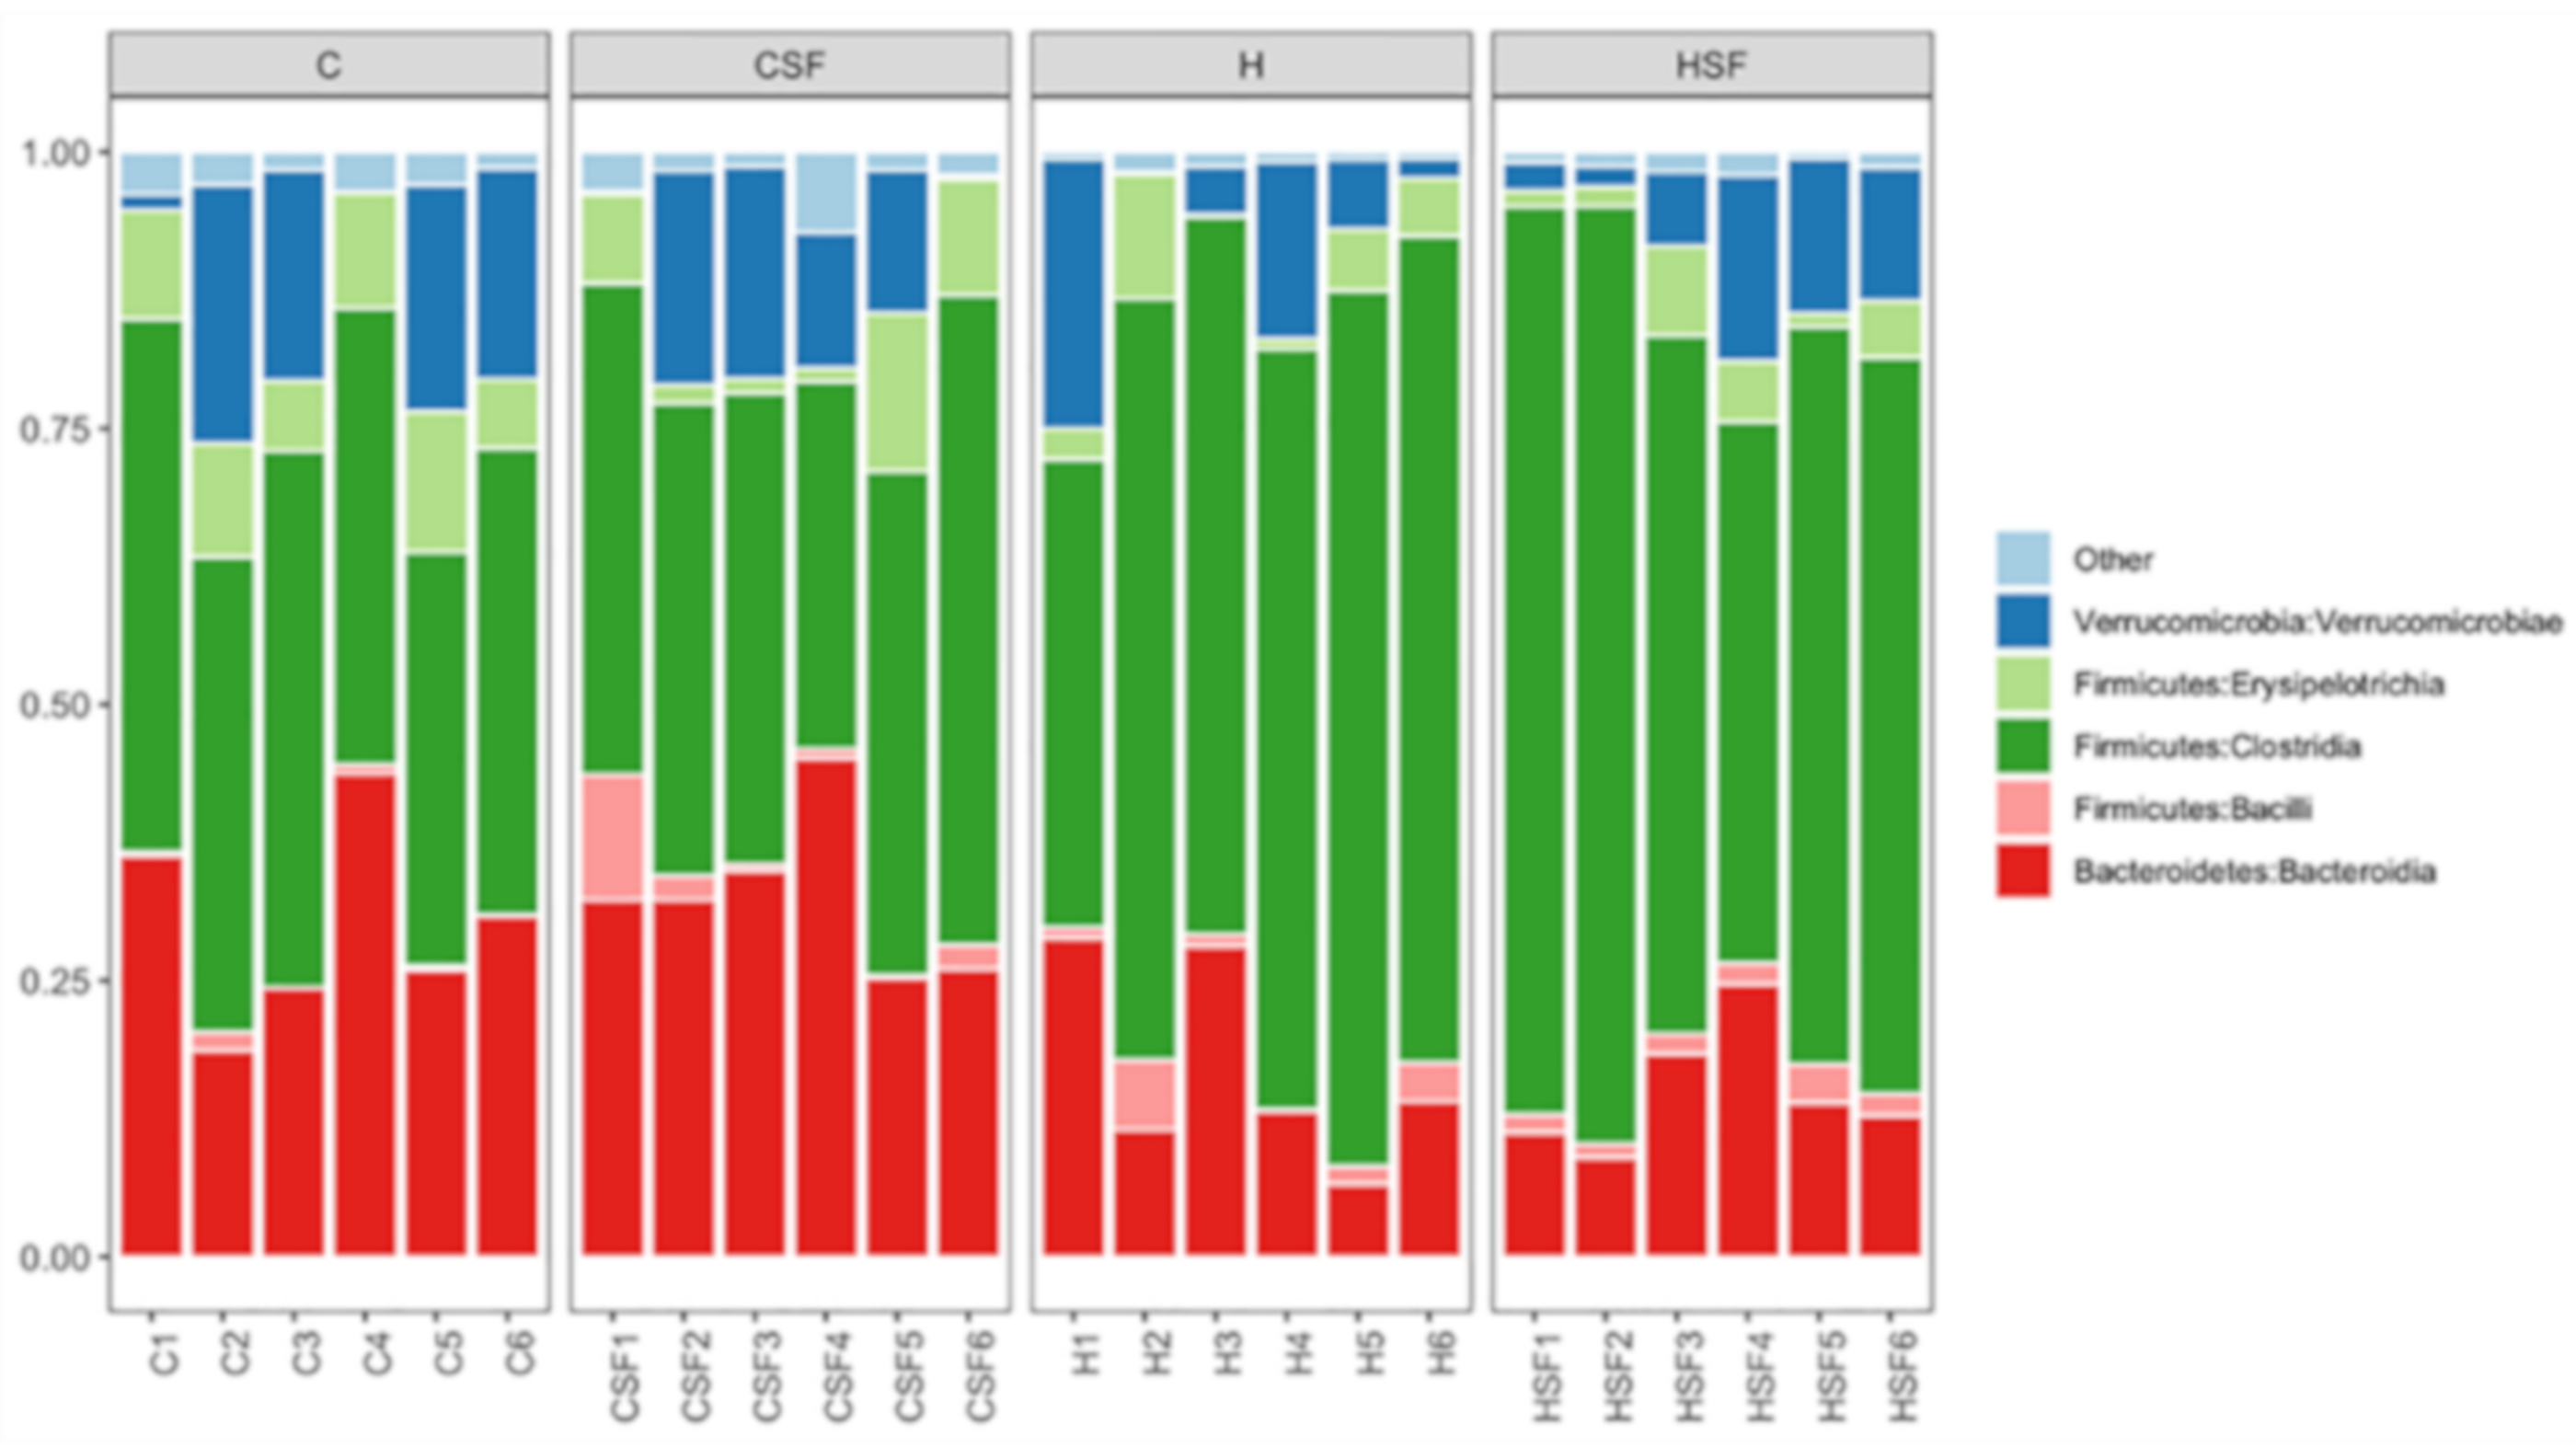
Figure 8.
Taxonomic profiles of bacterial communities shown at the class level of all faecal samples. C, corn starch diet-fed rats; CSF, corn starch diet-fed rats supplemented with Sarconema filiforme; H, high-carbohydrate, high-fat diet-fed rats; and HSF, high-carbohydrate, high-fat diet-fed rats supplemented with Sarconema filiforme.
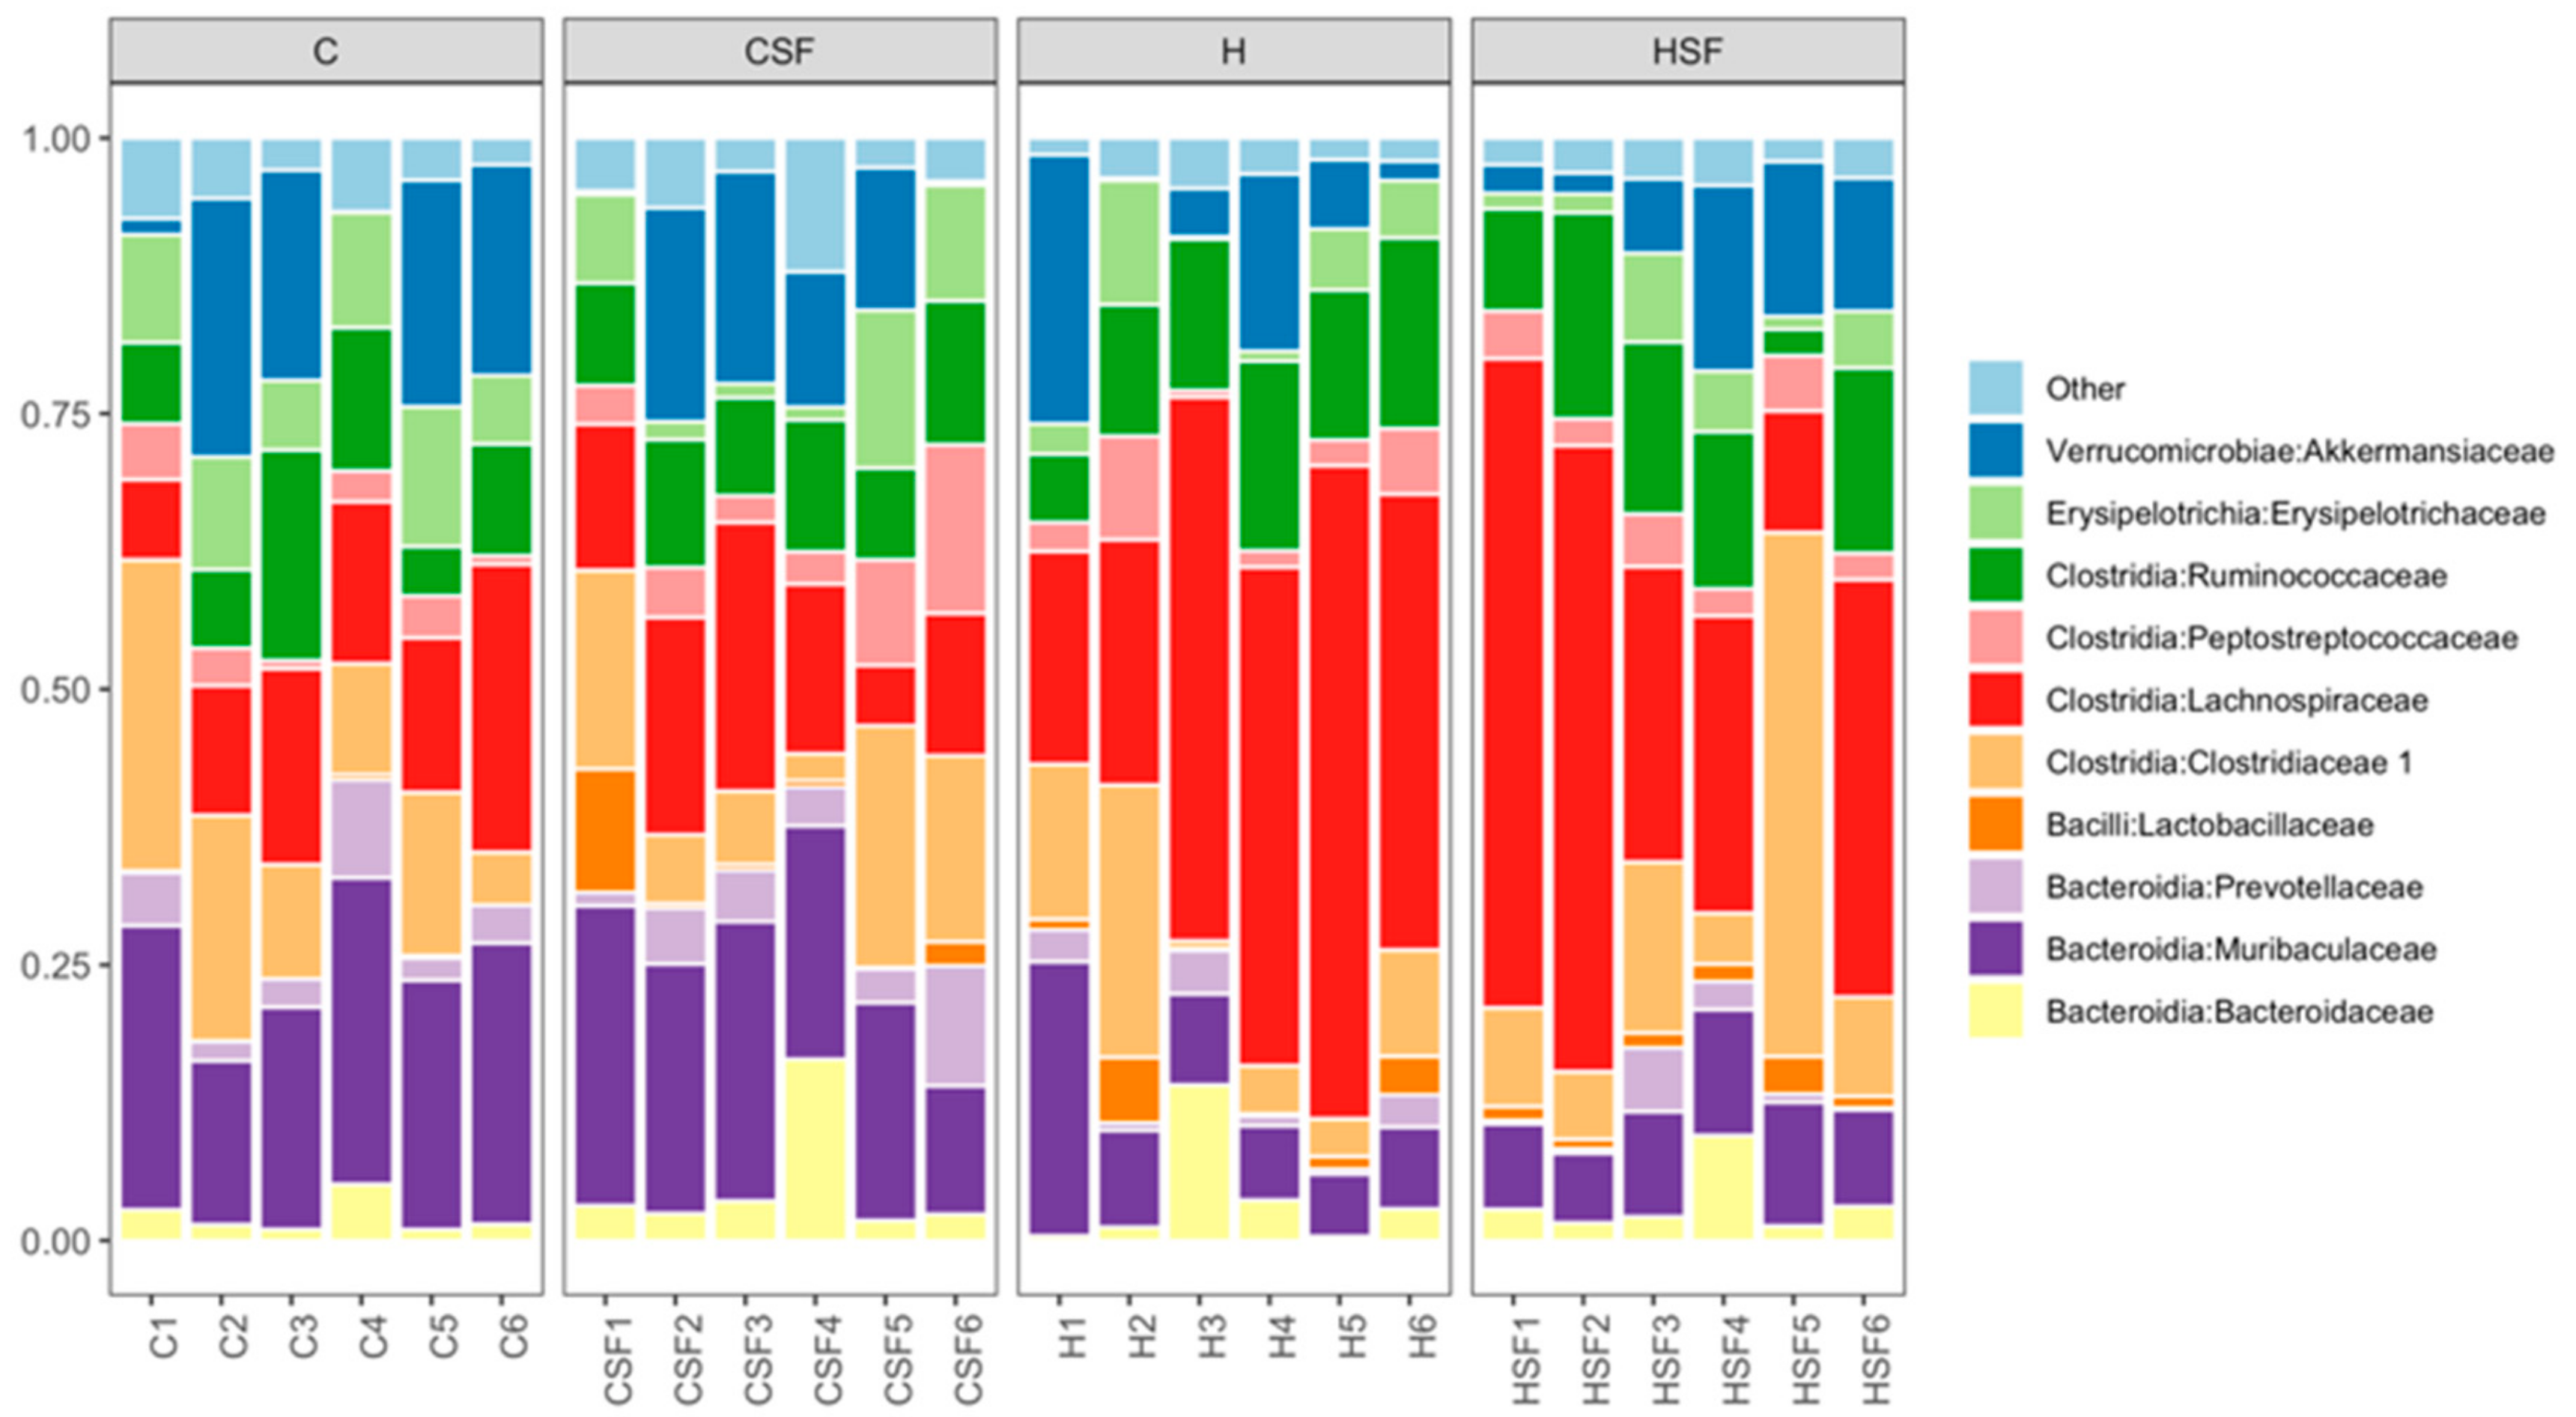
Figure 9.
Taxonomic profiles of bacterial communities shown at the family level of all faecal samples. C, corn starch diet-fed rats; CSF, corn starch diet-fed rats supplemented with Sarconema filiforme; H, high-carbohydrate, high-fat diet-fed rats; HSF, high-carbohydrate, high-fat diet-fed rats supplemented with Sarconema filiforme.
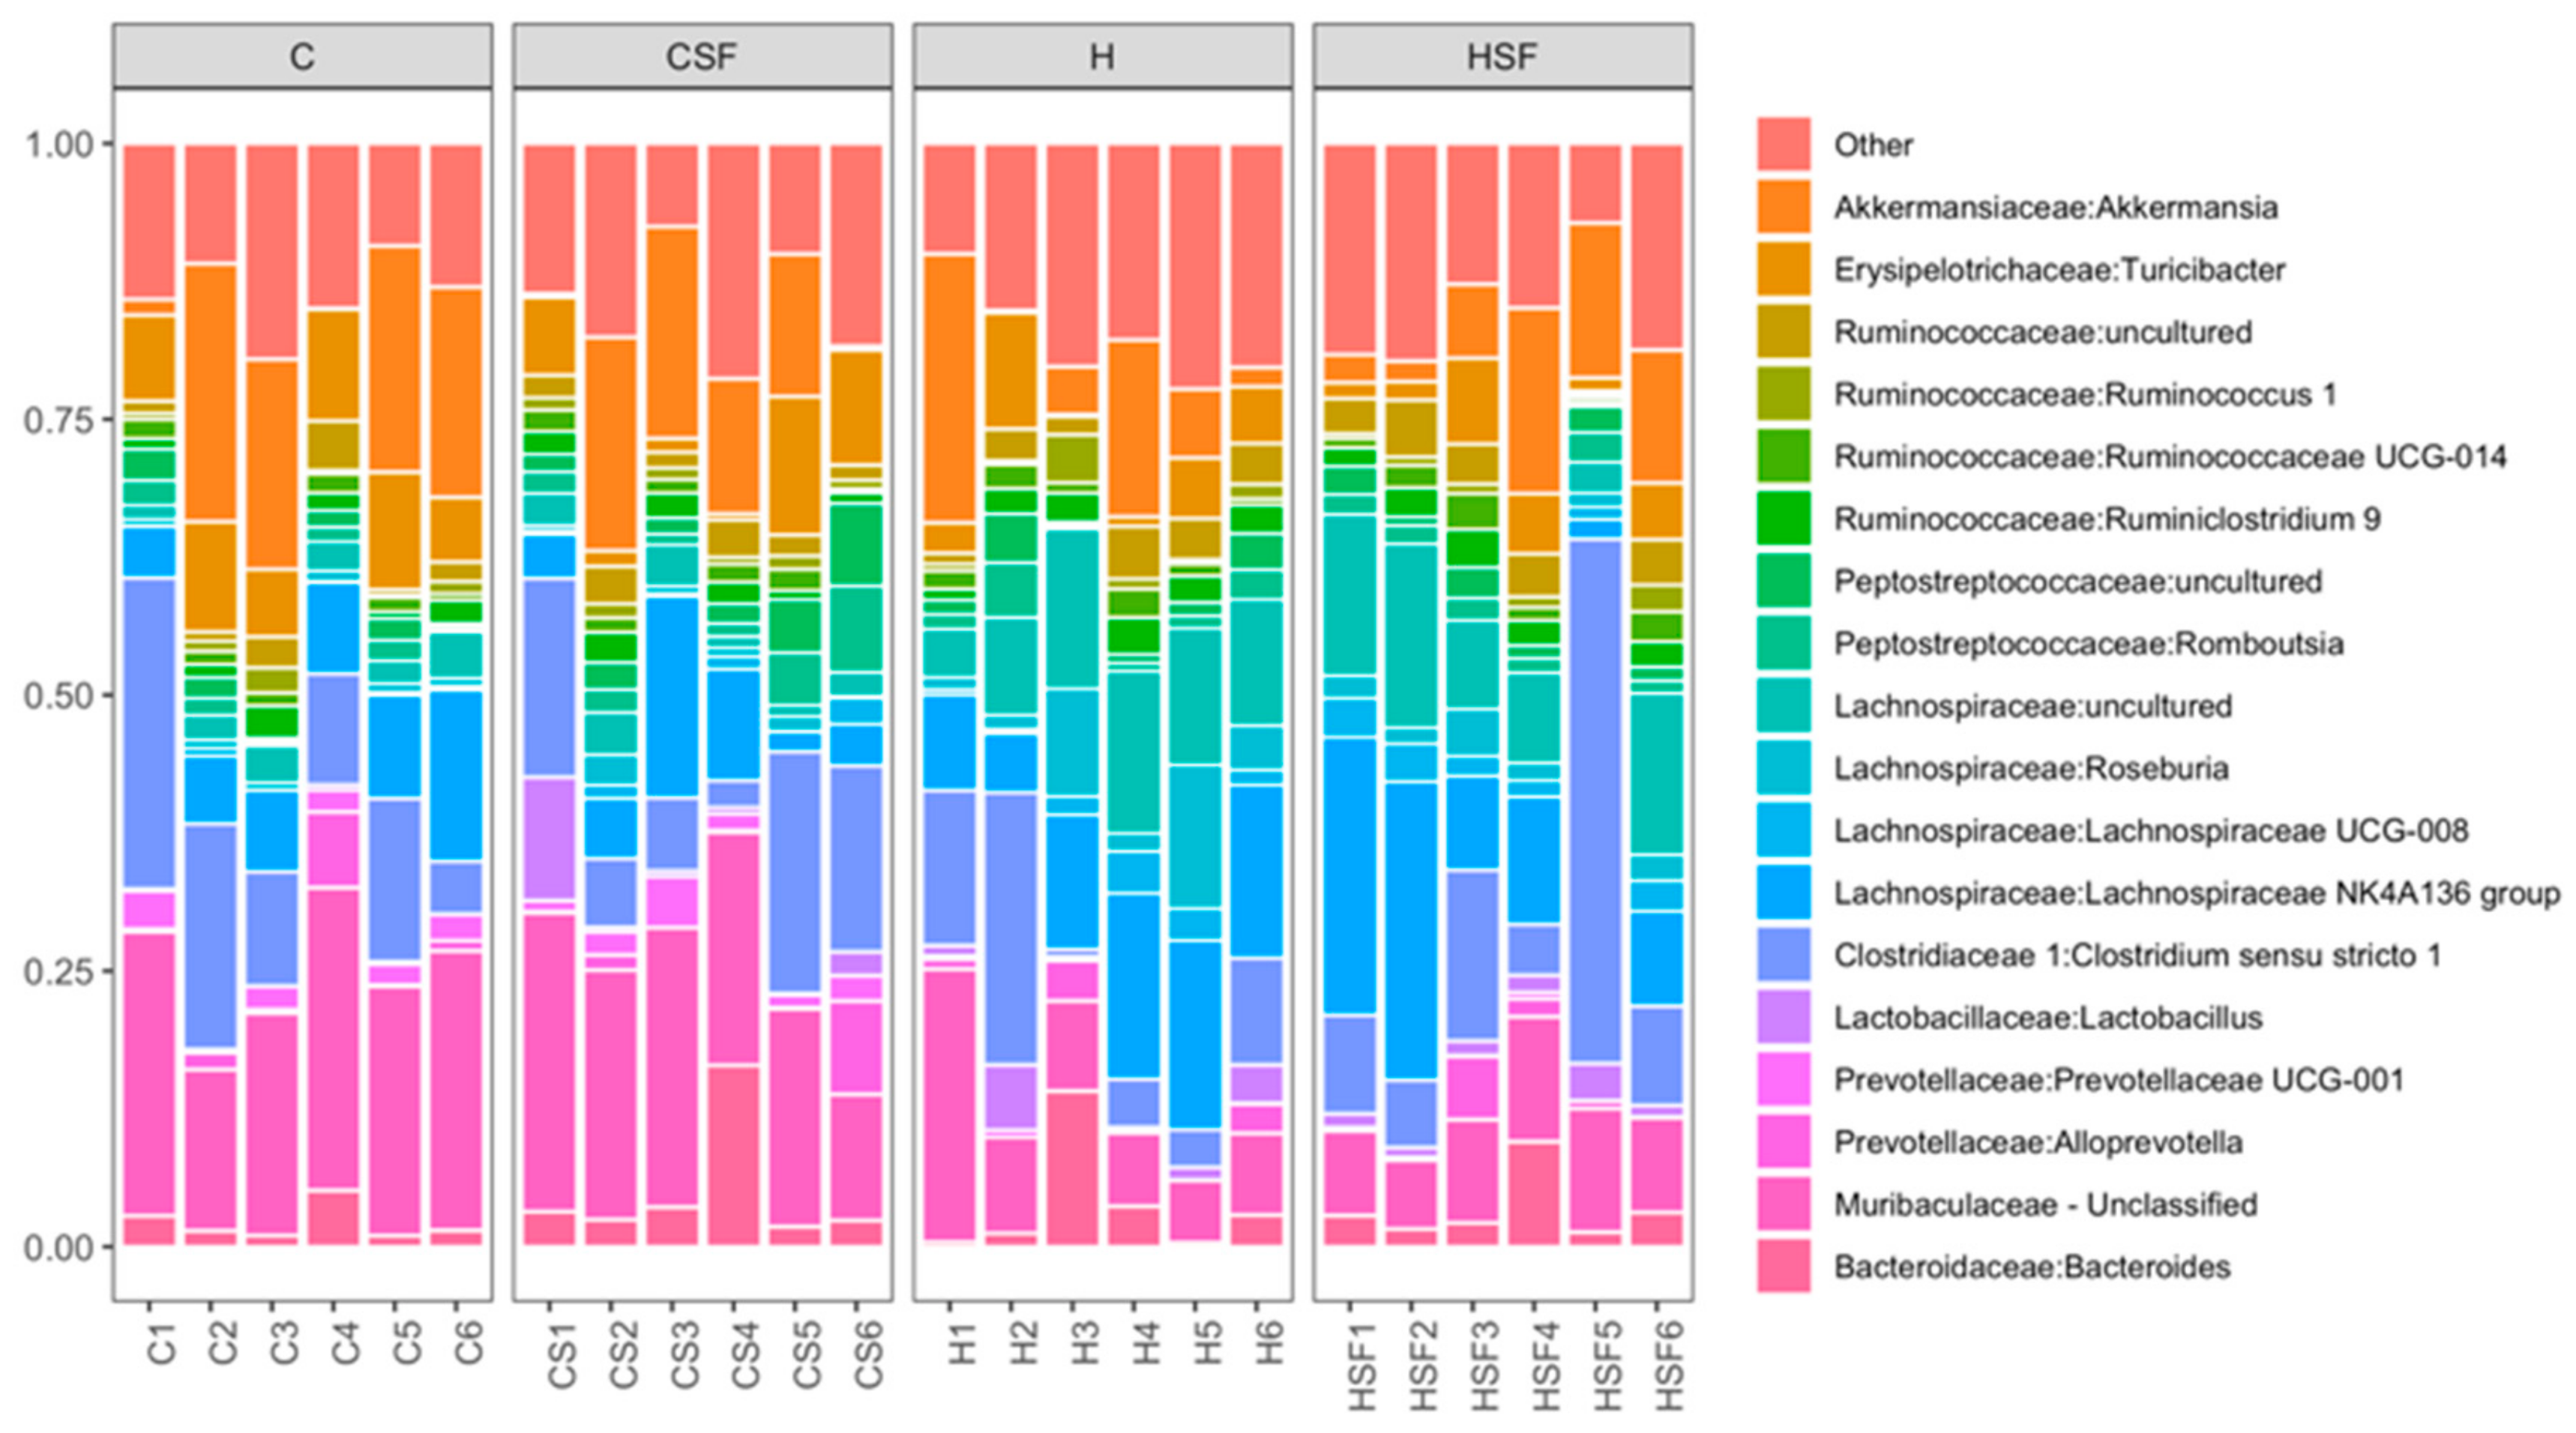
Figure 10.
Taxonomic profiles of bacterial communities shown at the genus level of all faecal samples. C, corn starch diet-fed rats; CSF, corn starch diet-fed rats supplemented with Sarconema filiforme; H, high-carbohydrate, high-fat diet-fed rats; HSF, high-carbohydrate, high-fat diet-fed rats supplemented with Sarconema filiforme.
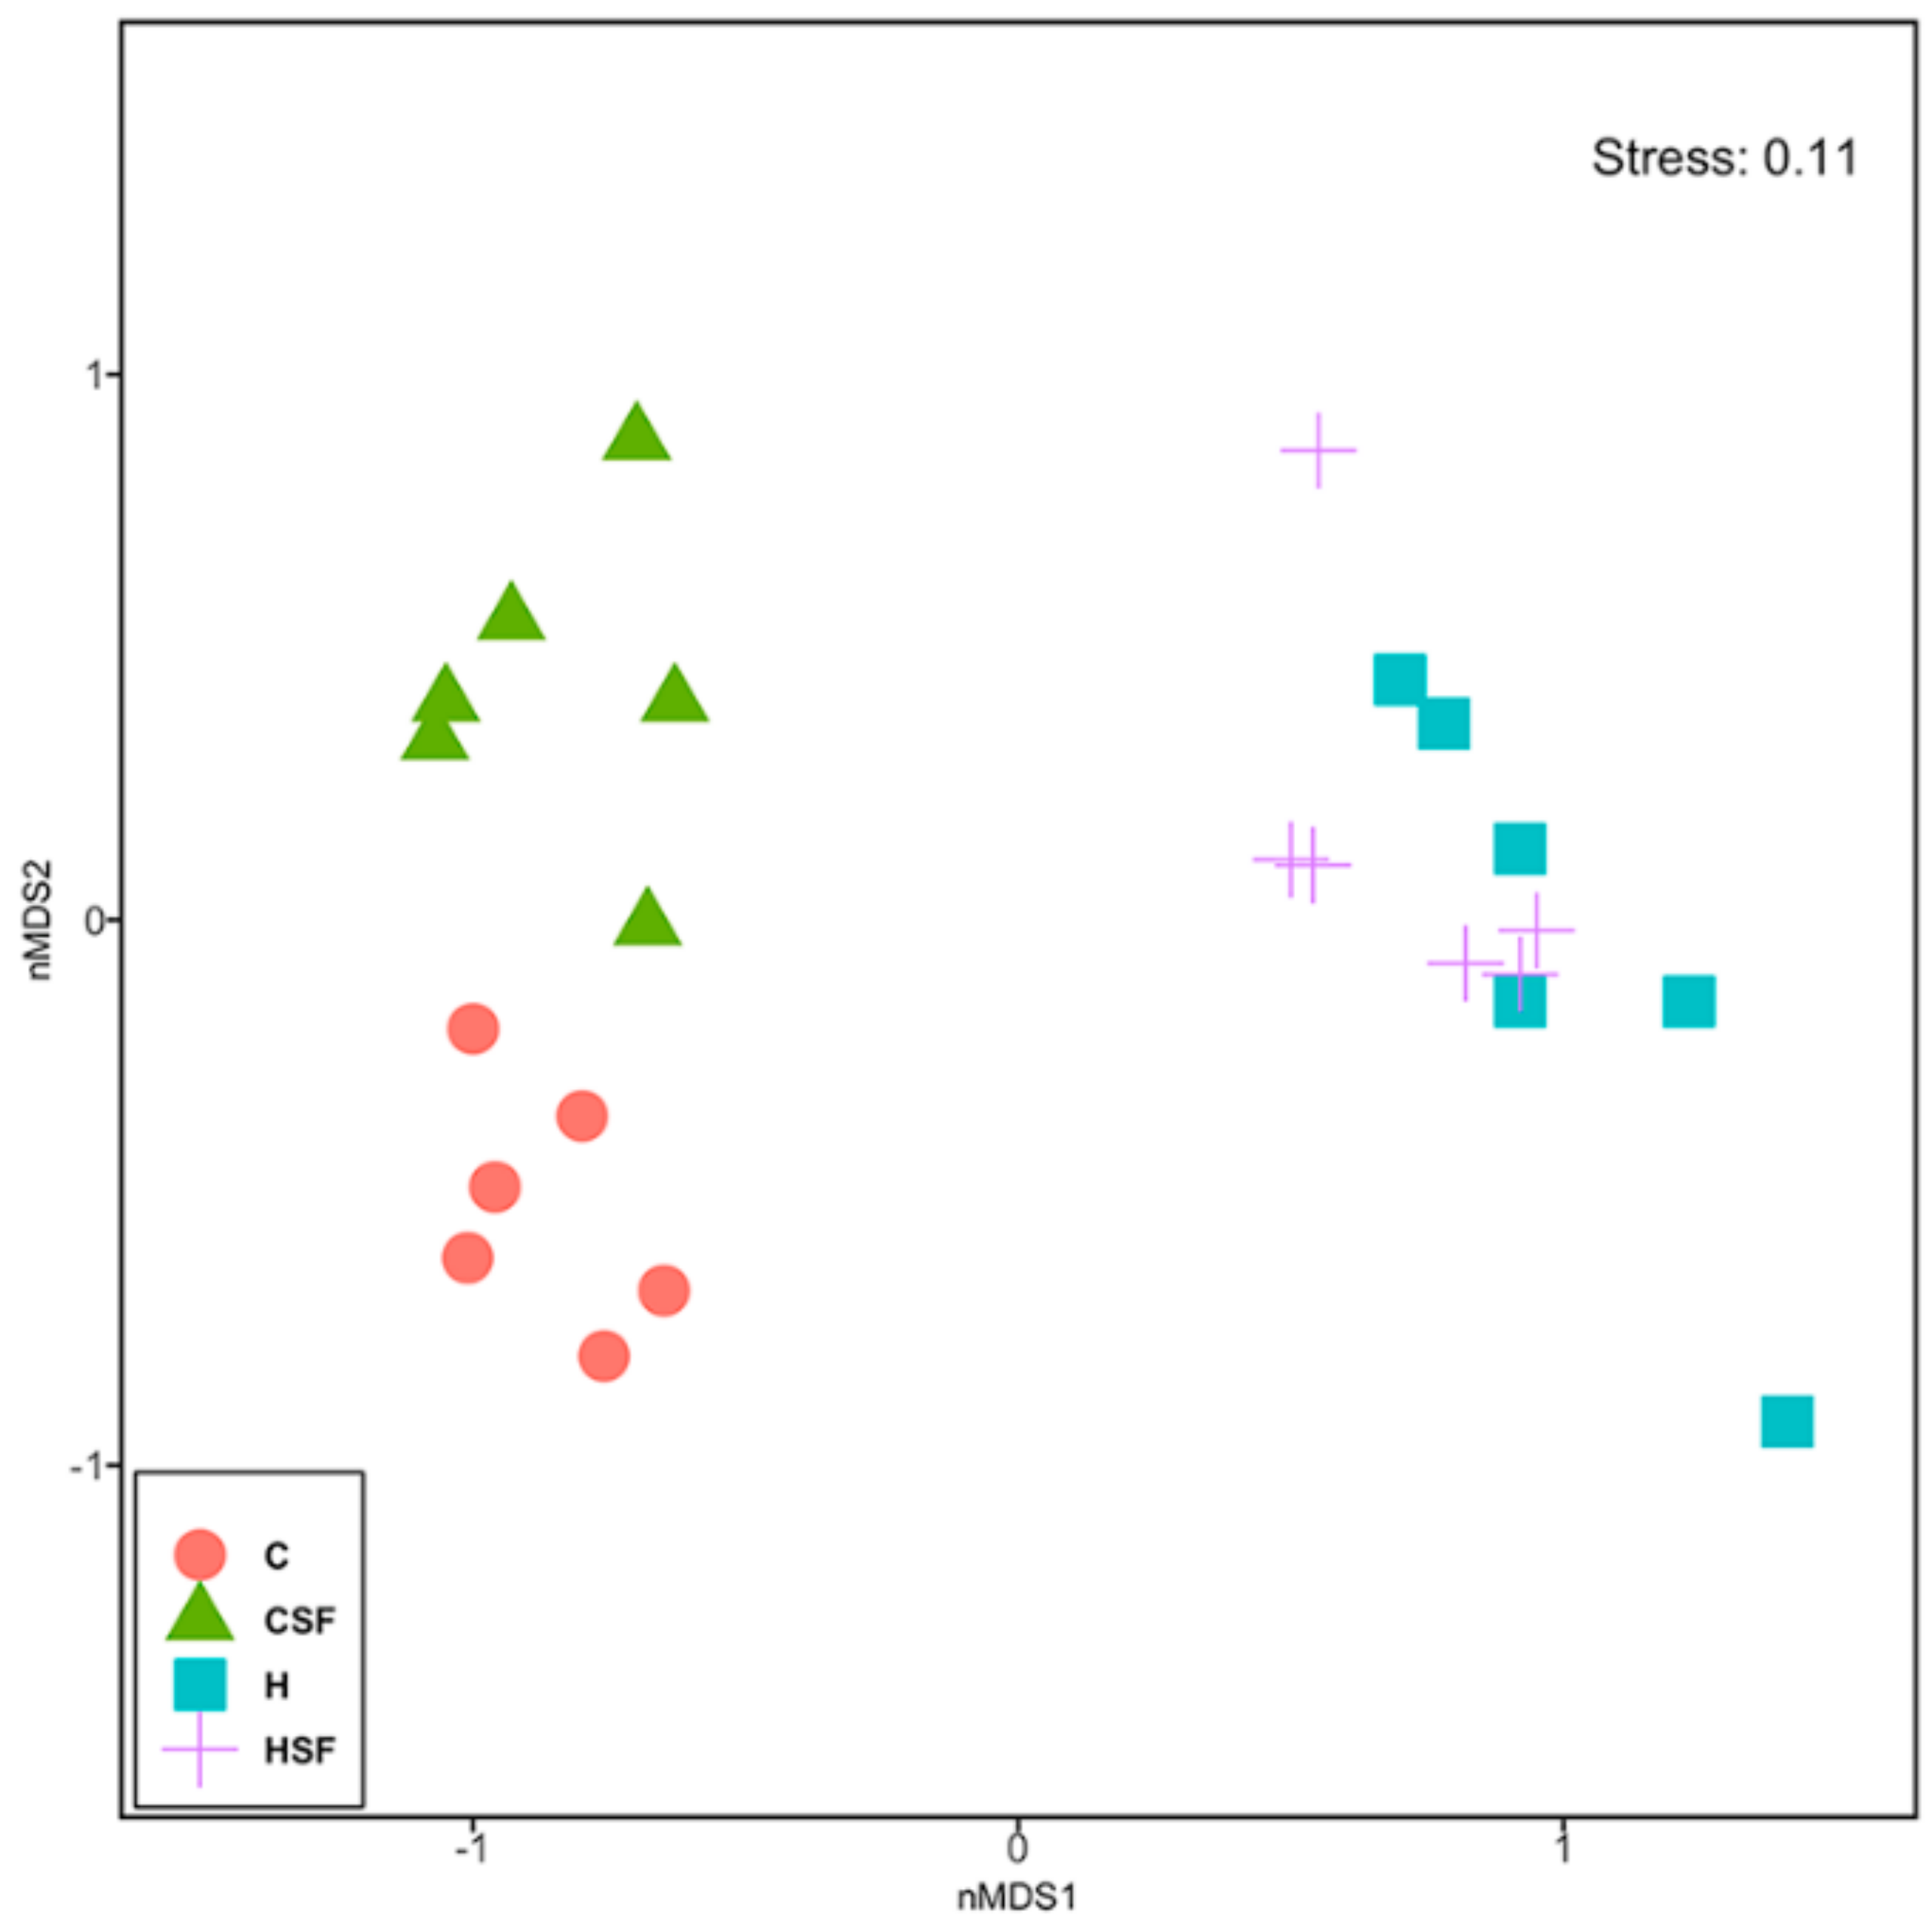
Figure 11.
Non-metric multi-disciplinary scaling (nMDS) plot of physiological data from all physiological parameters measured after 16 weeks of feeding. C, corn starch diet-fed rats; CSF, corn starch diet-fed rats supplemented with Sarconema filiforme; H, high-carbohydrate, high-fat diet-fed rats; HSF, high-carbohydrate, high-fat diet-fed rats supplemented with Sarconema filiforme.
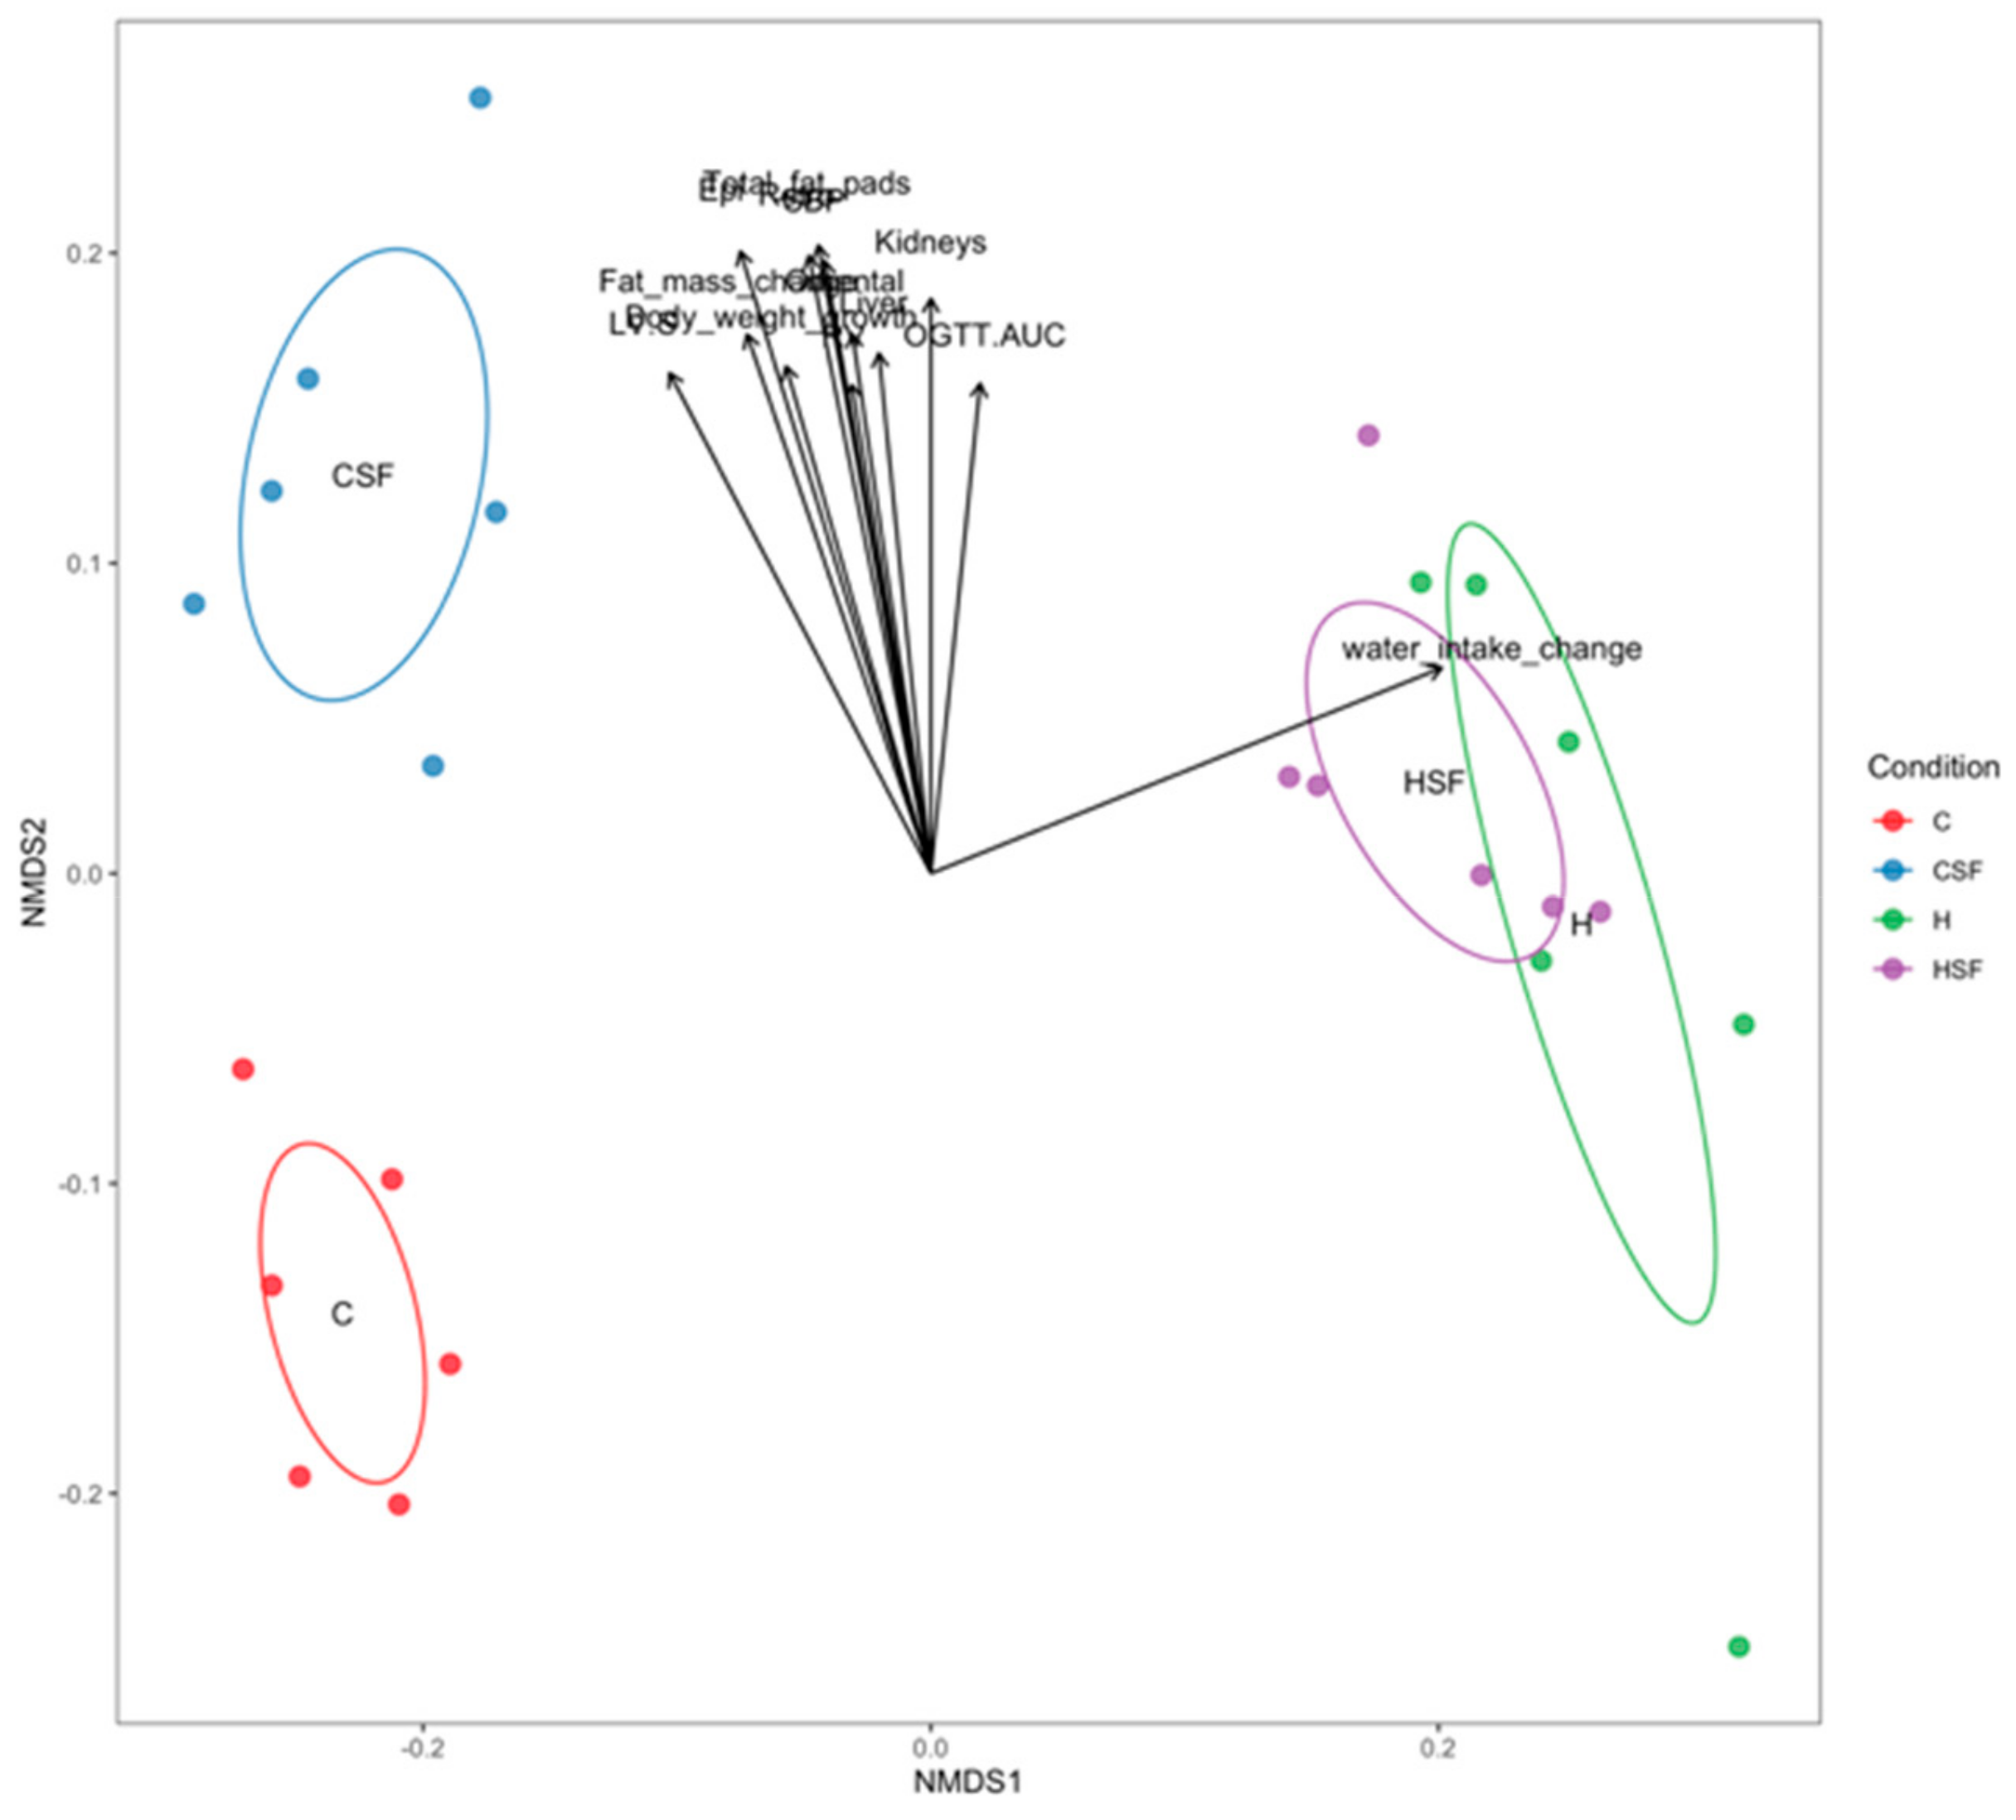
Figure 12.
Correlation between bacterial community structure (points) and environmental variables (arrows). C, corn starch diet-fed rats; CSF, corn starch diet-fed rats supplemented with Sarconema filiforme; H, high-carbohydrate, high-fat diet-fed rats; HSF, high-carbohydrate, high-fat diet-fed rats supplemented with Sarconema filiforme.
Table 1.
Biochemical composition of Sarconema filiforme biomass.
Table 1.
Biochemical composition of Sarconema filiforme biomass.
| Proximate | % dry weight | Metals | mg/kg |
| Carbohydrate | 34.4 |
| Protein | 11.8 | Aluminium | 39.3 |
| Lipid | 1.4 | Antimony | 0.1 |
| Ash | 50.8 | Arsenic | 6.2 |
| Moisture | 1.6 | Barium | 0.5 |
| Energy (kJ/g) | 8.7 | Boron | 299 |
| Fibre | % dry weight | Cadmium | 0.1 |
| Total dietary fibre | 21.7 | Calcium | 2150 |
| Insoluble dietary fibre | 9.6 | Chromium | 0.3 |
| Soluble dietary fibre (by difference) | 12.2 | Cobalt | 0.6 |
| Ultimate | % dry weight | Copper | 1.6 |
| Carbon | 21.2 | Iron | 1875 |
| Nitrogen | 2.6 | Lead | 0.2 |
| Hydrogen | 3.3 | Magnesium | 3655 |
| Sulfur | 4.2 | Manganese | 20.3 |
| Amino acids | % dry weight | Mercury | 0.3 |
| Total amino acids | 11.8 | Molybdenum | 0.2 |
| Histidine | 0.2 | Nickel | 0.7 |
| Serine | 0.7 | Phosphorus | 2500 |
| Arginine | 1.0 | Potassium | 189,500 |
| Glycine | 0.7 | Selenium | 0.3 |
| Aspartic acid | 1.3 | Silver | 0.0 |
| Glutamic acid | 1.8 | Sodium | 27,000 |
| Threonine | 0.6 | Strontium | 31.3 |
| Alanine | 0.8 | Tin | 0.1 |
| Proline | 0.6 | Vanadium | 2.4 |
| Lysine | 0.6 | Zinc | 128 |
| Tyrosine | 0.3 | Fatty acids | % dry weight |
| Methionine | 0.2 |
| Valine | 0.8 | Total fatty acids | 1.1 |
| Isoleucine | 0.7 | C16:0 palmitic | 0.4 |
| Leucine | 1.0 | C20:4 ω-6 arachidonic | 0.5 |
| Phenylalanine | 0.6 | C20:5 ω-3 eicosapentaenoic | 0.1 |
Table 2.
Responses to Sarconema filiforme.
Table 2.
Responses to Sarconema filiforme.
| Variables | C | CSF | H | HSF | p Value |
|---|
| Diet | Treatment | Interaction |
|---|
| Physiological variables |
| 0 week body weight, g | 338 ± 1 | 338 ± 1 | 339 ± 1 | 338 ± 1 | 0.66 | 0.66 | 0.66 |
| 8 week body weight, g | 371 ± 11b | 359 ± 5b | 451 ± 15a | 442 ± 10a | <0.0001 | 0.31 | 0.88 |
| 16 week body weight, g | 405 ± 4c | 398 ± 5c | 550 ± 15a | 498 ± 10b | <0.0001 | 0.004 | 0.025 |
| 16 week lean mass, g | 321 ± 9 | 324 ± 7 | 309 ± 10 | 338 ± 12 | 0.92 | 0.13 | 0.22 |
| 16 week fat mass, g | 59 ± 4c | 58 ± 6c | 251 ± 30a | 151 ± 16b | <0.0001 | 0.004 | 0.005 |
| 8 week lean/fat mass proportion | 4.4 ± 0.5b | 6.8 ± 0.8a | 2.2 ± 0.4c | 2.3 ±0.2c | <0.0001 | 0.056 | 0.08 |
| 16 week lean/fat mass proportion | 5.5 ± 0.4b | 6.0 ± 0.6a | 1.3 ± 0.1d | 2.5 ± 0.4c | <0.0001 | 0.047 | 0.93 |
| 16 week bone mineral content, g | 12.3 ± 0.8c | 12.1 ± 0.5c | 17.6 ± 0.7a | 14.6 ± 0.6b | <0.0001 | 0.021 | 0.041 |
| 16 week bone mineral density, g/cm2 | 0.180 ± 0.002 | 0.183 ± 0.004 | 0.184 ± 0.005 | 0.184 ± 0.002 | 0.53 | 0.70 | 0.70 |
| Food intake 0-8 weeks, g/day | 41.4 ± 0.9a | 39.0 ± 1.4a | 27.8 ± 0.9b | 26.5 ± 1.3b | <0.0001 | 0.21 | 0.71 |
| Food intake 9-16 weeks, g/day | 37.1 ± 0.4a | 37.0 ± 1.1a | 26.2 ± 0.7b | 20.9 ± 0.8c | <0.0001 | 0.012 | 0.015 |
| Water intake 0-8 weeks, g/day | 40.8 ± 4.4a | 32.7 ± 2.8b | 25.5 ± 0.8c | 29.3 ± 2.7b | 0.0061 | 0.51 | 0.07 |
| Water intake 9-16 weeks, g/day | 30.4 ± 3.8b | 42.3 ± 1.4a | 22.2 ± 0.6c | 41.8 ± 2.1a | 0.07 | <0.0001 | 0.11 |
| Energy intake 0-8 weeks, kJ/day | 468 ± 9b | 438 ±16b | 593 ± 13a | 597 ± 35a | <0.0001 | 0.65 | 0.55 |
| Energy intake 9-16 weeks, kJ/day | 415 ± 4b | 407 ± 13b | 558 ± 10a | 533 ± 17a | <0.0001 | 0.18 | 0.93 |
| 16 week abdominal circumference, cm | 20.1 ± 0.4c | 19.4 ± 0.1c | 23.8 ± 0.5a | 21.2 ± 0.3b | <0.0001 | <0.0001 | 0.005 |
| Body mass index, g/cm2 | 0.61 ± 0.02c | 0.65 ± 0.01c | 0.81 ± 0.03a | 0.74 ± 0.02b | <0.0001 | 0.46 | 0.011 |
| Retroperitoneal fat, mg/mm | 216 ± 37c | 196 ± 15c | 636 ± 67a | 423 ± 41b | <0.0001 | 0.007 | 0.025 |
| Epididymal fat, mg/mm | 78 ± 18c | 62 ± 9c | 191 ± 28a | 116 ± 12b | <0.0001 | 0.007 | 0.07 |
| Omental fat, mg/mm | 147 ± 21c | 142 ± 12c | 333 ± 29a | 245 ± 16b | <0.0001 | 0.019 | 0.035 |
| Visceral adiposity, % | 5.1 ± 0.6c | 4.8 ± 0.4c | 10.0 ± 0.6a | 7.8 ± 0.3b | <0.0001 | 0.011 | 0.048 |
| Liver wet weight, mg/mm | 218 ± 7b | 231 ± 7b | 365 ± 26a | 343 ± 16a | <0.0001 | 0.77 | 0.27 |
| Cardiovascular variables |
| 8 week systolic blood pressure, mmHg | 123 ± 4b | 122 ± 3b | 135 ± 3a | 138 ± 2a | 0.0001 | 0.76 | 0.54 |
| 16 week systolic blood pressure, mmHg | 128 ± 3b | 126 ± 4b | 145 ± 4a | 132 ± 3b | 0.007 | 0.07 | 0.18 |
| Left ventricle + septum wet weight, mg/mm | 22.6 ± 2.1 | 22.5 ± 1.0 | 21.2 ± 2.2 | 21.5 ± 0.6 | 0.38 | 0.94 | 0.88 |
| Right ventricle, mg/mm | 4.1 ± 0.3 | 3.5 ± 0.3 | 4.4 ± 0.1 | 4.3 ± 0.2 | 0.06 | 0.22 | 0.38 |
| Left ventricular diastolic stiffness (κ) | 21.2 ± 2.3c | 21.7 ± 1.7c | 29.6 ± 1.4a | 25.6 ± 1.9b | 0.022 | 0.36 | 0.24 |
| Left ventricle collagen area, % | 8.1 ± 2.4c | 8.3 ± 1.8c | 18.4 ± 1.9a | 12.1 ± 1.7b | 0.009 | 0.11 | 0.11 |
| Left ventricle inflammatory cells, cells/200µm2 | 7 ± 2c | 9 ± 2c | 25 ± 3a | 16 ± 3b | 0.0004 | 0.1949 | 0.0520 |
| Metabolic variables |
| Plasma total cholesterol, mmol/L | 1.59 ± 0.06b | 1.44 ± 0.06b | 1.73 ± 0.09a | 1.51 ± 0.08b | 0.18 | 0.021 | 0.65 |
| Plasma triglycerides, mmol/L | 0.50 ± 0.05b | 0.52 ± 0.08b | 1.15 ± 0.13a | 1.04 ± 0.21a | <0.0001 | 0.73 | 0.62 |
| Plasma non-esterified fatty acids, mmol/L | 0.68 ± 0.12b | 0.74 ± 0.24b | 2.71 ± 0.29a | 1.99 ± 0.59a | <0.0001 | 0.33 | 0.25 |
| Alanine transaminase, U/L | 39 ± 5ab | 33 ± 5ab | 50 ± 11ab | 31 ± 2b | 0.55 | 0.010 | 0.39 |
| Aspartate transaminase, U/L | 138 ± 20ab | 125 ± 20b | 174 ± 17a | 128 ± 13b | 0.29 | 0.011 | 0.37 |
| Liver inflammatory cells, cells/200µm2 | 11 ± 2 | 13 ± 2 | 30 ± 3a | 16 ± 3b | 0.0003 | 0.029 | 0.005 |
| Liver fat vacuoles area, µm2 | 12.4 ± 1.2 | 10.7 ± 1.8 | 90.6 ± 7.1a | 70.4 ± 2.7b | <0.0001 | 0.012 | 0.029 |
| Oral glucose tolerance test |
| 0 week basal blood glucose, mmol/L | 2.6 ± 0.1 | 2.6 ± 0.1 | 2.6 ± 0.1 | 2.5 ± 0.1 | 0.66 | 0.66 | 0.66 |
| 0 week area under the curve, mmol/L×min | 751 ± 26 | 650 ± 23 | 727 ± 23 | 689 ± 18 | 0.76 | 0.007 | 0.20 |
| 8 week basal blood glucose, mmol/L | 2.5 ± 0.1b | 2.8 ± 0.1b | 3.9 ± 0.4a | 3.4 ± 0.1a | <0.0001 | 0.60 | 0.044 |
| 8 week 120-min blood glucose, mmol/L | 3.6 ± 0.4b | 3.6 ± 0.1b | 5.2 ± 0.1a | 5.1 ± 0.1a | <0.0001 | 0.78 | 0.78 |
| 8 week area under the curve, mmol/L×min | 559 ± 34b | 538 ± 18b | 690 ± 17a | 645 ± 12a | <0.0001 | 0.11 | 0.56 |
| 16 week basal blood glucose, mmol/L | 2.6 ± 0.1b | 2.6 ± 0.2b | 3.5 ± 0.3a | 3.3 ± 0.2a | 0.002 | 0.67 | 0.67 |
| 16 week 120-min blood glucose, mmol/L | 3.6 ± 0.1b | 3.8 ± 0.2b | 5.8 ± 0.5a | 5.0 ± 0.1a | <0.0001 | 0.22 | 0.043 |
| 16 week area under the curve, mmol/L×min | 506 ± 22c | 547 ± 8b | 675 ± 20a | 647 ± 18a | <0.0001 | 0.71 | 0.056 |
| Insulin tolerance test |
| 8 week 120-min blood glucose, mmol/L | 2.1 ± 0.7b | 2.5 ± 0.5b | 3.8 ± 0.5a | 4.2 ± 0.4a | 0.004 | 0.47 | 1.00 |
| 8 week area under the curve, mmol/L×min | 204 ± 33b | 238 ± 36b | 349 ± 23a | 377 ± 24a | 0.0002 | 0.37 | 0.93 |
| 16 week 120-min blood glucose, mmol/L | 3.6 ± 0.4 | 3.3 ± 1.1 | 4.3 ± 1.1 | 3.4 ± 0.3 | 0.66 | 0.52 | 0.74 |
| 16 week area under the curve, mmol/L×min | 271 ± 64 | 225 ± 36 | 396 ± 56 | 341 ± 19 | 0.006 | 0.23 | 0.91 |
Table 3.
PERMANOVAs based on Bray-Curtis similarity measure for square-root transformed abundances of all rat faecal samples.
Table 3.
PERMANOVAs based on Bray-Curtis similarity measure for square-root transformed abundances of all rat faecal samples.
| PERMANOVA |
| Source | df | SS | MS | Pseudo-F | P(perm) | Unique perms |
| Diet | 1 | 9306.2 | 9306.2 | 9.3671 | 0.0001 | 9912 |
| Treatment | 1 | 2477.6 | 2477.6 | 2.4938 | 0.0001 | 9860 |
| Diet × treatment | 1 | 1671.4 | 1671.4 | 1.6823 | 0.003 | 9836 |
| Res | 19 | 18876 | 993.5 | | | |
| Total | 22 | 32369 | | | | |
| PAIR-WISE TESTS |
| Source | t | P(perm) | Unique perms |
| C, CSF | 1.626 | 0.0014 | 462 |
| C, H | 2.4472 | 0.0017 | 462 |
| C, HSF | 2.544 | 0.0024 | 462 |
| CSF, H | 2.3327 | 0.0018 | 462 |
| CSF, HSF | 2.2125 | 0.0022 | 461 |
| H, HSF | 1.185 | 0.0396 | 462 |
| PERMDISP (PAIRWISE COMPARISONS) |
| Groups | t | P(perm) |
| C, CSF | 1.7793 | 0.022 |
| C, H | 0.77115 | 0.65 |
| C, HSF | 0.80101 | 0.60 |
| CSF, H | 0.01072 | 0.99 |
| CSF, HSF | 1.6113 | 0.24 |
| H, HSF | 1.139 | 0.35 |
Table 4.
PERMANOVAs based on Euclidean distance matrix for physiological data of all rat faecal samples.
Table 4.
PERMANOVAs based on Euclidean distance matrix for physiological data of all rat faecal samples.
| PERMANOVA |
| Source | df | SS | MS | Pseudo-F | P(perm) | Unique perms |
| Diet | 1 | 4081700 | 4081700 | 53.366 | 0.0001 | 9924 |
| Treatment | 1 | 435050 | 435050 | 5.6882 | 0.0154 | 9942 |
| Diet × treatment | 1 | 408770 | 408770 | 5.3446 | 0.0187 | 9939 |
| Res | 20 | 1529700 | 76484 | | | |
| Total | 23 | 6455200 | | | | |
| PAIR-WISE TESTS |
| Source | t | P(perm) | Unique perms |
| C, CSF | 0.6848 | 0.82 | 462 |
| C, H | 5.6852 | 0.0018 | 461 |
| C, HSF | 4.4192 | 0.0024 | 462 |
| CSF, H | 5.8892 | 0.0021 | 462 |
| CSF, HSF | 4.7191 | 0.0023 | 462 |
| H, HSF | 2.5161 | 0.0268 | 462 |
| PERMDISP (PAIRWISE COMPARISONS) |
| Groups | t | P(perm) |
| C, CSF | 1.5351 | 0.23 |
| C, H | 1.9906 | 0.11 |
| C, HSF | 1.4159 | 0.20 |
| CSF, H | 2.4448 | 0.0398 |
| CSF, HSF | 2.2429 | 0.0139 |
| H, HSF | 1.0507 | 0.29 |
Table 5.
Summary of statistical tests on differential zOTU abundance.
Table 5.
Summary of statistical tests on differential zOTU abundance.
| Global Test (GLMs) by Mvabund |
| Diet: p < 0.0001 |
| Treatment: p = 0.003 |
| Diet × Treatment: p < 0.007 |
| Univariate Analysis by Mvabund (p < 0.05) |
| Factor | Number of differentially abundant OTUs | % of total number of OTUs |
| Diet | 77 | 6.24% |
| Treatment | 35 | 0.32% |
| Total (unique zOTUs affected by one or more factors) | 81 | 6.57% |
Table 6.
Relative abundance of zOTUs affected by diet (ANOVA with p adjusted <0.05) between C, CSF, H and HSF rats.
Table 6.
Relative abundance of zOTUs affected by diet (ANOVA with p adjusted <0.05) between C, CSF, H and HSF rats.
| OTU_ID | C (%) | CSF (%) | H (%) | HSF (%) | Phylum | Family | Genus |
|---|
| Zotu42 | 0.62 | 0.31 | 0.00 | 0.02 | Actinobacteria | Bifidobacteriaceae | Bifidobacterium |
| Zotu80 | 0.29 | 0.22 | 0.00 | 0.00 | Actinobacteria | Bifidobacteriaceae | Bifidobacterium |
| Zotu168 | 0.12 | 0.09 | 0.01 | 0.01 | Actinobacteria | Eggerthellaceae | Enterorhabdus |
| Zotu20 | 0.95 | 0.90 | 0.02 | 0.08 | Bacteroidetes | Bacteroidaceae | Bacteroides |
| Zotu21 | 1.11 | 0.73 | 0.16 | 0.09 | Bacteroidetes | Muribaculaceae | unclassified |
| Zotu27 | 1.05 | 0.37 | 0.05 | 0.06 | Bacteroidetes | Muribaculaceae | unclassified |
| Zotu79 | 0.40 | 0.13 | 0.02 | 0.01 | Bacteroidetes | Muribaculaceae | unclassified |
| Zotu541 | 0.02 | 0.05 | 0.00 | 0.00 | Bacteroidetes | Muribaculaceae | unclassified |
| Zotu857 | 0.08 | 0.04 | 0.00 | 0.00 | Bacteroidetes | Muribaculaceae | unclassified |
| Zotu978 | 0.12 | 0.11 | 0.01 | 0.03 | Bacteroidetes | Muribaculaceae | unclassified |
| Zotu1036 | 0.05 | 0.02 | 0.00 | 0.00 | Bacteroidetes | Muribaculaceae | unclassified |
| Zotu1144 | 0.12 | 0.04 | 0.00 | 0.01 | Bacteroidetes | Muribaculaceae | unclassified |
| Zotu10 | 2.06 | 2.28 | 0.28 | 0.19 | Bacteroidetes | Prevotellaceae | Prevotellaceae UCG-001 |
| Zotu916 | 0.00 | 0.00 | 0.02 | 0.02 | Firmicutes | Lachnospiraceae | Acetatifactor |
| Zotu77 | 0.04 | 0.05 | 0.30 | 0.54 | Firmicutes | Lachnospiraceae | Anaerostipes |
| Zotu244 | 0.01 | 0.00 | 0.07 | 0.11 | Firmicutes | Lachnospiraceae | Blautia |
| Zotu49 | 0.01 | 0.02 | 0.81 | 0.43 | Firmicutes | Lachnospiraceae | GCA-900066575 |
| Zotu76 | 0.03 | 0.03 | 0.64 | 0.20 | Firmicutes | Lachnospiraceae | Lachnoclostridium |
| Zotu856 | 0.00 | 0.00 | 0.03 | 0.02 | Firmicutes | Lachnospiraceae | Lachnospiraceae FCS020 group |
| Zotu1061 | 0.00 | 0.00 | 0.03 | 0.03 | Firmicutes | Lachnospiraceae | Lachnospiraceae FCS020 group |
| Zotu37 | 0.01 | 0.01 | 0.81 | 1.19 | Firmicutes | Lachnospiraceae | Lachnospiraceae NK4A136 group |
| Zotu100 | 0.36 | 0.14 | 0.00 | 0.02 | Firmicutes | Lachnospiraceae | Lachnospiraceae NK4A136 group |
| Zotu123 | 0.00 | 0.00 | 0.20 | 0.40 | Firmicutes | Lachnospiraceae | Lachnospiraceae NK4A136 group |
| Zotu182 | 0.00 | 0.00 | 0.18 | 0.23 | Firmicutes | Lachnospiraceae | Lachnospiraceae NK4A136 group |
| Zotu201 | 0.01 | 0.01 | 0.18 | 0.13 | Firmicutes | Lachnospiraceae | Lachnospiraceae NK4A136 group |
| Zotu544 | 0.00 | 0.00 | 0.13 | 0.09 | Firmicutes | Lachnospiraceae | Lachnospiraceae NK4A136 group |
| Zotu561 | 0.00 | 0.00 | 0.06 | 0.03 | Firmicutes | Lachnospiraceae | Lachnospiraceae NK4A136 group |
| Zotu658 | 0.00 | 0.00 | 0.48 | 0.54 | Firmicutes | Lachnospiraceae | Lachnospiraceae NK4A136 group |
| Zotu762 | 0.00 | 0.00 | 0.02 | 0.04 | Firmicutes | Lachnospiraceae | Lachnospiraceae NK4A136 group |
| Zotu847 | 0.00 | 0.00 | 0.03 | 0.02 | Firmicutes | Lachnospiraceae | Lachnospiraceae NK4A136 group |
| Zotu966 | 0.00 | 0.00 | 0.08 | 0.10 | Firmicutes | Lachnospiraceae | Lachnospiraceae NK4A136 group |
| Zotu1157 | 0.00 | 0.01 | 0.12 | 0.35 | Firmicutes | Lachnospiraceae | Lachnospiraceae NK4A136 group |
| Zotu26 | 0.00 | 0.00 | 1.65 | 1.27 | Firmicutes | Lachnospiraceae | Lachnospiraceae UGC-006 |
| Zotu110 | 0.01 | 0.02 | 0.49 | 0.25 | Firmicutes | Lachnospiraceae | Lachnospiraceae UGC-008 |
| Zotu35 | 0.01 | 0.01 | 1.69 | 0.32 | Firmicutes | Lachnospiraceae | Roseburia |
| Zotu556 | 0.00 | 0.00 | 0.02 | 0.04 | Firmicutes | Lachnospiraceae | Roseburia |
| Zotu582 | 0.00 | 0.00 | 0.02 | 0.05 | Firmicutes | Lachnospiraceae | Roseburia |
| Zotu604 | 0.00 | 0.00 | 0.01 | 0.05 | Firmicutes | Lachnospiraceae | Roseburia |
| Zotu625 | 0.00 | 0.00 | 0.01 | 0.03 | Firmicutes | Lachnospiraceae | Roseburia |
| Zotu634 | 0.00 | 0.00 | 0.01 | 0.05 | Firmicutes | Lachnospiraceae | Roseburia |
| Zotu25 | 0.00 | 0.00 | 1.10 | 0.83 | Firmicutes | Lachnospiraceae | unclassified |
| Zotu52 | 0.09 | 0.04 | 0.48 | 0.48 | Firmicutes | Lachnospiraceae | unclassified |
| Zotu73 | 0.02 | 0.00 | 0.24 | 0.44 | Firmicutes | Lachnospiraceae | unclassified |
| Zotu101 | 0.00 | 0.00 | 0.28 | 0.24 | Firmicutes | Lachnospiraceae | unclassified |
| Zotu174 | 0.00 | 0.00 | 0.13 | 0.32 | Firmicutes | Lachnospiraceae | unclassified |
| Zotu197 | 0.00 | 0.00 | 0.46 | 0.05 | Firmicutes | Lachnospiraceae | unclassified |
| Zotu198 | 0.02 | 0.02 | 0.27 | 0.32 | Firmicutes | Lachnospiraceae | unclassified |
| Zotu221 | 0.00 | 0.00 | 0.14 | 0.09 | Firmicutes | Lachnospiraceae | unclassified |
| Zotu226 | 0.00 | 0.00 | 0.15 | 0.22 | Firmicutes | Lachnospiraceae | unclassified |
| Zotu277 | 0.00 | 0.00 | 0.20 | 0.04 | Firmicutes | Lachnospiraceae | unclassified |
| Zotu293 | 0.00 | 0.00 | 0.04 | 0.18 | Firmicutes | Lachnospiraceae | unclassified |
| Zotu516 | 0.00 | 0.00 | 0.07 | 0.06 | Firmicutes | Lachnospiraceae | unclassified |
| Zotu528 | 0.00 | 0.00 | 0.05 | 0.03 | Firmicutes | Lachnospiraceae | unclassified |
| Zotu530 | 0.00 | 0.00 | 0.06 | 0.05 | Firmicutes | Lachnospiraceae | unclassified |
| Zotu590 | 0.00 | 0.00 | 0.05 | 0.04 | Firmicutes | Lachnospiraceae | unclassified |
| Zotu757 | 0.00 | 0.00 | 0.01 | 0.04 | Firmicutes | Lachnospiraceae | unclassified |
| Zotu891 | 0.00 | 0.00 | 0.02 | 0.02 | Firmicutes | Lachnospiraceae | unclassified |
| Zotu937 | 0.00 | 0.00 | 0.07 | 0.26 | Firmicutes | Lachnospiraceae | unclassified |
| Zotu988 | 0.00 | 0.00 | 0.01 | 0.01 | Firmicutes | Lachnospiraceae | unclassified |
| Zotu1043 | 0.01 | 0.02 | 0.23 | 0.17 | Firmicutes | Lachnospiraceae | unclassified |
| Zotu1161 | 0.00 | 0.00 | 0.09 | 0.04 | Firmicutes | Lachnospiraceae | unclassified |
| Zotu1200 | 0.00 | 0.01 | 0.33 | 0.16 | Firmicutes | Lachnospiraceae | unclassified |
| Zotu247 | 0.00 | 0.00 | 0.13 | 0.04 | Firmicutes | Peptococcaceae | unclassified |
| Zotu398 | 0.05 | 0.04 | 0.00 | 0.00 | Firmicutes | Peptococcaceae | unclassified |
| Zotu384 | 0.00 | 0.00 | 0.10 | 0.02 | Firmicutes | Ruminococcaceae | Butyricicoccus |
| Zotu279 | 0.00 | 0.00 | 0.07 | 0.08 | Firmicutes | Ruminococcaceae | Ruminiclostridium |
| Zotu614 | 0.00 | 0.00 | 0.02 | 0.04 | Firmicutes | Ruminococcaceae | Ruminiclostridium |
| Zotu958 | 0.00 | 0.00 | 0.01 | 0.01 | Firmicutes | Ruminococcaceae | Ruminiclostridium |
| Zotu63 | 0.00 | 0.00 | 0.51 | 0.30 | Firmicutes | Ruminococcaceae | Ruminiclostridium 9 |
| Zotu133 | 0.01 | 0.00 | 0.15 | 0.23 | Firmicutes | Ruminococcaceae | Ruminiclostridium 9 |
| Zotu135 | 0.00 | 0.00 | 0.17 | 0.21 | Firmicutes | Ruminococcaceae | Ruminiclostridium 9 |
| Zotu643 | 0.01 | 0.04 | 0.00 | 0.00 | Firmicutes | Ruminococcaceae | Ruminiclostridium 9 |
| Zotu38 | 0.93 | 0.21 | 0.00 | 0.00 | Firmicutes | Ruminococcaceae | Ruminiclostridium NK4A214 group |
| Zotu218 | 0.08 | 0.07 | 0.01 | 0.01 | Firmicutes | Ruminococcaceae | Ruminiclostridium NK4A214 group |
| Zotu50 | 0.01 | 0.04 | 0.50 | 0.38 | Firmicutes | Ruminococcaceae | unclassified |
| Zotu62 | 0.02 | 0.00 | 0.46 | 0.43 | Firmicutes | Ruminococcaceae | unclassified |
| Zotu275 | 0.00 | 0.00 | 0.06 | 0.12 | Firmicutes | Ruminococcaceae | unclassified |
Table 7.
Relative abundance of zOTUs affected by treatment (ANOVA with p adjusted <0.05) between C, CSF, H and HSF rats.
Table 7.
Relative abundance of zOTUs affected by treatment (ANOVA with p adjusted <0.05) between C, CSF, H and HSF rats.
| OTU_ID | C (%) | CSF (%) | H (%) | HSF (%) | Phylum | Family | Genus |
|---|
| Zotu15 | 0.72 | 0.00 | 3.02 | 0.00 | Bacteroidetes | Muribaculaceae | unclassified |
| Zotu232 | 0.00 | 0.06 | 0.00 | 0.13 | Firmicutes | Ruminococcaceae | Ruminococcaceae UCG-014 |
| Zotu595 | 0.00 | 0.04 | 0.00 | 0.01 | Firmicutes | Ruminococcaceae | Ruminococcaceae UCG-014 |
| Zotu40 | 0.00 | 0.70 | 0.00 | 0.43 | Proteobacteria | Desulfovibrionaceae | Bilophila |
Table 8.
Correlation between bacterial community structure and physiological parameters (p < 0.05).
Table 8.
Correlation between bacterial community structure and physiological parameters (p < 0.05).
| Physiological Variables | R2 | p-Value |
|---|
| Epididymal fat | 0.59 | 0.001 |
| Water intake | 0.58 | 0.002 |
| Total abdominal fat | 0.56 | 0.001 |
| Retroperitoneal fat | 0.54 | 0.002 |
| Systolic blood pressure | 0.53 | 0.001 |
| Left ventricle and septum wet weight | 0.47 | 0.001 |
| Fat mass | 0.46 | 0.001 |
| Kidneys wet weight | 0.44 | 0.002 |
| Omental fat | 0.40 | 0.007 |
| Body weight | 0.39 | 0.004 |
| Liver wet weight | 0.37 | 0.011 |
| Right ventricle wet weight | 0.33 | 0.003 |
| Oral glucose tolerance area under the curve | 0.33 | 0.025 |
| Oral glucose tolerance 120-minute blood glucose | 0.29 | 0.027 |
| Food intake | 0.25 | 0.033 |
Table 9.
Taxonomic assignments of the zOTUs strongly correlated with physiological parameters.
Table 9.
Taxonomic assignments of the zOTUs strongly correlated with physiological parameters.
| OTU_ID | Phylum | Family | Genus | Correlation with Physiological Parameters |
|---|
| Zotu42 | Actinobacteria | Bifidobacteriaceae | Bifidobacterium | Water intake (−) |
| Zotu20 | Bacteroidetes | Bacteroidaceae | Bacteroides | Left ventricle and septum wet weight (+), water intake (−) |
| Zotu1036 | Bacteroidetes | Muribaculaceae | unclassified | Water intake (−) |
| Zotu1144 | Bacteroidetes | Muribaculaceae | unclassified | Water intake (−) |
| Zotu21 | Bacteroidetes | Muribaculaceae | unclassified | Water intake (−) |
| Zotu27 | Bacteroidetes | Muribaculaceae | unclassified | Water intake (−) |
| Zotu541 | Bacteroidetes | Muribaculaceae | unclassified | Epididymal fat (+) |
| Zotu79 | Bacteroidetes | Muribaculaceae | unclassified | Water intake (−) |
| Zotu857 | Bacteroidetes | Muribaculaceae | unclassified | Water intake (−) |
| Zotu10 | Bacteroidetes | Prevotellaceae | Prevotellaceae UCG-001 | Left ventricle and septum wet weight (+), water intake (−) |
| Zotu77 | Firmicutes | Lachnospiraceae | Anaerostipes | Food intake (−), water intake (+) |
| Zotu244 | Firmicutes | Lachnospiraceae | Blautia | Water intake (+) |
| Zotu856 | Firmicutes | Lachnospiraceae | Lachnospiraceae FCS020 group | Water intake (+) |
| Zotu100 | Firmicutes | Lachnospiraceae | Lachnospiraceae NK4A136 group | Water intake (−) |
| Zotu37 | Firmicutes | Lachnospiraceae | Lachnospiraceae NK4A136 group | Left ventricle and septum wet weight (−) |
| Zotu762 | Firmicutes | Lachnospiraceae | Lachnospiraceae NK4A136 group | Water intake (+) |
| Zotu556 | Firmicutes | Lachnospiraceae | Roseburia | Food intake (−), water intake (+) |
| Zotu582 | Firmicutes | Lachnospiraceae | Roseburia | Food intake (−) |
| Zotu604 | Firmicutes | Lachnospiraceae | Roseburia | Food intake (−) |
| Zotu625 | Firmicutes | Lachnospiraceae | Roseburia | Water intake (+) |
| Zotu634 | Firmicutes | Lachnospiraceae | Roseburia | Food intake (−) |
| Zotu101 | Firmicutes | Lachnospiraceae | unclassified | Water intake (−) |
| Zotu174 | Firmicutes | Lachnospiraceae | unclassified | Food intake (−) |
| Zotu198 | Firmicutes | Lachnospiraceae | unclassified | Left ventricle and septum wet weight (−) |
| Zotu25 | Firmicutes | Lachnospiraceae | unclassified | Water intake (+) |
| Zotu516 | Firmicutes | Lachnospiraceae | unclassified | Water intake (+) |
| Zotu52 | Firmicutes | Lachnospiraceae | unclassified | Left ventricle and septum wet weight (−) |
| Zotu530 | Firmicutes | Lachnospiraceae | unclassified | Water intake (+) |
| Zotu590 | Firmicutes | Lachnospiraceae | unclassified | Left ventricle and septum wet weight (−) |
| Zotu73 | Firmicutes | Lachnospiraceae | unclassified | Water intake (+) |
| Zotu757 | Firmicutes | Lachnospiraceae | unclassified | Food intake (−) |
| Zotu891 | Firmicutes | Lachnospiraceae | unclassified | Water intake (+) |
| Zotu988 | Firmicutes | Lachnospiraceae | unclassified | Water intake (+) |
| Zotu398 | Firmicutes | Peptococcaceae | unclassified | Water intake (−) |
| Zotu279 | Firmicutes | Ruminococcaceae | Ruminiclostridium | Left ventricle and septum wet weight (−), water intake (+) |
| Zotu614 | Firmicutes | Ruminococcaceae | Ruminiclostridium | Left ventricle and septum wet weight (−) |
| Zotu643 | Firmicutes | Ruminococcaceae | Ruminiclostridium 9 | Body weight (+), retroperitoneal fat (+), epididymal fat (+), omental fat (+), Total abdominal fat (+), fat mass (+), Liver wet weight (+), Left ventricle and septum wet weight (+), oral glucose tolerance 120-minute blood glucose (+), systolic blood pressure (+), water intake (−) |
| Zotu133 | Firmicutes | Ruminococcaceae | Ruminiclostridium 9 | Water intake (+) |
| Zotu135 | Firmicutes | Ruminococcaceae | Ruminiclostridium 9 | Water intake (+) |
| Zotu63 | Firmicutes | Ruminococcaceae | Ruminiclostridium 9 | Left ventricle and septum wet weight (−) |
| Zotu595 | Firmicutes | Ruminococcaceae | Ruminococcaceae UCG-014 | Epididymal fat (+), retroperitoneal fat (+), right ventricle wet weight (+), systolic blood pressure (+) |
| Zotu232 | Firmicutes | Ruminococcaceae | Ruminococcaceae UCG-014 | Liver wet weight (+) |
| Zotu62 | Firmicutes | Ruminococcaceae | unclassified | Left ventricle and septum wet weight (−), water intake (+) |
| Zotu40 | Proteobacteria | Desulfovibrionaceae | Bilophila | Epididymal fat (+), omental fat (+), retroperitoneal fat (+), total abdominal fat (+), kidney wet weight (+), liver wet weight (+), oral glucose tolerance 120-minute blood glucose (+), oral glucose tolerance area under the curve (+), systolic blood pressure (+) |

 ,
, 


