Effectiveness of Chitosan as a Dietary Supplement in Lowering Cholesterol in Murine Models: A Meta-Analysis


Department of Animal Science, Jeonbuk National University, Jeonju 54896, Korea
*
Author to whom correspondence should be addressed.
Mar. Drugs 2021, 19(1), 26; https://0-doi-org.brum.beds.ac.uk/10.3390/md19010026
Submission received: 17 November 2020
/
Revised: 18 December 2020
/
Accepted: 6 January 2021
/
Published: 9 January 2021
Abstract
:This study presents a meta-analysis of studies that investigate the effectiveness of chitosan administration on lifestyle-related disease in murine models. A total of 34 published studies were used to evaluate the effect of chitosan supplementation. The effect sizes for various items after chitosan administration were evaluated using the standardized mean difference. Using Cochran’s Q test, the heterogeneity of effect sizes was assessed, after which a meta-ANOVA and -regression test was conducted to explain the heterogeneity of effect sizes using the mixed-effect model. Publication bias was performed using Egger’s linear regression test. Among the items evaluated, blood triglyceride and HDL-cholesterol showed the highest heterogeneity, respectively. Other than blood HDL-cholesterol, total cholesterol, and triglyceride in feces, most items evaluated showed a negative effect size with high significance in the fixed- and random-effect model (p < 0.0001). In the meta-ANOVA and -regression test, administering chitosan and resistant starch was revealed to be most effective in lowering body weight. In addition, chitosan supplementation proved to be an effective solution for serum TNF-α inhibition. In conclusion, chitosan has been shown to be somewhat useful in improving symptoms of lifestyle-related disease. Although there are some limitations in the results of this meta-analysis due to the limited number of animal experiments conducted, chitosan administration nevertheless shows promise in reducing the risk of cholesterol related metabolic disorder.
1. Introduction
Lifestyle-related diseases, including obesity, hyperlipidemia, atherosclerosis, type II diabetes, and hypertension, are widespread in industrialized countries, and are major threats to cardiovascular health. The syndrome is related to a combination of metabolic disorders, including abdominal obesity, hypertriglyceridemia, high-density lipoprotein (HDL) cholesterol decrease, hypertension, and high blood glucose, which lead to increased cardiovascular morbidity and mortality [1]. Unnatural blood lipid levels such as high levels of total cholesterol (TC) or triglyceride (TG), high low-density lipoprotein (LDL) level, or low HDL-cholesterol level are correlated with heart disease and stroke. Hypertension is one of the harmful risk factors for stroke and is a key factor in heart attacks. Moreover, obesity acts as a significant risk factor for cardiovascular disease and susceptibility to diabetes [2]. Thus, there has been an urgent need for effective methods of controlling these health-related parameters, including food additives.
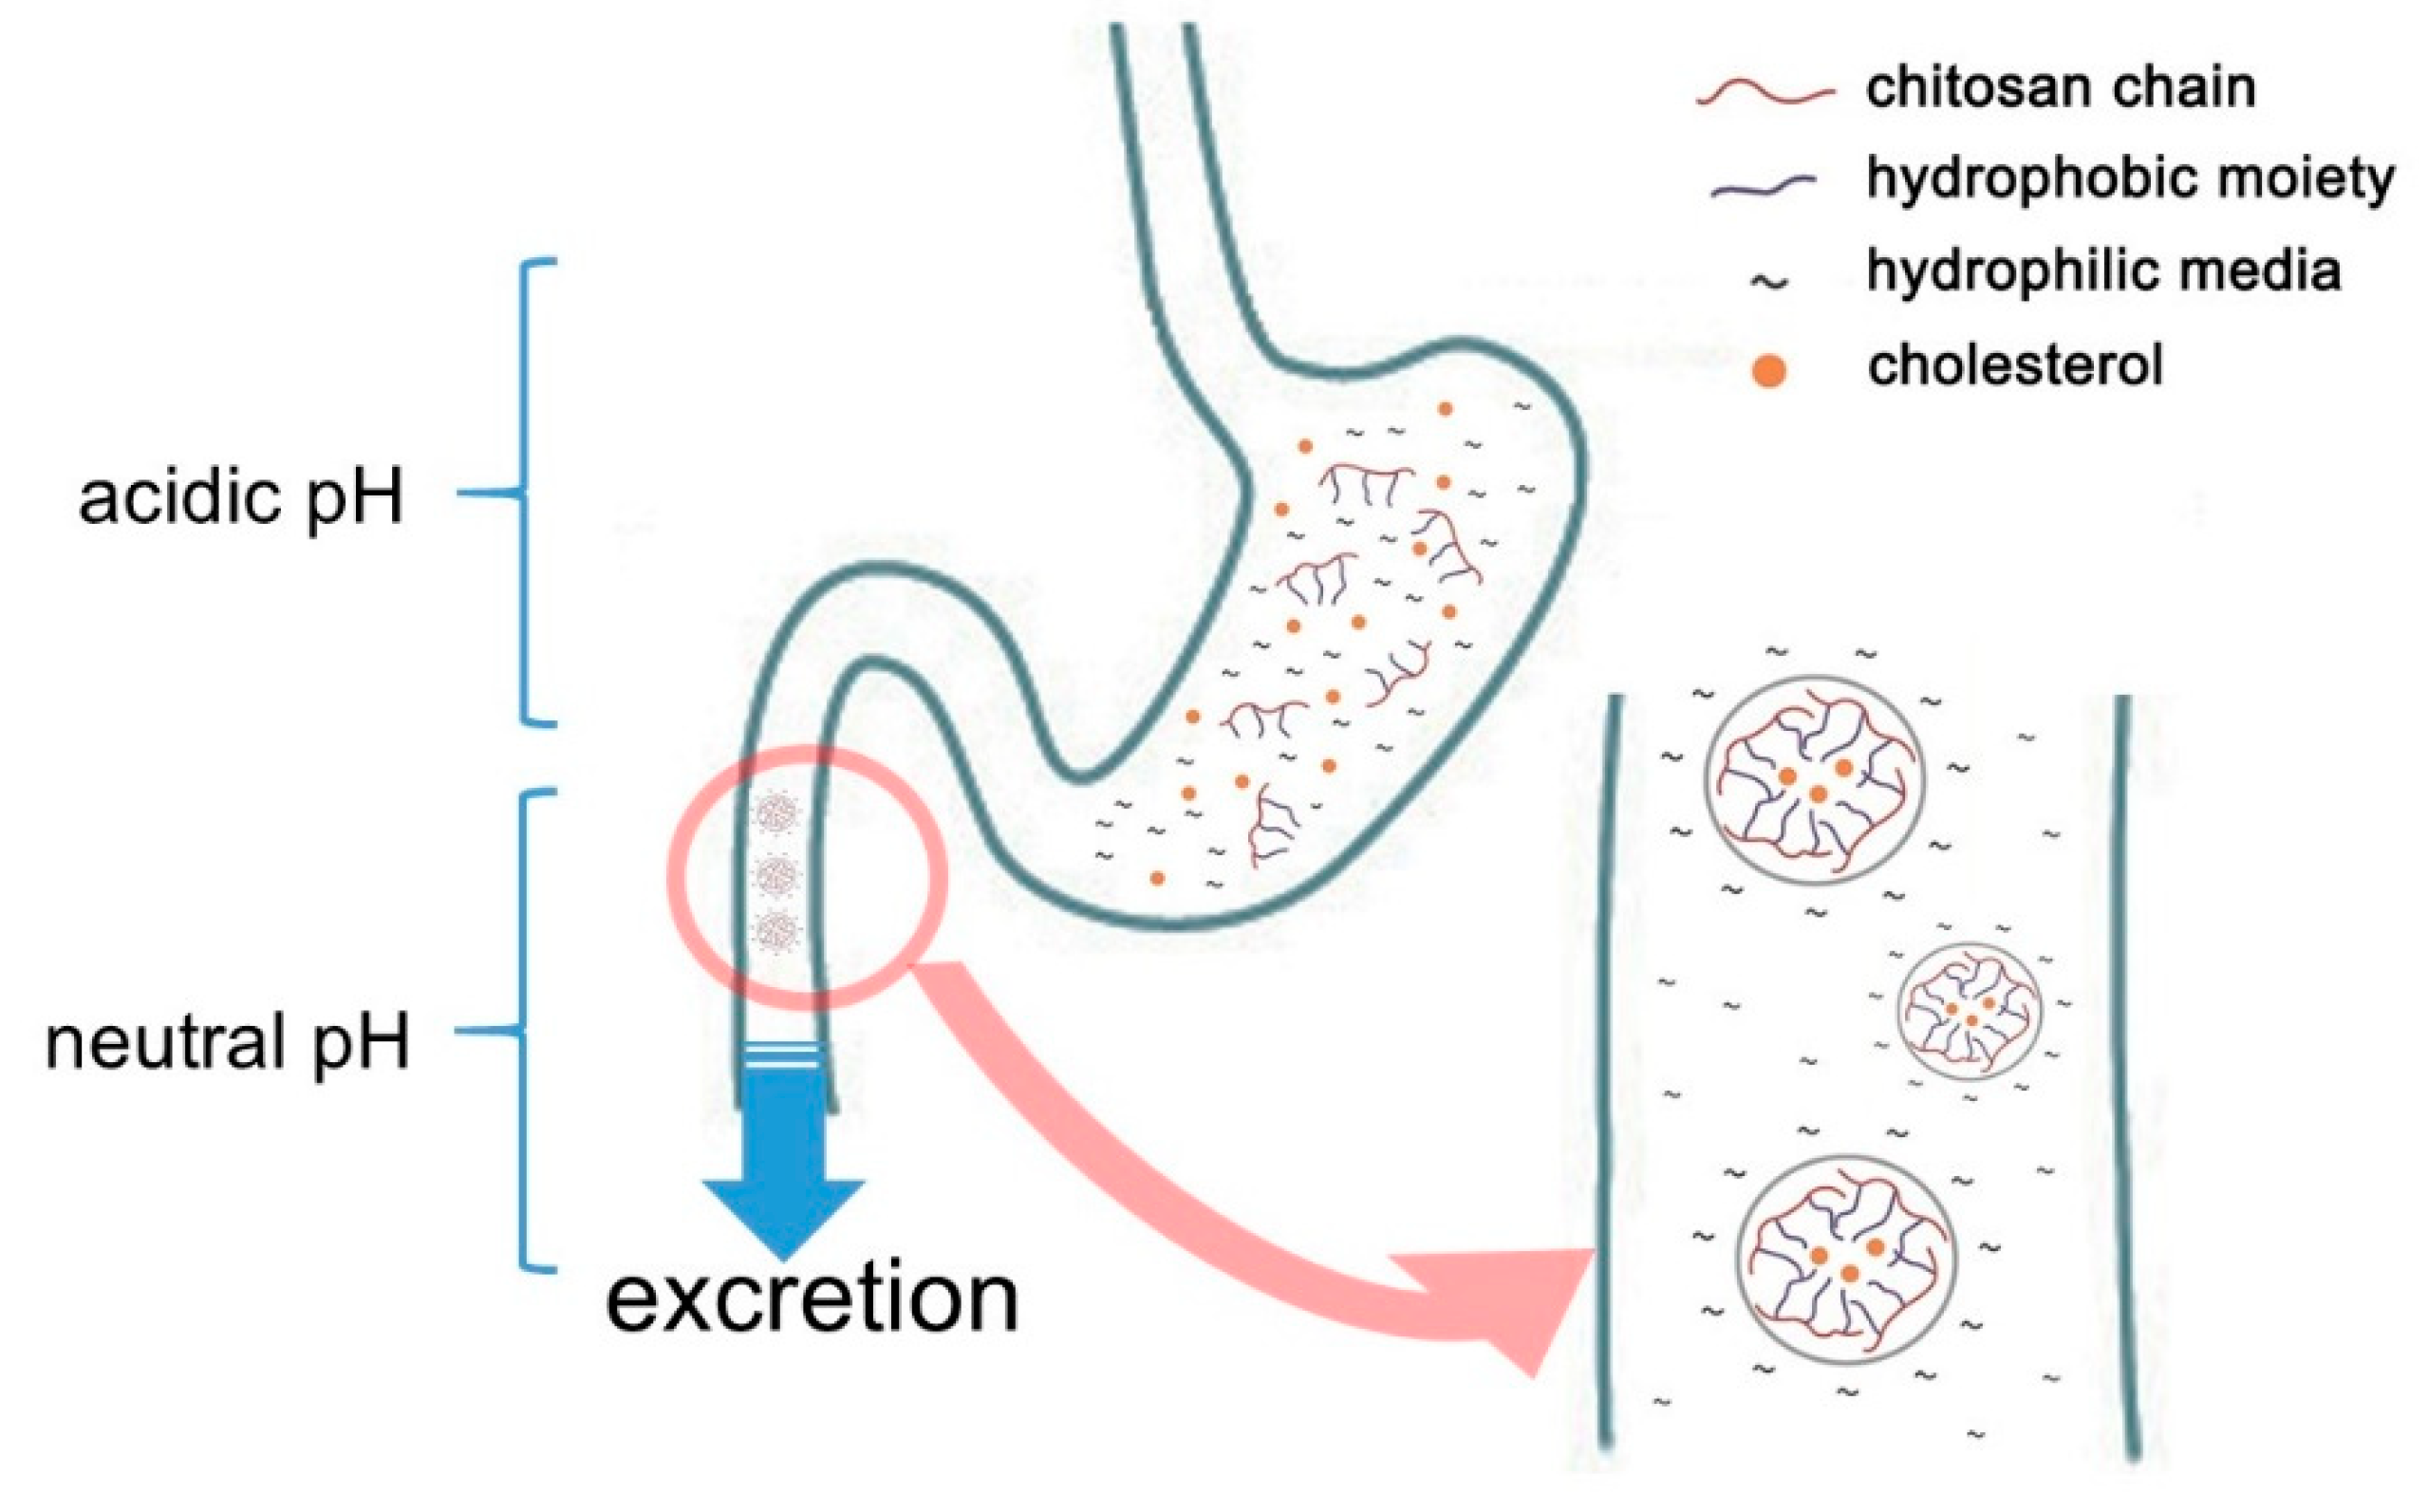
Chitosan is one of the polymers containing acetyl glucosamine and glucosamine. It may be obtained by hydrolyzing and converting chitin with alkali from crabs, shrimps, insects, mushrooms, and the cell walls of microorganisms. Chitosan manufacture by deacetylation of chitin has been utilized in wastewater treatment and the agricultural sector. As the safety of chitin or chitosan has become increasingly recognized, it has recently-been used in a variety of fields, including medical supplies, food additives, and cosmetics [3,4]. Chitosan is also known among food additives of which the effects include lowering blood or liver cholesterol and triglyceride by combining with lipids [5]. It even shows an anti-inflammatory effect by TNF-α inhibition [6,7,8,9]. Nauss et al. [10] assume that chitosan binds lipid micelle in the small intestine after the ingestion of a fatty meal, while Kanauchi et al. [11] propose a more specific mechanism by which chitosan inhibits fat digestion in the gastrointestinal tract. In the stomach, chitosan is dissolved in acidic gastric juice. In this aqueous phase, it acts as an emulsifier on fat globules. It also mixes with fat to form an emulsion. Once transferred into the intestine, the chitosan in the emulsion turns into an insoluble gel-like form trapped fat, which cannot be decomposed by enzymes such as pancreatin or other intestinal enzymes. As a result, fat excretion in feces is increased (Figure 1). In this connection, [12] have confirmed that in one animal study chitosan administration led to fecal fat excretion approximately 7.5 times higher compared to that of a cellulose-fed group.
Meta-analysis is a method of statistical analysis that combines results from various scientific studies to obtain a quantified synthesis [13]. Meta-analysis increases the power of statistical analysis by pooling the results from multiple available studies. Therefore, this study summarizes the results of various animal experiments and provides integrated technical data for clinical trials so that clinical trials can proceed more accurately.
Studies of lifestyle diseases in murine models suggest that they may be improved by administering chitosan. However, few comprehensive studies have been conducted to date on the effect of chitosan supplementation on improving lifestyle diseases. Accordingly, the objective of the present study was to perform a meta-analysis of the effects of chitosan on factors in lifestyle-related diseases in adults.
2. Results
2.1. Data Set
Table 1 shows the data sets and experimental conditions for the 34 published studies used in the meta-analysis. The publication years of the studies ranged between 1978 and 2020. The animals most frequently used in the data set were rat strains such as Sprague-Dawley and Wistar, experiment duration was distributed between 2.8 and 21 weeks, and experimental diet most used for inducing hyperlipidemia in the data set was a high fat/cholesterol diet. In the case of Liu et al. [14], a high-fructose diet was used to induce hyperlipidemia. Furthermore, in the study of Gallaher et al. [12], blood total cholesterol (TC) was observed in all studies. In addition to total triglyceride (TG), low-density lipoprotein (LDL)- and high-density lipoprotein (HDL)-cholesterol in the blood, TC and TG in the liver, and fecal TC and TG were investigated. The levels of chitosan administered to hyperlipidemia-induced animals ranged from 0.045 to 7.5% of the diet. The chitosan administration period varied between 3 and 21 weeks.
2.2. Effect Size and Heterogeneity
The effect sizes of chitosan administration on hyperlipidemia in murine models using fixed and random effect models are listed in Table 2. Most items other than HDL-cholesterol in blood, total cholesterol, and triglyceride in feces showed negative effect size and high significance (p < 0.0001) in both effect models. These results mean that chitosan administration results in decreased levels of TC, TG, and LDL-C in blood, TC and TG in the liver, serum TNF-α and glucose in blood and body weight, and increased levels of blood HDL-C, fecal TC and TG.
2.3. Moderator Analysis
Since heterogeneity analysis in this study revealed a high level of heterogeneity between the studies analyzed, moderator analysis was performed to account for this. For this, meta-ANOVA and meta-regression were conducted. To perform the meta-ANOVA test, Q statistics between the subgroups (Qb) calculated under assessing that between subgroups (τ2) was the same. First of all, a meta-ANOVA analysis was performed on most items except fecal TG, as shown in Table 3 and Table 4. Chitosan and resistant starch (CTS + RS) showed the highest effect size in blood TC and TG, body weight, blood glucose and blood HDL-C, CTS showed the largest effect size in blood LDL-C and TNF-α, and the cholestyramine (CSR) and water-soluble chitosan (WSC) showed the greatest effect size in liver TC and liver TG, respectively (Table 3). However, none of these items were statistically significant (p < 0.05). Table 4 shows the results of meta-ANOVA in analyzing the effect of chitosans administration period on biological indices (p > 0.05). Other than fecal TC, body weight, and blood glucose, most items showed significant differences (p < 0.05). In the case of TC, the Q statistics between the groups (Qb) was 31.94 (df = 13, p = 0.0025); the effect size between groups was assumed to be significantly different.
Next, meta-regression was performed to evaluate the effect size between the type of chitosan used and the administration period (Table 5). Only CTS + RS was significant (p = 0.0208), and it was revealed to use to decrease blood TC. In the case of WSC, it was significantly effective in lowering of serum TNF-α and body weight (p = 0.0307 and 0.0008, respectively). With regard to the administration period, this was significantly relevant to blood HDL-C and liver TC with p = 0.0004 and 0.0358, respectively.
2.4. Publication Bias
Publication bias was conducted using an Egger’s linear regression test (Table 6) on blood TC and TG, blood LDL-C and HDL-C, liver TG and TC, fecal TC, and body weight. As the results from the Egger’s linear regression test show, significance was detected in all items (p < 0.05) indicating that the relationship between effect size and standard error was statistically significant and confirming the presence of bias [48]. Thus, the trim-and-fill technique was used to correct asymmetry due to publication bias in all items, with the resulting compensated effect sizes being shown in Table 7. Other than blood HDL-C, most of the effects showed significance (p < 0.05).
3. Discussion
In the results of Table 2, most items showed negative effect size and high significance (p < 0.0001) in both effect models. These results mean that chitosan administration results in decreased levels of TC, TG, and LDL-C in blood, TC and TG in the liver, TNF-α and glucose in blood and body weight, and increased levels of blood HDL-C, fecal TC and TG.
The bioavailability of dietary fat in the intestine decreased after chitosan administration. After this, reverse cholesterol transport, which is delivered from peripheral tissues to the liver, is accelerated by excretion of surplus dietary fat, resulting in an increase in the ratio of HDL-cholesterol [49]. Similarly, [50] have reported that the addition of chitosan to an animal diet caused a decrease in LDL-cholesterol content. Generally, HDL-cholesterol may decrease cardiovascular disease by converting cholesterol condensed on peripheral tissues or blood vessel walls into an ester compound. The ester compound is then transferred to the liver, excreted by bile-salt, and cholesterol content in blood is lowered. By contrast, LDL-cholesterol, which is the most general delivery type of blood cholesterol, accumulates easily on artery walls, causing arteriosclerosis. For this reason, it is known as the leading risk factor for arteriosclerosis and cardiovascular [51]. In this result, increased HDL-cholesterol, fecal total cholesterol, and triglyceride after chitosan administration are related to the factors mentioned above. According to Jeon and Kim [52], when chitosan is cationized (–NH3+), its viscosity is increased by the formation of poly cations and gels. In high viscosity of the intestine, dietary fiber lower blood cholesterol by delaying cholesterol diffusion from micelle to mucosa, inhibiting bile acid metabolism, delaying micelle forming, and reducing cholesterol absorption rate in the intestine [19,53]. Based on this result, chitosan exhibits an excellent anti-hypercholesterolemic effect and is thought to be effective in mitigating cardiovascular disease caused by excessive fat intake.
Cytokines are secreted by activated lymphocytes and macrophages, and regulate the function of the cells related to immune response. They are also recognized as playing an essential role in the inflammatory response [54]. Yemak et al. [8] report that TNF-α generation was lower in lipopolysaccharide (LPS) and chitosan-injected mice than in LPS-injected mice. Similarly, Seo et al. [7] observed that TNF-α was increased by the application of special stimulants in a human mast cell line (HMC−1), but decreased by the use of chitosan. TNF-α is one of the pro-inflammatory cytokines synthesized by adipose tissue [55,56], and high TNF-α levels are one of the critical risk factors for diabetes [57]. In a similar vein, Yoon et al. [58] state that chitosan is associated with an anti-inflammatory response to TNF-α gene expression. According to Zhu et al. [59], chitosan has an anti-inflammatory effect on active molecules, for example TNF-α and IL-1β via the NF-κB pathway. Activated macrophages secrete numerous pro-inflammatory cytokines, including IL-1β and TNF-α, to intermediate the inflammatory response [60]. However, overproduction of these pro-inflammatory mediators causes excessive inflammation [61]; thus, regulation of the release of pro-inflammatory mediators may be important in mitigating the inflammatory response.
According to Prabu and Naturajan [62], blood glucose levels decreased in streptozotocin-induced diabetic rats that were fed chitosan for 30 days. Other researchers suggest that the effectiveness of chitosan in lowering blood glucose may be due in part to the effect of total glyceride in lowering free fatty acids. Jo et al. [63] report that in an animal study, chitosan that was enzymatically treated and of low molecular weight (<1000 Da) was more effective in managing prandial glucose. Kim et al. [64] also report that chitosan that is low in molecular weight acted similarly to acarbose, a known anti-diabetic medication, in a murine model. They also note that chitosan administration inhibited sucrase and glucoamylase activities. It is recognized that chitosan binds with glucosidase in the intestinal brush border in a manner similar to acarbose (Hanefeld, [65]; Puls et al. [66]; Krentz and Bailey [67]). The inference of these reports is that body weight may be decreased by chitosan administration.
In the course of this process, heterogeneity is introduced as a result of methodological differences between studies. In general, a heterogeneity test is used to decide on methods for combining studies and to evaluate the consistency or inconsistency of findings (Petitti [68]; Higgins et al. [69]). To evaluate heterogeneity in relation to effect size in the present study, Q statistics and I2 values were computed. The highest among Q statistics was TG in blood, with high significance (p < 0.0001). The significance of the Q statistic implies that the studies used to calculate the overall effect (the effect size of fixed and random effect models) do not share the same effect size with one another (Cho et al. [70]). In this study, the Q statistics for all items were found to be significant (p < 0.0001). However, one limitation of this method is its dependence on the number of studies (Fleiss [71]). I2 and τ2 values are commonly used to overcome this limitation of Q statistics by providing a concrete indication of heterogeneity. The I2 value is used most frequently in meta-analysis to compare different numbers of studies and data types. Consequently, it offers a solution to the issue of the Q statistic when analyzing heterogeneity (Higgins et al. [72]). All items of I2 value in the present study were above 70%, which means that they all showed significant levels of heterogeneity [73]. The τ2 value indicates the absolute value of heterogeneity, representing variance in true effect sizes [74]. In addition, liver TG showed the highest τ2 value, which means that variance in the effectiveness of chitosan administration is great (Cho et al. [70]).
Cholestyramine (trade name: Questran, Questran Light, Cholybar or Olestyr) and cholestipol (trade name: Colestid or Cholestabyl) as an anion-exchanger are these days used mainly for reducing cholesterol [75]. These medications contain amino groups, are water-insoluble, and unlike chitosan are not absorbed in the intestine. Specifically, they form insoluble complexes with bile acids in the intestines, which are then excreted in the feces. As a result, more plasma cholesterol is converted into bile acids in the liver to normalize its levels. When cholesterol is converted into bile acids, plasma cholesterol levels are lowered (National Institute of Diabetes and Digestive and Kidney Diseases [76]). Consequently, they are known to inhibit cholesterol absorption in the gut and to promote bile salt excretion. However, they are also known to involve a number of issues, including gastrointestinal disturbance, constipation, and colon cancer [77,78]. Valhouny et al. [79] report that chitosan supplementation showed a similar inhibition effect to cholestyramine in cholesterol adsorption. Similarly, an animal study by Jennings et al. [78] showed that chitosan was similar to cholestyramine in lowering lipids without other harmful changes in intestinal mucosa. Currently, a total of 1832 patents related to chitosan are being searched in the field of hyperlipidemia and associated cardiovascular diseases. It can thus be concluded that chitosan supplementation may be useful in lowering cholesterol and offers a promising alternative treatment for lifestyle-related diseases.
4. Materials and Methods
4.1. Data Set
To perform a meta-analysis of published studies regarding the effect of chitosan administration on lowering cholesterol in murine models between 1978 to 2020, a literature search was conducted on Pubmed (US National Library of Medicine, Bethesda, MD, USA) and Science Direct (Elsevier B. V., Amsterdam, The Netherlands). The keywords used for searching studies for meta-analysis were “chitosan, cholesterol” in all databases. The results obtained included 450 citations from Science Direct and 303 from Pubmed (US National Library of Medicine, Bethesda, MD, USA). These results were then filtered by title, abstract, and full text. Among them, 4 review articles and 7 studies of clinical tests in human studies were removed. Also, the studies expressed with graphical data were eliminated. Following this, studies regarding changes in cholesterol levels after chitosan administration were collected. Ultimately, a total of 34 studies with 11 items (e.g., total cholesterol, triglyceride, LDL- and HDL-cholesterol, TNF-α, and so on) were selected to perform a meta-analysis of the effectiveness of chitosan in reducing cholesterol in murine models.
4.2. Data Analysis
Corrected standardized mean difference (Hedges’ g), and 95% confidence intervals (CI) were computed between control groups and treatment. The weight of the effect size was calculated using inverse-variance [80,81]. Effect-size analysis of fixed and random effect models was used to calculate overall effect due to differences in administration period, animal strain, and the type and dosage of chitosan used in each study. Cochran’s Q test was performed to assess the statistical heterogeneity of the effect size, and the ratio of true heterogeneity to total variation in observed effects was expressed by the I2 value. To confirm the heterogeneity of effect size using a mixed-effect model for the items in question, meta-ANOVA and regression analyses were also used. Meta-ANOVA and meta-regression analysis can evaluate the difference of Hedges’ g among subgroups herein administration periods or type of treatment. The periods were set as independent factors in meta-ANOVA and as continuous variables in meta-regression. Finally, publication bias analysis was conducted to ensure the validity of the meta-analysis results. Statistical analysis and visualization of the results were performed using the ‘meta’, and ‘metafor’ packages in the R statistics software application (ver. 3.5.3, R Foundation for Statistical Computing, Vienna, Austria).
5. Conclusions
The present study confirmed the effectiveness of chitosan administration on lifestyle-related diseases through meta-analysis. Chitosan was significantly effective in lowering total cholesterol and triglyceride of blood and liver and rising fecal total cholesterol and triglyceride. Based on our results, chitosan was demonstrated to be useful in improving the symptoms of lifestyle-related disease.
Author Contributions
S.C. and N.-J.C. designed the study. S.-I.A. performed the literature search and data extraction. S.C. contributed to the statistical analyses. S.-I.A. wrote the first draft of the manuscript and S.C. and N.-J.C. prepared the final draft. All authors have read and agreed to the published version of the manuscript.
Funding
This work was supported by the National Research Foundation of Korea (NRF) grant funded by the Korea government (Ministry of Science and ICT) (No. 2020R1C1C1010982).
Institutional Review Board Statement
Not applicable.
Informed Consent Statement
Not applicable.
Data Availability Statement
The data presented in this study are fully available in the main text of this article.
Acknowledgments
The authors would like to thank the Writing Center at Jeonbuk National University for their language assistance, which we think readers will agree has greatly enhanced the readability of the manuscript.
Conflicts of Interest
The authors declare no conflict of interest.
References
- Grundy, S.M.; Cleeman, J.I.; Daniels, S.R.; Donato, K.A.; Eckel, R.H.; Franklin, B.A.; Gordon, D.J.; Krauss, R.M.; Savage, P.J.; Smith, S.C., Jr.; et al. Diagnosis and management of the metabolic syndrome. Circulation 2005, 112, 2735–2752. [Google Scholar] [CrossRef] [PubMed] [Green Version]
- Thayer, J.F.; Yamamoto, S.S.; Brosschot, J.F. The relationship of autonomic imbalance, heart rate variability and cardiovascular disease risk factors. Int. J. Cardiol. 2010, 141, 122–131. [Google Scholar] [CrossRef] [PubMed]
- Austin, P.R.; Brine, C.J.; Castle, J.E.; Zikakis, J.P. New facets of research. Science 1981, 212, 749–753. [Google Scholar] [CrossRef] [PubMed]
- Jeon, Y.J.; Kim, S.K. Effect of antimicrobial activity by chitosan oligosaccharides N-conjugated with asparagine. Microb. Biotechnol. 2001, 11, 281–286. [Google Scholar]
- Koide, S.S. Chitin-chitosan: Properties, benefits, and risks. Nutr. Res. 1998, 18, 1091–1101. [Google Scholar] [CrossRef]
- Kim, M.S.; You, H.J.; You, M.K.; Kim, N.S.; Shim, B.S.; Kim, H.M. Inhibitory effect of water-soluble chitosan on TNF-alpha and Il-8 secretion from HMC-1 cells. Immunopharmacol. Immunotoxicol. 2004, 26, 401–409. [Google Scholar] [CrossRef]
- Seo, S.B.; Jeong, H.J.; Chung, H.S.; Lee, J.D.; You, Y.O.; Kajiuchi, T.; Kim, H.M. Inhibitory effect of high molecular weight water-soluble chitosan on hypoxia-induced inflammatory cytokine production. Biol. Pharm. Bull. 2003, 26, 717–721. [Google Scholar] [CrossRef] [Green Version]
- Yermak, I.M.; Davidova, V.N.; Gorvach, V.I.; Luk’yanov, P.A.; Solov’eva, T.F.; Ulmer, A.J.; Buwitt-Beckmann, U.; Rietschel, E.T.; Ovodov, Y.S. Forming and immunological properties of some lipopolysaccharide-chitosan complexes. Biochimie 2005, 88, 23–30. [Google Scholar] [CrossRef]
- Knorr, D. Recovery and utilization of chitin and chitosan in food processing waste management. Food Technol. 1991, 44, 114–155. [Google Scholar]
- Nauss, J.L.; Thompson, J.L.; Nagyvary, J. The binding of micellar lipids to chitosan. Lipids 1983, 18, 714–719. [Google Scholar] [CrossRef]
- Kanauchi, O.; Deuchi, K.; Imasato, Y.; Shizukuishi, M.; Kobayashi, E. Mechanism for the inhibition of fat digestion by chitosan and for the synergistic effect of ascorbate. Biosci. Biotechnol. Biochem. 1995, 59, 786–790. [Google Scholar] [CrossRef] [PubMed] [Green Version]
- Gallaher, S.M.; Munion, J.; Hesslink, R., Jr.; Wise, J.; Gallaher, D.D. Cholesterol reduction by glucomannan and chitosan is mediated by changes in cholesterol absorption and bile acid and fat excretion in rats. J. Nutr. 2000, 130, 2753–2759. [Google Scholar] [CrossRef] [PubMed] [Green Version]
- Greenland, S.; O’Rourke, K. Meta-Analysis. In Modern Epidemiology, 3rd ed.; Rothman, K.J., Greenland, S., Lash, T.L., Eds.; Lippincott Williams & Wilkins: Philadelphia, PA, USA, 2008; pp. 652–682. [Google Scholar]
- Liu, S.H.; Cai, F.Y.; Chiang, M.T. Long-term feeding of chitosan ameliorates glucose and lipid metabolismin a high-fructose-diet-impaired rat model of glucose tolerance. Mar. Drugs 2015, 13, 7302–7313. [Google Scholar] [CrossRef] [PubMed] [Green Version]
- Liu, S.H.; Chiu, C.Y.; Shi, C.M.; Chiang, M.T. Functional comparison of high and low molecular weight chitosan on lipid metabolism and signals in high-fat diet-fed rats. Mar. Drugs 2018, 16, 251. [Google Scholar] [CrossRef] [PubMed] [Green Version]
- Abozaid, O.A.R.; AbdEl-hamid, O.M.; Atwa, S.A.E. Hypolipidemic and anti-inflammatory effect of chitosan in experimental induced non-alcoholic fatty liver disease in rats. Benha Vet. Med. J. 2015, 28, 155–165. [Google Scholar] [CrossRef] [Green Version]
- Bahijri, S.M.; Alsheikh, L.; Ajabnoor, G.; Borai, A. Effect of supplementation with chitosan on weight, cardiometabolic, and other risk indices in Wistar rats fed normal and high-fat/high-cholesterol diets Ad Libitum. Nutr. Metab. Insights 2017, 10, 1178638817710666. [Google Scholar] [CrossRef] [PubMed] [Green Version]
- Chiu, C.Y.; Chan, I.L.; Yang, T.H.; Liu, S.H.; Chiang, M.T. Supplementation of chitosan alleviates high-fat diet-enhanced lipogenesis in rats via adenosine monophosphate (AMP)-activated protein kinase activation and inhibition of lipogenesis-associated genes. J. Agric. Food Chem. 2015, 63, 2979–2988. [Google Scholar] [CrossRef]
- Park, J.H.; Hong, E.K.; Ahn, J.; Kwak, H.S. Properties of nanopowdered chitosan and its cholesterol lowering effect in rats. Food Sci. Biotechnol. 2010, 19, 1457–1462. [Google Scholar] [CrossRef]
- Sivakumar, R.; Rajesh, R.; Buddhan, S.; Jeyakumar, R.; Rajaprabhu, D.; Ganersan, B.; Anadan, R. Antilipidemic effect of chitosan against experimentally induced myocardial infarction in rats. J. Cell Anim. Biol. 2007, 1, 71–77. [Google Scholar]
- Sugano, M.; Fujikawa, T.; Hiratsuji, Y.; Hasegawa, Y. Hypocholesterolemic effects of chitosan in cholesterol-fed rats. Nutr. Rep. Int. 1978, 18, 531–536. [Google Scholar]
- Tao, Y.; Zhang, H.; Gao, B.; Guo, J.; Hu, Y.; Su, Z. Water-soluble chitosan nanoparticles inhibit hypercholesterolemia induced by feeding a high-fat diet in male Sprague-Dawley rats. J. Nanomater. 2011. [Google Scholar] [CrossRef]
- Zacour, A.C.; Silva, M.E.; Cecon, P.R.; Bambirra, E.A.; Vieira, E.C. Effect of dietary chitin on cholesterol absorption and metabolism in rats. J. Nutr. Sci. Vitam. 1992, 38, 609–613. [Google Scholar] [CrossRef] [PubMed] [Green Version]
- Yao, H.T.; Chiang, M.T. Effect of chitosan on plasma lipids, hepatic lipids, and fecal bile acid in hamsters. J. Food Drug Anal. 2006, 14, 183–189. [Google Scholar] [CrossRef]
- Moon, M.S.; Lee, M.S.; Kim, C.T.; Kim, Y. Dietary chitosan enhances hepatic CYP7A1 activity and reduces plasma and liver cholesterol concentrations in diet-induced hypercholesterolemia in rats. Nutr. Res. Pract. 2007, 1, 175–179. [Google Scholar] [CrossRef] [Green Version]
- Chiu, C.Y.; Chang, T.C.; Liu, S.H.; Chiang, M.T. The regulatory effects of fish oil and chitosan on hepatic lipogenic signals in high-fat diet-induced obese rats. J. Food Drug Anal. 2017, 25, 919–930. [Google Scholar] [CrossRef] [Green Version]
- Ardakani, F.E.; Karbasi, M.H.A.; Vahidi, A.; Mirjalili, N.; Eslampour, N. Effects of chitosan and Salvadora persica on blood lipids in the Wistar rat. Med. J. Islamic World Acad. Sci. 2009, 17, 95–102. [Google Scholar]
- Jung, E.Y.; Hong, Y.H.; Chang, U.J.; Suh, H.J. Anti-obese effects of chitosan and psyllium husk containing vitamin C in Sprague-Dawley (SD) rats fed a high fat diet. Prog. Nutr. 2016, 18, 152–160. [Google Scholar]
- Hsieh, Y.L.; Yao, H.T.; Cheng, R.S.; Chiang, M.T. Chitosan reduces plasma adipocytokines and lipid accumulation in liver and adipose tissues and ameliorates insulin resistance in diabetic rats. J. Med. Food. 2012, 15, 453–460. [Google Scholar] [CrossRef]
- Han, L.K.; Kimura, Y.; Okuda, H. Reduction in fat storage during chitin-chitosan treatment in mice fed a high-fat diet. Int. J. Obes. 1999, 23, 174–179. [Google Scholar] [CrossRef] [Green Version]
- Chiang, M.T.; Yao, H.T.; Chen, H.C. Effect of dietary chitosans with different viscosity on plasma lipids and lipid peroxidation in rats fed on a diet enriched with cholesterol. Biosci. Biotechnol. Biochem. 2000, 64, 965–971. [Google Scholar] [CrossRef] [Green Version]
- Shang, W.; Si, X.; Zhou, Z.; Wanga, J.; Strappe, P.; Blanchard, C. Studies on the unique properties of resistant starch and chitooligosaccharide complexes for reducing high-fat diet-induced obesity and dyslipidemia in rats. J. Funct. Foods. 2017, 38, 20–27. [Google Scholar] [CrossRef]
- Zhang, H.L.; Tao, Y.; Guo, J.; Hu, Y.M.; Su, Z.Q. Hypolipidemic effects of chitosan nanoparticles in hyperlipidemia rats induced by high fat diet. Int. Immunopharmacol. 2011, 11, 457–461. [Google Scholar] [CrossRef] [PubMed]
- van Bennekum, A.M.; Nguyen, D.V.; Schulthess, G.; Hauser, H.; Phillips, M.C. Mechanisms of cholesterol-lowering effects of dietary insoluble fibres: Relationships with intestinal and hepatic cholesterol parameters. Br. J. Nutr. 2005, 94, 331–337. [Google Scholar] [CrossRef] [PubMed]
- Zhou, G.D.; Li, M.R.; Zhang, J.; Pan, D.; Zhao, S.X.; Yang, J.F.; Yu, J.; Zhao, J.M. Chitosan ameliorates the severity of steatohepatitis induced by high fat diet in rats. Scand. J. Gastroenterol. 2008, 43, 1371–1377. [Google Scholar] [CrossRef]
- Kumar, S.G.; Rahman, M.A.; Lee, S.H.; Hwang, H.S.; Kim, H.A.; Yun, J.W. Plasma proteome analysis for anti-obesity and anti-diabetic potentials of chitosan oligosaccharides in ob/ob mice. Proteomics 2009, 9, 2149–2162. [Google Scholar] [CrossRef]
- Kim, J.N.; Chang, I.Y.; Kim, H.I.; Yoon, S.P. Long-term effects of chitosan oligosaccharide in streptozotocin-induced diabetic rats. Islets 2009, 1, 111–116. [Google Scholar] [CrossRef]
- Zong, C.; Yu, Y.; Song, G.; Luo, T.; Li, L.; Wang, X.; Qin, S. Chitosan oligosaccharides promote reverse cholesterol transport and expression of scavenger receptor BI and CYP7A1 in mice. Exp. Biol. Med. 2012, 237, 194–200. [Google Scholar] [CrossRef]
- Liu, S.H.; He, S.P.; Chiang, M.T. Effects of long-term feeding of chitosan on postprandial lipid responses and lipid metabolism in a high-sucrose-diet-impaired glucose-tolerant rat model. J. Agric. Food Chem. 2012, 60, 4306–4313. [Google Scholar] [CrossRef]
- Zhang, J.; Zhang, W.; Mamadouba, B.; Xia, W. A comparative study on hypolipidemic activities of high and low molecular weight chitosan in rats. Int. J. Biol. Macromol. 2012, 51, 504–508. [Google Scholar] [CrossRef]
- Zhang, H.L.; Zhong, X.B.; Tao, Y.; Wu, S.H.; Su, Z.Q. Effects of chitosan and water-soluble chitosan micro- and nanoparticles in obese rats fed a high-fat diet. International. J. Nanomed. 2012, 2012 7, 4069–4076. [Google Scholar] [CrossRef] [Green Version]
- Zhang, W.; Xia, W. Effect of media milling on lipid-lowering and antioxidant activities of chitosan. Int. J. Biol. Macromol. 2015, 72, 1402–1405. [Google Scholar] [CrossRef] [PubMed]
- Si, X.; Strappe, P.; Blanchard, C.; Zhou, Z. Enhanced anti-obesity effects of complex of resistant starch and chitosan in high fat diet fed rats. Carbohydr. Polym. 2017, 157, 834–841. [Google Scholar] [CrossRef] [PubMed] [Green Version]
- Do, A.R.; Cho, S.J.; Cho, Y.Y.; Kwon, E.Y.; Choi, J.Y.; Lee, J.H.; Han, Y.; Kim, Y.S.; Piao, Z.; Shin, Y.C.; et al. Antiobesity effects of short-chain chitosan in diet-induced obese mice. J. Med. Food. 2018, 21, 927–934. [Google Scholar] [CrossRef] [PubMed]
- Wang, Z.; Zhang, F.; Yan, Y.; Zhang, Z.; Wang, L.; Qin, C. Lipid-lowering activities of chitosan and its quaternary ammonium salt for the hyperlipidemia rats induced by high-fat diets. Int. J. Biol. Macromol. 2019, 132, 922–928. [Google Scholar] [CrossRef]
- Chiu, C.Y.; Yen, T.E.; Liu, S.H.; Chiang, M.T. Comparative effects and mechanisms of chitosan and its derivatives on hypercholesterolemia in high-fat diet-fed rats. Int. J. Mol. Sci. 2020, 21, 92. [Google Scholar] [CrossRef] [Green Version]
- Wang, D.; Han, J.; Yu, Y.; Li, X.; Wang, Y. Chitosan oligosaccharide decreases very-low-density lipoprotein triglyceride and increases high-density lipoprotein cholesterol in high-fat-diet-fed rats. Exp. Biol. Med. 2011, 236, 1064–1069. [Google Scholar] [CrossRef]
- Egger, M.G.; Davey, S.; Schneider, M.; Minder, C. Bias in meta-analysis detected by a simple, graphical test. Br. Med. J. 1997, 315, 629–634. [Google Scholar] [CrossRef] [Green Version]
- Razdan, A.; Pettersson, D. Effect of chitosan on nutrient digestibility and plasma lipid concentration in broiler chickens. Br. J. Nutr. 1994, 72, 277–288. [Google Scholar] [CrossRef] [Green Version]
- Lee, J.M.; Cho, W.K.; Park, H.J. Effects of chitosan treated with enzymatic methods on glucose and lipid metabolism in rat. Korean J. Nutr. 1998, 31, 1112–1120. [Google Scholar]
- Gordon, T.; Castelli, W.P.; Dawber, T.R. Lipoprotein, cardiovascular disease and death, the Framingham study. Arch. Intern. Med. 1981, 141, 1128–1135. [Google Scholar] [CrossRef]
- Jeon, Y.J.; Kim, S.K. Potential immuno-stimulating effect of antitumoral fraction of chitosan oligosaccharides. J. Chitin Chitosan 2001, 6, 163–167. [Google Scholar]
- Gallaher, D.D. Chitosan, cholesterol lowering, and caloric loss. Food Sci. Nutr. 2003, 14, 32–35. [Google Scholar]
- Zhang, J.M.; An, J. Cytokines, inflammation and pain. Int. Anesth. Clin. 2007, 45, 27–37. [Google Scholar] [CrossRef] [PubMed] [Green Version]
- Fried, S.K.; Bunkin, D.A.; Greenberg, A.S. Omental and subcutaneous adipose tissues of obese subjects release interleukin-6: Depot difference and regulation by glucocorticoid. J. Clin. Endocrinol. Metab. 1998, 83, 847–850. [Google Scholar] [CrossRef]
- Mohamed-Ali, V.; Goodrick, S.; Rawesh, A.; Katz, D.R.; Miles, J.M.; Yudkin, J.S.; Klein, S.; Coppack, S.W. Subcutaneous adipose tissue releases interleukin-6, but not tumor necrosis factor-alpha, in vivo. J. Clin. Endocrinol. Metab. 1997, 82, 4196–4200. [Google Scholar]
- Ziamajidi, N.; Nasiri, A.; Abbasalipourkabir, R.; Sadeghi Moheb, S. Effects of garlic extract on TNF-alpha expression and oxidative stress status in the kidneys of rats with STZ + nicotinamide-induced diabetes. Pharm. Biol. 2017, 55, 526–531. [Google Scholar] [CrossRef] [Green Version]
- Yoon, H.J.; Moon, M.E.; Park, H.S.; Im, S.Y.; Kim, Y.H. Chitosan oligosaccharide (COS) inhibits LPS-induced inflammatory effects in RAW 264.7 macrophage cells. Biochem. Biophys. Res. Commun. 2007, 358, 954–959. [Google Scholar] [CrossRef]
- Zhu, J.; Zhang, Y.; Wu, G.; Xiao, Z.; Zhou, H.; Yu, X. Inhibitory effects of oligochitosan on TNF-α, IL-1β and nitric oxide production in lipopolysaccharide-induced RAW264.7 cells. Mol. Med. Rep. 2015, 11, 729–733. [Google Scholar] [CrossRef]
- Lin, W.W.; Karin, M. A cytokine-mediated link between innate immunity, inflammation, and cancer. J. Clin. Investig. 2017, 117, 1175–1183. [Google Scholar] [CrossRef]
- Lawrence, T.; Willoughby, D.A.; Gilroy, D.W. Anti-inflammatory lipid mediators and insights into the resolution of inflammation. Nat. Rev. Immunol. 2002, 2, 787–795. [Google Scholar] [CrossRef]
- Prabu, K.; Natarajan, E. Antihyperglycemic effect of chitosan of urophthalmus vigil in streptozotocin induced diabetic rats. Int. J. Pharm. Sci. Res. 2013, 4, 352–359. [Google Scholar]
- Jo, S.H.; Ha, K.S.; Moon, K.S.; Kim, J.G.; Oh, C.G.; Kim, Y.C.; Apostolidis, E.; Kwon, Y.I. Molecular weight dependent glucose lowering effect of low molecular weight chitosan oligosaccharide (GO2KA1) on postprandial blood glucose level in SD rats model. Int. J. Mol. Sci. 2013, 14, 14214–14224. [Google Scholar] [CrossRef] [PubMed] [Green Version]
- Kim, J.G.; Jo, S.H.; Ha, K.S.; Kim, S.C.; Kim, Y.C.; Apostolidis, E.; Kwon, Y.I. Effect of long-term supplementation of low molecular weight chitosan oligosaccharide (GO2KA1) on fasting blood glucose and HbA1c in db/db mice model and elucidation of mechanism of action. BMC Complementary Altern. Med. 2014, 14, 272–278. [Google Scholar] [CrossRef] [PubMed] [Green Version]
- Hanefeld, M. Cardiovascular benefits and safety profile of acarbose therapy in prediabetes and established type 2 diabetes. Cardiovasc. Diabetol. 2007, 6, 20. [Google Scholar] [CrossRef] [PubMed] [Green Version]
- Puls, W.; Keup, U.; Krause, H.P.; Thomas, G.; Hoffmeister, F. Glucosidase inhibition. A new approach to the treatment of diabetes, obesity, and hyperlipoproteinaemia. Naturwissenschaften 1977, 64, 36–537. [Google Scholar]
- Krentz, A.; Bailey, C. Oral antidiabetic agents. Drugs 2004, 65, 385–411. [Google Scholar] [CrossRef]
- Petitti, D.B. Approaches to heterogeneity in meta-analysis. Stat. Med. 2001, 20, 3625–3633. [Google Scholar] [CrossRef]
- Higgins, J.; Thompson, S.; Deeks, J.; Altman, D. Statistical heterogeneity in systematic reviews of clinical trials: A critical appraisal of guidelines and practice. J. Health Serv. Res. Policy. 2002, 7, 51–61. [Google Scholar] [CrossRef]
- Cho, S.B.; Lee, S.M.; Kim, E.J. Effect of different forages on growth performance, meat production and meat quality of Hanwoo steers: Meta-analysis. J. Korean Soc. Grassl. Forage Sci. 2012, 32, 175–184. [Google Scholar] [CrossRef] [Green Version]
- Fleiss, J.L. Analysis of data from multiclinic trials. Control. Clin. Trials. 1986, 7, 267–275. [Google Scholar] [CrossRef]
- Higgins, J.P.T.; Thompson, S.G.; Deeks, J.J.; Altman, D.G. Measuring inconsistency in meta-analyses. Br. Med. J. 2003, 327, 557–560. [Google Scholar] [CrossRef] [PubMed] [Green Version]
- Ahn, S.I.; Cho, S.B.; Choi, N.J. Effect of dietary probiotics on colon length in an inflammatory bowel disease–induced murine model: A meta-analysis. J. Dairy Sci. 2020, 103, 1807–1819. [Google Scholar] [CrossRef] [PubMed]
- Tufanaru, C.; Munn, Z.; Aromataris, E.; Campbell, J.; Hopp, L. Systematic reviews of effectiveness. In The Joanna Briggs Institute Reviewer’s Manual; Aromataris, E., Munn, Z., Eds.; JBI: Adelaide, Austrailia, 2020; Available online: https://synthesismanual.jbi.global (accessed on 14 October 2020).
- Handelsman, Y. Role of bile acid sequestrants in the treatment of type 2 diabetes. Diabetes Care 2011, 34 (Suppl. 2), S244–S250. [Google Scholar] [CrossRef] [Green Version]
- National Institute of Diabetes and Digestive and Kidney Diseases. LiverTox: Clinical and Research Information on Drug-Induced Liver Injury [Internet]. Available online: https://pubmed.ncbi.nlm.nih.gov/31643176 (accessed on 20 October 2020).
- Clementi, M.; Weber-Schondorfer, C. Gastro-intestinal medications, hypolipidemic agents and spasmolytics. In Drugs during Pregnancy and Lactation: Treatment Options and Risk Assessment; Schaefer, C., Peters, P.W.J., Mille, R.K., Eds.; Elsevier: London, UK, 2015; pp. 93–113. [Google Scholar]
- Jennings, C.D.; Boleyn, K.; Bridges, S.R.; Wood, P.J.; Anderson, J.W. A comparison of the lipid-lowering and intestinal morphological effects of cholestyramine, chitosan, and oat gum in rats. Exp. Biol. Med. 1988, 189, 13–20. [Google Scholar] [CrossRef] [PubMed]
- Vahouny, G.V.; Satchihanandam, S.; Cassidy, M.M.; Lightfoot, F.B.; Furda, I. Comparative effects of chitosan and cholestyramine on lymphatic absorption of lipids in the rat. Am. J. Clin. Nutr. 1983, 38, 278–284. [Google Scholar] [CrossRef] [PubMed] [Green Version]
- Borenstein, M. Effect sizes for continuous data. In Handbook of Research Synthesis and Meta-Analysis, 2nd ed.; Cooper, H., Hedges, L.V., Valentine, J.C., Eds.; Russell Sage: New York, NY, USA, 2009; pp. 221–235. [Google Scholar]
- Deek, J.J.; Higgins, J.P.T.; Altman, D.G. Analysing data and undertaking meta-analyses. In Cochrane Handbook for Systematic Reviews of Interventions; Higgins, J.P.T., Green, S., Eds.; John Wiley & Sons: West Sussex, UK, 2011; pp. 243–293. [Google Scholar]
Figure 1.
Schematic representation of cholesterol adsorption of chitosan in gastrointestinal tracts.
Figure 1.
Schematic representation of cholesterol adsorption of chitosan in gastrointestinal tracts.


Table 1.
Studies used in the data set and their information for meta-analysis.
| Authors | Animal (Strain) | n | Week | Experimental Diet | Analytical Items 1 |
|---|---|---|---|---|---|
| Liu et al. (2018) [15] | Rat (Sprague–Dawley) | 8 | 8 | High fat | TC *, TG *, LDL-C *, HDL-C *, TNF-α * |
| Abozaid et al. (2015) [16] | Rat (white Albino) | 10 | 6 | High fat | TC *, TG *, LDL-C *, HDL-C *, TNF-α * |
| Bahijri et al. (2017) [17] | Rat (Wistar) | 10 | 12 | High fat | TC *, TG *, LDL-C *, HDL-C * |
| Chiu et al. (2015) [18] | Rat (Sprague–Dawley) | 8 | 7 | High fat | TC *, TG *, TC ‡, TG ‡ |
| Park et al. (2010) [19] | Rat (Sprague–Dawley) | 8 | 8 | High fat | TC *, TG *, LDL-C *, HDL-C *, TC †, TG †, TC ‡ |
| Sivakumar et al. (2007) [20] | Rat (Wistar) | 6 | 8.5 | High fat | TC *, TG *, LDL-C *, HDL-C * |
| Sugano et al. (1978) [21] | Rat (Wistar) | 6 | 2.8 | High fat | TC *, TG *, TC †, TG †, TC ‡ |
| Tao et al. (2011) [22] | Rat (Sprague–Dawley) | 8 | 4 | High fat | TC *, TG *, LDL-C *, HDL-C * |
| Zacour et al. (1992) [23] | Rat (Wistar) | 6 | 6 | High fat | TC *, TG *, TC †, TG †, TC ‡, TG ‡ |
| Yao and Chiang (2006) [24] | Hamster | 9 | 8 | High fat | TC *, TG *, LDL-C *, HDL-C *, TC †, TG †, TC ‡ |
| Moon et al. (2007) [25] | Rat (Sprague–Dawley) | 8 | 4 | High fat | TC *, TG *, LDL-C *, HDL-C *, TC † |
| Chiu et al. (2017) [26] | Rat (Sprague−Dawley) | 8 | 5 | High fat | TC *, TG*, HDL-C *, TC ‡, TG ‡ |
| Liu et al. (2015) [14] | Rat (Sprague–Dawley) | 8 | 21 | High fructose | TC *, TG *, HDL-C *, TC †, TG †, TC ‡, TG ‡ |
| Ardakani et al. (2009) [27] | Rat (Wistar) | 5 | 2 | High fat | TC *, TG *, LDL-C *, HDL-C * |
| Jung et al. (2016) [28] | Rat (Sprague–Dawley) | 8 | 6 | High fat | TC *, TG *, LDL-C *, HDL-C * |
| Hsieh et al. (2012) [29] | Rat (Sprague–Dawley) | 9.5 | 10 | High fat | TC †, TG †, TNF-α * |
| Han et al. (1999) [30] | Mouse (ICR) | 13 | 9 | High fat | TC *, TG, TC †, TG †, body weight |
| Chiang et al. (2000) [31] | Rat (Sprague–Dawley) | 6 | 4 | Normal diet + cellulose 5% | TC *, LDL-C *, HDL-C *, TC †, TG †, TC ‡, TG ‡ |
| Shang et al. (2017) [32] | Rat (Sprague–Dawley) | 8 | 6 | High fat | TC *, TG *, LDL-C *, HDL-C *, body weight |
| Zhang et al. (2011) [33] | Rat (Sprague–Dawley) | 8 | 4 | High fat | TC *, TG *, LDL-C *, HDL-C * |
| van Bennekum et al. (2005) [34] | Mouse (C57BL/6) | 6 | 3 | High fat | TC *, TC † |
| Zhou et al. (2008) [35] | Rat (Sprague–Dawley) | 12 | 8 | High fat | TC *, TG *, LDL-C *, HDL-C *, TNF-α *, glucose * |
| Kumar et al. (2009) [36] | Mouse (C57BL/6) | 6 | 4 | High fat | TC *, TG * |
| Kim et al. (2009) [37] | Rat (Sprague–Dawley) | 5 | 8 | High fat | TC *, body weight |
| Zong et al. (2012) [38] | Mouse (C57BL/6) | 6 | 6 | High fat | TC *, TG *, LDL-C *, HDL-C *, body weight, |
| Liu et al. (2012) [39] | Rat (Sprague–Dawley) | 9 | 16 | High sucrose | TC *, TG *, HDL-C *, TNF-α *, glucose * |
| Zhang et al. (2012) [40] | Rat (Sprague–Dawley) | 8 | 8 | High fat | TC *, TG *, LDL-C *, HDL-C *, TC †, TG † |
| Zhang et al. (2012) [41] | Rat (Sprague–Dawley) | 10 | 4 | High fat | TC *, TG *, LDL-C *, HDL-C * |
| Zhang and Xia (2015) [42] | Rat (Sprague–Dawley) | 8 | 8 | High fat | TC *, TG *, LDL-C *, HDL-C *, TC †, TG †, TC ‡, body weight |
| Si et al. (2017) [43] | Rat (Wistar) | 8 | 6 | High fat | TC *, TG *, LDL-C *, HDL-C *, body weight, glucose * |
| Do et al. (2018) [44] | Mouse (C57BL/6) | 10 | 12 | High fat | TC *, TG *, HDL-C *, TC †, TG †, TC ‡, TG ‡, body weight |
| Wang et al. (2019) [45] | Rat (Sprague–Dawley) | 8 | 4.2 | High fat | TC *, TG *, LDL-C *, HDL-C *, TC †, TG †, TC ‡, body weight |
| Chiu et al. (2020) [46] | Rat (Sprague–Dawley) | 6 | 8 | High fat | TC *, TC †, TC ‡, TNF-α * |
| Wang et al. (2011) [47] | Rat (Wistar) | 8 | 3 | High fat | TG *, LDL-C *, HDL-C * |
1 TC, total cholesterol; TG, triglyceride; LDL-C, low-density lipoprotein cholesterol; HDL-C, high-density lipoprotein cholesterol; TNF-α, tumor necrosis factor-α; *, blood; †, liver; ‡, feces.
Table 2.
Effect size of chitosan administration on hyperlipidemia in murine model.
| Items | df | Fixed Effect Model | Random Effect Model | Heterogeneity | ||||
|---|---|---|---|---|---|---|---|---|
| ES 1 | p-Value | ES | p-Value | Q (p-Value) | I2 (%) | τ2 | ||
| Total cholesterol (blood) | 65 | −1.5457 | <0.0001 | −2.2248 | <0.0001 | 376.43 (<0.0001) | 82.7 | 2.1388 |
| Triglyceride (blood) | 63 | −0.5852 | <0.0001 | −1.2366 | <0.0001 | 525.93 (<0.0001) | 88.0 | 2.6610 |
| LDL-cholesterol (blood) | 46 | −1.6121 | <0.0001 | −2.5212 | <0.0001 | 294.88 (<0.0001) | 84.4 | 2.5182 |
| HDL-cholesterol (blood) | 49 | 0.1318 | 0.1363 | 0.1532 | 0.5704 | 431.89 (<0.0001) | 88.7 | 3.0718 |
| Total cholesterol (liver) | 30 | −2.3101 | <0.0001 | −3.3734 | <0.0001 | 187.28 (<0.0001) | 84.0 | 3.2403 |
| Triglyceride (liver) | 22 | −2.1172 | <0.0001 | −3.2648 | <0.0001 | 172.75 (<0.0001) | 87.3 | 3.8731 |
| Total cholesterol (feces) | 22 | 1.8491 | <0.0001 | 2.6038 | <0.0001 | 113.25 (<0.0001) | 80.6 | 2.2198 |
| Triglyceride (feces) | 9 | 2.0168 | <0.0001 | 2.4130 | <0.0001 | 35.30 (<0.0001) | 74.5 | 1.5050 |
| TNF-α (blood) | 12 | −1.4885 | <0.0001 | −1.8355 | <0.0001 | 66.72 (<0.0001) | 82.0 | 1.8174 |
| Body weight | 21 | −1.5974 | <0.0001 | −2.4442 | <0.0001 | 162.18 (<0.0001) | 87.1 | 3.1836 |
| Glucose (blood) | 12 | −0.7512 | <0.0001 | −0.8958 | 0.0096 | 61.64 (<0.0001) | 80.5 | 1.2356 |
1 ES: effect size.
Table 3.
Meta-ANOVA analysis of effect of chitosan type on biological indices.
| Biological Index 1 | Analysis Item 2 | K3 | Fixed Effect Model | Random Effect Model | Q 6 | τ2 7 | I2 8 | Qb 9 | df 10 | p | ||||
|---|---|---|---|---|---|---|---|---|---|---|---|---|---|---|
| SMD 4 | 95%-CI 5 | SMD | 95%-CI | |||||||||||
| Lower | Upper | Lower | Upper | |||||||||||
| TC (blood) | CTS | 42 | −1.5720 | −1.7639 | −1.3801 | −2.0640 | −2.5645 | −1.5635 | 194.29 | 2.2266 | 78.9 | 12.60 | 7 | 0.0826 |
| WSC | 17 | −1.5434 | −1.9066 | −1.1801 | −2.7620 | −3.6088 | −1.9153 | 145.47 | 2.2266 | 89.0 | ||||
| RS | 2 | −1.7624 | −2.6836 | −0.8412 | −2.3197 | −4.6315 | −0.0080 | 6.88 | 2.2266 | 85.5 | ||||
| CE | 1 | −2.1859 | −3.7413 | −0.6305 | −2.1859 | −5.4984 | 1.1266 | 0.00 | -11 | - | ||||
| CTS + RS | 1 | −8.9998 | −12.7228 | −5.2769 | −8.9998 | −13.7341 | −4.2655 | 0.00 | - | - | ||||
| WSC + RS | 1 | −1.4835 | −4.6243 | 1.6572 | −1.4835 | −4.6243 | 1.6572 | 0.00 | - | - | ||||
| CTS + VitC | 1 | 0.2823 | −0.7041 | 1.2688 | 0.2823 | −2.8042 | 3.3688 | 0.00 | - | - | ||||
| CSR | 1 | −1.9182 | −3.3870 | −0.4494 | −1.9182 | −5.1910 | 1.3545 | 0.00 | - | - | ||||
| TG (blood) | CTS | 39 | −0.4142 | −0.6035 | −0.2249 | −1.0874 | −1.6614 | −0.5135 | 378.70 | 2.8583 | 90.0 | 5.50 | 6 | 0.4819 |
| WSC | 17 | −1.1778 | −1.4773 | −0.8782 | −1.9030 | −2.7835 | −1.0224 | 86.48 | 2.8583 | 81.5 | ||||
| RS | 2 | −0.8491 | −1.6483 | −0.0499 | −1.1971 | −3.6866 | 1.2924 | 7.64 | 2.8583 | 86.9 | ||||
| CE | 1 | 1.1106 | 0.0996 | 2.1216 | 1.1106 | −2.3538 | 4.5750 | 0.00 | - | - | ||||
| CTS + RS | 1 | −3.4066 | −5.0825 | −1.7307 | −3.4066 | −7.1199 | 0.3067 | 0.00 | - | - | ||||
| WSC + RS | 1 | −1.4338 | −2.5685 | −0.2990 | −1.4338 | −4.9363 | 2.0688 | 0.00 | - | - | ||||
| CTS + VitC | 1 | −0.8606 | −1.8990 | 0.1778 | −0.8606 | −4.3331 | 2.6119 | 0.00 | - | - | ||||
| LDL-C (blood) | CTS | 28 | −2.1800 | −2.4471 | −1.9129 | −2.8041 | −3.4238 | −2.1843 | 100.39 | 1.9848 | 73.1 | 6.27 | 3 | 0.0990 |
| WSC | 13 | −1.6760 | −2.0564 | −1.2956 | −2.8831 | −3.8113 | −1.9550 | 100.21 | 1.9848 | 88.0 | ||||
| RS | 2 | −0.2492 | −0.9457 | 0.4474 | −0.2492 | −2.3222 | 1.8238 | 0.00 | 1.9848 | 0.0 | ||||
| CTS + RS | 2 | −1.6799 | −2.5327 | −0.8270 | −1.7721 | −3.9089 | 0.3647 | 1.49 | 1.9848 | 32.9 | ||||
| HDL-C (blood) | CTS | 36 | 0.1332 | −0.0704 | 0.3368 | 0.3816 | −0.2696 | 1.0329 | 315.19 | 3.3880 | 88.9 | 3.63 | 4 | 0.4585 |
| WSC | 10 | −0.0158 | −0.4449 | 0.4132 | −0.7968 | −2.0465 | 0.4528 | 107.00 | 3.3880 | 91.6 | ||||
| RS | 2 | −0.1120 | −0.8081 | 0.5842 | −0.1134 | −2.7577 | 2.5308 | 0.34 | 3.3880 | 0.0 | ||||
| CTS + RS | 1 | 1.9999 | 0.7360 | 3.2638 | 1.9999 | −1.8227 | 5.8225 | 0.00 | - | - | ||||
| WSC + RS | 1 | 0.2293 | −0.7549 | 1.2135 | 0.2293 | −3.5102 | 3.9688 | 0.00 | - | - | ||||
| TC (liver) | CTS | 26 | −2.5523 | −2.8603 | −2.2442 | −3.6571 | −4.4528 | −2.8614 | 157.12 | 3.2800 | 84.1 | 4.50 | 3 | 0.2122 |
| WSC | 3 | −1.0529 | −1.7573 | −0.3485 | −1.5068 | −3.6972 | 0.6837 | 11.05 | 3.2800 | 81.9 | ||||
| CE | 1 | −1.5873 | −2.9588 | −0.2158 | −1.5873 | −5.3927 | 2.2181 | 0.00 | - | - | ||||
| CSR | 1 | −4.7470 | −7.3259 | −2.1682 | −4.7470 | −9.1346 | −0.3595 | 0.00 | - | - | ||||
| TG (liver) | CTS | 19 | −1.9028 | −2.2234 | −1.5823 | −3.0600 | −4.0045 | −2.1154 | 153.33 | 3.5904 | 88.3 | 0.91 | 1 | 0.3410 |
| WSC | 4 | −3.9955 | −4.9445 | −3.0466 | −4.1792 | −6.2803 | −2.0781 | 2.65 | 3.5904 | 0.0 | ||||
| TC (feces) | CTS | 20 | 1.8847 | 1.5660 | 2.2034 | 2.6479 | 1.8759 | 3.4200 | 97.07 | 2.3783 | 80.4 | 0.04 | 1 | 0.8341 |
| WSC | 3 | 1.6188 | 0.8072 | 2.4304 | 2.4194 | 0.4258 | 4.4131 | 15.82 | 2.3783 | 87.4 | ||||
| Body weight | CTS | 11 | −2.4795 | −2.9132 | −2.0458 | −3.4586 | −4.5418 | −2.3755 | 78.81 | 2.5667 | 87.3 | 18.75 | 4 | 0.0009 |
| WSC | 7 | −0.5100 | −0.9616 | −0.0584 | −0.5950 | −1.8669 | 0.6769 | 22.98 | 2.5667 | 73.9 | ||||
| RS | 2 | −1.7624 | −2.6836 | −0.8412 | −2.3356 | −4.7858 | 0.1147 | 6.88 | 2.5667 | 85.5 | ||||
| CTS + RS | 1 | −8.9998 | −12.7228 | −5.2769 | −8.9998 | −13.8702 | −4.1295 | 0.00 | - | - | ||||
| WSC + RS | 1 | −1.4835 | −2.6285 | −0.3386 | −1.4835 | −4.8258 | 1.8588 | 0.00 | - | - | ||||
| TNF-α | CTS | 12 | −1.6953 | −2.0508 | −1.3398 | −2.0430 | −2.8184 | −1.2676 | 49.88 | 1.4116 | 77.9 | 19.84 | 3 | 0.0002 |
| WSC | 1 | 0.9843 | −0.2451 | 2.2137 | 0.9843 | −1.6489 | 3.6175 | 0.00 | - | - | ||||
| Glucose (blood) | CTS | 10 | −0.7573 | −1.0898 | −0.4247 | −0.9044 | −1.6869 | −0.1218 | 48.68 | 1.2809 | 81.5 | 2.49 | 3 | 0.4765 |
| RS | 1 | −1.6688 | −2.8537 | −0.4840 | −1.6688 | −4.1837 | 0.8460 | 0.00 | - | - | ||||
| CTS + RS | 1 | −1.7693 | −2.9772 | −0.5615 | −1.7693 | −4.2951 | 0.7564 | 0.00 | - | - | ||||
| CTS + VitC | 1 | 0.7144 | −0.3062 | 1.7350 | 0.7144 | −1.7274 | 3.1562 | 0.00 | - | - | ||||
1 TC, total cholesterol; TG, triglyceride, LDL-C, low-density lipoprotein; HDL-C, high-density lipoprotein, TNF-α; Tumor necrosis factor alpha; 2 CTS, chitosan; WSC, water-soluble chitosan; RS, resistant starch; CE, cellulose; CTS + RS, chitosan and resistant starch; WSC + RS, water-soluble chitosan and resistant starch; CTS + VitC, chitosan and vitamin C; CSR, cholestyramine; 3 k: number of treatments; 4 SMD: standardized mean difference; 5 CI: confidence interval; 6 Q: chi-squared statistic; 7 τ2: true heterogeneity; 8 I2: Higgin’s I2 statistic; 9 Qb: Q statistics between groups; 10 df: degrees of freedom of Q statistic; 11 –: no data.
Table 4.
Meta-ANOVA analysis of effect of chitosans administration period on biological indices.
| Item 1 | Administration Period (Week) | K2 | Fixed Effect Model | Random Effect Model | Q 5 | τ2 6 | I2 7 | Qb 8 | Df 9 | p | ||||
|---|---|---|---|---|---|---|---|---|---|---|---|---|---|---|
| SMD 3 | 95%-CI 4 | SMD | 95%-CI | |||||||||||
| Lower | Upper | Lower | Upper | |||||||||||
| TC (blood) | 2 | 1 | −2.4519 | −4.3072 | −0.5966 | −2.4519 | −5.6070 | 0.7668 | 0.00 | -10 | - | 31.94 | 13 | 0.0025 |
| 2.8 | 1 | −5.4530 | −8.3456 | −2.5605 | −5.4530 | −9.3626 | −1.5435 | 0.00 | - | - | ||||
| 3 | 3 | −1.7388 | −2.5626 | −0.9149 | −1.7849 | 3.5161 | −0.0536 | 0.84 | 1.8009 | 0.0 | ||||
| 4 | 15 | −2.4145 | −2.7809 | −2.0482 | 3.0386 | −3.8429 | −2.2343 | 58.25 | 1.8009 | 76.0 | ||||
| 4.2 | 4 | −1.4345 | −2.0713 | −0.7978 | −2.1531 | −3.6612 | −0.6451 | 19.86 | 1.8009 | 84.9 | ||||
| 5 | 1 | −2.1630 | −3.4689 | −0.8570 | −2.1630 | −5.0996 | 0.7736 | 0.00 | - | - | ||||
| 6 | 13 | −0.8035 | −1.1424 | −0.4645 | −1.3554 | −2.1863 | −0.5246 | 73.20 | 1.8009 | 83.6 | ||||
| 7 | 3 | 0.1396 | −0.4290 | 0.7082 | 0.1408 | −1.4807 | 1.7624 | 0.48 | 1.8009 | 0.0 | ||||
| 8 | 13 | −1.9919 | −2.3823 | −1.6016 | −2.4673 | −3.3262 | −1.6083 | 45.48 | 1.8009 | 73.6 | ||||
| 8.5 | 1 | −2.6715 | −4.3982 | −0.9449 | −2.6715 | −5.8178 | 0.4748 | 0.00 | - | - | ||||
| 9 | 3 | −3.9353 | −4.8325 | −3.0381 | −5.3277 | −7.2274 | −3.4280 | 26.07 | 1.8009 | 92.3 | ||||
| 12 | 4 | −1.1933 | −1.8028 | −0.5839 | −1.8238 | −3.3133 | −0.3343 | 31.08 | 1.8009 | 90.3 | ||||
| 16 | 3 | −1.1877 | −1.7836 | −0.5919 | −1.2240 | −2.8565 | 0.4085 | 1.48 | 1.8009 | 0.0 | ||||
| 21 | 1 | −1.2794 | −2.3845 | −0.1744 | −1.2794 | −4.1324 | 1.5735 | 0.00 | - | - | ||||
| TG (blood) | 2 | 1 | −1.7652 | −3.3540 | −0.1764 | −1.7652 | −4.6864 | 1.1560 | 0.00 | - | - | 96.55 | 13 | <0.0001 |
| 2.8 | 1 | 1.5689 | 0.2025 | 2.9353 | 1.5689 | −1.2375 | 4.3754 | 0.00 | - | - | ||||
| 3 | 2 | −1.1789 | −1.9477 | −0.4101 | −1.1794 | −3.0756 | 0.7168 | 0.01 | 1.5643 | 0.0 | ||||
| 4 | 15 | −0.6150 | −0.9114 | −0.3186 | −1.1423 | −1.8601 | −0.4246 | 115.66 | 1.5643 | 87.9 | ||||
| 4.2 | 4 | −3.0564 | −3.8949 | −2.2179 | −3.6529 | −5.1879 | −2.1179 | 12.50 | 1.5643 | 76.0 | ||||
| 5 | 1 | −0.5418 | −1.5454 | 0.4617 | −0.5418 | −3.1906 | 2.1070 | 0.00 | - | - | ||||
| 6 | 13 | −0.9085 | −1.2282 | −0.5889 | −1.0837 | −1.8397 | −0.3276 | 38.28 | 1.5643 | 68.6 | ||||
| 7 | 3 | 1.1330 | 0.5098 | 1.7563 | 1.1336 | −0.4129 | 2.6800 | 0.02 | 1.5643 | 0.0 | ||||
| 8 | 10 | −0.8028 | −1.1722 | −0.4333 | −1.3193 | −2.1969 | −0.4417 | 68.52 | 1.5643 | 86.9 | ||||
| 8.5 | 1 | −2.5453 | −4.2258 | −0.8647 | −2.5453 | −5.5173 | 0.4268 | 0.00 | - | - | ||||
| 9 | 3 | −9.3202 | −10.9958 | −7.6445 | −9.5824 | −11.8082 | −7.3566 | 4.23 | 1.5643 | 52.7 | ||||
| 12 | 3 | −1.6964 | −2.3414 | −1.0515 | −2.0228 | −3.5934 | −0.4521 | 10.45 | 1.5643 | 80.9 | ||||
| 16 | 4 | 1.3087 | 0.7842 | 1.8333 | 1.3374 | 0.0031 | 2.6716 | 1.33 | 1.5643 | 0.0 | ||||
| 21 | 1 | 1.3630 | 0.2421 | 2.4838 | 1.3630 | −1.3324 | 4.0584 | 0.00 | - | - | ||||
| LDL-C (blood) | 2 | 1 | −1.7162 | −3.2878 | −0.1445 | −1.7162 | −4.3664 | 0.9341 | 0.00 | - | - | 59.48 | 7 | <0.0001 |
| 3 | 2 | −0.2574 | −0.9554 | 0.4407 | −0.2590 | −1.9216 | 1.4036 | 0.18 | 1.1854 | 0.0 | ||||
| 4 | 15 | −2.2993 | −2.6446 | −1.9539 | −2.5700 | −3.2315 | −1.9085 | 33.05 | 1.1854 | 57.6 | ||||
| 4.2 | 4 | −11.5502 | −13.9253 | −9.1751 | −11.6010 | −14.2147 | −8.9872 | 1.53 | 1.1854 | 0.0 | ||||
| 6 | 11 | −1.4658 | −1.8446 | −1.0870 | −1.7983 | −2.5618 | −1.0348 | 32.11 | 1.1854 | 68.9 | ||||
| 8 | 10 | −1.7590 | −2.1810 | −1.3371 | −2.5968 | −3.4802 | −1.7134 | 60.61 | 1.1854 | 85.2 | ||||
| 8.5 | 1 | −5.2140 | −7.9995 | −2.4285 | −5.2140 | −8.7229 | −1.7050 | 0.00 | - | - | ||||
| 12 | 1 | −2.6102 | −3.8684 | −1.3520 | −2.6102 | −5.0875 | −0.1329 | 0.00 | - | - | ||||
| HDL-C (blood) | 2 | 1 | 1.0239 | −0.3431 | 2.3910 | 1.0239 | −2.2340 | 4.2819 | 0.00 | - | - | 69.79 | 10 | <0.0001 |
| 3 | 2 | 0.5630 | −0.6456 | 1.7715 | 0.5824 | −1.8350 | 2.9998 | 0.18 | 2.2766 | 0.0 | ||||
| 4 | 13 | −2.0684 | −2.4694 | −1.6673 | −2.9457 | −3.883.7 | −2.0077 | 106.17 | 2.2766 | 88.7 | ||||
| 4.2 | 4 | 0.0038 | −0.4905 | 0.4981 | 0.0015 | −1.5576 | 1.5606 | 1.69 | 2.2766 | 0.0 | ||||
| 5 | 1 | 0.4126 | −0.5811 | 1.4064 | 0.4126 | −2.7071 | 3.5324 | 0.00 | - | - | ||||
| 6 | 13 | 0.5061 | 0.1888 | 0.8233 | 0.9245 | 0.0276 | 1.8213 | 63.04 | 2.2766 | 81.0 | ||||
| 8 | 8 | 1.3101 | 0.9108 | 1.7093 | 1.5747 | 0.4469 | 2.7025 | 21.96 | 2.2766 | 68.1 | ||||
| 8.5 | 1 | 5.6757 | 2.6829 | 8.6686 | 5.6757 | 1.4683 | 9.8832 | 0.00 | - | - | ||||
| 12 | 3 | 0.2234 | −0.6859 | 1.1328 | 4.0812 | 1.8229 | 6.3396 | 66.29 | 2.2766 | 97.0 | ||||
| 16 | 3 | 0.4824 | −0.1859 | 1.1506 | 0.4850 | −1.3486 | 2.3185 | 0.14 | 2.2766 | 0.0 | ||||
| 21 | 1 | 0.6661 | −0.3493 | 1.6815 | 0.6661 | −2.4607 | 3.7928 | 0.00 | - | - | ||||
| TC (liver) | 2.8 | 1 | −9.3712 | −14.0837 | −4.6586 | −9.3712 | −14.5605 | −4.1818 | 0.00 | - | - | 62.17 | 9 | <0.0001 |
| 3 | 3 | −2.2552 | −3.2123 | −1.2980 | −2.5488 | −4.1731 | −0.9244 | 4.50 | 1.2291 | 55.6 | ||||
| 4 | 4 | −1.1782 | −1.8149 | −0.5415 | −1.6315 | −2.9484 | −0.3146 | 11.98 | 1.2291 | 75.0 | ||||
| 4.2 | 4 | −1.4115 | −2.0064 | −0.8165 | −1.6940 | −2.9526 | −0.4353 | 9.42 | 1.2291 | 68.1 | ||||
| 6 | 1 | −1.6407 | −3.0270 | −0.2543 | −1.6407 | −4.2182 | 0.9368 | 0.00 | - | - | ||||
| 8 | 10 | −2.4940 | −2.9903 | −1.9978 | −2.9111 | −3.7901 | −2.0320 | 32.45 | 1.2291 | 72.3 | ||||
| 9 | 3 | −9.3634 | −11.0438 | −7.6830 | −9.5728 | −11.6968 | −7.4488 | 3.86 | 1.2291 | 48.2 | ||||
| 10 | 2 | −2.7055 | −3.6429 | −1.7681 | −2.7400 | −4.5432 | −0.9368 | 0.52 | 1.2291 | 0.0 | ||||
| 12 | 2 | −6.7401 | −8.5025 | −4.9776 | −6.7503 | −9.0902 | −4.4104 | 0.11 | 1.2291 | 0.0 | ||||
| 21 | 1 | −3.0412 | −4.6012 | −1.4813 | −3.0412 | −5.7161 | −0.3664 | 0.00 | - | - | ||||
| TG (liver) | 2.8 | 1 | −5.1384 | −7.8902 | −2.3866 | −5.1384 | −9.5841 | −0.6927 | 0.00 | - | - | 18.28 | 8 | 0.0192 |
| 4 | 2 | 0.6597 | −0.1879 | 1.5072 | 0.7060 | −1.9059 | 3.3180 | 1.18 | 3.1738 | 15.0 | ||||
| 4.2 | 4 | −2.8029 | −3.5742 | −2.0316 | −3.1371 | −5.0651 | −1.2092 | 6.82 | 3.1738 | 56.0 | ||||
| 6 | 1 | −3.2107 | −5.1438 | −1.2775 | −3.2107 | −7.2018 | 0.7804 | 0.00 | - | - | ||||
| 8 | 7 | −2.5754 | −3.2000 | −1.9508 | −4.0563 | −5.5980 | −2.5146 | 47.21 | 3.1738 | 87.3 | ||||
| 9 | 3 | −3.3928 | −4.2013 | −2.5842 | −4.7613 | −7.0104 | −2.5123 | 24.84 | 3.1738 | 91.9 | ||||
| 10 | 2 | −0.9960 | −1.6800 | −0.3120 | −0.9970 | −3.5590 | 1.5650 | 0.03 | 3.1738 | 0.0 | ||||
| 12 | 2 | −5.0743 | −6.5083 | −3.6403 | −5.6019 | −8.5208 | −2.6830 | 4.14 | 3.1738 | 75.8 | ||||
| 21 | 1 | −1.8937 | −3.1313 | −0.6562 | −1.8937 | −5.5982 | 1.8108 | 0.00 | - | - | ||||
| TC (feces) | 2.8 | 1 | 5.3232 | 2.4889 | 8.1575 | 5.3232 | 1.3385 | 9.3079 | 0.00 | - | - | 10.86 | 8 | 0.2098 |
| 4 | 2 | 0.5976 | −0.2454 | 1.4405 | 0.6403 | −1.5136 | 2.7943 | 1.26 | 2.0420 | 20.6 | ||||
| 4.2 | 4 | 1.6887 | 0.9671 | 2.4103 | 3.0580 | 1.3721 | 4.7439 | 30.95 | 2.0420 | 90.3 | ||||
| 5 | 1 | 1.0557 | −0.0110 | 2.1224 | 1.0557 | −1.9414 | 4.0527 | 0.00 | - | - | ||||
| 6 | 1 | 1.7250 | 0.3145 | 3.1356 | 1.7250 | −1.4109 | 4.8609 | 0.00 | - | - | ||||
| 7 | 3 | 3.0554 | 2.1511 | 3.9596 | 3.0669 | 1.2132 | 4.9206 | 0.18 | 2.0420 | 0.0 | ||||
| 8 | 8 | 1.5481 | 1.0714 | 2.0247 | 2.2101 | 1.0727 | 3.3475 | 33.38 | 2.0420 | 79.0 | ||||
| 12 | 2 | 4.1314 | 2.9406 | 5.3221 | 4.1879 | 1.8709 | 6.5048 | 0.59 | 2.0420 | 0.0 | ||||
| 21 | 1 | 5.0436 | 2.8049 | 7.2823 | 5.0436 | 1.4581 | 8.6292 | 0.00 | - | - | ||||
| TG (feces) | 4 | 2 | 2.0809 | 1.0028 | 3.1590 | 2.0809 | 1.0028 | 3.1590 | 0.17 | 0.0000 | 0.0 | 34.97 | 5 | <0.0001 |
| 5 | 1 | 0.1343 | −0.8472 | 1.1157 | 0.1343 | −0.8472 | 1.1157 | 0.00 | - | - | ||||
| 6 | 1 | 2.3328 | 0.7274 | 3.9382 | 2.3328 | 0.7274 | 3.9382 | 0.00 | - | - | ||||
| 7 | 3 | 1.9419 | 1.2198 | 2.6640 | 1.9419 | 1.2198 | 2.6640 | 0.16 | 0.0000 | 0.0 | ||||
| 12 | 2 | 5.2475 | 3.8224 | 6.6726 | 5.2475 | 3.8224 | 6.6726 | 0.00 | 0.0000 | 0.0 | ||||
| 21 | 1 | 2.7213 | 1.2585 | 4.1841 | 2.7213 | 1.2585 | 4.1841 | 0.00 | - | - | ||||
| Body weight | 4.2 | 4 | −1.7969 | −2.4141 | −1.1796 | −1.8690 | −3.7561 | −0.0360 | 3.13 | 3.1917 | 4.1 | 8.74 | 4 | 0.0679 |
| 6 | 9 | −0.9479 | −1.3802 | −0.5155 | −1.8184 | −3.1069 | −0.5299 | 56.45 | 3.1917 | 85.8 | ||||
| 8 | 3 | −1.4852 | −2.2513 | −0.7191 | −1.8393 | −4.0223 | 0.3436 | 9.29 | 3.1917 | 78.5 | ||||
| 9 | 3 | −3.9353 | −4.8325 | −3.0381 | −5.6255 | −7.9722 | −3.2789 | 26.07 | 3.1917 | 92.3 | ||||
| 12 | 3 | −1.7793 | −2.6526 | −0.9059 | −2.8871 | −5.1625 | −0.6117 | 31.84 | 3.1917 | 93.7 | ||||
| TNF-α | 6 | 1 | −8.0454 | −10.9625 | −5.1282 | −8.0454 | −11.4788 | −4.6119 | 0.00 | - | - | 19.84 | 3 | 0.0002 |
| 8 | 7 | −1.0126 | −1.4568 | −0.5683 | −1.0557 | −1.8732 | −0.2382 | 27.60 | 0.8535 | 78.3 | ||||
| 10 | 2 | −3.4666 | −4.5486 | −2.3845 | −3.4672 | −5.1437 | −1.7908 | 0.01 | 0.8535 | 0.0 | ||||
| 16 | 3 | −1.4696 | −2.0976 | −0.8416 | −1.5301 | −2.7528 | −0.3075 | 2.46 | 0.8535 | 18.6 | ||||
| Glucose (blood) | 6 | 5 | −0.4178 | −0.9320 | 0.0963 | −0.4410 | −1.5333 | 0.6513 | 30.43 | 1.2036 | 86.9 | 8.51 | 5 | 0.1304 |
| 8 | 1 | −4.5622 | −6.1849 | −2.9395 | −4.5622 | −7.2560 | −1.8684 | 0.00 | - | - | ||||
| 10 | 2 | −1.2618 | −1.9991 | −0.5246 | −1.2927 | −2.9841 | 0.3987 | 0.83 | 1.2036 | 0.0 | ||||
| 12 | 1 | −0.1355 | −1.0133 | 0.7423 | −0.1355 | −2.4580 | 2.1870 | 0.00 | - | - | ||||
| 16 | 3 | −0.6143 | −1.1747 | −0.0522 | −0.6727 | −2.0368 | 0.6914 | 3.57 | 1.2036 | 43.9 | ||||
| 21 | 1 | −0.8705 | −1.9103 | 0.1692 | −0.8705 | −3.2590 | 1.5179 | 0.00 | - | - | ||||
1 TC, total cholesterol; TG, triglyceride, LDL-C, low-density lipoprotein; HDL-C, high-density lipoprotein, TNF-α; Tumor necrosis factor alpha; 2 k: number of treatments; 3 SMD: standardized mean difference; 4 CI: confidence interval; 5 Q: chi-squared statistic; 6 τ2: true heterogeneity; 7 I2: Higgin’s I2 statistic; 8 Qb: Q statistics between groups; 9 df: degrees of freedom of Q statistic; 10 –: no data.
Table 5.
Meta-regression analysis of effect of chitosan on lowering cholesterol.
| Item | Item 1 | Estimate | SE | p-Value 2 | ci. lb | ci. ub | |
|---|---|---|---|---|---|---|---|
| TC (blood) | Type | Intercept | −2.1859 | 1.6901 | 0.1959 | −5.4884 | 1.1266 |
| CTS | 0.1219 | 1.7093 | 0.9431 | −3.2282 | 3.4720 | ||
| WSC | −0.5761 | 1.7444 | 0.7412 | −3.9952 | 2.8429 | ||
| RS | −0.1338 | 2.0610 | 0.9482 | −4.1733 | 3.9056 | ||
| CTS + RS | −6.8139 | 2.9481 | 0.0208 * | −12.5920 | −1.0358 | ||
| WSC + RS | 0.7024 | 2.3290 | 0.7630 | −3.8624 | 5.2671 | ||
| CSR | 0.2677 | 2.3758 | 0.9103 | −4.3889 | 4.9242 | ||
| Administ-ration period | Intercept | −2.7155 | 0.4412 | <0.0001 *** | −3.5802 | −1.8509 | |
| Period | 0.0701 | 0.0561 | 1.2503 | −0.0398 | 0.1800 | ||
| TG (blood) | Type | Intercept | 1.1106 | 1.7676 | 0.5298 | −2.3538 | 4.5750 |
| CTS | −2.1980 | 1.7917 | 0.2199 | −5.7097 | 1.3136 | ||
| WSC | −3.0136 | 1.8238 | 0.0985 | −6.5881 | 0.5610 | ||
| RS | −2.3077 | 2.1766 | 0.2890 | −6.5738 | 1.9584 | ||
| CTS + RS | −4.5172 | 2.5911 | 0.0813 | −9.5957 | 0.5613 | ||
| WSC + RS | −2.5444 | 2.5135 | 0.3114 | −7.4708 | 2.3821 | ||
| CTS + VitC | −1.9712 | 2.5027 | 0.4309 | −6.8764 | 2.9340 | ||
| Administ-ration period | Intercept | −2.0619 | 0.4644 | <0.0001 *** | −2.9721 | −1.1516 | |
| Period | 0.1108 | 0.0586 | 0.0586 | −0.0040 | 0.2257 | ||
| LDL-C (blood) | Type | Intercept | −1.7721 | 1.0902 | 0.1041 | −3.9089 | 0.3647 |
| CTS | −1.0320 | 1.1352 | 0.1041 | −3.9089 | 0.3647 | ||
| WSC | −1.1110 | 1.1886 | 0.3499 | −3.4407 | 1.2186 | ||
| RS | 1.5229 | 1.5190 | 0.3161 | −1.4542 | 4.5000 | ||
| Administ-ration period | Intercept | −2.3459 | 0.7447 | 0.0016 ** | −3.8056 | −0.8863 | |
| Period | −0.0554 | 0.1258 | 0.6595 | −0.3021 | 0.1912 | ||
| HDL-C (blood) | Type | Intercept | 0.3816 | 0.3323 | 0.2507 | −0.2696 | 1.0329 |
| WSC | −1.1785 | 0.7190 | 0.1012 | −2.5877 | 0.2307 | ||
| RS | −0.4951 | 1.3894 | 0.7216 | −3.2183 | 2.2282 | ||
| CTS + RS | 1.6183 | 1.9784 | 0.4134 | −2.2594 | 5.4959 | ||
| WSC + RS | −0.1523 | 1.9366 | 0.9373 | −3.9481 | 3.6434 | ||
| Administ-ration period | Intercept | −1.4886 | 0.5323 | 0.0052 ** | −2.5319 | −0.4453 | |
| Period | 0.2432 | 0.0684 | 0.0004 *** | 0.1091 | 0.3773 | ||
| TC(liver) | Type | Intercept | −1.5873 | 1.9416 | 0.4136 | −5.3927 | 2.2181 |
| WSC | 0.0805 | 2.2402 | 0.9713 | −4.3102 | 4.4713 | ||
| CTS | −2.0698 | 1.9835 | 0.2967 | −5.9575 | 1.8179 | ||
| CSR | −3.1597 | 2.9633 | 0.2869 | −8.9676 | 2.6481 | ||
| Administ-ration period | Intercept | −1.9173 | 0.7594 | 0.0116 | −3.4057 | −0.4289 | |
| Period | −0.1982 | 0.0944 | 0.0358 | −0.3872 | −0.0132 | ||
| TG(blood) | Type | Intercept | −3.0600 | 0.4819 | <0.0001 *** | −4.0045 | −2.1154 |
| WSC | −1.1192 | 1.1754 | 0.3410 | −3.4229 | 1.1845 | ||
| Administ-ration period | Intercept | −2.7837 | 1.0596 | 0.0086 ** | −4.8606 | −0.7068 | |
| Period | −0.0620 | 0.1197 | 0.6045 | −0.2967 | 0.1727 | ||
| TC (feces) | Type | Intercept | 2.6479 | 0.3939 | <0.0001 *** | 1.8759 | 3.4200 |
| WSC | −0.2285 | 1.0908 | 0.8341 | −2.3664 | 1.9094 | ||
| Administ-ration period | Intercept | 1.3488 | 0.7729 | 0.0810 | −0.1661 | 2.8637 | |
| Period | 0.1637 | 0.0958 | 0.0808 | −0.0205 | 0.3552 | ||
| TG (feces) | Administ-ration period | Intercept | 1.2205 | 0.8155 | 0.1345 | −0.3778 | 2.8189 |
| Period | 0.1409 | 0.0847 | 0.0961 | −0.2510 | 0.3069 | ||
| TNF-α | Type | Intercept | −2.0430 | 0.3956 | <0.0001 *** | −2.8184 | −1.2676 |
| WSC | 3.0273 | 1.4005 | 0.0307 * | 0.2823 | 5.7723 | ||
| Administ-ration period | Intercept | −2.4611 | 1.3793 | 0.0744 | −5.1646 | 0.2423 | |
| Period | 0.0599 | 0.1285 | 0.6413 | −0.1920 | 0.3117 | ||
| Body weight | Type | Intercept | −3.4586 | 0.5526 | <0.0001 *** | −4.5418 | −2.3755 |
| WSC | 2.8636 | 0.8524 | 0.0008 *** | 1.1930 | 4.5342 | ||
| RS | 1.1231 | 1.3669 | 0.4113 | −1.5559 | 3.8021 | ||
| CTS + RS | −5.5412 | 2.5456 | 0.0295 * | −10.5305 | −0.5519 | ||
| WSC + RS | 1.9751 | 1.7926 | 0.2705 | −1.5383 | 5.4885 | ||
| Administ-ration period | Intercept | −0.5489 | 1.3274 | 0.6793 | −3.1506 | 2.0529 | |
| Period | −0.2678 | 0.1770 | 0.1303 | −0.6148 | 0.0792 | ||
| Glucose (blood) | Type | Intercept | −0.9044 | 0.3993 | 0.0235 * | −1.6869 | −0.1218 |
| RS | −0.7644 | 1.3438 | 0.5694 | −3.3982 | 1.8694 | ||
| CTS + RS | −0.8650 | 1.3491 | 0.5214 | −3.5092 | 1.7793 | ||
| CTS + VitC | 1.6188 | 1.3082 | 0.2159 | −0.9453 | 4.1829 | ||
| Administ-ration period | Intercept | −1.0118 | 0.8754 | 0.2477 | −2.7275 | 0.7039 | |
| Period | 0.0103 | 0.0736 | 0.8887 | −0.1339 | 0.1545 | ||
1 CTS, chitosan; WSC, water-soluble chitosan; RS, resistant starch; CTS + RS, chitosan and resistant starch; WSC + RS, water-soluble chitosan and resistant starch; CTS + VitC, chitosan and vitamin C; CSR, cholestyramine; 2 Means marked with *, **, and *** differ significantly (p < 0.05, 0.01 and 0.001, respectively).
Table 6.
Egger’s linear regression test for publication bias.
| Items | Bias | Se 1. bias | Slope | t | df 2 | p-Value |
|---|---|---|---|---|---|---|
| Total cholesterol (blood) | −6.9521793 | 0.5168551 | 2.8826324 | −13.451 | 64 | <2.2 × 10⁻¹⁶ |
| Triglyceride (blood) | −7.4780606 | 0.9998057 | 3.7716108 | −7.4795 | 67 | 2.087 × 10⁻¹⁰ |
| LDL-cholesterol (blood) | −6.1250126 | 0.4715822 | 2.2442145 | −12.988 | 46 | <2.2 × 10⁻¹⁶ |
| HDL-cholesterol (blood) | 0.51543585 | 1.43323094 | −0.07605097 | 0.35963 | 52 | <0.0001 |
| Total cholesterol (liver) | −6.5468325 | 0.5461543 | 2.4287577 | −11.987 | 30 | 5.732 × 10⁻¹³ |
| Triglyceride (liver) | −6.7370699 | 0.9014982 | 2.5785977 | −7.4732 | 21 | 2.411 × 10−07 |
| Total cholesterol (feces) | 6.5339622 | 0.4235035 | −2.6905774 | 15.428 | 24 | 5.871 × 10⁻¹⁴ |
| Triglyceride (feces) | 8.411555 | 1.070048 | −3.8220945 | 7.8609 | 8 | 4.953 × 10−05 |
| TNF-α (blood) | −8.347186 | 2.266406 | 3.647681 | −3.683 | 11 | 0.003607 |
| Body weight | −7.798456 | 1.192187 | 3.513530 | −6.5413 | 20 | 2.249 × 10−06 |
1 Se: standard error; 2 df: degrees of freedom of Q statistic.
Table 7.
Trimmed effect size of probiotics on inflammatory bowel disease in murine model.
| Items | df | Fixed Effect Model | Random Effect Model | Heterogeneity | ||||
|---|---|---|---|---|---|---|---|---|
| ES | p-Value | ES | p-Value | Q (p-Value) | I2 (%) | τ2 | ||
| Total cholesterol (blood) | 86 | −1.1096 | <0.0001 | −1.2079 | <0.0001 | 686.36 (<0.0001) | 87.5 | 3.6291 |
| Triglyceride (blood) | 78 | −0.2142 | 0.0029 | −0.2935 | 0.2360 | 878.84 (<0.0001) | 91.1 | 4.2254 |
| LDL-cholesterol (blood) | 64 | −1.1291 | <0.0001 | −1.2373 | <0.0001 | 551.97 (<0.0001) | 88.4 | 4.2350 |
| HDL-cholesterol (blood) | 52 | 0.0607 | 0.4912 | −0.1870 | 0.5174 | 521.81 (<0.0001) | 90.0 | 3.7407 |
| Total cholesterol (liver) | 42 | −1.7190 | <0.0001 | −1.8509 | <0.0001 | 367.01 (<0.0001) | 88.6 | 5.8208 |
| Triglyceride (liver) | 31 | −1.4703 | <0.0001 | −1.6805 | 0.0004 | 314.64 (<0.0001) | 90.1 | 6.2275 |
| Total cholesterol (feces) | 31 | 1.2437 | <0.0001 | 1.3796 | 0.0004 | 226.78 (<0.0001) | 86.3 | 3.9640 |
| Triglyceride (feces) | 13 | 1.4815 | <0.0001 | 1.5692 | 0.0011 | 71.66 (<0.0001) | 81.9 | 2.5666 |
| TNF-α (blood) | 14 | −1.2869 | <0.0001 | −1.3743 | 0.0026 | 96.71 (<0.0001) | 85.5 | 2.5645 |
| Body weight | 27 | −1.1740 | <0.0001 | −1.2547 | 0.0079 | 284.88 (<0.0001) | 90.5 | 5.3068 |
| Glucose (blood) | 12 | −0.7512 | <0.0001 | −0.8958 | 0.0096 | 61.64 (<0.0001) | 80.5 | 1.2356 |
Publisher’s Note: MDPI stays neutral with regard to jurisdictional claims in published maps and institutional affiliations. |
© 2021 by the authors. Licensee MDPI, Basel, Switzerland. This article is an open access article distributed under the terms and conditions of the Creative Commons Attribution (CC BY) license (http://creativecommons.org/licenses/by/4.0/).
Share and Cite
MDPI and ACS Style
Ahn, S.-I.; Cho, S.; Choi, N.-J. Effectiveness of Chitosan as a Dietary Supplement in Lowering Cholesterol in Murine Models: A Meta-Analysis. Mar. Drugs 2021, 19, 26. https://0-doi-org.brum.beds.ac.uk/10.3390/md19010026
AMA Style
Ahn S-I, Cho S, Choi N-J. Effectiveness of Chitosan as a Dietary Supplement in Lowering Cholesterol in Murine Models: A Meta-Analysis. Marine Drugs. 2021; 19(1):26. https://0-doi-org.brum.beds.ac.uk/10.3390/md19010026
Chicago/Turabian StyleAhn, Sung-Il, Sangbuem Cho, and Nag-Jin Choi. 2021. "Effectiveness of Chitosan as a Dietary Supplement in Lowering Cholesterol in Murine Models: A Meta-Analysis" Marine Drugs 19, no. 1: 26. https://0-doi-org.brum.beds.ac.uk/10.3390/md19010026
Note that from the first issue of 2016, this journal uses article numbers instead of page numbers. See further details here.