Association of Kidney Function Tests with a Cardio-Ankle Vascular Index in Community-Dwelling Individuals with a Normal or Mildly Decreased Estimated Glomerular Filtration Rate


 ,
, 
Abstract
:1. Introduction
2. Materials and Methods
3. Results
4. Discussion
5. Conclusions
Supplementary Materials
Author Contributions
Funding
Conflicts of Interest
References
- Tanaka, M.; Abe, Y.; Furukado, S.; Miwa, K.; Sakaguchi, M.; Sakoda, S.; Kitagawa, K. Chronic Kidney Disease and Carotid Atherosclerosis. J. Stroke Cerebrovasc. Dis. 2012, 21, 47–51. [Google Scholar] [CrossRef] [PubMed]
- Palanca, A.; Castelblanco, E.; Perpiñán, H.; Betriu, À.; Soldevila, B.; Valdivielso, J.M.; Bermúdez, M.; Duran, X.; Fernández, E.; Puig-Domingo, M.; et al. Prevalence and progression of subclinical atherosclerosis in patients with chronic kidney disease and diabetes. Atherosclerosis 2018, 276, 50–57. [Google Scholar] [CrossRef] [PubMed] [Green Version]
- Wu, Y.; Hou, J.; Li, J.; Luo, Y.; Wu, S. Correlation between Carotid Intima–Media Thickness and Early-Stage Chronic Kidney Disease: Results from Asymptomatic Polyvascular Abnormalities in Community Study. J. Stroke Cerebrovasc. Dis. 2016, 25, 259–265. [Google Scholar] [CrossRef] [PubMed]
- Choi, I.J.; Lim, S.; Choo, E.-H.; Kim, J.-J.; Hwang, B.-H.; Kim, T.-H.; Seo, S.M.; Koh, Y.-S.; Shin, D.I.; Park, H.-J.; et al. Differential Impact of Chronic Kidney Disease on Coronary Calcification and Atherosclerosis in Asymptomatic Individuals with or without Diabetes: Analysis from a Coronary Computed Tomographic Angiography Registry. Cardiorenal Med. 2018, 8, 228–236. [Google Scholar] [CrossRef] [PubMed]
- Wohlfahrt, P.; Cífková, R.; Movsisyan, N.; Kunzová, Š.; Lešovský, J.; Homolka, M.; Soška, V.; Dobšák, P.; Lopez-Jimenez, F.; Sochor, O. Reference values of cardio-ankle vascular index in a random sample of a white population. J. Hypertens. 2017, 35, 2238–2244. [Google Scholar] [CrossRef]
- Shirai, K.; Utino, J.; Otsuka, K.; Takata, M. A novel blood pressure-independent arterial wall stiffness parameter; cardio-ankle vascular index (CAVI). J. Atheroscler. Thromb. 2006, 13, 101–107. [Google Scholar] [CrossRef]
- Park, S.Y.; Chin, S.O.; Rhee, S.Y.; Oh, S.; Woo, J.-T.; Kim, S.W.; Chon, S. Cardio-Ankle Vascular Index as a Surrogate Marker of Early Atherosclerotic Cardiovascular Disease in Koreans with Type 2 Diabetes Mellitus. Diabetes Metab. J. 2018, 42, 285–295. [Google Scholar] [CrossRef]
- Romero-Aroca, P.; Baget-Bernaldiz, M.; Navarro-Gil, R.; Moreno-Ribas, A.; Valls-Mateu, A.; Sagarra-Alamo, R.; La Puente, J.F.B.-D.; Mundet-Tuduri, X. Glomerular Filtration Rate and/or Ratio of Urine Albumin to Creatinine as Markers for Diabetic Retinopathy: A Ten-Year Follow-Up Study. J. Diabetes Res. 2018, 2018, 1–9. [Google Scholar] [CrossRef]
- Foster, M.C.; Ghuman, N.; Hwang, S.J.; Murabito, J.M.; Fox, C.S. Low ankle-brachial index and the development of rapid estimated GFR decline and CKD. Am. J. Kidney Dis. 2013, 61, 204–210. [Google Scholar] [CrossRef]
- Alizargar, J.; Bai, C.-H. Factors associated with carotid Intima media thickness and carotid plaque score in community-dwelling and non-diabetic individuals. BMC Cardiovasc. Disord. 2018, 18, 21. [Google Scholar] [CrossRef]
- Namekata, T.; Suzuki, K.; Ishizuka, N.; Shirai, K. Establishing baseline criteria of cardio-ankle vascular index as a new indicator of arteriosclerosis: A cross-sectional study. BMC Cardiovasc. Disord. 2011, 11, 51. [Google Scholar] [CrossRef]
- Levey, A.S.; Stevens, L.A.; Schmid, C.H.; Zhang, Y.L.; Castro, A.F.; Feldman, H.I.; Kusek, J.W.; Eggers, P.; Van Lente, F.; Greene, T.; et al. A new equation to estimate glomerular filtration rate. Ann. Intern. Med. 2009, 150, 604–612. [Google Scholar] [CrossRef]
- Parv, F.; Beceanu, A.; Avram, R.; Timar, R.Z.; Timar, B.; Gadalean, F. Association of Mild-to-Moderate Reduction in Glomerular Filtration Rate with Subclinical Atherosclerosis in Postmenopausal Women. J. Women’s Health 2017, 26, 1201–1213. [Google Scholar] [CrossRef] [PubMed]
- Maebuchi, D.; Sakamoto, M.; Fuse, J.; Tanaka, H.; Shiraishi, Y.; Takei, M.; Inui, Y.; Sutoh, Y.; Ikegami, Y.; Momiyama, Y. The cardio-ankle vascular index predicts chronic kidney disease in Japanese subjects. Artery Res. 2013, 7, 48–53. [Google Scholar] [CrossRef]
- Chen, J.-H.; Chen, S.-C.; Liu, W.-C.; Su, H.-M.; Chen, C.-Y.; Mai, H.-C.; Chou, M.-C.; Chang, J.-M. Determinants of Peripheral Arterial Stiffness in Patients with Chronic Kidney Disease in Southern Taiwan. Kaohsiung J. Med. Sci. 2009, 25, 366–373. [Google Scholar] [CrossRef]
- Levin, A.; Djurdjev, O.; Barrett, B.; Burgess, E.; Carlisle, E.; Ethier, J.; Jindal, K.; Mendelssohn, D.; Tobe, S.; Singer, J.; et al. Cardiovascular disease in patients with chronic kidney disease: Getting to the heart of the matter. Am. J. Kidney Dis. 2001, 38, 1398–1407. [Google Scholar] [CrossRef] [PubMed] [Green Version]
- Shinohara, K.; Shoji, T.; Tsujimoto, Y.; Kimoto, E.; Tahara, H.; Koyama, H.; Emoto, M.; Ishimura, E.; Miki, T.; Tabata, T.; et al. Arterial stiffness in predialysis patients with uremia. Kidney Int. 2004, 65, 936–943. [Google Scholar] [CrossRef] [Green Version]
- Martin, W.F.; Armstrong, L.E.; Rodriguez, N.R. Dietary protein intake and renal function. Nutr. Metab. 2005, 2, 25. [Google Scholar] [CrossRef]
- Muller, C.R.; Leite, A.P.O.; Yokota, R.; Pereira, R.O.; Americo, A.L.V.; Nascimento, N.R.F.; Evangelista, F.S.; Farah, V.; Fonteles, M.C.; Fiorino, P. Post-weaning Exposure to High-Fat Diet Induces Kidney Lipid Accumulation and Function Impairment in Adult Rats. Front. Nutr. 2019, 6, 60. [Google Scholar] [CrossRef]
- Wang, Y.; Qiu, X.; Lv, L.; Ye, Z.; Li, S.; Liu, Q.; Lou, T. Correlation between Serum Lipid Levels and Measured Glomerular Filtration Rate in Chinese Patients with Chronic Kidney Disease. PLoS ONE 2016, 11, 0163767. [Google Scholar] [CrossRef]
- Ford, I.; Bezlyak, V.; Stott, D.J.; Sattar, N.; Packard, C.J.; Perry, I.; Buckley, B.M.; Jukema, J.W.; De Craen, A.J.M.; Westendorp, R.G.J.; et al. Reduced Glomerular Filtration Rate and Its Association with Clinical Outcome in Older Patients at Risk of Vascular Events: Secondary Analysis. PLoS Med. 2009, 6, e1000016. [Google Scholar] [CrossRef] [PubMed]
- Available online: http://www.openepi.com/Power/PowerMean.htm (accessed on 2 November 2018).


| Parameter | Mean ± SD Number (%) | GFR (mL/min/1.73 m2) | ||
|---|---|---|---|---|
| 60-89 | ≥90 | p value | ||
| Overall | 164 (100) | 56 (34.15) | 108 (65.85) | - |
| Age (years) | 62.64 ± 9.47 | 69.64 ± 7.40 | 59.01 ± 8.34 | <0.001 |
| Sex (male) | 62 (37.80) | 26 (46.43) | 36 (33.33) | 0.126 |
| BMI (kg/m2) | 24.80 ± 3.61 | 24.87 ± 3.30 | 24.76 ± 3.78 | 0.853 |
| WC (cm) | 80.50 ± 9.89 | 81.61 ± 10.07 | 79.92 ± 9.79 | 0.301 |
| HC (cm) | 94.04 ± 6.87 | 93.58 ± 6.39 | 94.28 ± 7.13 | 0.537 |
| ABI | 2.22 ± 0.12 | 2.19 ± 0.11 | 2.23 ± 0.12 | 0.128 |
| SBP (mmHg) | 130.04 ± 17.44 | 134.17 ± 16.30 | 127.89 ± 17.69 | 0.028 |
| DBP (mmHg) | 80.66 ± 10.36 | 81.57 ± 10.40 | 80.19 ± 10.36 | 0.421 |
| T2DM | 23 (14.02) | 10 (17.86) | 13 (12.04) | 0.346 |
| HTN | 55 (33.54) | 26 (46.43) | 29 (26.85) | 0.014 |
| IHD | 12 (7.32) | 7 (12.5) | 5 (4.63) | 0.109 |
| FH | 37 (22.84) | 17 (30.36) | 20 (18.87) | 0.116 |
| SMK | 31 (18.90) | 11 (19.64) | 20 (18.52) | 0.837 |
| Pack-years | 0.57 ± 3.70 | 0.45 ± 3.40 | 0.63 ± 3.86 | 0.770 |
| Alc | 57 (34.76) | 18 (32.14) | 39 (36.11) | 0.729 |
| Alc. vol. (mL) | 106.52 ± 252.84 | 90.53 ± 266.80 | 114.81 ± 246.16 | 0.561 |
| Exercise | 131 (79.88) | 45 (80.36) | 86 (79.63) | 1.00 |
| Exe. freq. per week | 3.24 ± 3.23 | 3.69 ± 3.20 | 3 ± 3.24 | 0.198 |
| CAVI | 8.62 ± 1.08 | 9.04 ± 0.83 | 8.40 ± 1.14 | <0.001 |
| Test | Mean ± SD Number (%) | CAVI | Pearson Correlation with the CAVI | |||
|---|---|---|---|---|---|---|
| Low | High | p value | r | p value | ||
| BUN (mg/dL) | 14.58 ± 3.45 | 14.38 ± 3.41 | 15.19 ± 3.55 | 0.193 | 0.207 | 0.007 |
| Cr (mg/dL) | 0.741 ± 0.155 | 0.74 ± 0.15 | 0.73 ± 0.14 | 0.643 | −0.003 | 0.961 |
| AST (units/L) | 19.01 ± 4.57 | 19.02 ± 5 | 19 ± 2.98 | 0.976 | 0.132 | 0.090 |
| ALT (units/L) | 18.10 ± 7.78 | 18.21 ± 8.35 | 17.75 ± 5.80 | 0.742 | 0.034 | 0.660 |
| FBS (mg/dL) | 93.43 ± 22.12 | 91.71 ± 21.05 | 98.58 ± 24.63 | 0.085 | 0.124 | 0.111 |
| UA (mg/dL) | 5.33 ± 1.21 | 5.25 ± 1.25 | 5.59 ± 1.09 | 0.123 | 0.077 | 0.321 |
| TGL (mg/dL) | 117.38 ± 52.59 | 115.74 ± 55.07 | 122.29 ± 44.58 | 0.491 | 0.059 | 0.452 |
| CHOL (mg/dL) | 190.64 ± 30.78 | 191.20 ± 31.11 | 188.97 ± 30.06 | 0.689 | 0.013 | 0.861 |
| LDL (mg/dL) | 115.99 ± 28.04 | 115.33 ± 28.61 | 117.97 ± 26.50 | 0.602 | 0.028 | 0.715 |
| HDL (mg/dL) | 53.74 ± 12.34 | 54.05 ± 12.71 | 52.80 ± 11.24 | 0.575 | 0.014 | 0.855 |
| hs-CRP (mg/L) | 0.183 ± 0.34 | 0.160 ± 0.193 | 0.25 ± 0.60 | 0.148 | 0.122 | 0.119 |
| HBA1c (%) | 5.93 ± 0.80 | 5.85 ± 0.71 | 6.18 ± 0.98 | 0.024 | 0.234 | 0.002 |
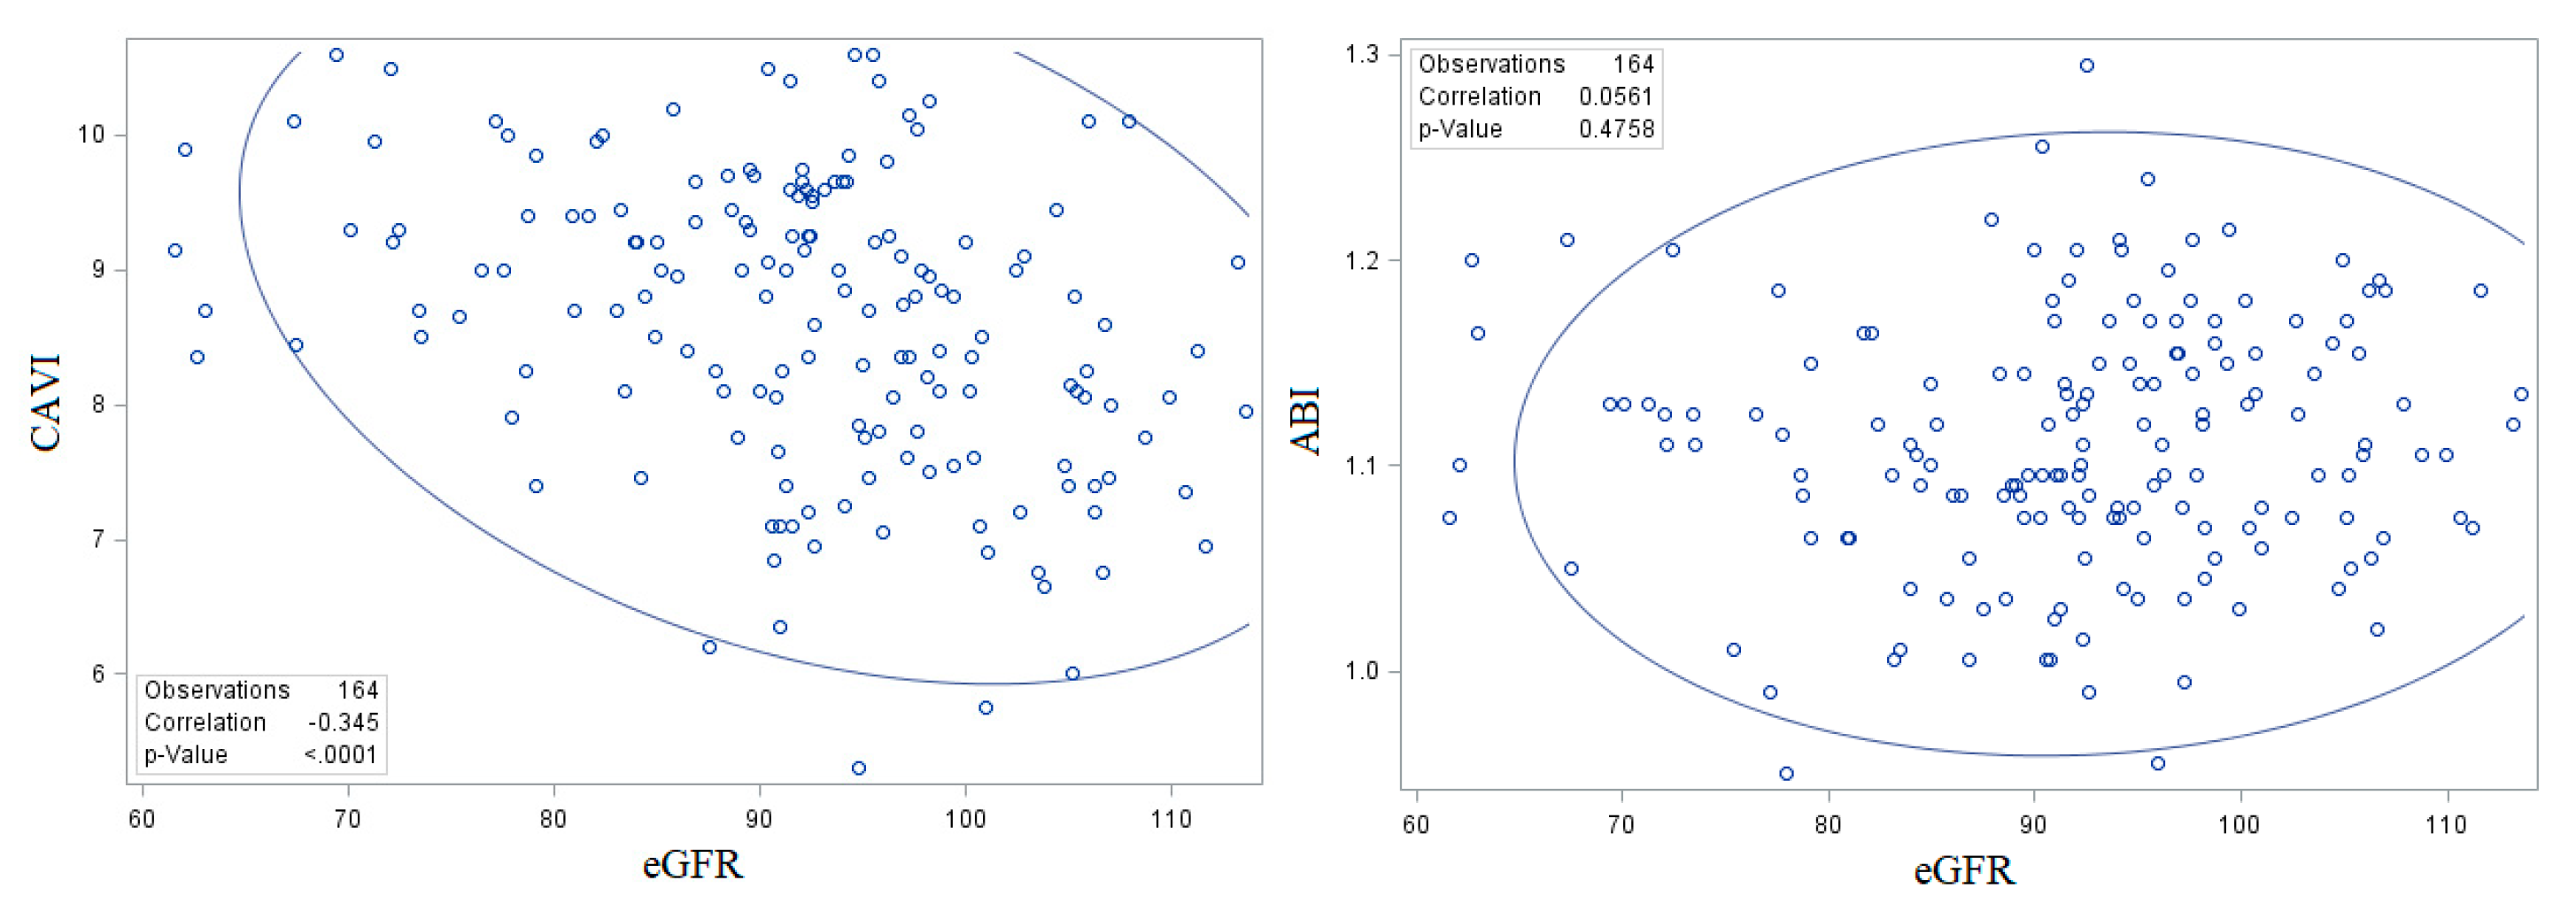
| eGFR (mL/min/1.73 m2) | 91.96 ± 10.94 | 93 ± 11.02 | 88.82 ± 10.20 | 0.033 | –0.344 | <0.001 |
| UACR (mg/g) | 12.58 ± 25.21 | 13.38 ± 28.09 | 10.2113.49 | 0.510 | 0.066 | 0.420 |
| Variable | Unstandardized Beta Coefficients | Standardized Beta Coefficients | p Value |
|---|---|---|---|
| BMI | −0.006 | −0.176 | 0.025 |
| eGFR | −0.002 | −0.185 | 0.029 |
| HTN | 0.068 | 0.247 | 0.003 |
| SBP | 0.001 | 0.179 | 0.021 |
© 2019 by the authors. Licensee MDPI, Basel, Switzerland. This article is an open access article distributed under the terms and conditions of the Creative Commons Attribution (CC BY) license (http://creativecommons.org/licenses/by/4.0/).
Share and Cite
Alizargar, J.; Bai, C.-H.; Hsieh, N.-C.; Wu, S.-F.V.; Weng, S.-Y.; Wu, J.-P. Association of Kidney Function Tests with a Cardio-Ankle Vascular Index in Community-Dwelling Individuals with a Normal or Mildly Decreased Estimated Glomerular Filtration Rate. Medicina 2019, 55, 657. https://0-doi-org.brum.beds.ac.uk/10.3390/medicina55100657
Alizargar J, Bai C-H, Hsieh N-C, Wu S-FV, Weng S-Y, Wu J-P. Association of Kidney Function Tests with a Cardio-Ankle Vascular Index in Community-Dwelling Individuals with a Normal or Mildly Decreased Estimated Glomerular Filtration Rate. Medicina. 2019; 55(10):657. https://0-doi-org.brum.beds.ac.uk/10.3390/medicina55100657
Chicago/Turabian StyleAlizargar, Javad, Chyi-Huey Bai, Nan-Chen Hsieh, Shu-Fang Vivienne Wu, Shih-Yen Weng, and Jia-Ping Wu. 2019. "Association of Kidney Function Tests with a Cardio-Ankle Vascular Index in Community-Dwelling Individuals with a Normal or Mildly Decreased Estimated Glomerular Filtration Rate" Medicina 55, no. 10: 657. https://0-doi-org.brum.beds.ac.uk/10.3390/medicina55100657