


Deep-Learning Model of ResNet Combined with CBAM for Malignant–Benign Pulmonary Nodules Classification on Computed Tomography Images
 , ,
, ,
Abstract
:1. Introduction
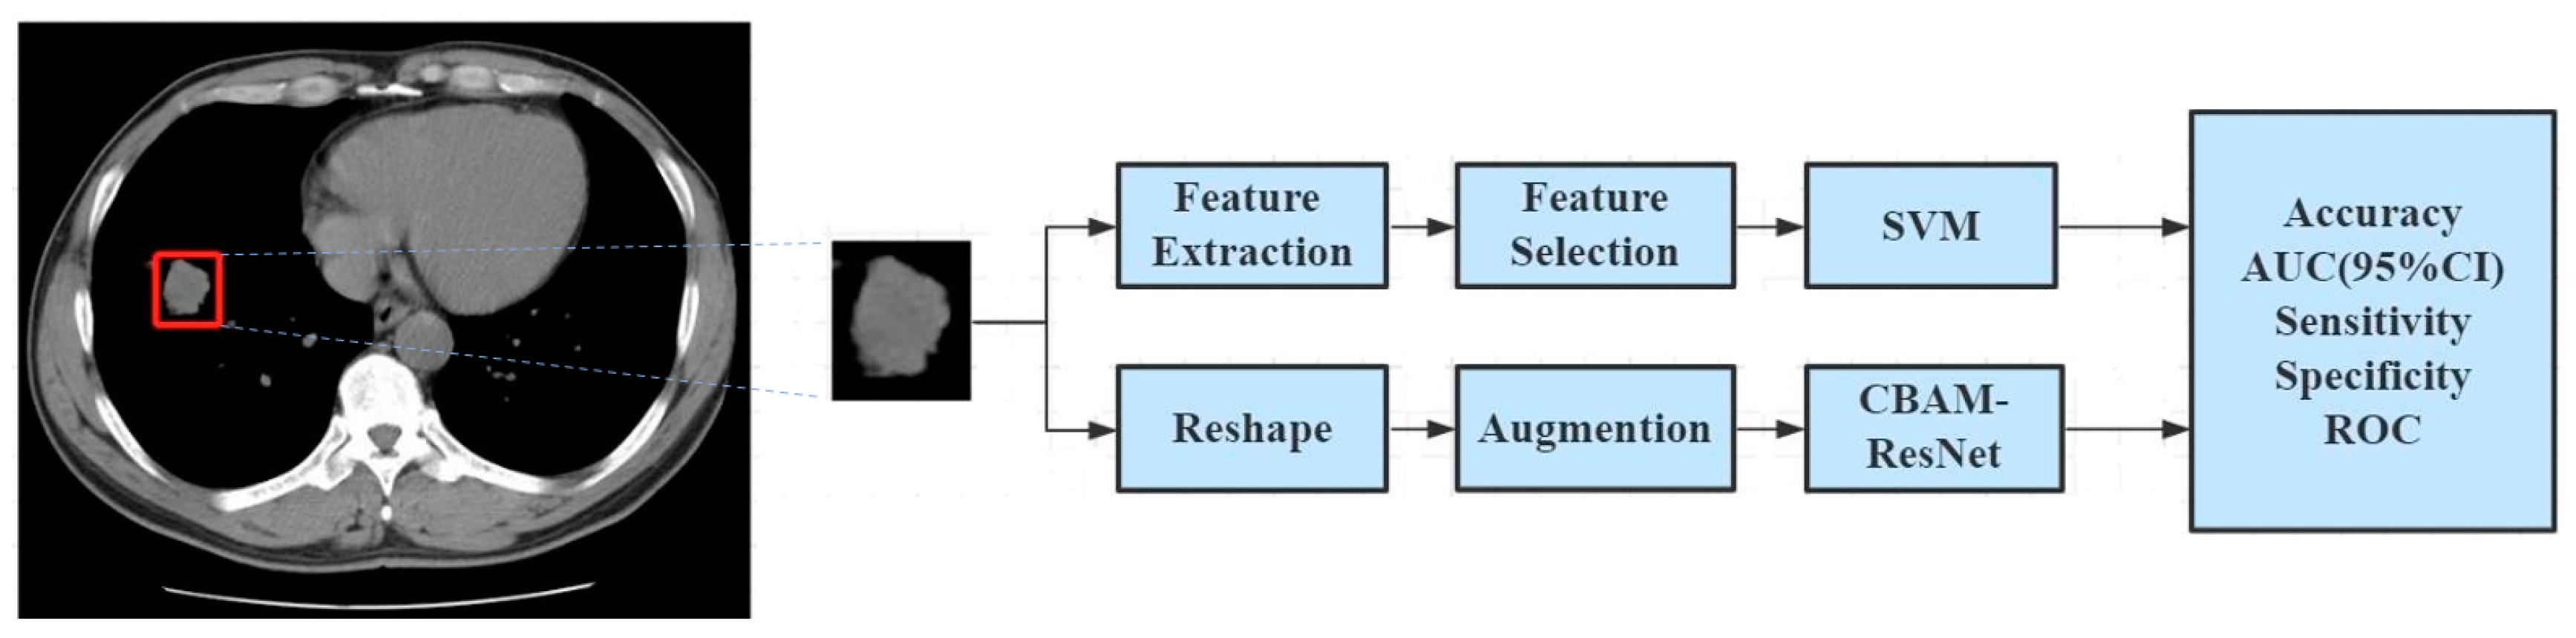
2. Methods
2.1. Data Source
2.2. Image Preprocessing
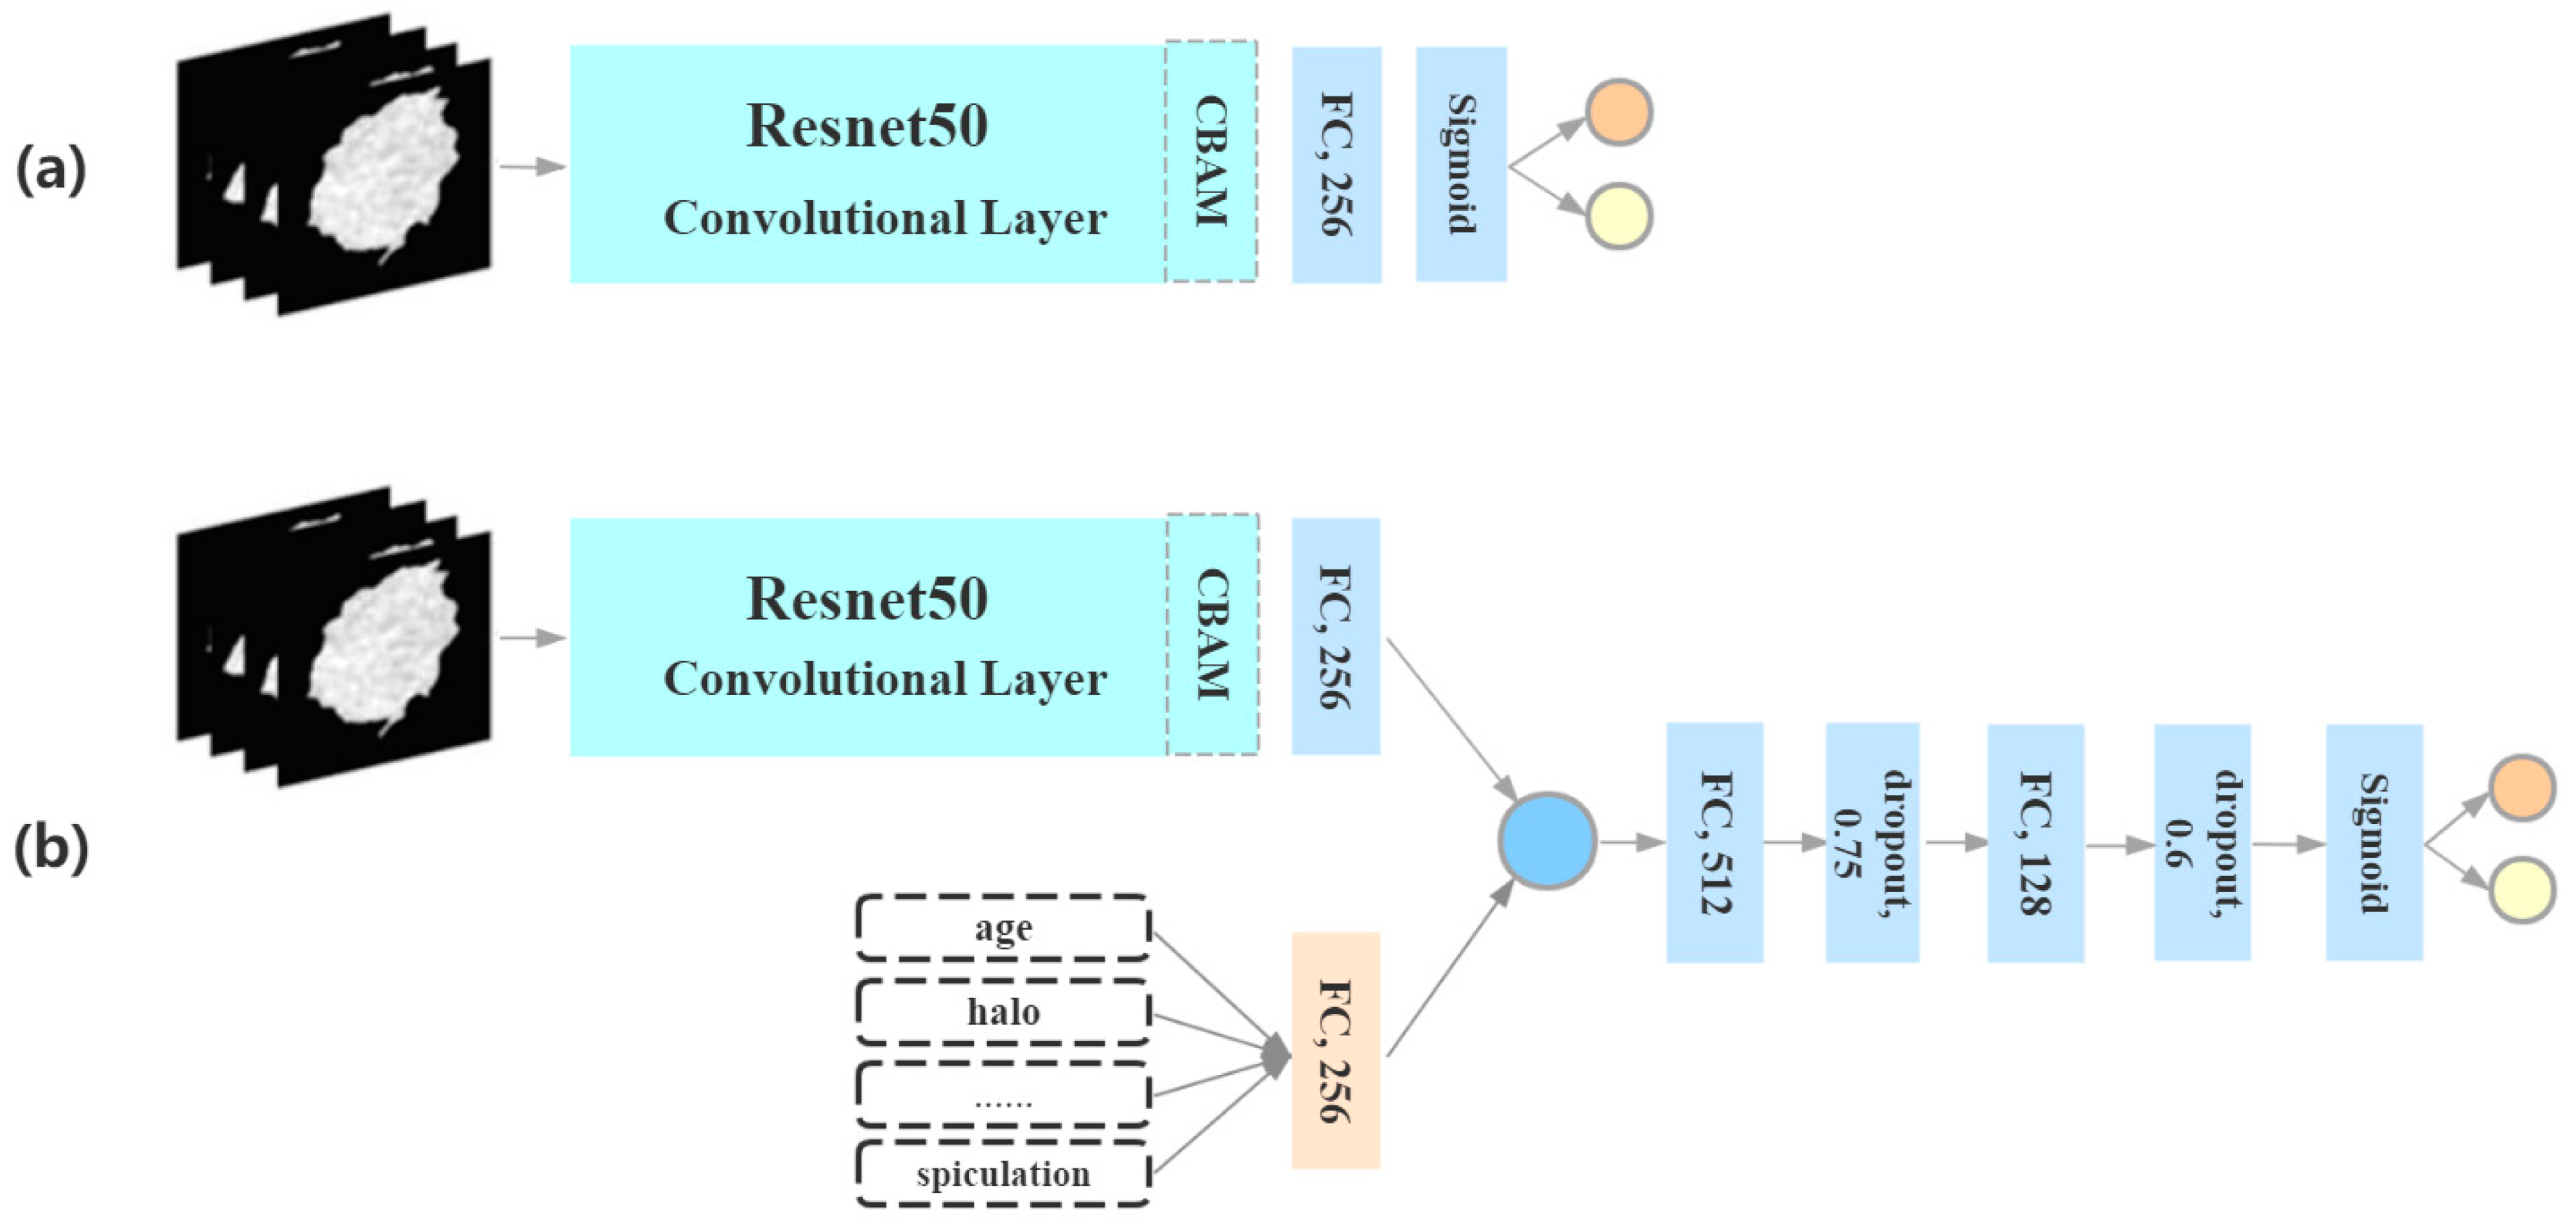
2.3. Deep-Learning Algorithm
2.4. Radiomic Analysis
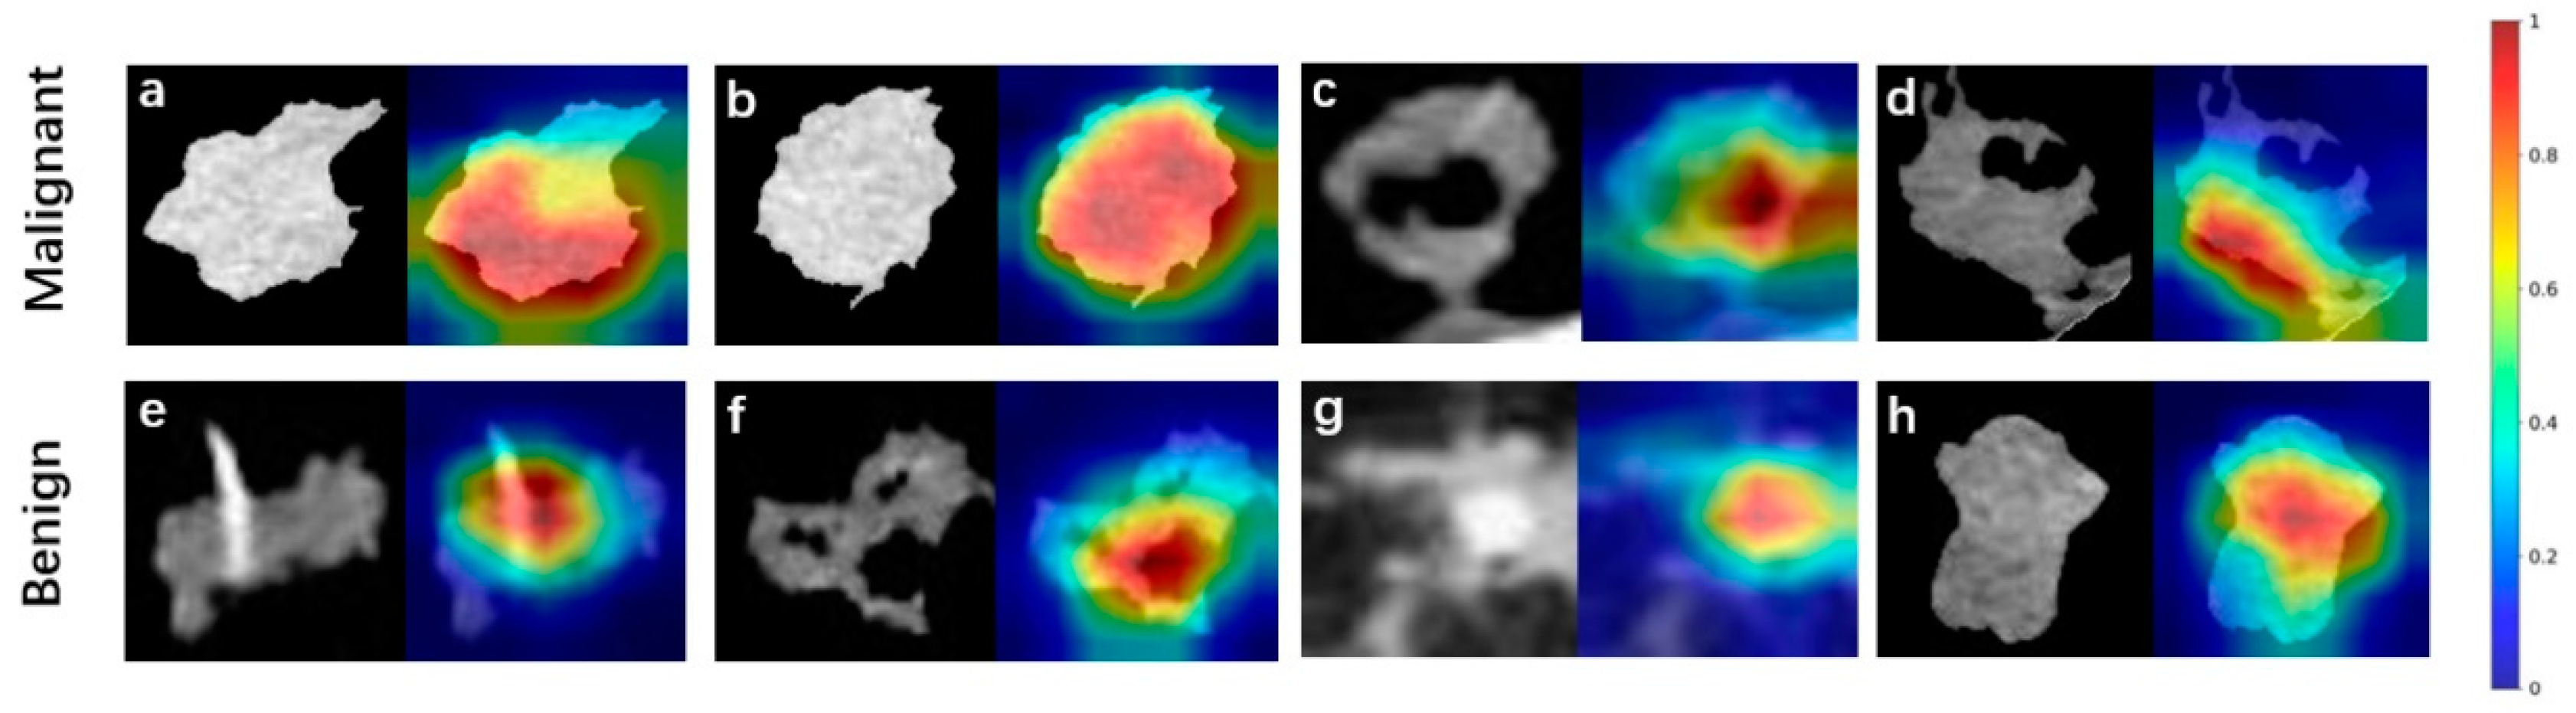
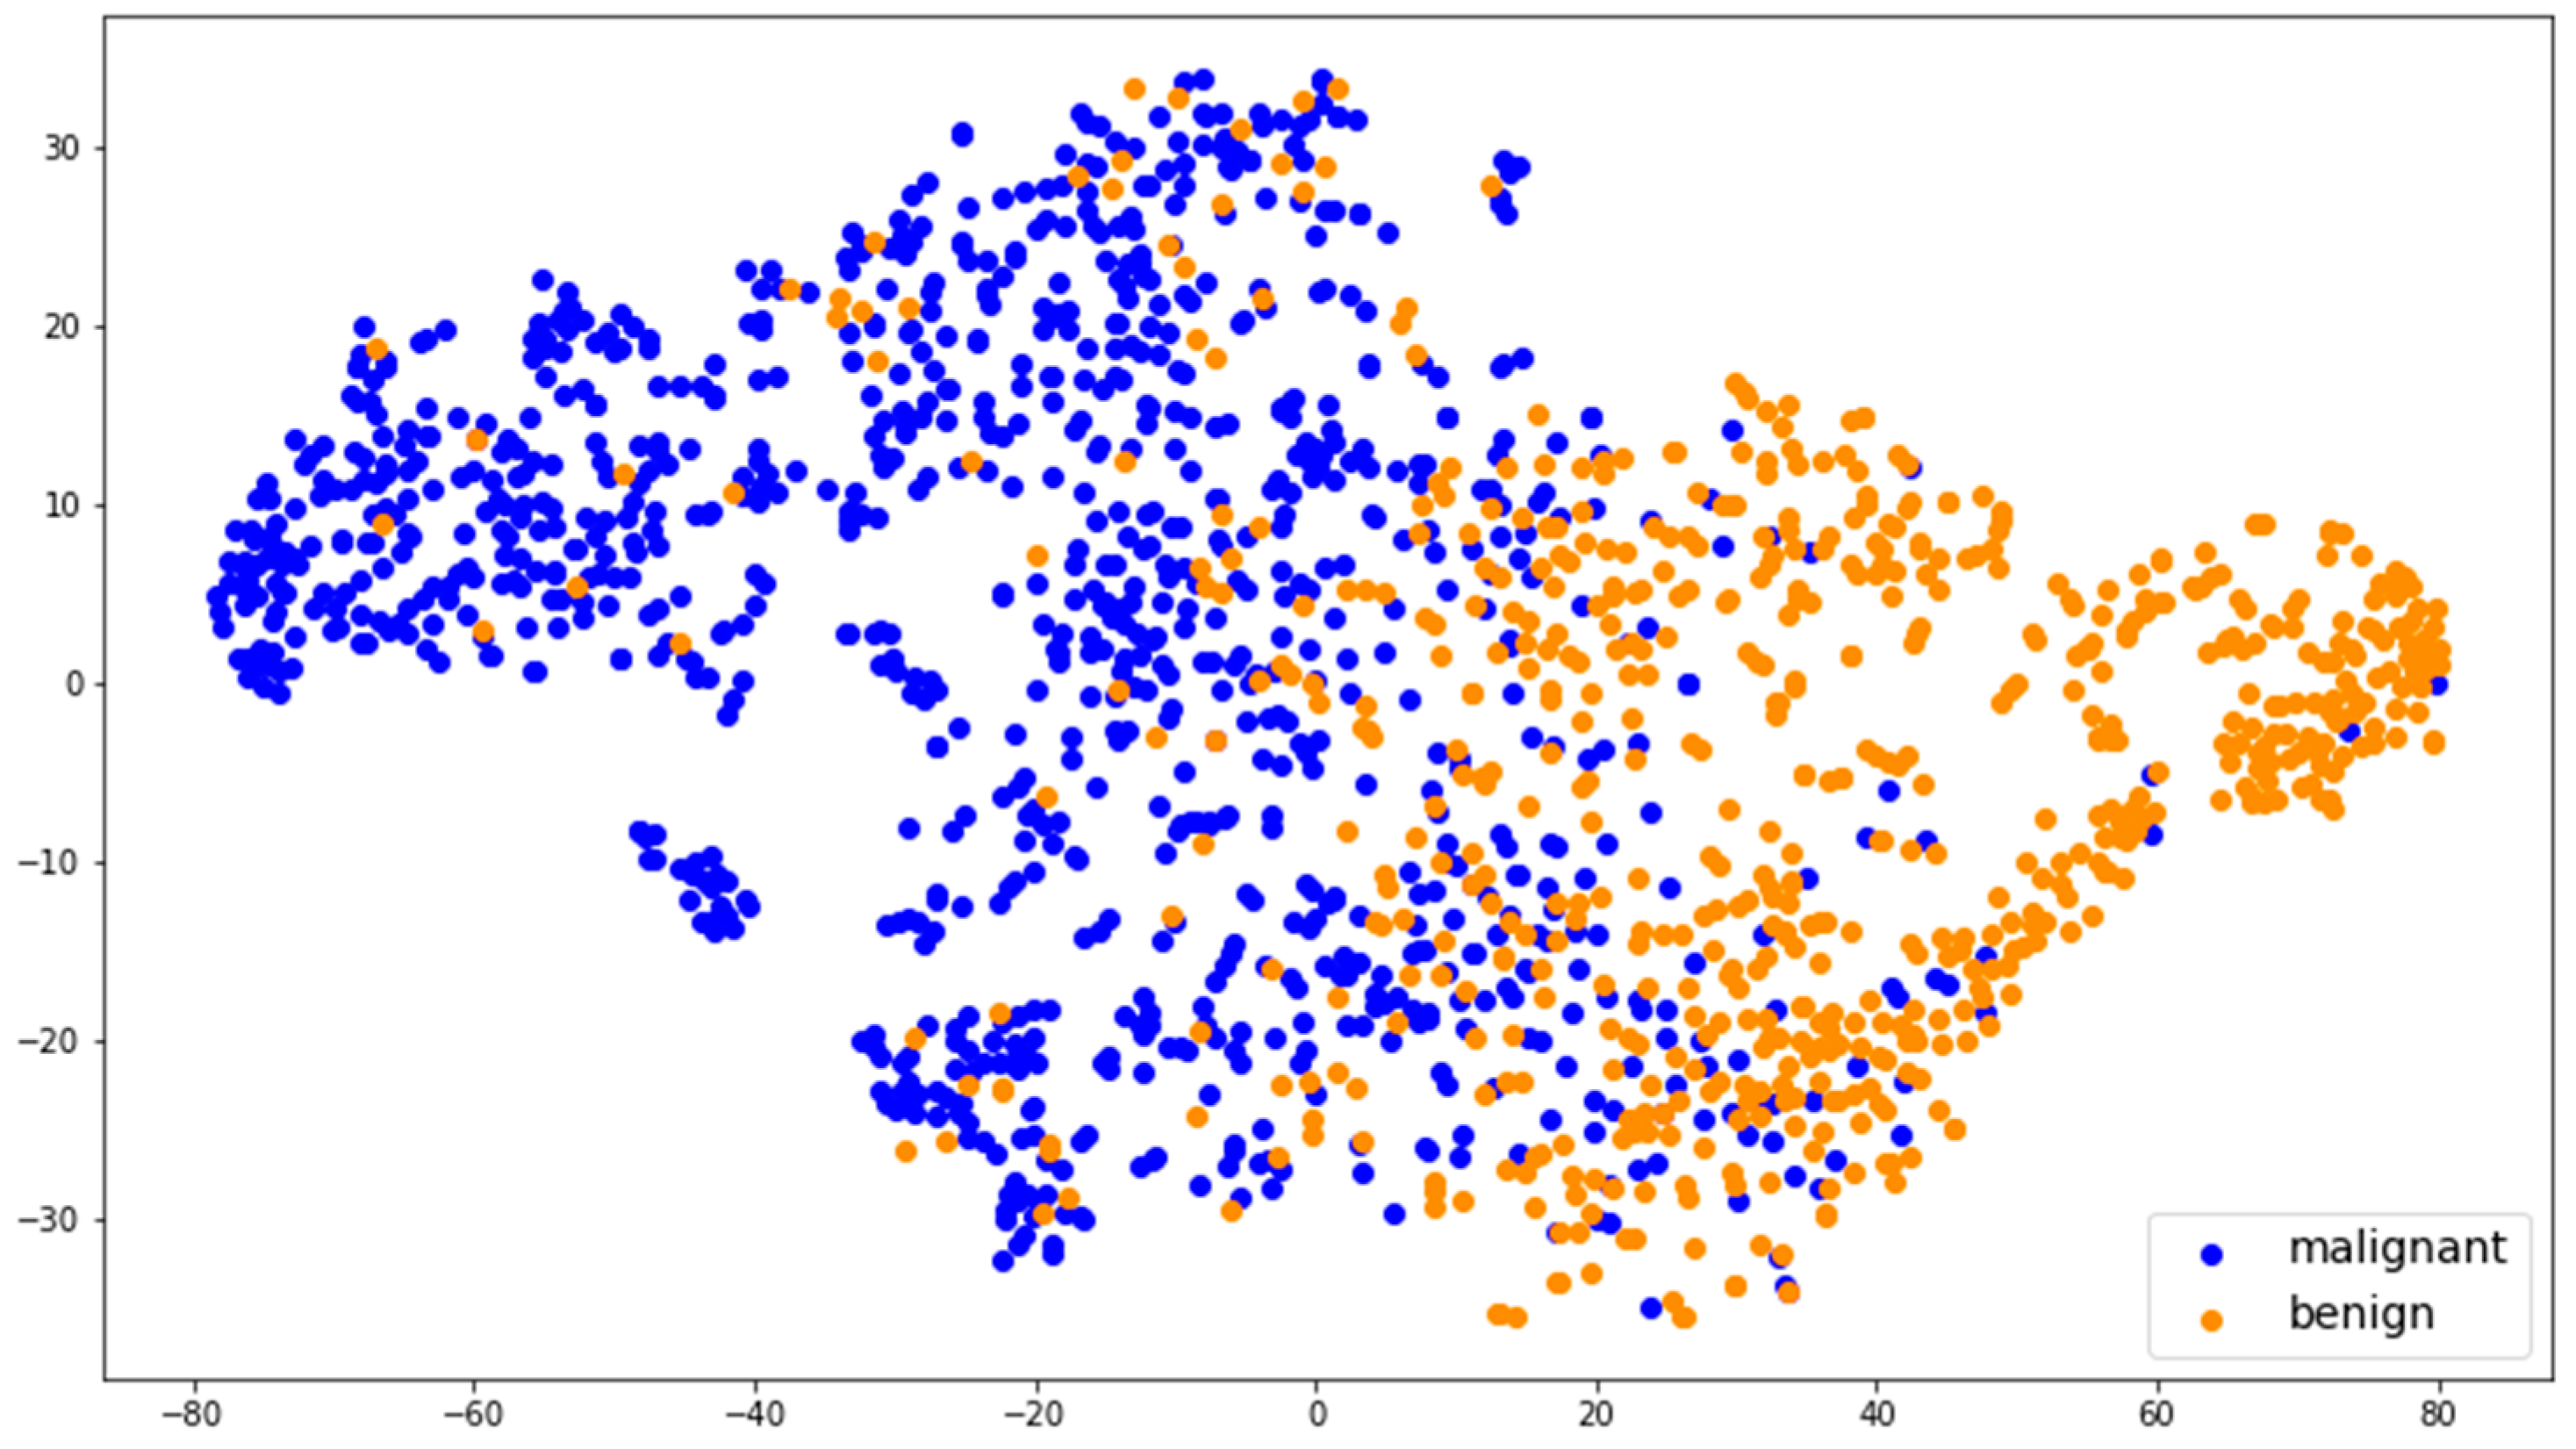
2.5. Deep-Feature Visualization
2.6. Statistical Analysis
3. Results
3.1. Clinical and Morphological Characteristics
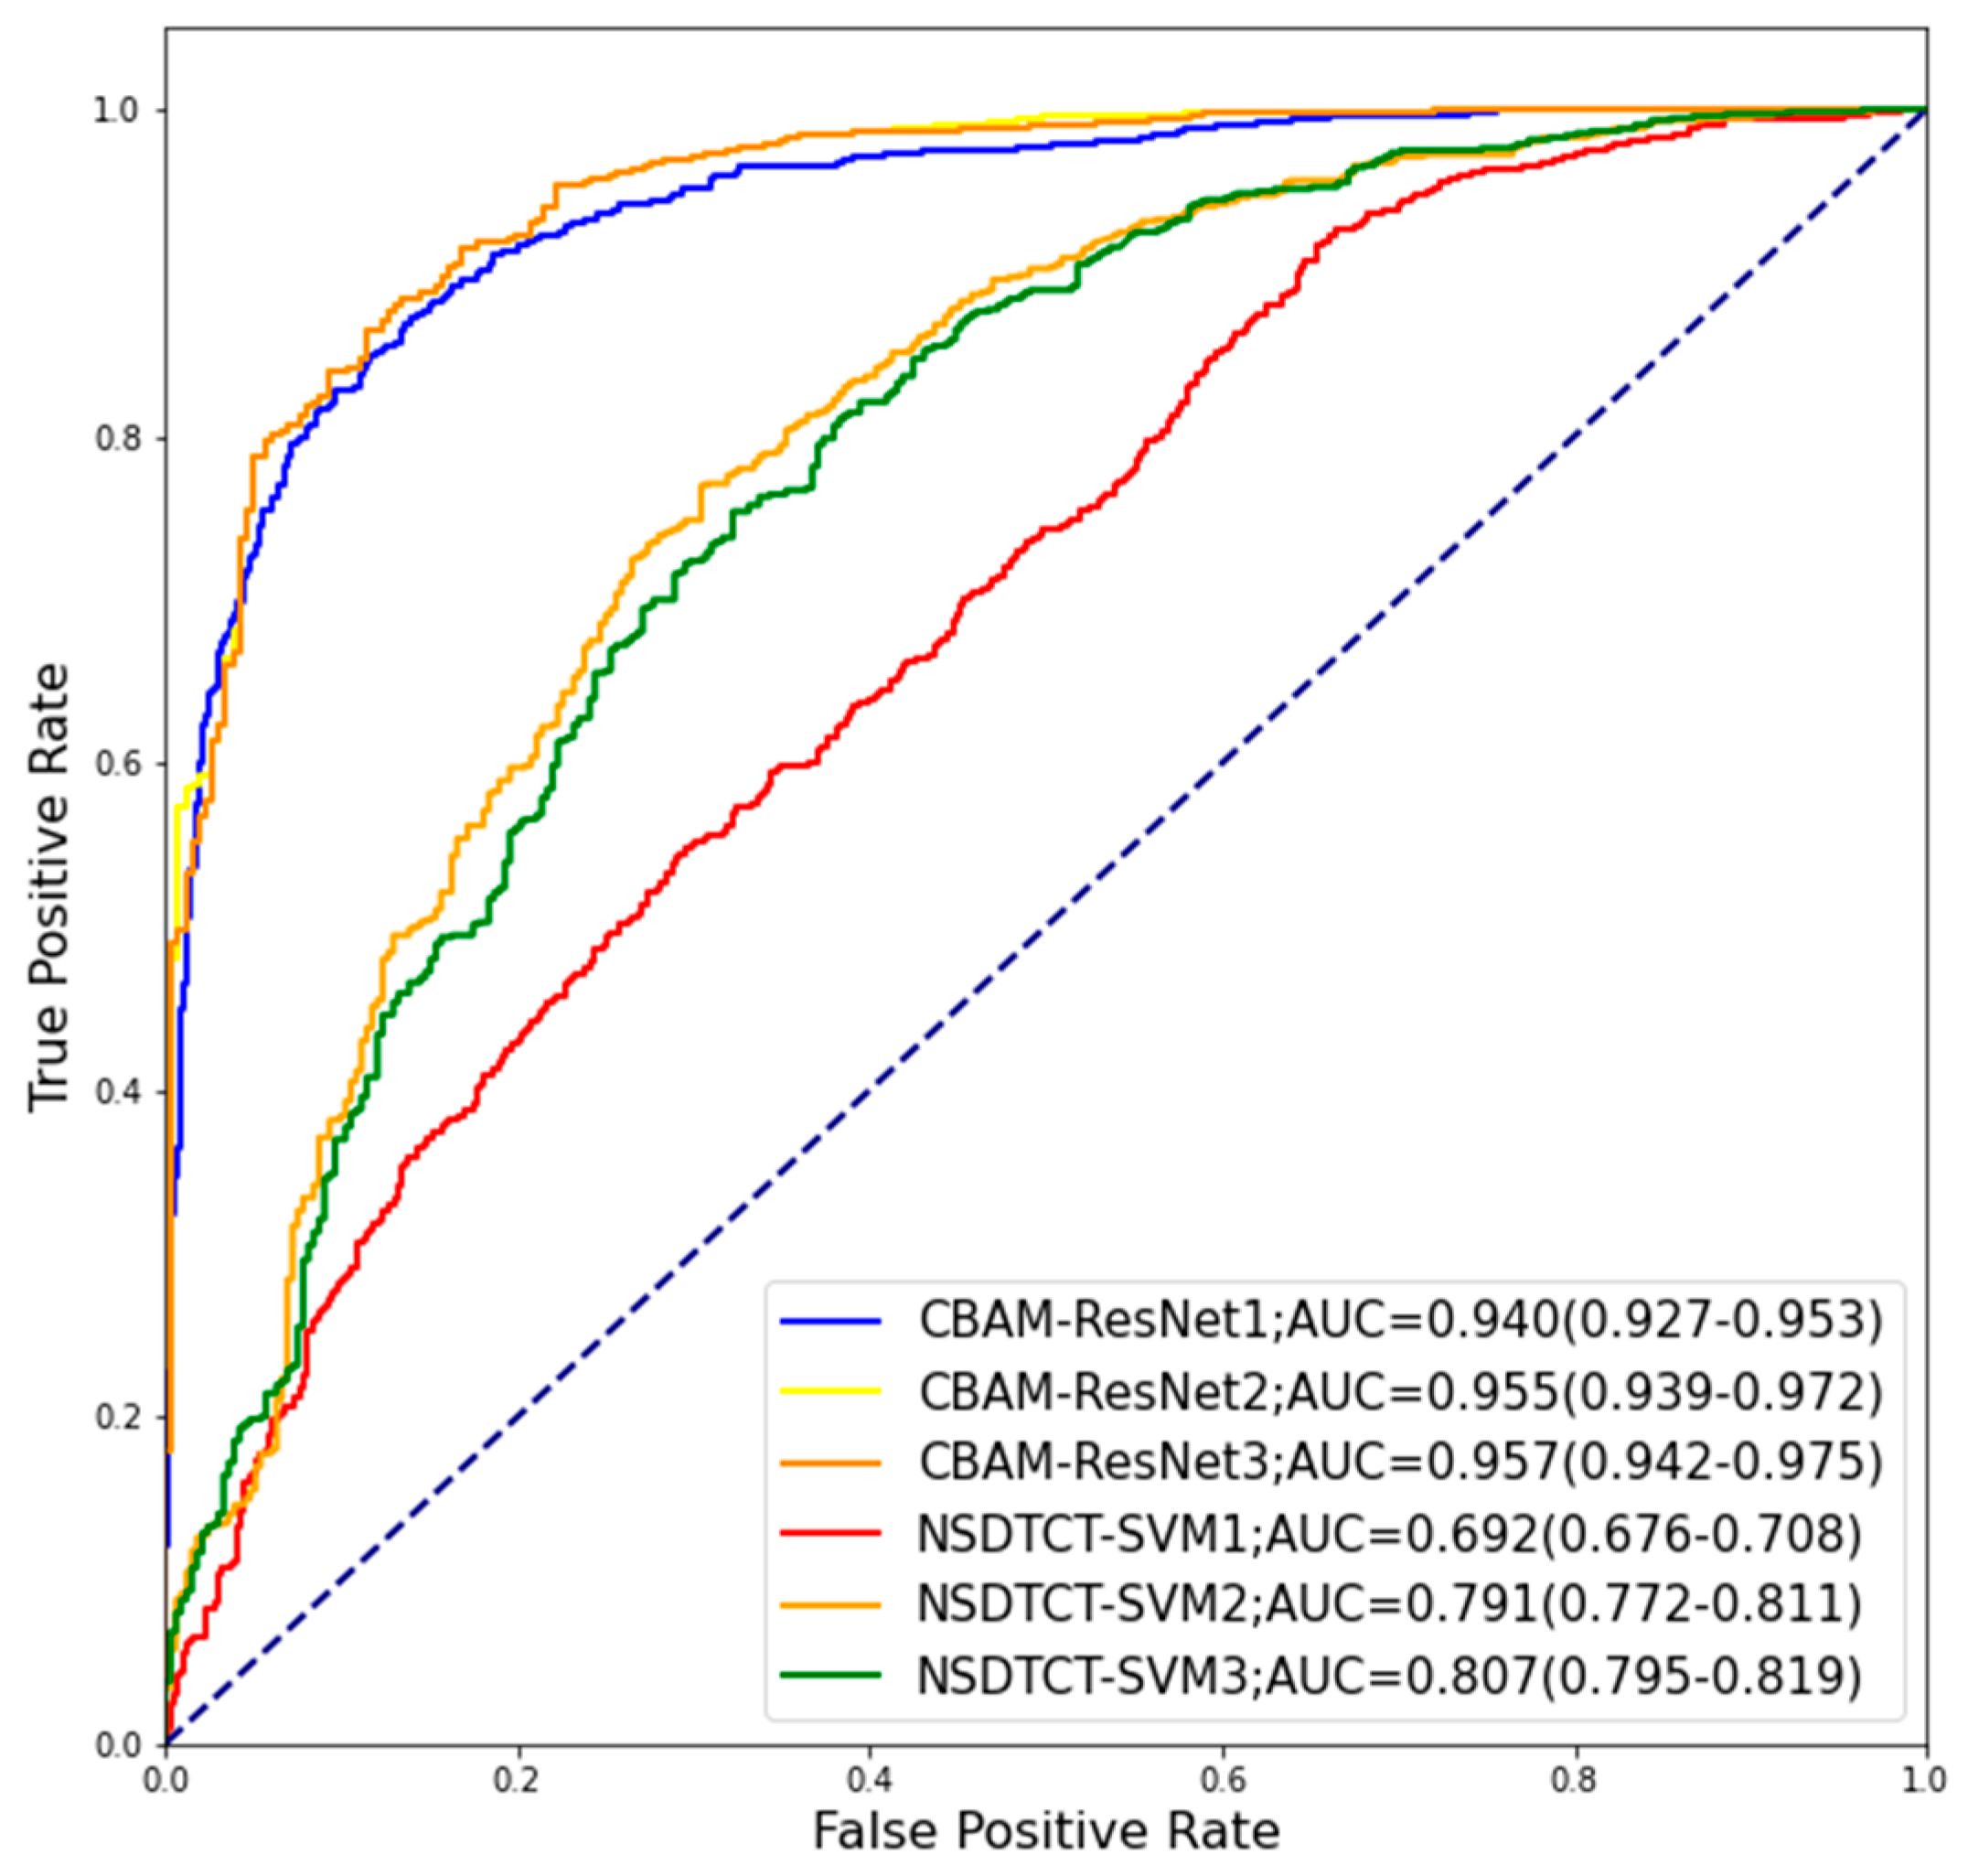
3.2. Performance of Classification
3.3. Visualization of Deep Features
4. Discussion
Author Contributions
Funding
Institutional Review Board Statement
Informed Consent Statement
Data Availability Statement
Conflicts of Interest
References
- Sung, H.; Ferlay, J.; Siegel, R.L.; Laversanne, M.; Soerjomataram, I.; Jemal, A.; Bray, F. Global Cancer Statistics 2020: GLOBOCAN Estimates of Incidence and Mortality Worldwide for 36 Cancers in 185 Countries. CA Cancer J. Clin. 2021, 71, 209–249. [Google Scholar] [CrossRef] [PubMed]
- Lu, H.; Jiang, Z. Advances in antibody therapeutics targeting small-cell lung cancer. Adv. Clin. Exp. Med. 2018, 27, 1317–1323. [Google Scholar] [CrossRef] [PubMed] [Green Version]
- Thawani, R.; McLane, M.; Beig, N.; Ghose, S.; Prasanna, P.; Velcheti, V.; Madabhushi, A. Radiomics and radiogenomics in lung cancer: A review for the clinician. Lung Cancer 2018, 115, 34–41. [Google Scholar] [CrossRef] [PubMed]
- Siegel, R.L.; Miller, K.D.; Jemal, A. Cancer statistics, 2020. CA Cancer J. Clin. 2020, 70, 7–30. [Google Scholar] [CrossRef]
- Yu, W.; Tang, C.; Hobbs, B.P.; Li, X.; Koay, E.J.; Wistuba, I.I.; Sepesi, B.; Behrens, C.; Rodriguez Canales, J.; Parra Cuentas, E.R.; et al. Development and Validation of a Predictive Radiomics Model for Clinical Outcomes in Stage I Non-small Cell Lung Cancer. Int. J. Radiat. Oncol. Biol. Phys. 2018, 102, 1090–1097. [Google Scholar] [CrossRef]
- Li, W.; Wang, X.; Zhang, Y.; Li, X.; Li, Q.; Ye, Z. Radiomic analysis of pulmonary ground-glass opacity nodules for distinction of preinvasive lesions, invasive pulmonary adenocarcinoma and minimally invasive adenocarcinoma based on quantitative texture analysis of CT. Chin. J. Cancer Res. 2018, 30, 415–424. [Google Scholar] [CrossRef]
- Lim, K.P.; Marshall, H.; Tammemägi, M.; Brims, F.; McWilliams, A.; Stone, E.; Manser, R.; Canfell, K.; Weber, M.; Connelly, L.; et al. Protocol and Rationale for the International Lung Screening Trial. Ann. Am. Thorac. Soc. 2020, 17, 503–512. [Google Scholar] [CrossRef]
- Xu, K.; Feng, D.; Mi, H. Deep Convolutional Neural Network-Based Early Automated Detection of Diabetic Retinopathy Using Fundus Image. Molecules 2017, 22, 2054. [Google Scholar] [CrossRef] [Green Version]
- Jiang, S.; Li, H.; Jin, Z. A Visually Interpretable Deep Learning Framework for Histopathological Image-Based Skin Cancer Diagnosis. IEEE J. Biomed. Health Inform. 2021, 25, 1483–1494. [Google Scholar] [CrossRef]
- Cetinoglu, Y.K.; Koska, I.O.; Uluc, M.E.; Gelal, M.F. Detection and vascular territorial classification of stroke on diffusion-weighted MRI by deep learning. Eur. J. Radiol. 2021, 145, 110050. [Google Scholar] [CrossRef]
- Marentakis, P.; Karaiskos, P.; Kouloulias, V.; Kelekis, N.; Argentos, S.; Oikonomopoulos, N.; Loukas, C. Lung cancer histology classification from CT images based on radiomics and deep learning models. Med. Biol. Eng. Comput. 2021, 59, 215–226. [Google Scholar] [CrossRef] [PubMed]
- Xu, Y.; Hosny, A.; Zeleznik, R.; Parmar, C.; Coroller, T.; Franco, I.; Mak, R.H.; Aerts, H.J.W.L. Deep Learning Predicts Lung Cancer Treatment Response from Serial Medical Imaging. Clin. Cancer Res. 2019, 25, 3266–3275. [Google Scholar] [CrossRef] [PubMed] [Green Version]
- Liu, S.; Xie, Y.; Jirapatnakul, A.; Reeves, A.P. Pulmonary nodule classification in lung cancer screening with three-dimensional convolutional neural networks. J. Med. Imaging 2017, 4, 041308. [Google Scholar] [CrossRef] [PubMed]
- Yang, Y.; Feng, X.; Chi, W.; Li, Z.; Duan, W.; Liu, H.; Liang, W.; Wang, W.; Chen, P.; He, J.; et al. Deep learning aided decision support for pulmonary nodules diagnosing: A review. J. Thorac. Dis. 2018, 10, S867–S875. [Google Scholar] [CrossRef] [PubMed] [Green Version]
- Gillies, R.J.; Kinahan, P.E.; Hricak, H. Radiomics: Images Are More than Pictures, They Are Data. Radiology 2016, 278, 563–577. [Google Scholar] [CrossRef] [PubMed] [Green Version]
- Lambin, P.; Rios-Velazquez, E.; Leijenaar, R.; Carvalho, S.; van Stiphout, R.G.P.M.; Granton, P.; Zegers, C.M.L.; Gillies, R.; Boellard, R.; Dekker, A.; et al. Radiomics: Extracting more information from medical images using advanced feature analysis. Eur. J. Cancer 2012, 48, 441–446. [Google Scholar] [CrossRef] [Green Version]
- Bian, Y.; Jiang, H.; Ma, C.; Wang, L.; Zheng, J.; Jin, G.; Lu, J. CT-Based Radiomics Score for Distinguishing Between Grade 1 and Grade 2 Nonfunctioning Pancreatic Neuroendocrine Tumors. AJR Am. J. Roentgenol. 2020, 215, 852–863. [Google Scholar] [CrossRef]
- Li, J.; Zhang, C.; Wei, J.; Zheng, P.; Zhang, H.; Xie, Y.; Bai, J.; Zhu, Z.; Zhou, K.; Liang, X.; et al. Intratumoral and Peritumoral Radiomics of Contrast-Enhanced CT for Prediction of Disease-Free Survival and Chemotherapy Response in Stage II/III Gastric Cancer. Front. Oncol. 2020, 10, 552270. [Google Scholar] [CrossRef]
- Shen, S.; Han, S.X.; Aberle, D.R.; Bui, A.A.; Hsu, W. An Interpretable Deep Hierarchical Semantic Convolutional Neural Network for Lung Nodule Malignancy Classification. Expert Syst. Appl. 2019, 128, 84–95. [Google Scholar] [CrossRef] [Green Version]
- Lei, Y.; Tian, Y.; Shan, H.; Zhang, J.; Wang, G.; Kalra, M.K. Shape and margin-aware lung nodule classification in low-dose CT images via soft activation mapping. Med. Image Anal. 2020, 60, 101628. [Google Scholar] [CrossRef] [Green Version]
- Khan, M.A.; Rajinikanth, V.; Satapathy, S.C.; Taniar, D.; Mohanty, J.R.; Tariq, U.; Damaševičius, R. VGG19 Network Assisted Joint Segmentation and Classification of Lung Nodules in CT Images. Diagnostics 2021, 11, 2208. [Google Scholar] [CrossRef] [PubMed]
- Cai, Z.; Vasconcelos, N. Cascade R-CNN: High Quality Object Detection and Instance Segmentation. IEEE Trans. Pattern Anal. Mach. Intell. 2021, 43, 1483–1498. [Google Scholar] [CrossRef] [PubMed] [Green Version]
- Huang, Q.; Li, W.; Zhang, B.; Li, Q.; Tao, R.; Lovell, N.H. Blood Cell Classification Based on Hyperspectral Imaging With Modulated Gabor and CNN. IEEE J. Biomed. Health Inform. 2020, 24, 160–170. [Google Scholar] [CrossRef] [PubMed]
- Balagourouchetty, L.; Pragatheeswaran, J.K.; Pottakkat, B.; Ramkumar, G. GoogLeNet-Based Ensemble FCNet Classifier for Focal Liver Lesion Diagnosis. IEEE J. Biomed. Health Inform. 2020, 24, 1686–1694. [Google Scholar] [CrossRef]
- Geng, L.; Zhang, S.; Tong, J.; Xiao, Z. Lung segmentation method with dilated convolution based on VGG-16 network. Comput. Assist. Surg. 2019, 24, 27–33. [Google Scholar] [CrossRef] [Green Version]
- He, F.; Liu, T.; Tao, D. Why ResNet Works? Residuals Generalize. IEEE Trans. Neural Netw. Learn. Syst. 2020, 31, 5349–5362. [Google Scholar] [CrossRef] [Green Version]
- Tao, Z.; Bingqiang, H.; Huiling, L.; Zaoli, Y.; Hongbin, S. NSCR-Based DenseNet for Lung Tumor Recognition Using Chest CT Image. Biomed. Res. Int. 2020, 2020, 6636321. [Google Scholar] [CrossRef]
- Li, L.; Yang, Y.; Zhang, Q.; Wang, J.; Jiang, J.; Neuroimaging Initiative, A.s.D. Use of Deep-Learning Genomics to Discriminate Healthy Individuals from Those with Alzheimer’s Disease or Mild Cognitive Impairment. Behav. Neurol. 2021, 2021, 3359103. [Google Scholar] [CrossRef]
- Hu, J.; Shen, L.; Albanie, S.; Sun, G.; Wu, E. Squeeze-and-Excitation Networks. IEEE Trans. Pattern Anal. Mach. Intell. 2020, 42, 2011–2023. [Google Scholar] [CrossRef] [Green Version]
- Feng, W.; Halm-Lutterodt, N.V.; Tang, H.; Mecum, A.; Mesregah, M.K.; Ma, Y.; Li, H.; Zhang, F.; Wu, Z.; Yao, E.; et al. Automated MRI-Based Deep Learning Model for Detection of Alzheimer’s Disease Process. Int. J. Neural Syst. 2020, 30, 2050032. [Google Scholar] [CrossRef]
- Wu, P.; Sun, X.; Zhao, Z.; Wang, H.; Pan, S.; Schuller, B. Classification of Lung Nodules Based on Deep Residual Networks and Migration Learning. Comput. Intell. Neurosci. 2020, 2020, 8975078. [Google Scholar] [CrossRef] [PubMed]
- Kavitha, M.S.; Shanthini, J.; Sabitha, R. ECM-CSD: An Efficient Classification Model for Cancer Stage Diagnosis in CT Lung Images Using FCM and SVM Techniques. J. Med. Syst. 2019, 43, 73. [Google Scholar] [CrossRef] [PubMed]
- Basaia, S.; Agosta, F.; Wagner, L.; Canu, E.; Magnani, G.; Santangelo, R.; Filippi, M. Automated classification of Alzheimer’s disease and mild cognitive impairment using a single MRI and deep neural networks. Neuroimage Clin. 2019, 21, 101645. [Google Scholar] [CrossRef] [PubMed]
- Girard, F.; Kavalec, C.; Cheriet, F. Joint segmentation and classification of retinal arteries/veins from fundus images. Artif. Intell. Med. 2019, 94, 96–109. [Google Scholar] [CrossRef] [Green Version]
- Xiao, Y.; Yin, H.; Wang, S.-H.; Zhang, Y.-D. TReC: Transferred ResNet and CBAM for Detecting Brain Diseases. Front. Neuroinform. 2021, 15, 781551. [Google Scholar] [CrossRef]
- Vlahos, I.; Stefanidis, K.; Sheard, S.; Nair, A.; Sayer, C.; Moser, J. Lung cancer screening: Nodule identification and characterization. Transl. Lung Cancer Res. 2018, 7, 288–303. [Google Scholar] [CrossRef]
- Li, L.; Shao, M.; He, X.; Ren, S.; Tian, T. Risk of lung cancer due to external environmental factor and epidemiological data analysis. Math. Biosci. Eng. 2021, 18, 6079–6094. [Google Scholar] [CrossRef]
- Dhara, A.K.; Mukhopadhyay, S.; Dutta, A.; Garg, M.; Khandelwal, N. A Combination of Shape and Texture Features for Classification of Pulmonary Nodules in Lung CT Images. J. Digit. Imaging 2016, 29, 466–475. [Google Scholar] [CrossRef] [Green Version]
- Liu, K.; Kang, G. Multiview convolutional neural networks for lung nodule classification. Int. J. Imaging Syst. Technol. 2017, 27, 12–22. [Google Scholar] [CrossRef] [Green Version]
- Liu, Y.; Hao, P.; Peng, Z.; Xu, X.; Wei, C.J.I.A. Dense Convolutional Binary-Tree Networks for Lung Nodule Classification. IEEE Access 2018, 6, 49080–49088. [Google Scholar] [CrossRef]
- Shen, W.; Zhou, M.; Yang, F.; Yu, D.; Dong, D.; Yang, C.; Zang, Y.; Tian, J. Multi-crop Convolutional Neural Networks for lung nodule malignancy suspiciousness classification. Pattern Recognit. 2017, 61, 663–673. [Google Scholar] [CrossRef]
- Liu, H.; Cao, H.; Song, E.; Ma, G.; Xu, X.; Jin, R.; Liu, C.; Hung, C.-C. Multi-model Ensemble Learning Architecture Based on 3D CNN for Lung Nodule Malignancy Suspiciousness Classification. J. Digit. Imaging 2020, 33, 1242–1256. [Google Scholar] [CrossRef] [PubMed]


| Source | Subjects (n, %) | Images (n, %) |
|---|---|---|
| Beijing Chest Hospital | 183 (18.8) | 3065 (37.2) |
| Beijing Friendship Hospital | 174 (17.9) | 1454 (17.6) |
| Beijing Cancer Hospital | 394 (40.5) | 2312 (28.1) |
| Xuanwu Hospital | 221 (22.7) | 1410 (17.1) |
| Total | 972 (100.0) | 8241 (100.0) |
| Characteristic | Training Set (n = 6594) | Testing Set (n = 1647) | p-Value |
|---|---|---|---|
| Age (years, mean ± SD) | 61.5 ± 11.6 | 61.3 ± 11.8 | 0.451 a |
| Sex (n, %) | 0.391 b | ||
| Male | 4171 (63.3) | 1023 (62.1) | |
| Female | 2423 (36.7) | 624 (37.9) | |
| Type (n, %) | 0.966 b | ||
| Malignant | 4103 (62.2) | 1027 (62.3) | |
| Benign | 1491 (37.8) | 620 (37.7) |
| Morphological Feature | Benign (n = 3111) | Malignant (n = 5130) | p-Value |
|---|---|---|---|
| Diameter (cm, mean ± SD) | 2.582 ± 1.30 | 3.135 ± 1.52 | <0.001 a |
| Halo (yes, %) | 47 (3.4) | 248 (6.2) | <0.001 b |
| Lobulation (yes, %) | 477 (34.8) | 3073 (73.6) | <0.001 b |
| Vacuole (yes, %) | 46 (2.7) | 575 (14.6) | <0.001 b |
| Spiculation (yes, %) | 245 (16.9) | 1802 (45.9) | <0.001 b |
| Calcification (yes, %) | 316 (22.0) | 324 (5.3) | <0.001 b |
| Cavity (yes, %) | 115 (8.6) | 231 (6.0) | <0.001 b |
| Pleural retraction (yes, %) | 181 (14.1) | 1871 (47.0) | <0.001 b |
| Model | AUC (95% CI) | Accuracy | Sensitivity | Specificity |
|---|---|---|---|---|
| CBAM-ResNet1 | 0.940 (0.927–0.953) | 0.867 | 0.931 | 0.849 |
| CBAM-ResNet2 | 0.955 (0.939–0.972) | 0.896 | 0.968 | 0.863 |
| CBAM-ResNet3 | 0.957 (0.942–0.975) | 0.898 | 0.971 | 0.864 |
| NSDTCT-SVM1 | 0.692 (0.676–0.708) | 0.691 | 0.748 | 0.691 |
| NSDTCT-SVM2 | 0.791 (0.772–0.811) | 0.765 | 0.752 | 0.776 |
| NSDTCT-SVM3 | 0.807 (0.795–0.819) | 0.779 | 0.763 | 0.782 |
Disclaimer/Publisher’s Note: The statements, opinions and data contained in all publications are solely those of the individual author(s) and contributor(s) and not of MDPI and/or the editor(s). MDPI and/or the editor(s) disclaim responsibility for any injury to people or property resulting from any ideas, methods, instructions or products referred to in the content. |
© 2023 by the authors. Licensee MDPI, Basel, Switzerland. This article is an open access article distributed under the terms and conditions of the Creative Commons Attribution (CC BY) license (https://creativecommons.org/licenses/by/4.0/).
Share and Cite
Zhang, Y.; Feng, W.; Wu, Z.; Li, W.; Tao, L.; Liu, X.; Zhang, F.; Gao, Y.; Huang, J.; Guo, X. Deep-Learning Model of ResNet Combined with CBAM for Malignant–Benign Pulmonary Nodules Classification on Computed Tomography Images. Medicina 2023, 59, 1088. https://0-doi-org.brum.beds.ac.uk/10.3390/medicina59061088
Zhang Y, Feng W, Wu Z, Li W, Tao L, Liu X, Zhang F, Gao Y, Huang J, Guo X. Deep-Learning Model of ResNet Combined with CBAM for Malignant–Benign Pulmonary Nodules Classification on Computed Tomography Images. Medicina. 2023; 59(6):1088. https://0-doi-org.brum.beds.ac.uk/10.3390/medicina59061088
Chicago/Turabian StyleZhang, Yanfei, Wei Feng, Zhiyuan Wu, Weiming Li, Lixin Tao, Xiangtong Liu, Feng Zhang, Yan Gao, Jian Huang, and Xiuhua Guo. 2023. "Deep-Learning Model of ResNet Combined with CBAM for Malignant–Benign Pulmonary Nodules Classification on Computed Tomography Images" Medicina 59, no. 6: 1088. https://0-doi-org.brum.beds.ac.uk/10.3390/medicina59061088