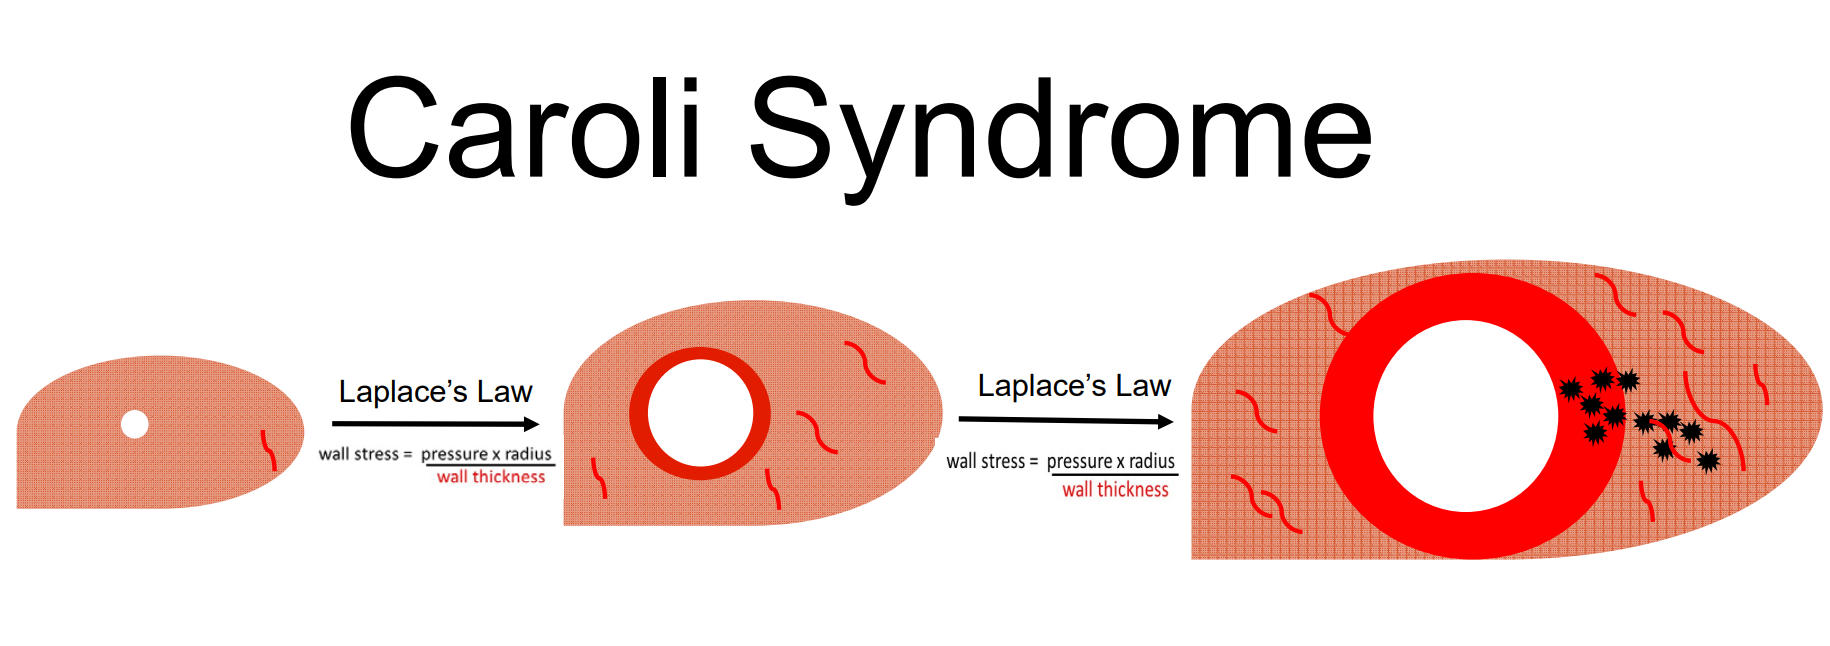
Remodeling of Intrahepatic Ducts in a Model of Caroli Syndrome: Is Scar Carcinoma a Consequence of Laplace’s Law?

 ,
,
Abstract
:
1. Introduction
2. Methods
2.1. Animal Models
2.2. Liver Function Test and Biochemical and Histopathological Analysis
2.3. Data Analysis
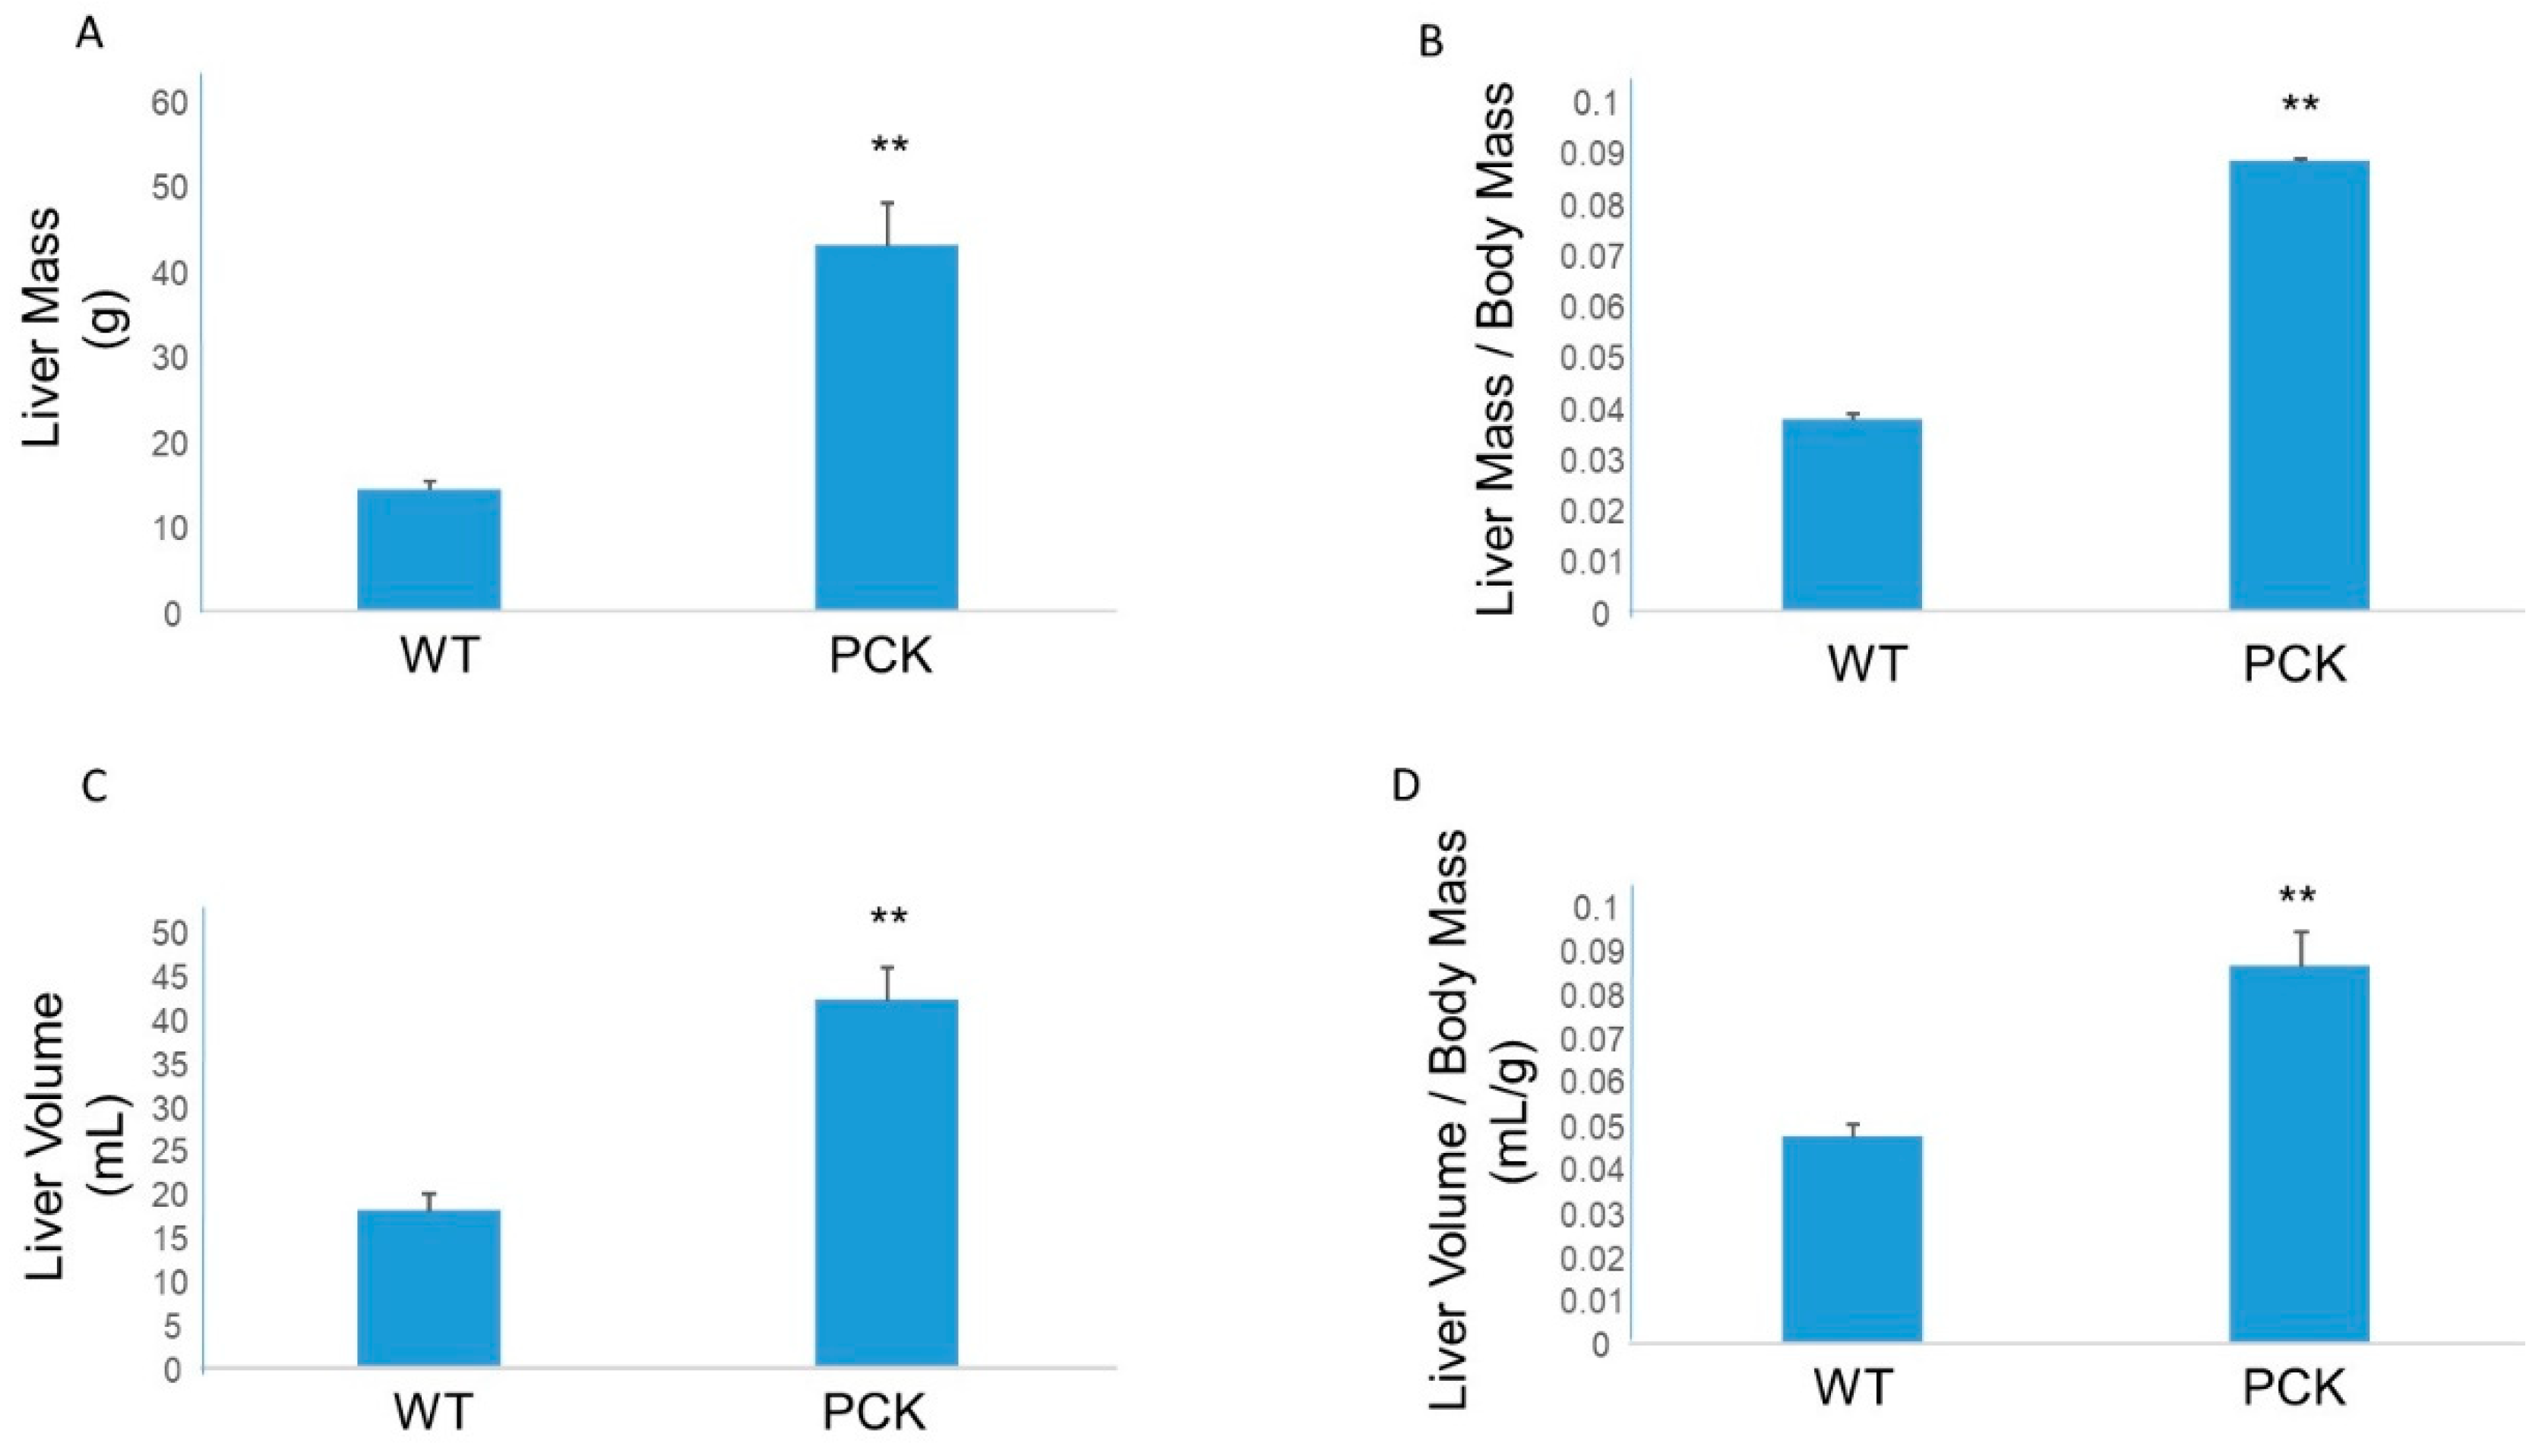
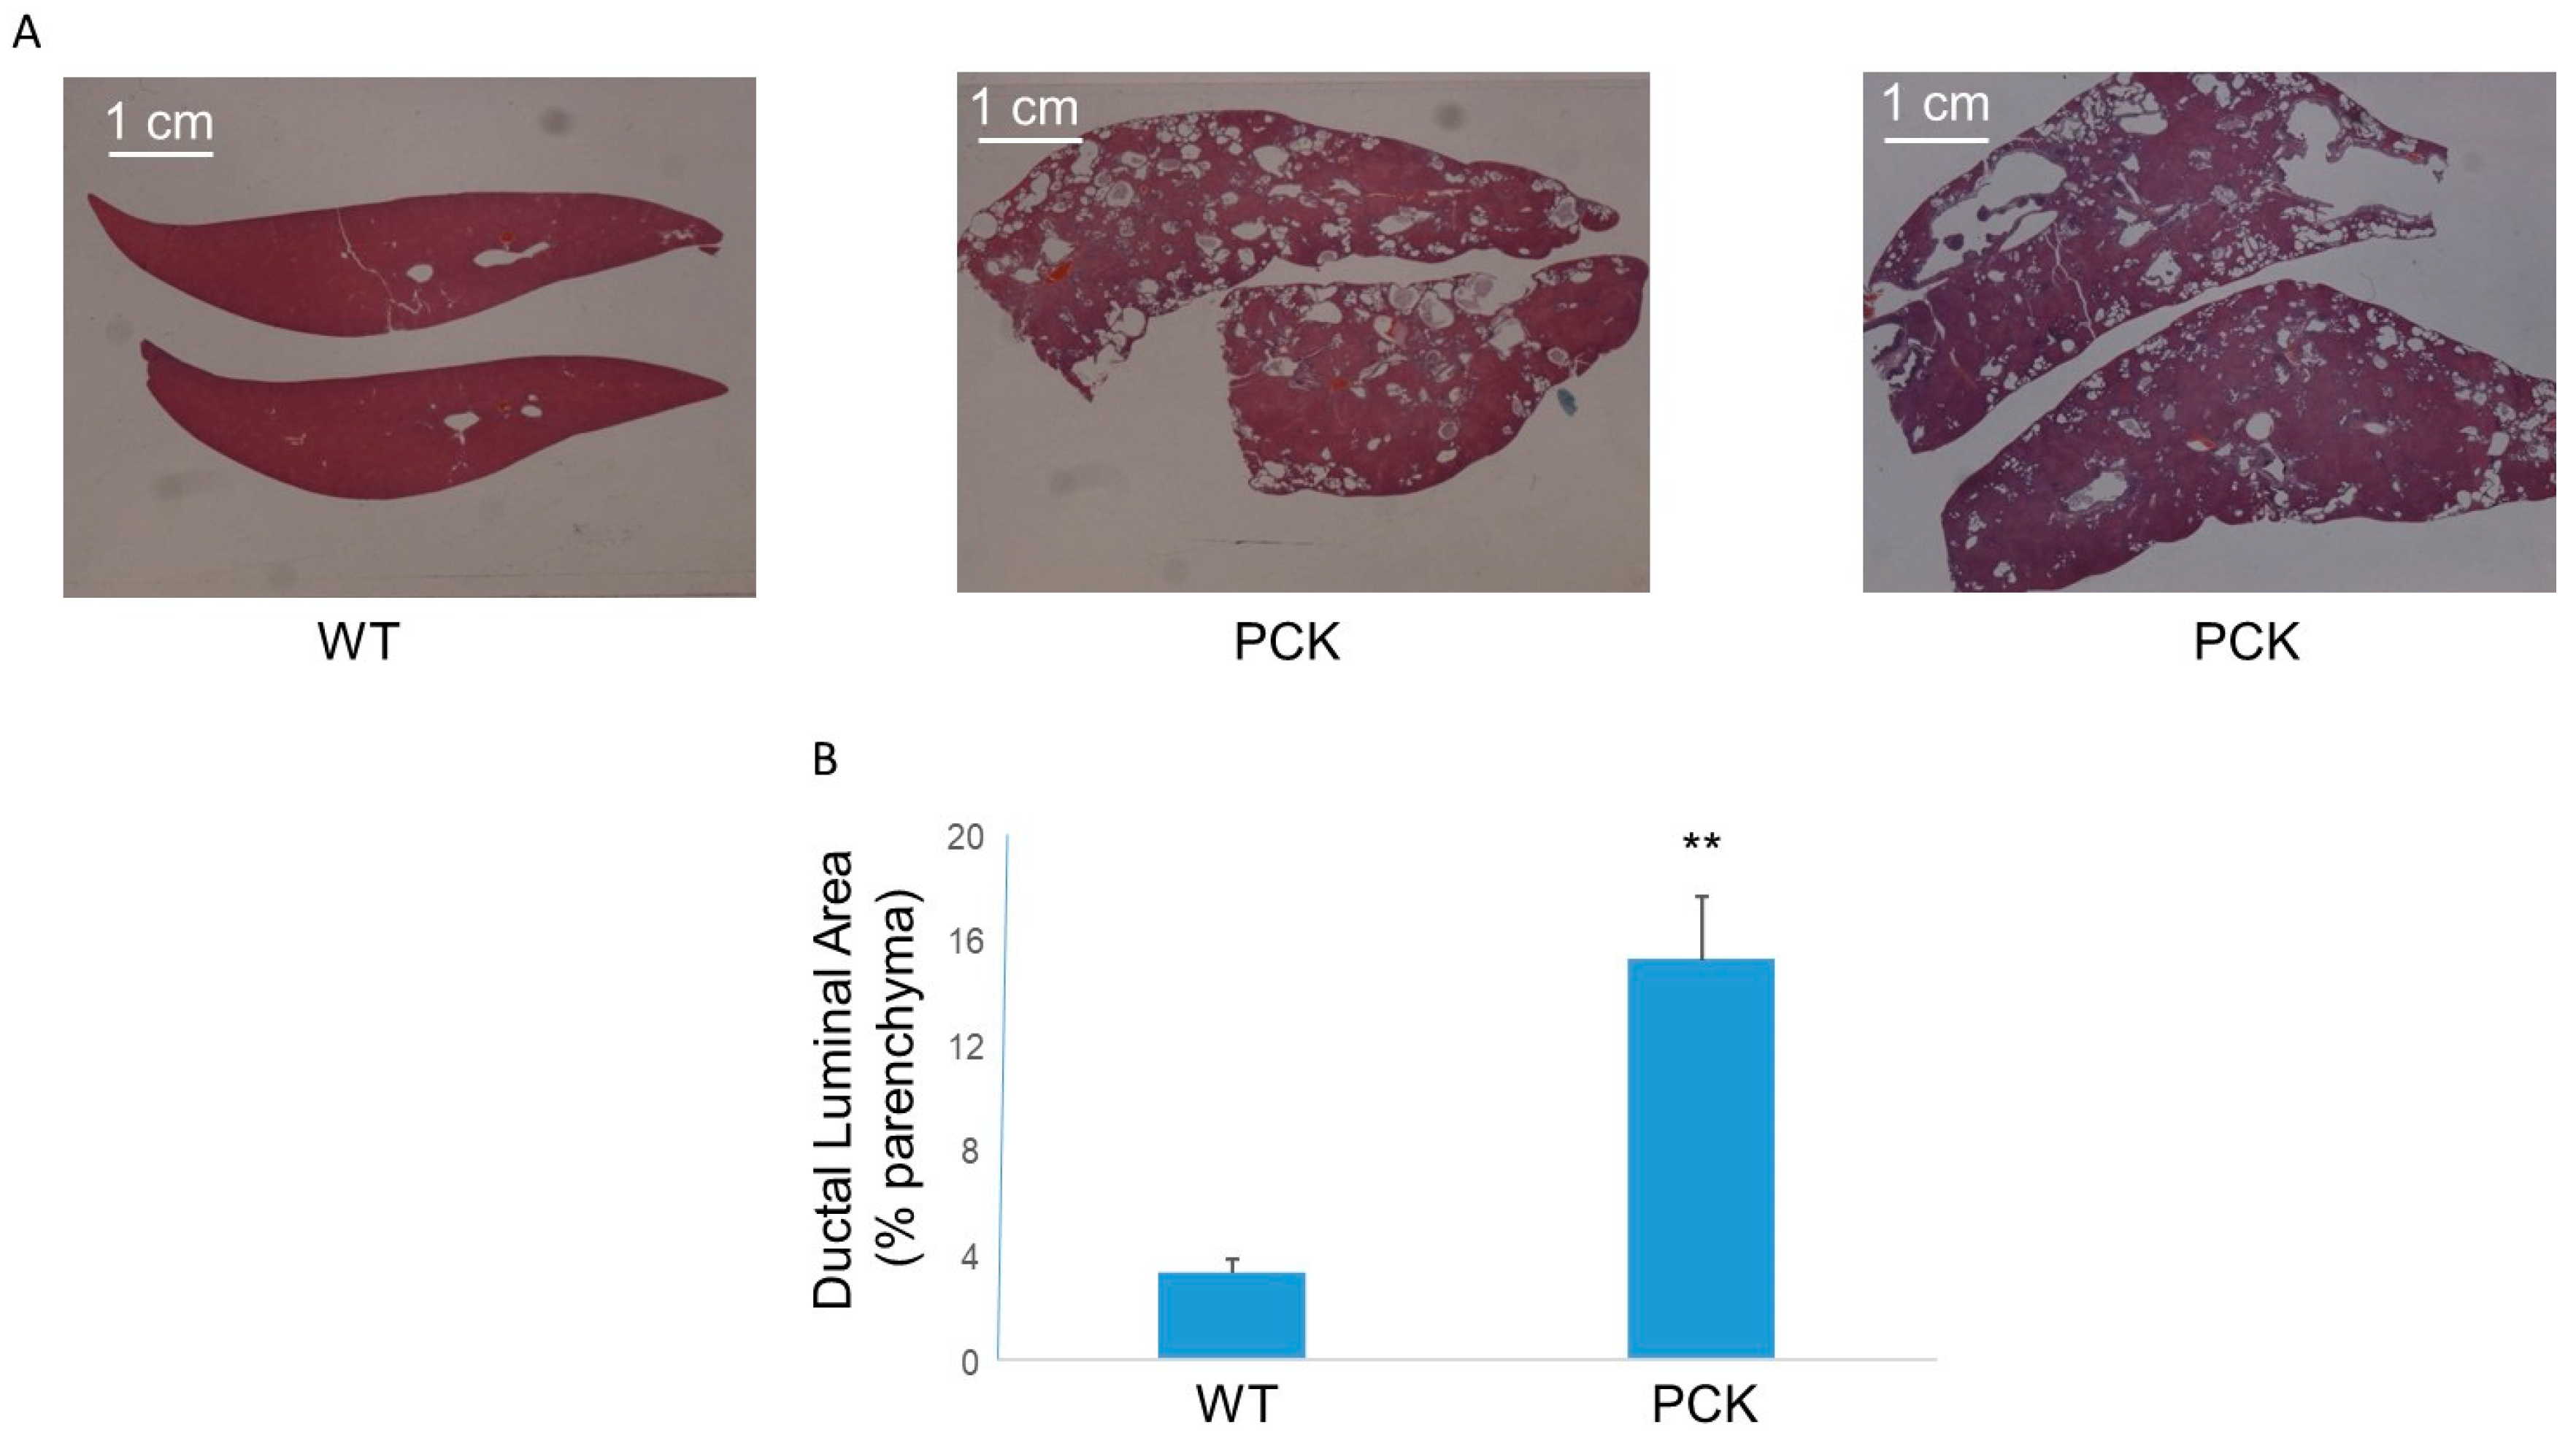
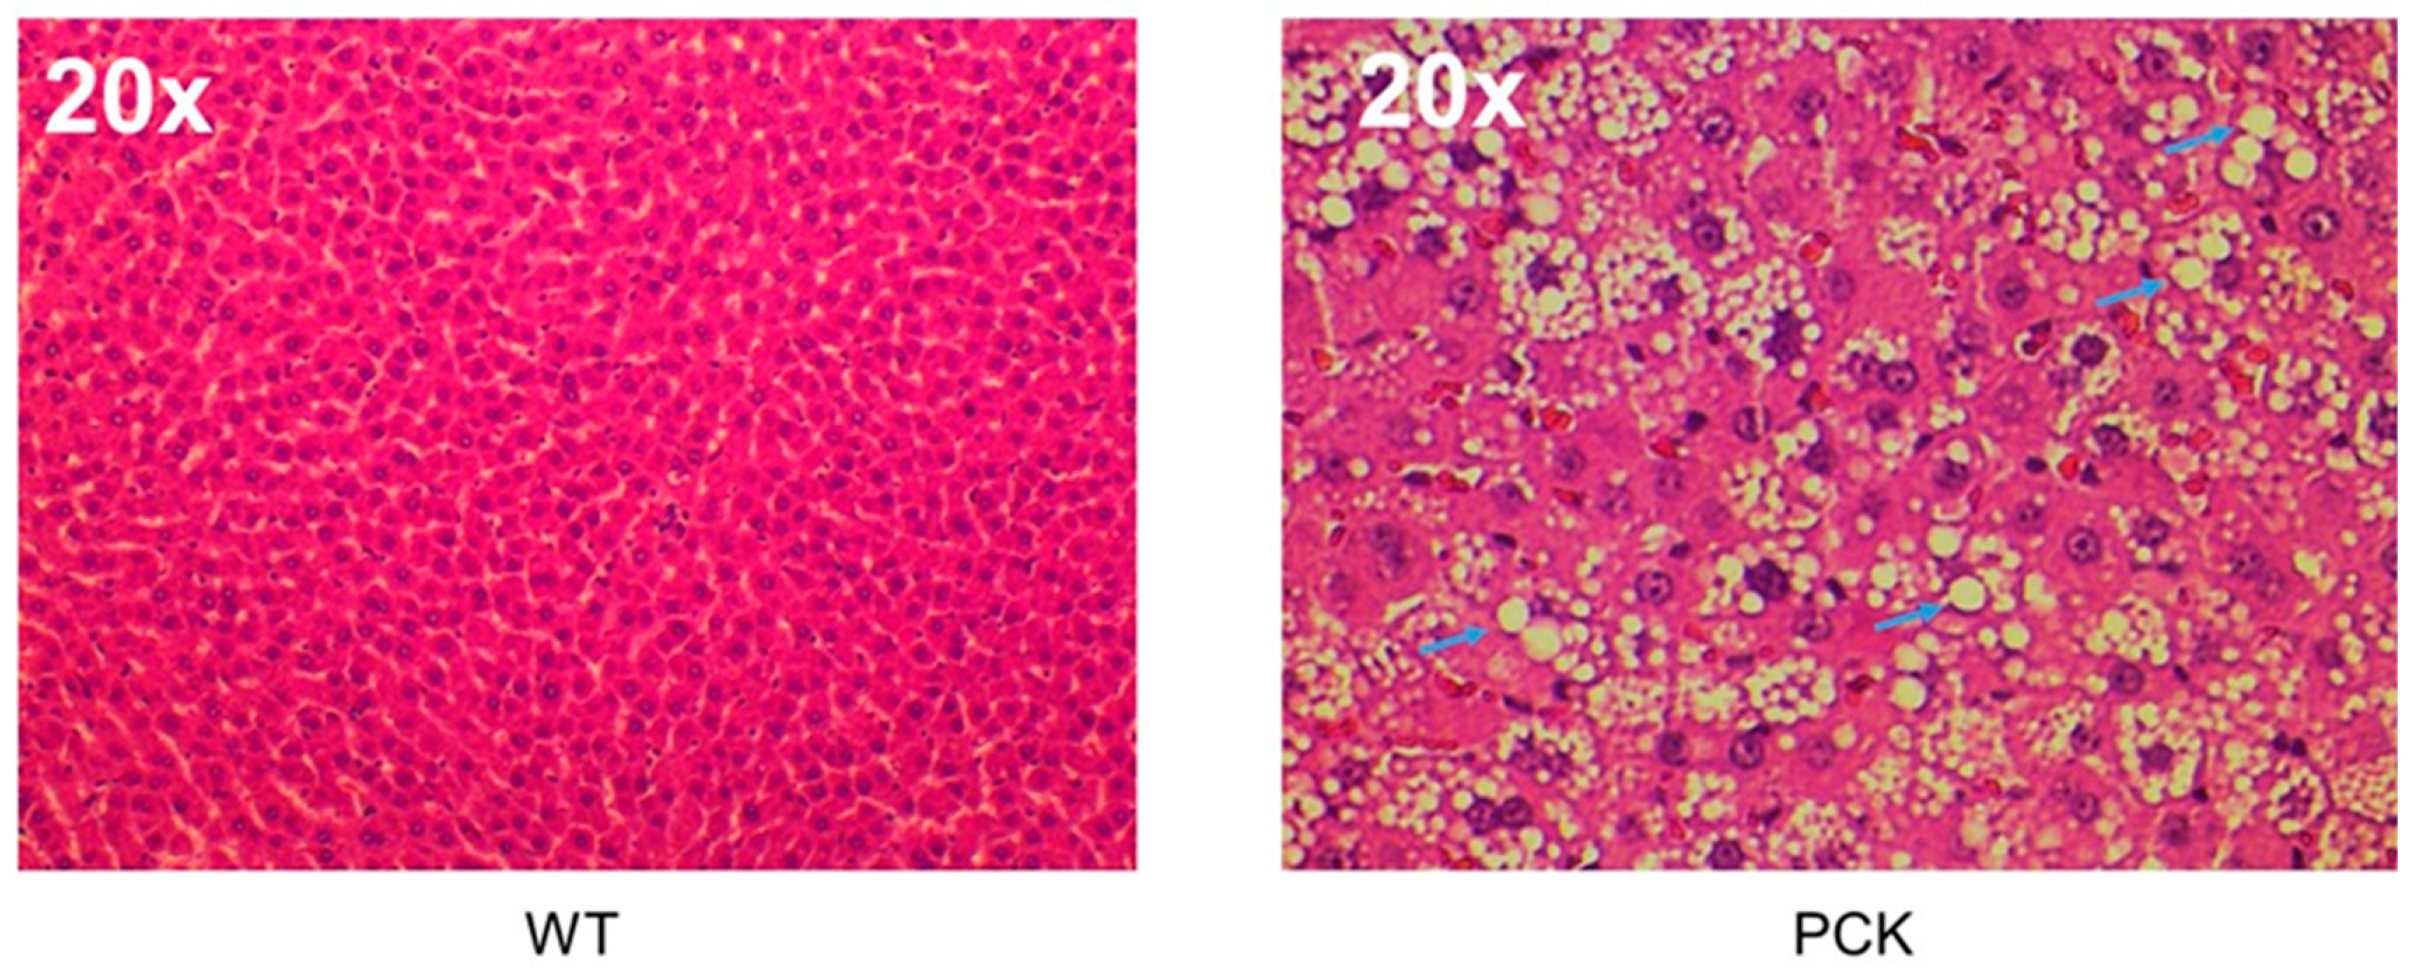
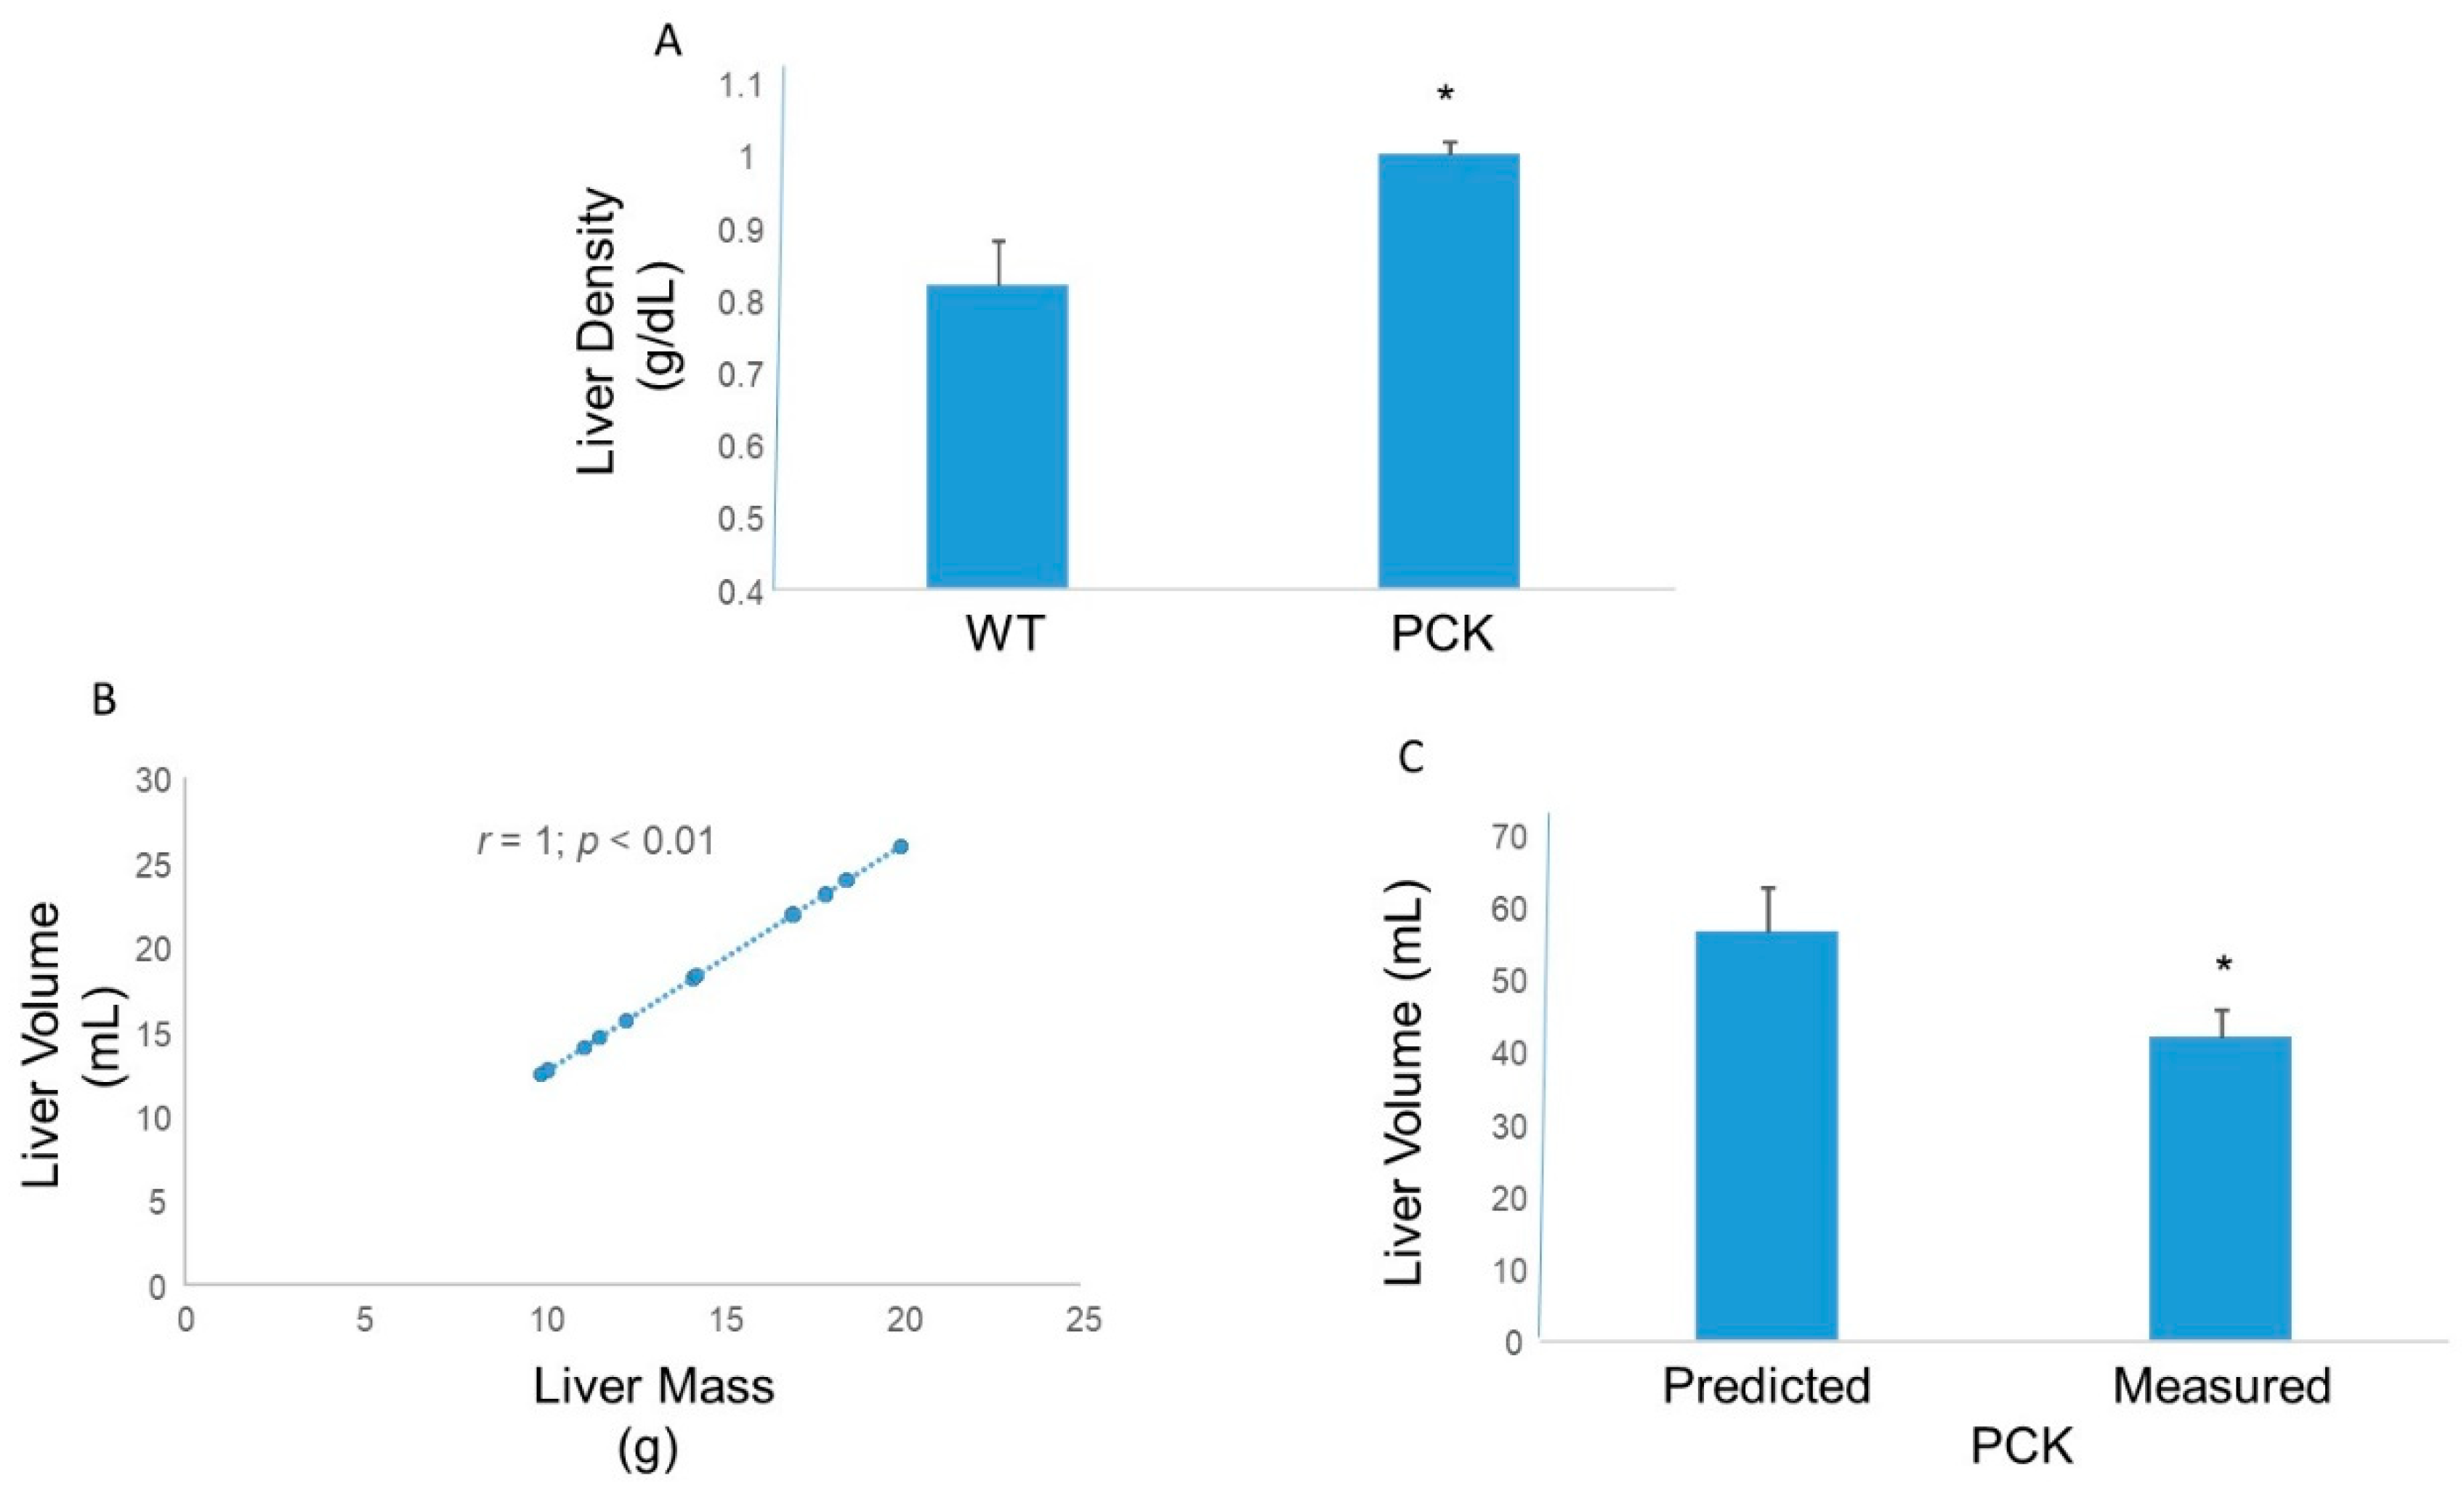
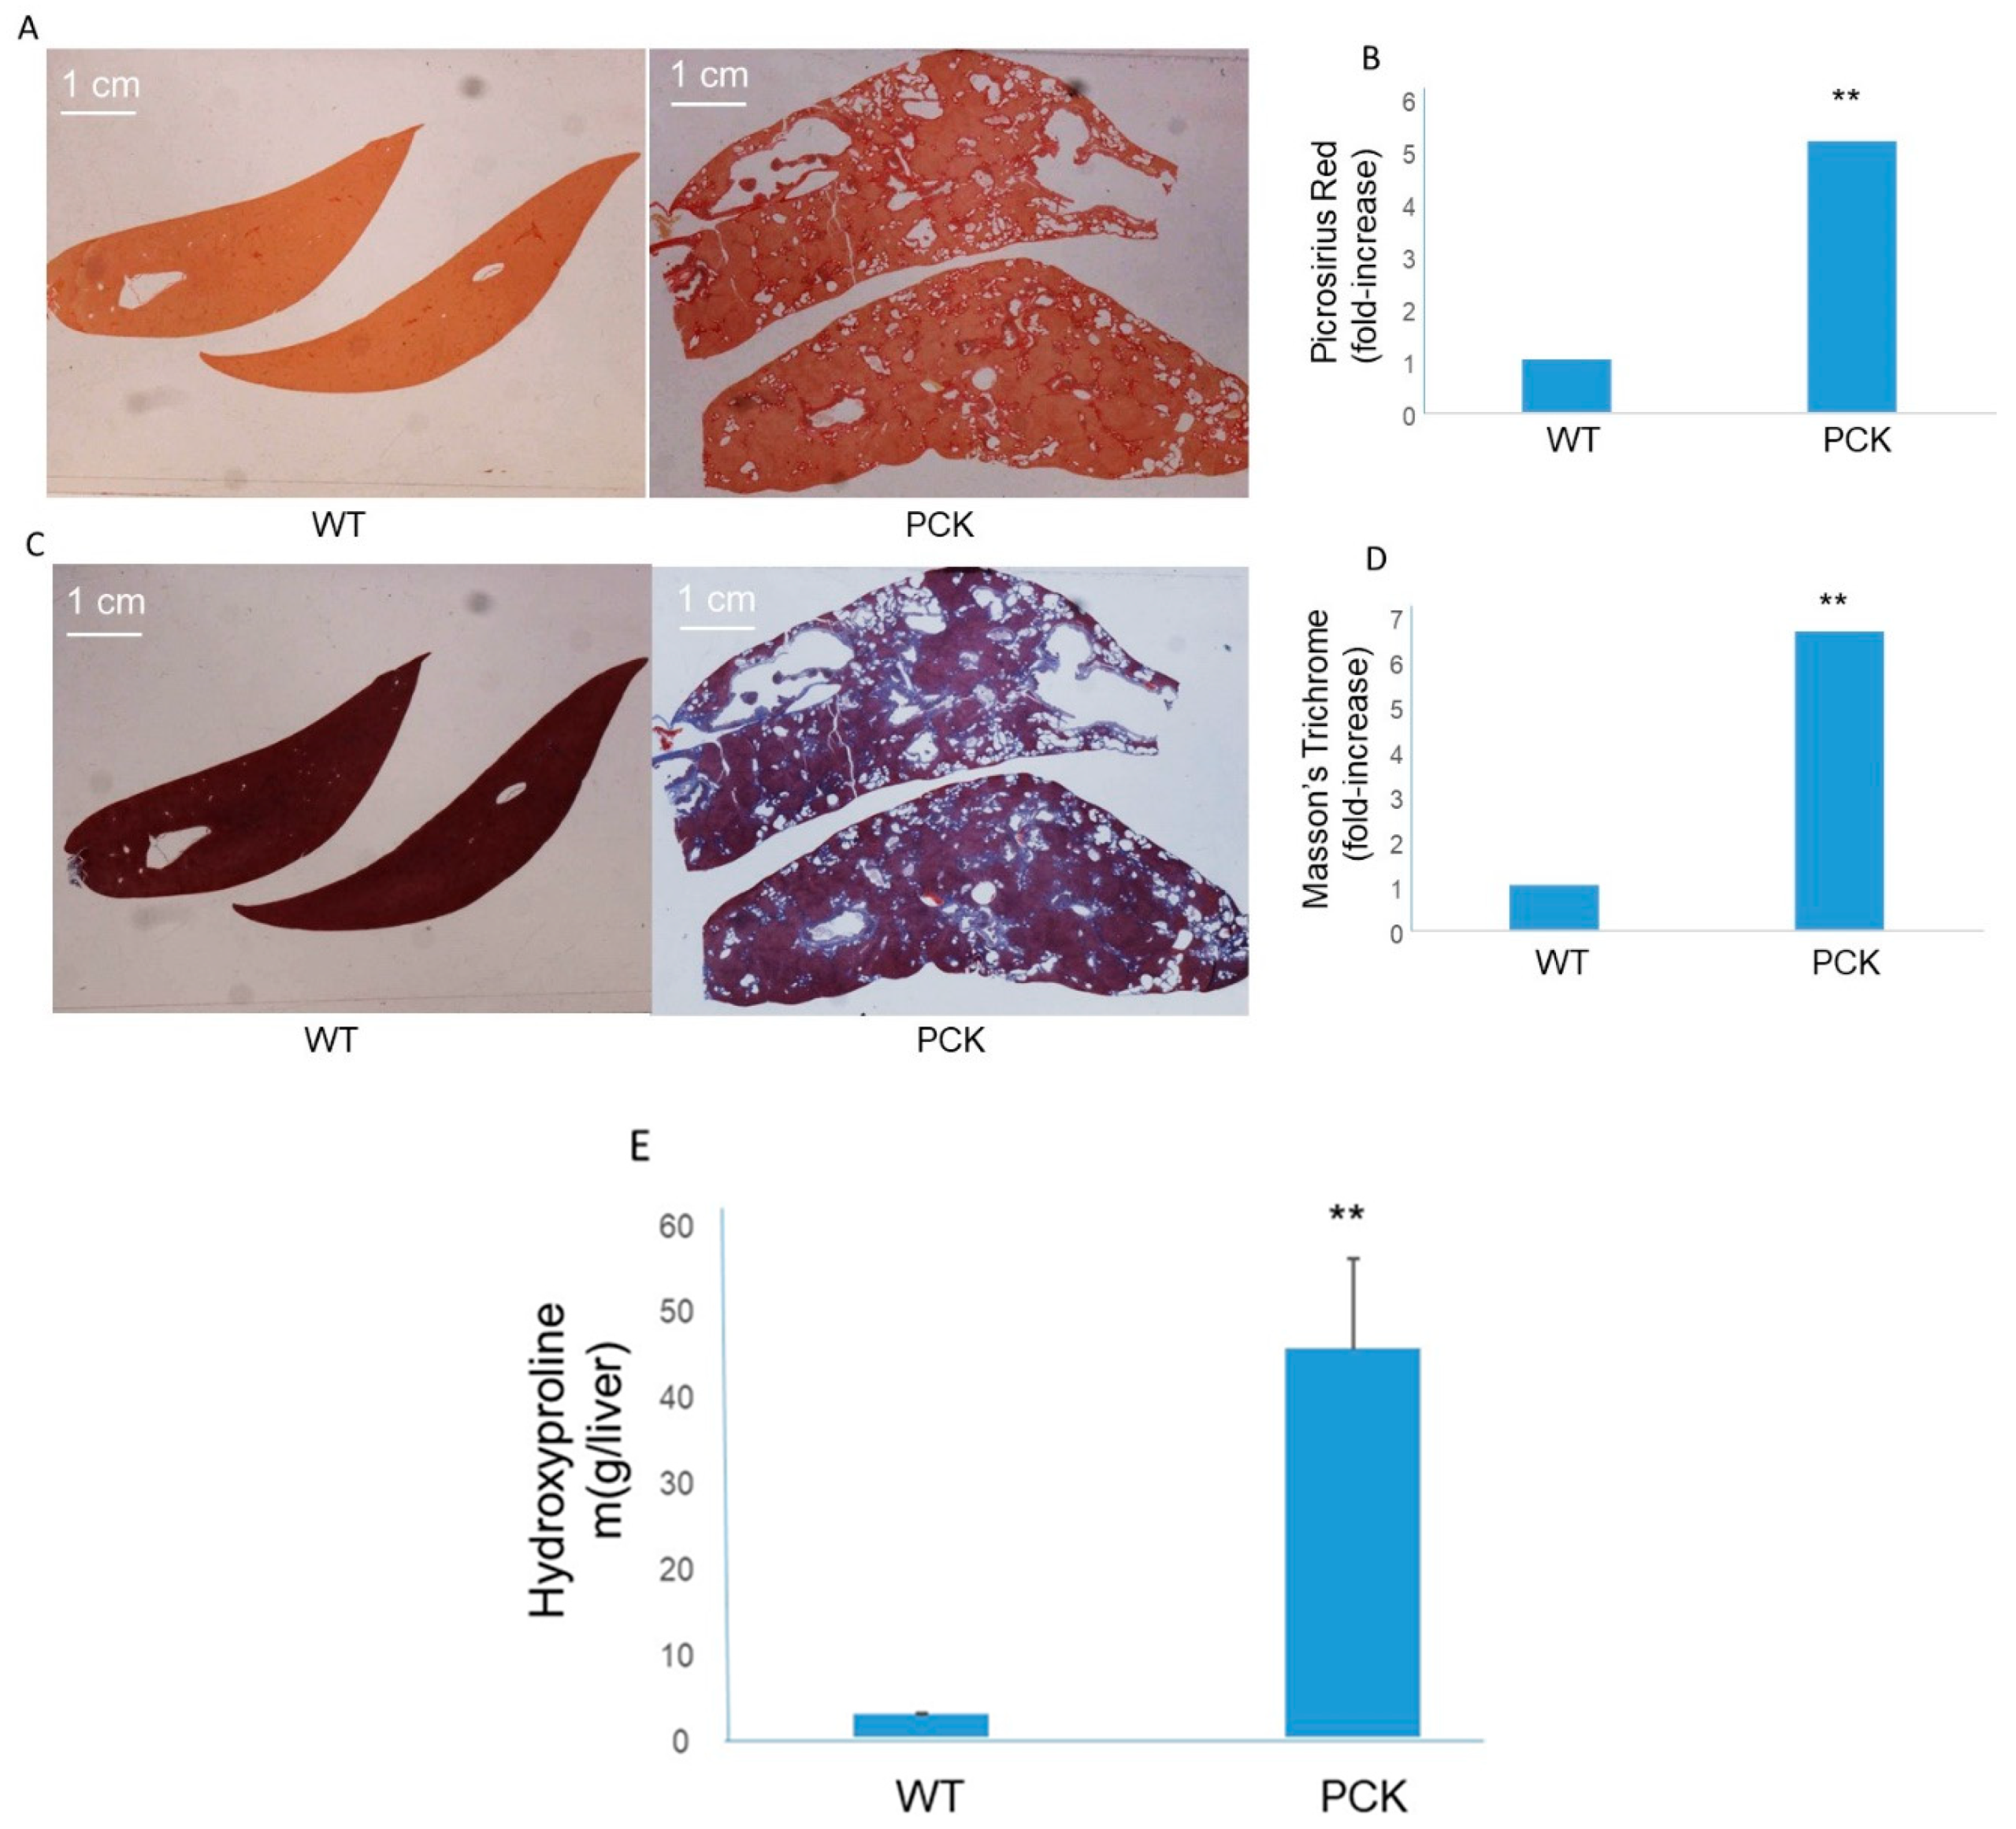
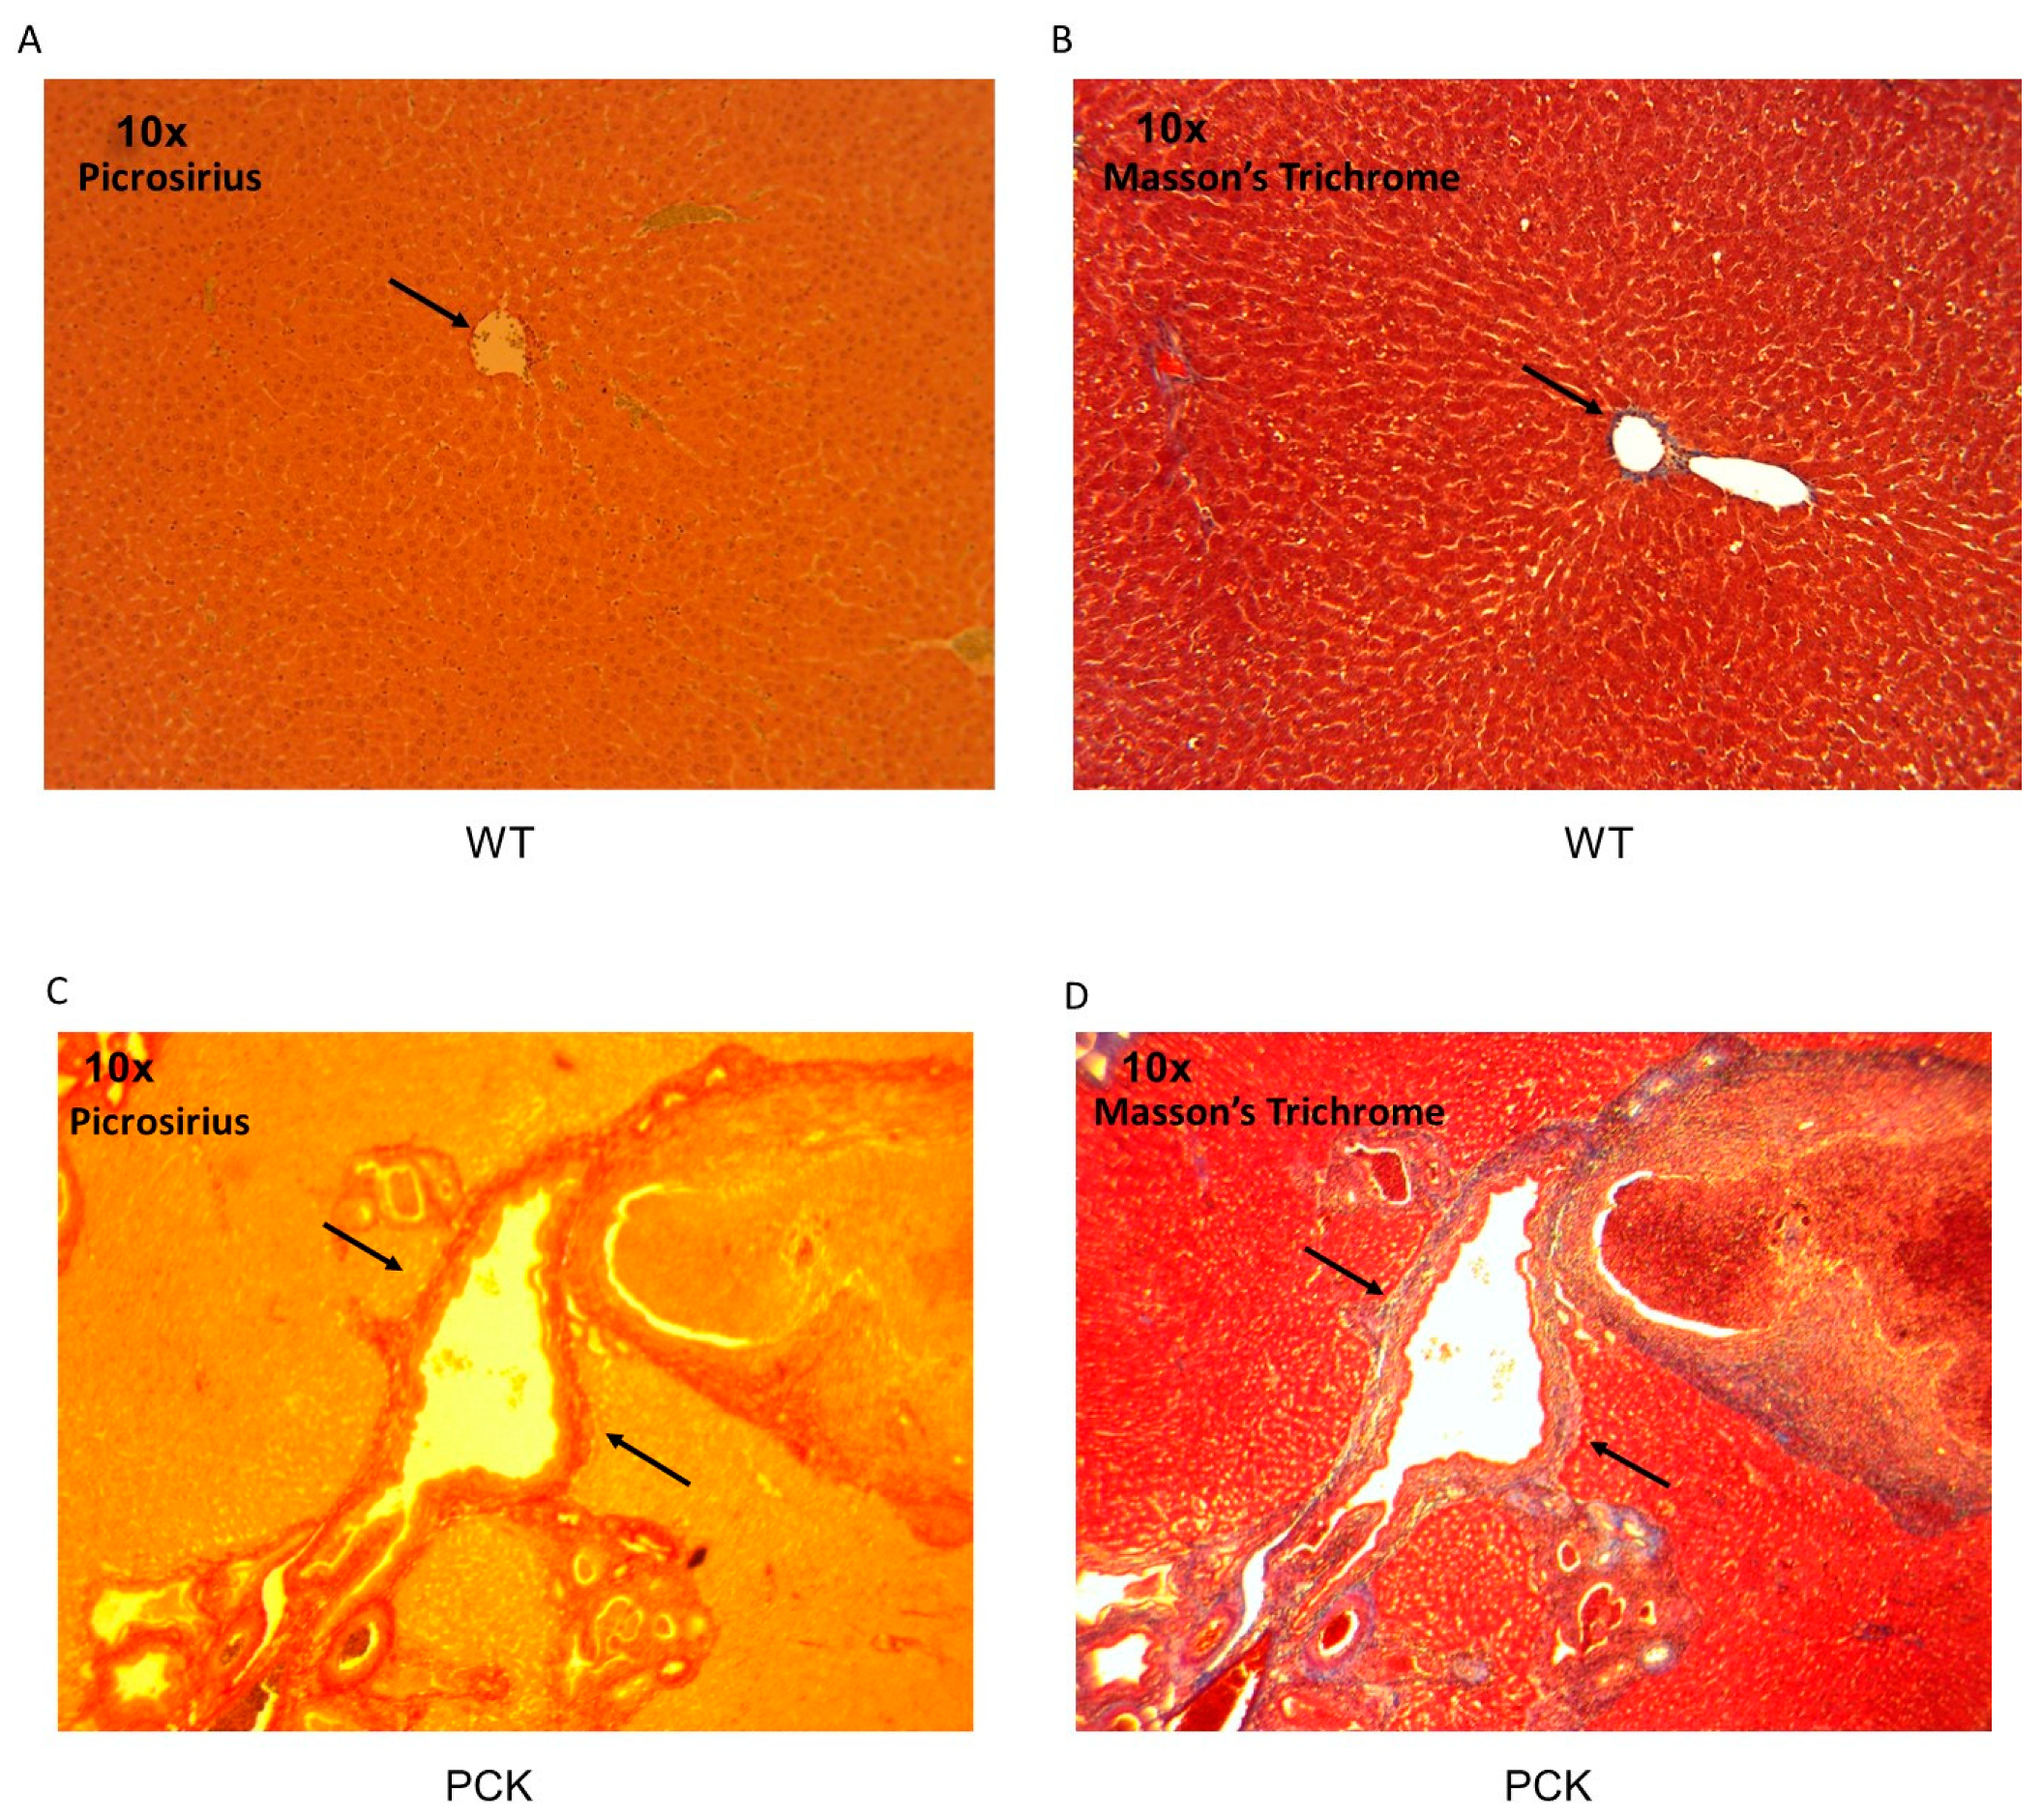
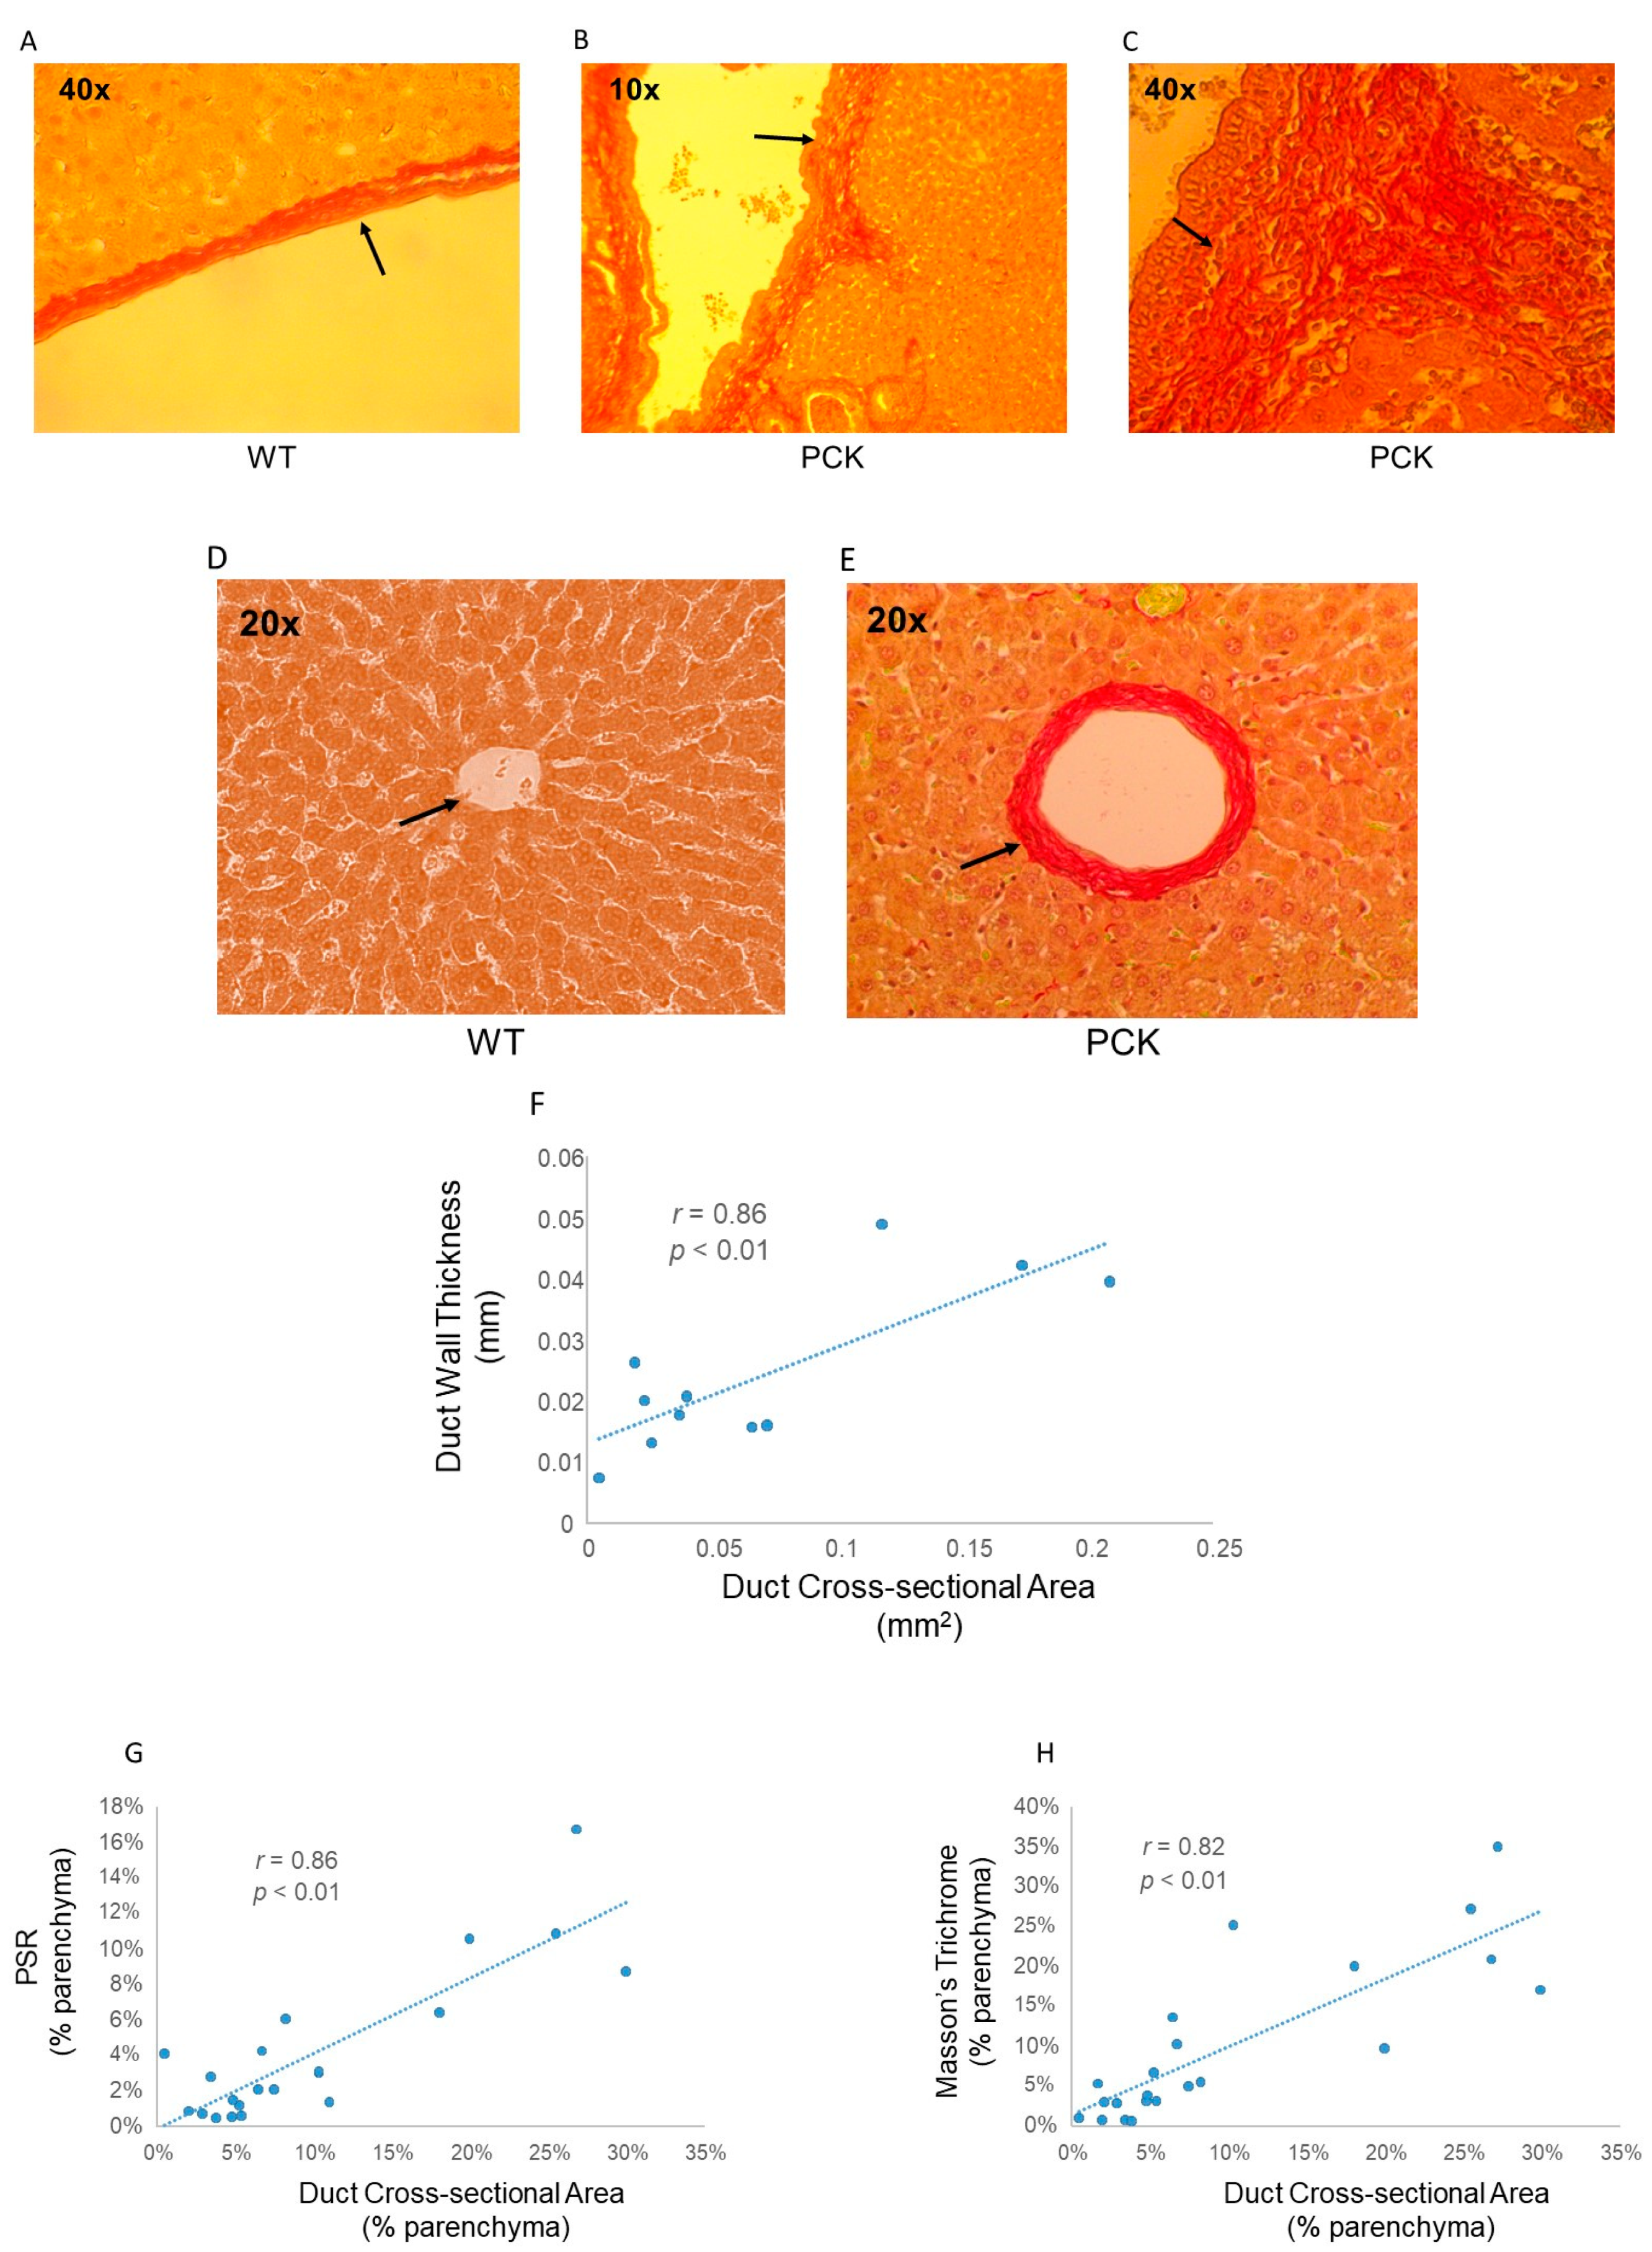
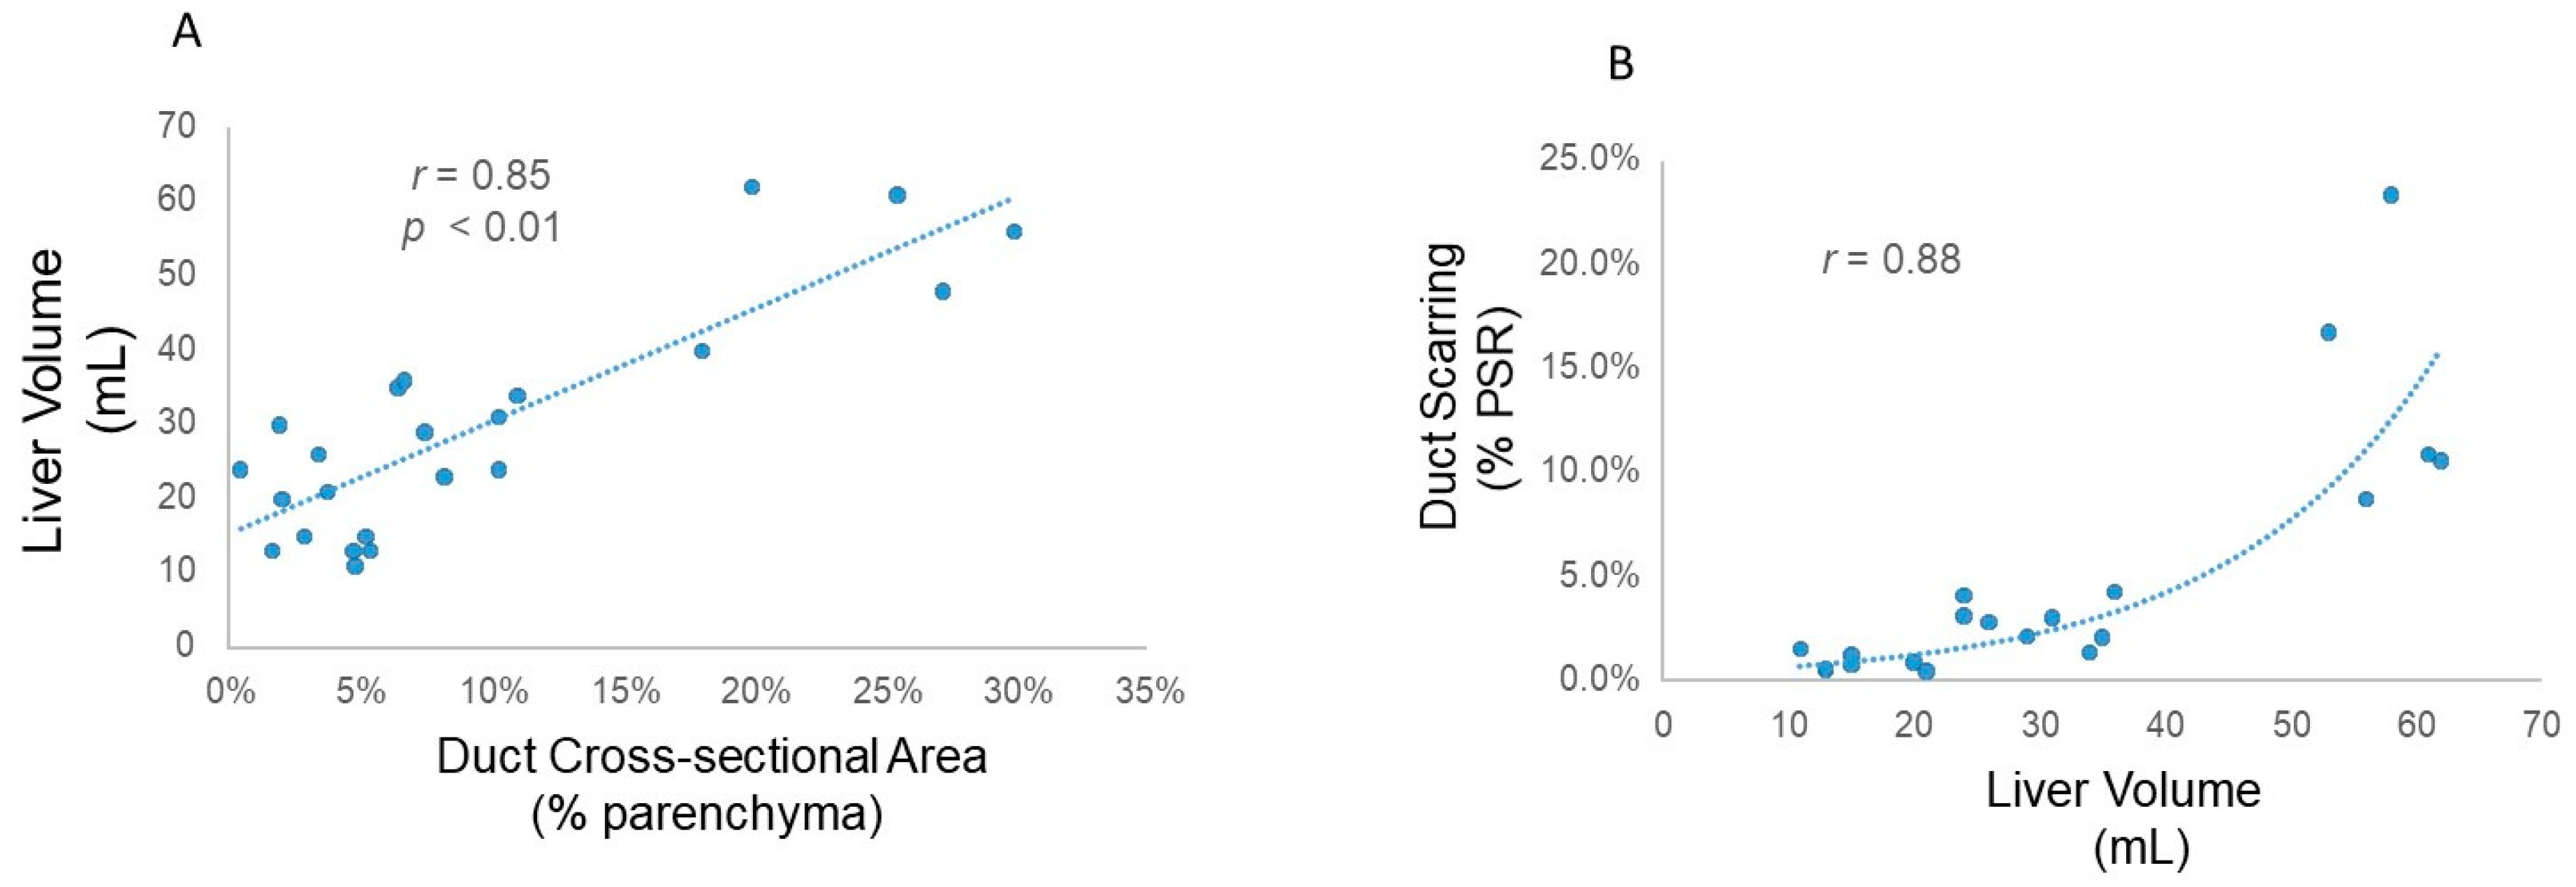
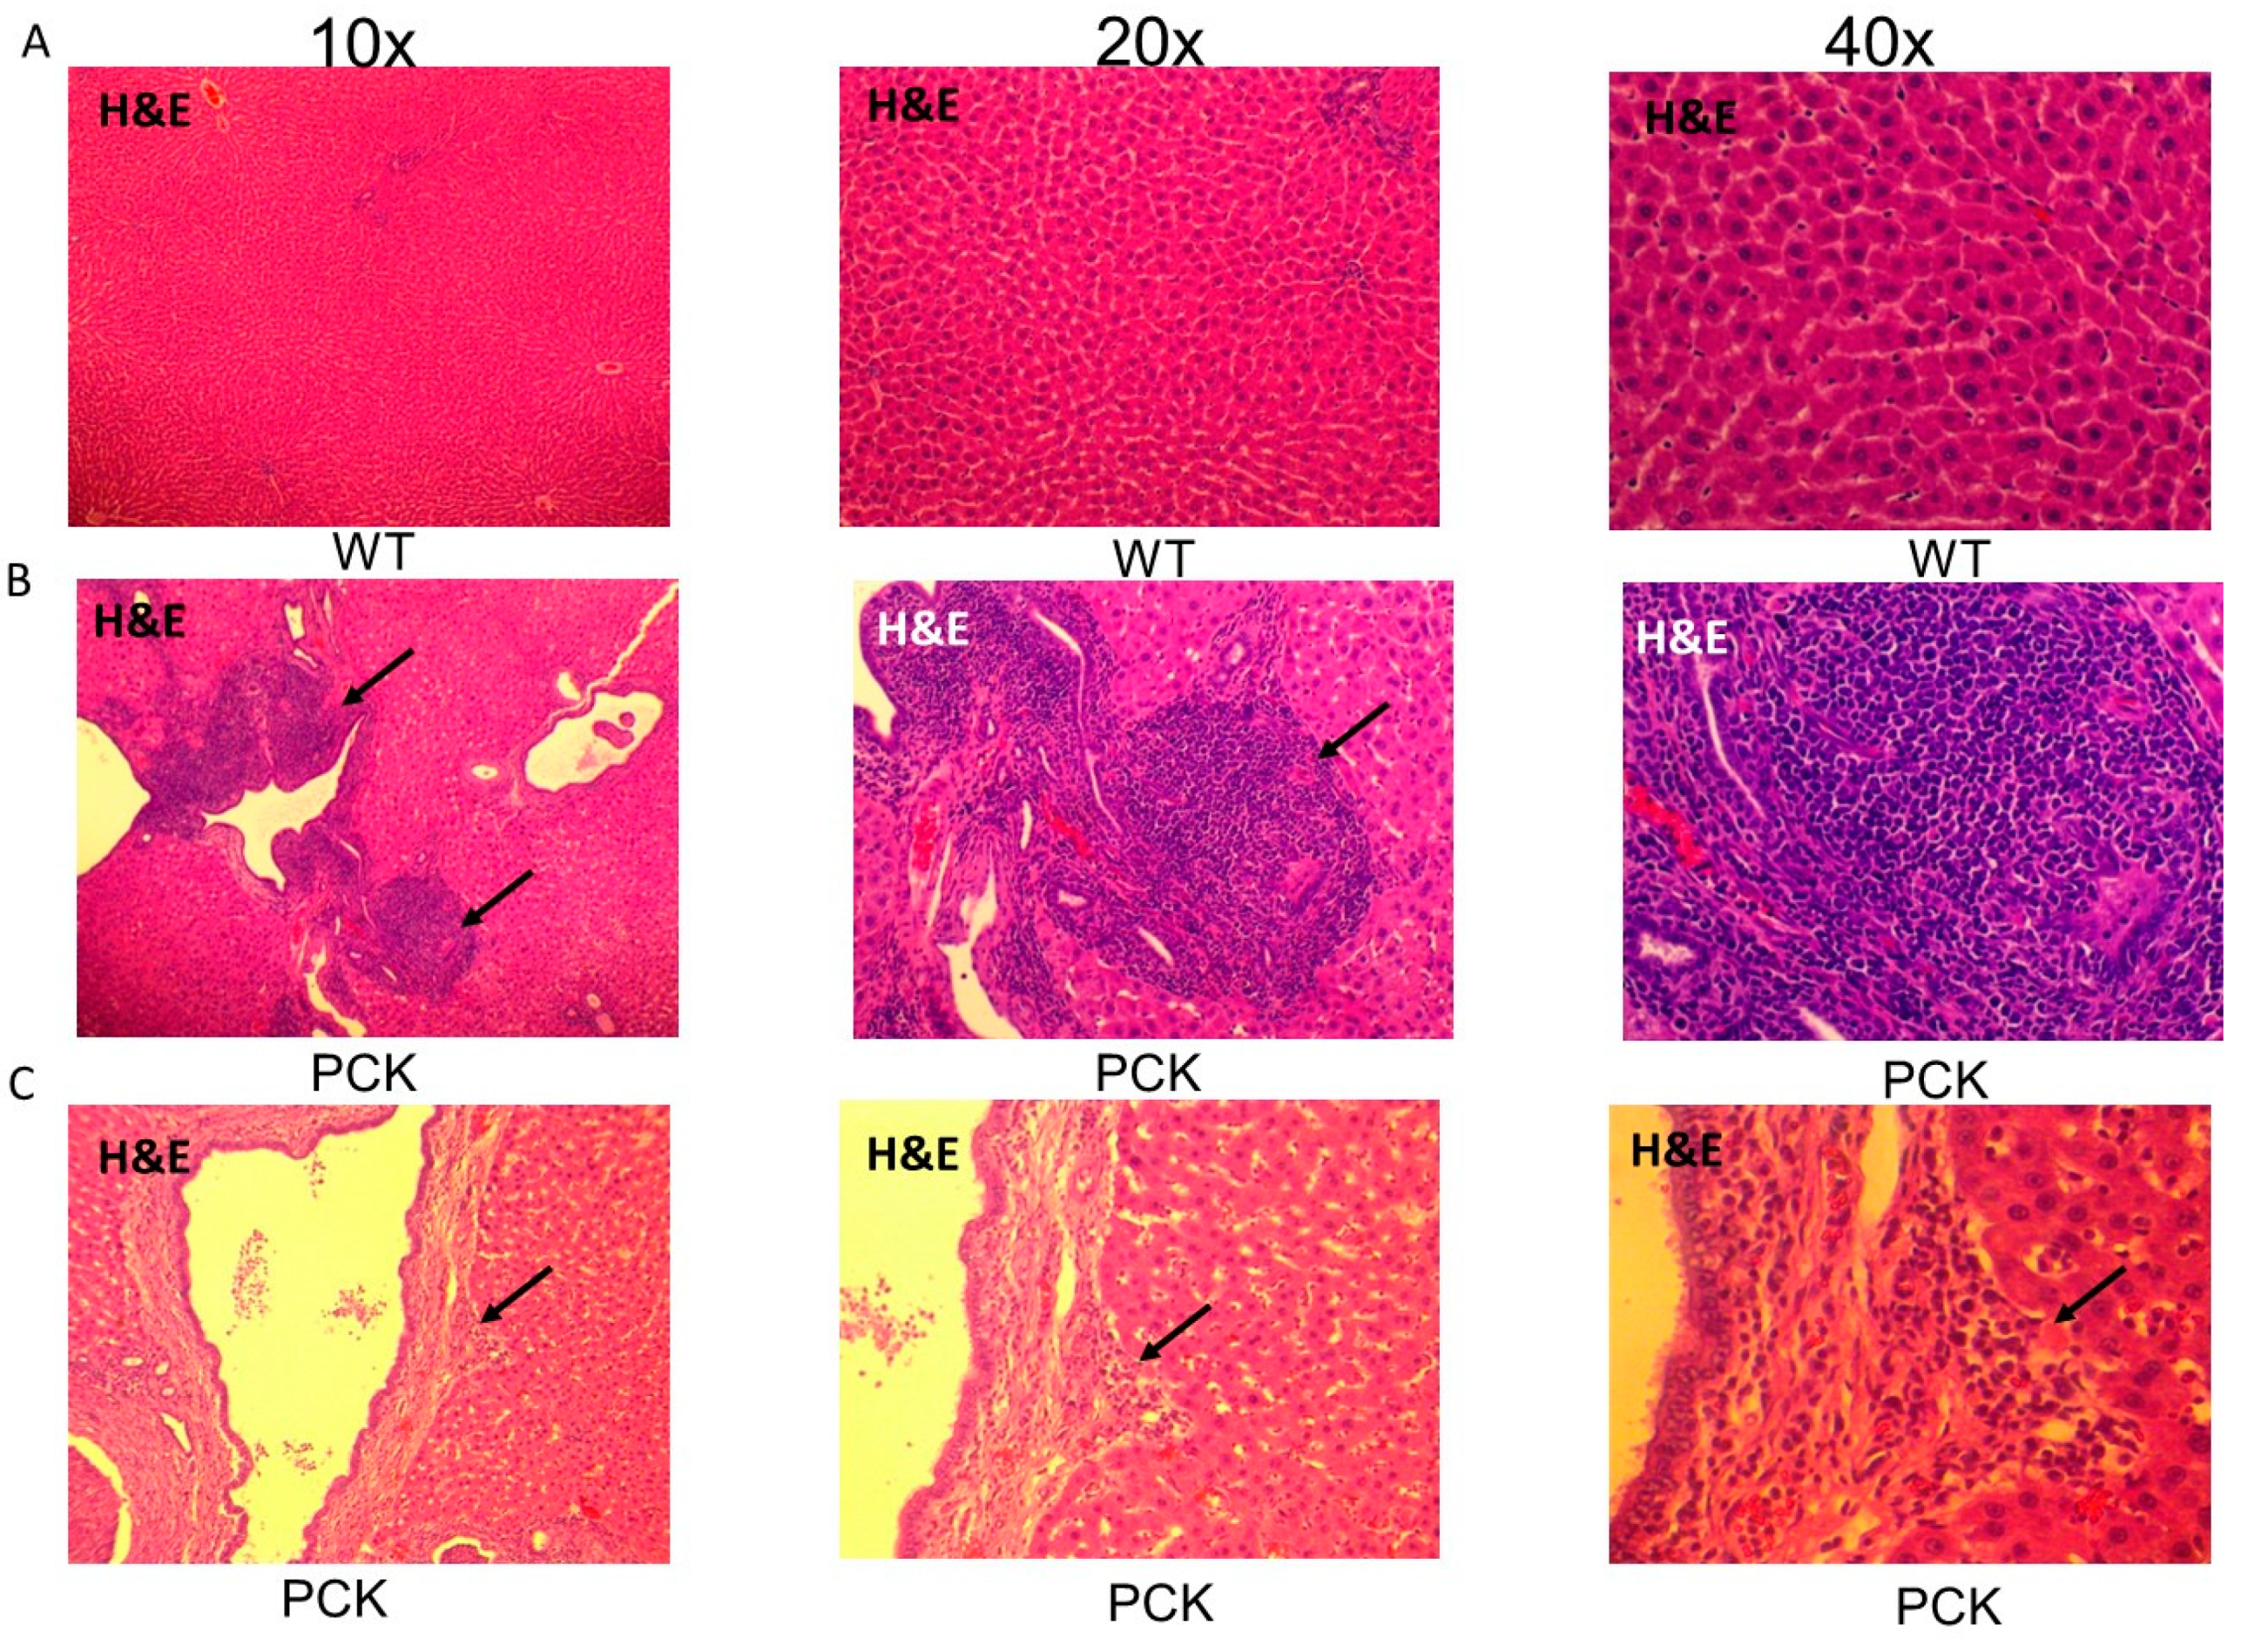
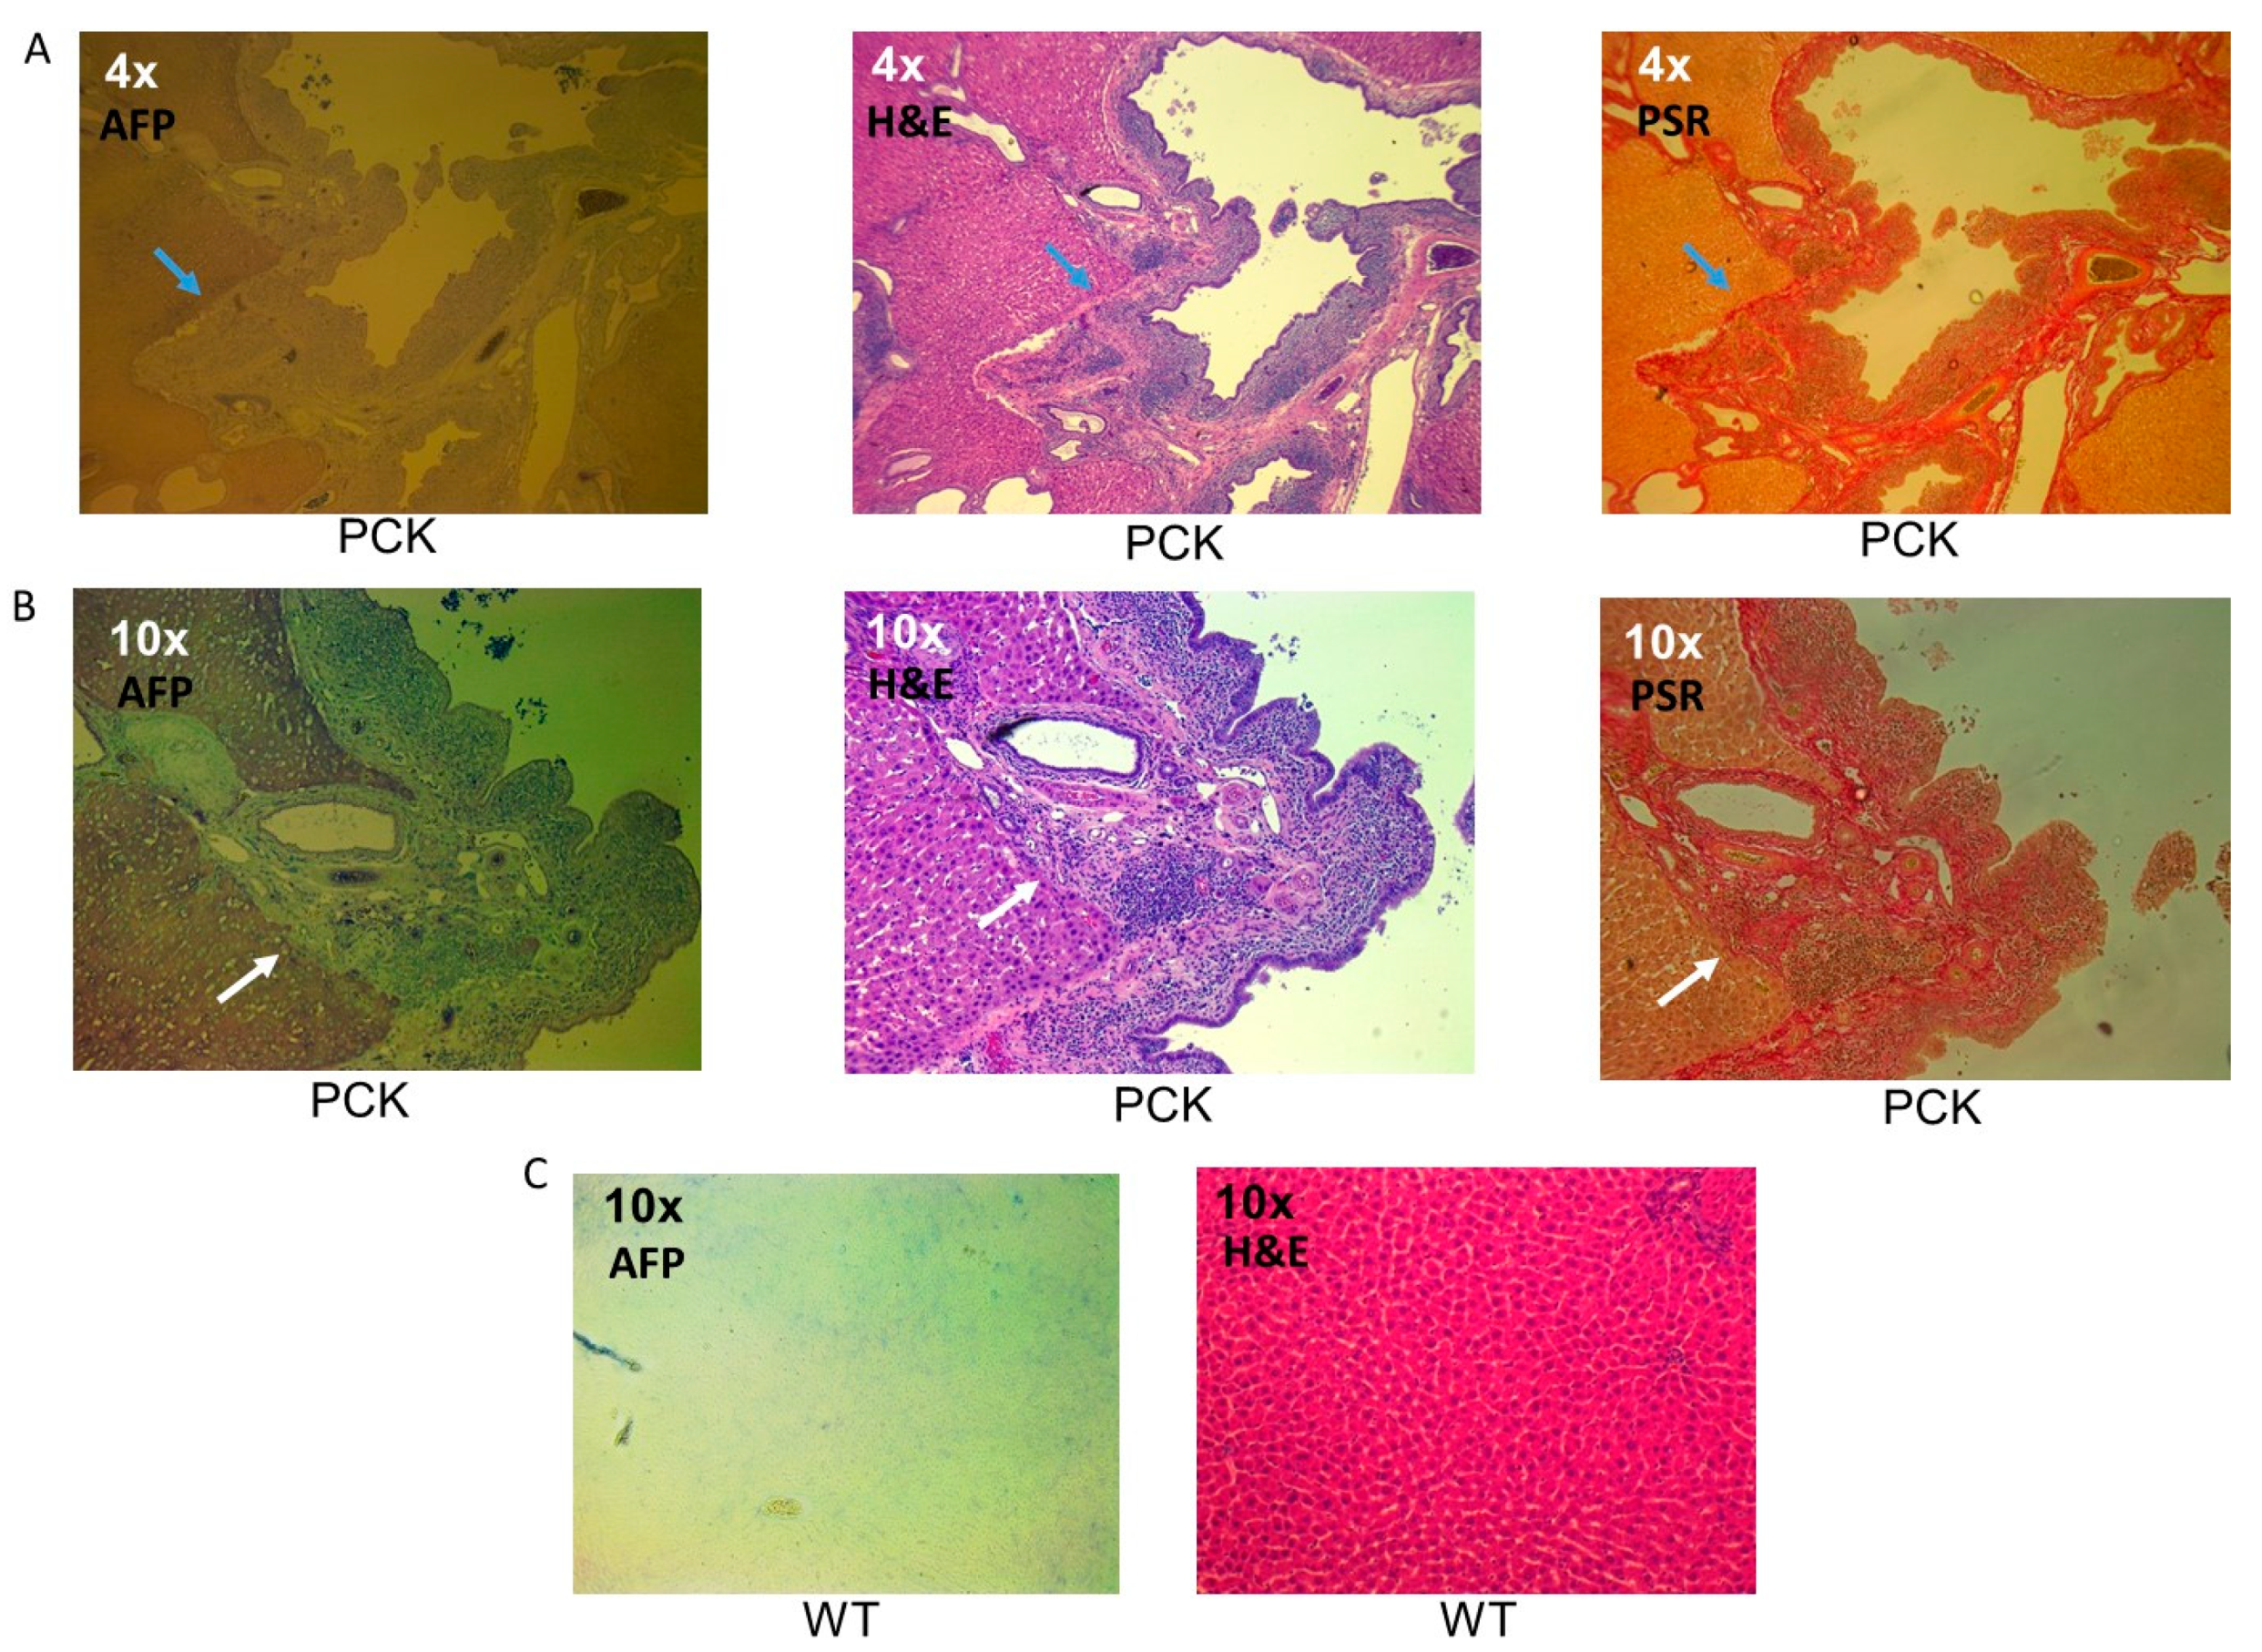
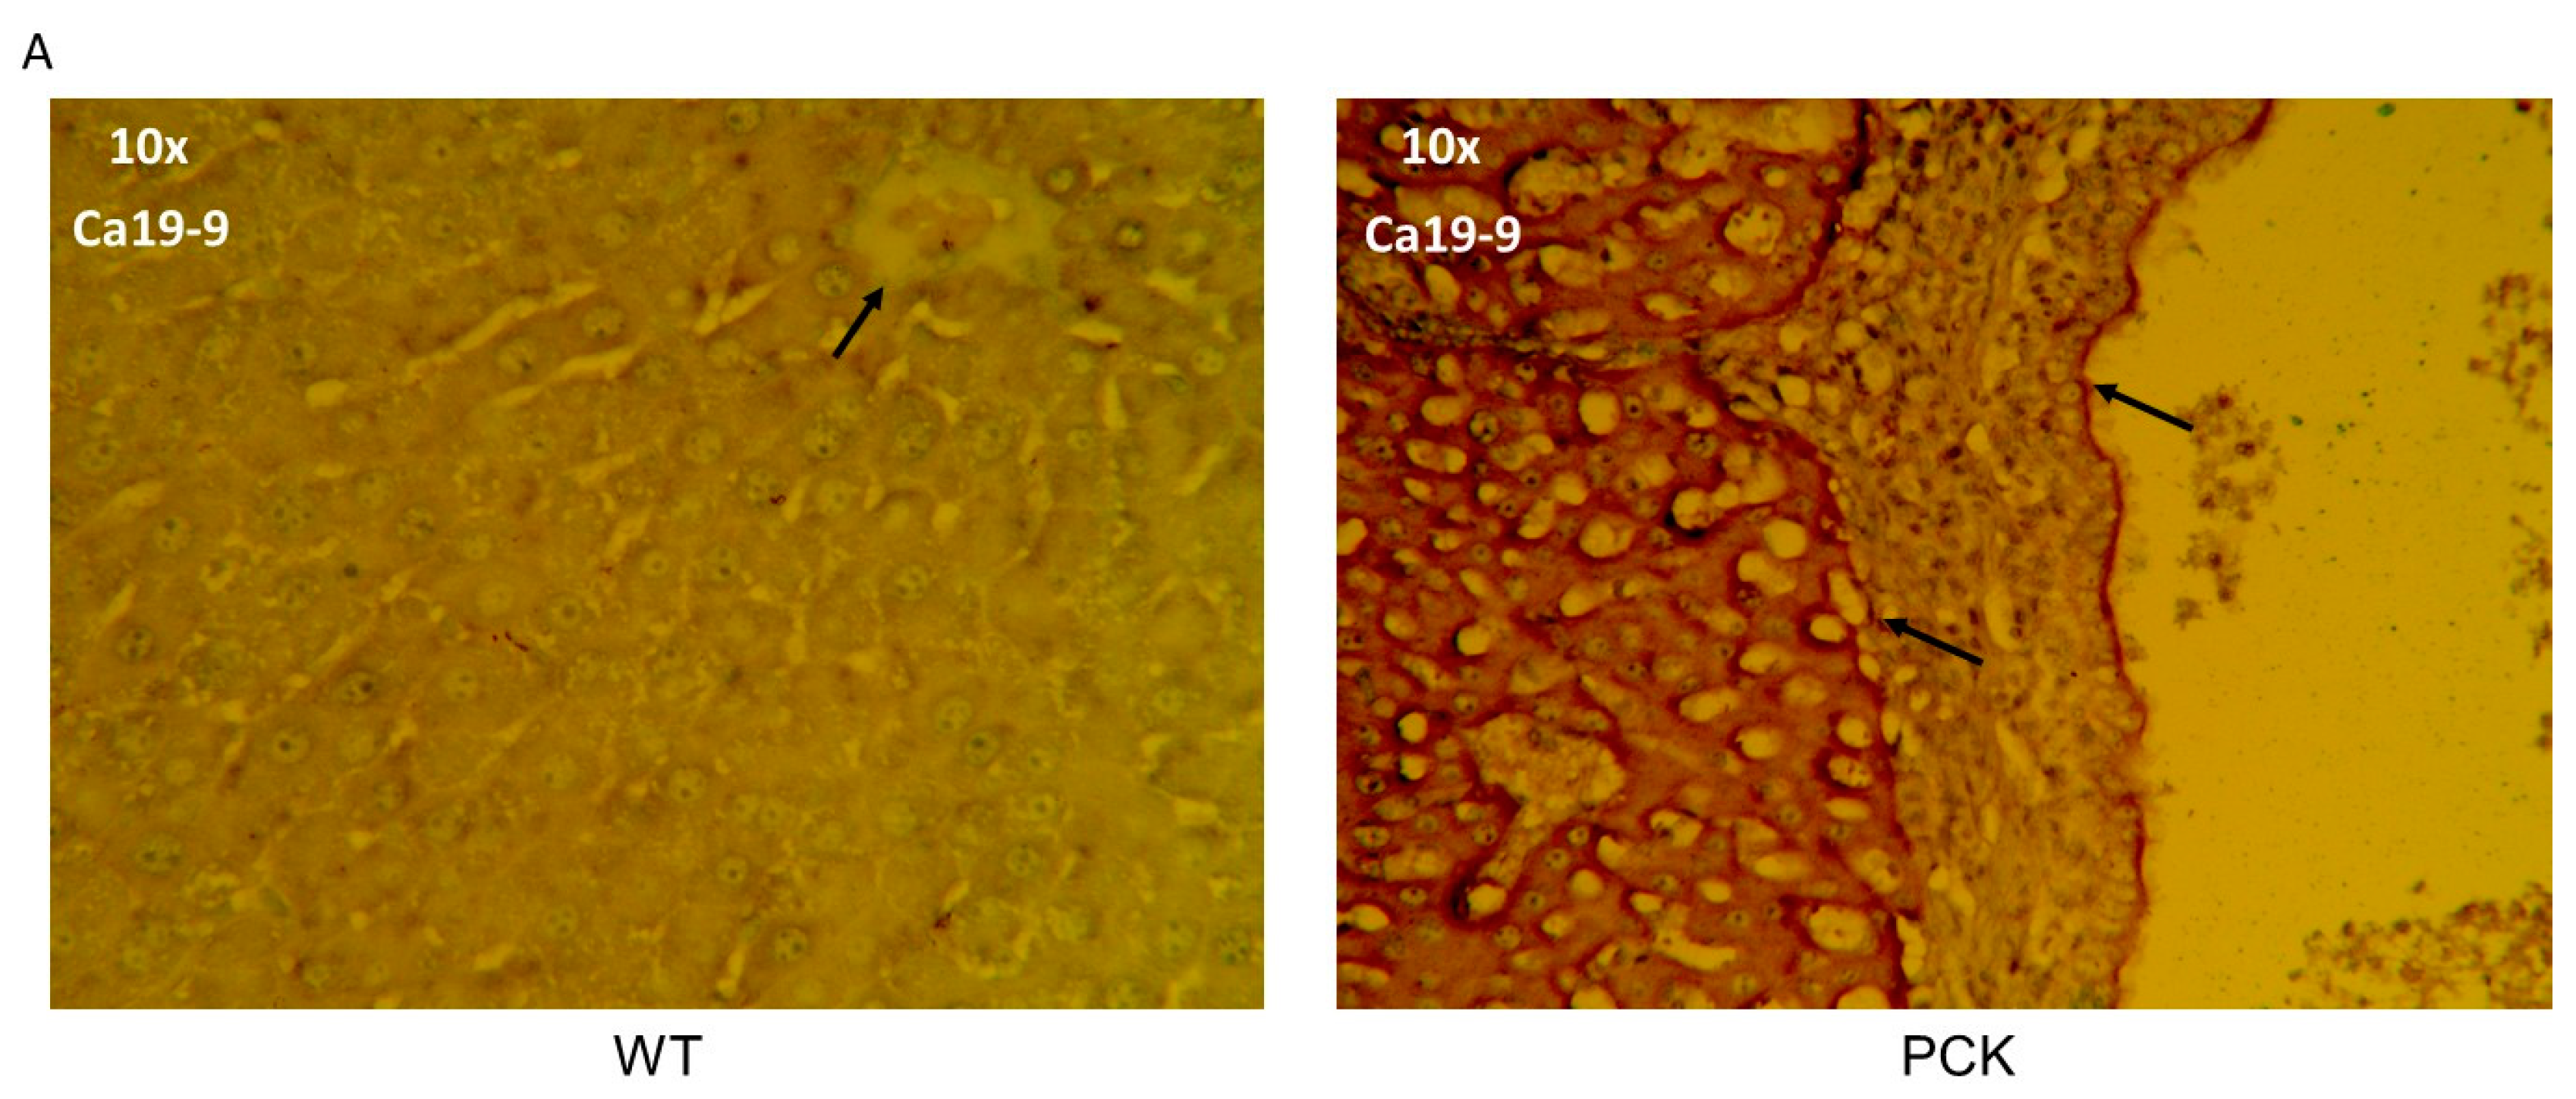
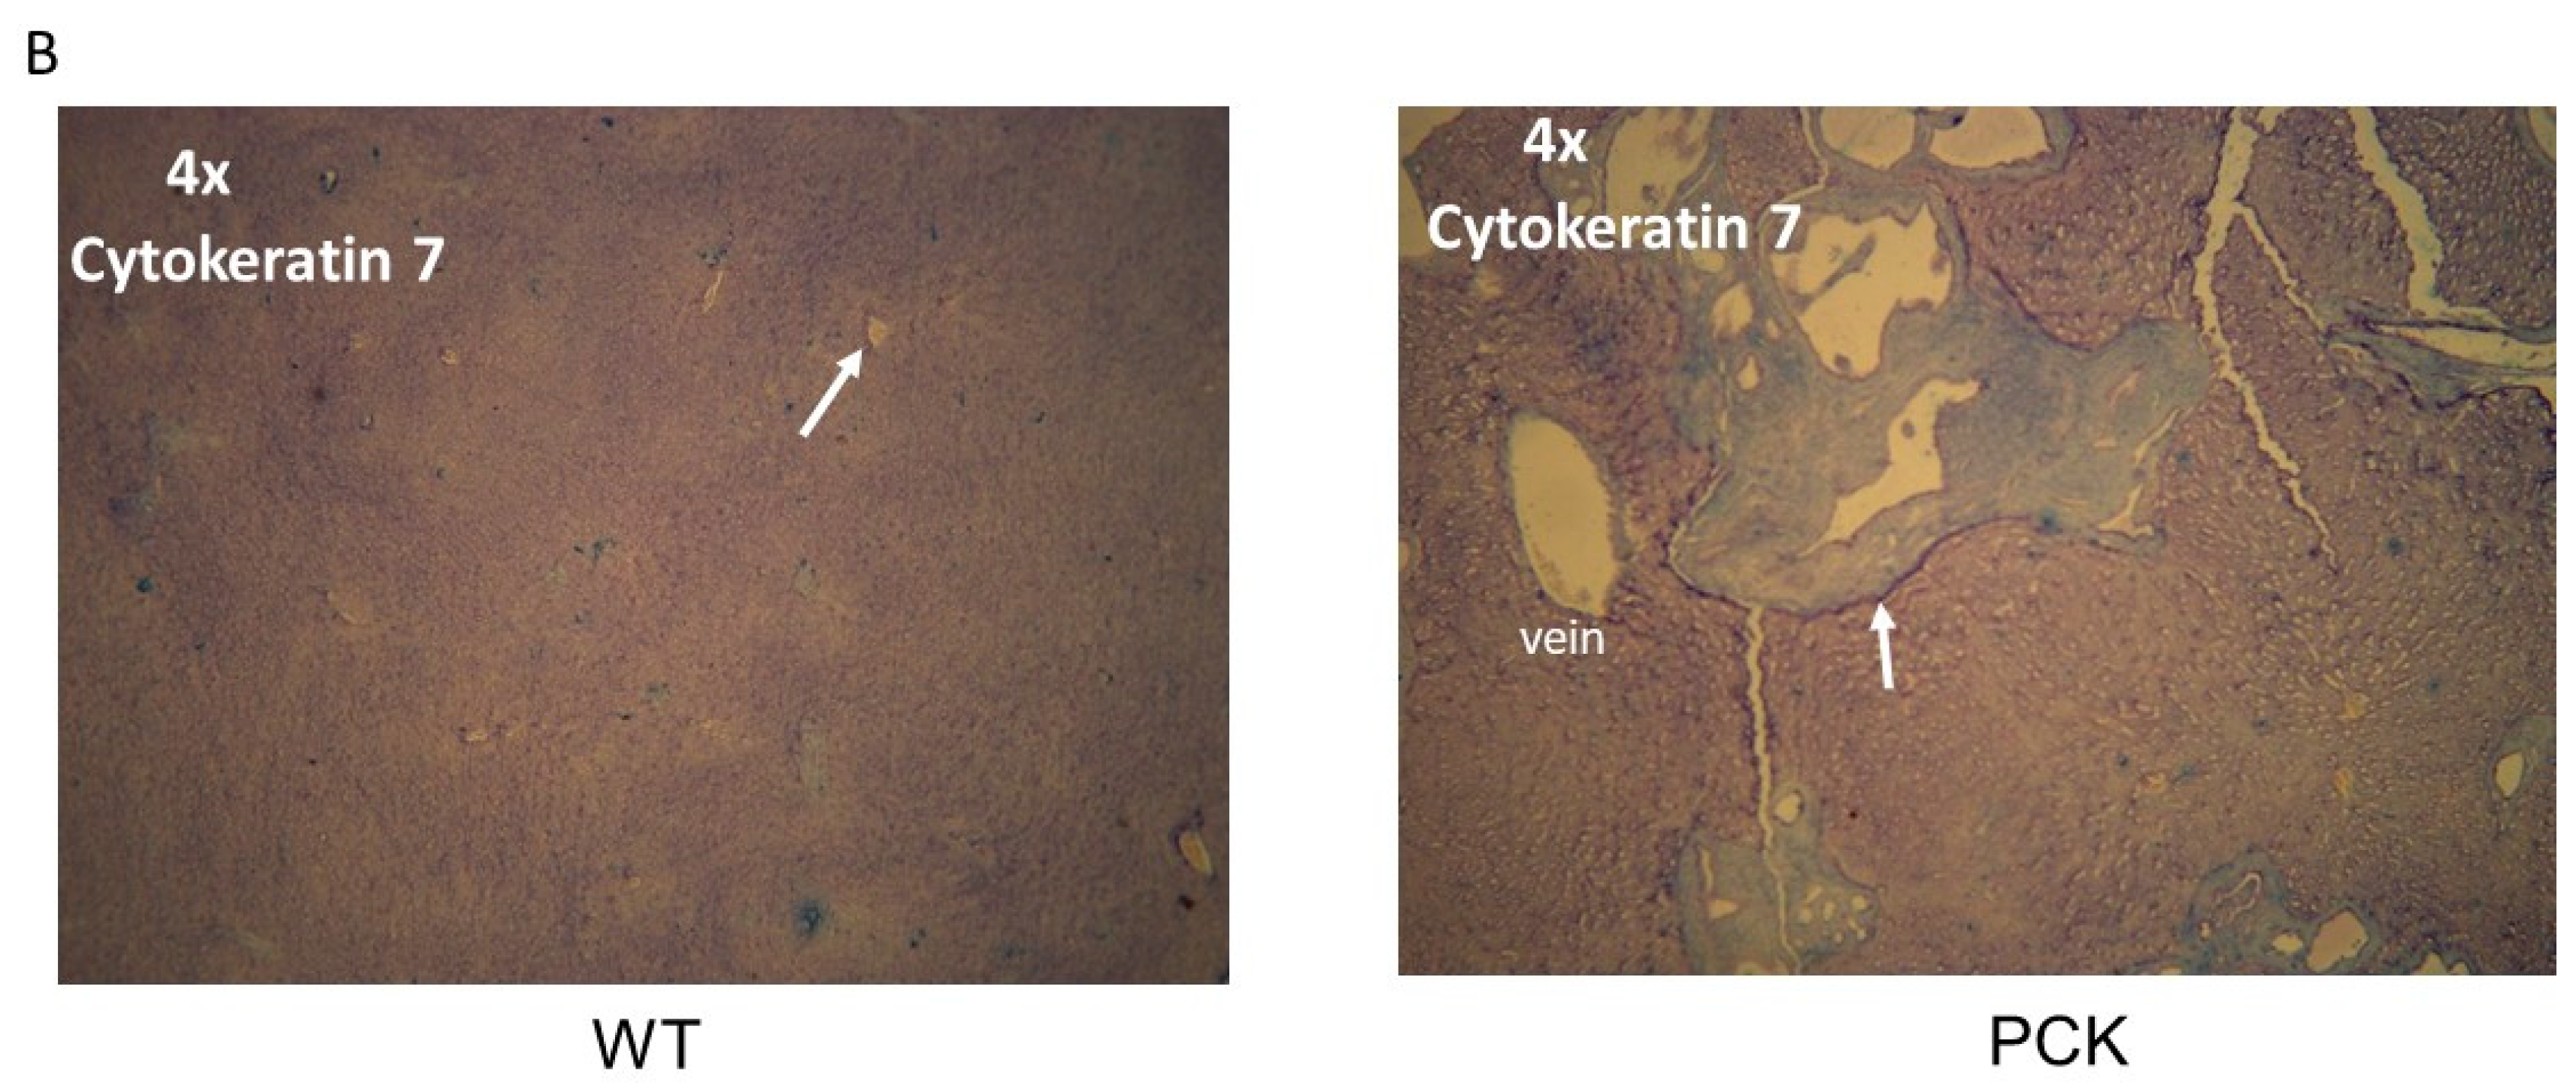
3. Results
4. Discussion
5. Conclusions
Author Contributions
Funding
Conflicts of Interest
References
- Schomerus, H.; Egberts, E. Caroli syndrome: The focal dilatation of intrahepatic bile ducts. Ergebnisse der inneren Medizin und Kinderheilkunde 1981, 46, 1. [Google Scholar]
- Sulkowski, U.; Meyer, J.; Bünte, H. Caroli syndrome. Clinical aspects–diagnosis–therapy. Zentralblatt fur Chirurgie 1988, 113, 351–356. [Google Scholar]
- Hoyer, P.F. Clinical manifestations of autosomal recessive polycystic kidney disease. Curr. Opin. Pediatr. 2015, 27, 186–192. [Google Scholar] [CrossRef]
- Ros, E.; Navarro, S.; Bru, C.; Gilabert, R.; Bianchi, L.; Bruguera, M. Ursodeoxycholic acid treatment of primary hepatolithiasis in Caroli’s syndrome. Lancet 1993, 342, 404–406. [Google Scholar] [CrossRef]
- Jain, D.; Nayak, N.C.; Saigal, S. Hepatocellular carcinoma arising in association with von-Meyenburg’s complexes: An incidental finding or precursor lesions? A clinicopatholigic study of 4 cases. Ann. Diagn. Pathol. 2010, 14, 317–320. [Google Scholar] [CrossRef] [PubMed]
- Kadakia, N.; Lobritto, S.J.; Ovchinsky, N.; Remotti, H.E.; Yamashiro, D.J.; Emond, J.C.; Martinez, M. A Challenging Case of Hepatoblastoma Concomitant with Autosomal Recessive Polycystic Kidney Disease and Caroli Syndrome—Review of the Literature. Front. Pediatr. 2017, 5, 114. [Google Scholar] [CrossRef]
- Jang, M.H.; Lee, Y.J.; Kim, H. Intrahepatic cholangiocarcinoma arising in Caroli’s disease. Clin. Mol. Hepatol. 2014, 20, 402–405. [Google Scholar] [CrossRef] [PubMed]
- Telega, G.; Cronin, D.; Avner, E.D. New approaches to the autosomal recessive polycystic kidney disease patient with dual kidney–liver complications. Pediatr. Transplant. 2013, 17, 328–335. [Google Scholar] [CrossRef] [PubMed]
- Sans, M.; Rimola, A.; Navasa, M.; Grande, L.; García-Valdecasas, J.C.; Andreu, H.; Salmeron, J.M.; Mas, A.; Rodés, J. Liver transplantation in patients with Caroli’s disease and recurrent cholangitis. Transpl. Int. 1997, 10, 241–244. [Google Scholar] [PubMed]
- Mabrut, J.-Y.; Kianmanesh, R.; Nuzzo, G.; Castaing, D.; Boudjema, K.; Létoublon, C.; Adham, M.; Ducerf, C.; Pruvot, F.R.; Meurisse, N.; et al. Surgical management of congenital intrahepatic bile duct dilatation, Caroli’s disease and syndrome: Long-term results of the French Association of Surgery Multicenter Study. Ann. Surg. 2013, 258, 713–721. [Google Scholar] [CrossRef]
- Fahrner, R.; Dennler, S.; Dondorf, F.; Ardelt, M.; Rauchfuss, F.; Settmacher, U. Liver resection and transplantation in Caroli disease and syndrome. J. Visc. Surg. 2018. [Google Scholar] [CrossRef]
- National Institute of Health. Available online: https://rarediseases.info.nih.gov/diseases/6002/caroli-disease (accessed on 3 October 2019).
- Kelly, K.; Zhang, J.; Han, L.; Kamocka, M.; Miller, C.; Gattone, V.H., II; Dominguez, J.H. Improved structure and function in autosomal recessive polycystic rat kidneys with renal tubular cell therapy. PLoS ONE 2015, 10, e0131677. [Google Scholar] [CrossRef] [PubMed]
- Nieto, J.A.; Yamin, M.A.; Goldberg, I.D.; Narayan, P. An Empirical Biomarker-Based Calculator for Cystic Index in a Model of Autosomal Recessive Polycystic Kidney Disease—The Nieto-Narayan Formula. PLoS ONE 2016, 11, e0163063. [Google Scholar] [CrossRef]
- Sanzen, T.; Harada, K.; Yasoshima, M.; Kawamura, Y.; Ishibashi, M.; Nakanuma, Y. Polycystic kidney rat is a novel animal model of Caroli’s disease associated with congenital hepatic fibrosis. Am. J. Pathol. 2001, 158, 1605–1612. [Google Scholar] [CrossRef]
- Sato, Y.; Harada, K.; Kizawa, K.; Sanzen, T.; Furubo, S.; Yasoshima, M.; Ozaki, S.; Ishibashi, M.; Nakanuma, Y. Activation of the MEK5/ERK5 cascade is responsible for biliary dysgenesis in a rat model of Caroli’s disease. Am. J. Pathol. 2005, 166, 49–60. [Google Scholar] [CrossRef]
- Hwang, A.; Shi, C.; Zhu, E.; Naaz, F.; Zhou, P.; Rasheed, Z.; Liu, M.; Jung, L.S.; Duan, B.; Li, J. Supervised learning reveals circulating biomarker levels diagnostic of hepatocellular carcinoma in a clinically relevant model of non-alcoholic steatohepatitis; an OAD to NASH. PLoS ONE. 2018, 13, e0198937. [Google Scholar] [CrossRef]
- Arifin, K.T.; Sulaiman, S.; Saad, S.M.; Damanhuri, H.A.; Ngah, W.Z.W.; Yusof, Y.A.M. Elevation of tumour markers TGF-β, M 2-PK, OV-6 and AFP in hepatocellular carcinoma (HCC)-induced rats and their suppression by microalgae Chlorella vulgaris. BMC Cancer 2017, 17, 879. [Google Scholar]
- Chu, P.; Wu, E.; Weiss, L.M. Cytokeratin 7 and cytokeratin 20 expression in epithelial neoplasms: A survey of 435 cases. Mod. Pathol. 2000, 13, 962–972. [Google Scholar] [CrossRef]
- Rizvi, S.; Gores, G.J. Pathogenesis, diagnosis, and management of cholangiocarcinoma. Gastroenterology 2013, 145, 1215–1229. [Google Scholar] [CrossRef] [PubMed]
- Social Science Statistics. Available online: https://www.socscistatistics.com/pvalues/pearsondistribution.aspx (accessed on 3 November 2019).
- PKD Foundation. Available online: https://pkdcure.org/ (accessed on 3 October 2019).
- Huang, B.; Paka, P.; McCormack, S.; Zhou, P.; Paka, L.; Yamin, M.; Goldberg, I.D.; Narayan, P. A Biomarker Cluster for Polycystic Kidney Disease: Correlation with Cystic Index. Recent Pat. Biomark. 2015, 5, 35–43. [Google Scholar] [CrossRef]
- Ren, X.S.; Sato, Y.; Harada, K.; Sasaki, M.; Yoneda, N.; Lin, Z.H.; Nakanuma, Y. Biliary infection may exacerbate biliary cystogenesis through the induction of VEGF in cholangiocytes of the polycystic kidney (PCK) rat. Am. J. Pathol. 2011, 179, 2845–2854. [Google Scholar] [CrossRef] [PubMed]
- Correia, P.C.; Morgado, B. Caroli’s Disease as a Cause of Chronic Epigastric Abdominal Pain: Two Case Reports and a Brief Review of the Literature. Cureus 2017, 9, e1701. [Google Scholar] [CrossRef]
- Lee, L.C.; Zhihong, Z.; Hinson, A.; Guccione, J.M. Reduction in left ventricular wall stress and improvement in function in failing hearts using Algisyl-LVR. J. Vis. Exp. JoVE 2013, 74. [Google Scholar] [CrossRef]
- Sakurai, T.; Kudo, M. Molecular link between liver fibrosis and hepatocellular carcinoma. Liver Cancer 2013, 2, 365–366. [Google Scholar] [CrossRef]
- Bobba, R.K.; Holly, J.S.; Loy, T.; Perry, M.C. Scar carcinoma of the lung: A historical perspective. Clin. Lung Cancer 2011, 12, 148–154. [Google Scholar] [CrossRef]
- Gao, F.; Ge, X.; Li, M.; Zheng, X.; Xiao, L.; Zhang, G.; Hua, Y. CT features of lung scar cancer. J. Thorac. Dis. 2015, 7, 273–280. [Google Scholar]


© 2019 by the authors. Licensee MDPI, Basel, Switzerland. This article is an open access article distributed under the terms and conditions of the Creative Commons Attribution (CC BY) license (http://creativecommons.org/licenses/by/4.0/).
Share and Cite
Chavre, B.M.; Jiang, K.; St. Surin, L.G.; Bissoondial, T.; Zhou, P.; Li, J.; Gadhiya, S.V.; Goldberg, I.D.; Narayan, P. Remodeling of Intrahepatic Ducts in a Model of Caroli Syndrome: Is Scar Carcinoma a Consequence of Laplace’s Law? Med. Sci. 2019, 7, 55. https://0-doi-org.brum.beds.ac.uk/10.3390/medsci7040055
Chavre BM, Jiang K, St. Surin LG, Bissoondial T, Zhou P, Li J, Gadhiya SV, Goldberg ID, Narayan P. Remodeling of Intrahepatic Ducts in a Model of Caroli Syndrome: Is Scar Carcinoma a Consequence of Laplace’s Law? Medical Sciences. 2019; 7(4):55. https://0-doi-org.brum.beds.ac.uk/10.3390/medsci7040055
Chicago/Turabian StyleChavre, Bharvi M., Kai Jiang, Luce G. St. Surin, Terrence Bissoondial, Ping Zhou, Jingsong Li, Satishkumar V. Gadhiya, Itzhak D. Goldberg, and Prakash Narayan. 2019. "Remodeling of Intrahepatic Ducts in a Model of Caroli Syndrome: Is Scar Carcinoma a Consequence of Laplace’s Law?" Medical Sciences 7, no. 4: 55. https://0-doi-org.brum.beds.ac.uk/10.3390/medsci7040055