Pilot-Scale Demonstration of Membrane-Based Nitrogen Recovery from Swine Manure

Abstract
:
1. Introduction
2. Materials and Methods
2.1. Location of the Pilot Plant and Origin of Manure
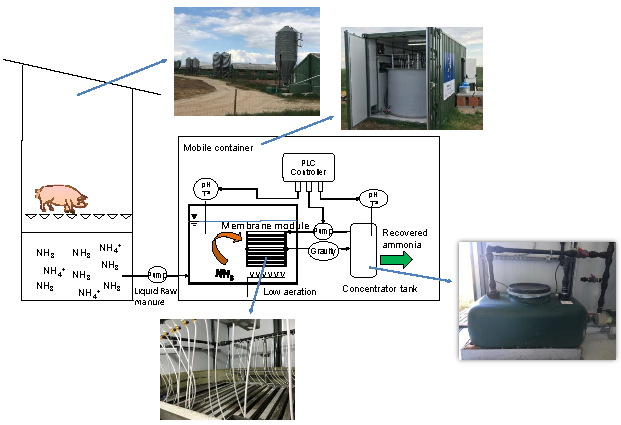
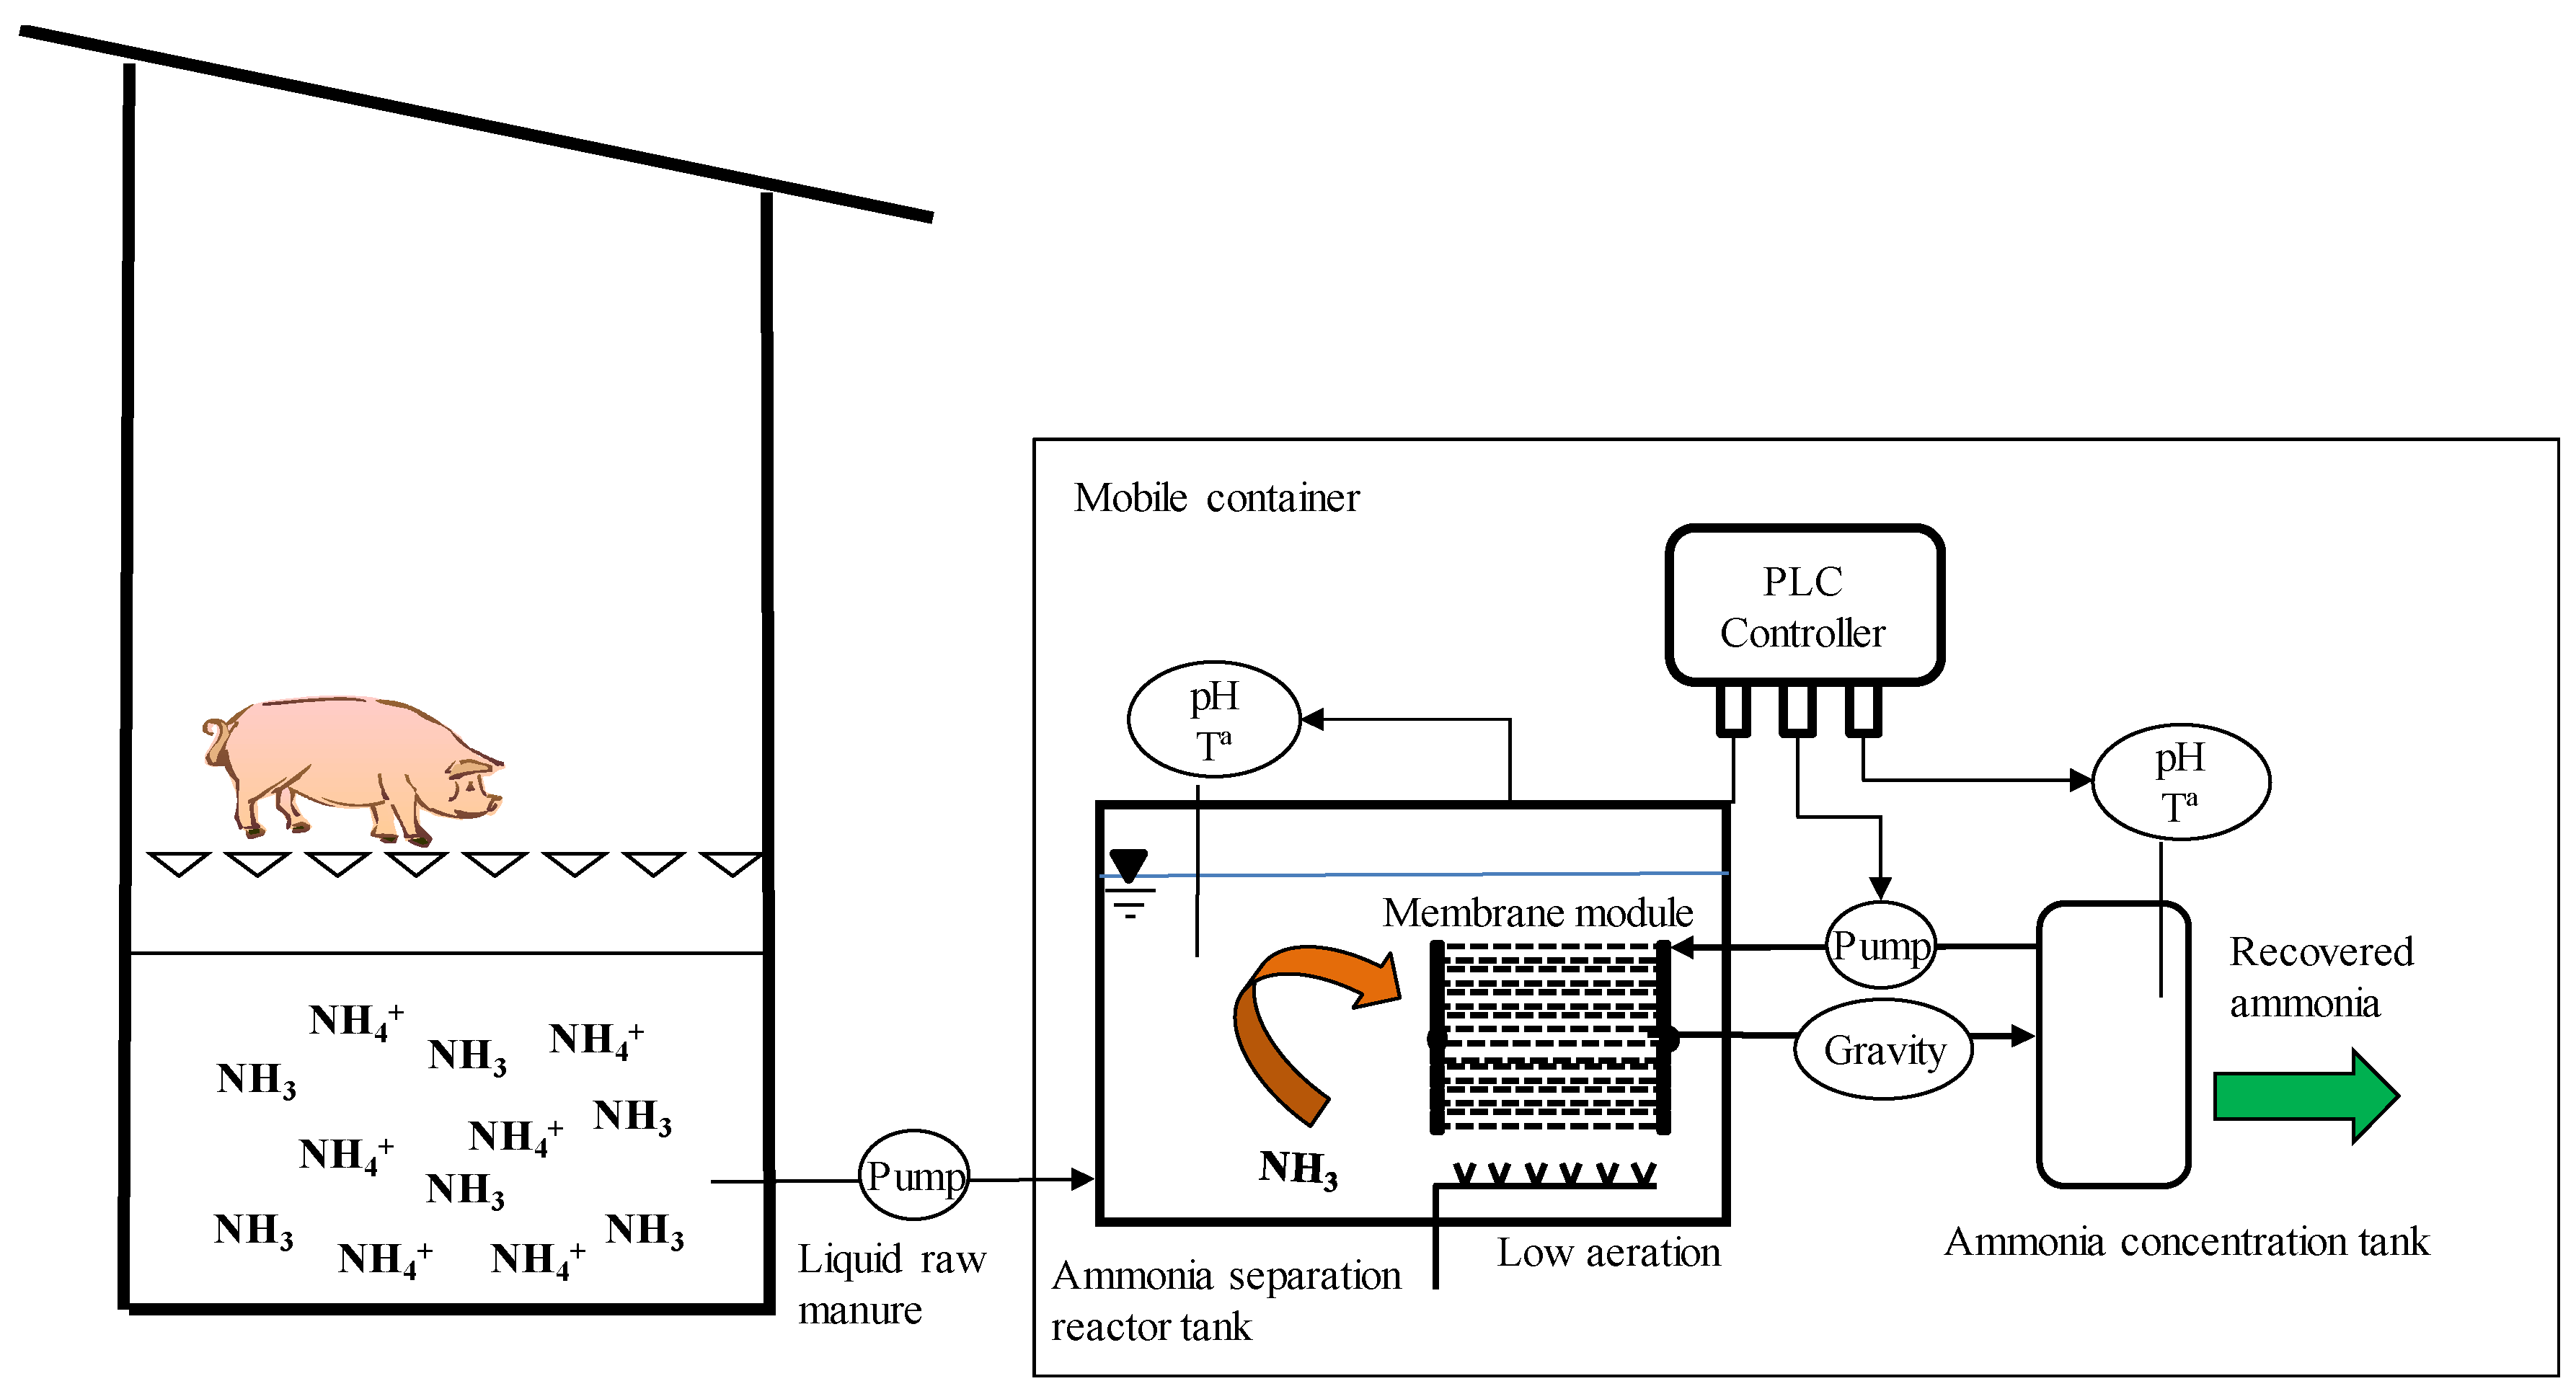
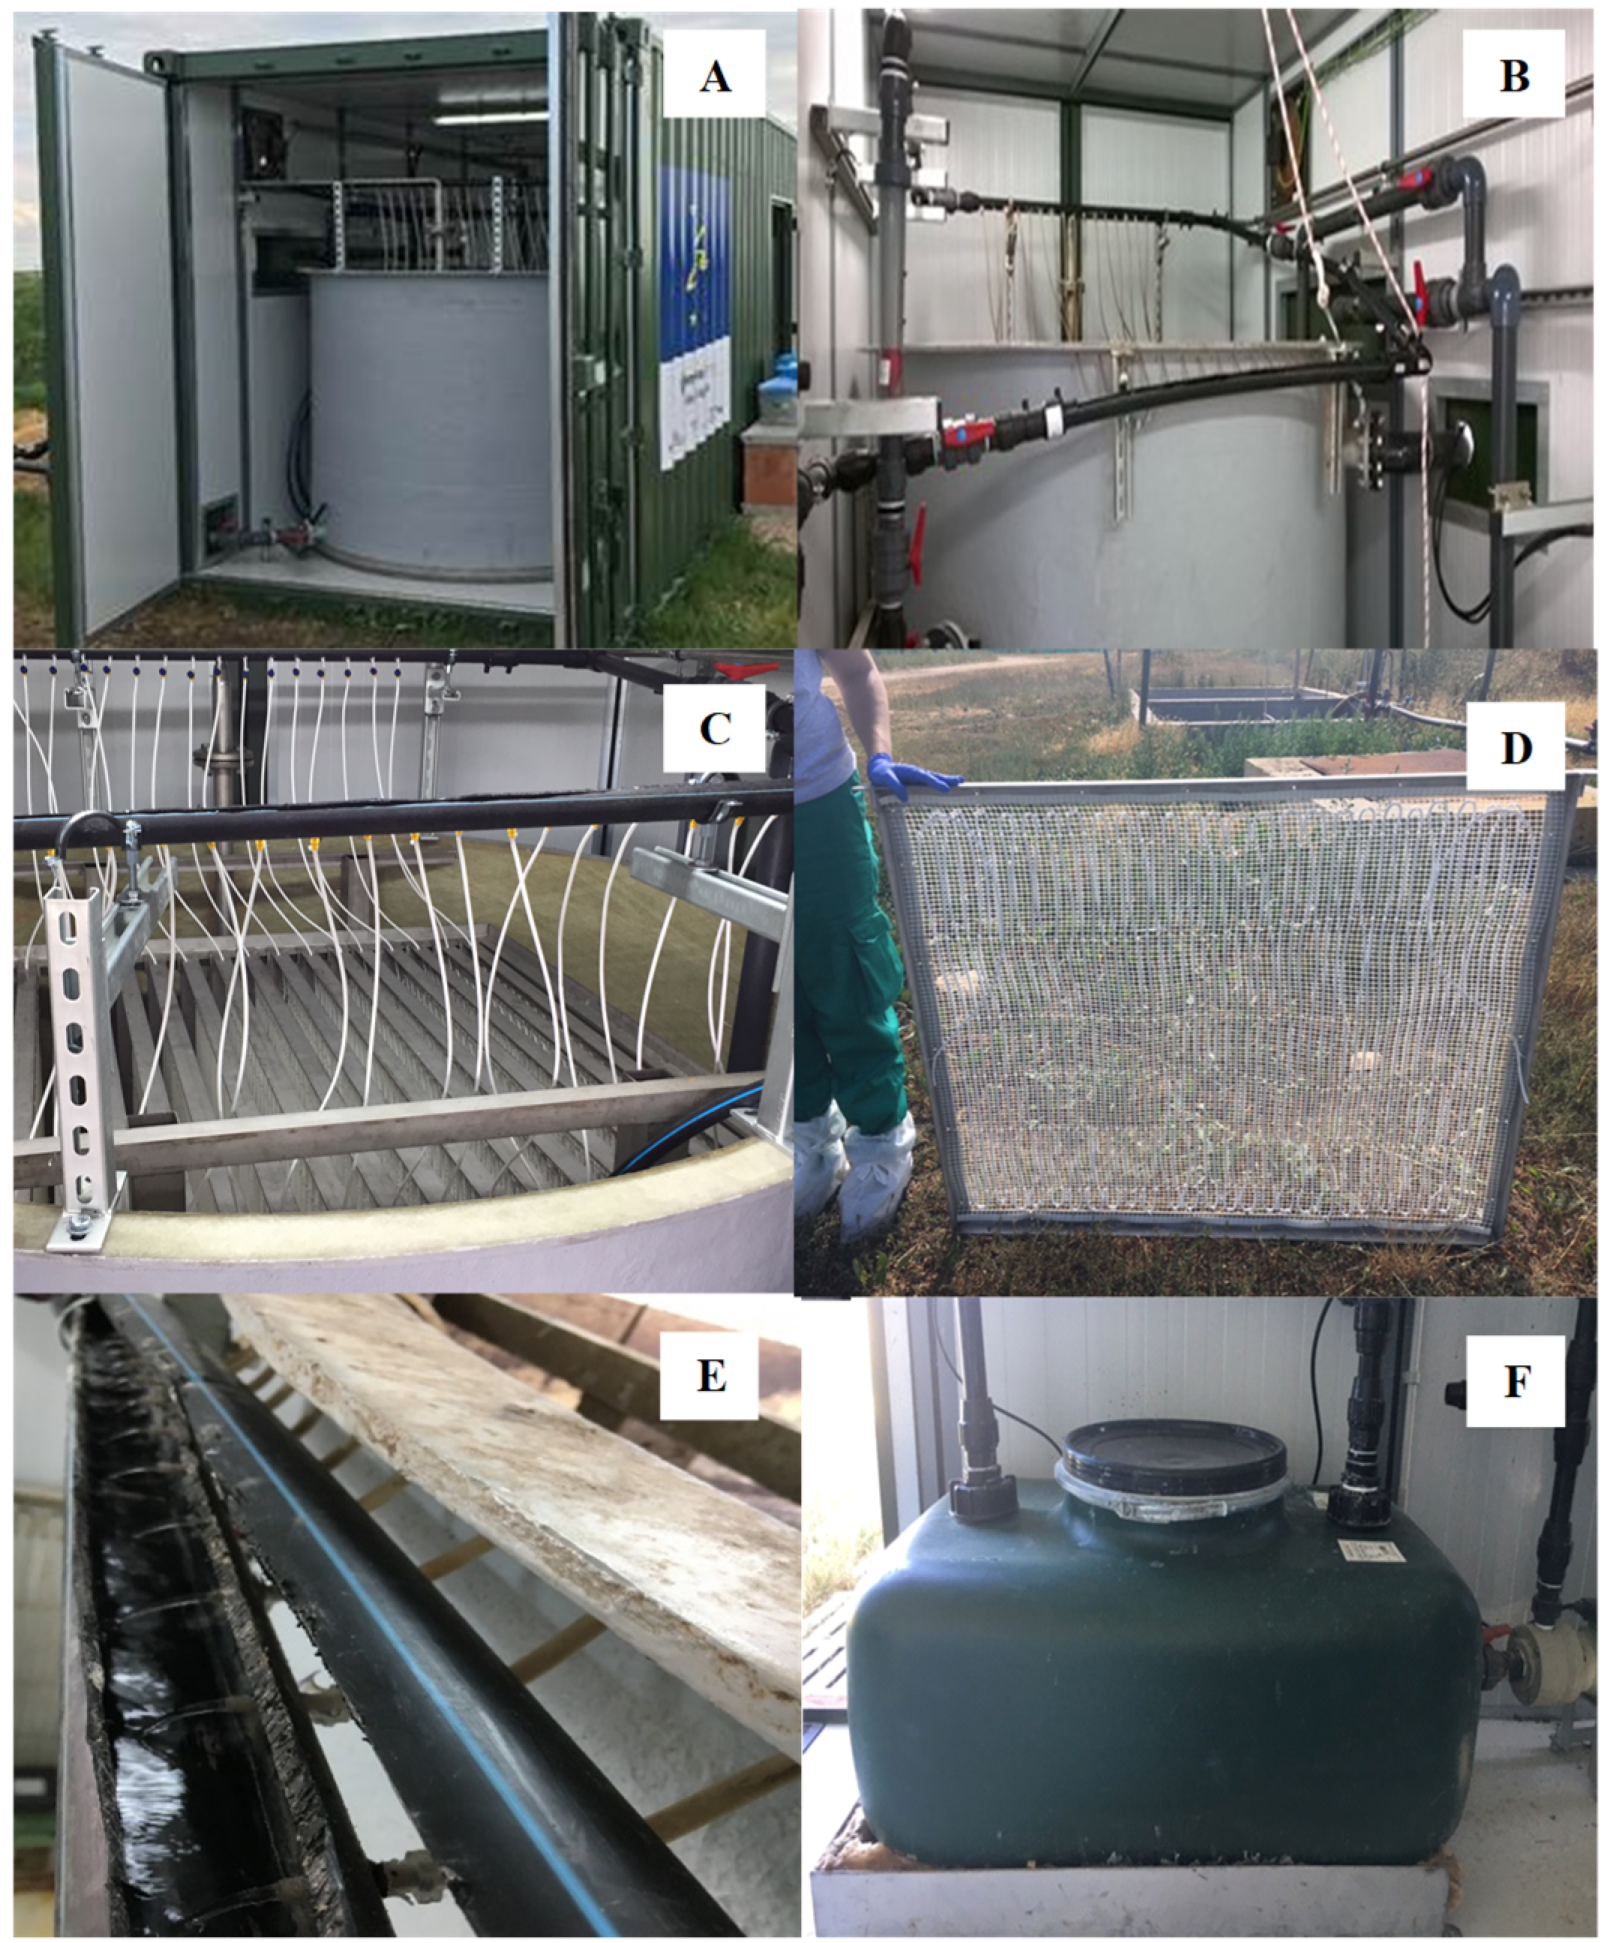
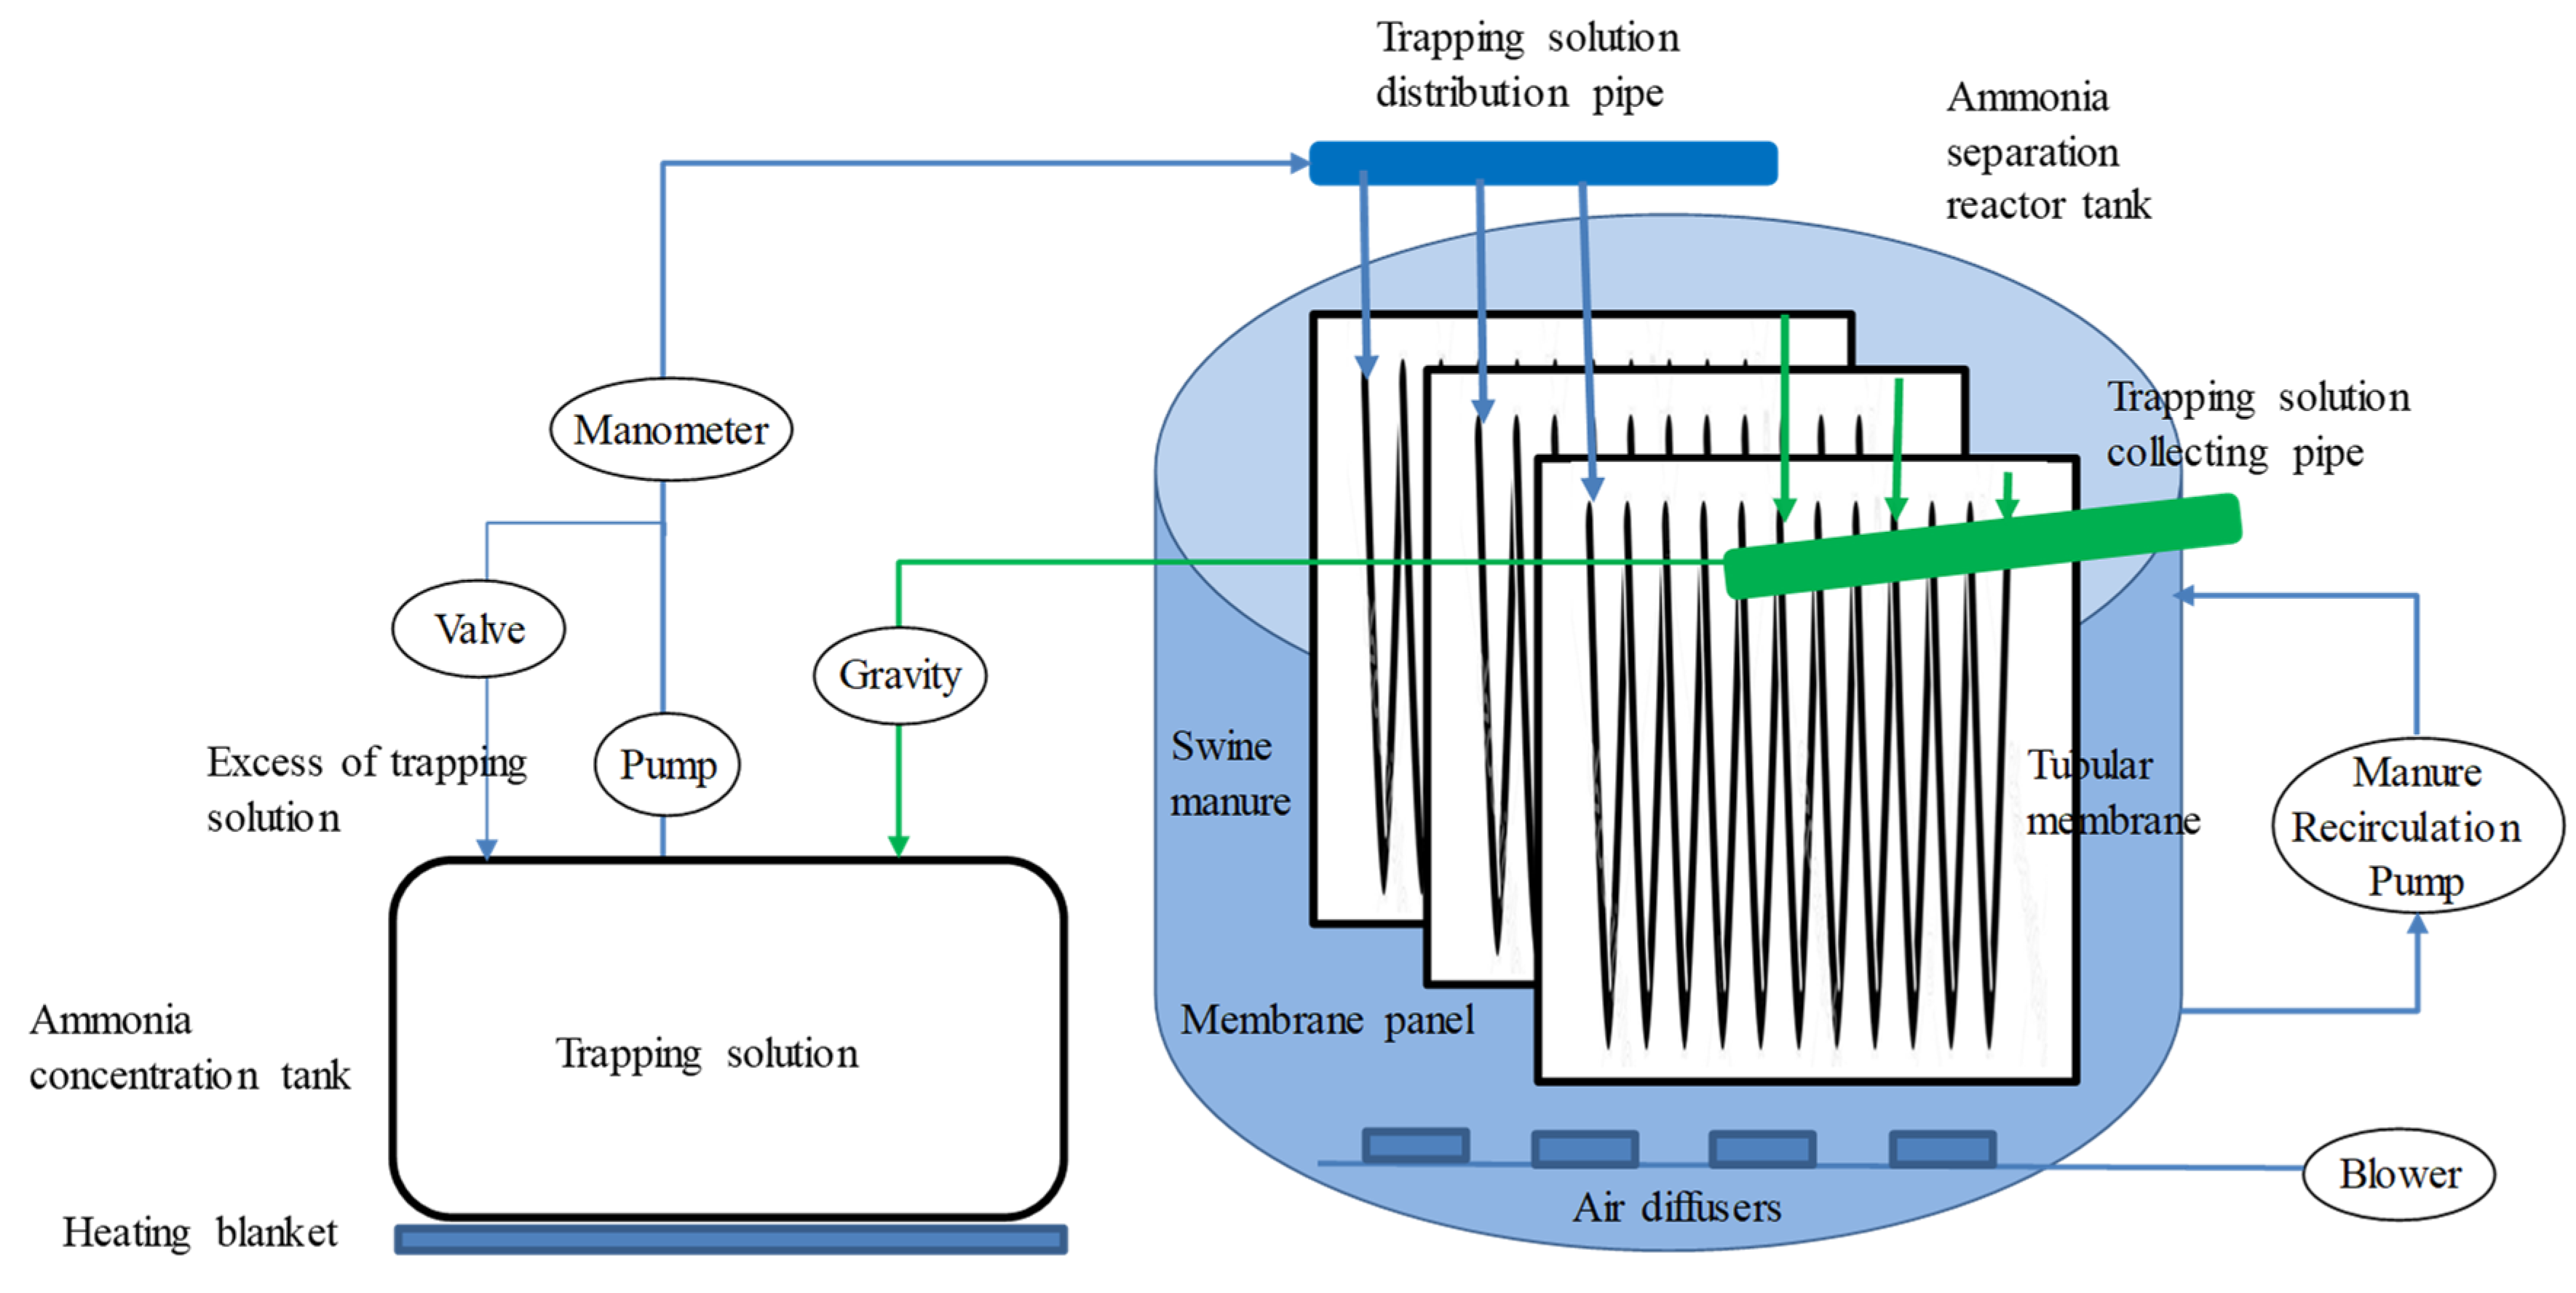
2.2. Pilot Plant Configuration
2.3. Operating Procedures and Process Monitoring
2.4. Sampling and Chemical Characterization
3. Results and Discussion
3.1. Pilot Plant Operation
3.1.1. Problems Encountered in the Pilot Plant Start-Up
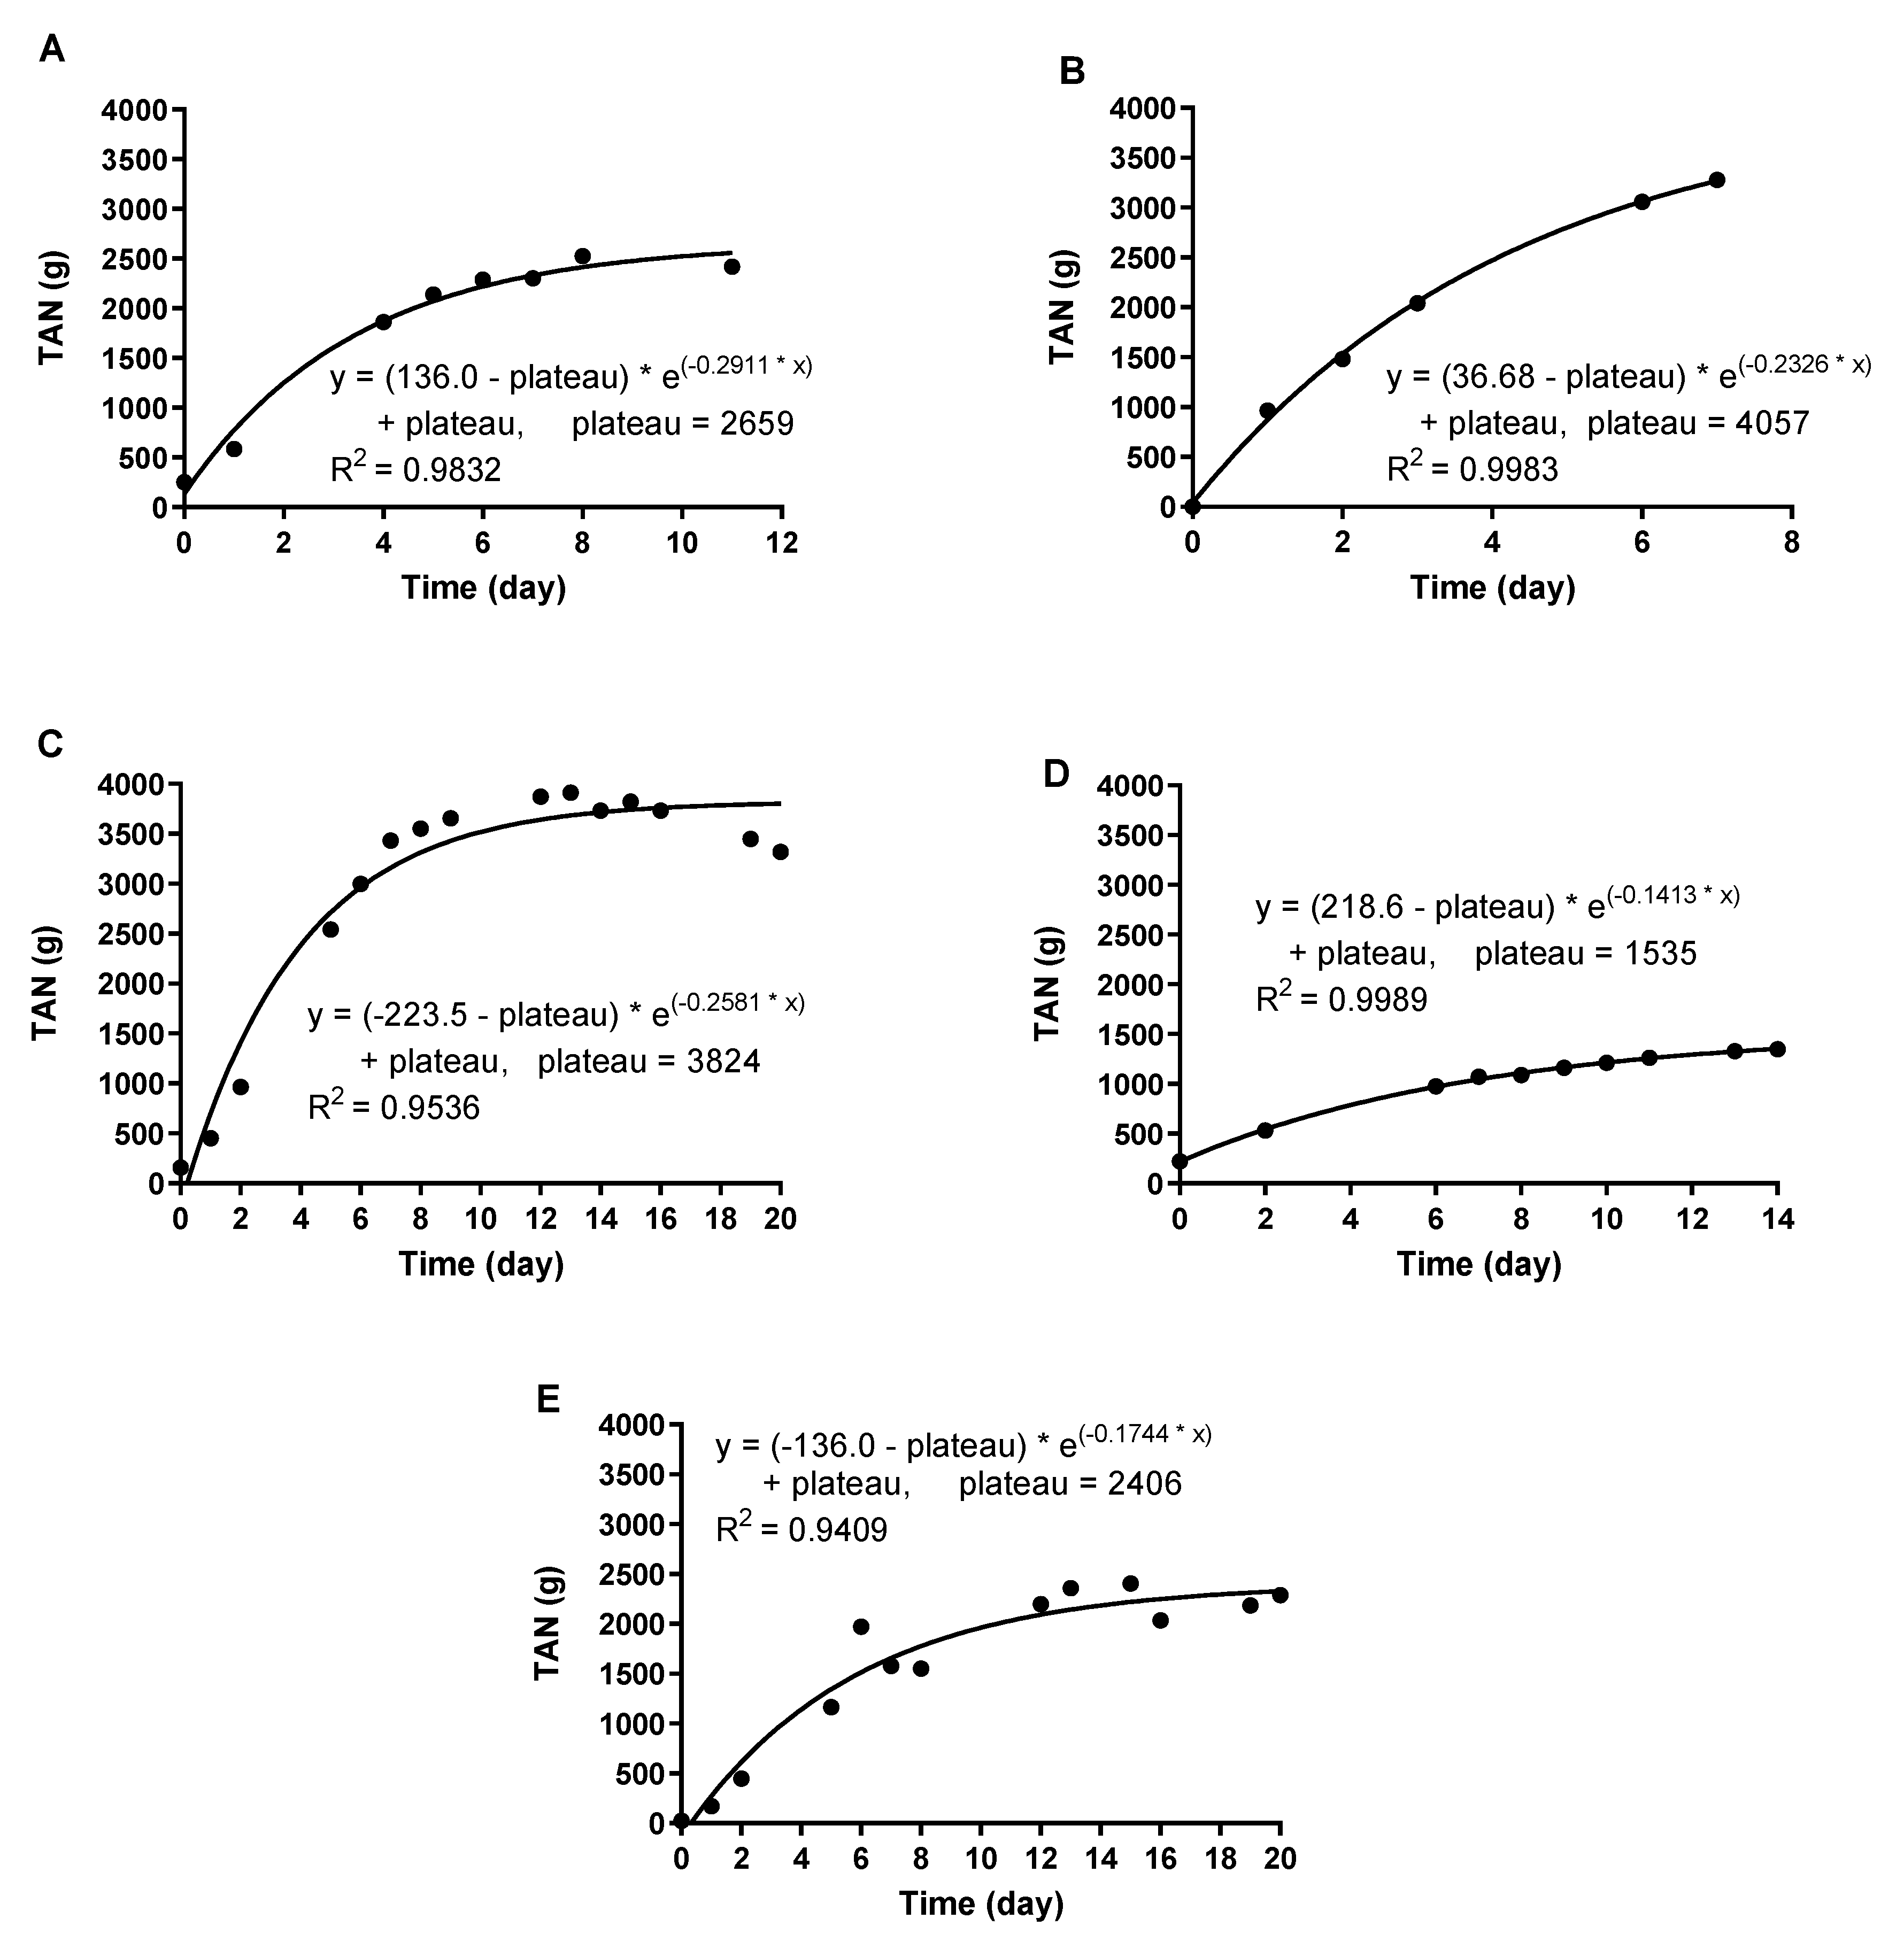
3.1.2. Batch Experiments
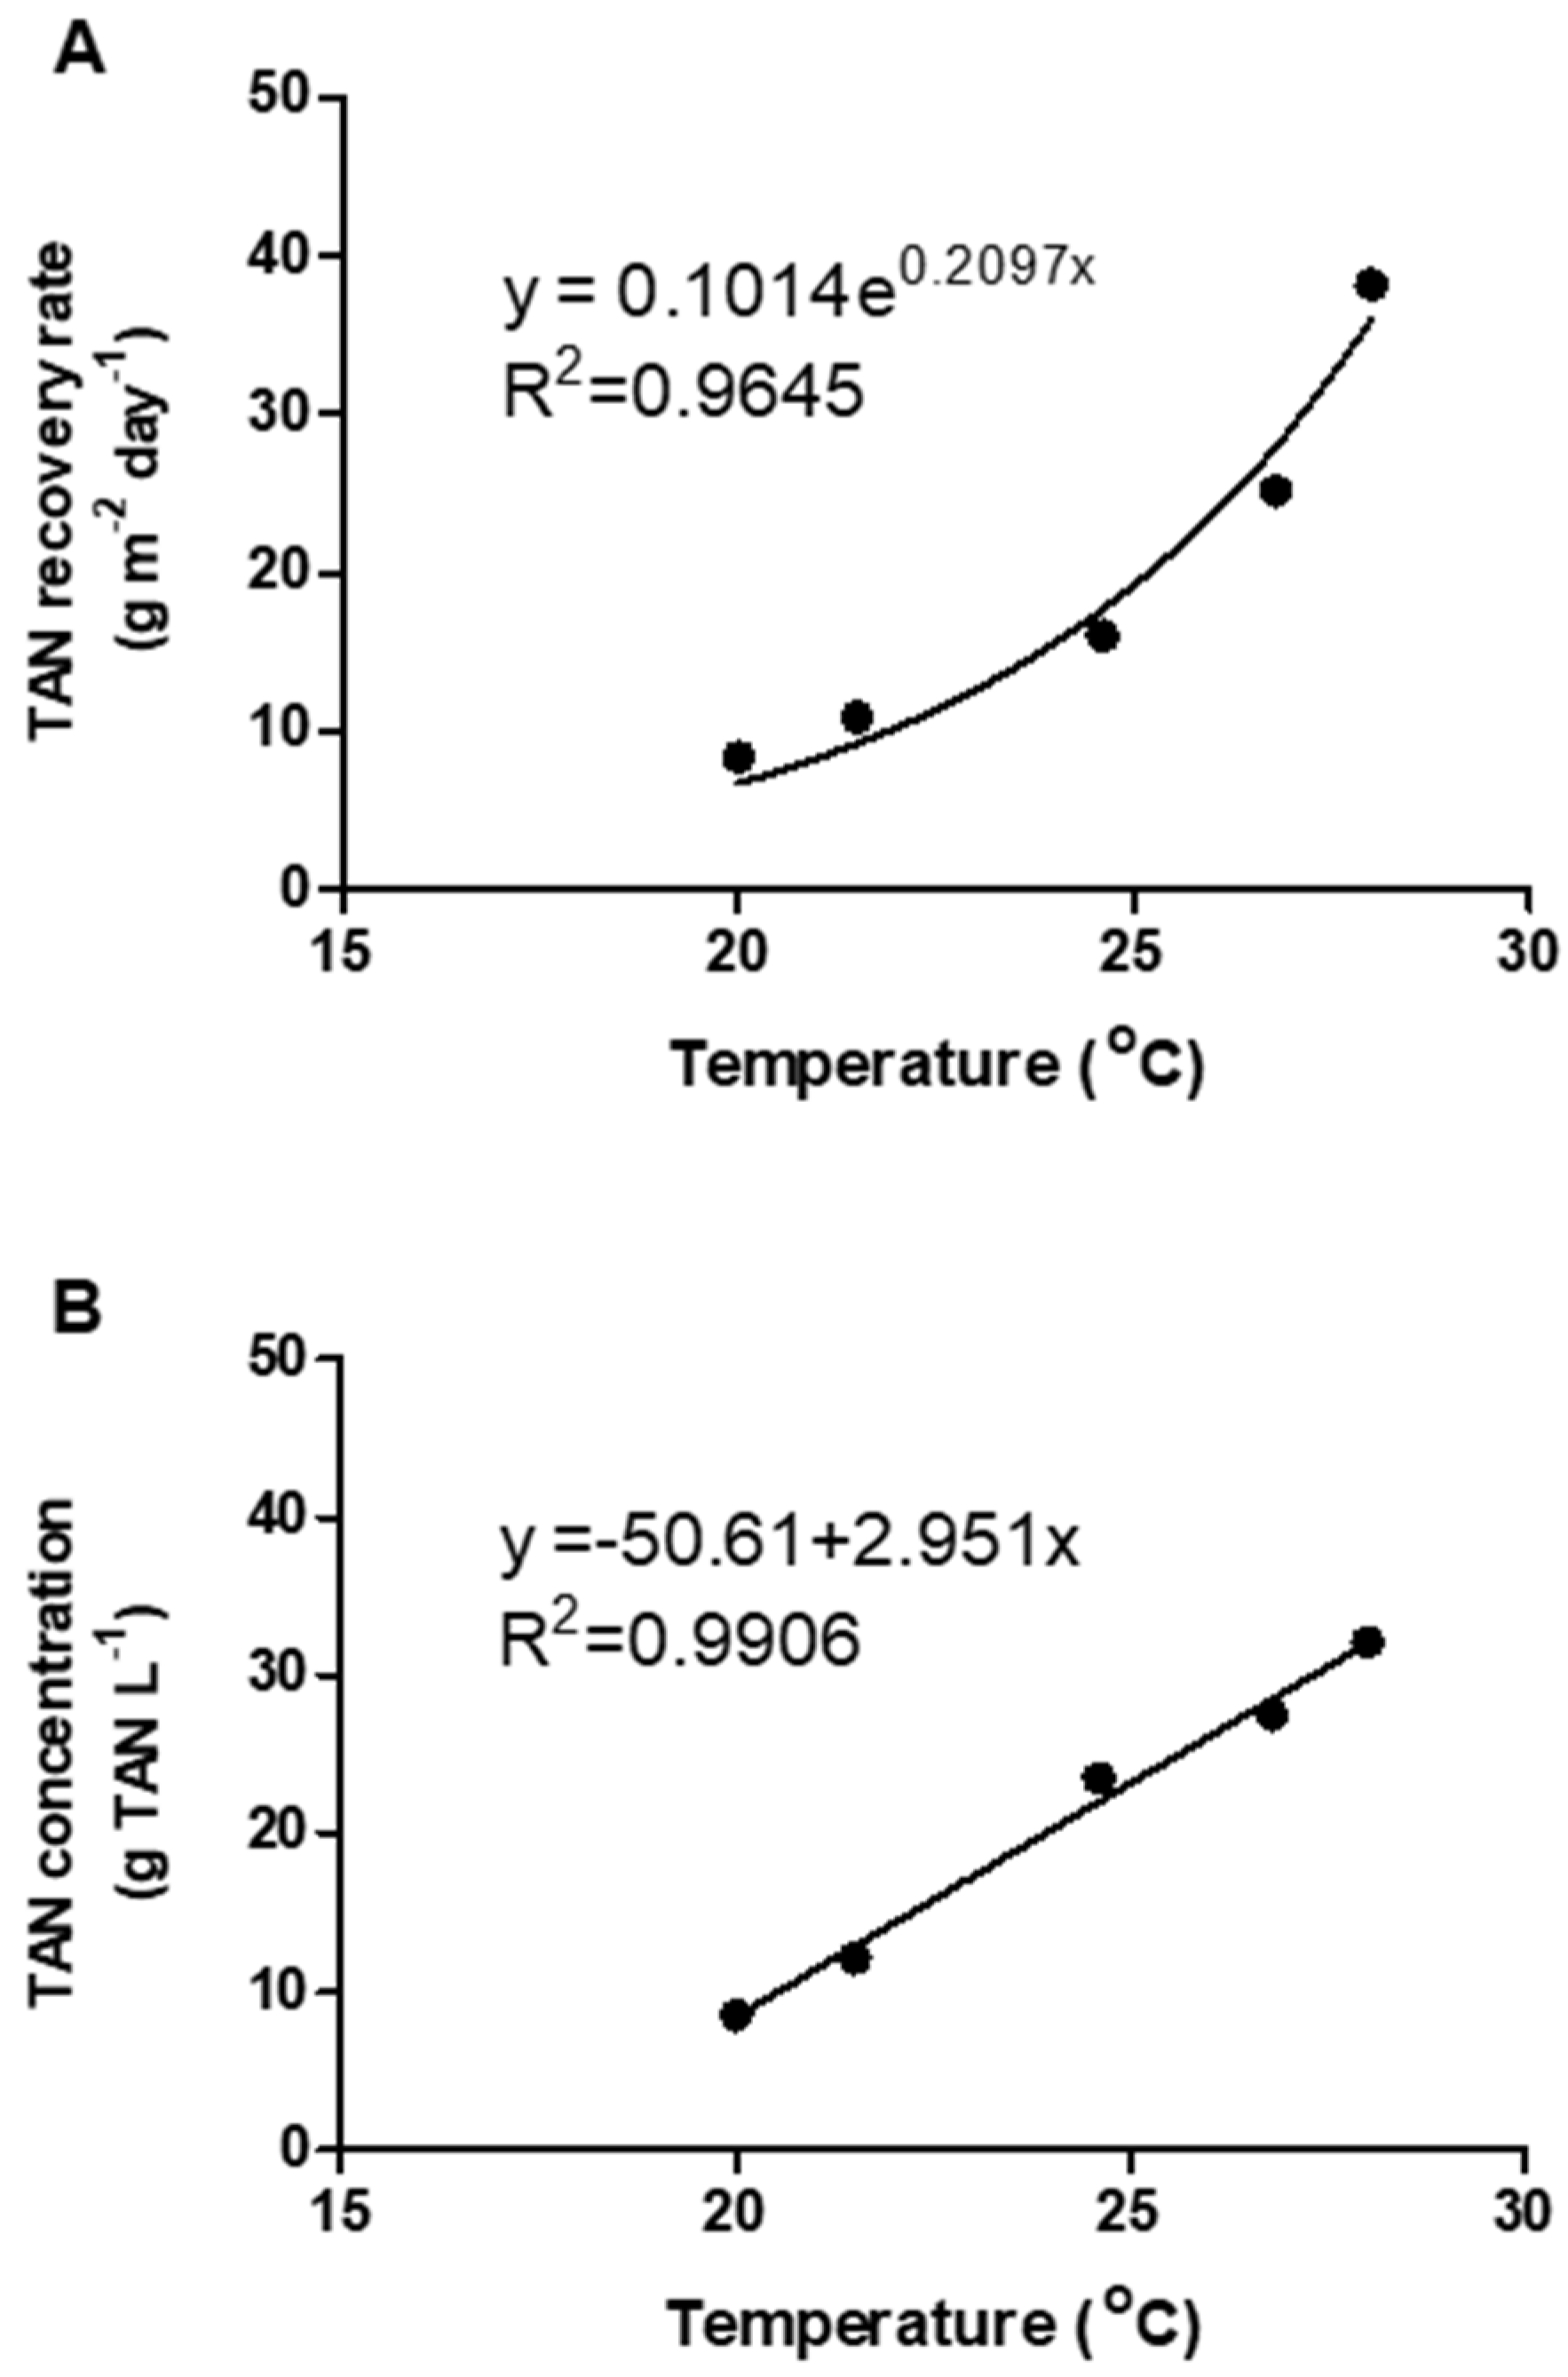
TAN Removal and Recovery: Effect of Temperature
Concentrated Ammonium Solution Obtained
3.2. Economic Approach
- The annual production of raw swine manure in the farm is approx. 17136 m3 (i.e., 47 m3 per day), resulting from 2800 animals producing 6.12 m3 of manure per year each [17].
- Raw swine manure contains an average of 2774 mg TAN L−1 (Table 1).
- A TAN removal goal for the raw swine manure of approximately 90% is proposed.
- Membrane cost is 115 € m−2 [6] and 10% of replacement per year is considered (this study).
- Annualized costs of equipment are calculated using a 10-year useful life and 8% interest [6].
- The amount of H2SO4 (98%) needed to capture TAN is 7.36 kg of acid per kg of N recovered (this study).
- Since the recovery of N is highly dependent on the temperature in the manure, a heating system for the winter months should be considered.
- The evaluation of cheaper materials for the membranes and the use of recycled acids would be two examples of sustainable alternatives to reduce operational costs.
4. Conclusions
Author Contributions
Funding
Conflicts of Interest
References
- EEA (European Environment Agency). Agriculture, Ammonia Emissions Statistics. 2018. Available online: https://www.eea.europa.eu/data-and-maps/dashboards/air-pollutant-emissions-data-viewer-1 (accessed on 12 June 2019).
- EC-European Commission. Directive (EU) 2016/2284 of the European Parlament and of the Council of 14 December 2016 on the reduction of national emissions of certain atmospheric pollutants, amending Directive 2003/35/EC and repealing Directive 2001/81/EC. Off. J. Eur. Commun. 2016, 344, 1–31. [Google Scholar]
- Santonja, G.G.; Georgitzikis, K.; Scalet, B.M.; Montobbio, P.; Roudier, S.; Delgado Sancho, L. Best Available Techniques (BAT) Reference Document for the Intensive Rearing of Poultry or Pigs, EUR 28674 EN; EU: Brussels, Belgium, 2017. [Google Scholar]
- Winkler, M.K.; Straka, L. New directions in biological nitrogen removal and recovery from wastewater. Curr. Opin. Biotechnol. 2019, 57, 50–55. [Google Scholar] [CrossRef] [PubMed]
- Laureni, M.; Palatsi, J.; Llovera, M.; Bonmatí, A. Influence of pig slurry characteristics on ammonia stripping efficiencies and quality of the recovered ammonium-sulfate solution. J. Chem. Technol. Biotechnol. 2013, 88, 1654–1662. [Google Scholar] [CrossRef]
- Dube, P.J.; Vanotti, M.B.; Szogi, A.A.; Garcia-González, M.C. Enhancing recovery of ammonia from swine manure anaerobic digester effluent using gas-permeable membrane technology. Waste Manag. 2016, 49, 372–377. [Google Scholar] [CrossRef] [PubMed] [Green Version]
- García-González, M.C.; Vanotti, M.B.; Szogi, A.A. Recovery of ammonia from swine manure using gas-permeable membranes: Effect of aeration. J. Environ. Manag. 2015, 152, 19–26. [Google Scholar] [CrossRef] [PubMed]
- García-González, M.C.; Vanotti, M.B. Recovery of ammonia from swine manure using gas-permeable membranes: Effect of waste strength and pH. Waste Manag. 2015, 38, 455–461. [Google Scholar] [CrossRef] [PubMed]
- Bayrakdar, A.; Sürmeli, R.Ö.; Çalli, B. Anaerobic digestion of chicken manure by a leach-bed process coupled with side-stream membrane ammonia separation. Bioresour. Technol. 2018, 258, 41–47. [Google Scholar] [CrossRef] [PubMed]
- Riaño, B.; Molinuevo-Salces, B.; Vanotti, M.B.; García-González, M.C. Application of Gas-Permeable Membranes For-Semi-Continuous Ammonia Recovery from Swine Manure. Environments 2019, 6, 32. [Google Scholar] [CrossRef] [Green Version]
- American Public Health Association. Standard Methods for the Examination of Water, Wastewater APHA. In American Water Works Association and Water Environment Federation, 21st ed.; American Public Health Association: Washington, DC, USA, 2005. [Google Scholar]
- Vanotti, M.B.; Dube, P.J.; Szogi, A.A.; García-González, M.C. Recovery of ammonia and phosphate minerals from swine wastewater using gas-permeable membranes. Water Res. 2017, 112, 137–146. [Google Scholar] [CrossRef] [PubMed] [Green Version]
- Fillingham, M.; VanderZaag, A.; Singh, J.; Burtt, S.; Crolla, A.; Kinsley, C.; MacDonald, J.D. Characterizing the performance of gas-permeable membranes as an ammonia recovery strategy from anaerobically digested dairy manure. Membranes 2017, 7, 59. [Google Scholar] [CrossRef] [PubMed] [Green Version]
- Daguerre-Martini, S.; Vanotti, M.B.; Rodriguez-Pastor, M.; Rosal, A.; Moral, R. Nitrogen recovery from wastewater using gas-permeable membranes: Impact of inorganic carbon content and natural organic matter. Water Res. 2018, 137, 201–210. [Google Scholar] [CrossRef] [PubMed] [Green Version]
- CREA Newsletter 11, 2005. Available online: http://crea.uclm.es/siar/publicaciones/files/HOJA11.pdf (accessed on 25 July 2019).
- Miles, C.; Jonathan, R.; Elizabeth, M.; Coolong, T. Fertigation in Organic Vegetable Production Systems. Available online: https://eorganic.org/node/4937 (accessed on 20 February 2020).
- Spanish Royal Decree 324. March 3rd, por el que se Establecen Normas Básicas de Ordenación de las Explotaciones Porcinas. BOE 58, Agencia Estatal Boletin Oficial del Estado, Madrid. Available online: https://www.boe.es/buscar/pdf/2000/BOE-A-2000-4447-consolidado.pdf (accessed on 13 February 2020).
- Zarebska, A.; Romero Nieto, D.; Christensen, K.V.; Fjerbæk Søtoft, L.; Norddahl, B. Ammonium fertilizers production from manure: A critical review. Crit. Rev. Environ. Sci. Technol. 2014, 45, 1469–1521. [Google Scholar] [CrossRef]
- De Vrieze, J.; Colica, G.; Pintucci, C.; Sarli, J.; Pedizzi, C.; Willeghems, G.; Bral, A.; Varga, S.; Prat, D.; Peng, L.; et al. Resource recovery from pig manure via an integrated approach: A technical and economic assessment for full-scale applications. Bioresour. Technol. 2018, 272, 582–593. [Google Scholar] [CrossRef] [PubMed]


| Parameter | Unit | B1 | B2 | B3 | B4 | B5 |
|---|---|---|---|---|---|---|
| pH | 7.71 | 7.26 | 7.53 | 7.75 | 7.75 | |
| TS | g L−1 | 22.61 (0.36) | 30.42 (2.23) | 39.60 (0.79) | 72.11 (3.09) | 43.60 (0.35) |
| VS | g L−1 | 15.75 (0.40) | 22.56 (1.99) | 29.80 (0.83) | 55.94 (2.85) | 32.65 (0.29) |
| Ratio VS/TS | 0.70 | 0.74 | 0.75 | 0.78 | 0.75 | |
| CODs | g L−1 | 15.12 (0.61) | 13.74 (0.12) | 13.84 (2.13) | 19.42 (1.41) | 10.86 (3.28) |
| CODt | g L−1 | 30.14 (1.93) | 41.87 (3.24) | 38.62 (1.36) | 58.26 (1.08) | 38.42 (1.68) |
| TVFA | g COD L−1 | 8.95 (0.19) | 8.56 (0.04) | 7.17 (0.28) | 8.89 (0.00) | 3.71 (0.07) |
| TAN | g L−1 | 2.79 (0.18) | 2.82 (0.00) | 3.05 (0.02) | 2.92 (0.02) | 2.30 (0.08) |
| TKN | g L−1 | 3.36 (0.00) | 3.38 (0.01) | 3.82 (0.00) | 4.29 (0.01) | 3.11 (0.02) |
| Parameter | Unit | B1 | B2 | B3 | B4 | B5 |
|---|---|---|---|---|---|---|
| Operation time | days | 11 | 7 | 20 | 14 | 20 |
| Trapping solution | m3 | 0.15–0.08 | 0.15–0.17 | 0.19–0.14 | 0.18–0.16 | 0.18–0.19 |
| Manure | m3 | 4.86–4.68 | 4.97–4.72 | 4.94–4.74 | 5.12–5.06 | 5.10–5.06 |
| Membrane surface | m2 | 13.07 | 12.03 | 13.07 | 10.60 | 13.07 |
| Temperature manure | °C | 26.8 (1.2) | 28.0 (1.2) | 24.6 (1.8) | 20.0 (1.7) | 21.5 (1.4) |
| Temperature trapping solution | °C | 29.2 (2.0) | 30.7 (1.3) | 27.4 (1.7) | 25.4 (2.3) | 24.7 (1.8) |
| Parameter | Unit | B1 | B2 | B3 | B4 | B5 | Average B1–B5 | |
|---|---|---|---|---|---|---|---|---|
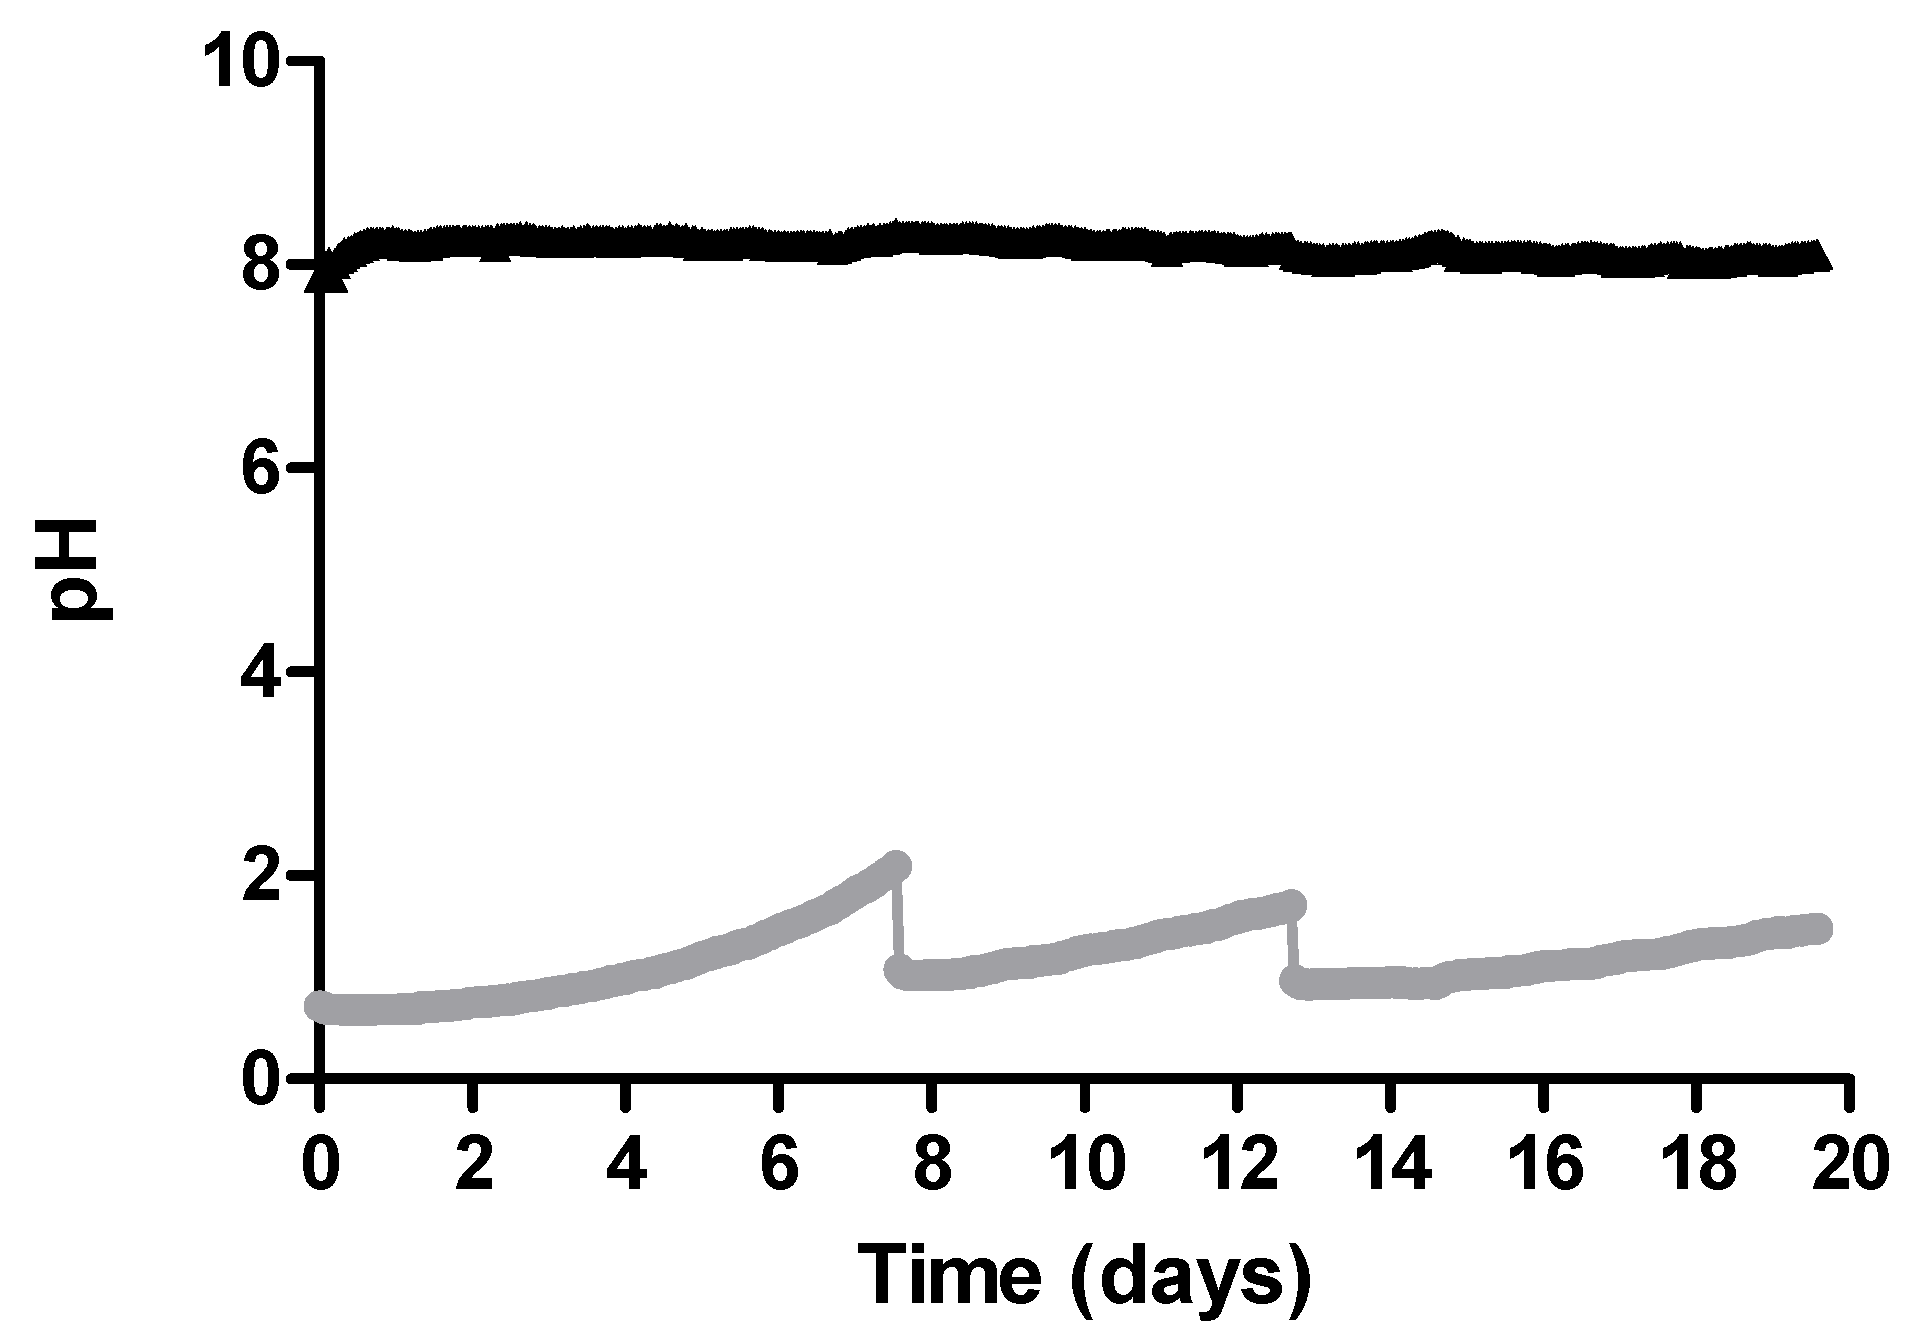
| pH | - | Initial | 7.71 | 7.26 | 7.53 | 7.75 | 7.75 | 7.60 (0.21) |
| Final | 8.91 | 8.49 | 8.55 | 8.20 | 8.88 | 8.61 (0.30) | ||
| TAN | g L−1 | Initial | 2.79 | 2.82 | 3.05 | 2.92 | 2.30 | 2.78 (0.28) |
| Final | 1.99 | 1.92 | 1.54 | 2.51 | 1.22 | 1.84 (0.49) | ||
| Alkalinity | mg CaCO3 L−1 | Initial | 12794 | 11239 | 10033 | 13673 | 10126 | 11573 (1618) |
| Final | 7552 | 7937 | 5420 | 11345 | 6793 | 7809 (2198) | ||
| Removed TAN | % | - | 28.53 | 31.87 | 49.46 | 14.30 | 46.82 | 34.20 (14.37) |
| Initial alkalinity: Initial TAN ratio | - | - | 4.59 | 3.99 | 3.29 | 4.68 | 4.41 | 4.19 (0.57) |
| Alkalinity consumed | mg CaCO3 L−1 | - | 5242 | 3302 | 4613 | 2328 | 3333 | 3764 (1158) |
| Alkalinity consumed: TAN removed ratio | - | - | 6.59 | 3.68 | 3.06 | 5.57 | 3.10 | 4.40 (1.60) |
| Parameter | Unit | B1 | B2 | B3 | B4 | B5 | Average B1–B5 | |
|---|---|---|---|---|---|---|---|---|
| TAN | g L−1 | Initial | 1.66 | 13.45 | 0.85 | 1.24 | 0.14 | 3.47 (5.61) |
| Final | 27.48 | 32.10 | 23.54 | 8.48 | 12.11 | 20.74 (10.09) | ||
| Recovered TAN in the trapping solution | % | - | 79.69 | 66.23 | 42.81 | 59.32 | 62.10 | 62.03 (13.29) |
| TAN recovery rate | g TAN m−2 day−1 | - | 25.15 | 38.20 | 15.98 | 8.38 | 10.87 | 19.72 (12.16) |
| Initial seven-day TAN recovery rate | g TAN m−2 day−1 | - | 29.46 | 38.20 | 37.03 | 12.61 | 16.93 | 26.85 (11.62) |
| Capital Costs | ||
|---|---|---|
| - | Initial Investment (€) | Annualized Costs: 8% Interest, 10-Year Life (€/Year) |
| Nitrogen Recovery Pilot Plant | 239,348 | 35,670 |
| Operational Costs | ||
| - | - | Annual Costs (€/year) |
| Membranes Replacement (10%) | - | 21,634 |
| Chemicals (H2SO4) | - | 55,985 |
| Power (ƩkWh) | - | 2822 |
| Total operational annual costs- | - | 80,441 |
| Total Annualized Cost | 116,111 | |
| Revenue | ||
| Sale of Fertilizer Products | (€/year) | |
| Recovered Nitrogen: 26,230 kg N/year (€ 2.36/kg N) | 61,903 | |
| Net Annual Cost | 54,208 | |
© 2020 by the authors. Licensee MDPI, Basel, Switzerland. This article is an open access article distributed under the terms and conditions of the Creative Commons Attribution (CC BY) license (http://creativecommons.org/licenses/by/4.0/).
Share and Cite
Molinuevo-Salces, B.; Riaño, B.; Vanotti, M.B.; Hernández-González, D.; García-González, M.C. Pilot-Scale Demonstration of Membrane-Based Nitrogen Recovery from Swine Manure. Membranes 2020, 10, 270. https://0-doi-org.brum.beds.ac.uk/10.3390/membranes10100270
Molinuevo-Salces B, Riaño B, Vanotti MB, Hernández-González D, García-González MC. Pilot-Scale Demonstration of Membrane-Based Nitrogen Recovery from Swine Manure. Membranes. 2020; 10(10):270. https://0-doi-org.brum.beds.ac.uk/10.3390/membranes10100270
Chicago/Turabian StyleMolinuevo-Salces, Beatriz, Berta Riaño, Matias B. Vanotti, David Hernández-González, and María Cruz García-González. 2020. "Pilot-Scale Demonstration of Membrane-Based Nitrogen Recovery from Swine Manure" Membranes 10, no. 10: 270. https://0-doi-org.brum.beds.ac.uk/10.3390/membranes10100270