3.1. CFD Model Validation and Membrane Deformation Analysis
TMP in FO processes has been shown to cause draw-channel occlusion, whereby the membrane deforms into the draw channel [
18,
19,
21]. To determine the exact level of occlusion experienced in a range of FO modules under pressure, models were developed using experimental data at 0 bar and 1.5 bar of TMP. Firstly, the draw-channels were modelled as 3D CFD geometries and validated against a range of experimental data reported previously in the literature to assess the degree of membrane deformation across module and membrane types [
17,
21]. The PF (Porifera) module was validated from previous experimental data, using the method from our previous work [
18]. However, a novel 3D geometry for a channel occlusion of 49% was developed to determine the membrane deformation at 1.5 bar of TMP, to establish a comparison point between the three commercially available FO modules.
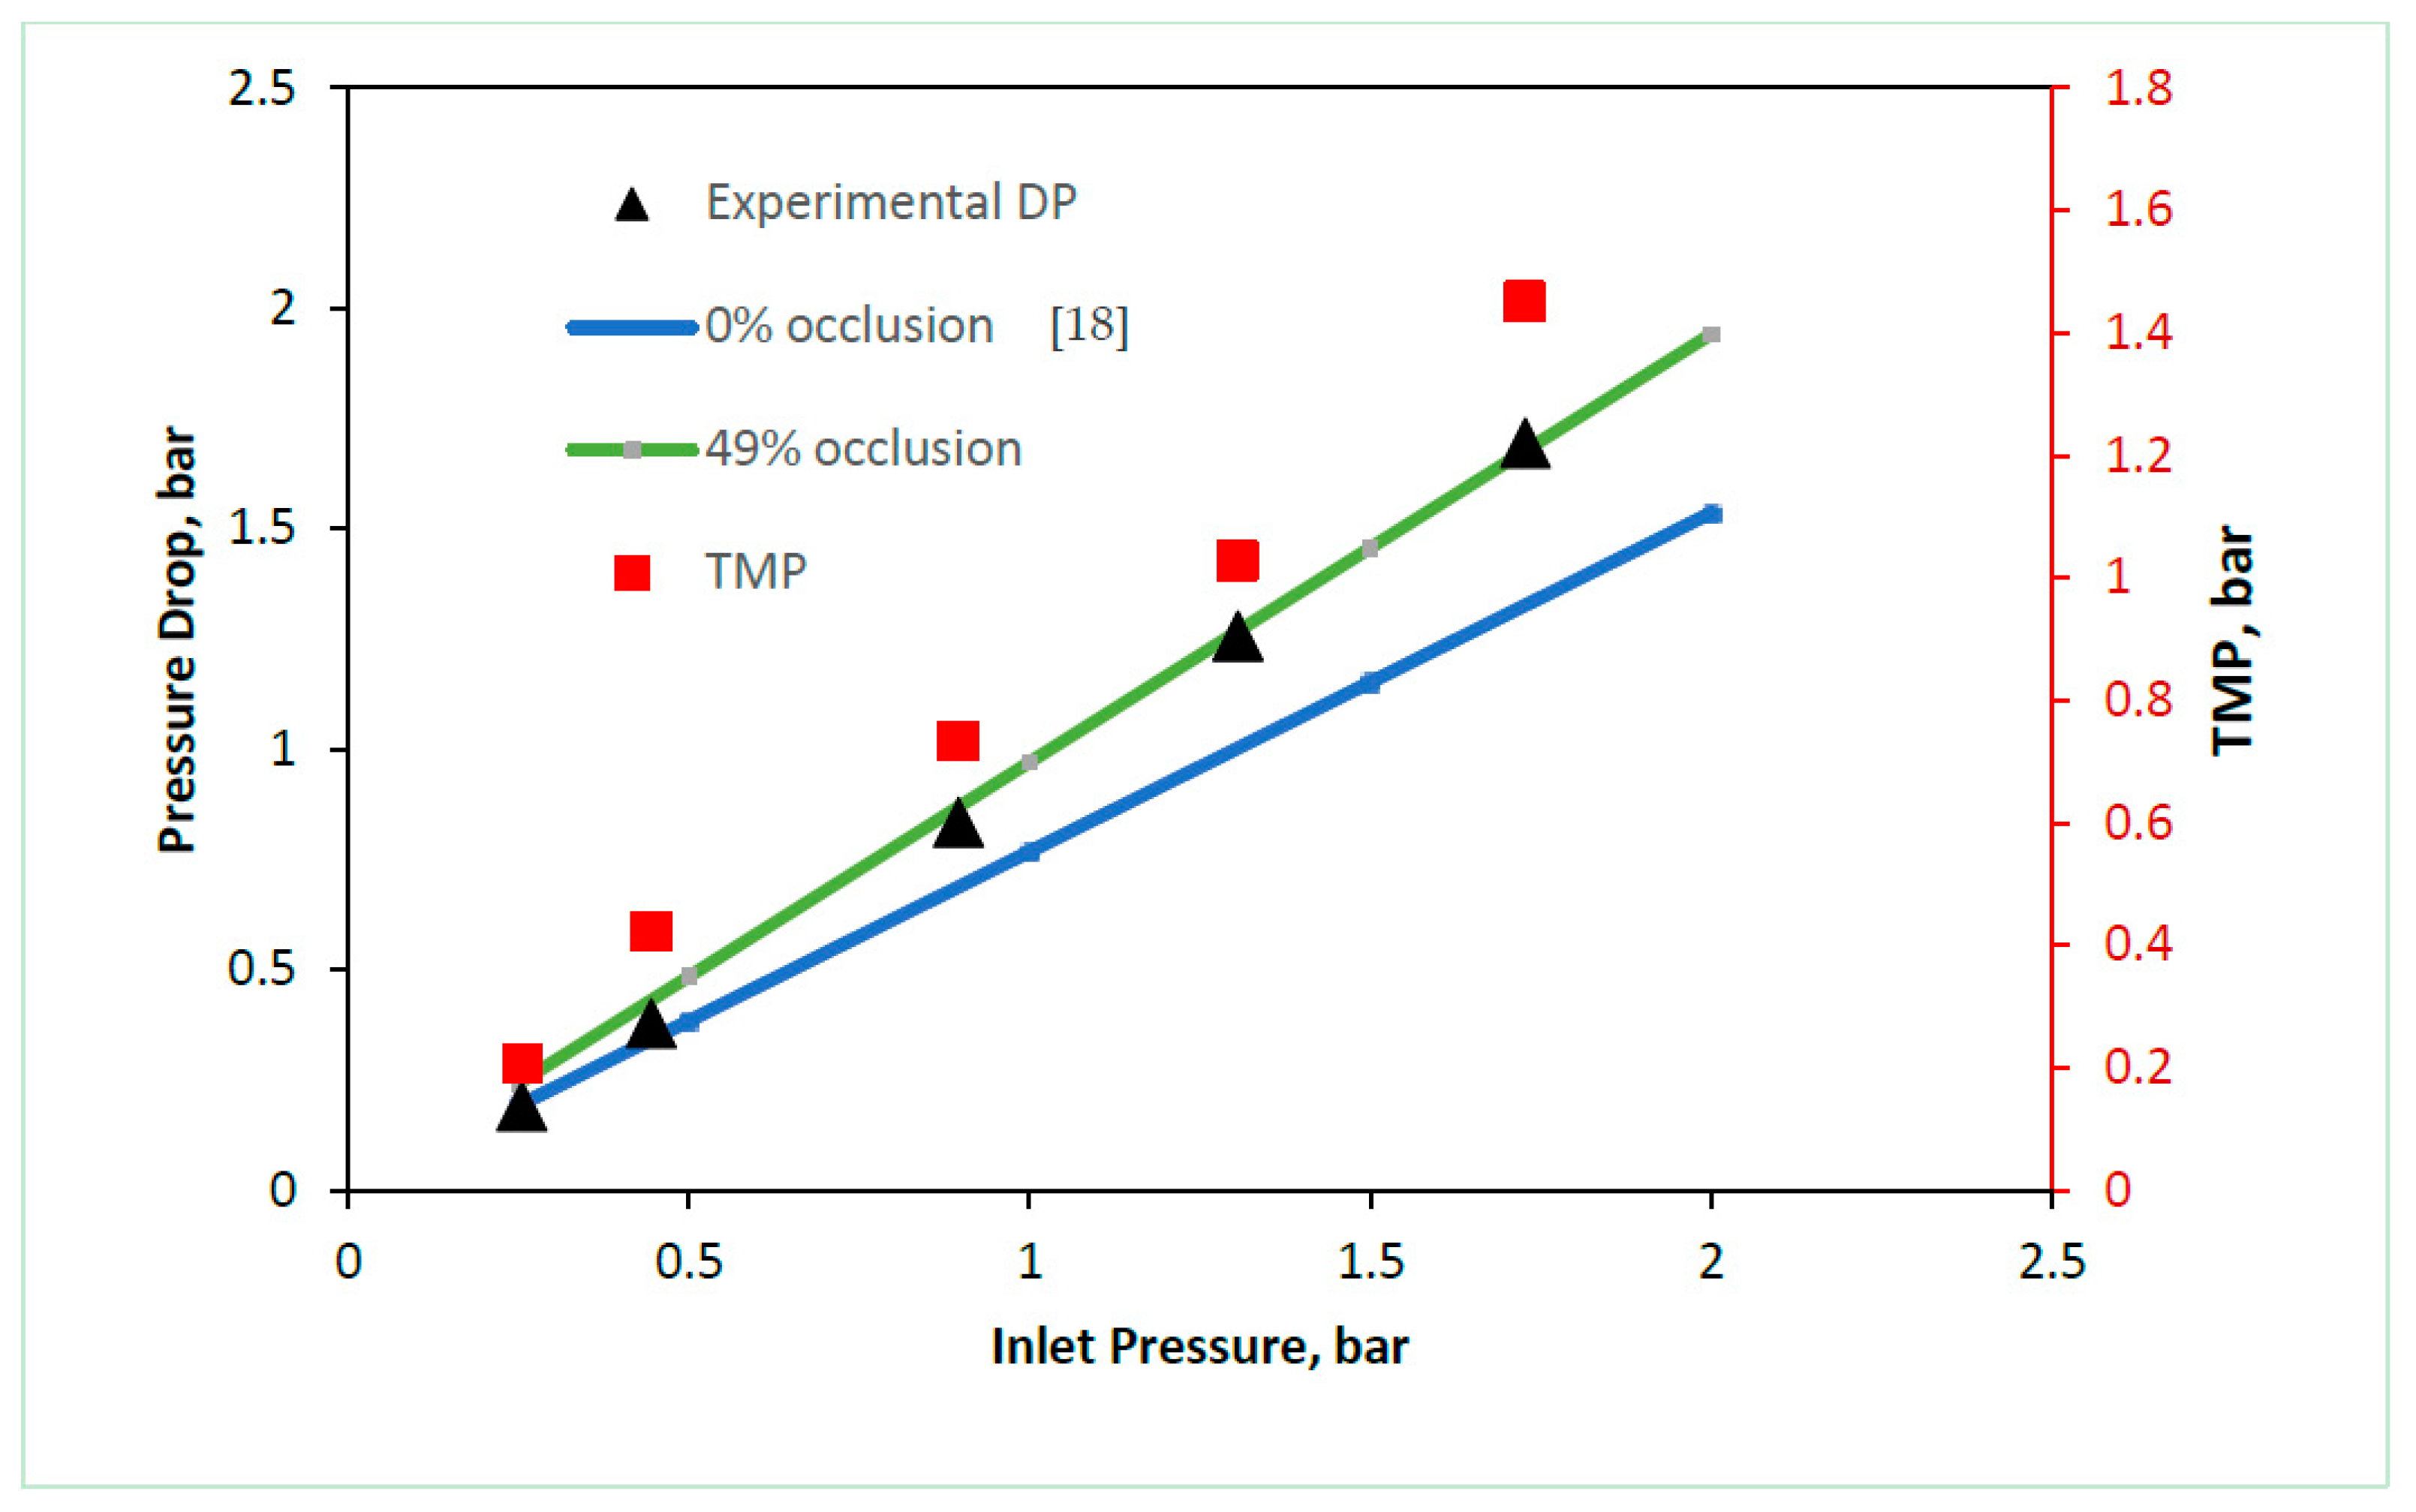
The Porifera module (
Figure 2) shows pressure-drop behavior following the 0% channel at lower TMPs (between 0–0.5 bar), and with increasing pressure, the pressure drops shift to match the behavior of the 49% channel, between TMPs of 0.8–1.5 bar. The 49% channel occlusion is high when compared to the relatively low TMP applied, and is due to the lack of mechanical support from the dot-spacer type used in the module.
The SW modules were simulated as 3D geometries of a single sheet, using a pressure-drop comparison method previously established in the literature [
17]. The SW modules were both modelled from a different dataset to the PF module, where the only the TMP was varied (and not the inlet pressure). This resulted in the “calibration” approach whereby after the 3D dimensions were established, the open channel porosity was calibrated, the pressure was dropped at 0 bar TMP and the channel height was varied until the pressure drop matched at 1.5 bar TMP.
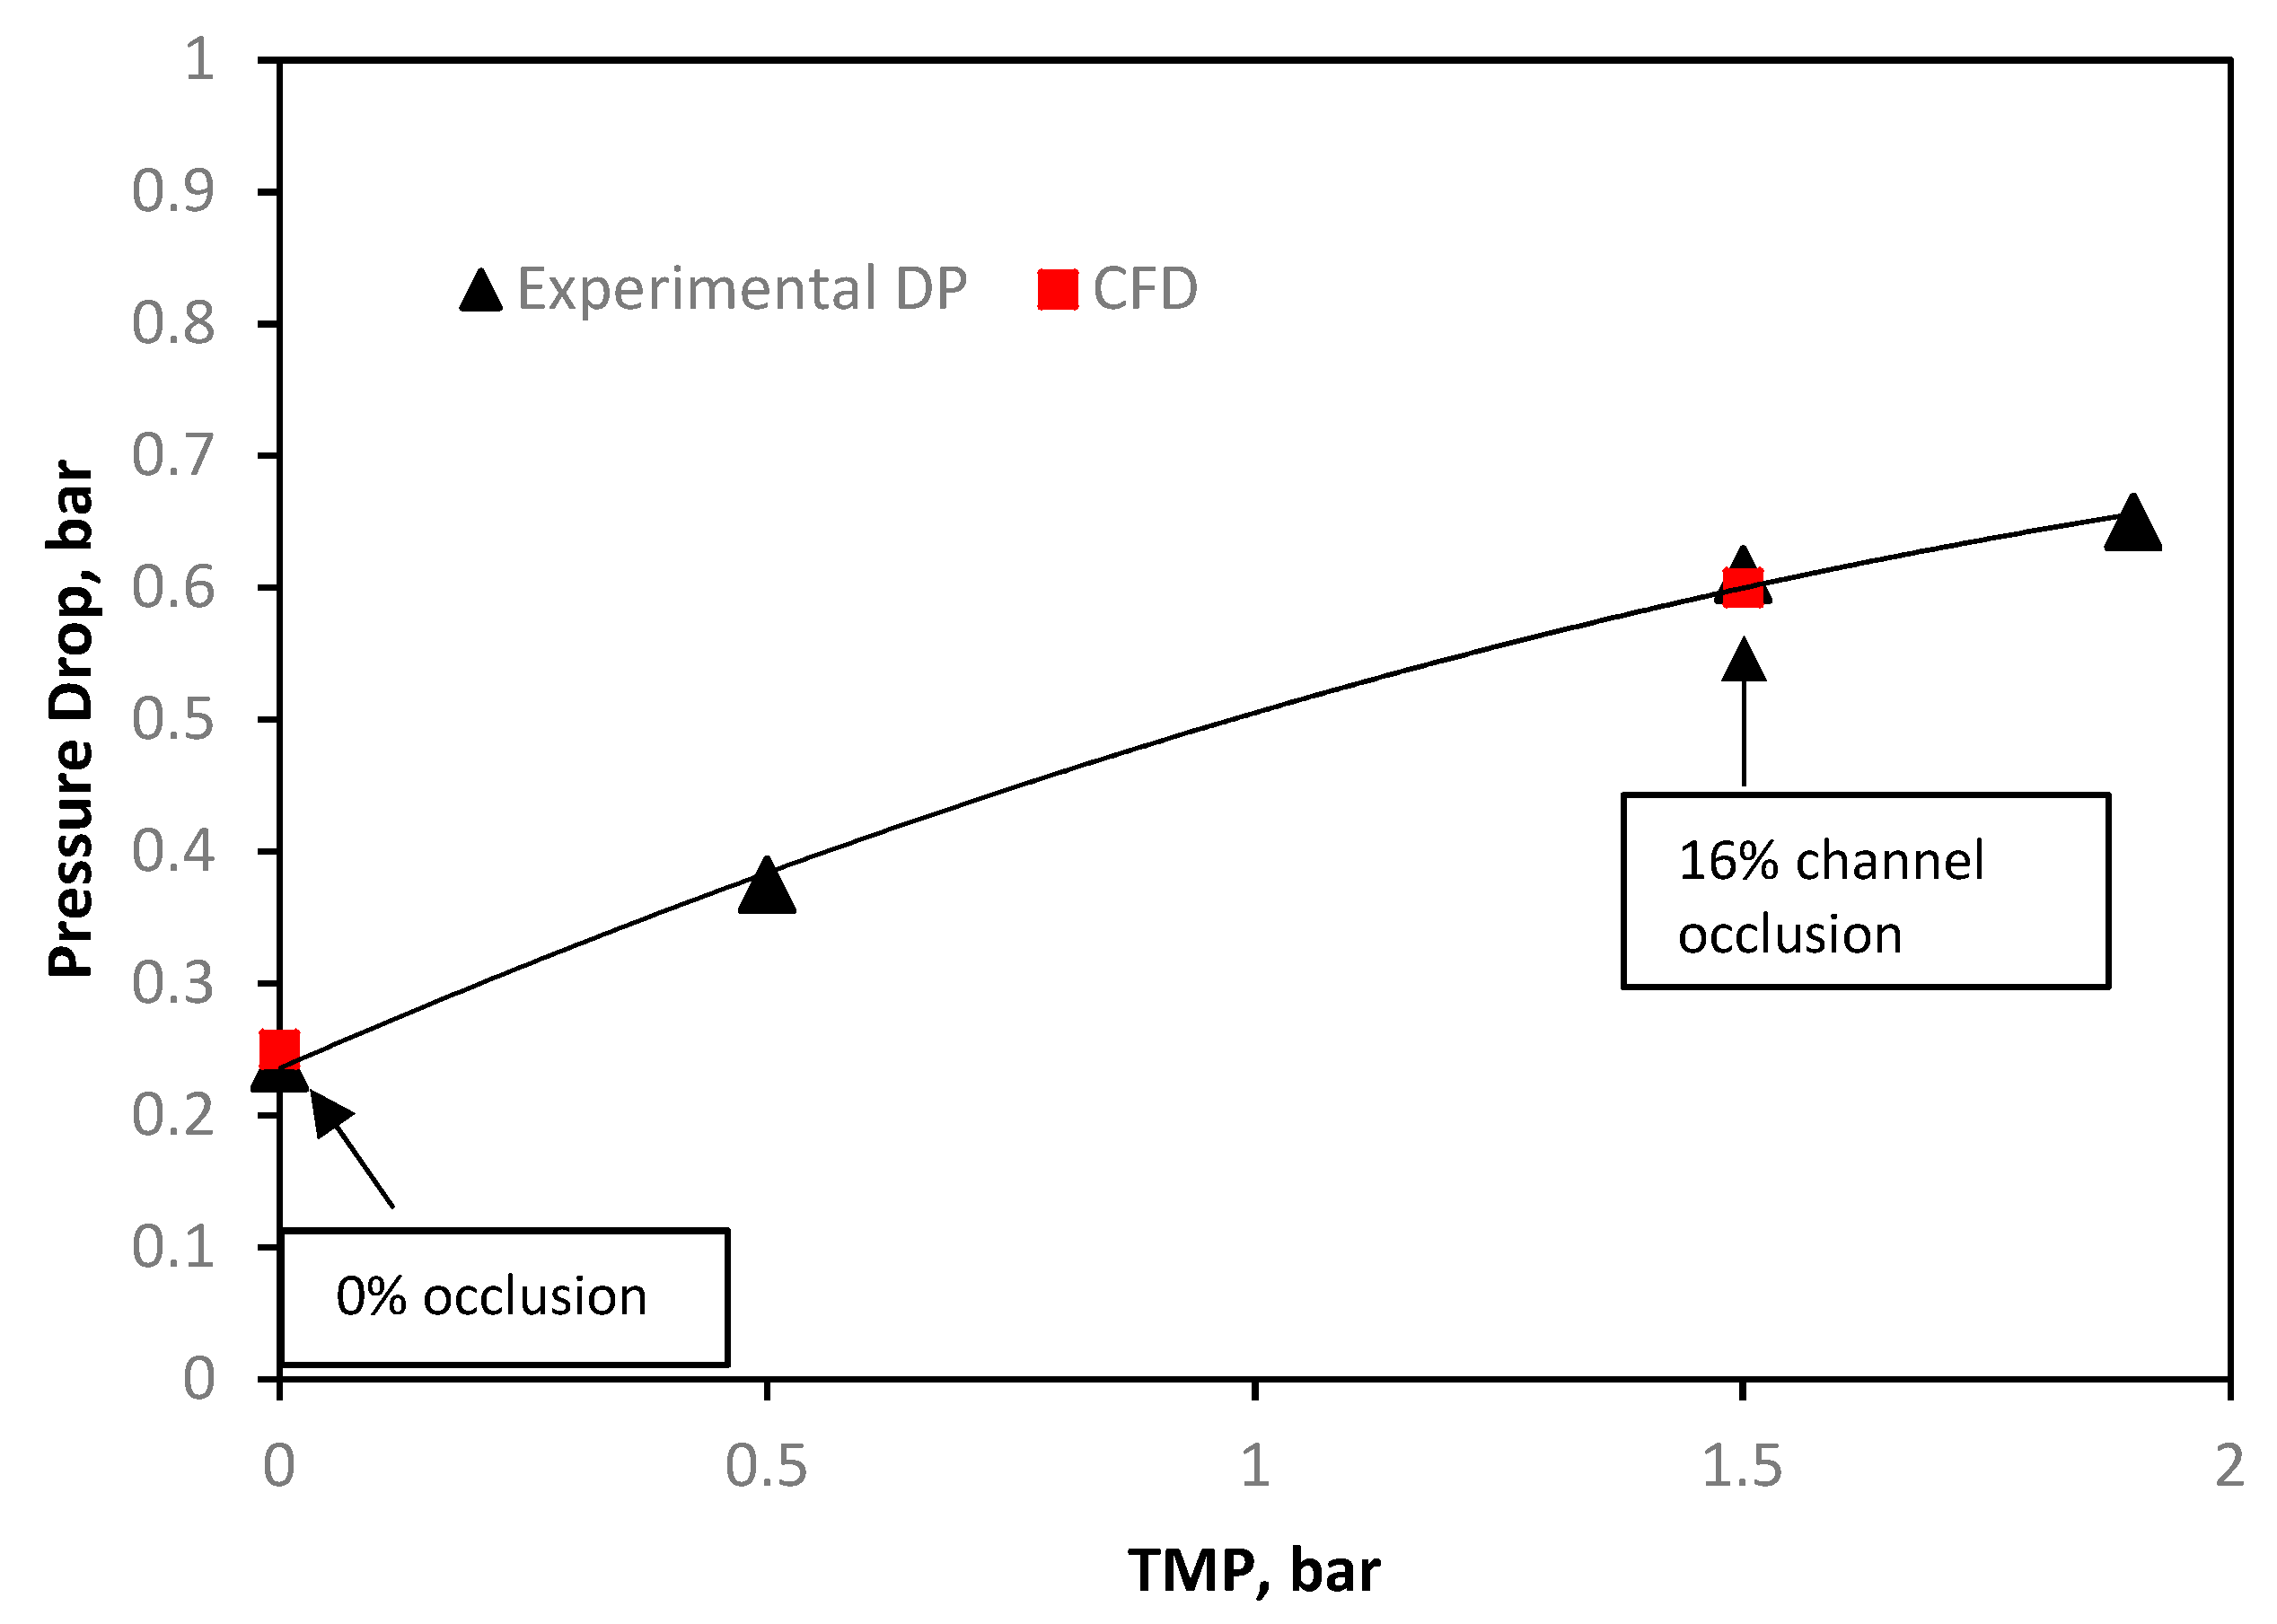
The Toray 0% occlusion channel (
Figure 3) was calibrated against the experimental channel at negligible TMP. The initial pressure drop is caused by the resistance of the spacer in the draw-channel. At 1.5 bar of TMP, the channel height was contracted such that the experimental pressure drop matched a channel that was occluded at 16%. The lower degree of occlusion shown in the Toray module when compared to the Porifera module (
Figure 2) is due to the increase mechanical support of a fine mesh draw-spacer.
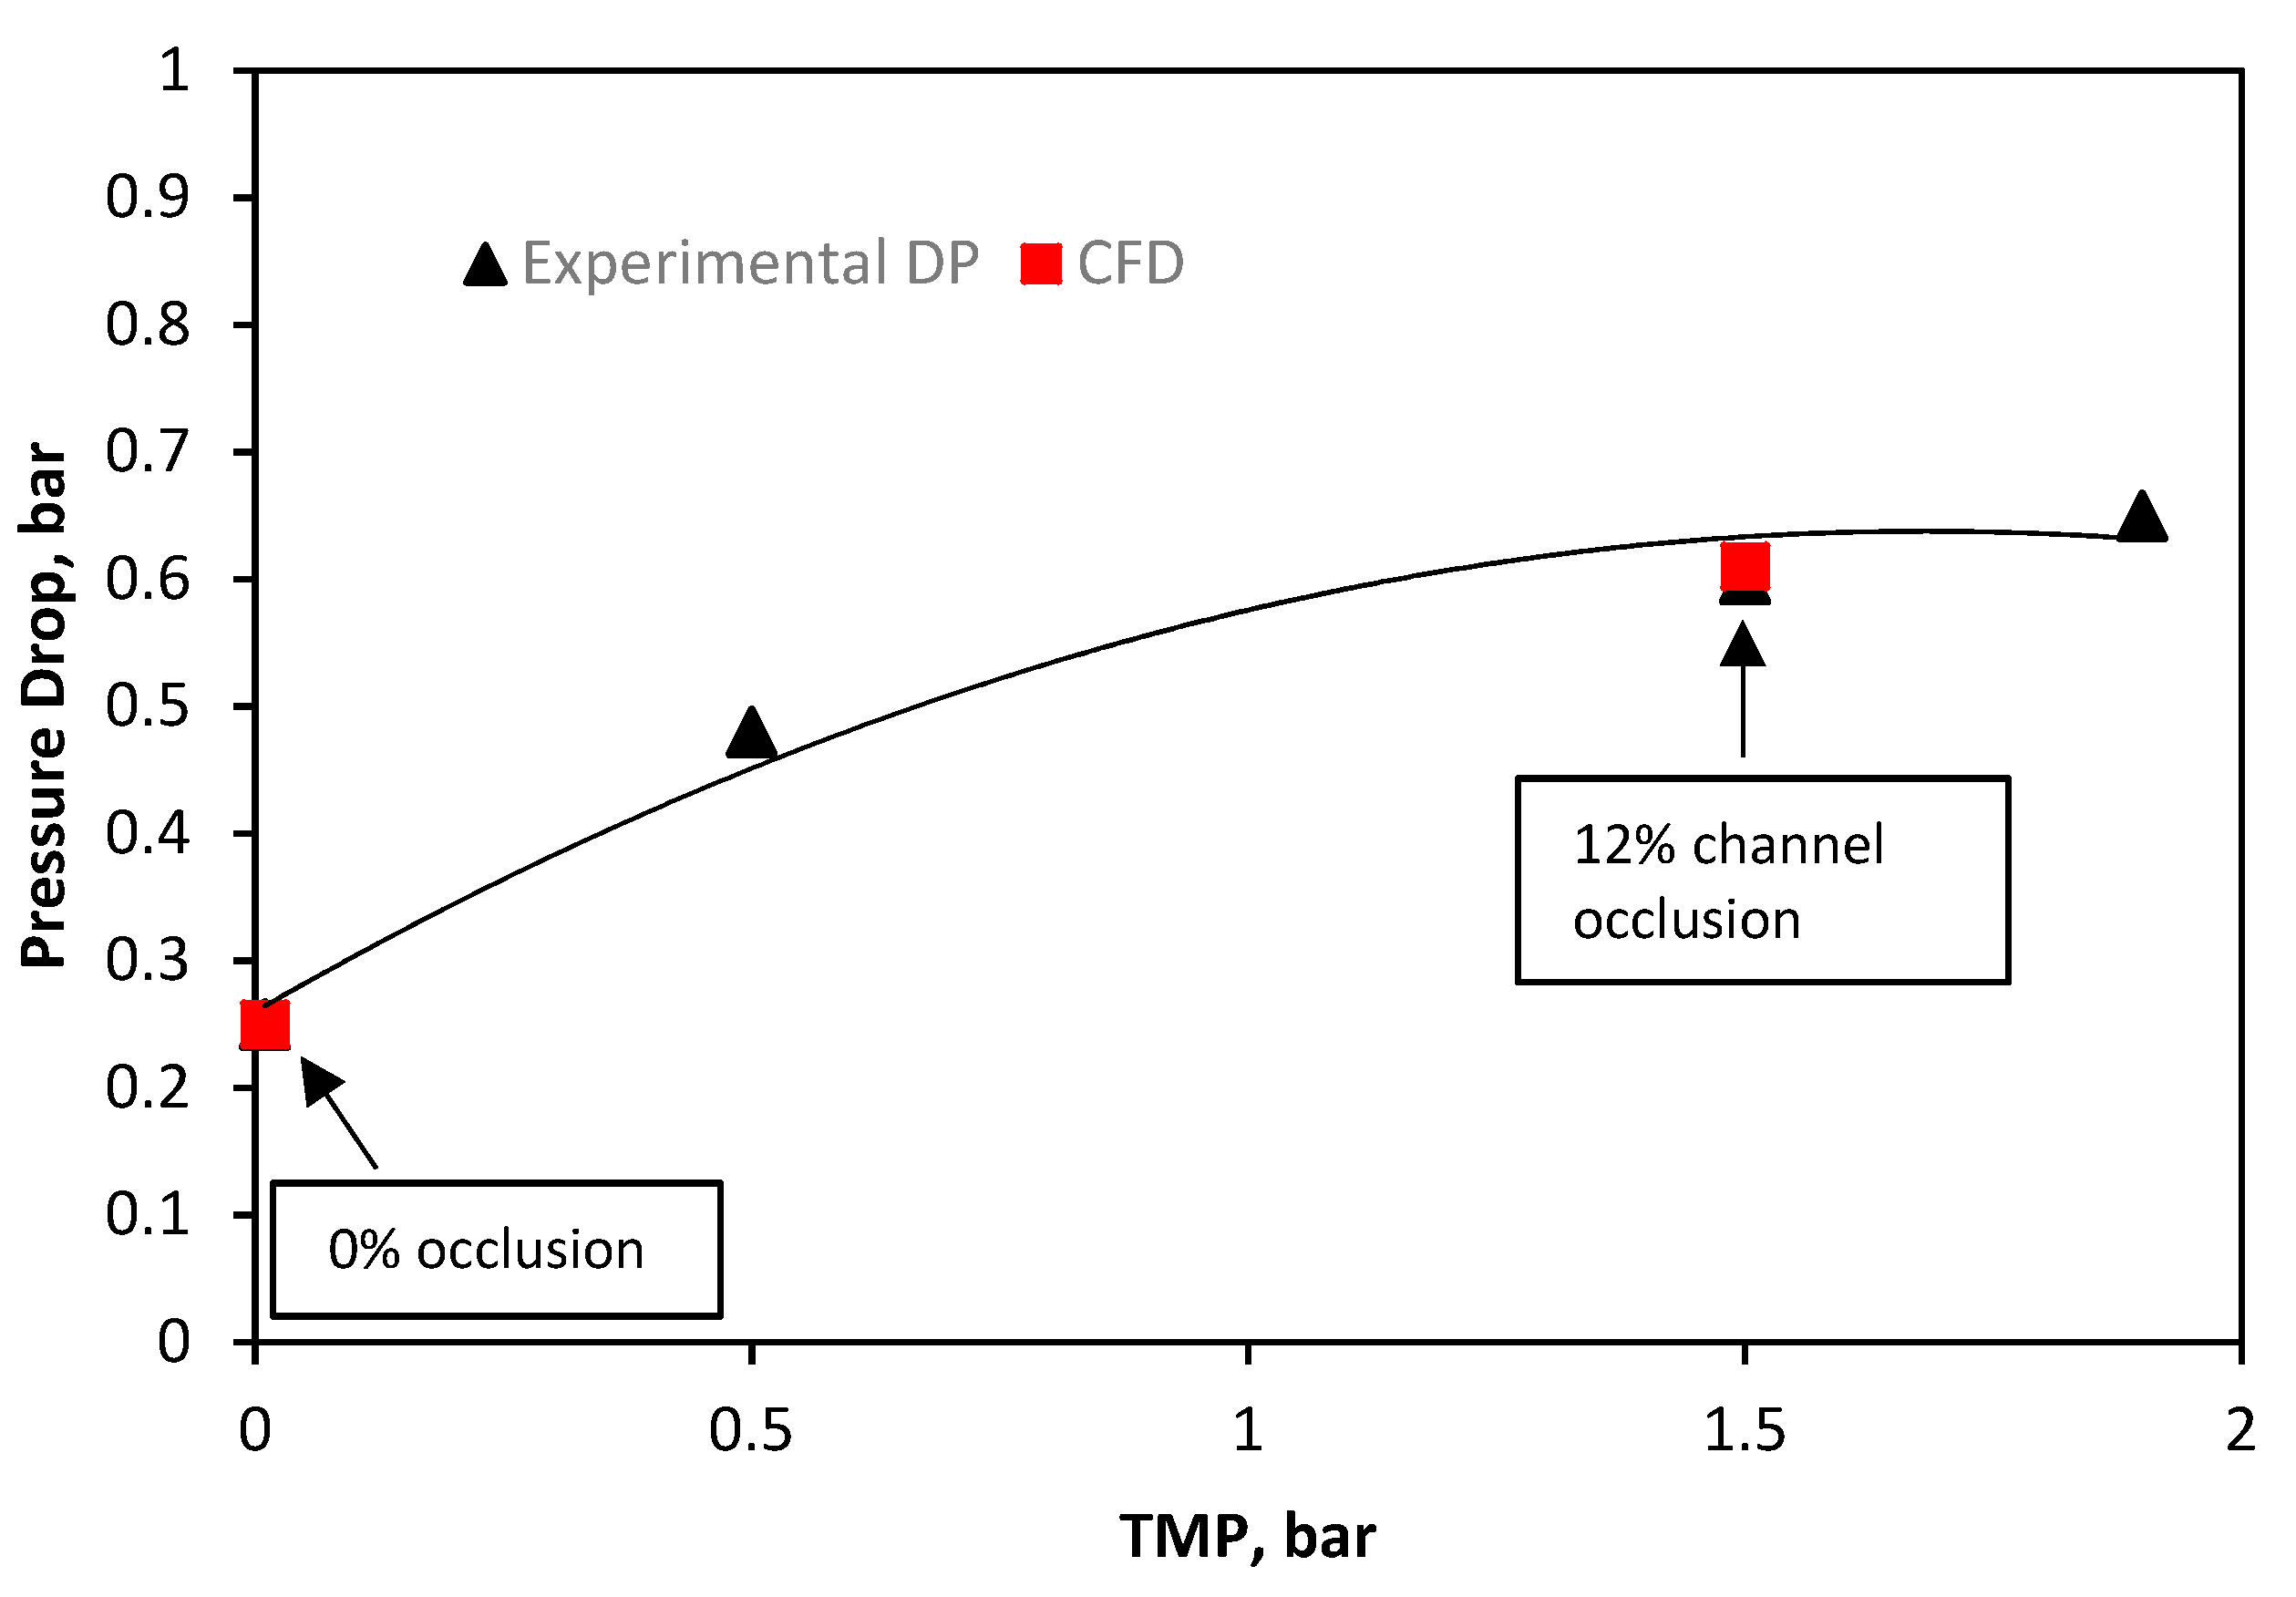
The CFD validation of the HTI module (
Figure 4) was from the same dataset as the Toray module, and as such follows the same format. The CFD open channel (0%) was calibrated against the experimental data at negligible TMP and demonstrates a similar pressure drop to the other SW module (Toray,
Figure 3). At 1.5 bar of TMP, the experimental pressure drop matches a CFD geometry of 12% occlusion. The HTI spacer is a dense/rigid Tricot spacer, with the highest degree of mechanical support provided across the three modules [
17]. The mechanical support of the dense HTI draw spacer allows for the least deformation, and therefore least channel occlusion (12% at 1.5 bar TMP). Furthermore, the Porifera “dot-spacer” design for the draw-channel offers by contrast the least mechanical support [
18], and subsequently the highest (49%) channel occlusion under pressure. Overall, the three FO modules clearly demonstrate a region of deformation, whereby the pressure-drop change with inlet pressure is high, physically representing the membrane moving closer to the draw-channel spacer for mechanical support. Subsequently (but not shown within the reported TMP range in this study), the pressure-drop gradient is lower; while some further membrane deformation may occur, the increase in occlusion at higher TMP is significantly slower and expected to reach insignificance since the membrane rests fully against the spacer or channel wall. From these results, a comparison point at 1.5 bar TMP is now used for the rest of the paper to investigate the effects of TMP on hydrodynamics, CP, and therefore overall flux performance.
3.2. Shear Strain Analysis
Utilising the two comparison points of channel/membrane behaviour at 0 and 1.5 bar of TMP, the effects of TMP on draw channel hydrodynamics can be assessed in detail by 3D CFD simulations. Shear strain analysis is an assessment of the force exerted by a fluid on the membrane surface, previously reported in the literature for its effects on fouling and more importantly, ECP [
18,
27,
28]. The effects of TMP on the shear rate at the membrane surface, as well as the bulk fluid, are further investigated and linked with CP considerations directly in later sections of this study.
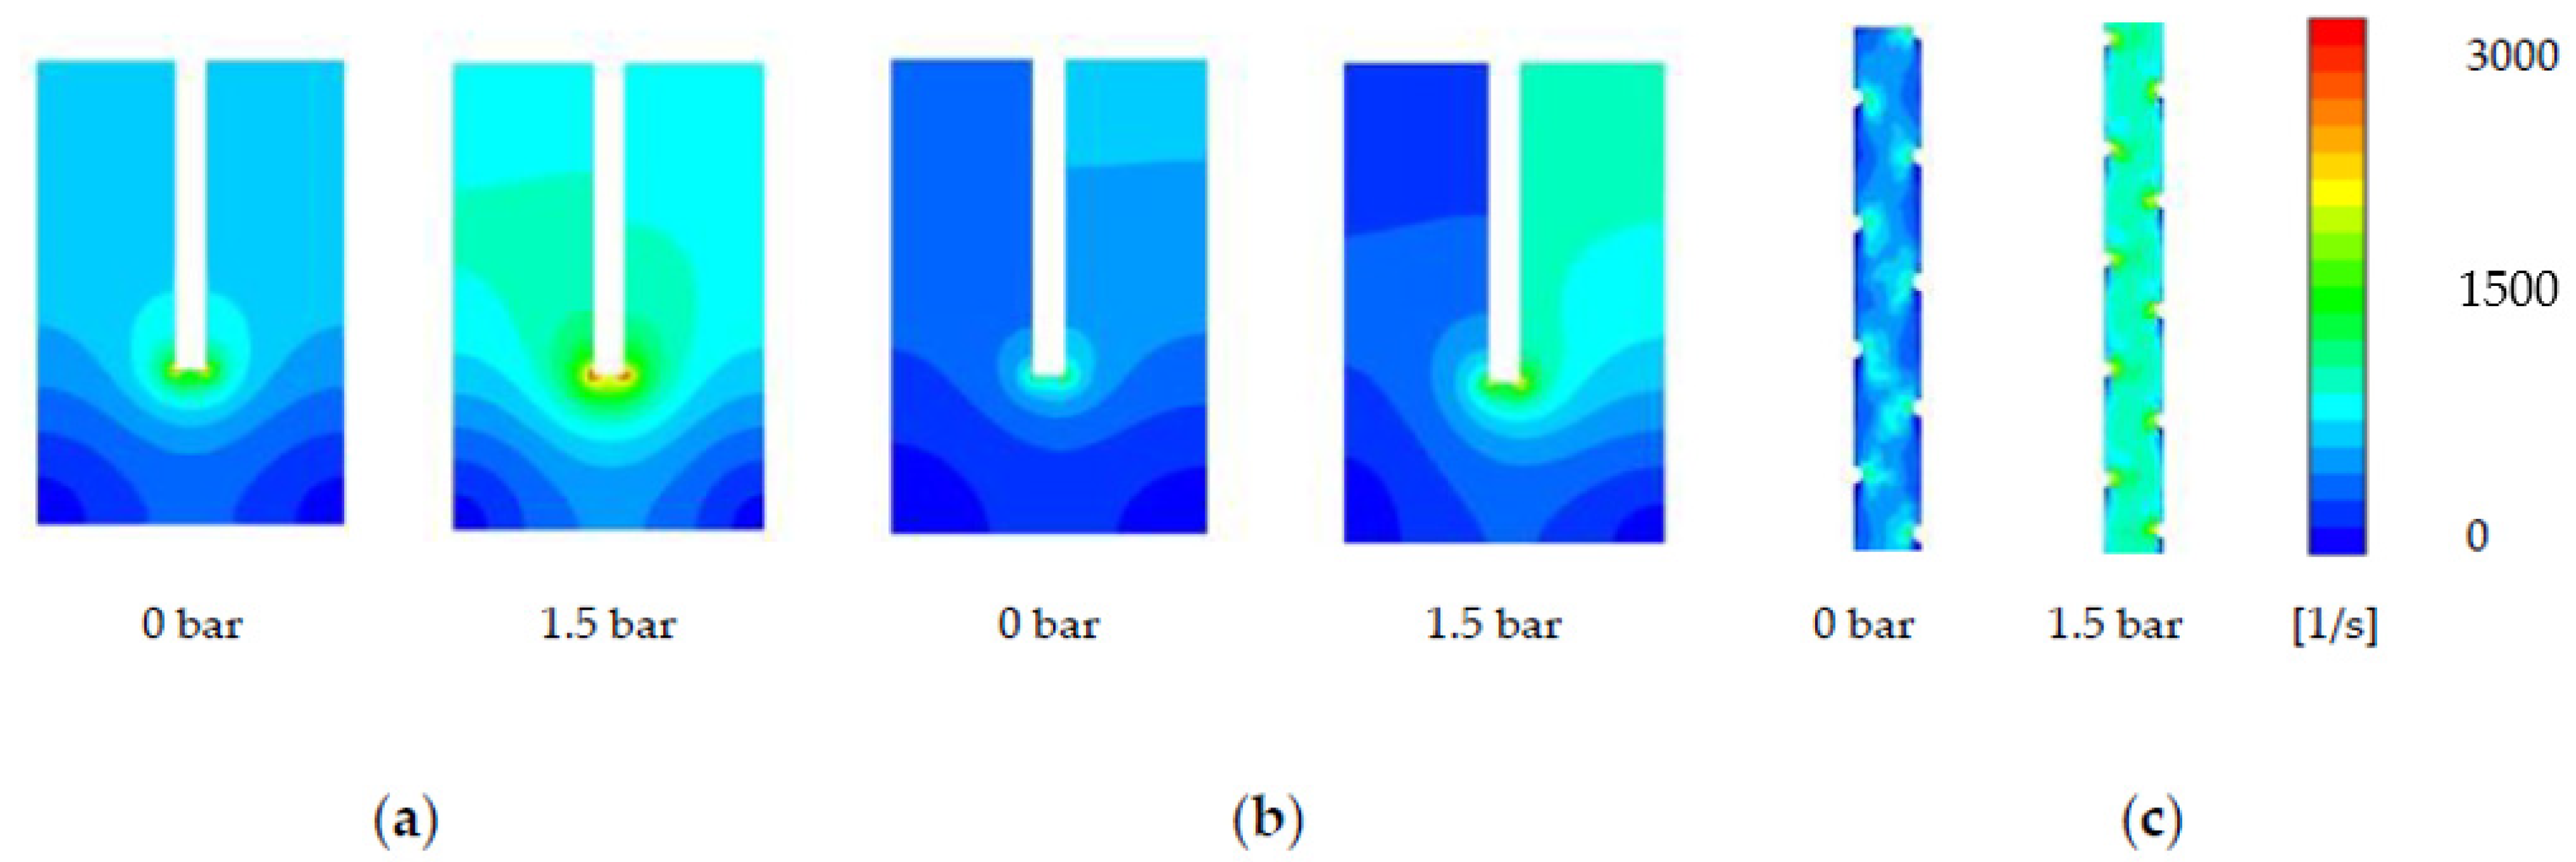
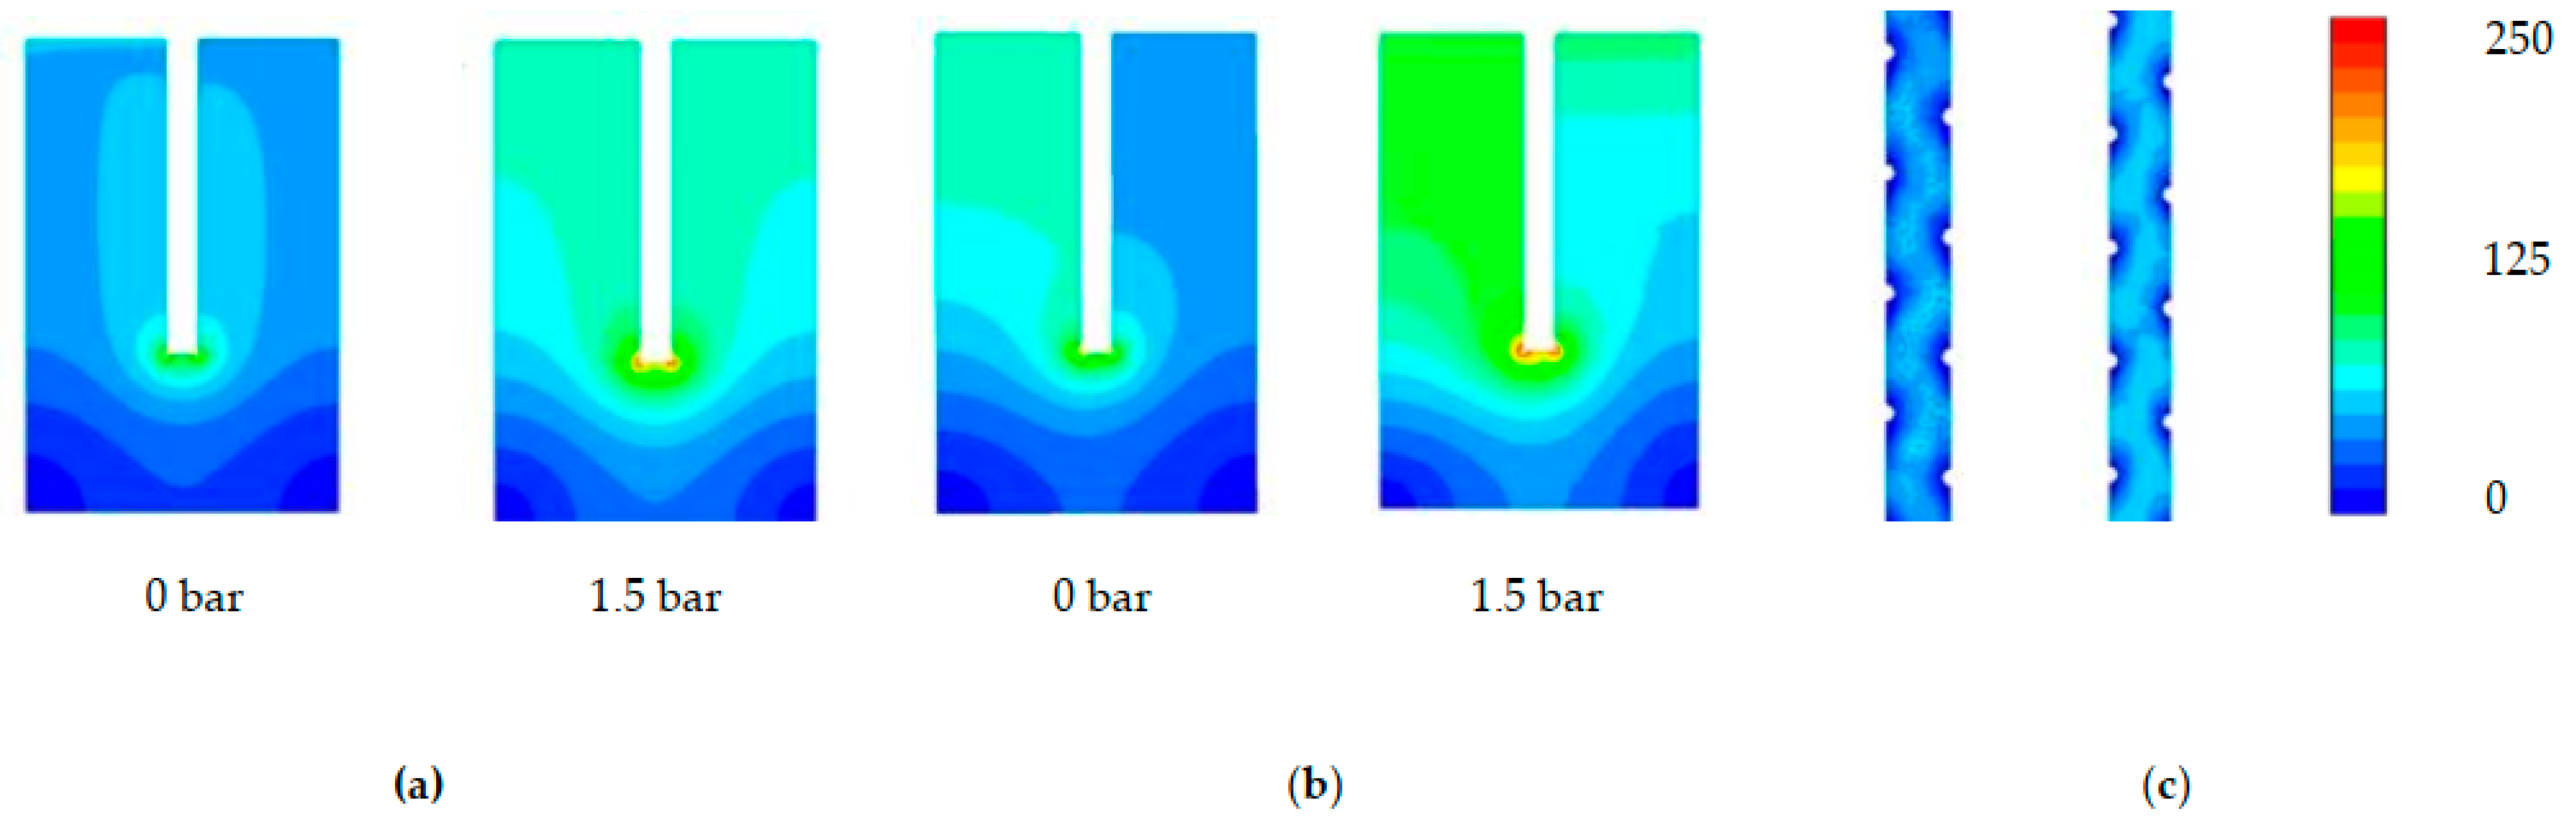
The Toray module (
Figure 5a) shows the most significant change of the SW modules to shear rate on the membrane surface under the effects of 1.5 bar TMP. The membrane shear strain rate distribution at 0% occlusion shows high shear stress (657 ± 63
) within the straight channel of the membrane leaves, and dead-zones of lower shear rate as expected in the corners (13 ± 25
). At 16% (1.5 bar TMP) occlusion, the straight channels that cover the majority of the shear distribution demonstrate a shear rate increase to 825 ± 63
, as expected of a narrower channel where the fluid local cross flow velocity (CFV) increases in proportion to a lower cross-sectional area. The HTI demonstrates a more uneven distribution of shear strain on the membrane surface (
Figure 5c), and a lower initial shear stress when compared to the Toray module (375 ± 63
). This uneven shear strain distribution is likely due to the denser spacer, creating more flow resistance and higher gradients of strain (noting that all simulations were run at 0.1 m/s). The shear strain increase with a 1.5 bar TMP of an applied to the HTI membrane increases the majority of the shear stress in the straight channels to (657 ± 63
). The Porifera membrane has the least consistent shear stress distribution on the membrane surface, with each spacer creating a shear “dead-zone” along the length of the channel (
Figure 5c). This inconsistency leads to two visually dominant shear distributions of 657 and 825 ± 63
within the 0% channel. The Porifera module has the least dense spacer of the three modules, and the low mechanical support creates a wider distribution and a much higher number of dead-zones. All three modules, however, overall demonstrate significant shear increases on the membrane surface with applied TMP pressure of 1.5 bar.
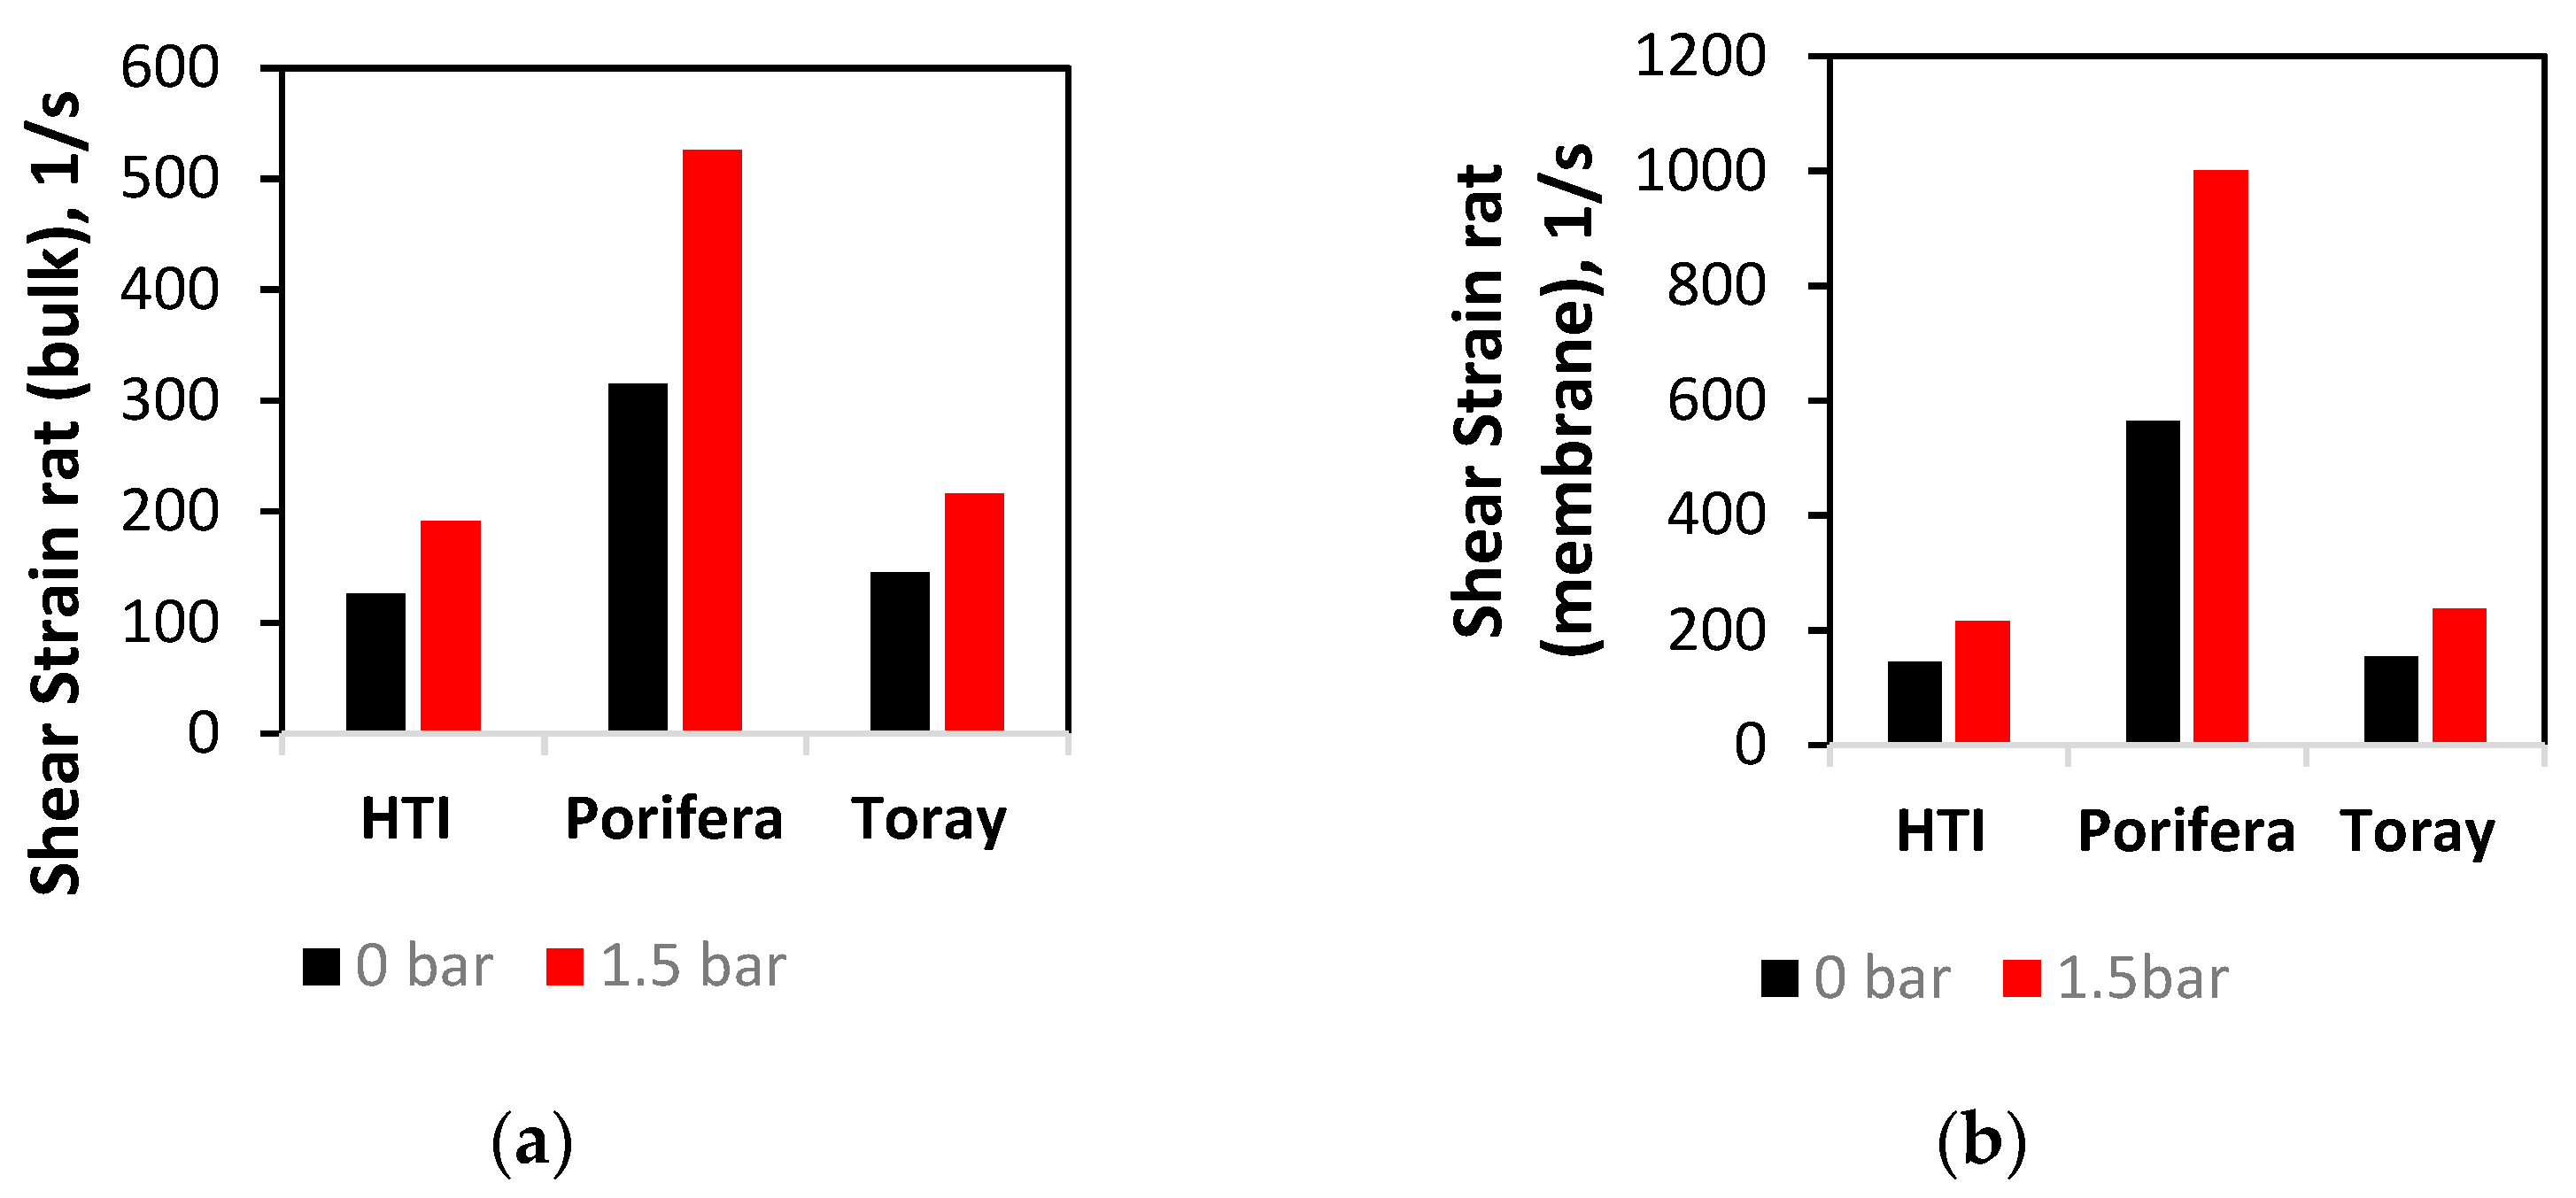
Figure 6 shows the average values of the shear rate in the bulk average of the fluid, and represents the average perpendicular force exerted fluid in the draw-channel. The Porifera module is observed with the highest average shear rate in both the bulk fluid and at the membrane surface (315 and 526
), matching the observed trend on the membrane surface (
Figure 5). The Toray has the lowest shear values, further matching the open nature of a larger channel. Overall, the three modules experience an increase in shear rate at both the bulk flow and membrane surface when TMP is applied. Additionally, the shear rate is much higher at the membrane surface, even with a relatively low CFV of 0.1 m/s and narrow channel size (1–3 mm across the modules). Additionally, on both the membrane and bulk fluid, an applied TMP of 1.5 bar increases the shear by more than double for all the modules studied. This shear increase has implications on efficiency and CP performance, to be further investigated in this study.
3.3. Reynolds Number Analysis of Flow
ANSYS Fluent was used to calculate the Reynolds number distribution on the membrane surface, as well as the membrane average and bulk average values to produce a detailed assessment of turbulence in the modules, under the effects of applied TMP (1.5 bar). The assessment of Reynolds number in the draw-channel aims to provide a complimentary assessment to shear strain and further detail to an overall hydrodynamic analysis.
The Toray shows the lower Reynolds distribution (
Figure 7a) of the SW modules, with the straight channels of the membrane’s leaves showing symmetrical and majority values of 56 ± 13. Symmetrical dead-zones of low turbulence are found in the corners of the membrane sleeves, as well as a slight increase to 81 ± 13 on the corner of the glue-line, with an observed increase in the severity of the glue-line turbulence between the 0% and 12% channels. An increase of Reynolds number to 69 ± 10 occurs under a TMP increase of 1.5 bar, an explanation of which is the increase in fluid velocity due to a decrease in the cross-sectional area (similar to
Section 3.2). The HTI module has the most extensive range in the distribution of the Reynolds number across the membrane surface (
Figure 7b). Furthermore, the range across the outlet channel of the membrane leaf is of a much higher range than the Toray module (10 vs 68 ± 10). This phenomenon can be explained by the less dense spacer of the Toray draw module, and hence emphasises the importance of contour maps as a means of measuring Reynolds distribution in FO modules with larger draw-channels (
Section 3.1) [
17].
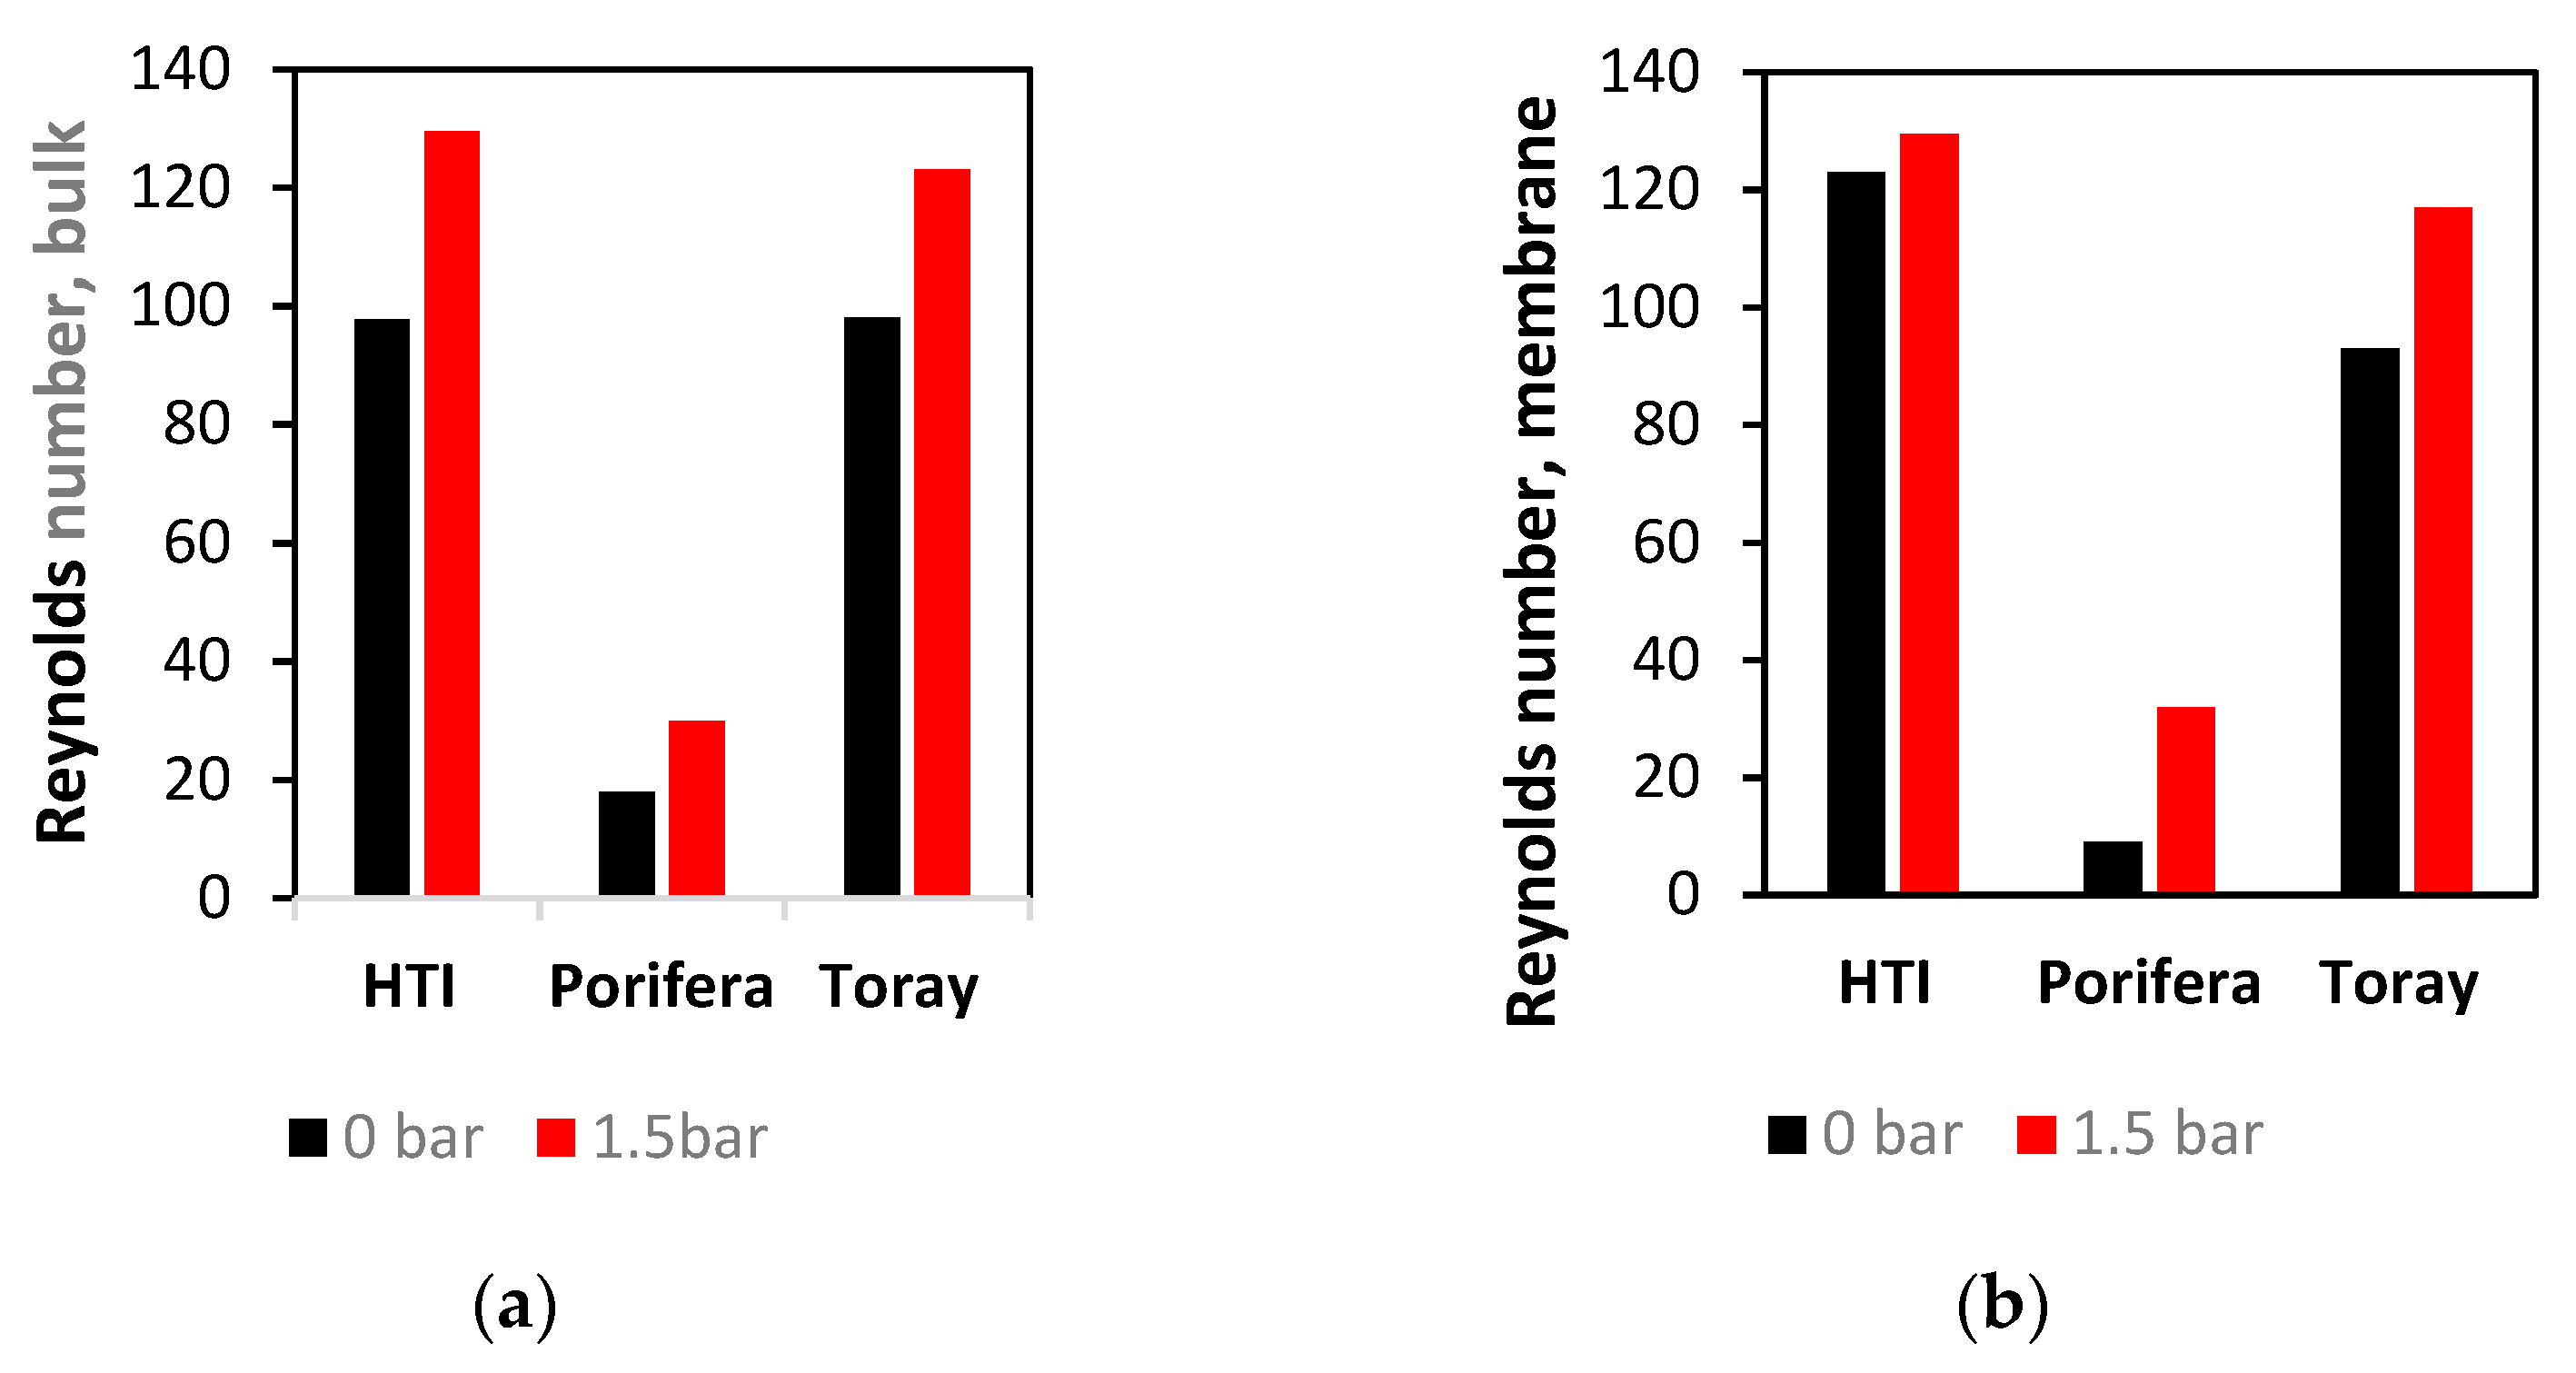
In direct contrast to the shear data (
Section 3.2), the Porifera module has the lowest average Reynolds number at any TMP in the bulk fluid flow (
Figure 8a). Additionally, at the membrane surface, the Porifera module is observed as the lowest Reynolds number, and when TMP of 1.5 bar is applied (
Figure 8b), it also shows the least significant increase under applied pressure. Hence, the Porifera module Reynolds number is the least sensitive to deformation, likely due to the low degree of mechanical support offered by the draw-spacer and lack of turbulence promoters evenly distributed like a SW mesh spacer. Additionally, the turbulence is much lower on the membrane surface, an opposing trend to the shear strain data (
Section 3.2). Overall, the detail shown in
Figure 7 presents a similar contour profile to the shear strain data shown in
Figure 5 but with less severity in the effect of TMP (with the exception of the Porifera module). This detailed assessment of turbulence through Reynolds number will be further characterised and linked to CP later in this study.
3.4. TMP Effects on CP
The impact of TMP on deformation and subsequent draw channel contraction clearly affects the hydrodynamics within FO modules; as such, an assessment of applying TMP on overall efficiency and CP is proposed. The CP effects are then linked to the CFD hydrodynamic analysis from
Section 3.2 and
Section 3.3 later in this study.
Firstly, the PF and SW flux data were assessed by expressing the flux as a percentage of the maximal possible flux to determine the overall flux efficiency (Equation (3)) from experimental data previously reported in the literature [
3,
17,
21]. The flux data were then used to determine osmotic efficiency, which characterizes the effectiveness of the osmotic component in the driving force (Equation (4)). Subsequently, the flux data were processed in a CP modulus model [
10] to characterise both ICP and ECP. The flux and osmotic efficiency is then compared against ICP and ECP across a range of TMPs, expressed as a percentage change from initial conditions to normalise different operating conditions.
The efficiency and CP analysis was first assessed on the membrane scale, where data from the literature were used in this study, given at 0 and 4 bar and studied in a small-scale crossflow cell [
3] (
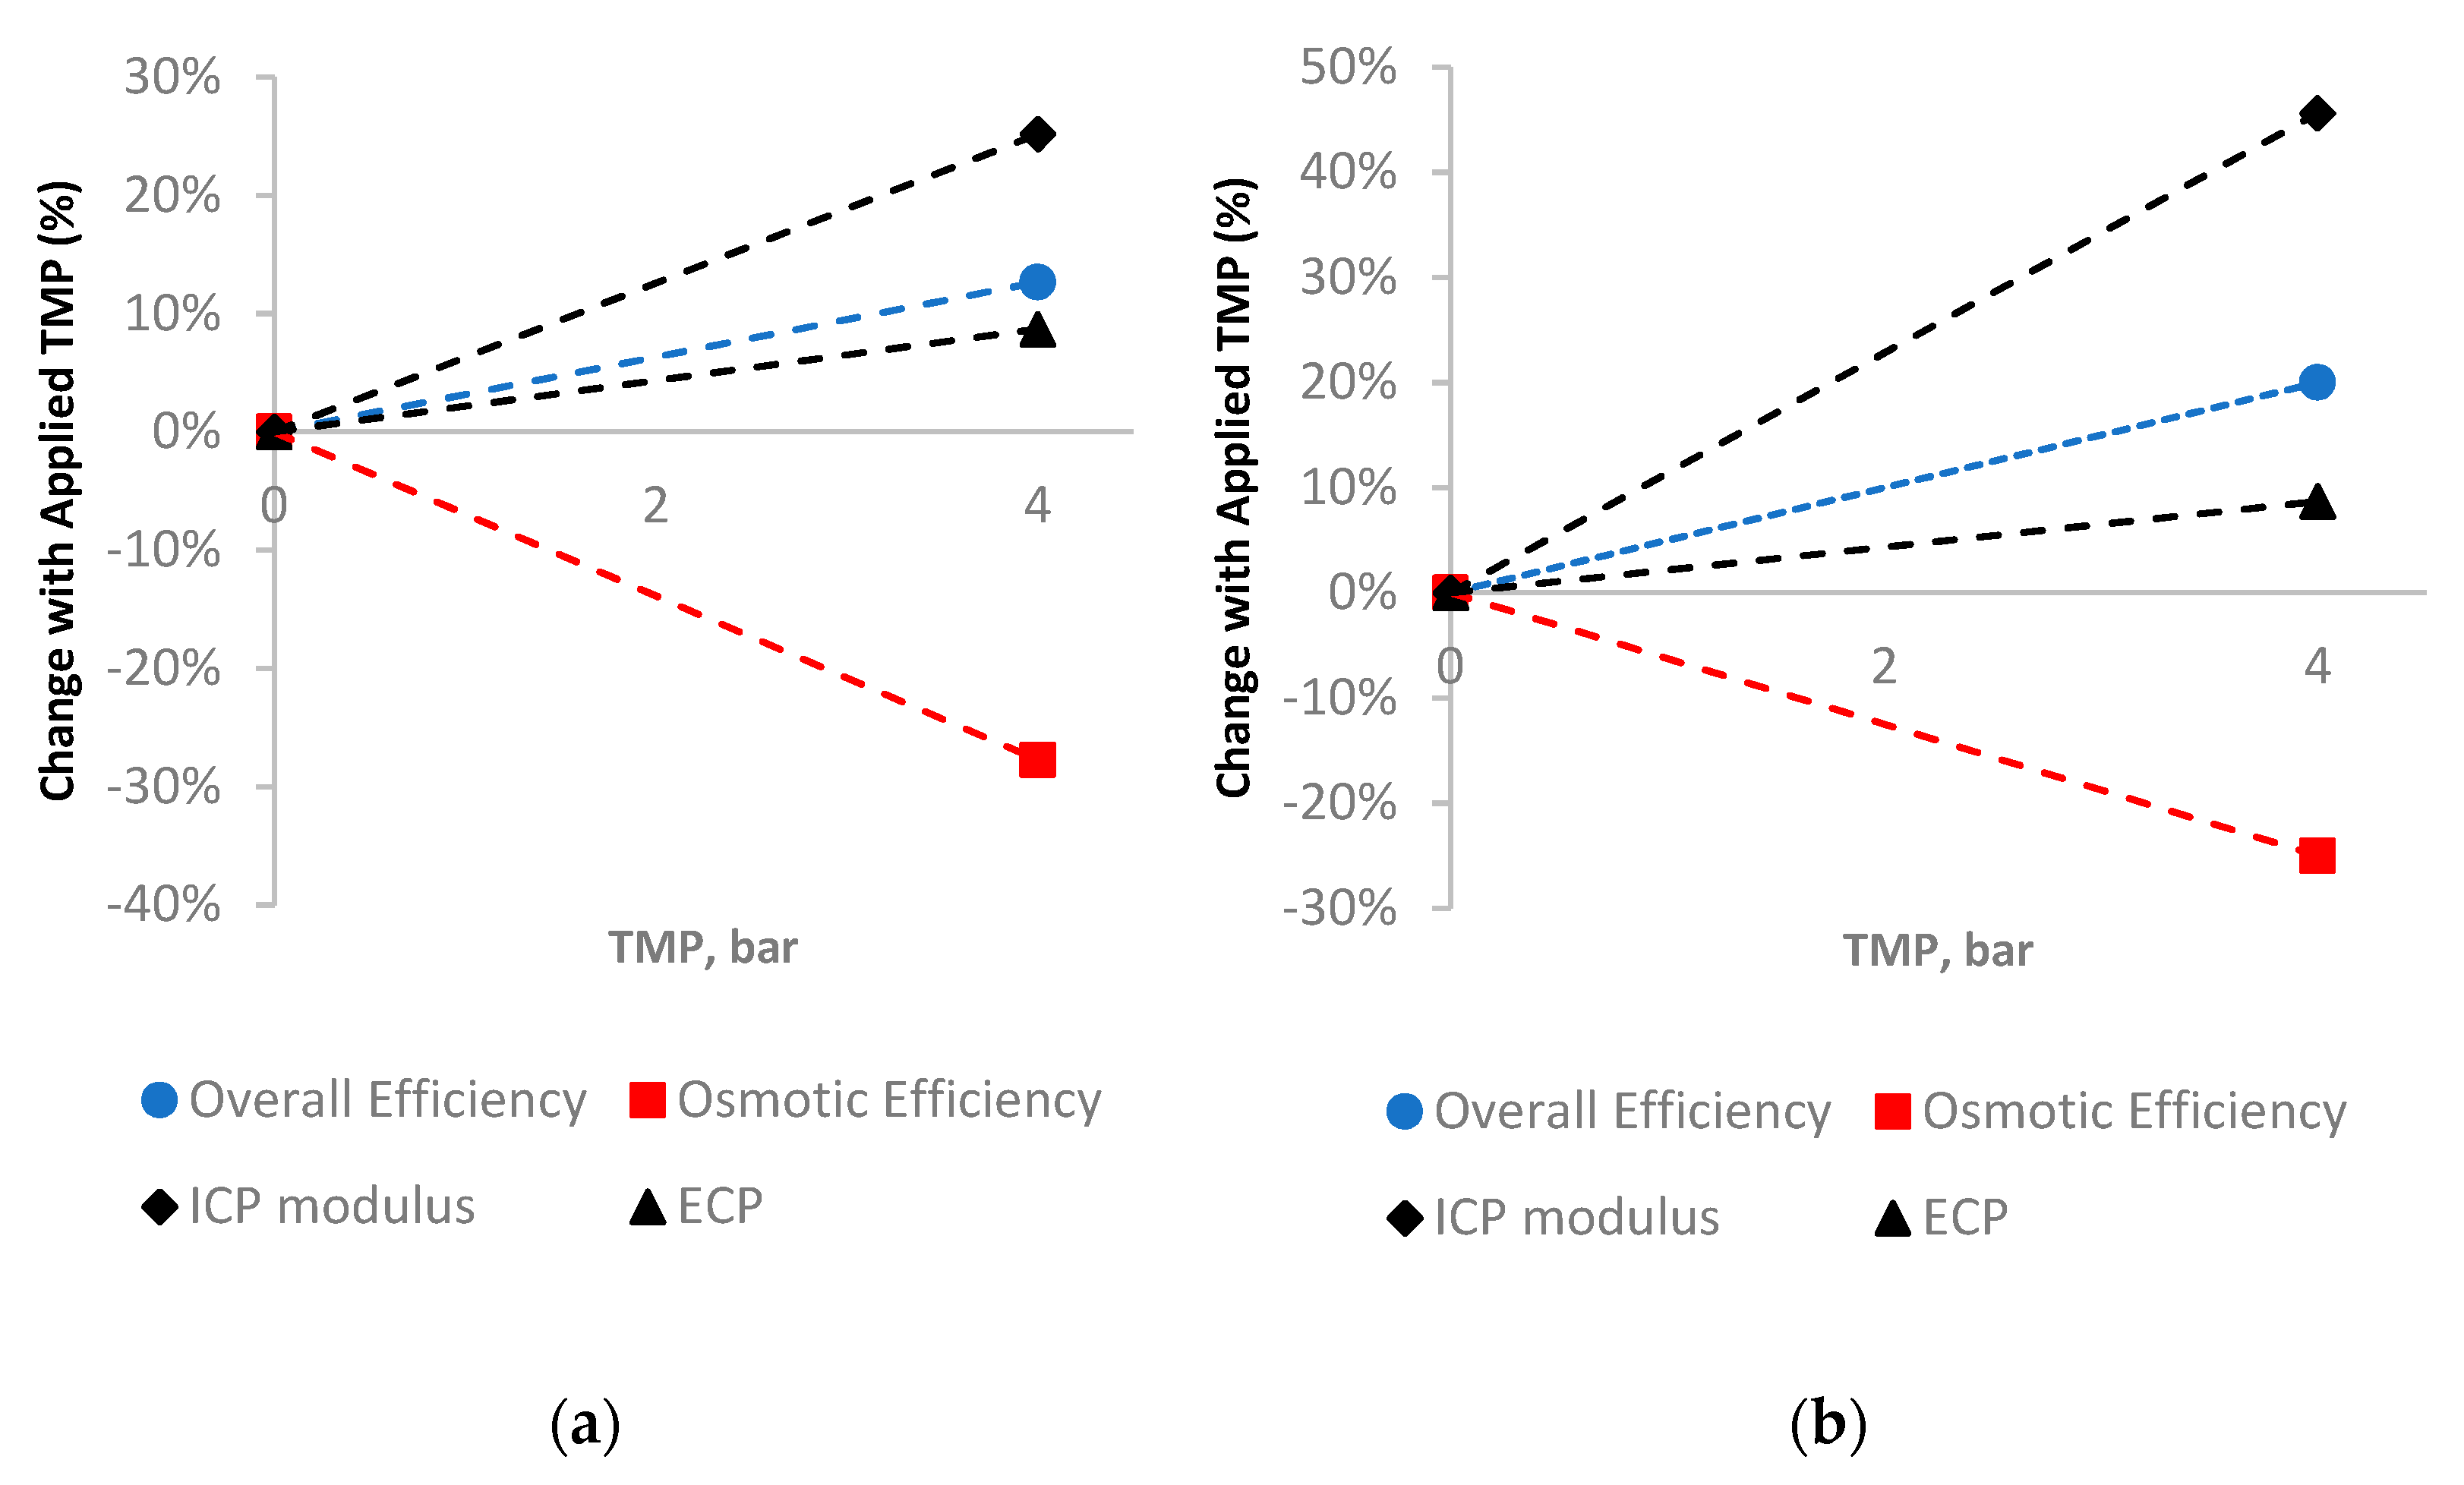
Figure 9). The data are expressed as a percentage change from conditions at 0 bar TMP (FO mode) to normalize the initial operating/membrane characteristics and allow for a direct comparison between membrane and module scale.
Figure 9a is the HTI membrane and illustrates the overall trends to be expected for FO membranes operated under TMP. The overall efficiency increases by 13%, with the addition of hydraulic pressure in an FO process (whereby the hydraulic component of the driving force is almost 100% efficient). The osmotic component of the driving force decreases as the higher pressure causes higher flux, and, thus, the osmotic pressure is hindered by CP. This increase is illustrated in
Figure 10a in both the ICP and ECP increase of 25 and 8%, respectively, as expected with increasing flux [
10]. The Porifera membrane has a higher hydraulic permeability [
3], and so higher flux with TMP; thus, the CP effects are greater with higher pressure/flux. The Porifera membrane has a 46% increase in ICP, yet this is balanced with a higher overall flux efficiency increase, as the effects of CP are balanced against the hydraulic permeability.
The efficiency and CP analysis was then performed at the module scale, to determine the effects the different module and spacer designs exhibit under applied TMP, shown in
Figure 10. The analysis was again performed on flux data from the literature, expressed as percentage changes from initial conditions at 0 bar to allow for direct comparison.
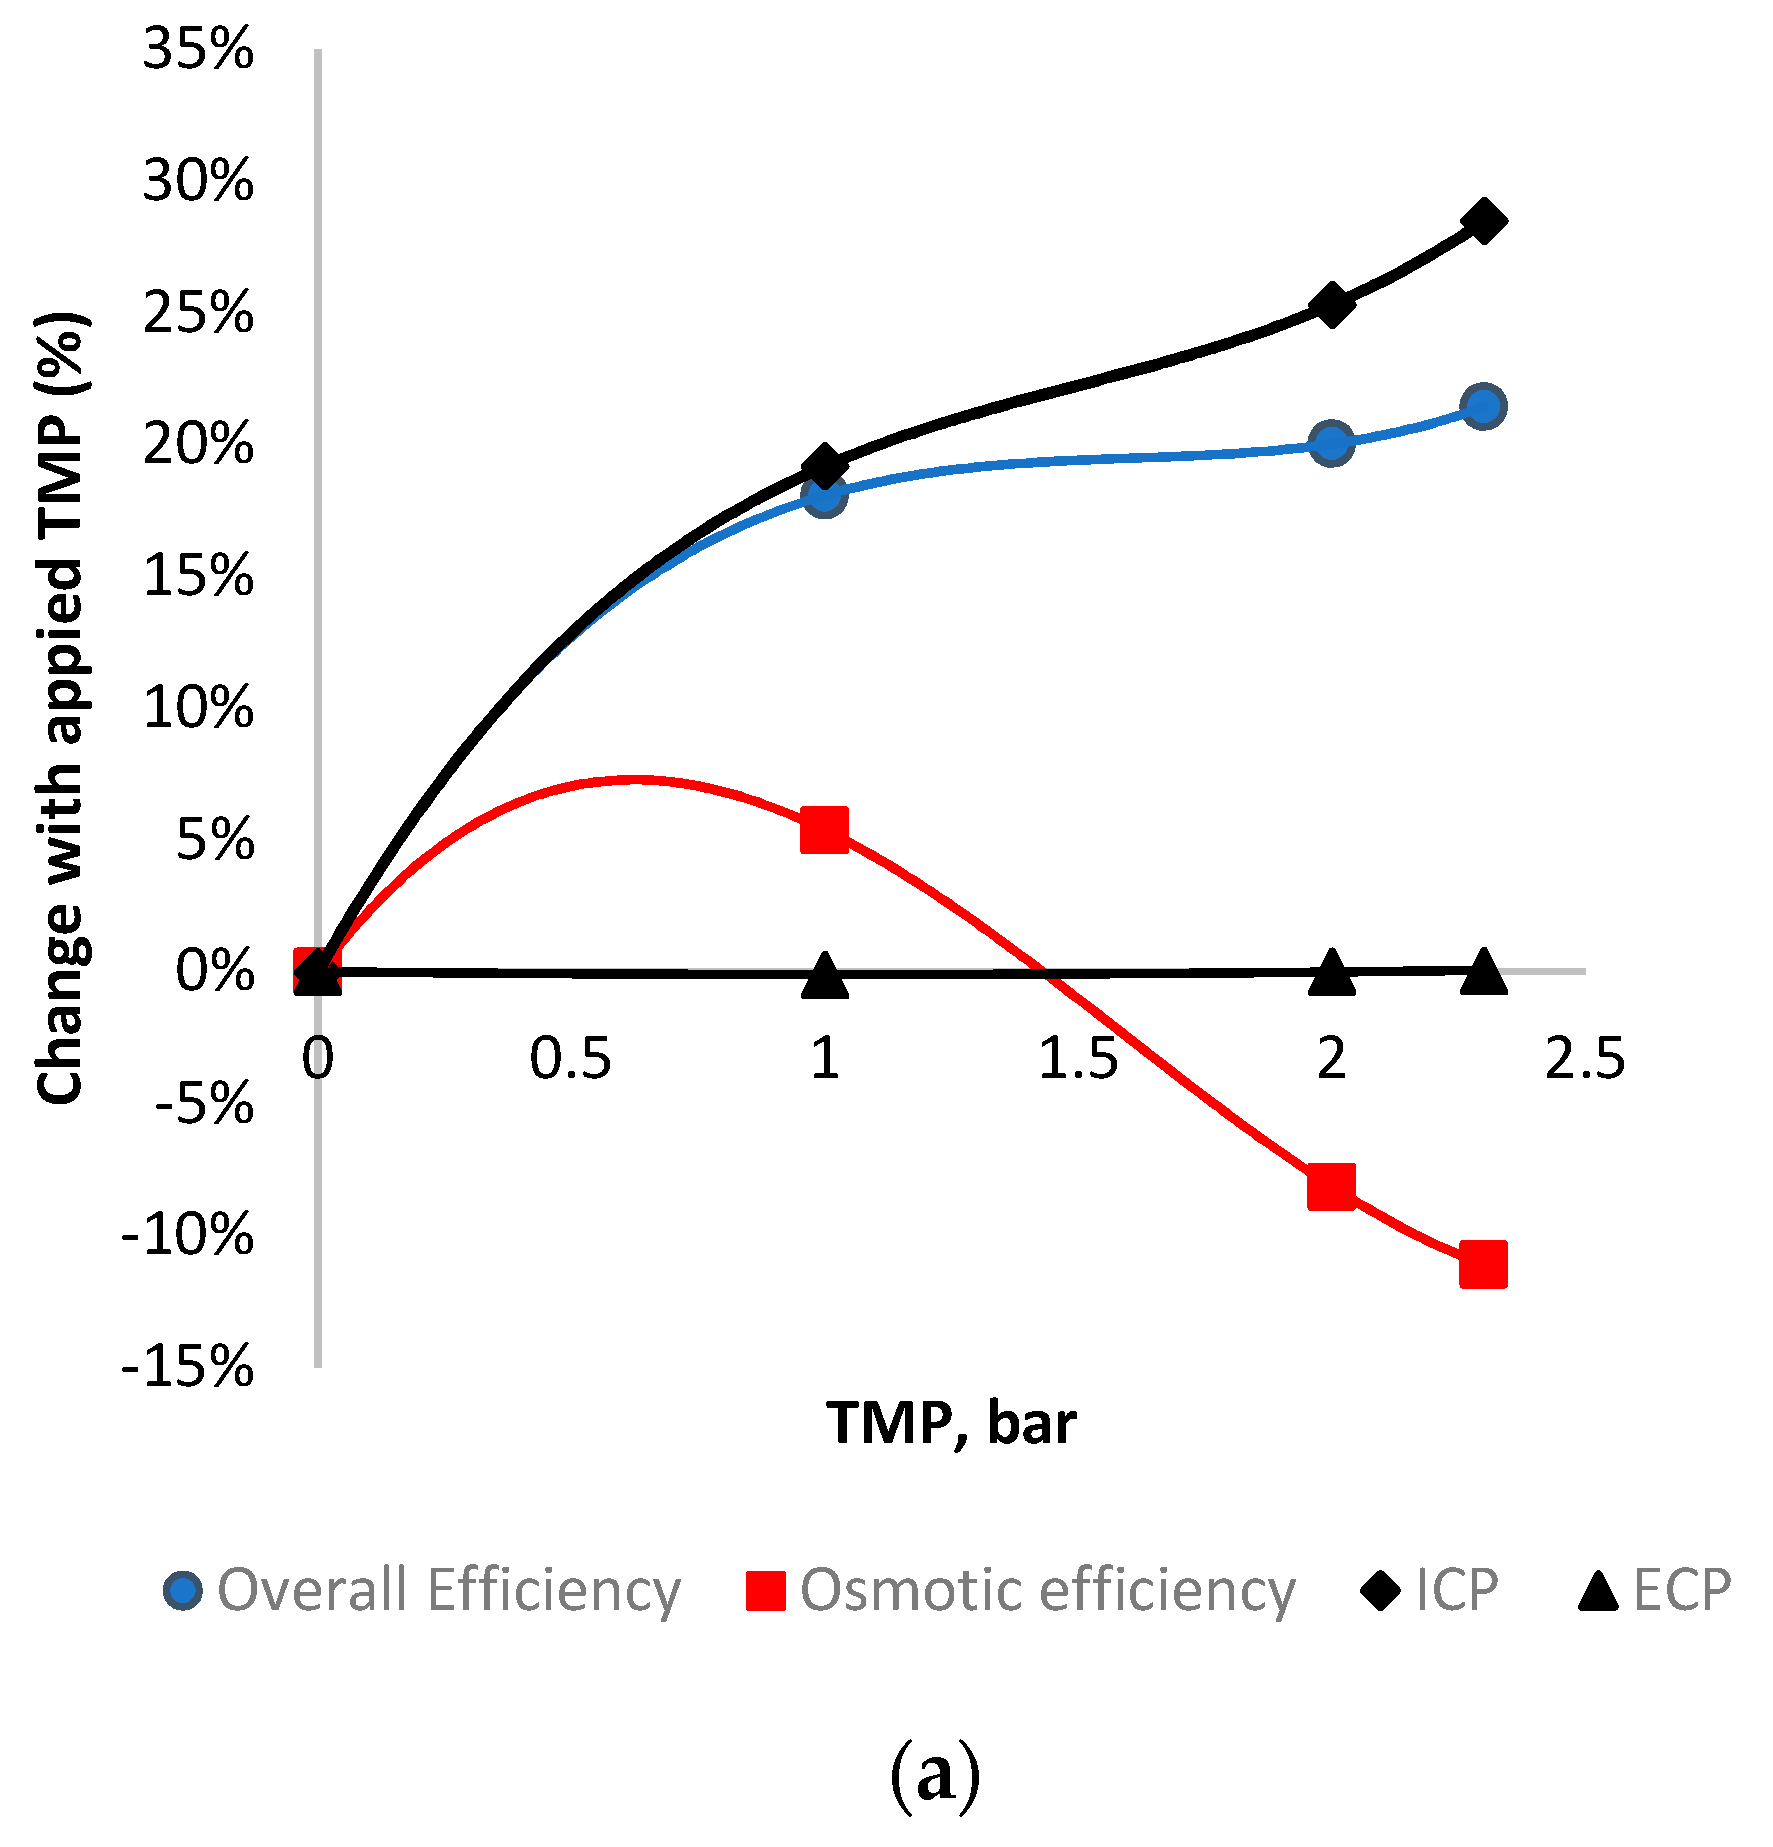
Figure 10a illustrates the efficiency and CP effects on a module scale for the HTI module, calculated based on the flux data from the literature [
17]. The TMP of 0–2.3 bar is a narrower range than the membrane-scale shown in
Figure 10a, but suits the purpose of analyzing the efficiency and CP during the membrane deformation and compares well to the overall picture given over a larger range of TMP’s. The overall flux efficiency increase found by adding hydraulic pressure into the HTI SW module was over 20% from 0–2.3 bar, matching the trends of the membrane-scale results. However, it is clearly observed that much of the efficiency gain is from 0–1 bar of TMP, with lower subsequent increases (less than 2% improvement over the subsequent 1 bar of applied TMP). Unexpectedly, the osmotic efficiency of the HTI module increases within the 1 bar TMP range, in contrast to the trends predicted from the membrane-scale analysis (
Figure 9). The osmotic efficiency then decreases rapidly from 5% to -8% over the next 1 bar of TMP. An explanation for the unexpected increase in osmotic efficiency can be found by observing the TMP band at which the improved performance occurs, noting that it matches with the deformation region of the HTI membrane (
Section 3.3). This unexpected trend indicates that the deformation has a positive effect on osmotic and overall flux efficiency. With respect to the CP analysis, the ICP increases proportionally with increased TMP (and, thus, flux), as expected given the relatively constant nature of the S parameter in FO membranes [
10,
17]. In contrast to the ICP, the ECP remains constant across the TMP’s, and does not increase as expected with higher TMP/flux. This stable ECP is in direct contrast with the increasing ECP effects under applied TMP in the membrane scale (
Figure 9). An explanation for this is the changing hydrodynamics in the draw channel, whereby TMP causes contraction, a narrower channel and a faster CFV. This fast CFV and decreasing CFV mean that the changing hydrodynamics outweigh the flux increase effects on ECP. Specifically, the ECP is held constant by the higher Reynolds number, and, as such, the higher “
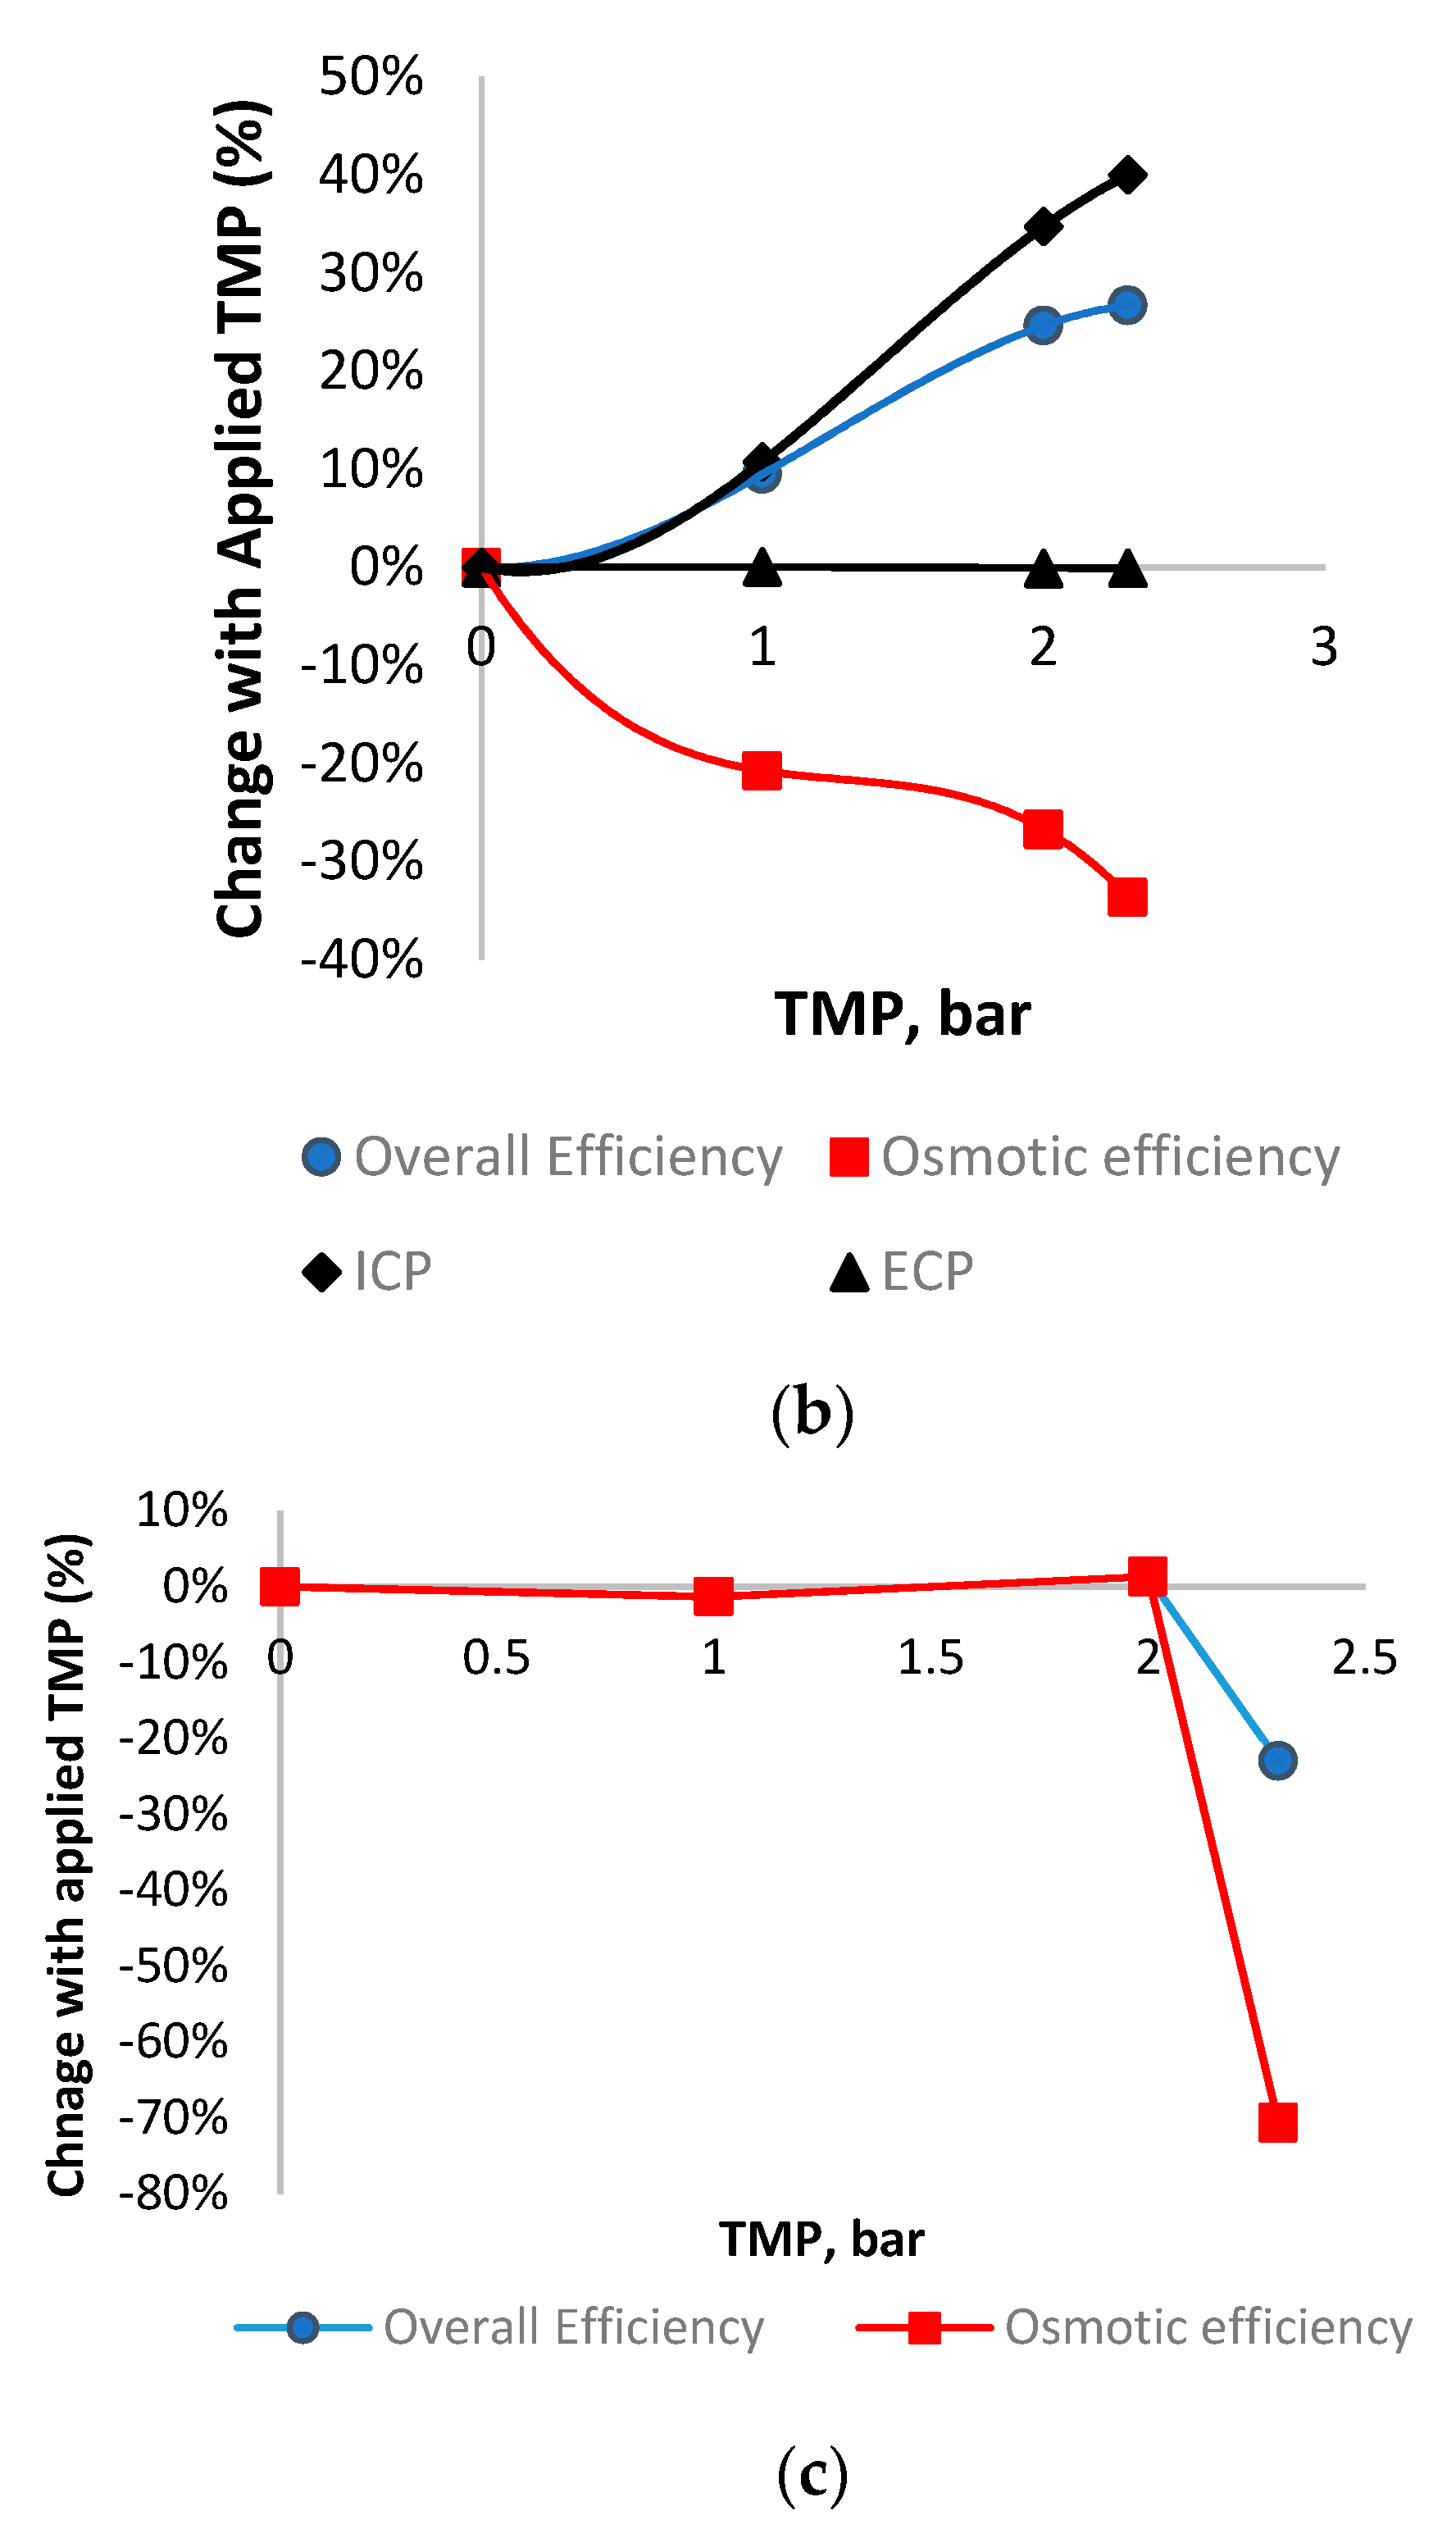
k” value counterbalancing the increase usually expected by higher flux. The Toray module demonstrates the same increase in overall efficiency within TMP’s of 0–2.3 bar; however, with a much slower increase than the HTI at pressures of 0–1 bar (
Figure 10). This is coupled with an osmotic efficiency that decreases, yet the decrease slows at TMPs of 1–2 bar of TMP, indicating an optimum point of operation. The Toray module displays similar behavior to the HTI overall, with an optimum region of higher-than-expected performance matching with the deformation region of the membrane. However, the optimum range of the Toray module is found at larger TMPs than the HTI due to less dense spacer support (
Section 3.1). ECP decreases only slightly with applied TMP, as with the HTI module. The Porifera module (
Figure 10c) has no CP data points illustrated, as the much higher deformation and resultant channel occlusion were the primary factor for the flux and this efficiency loss. This is particularly apparent as the overall efficiency does not increase with applied TMP, in direct contrast to the Toray and HTI modules. The efficiency data is also in direct contrast the Porifera membrane-scale data (
Figure 9), indicating that the occlusion is therefore not spread evenly and is likely contacting the spacer or wall results in membrane area (and, hence, the flux performance loss). It is important to note the low TMP pressures recommended for Porifera operation [
3]; however, this indicates the importance of mechanical support in the FO modules when the PAO mode is used.
This first implication of the data overall is the importance of ECP when considering FO membranes and modules, illustrating how channel hydrodynamic impact and can mitigate ECP on the draw-side. The effect of membrane deformation on channel hydrodynamics and its subsequent impact on CP is an emerging idea previously reported in the literature [
19]. However, the CP models mentioned previously do not account for how membrane deformation would affect the flow profile, and do not use CFD analysis to assist in CP characterisation. The next section of this study will further assess this relation by linking the CFD hydrodynamic analysis to the unexpected CP trends under applied pressure.
With the detailed assessment of the level of occlusion and hydrodynamic characterisation by CFD (
Section 3.1,
Section 3.2 and
Section 3.3), the analysis of the efficiency and CP (
Section 3.4) can be compared and linked. Current numerical CP models do not account for ECP based on irregular flow profiles caused by deformation, and CFD analysis can provide a link to assess CP improvements by deformation. The results are compared across the FO modules to assess the relationship between the CFD characterisation of the draw channel flow profile, to link against experimental and CP analysis to improve further the effectiveness and convenience of CFD in future module and spacer design.
The CFD, efficiency and CP analysis are summarised in
Table 2. The HTI module (under 1.5 bar TMP) has an improved osmotic efficiency, in part due to the improved draw-channel hydrodynamics (
Section 3.4). This is in direct correlation with the shear force and Reynolds number improvement in the module under 1.5 bar TMP (
Table 2). Given the high osmotic and overall efficiency performance of the HTI module, the higher bulk Reynolds number increase over the Toray can be stated as the most important factor when considering the relatively similar shear strain values. However, the scope of this study does not include fouling effects whereby the strain rate is more likely to be a major factor.
The PF Porifera module, however, has the greatest Reynolds increase (40% in the bulk flow), due to the high degree of occlusion (
Section 3.1) and high turbulence from the uneven flow profile (
Section 3.3). However, the relationship between turbulence and efficiency is balanced against the membrane-area loss for the Porifera module, which would decrease the area possible for flux to occur. This trade-off implies that mechanical support must be balanced against flow improvements overall and depends on the TMP desired for each FO module. The HTI and Toray modules experienced lower increases in turbulence (
Table 1), but due to the higher mechanical support maintained a high membrane area availability. The shear strain rate (
Table 2) improves by 20%–40% across all modules, is also strongly linked to increased flux performance, with shear strain on the membrane surface likely to disrupt the ECP boundary layer on the draw-channel and explain the higher-than-expected osmotic efficiency. The significant increases in the Reynolds number and the shear strain (
Table 2) seem to link more directly to osmotic efficiency in the deformation region of the membrane. As such, future spacer design should seek to improve the shear strain for the increased flux performance of the module. The spacer design can also aim to improve Reynolds number in the channel through turbulence promotion should RSD improvement be an aim. However, when comparing the Reynolds number analysis of FO channels, the findings of this study imply a less direct link than the mass transfer coefficient “
k” (Equation (8)) from the CP models would suggest. The appropriateness of the mass transfer coefficient “
k” using a hydraulic-diameter based Reynolds number is shown as inaccurate when the channel flow has most deviated from channel geometry assumptions, especially prominent during deformation. This indicates that ECP in the draw-channel plays a greater role in the draw-side than initially assumed [
9,
10,
11]. Furthermore, models that account for ECP in the draw-channel should further aim to take into account irregular (nonrectangular or perfectly spherical) channel shapes with the assistance of CFD to determine a draw-channel flow profile. Overall, most notably, it can be seen that the overall CP effects decrease within the deformation range of the membrane modules. With 1.5 bar across all modules, the effects of the CP are lower; as such, the membrane deformation region is likely an efficient operating point of the FO modules when in FO and PAO modes.


