
A Critical Review on Electric Field-Assisted Membrane Processes: Implications for Fouling Control, Water Recovery, and Future Prospects


Abstract
:1. Introduction
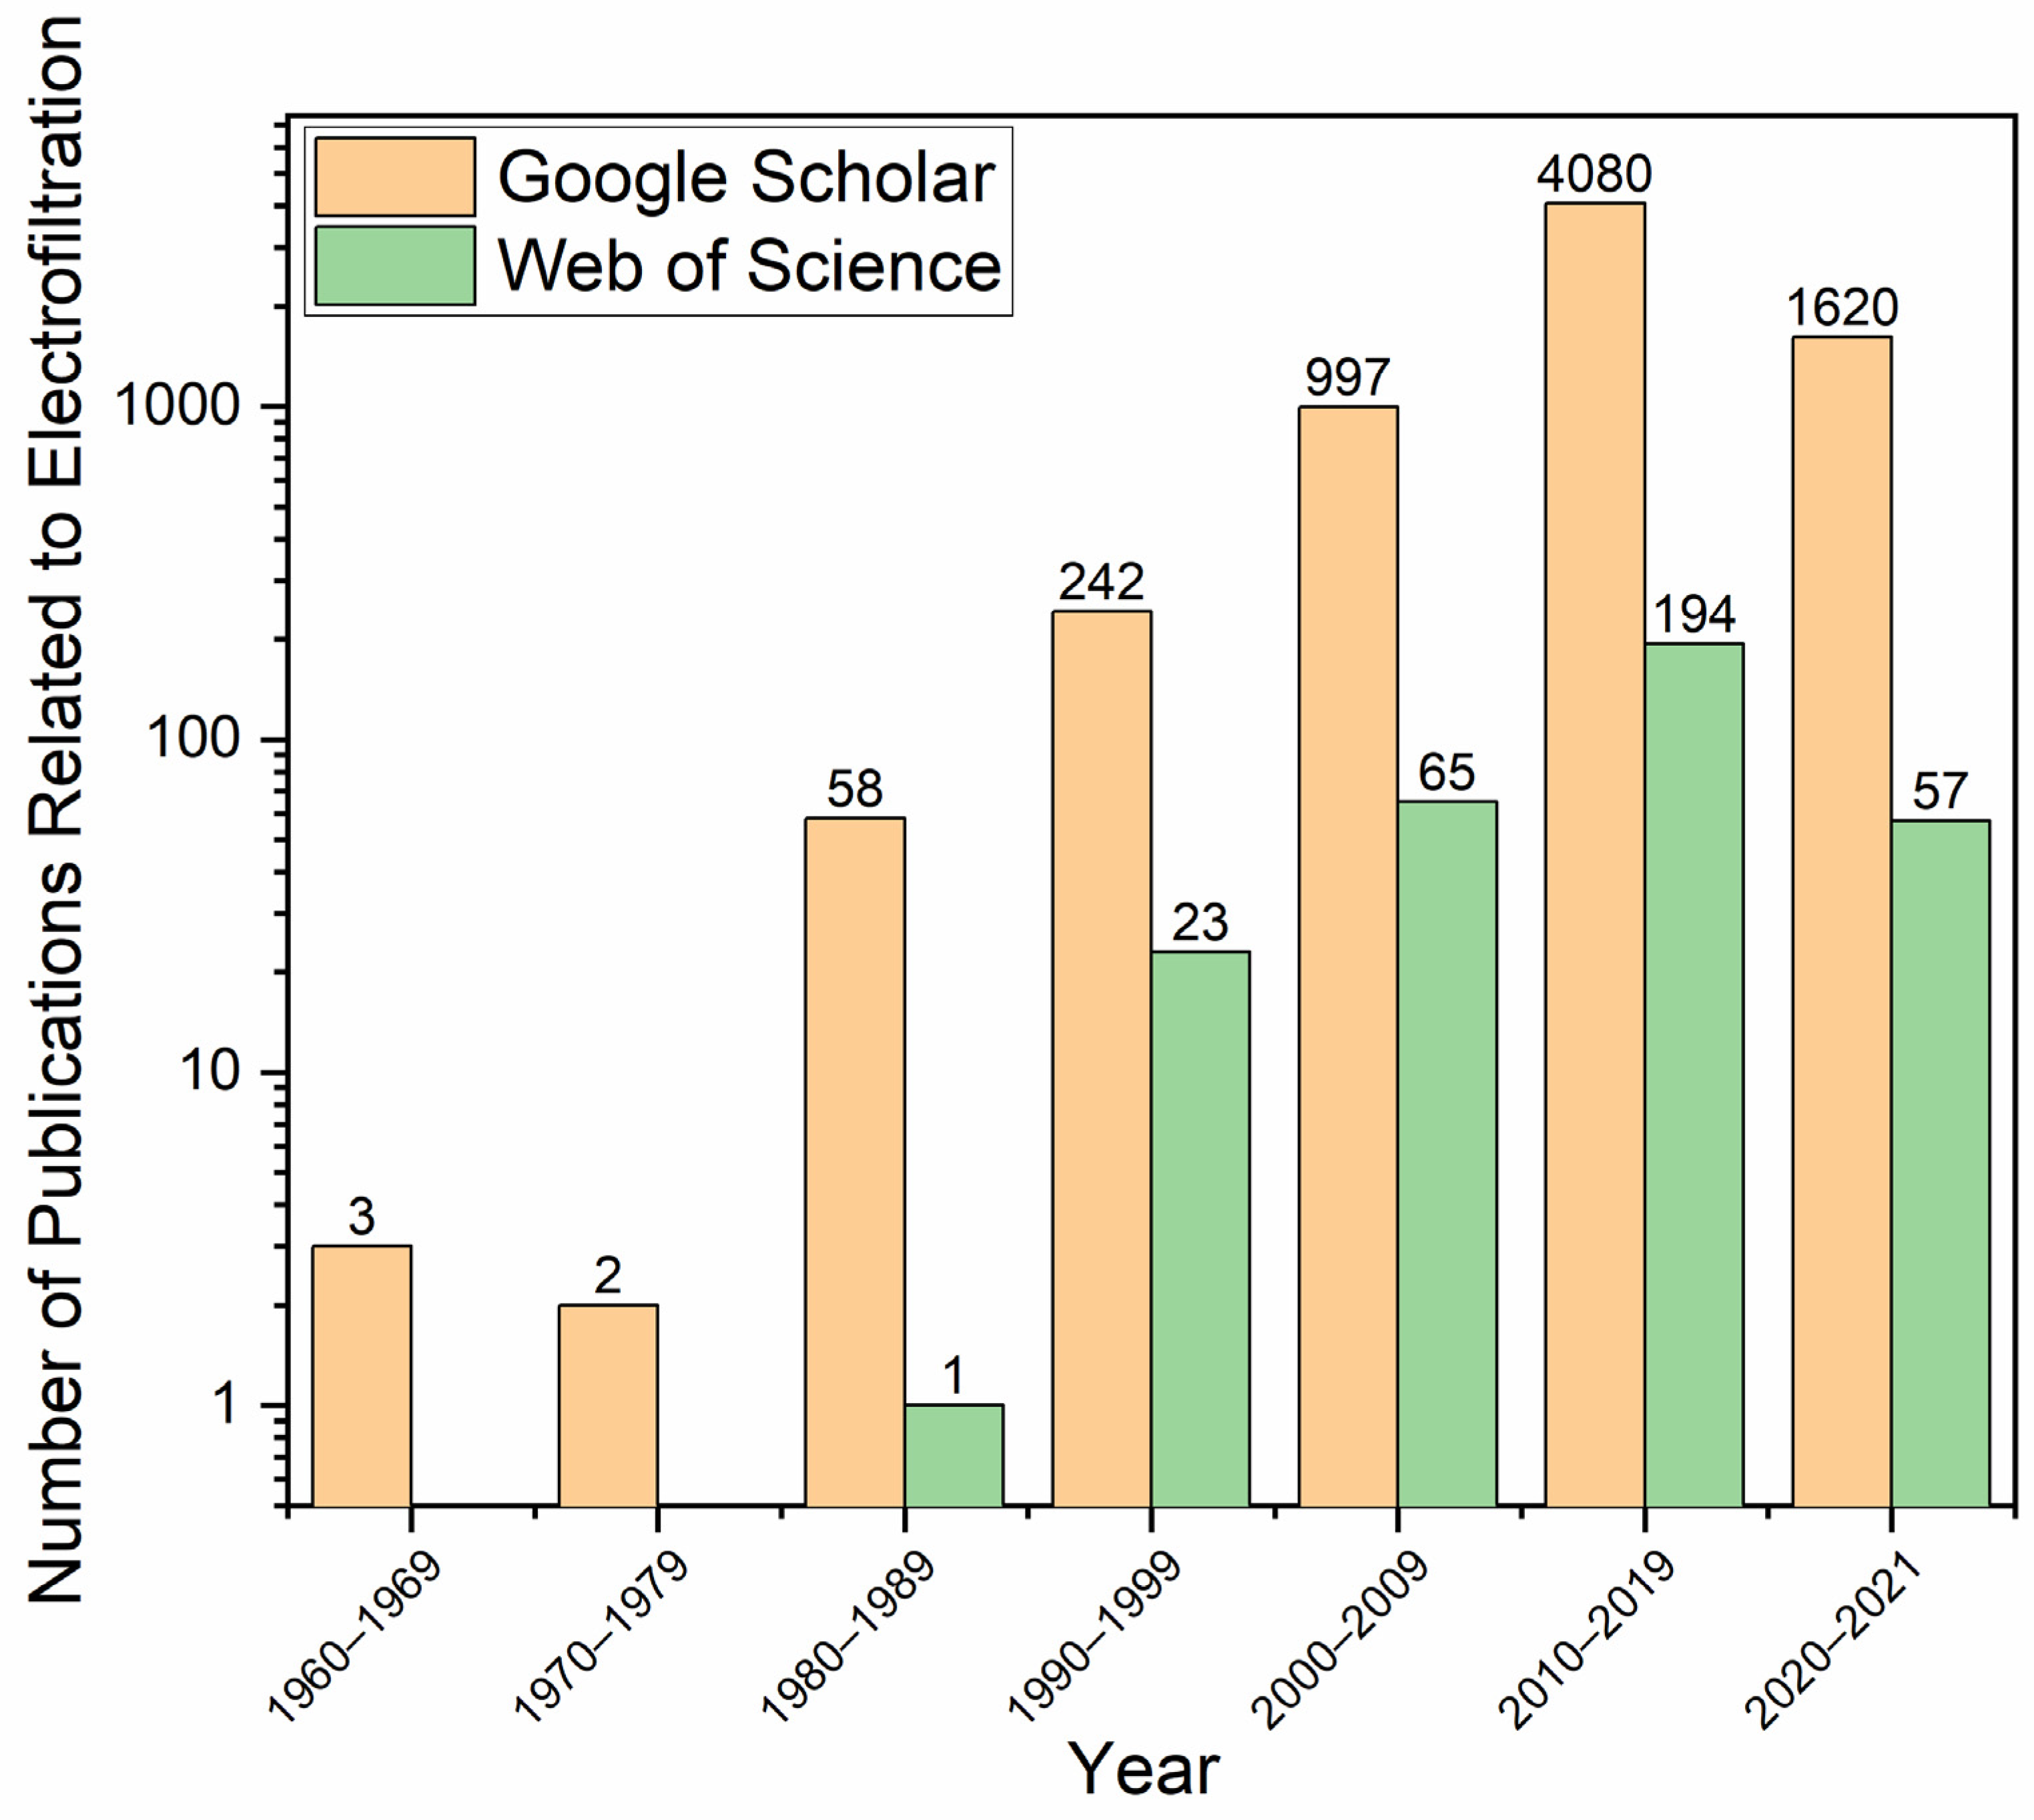
2. Summary of Recent Electrofiltration Studies from Year 2000–2021
3. Mechanisms of Electrofiltration
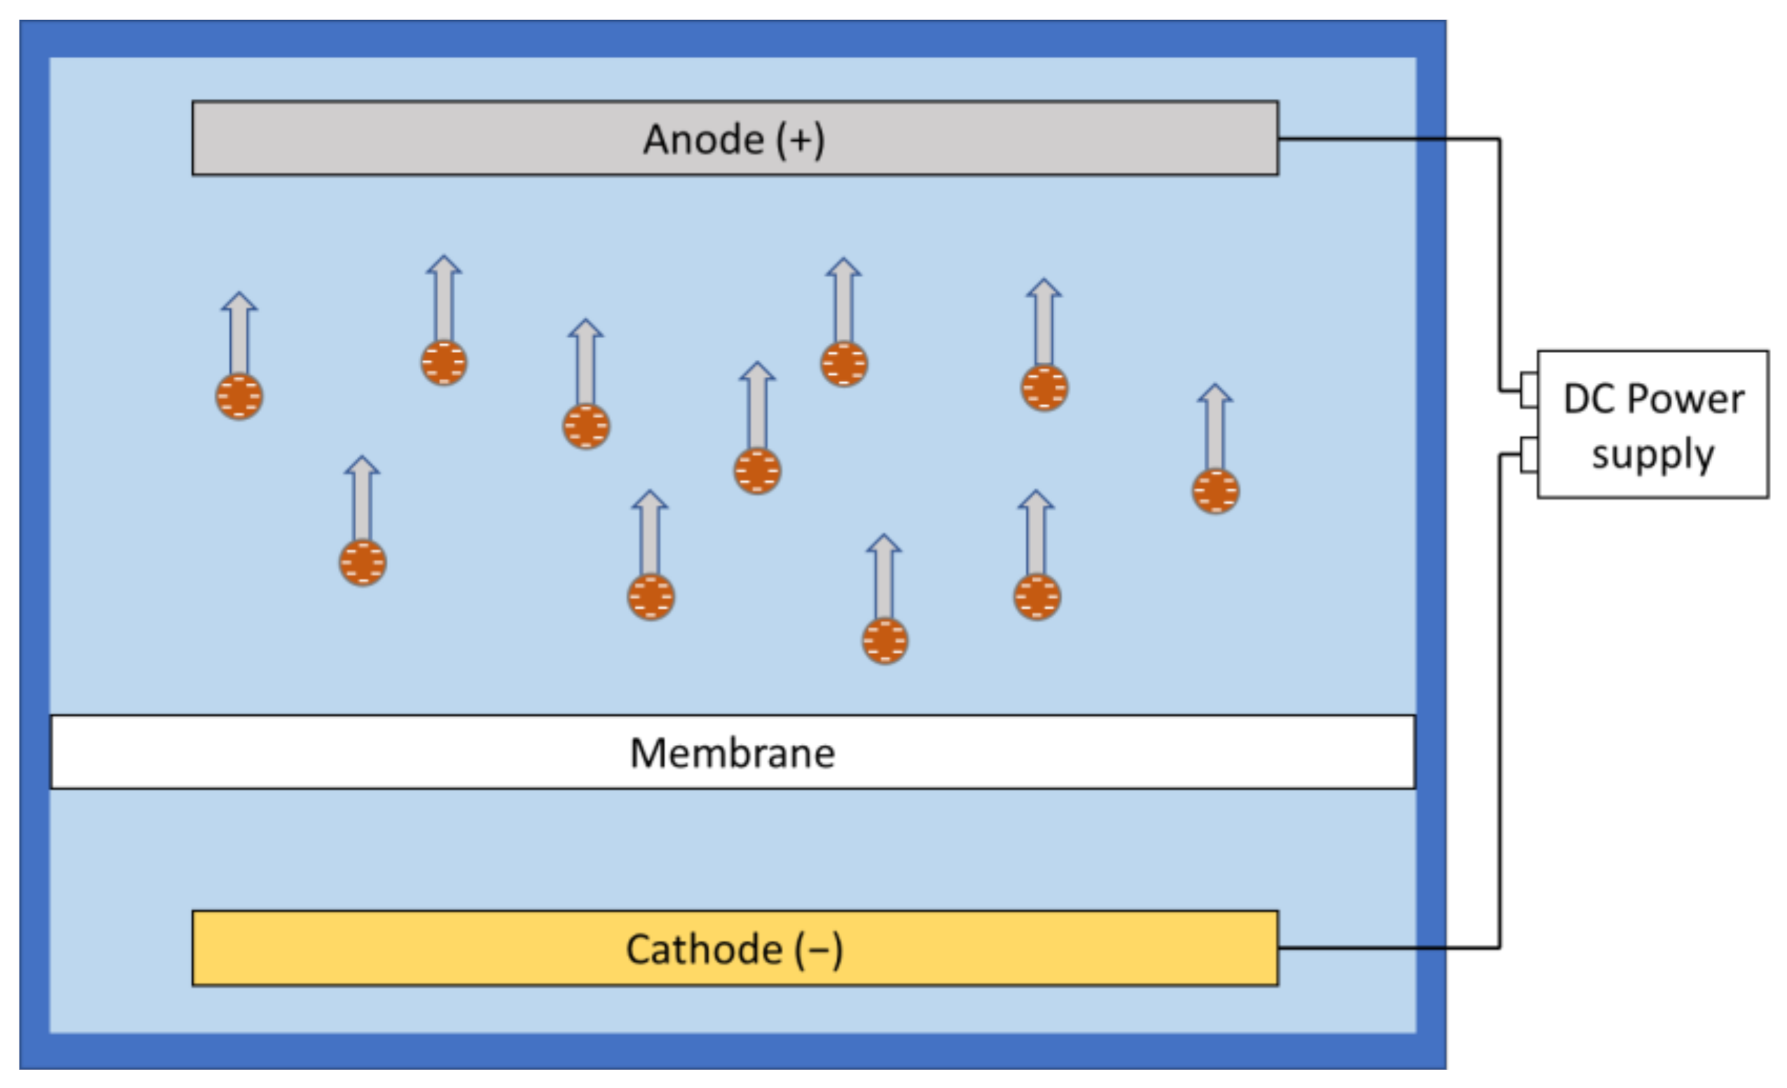
3.1. Electrophoresis
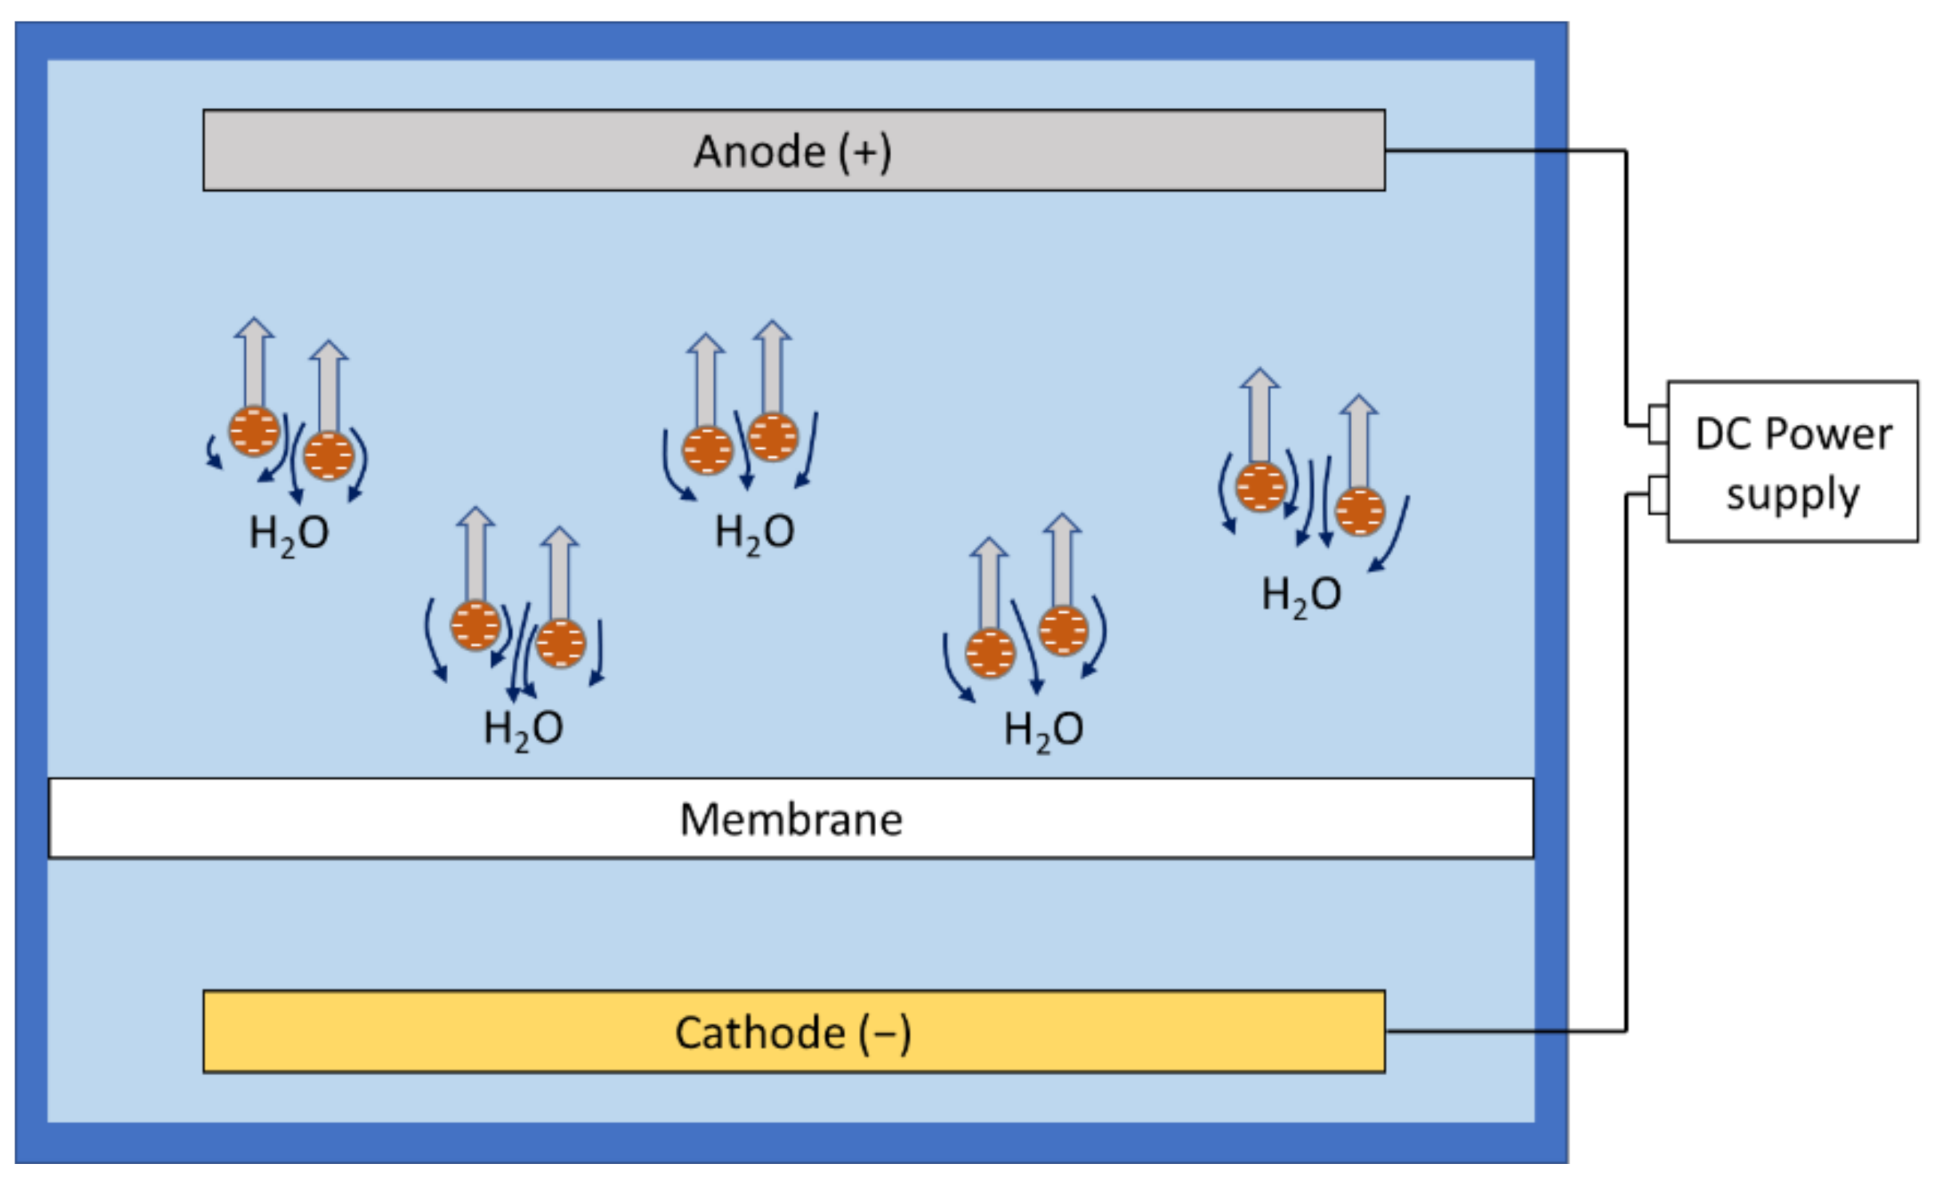
3.2. Electroosmosis
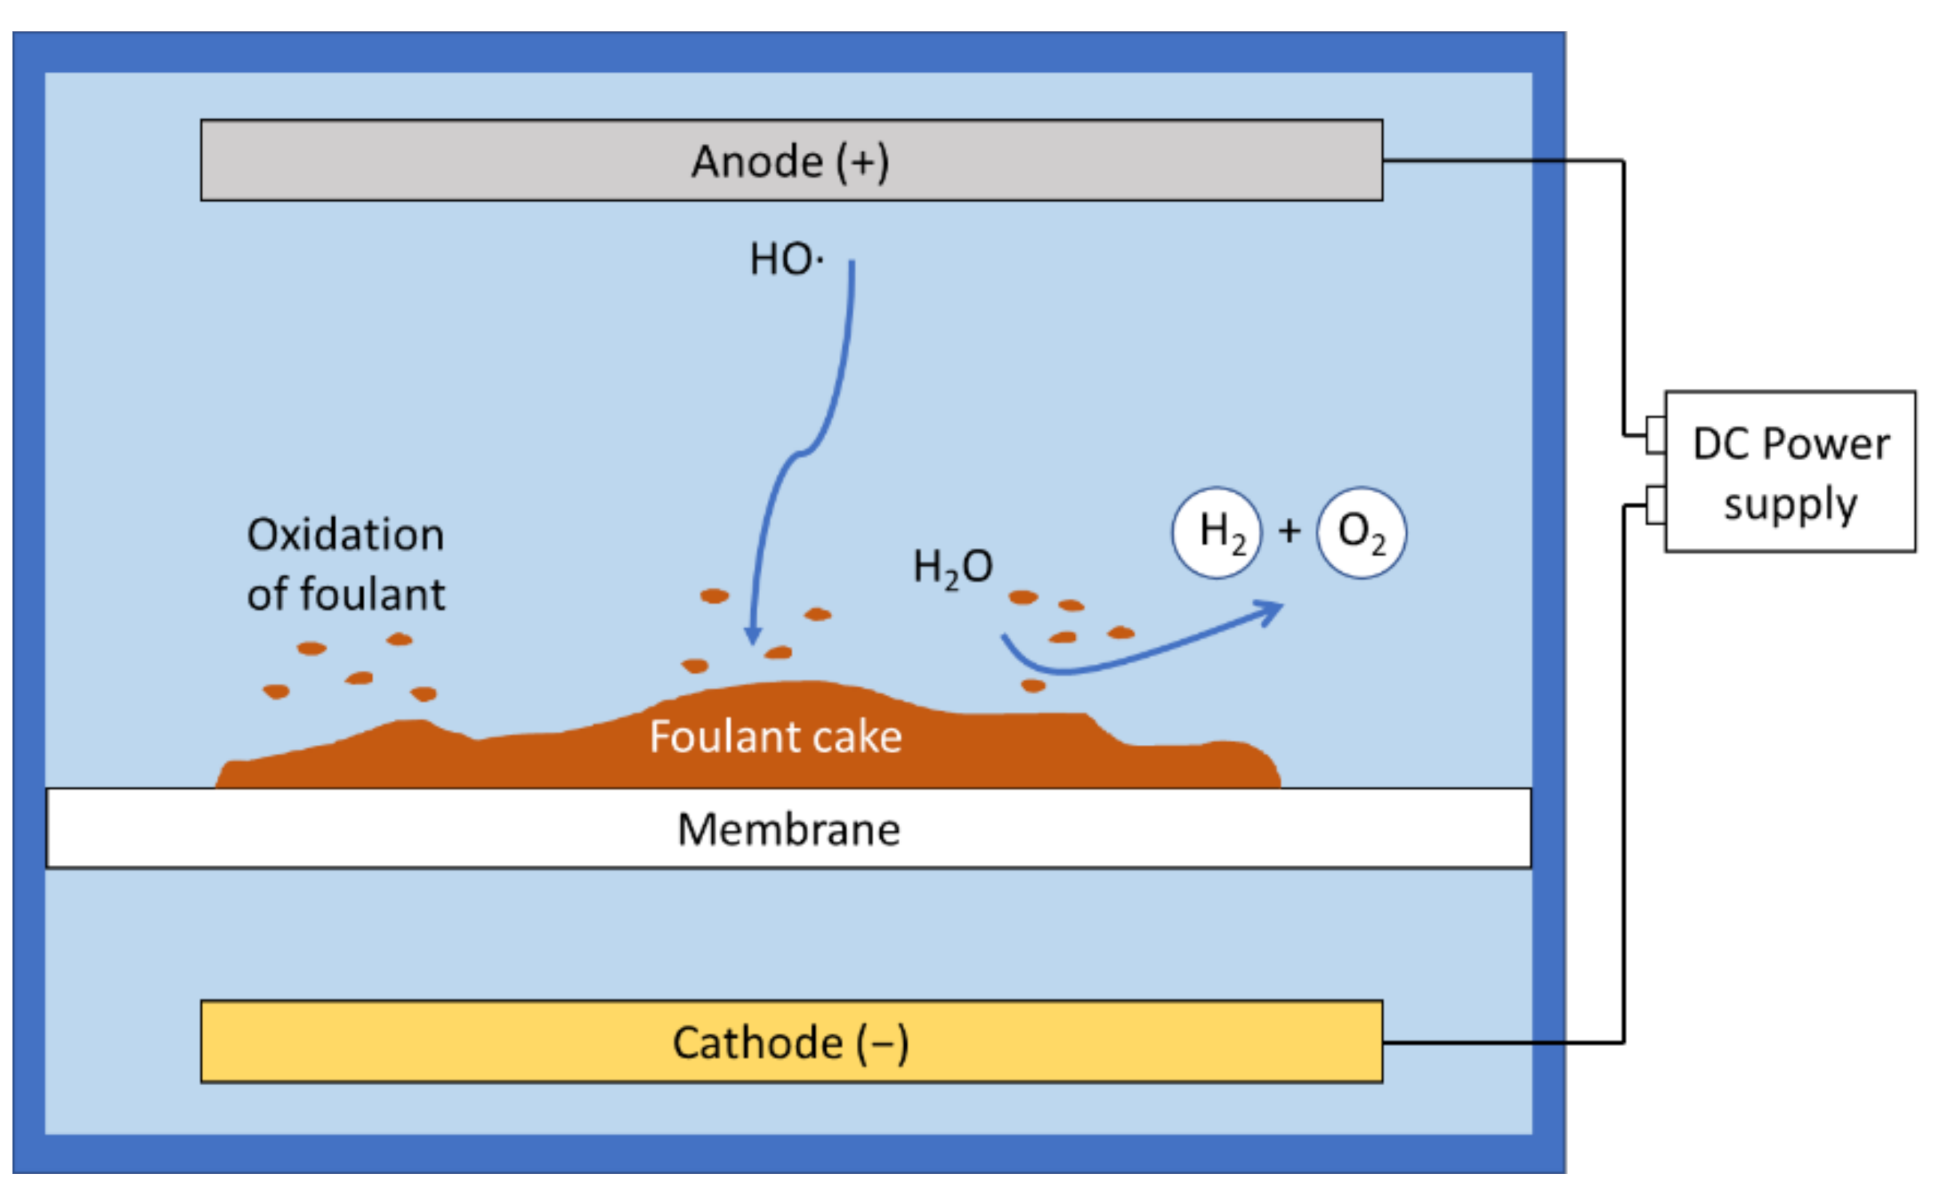
3.3. Electrolysis
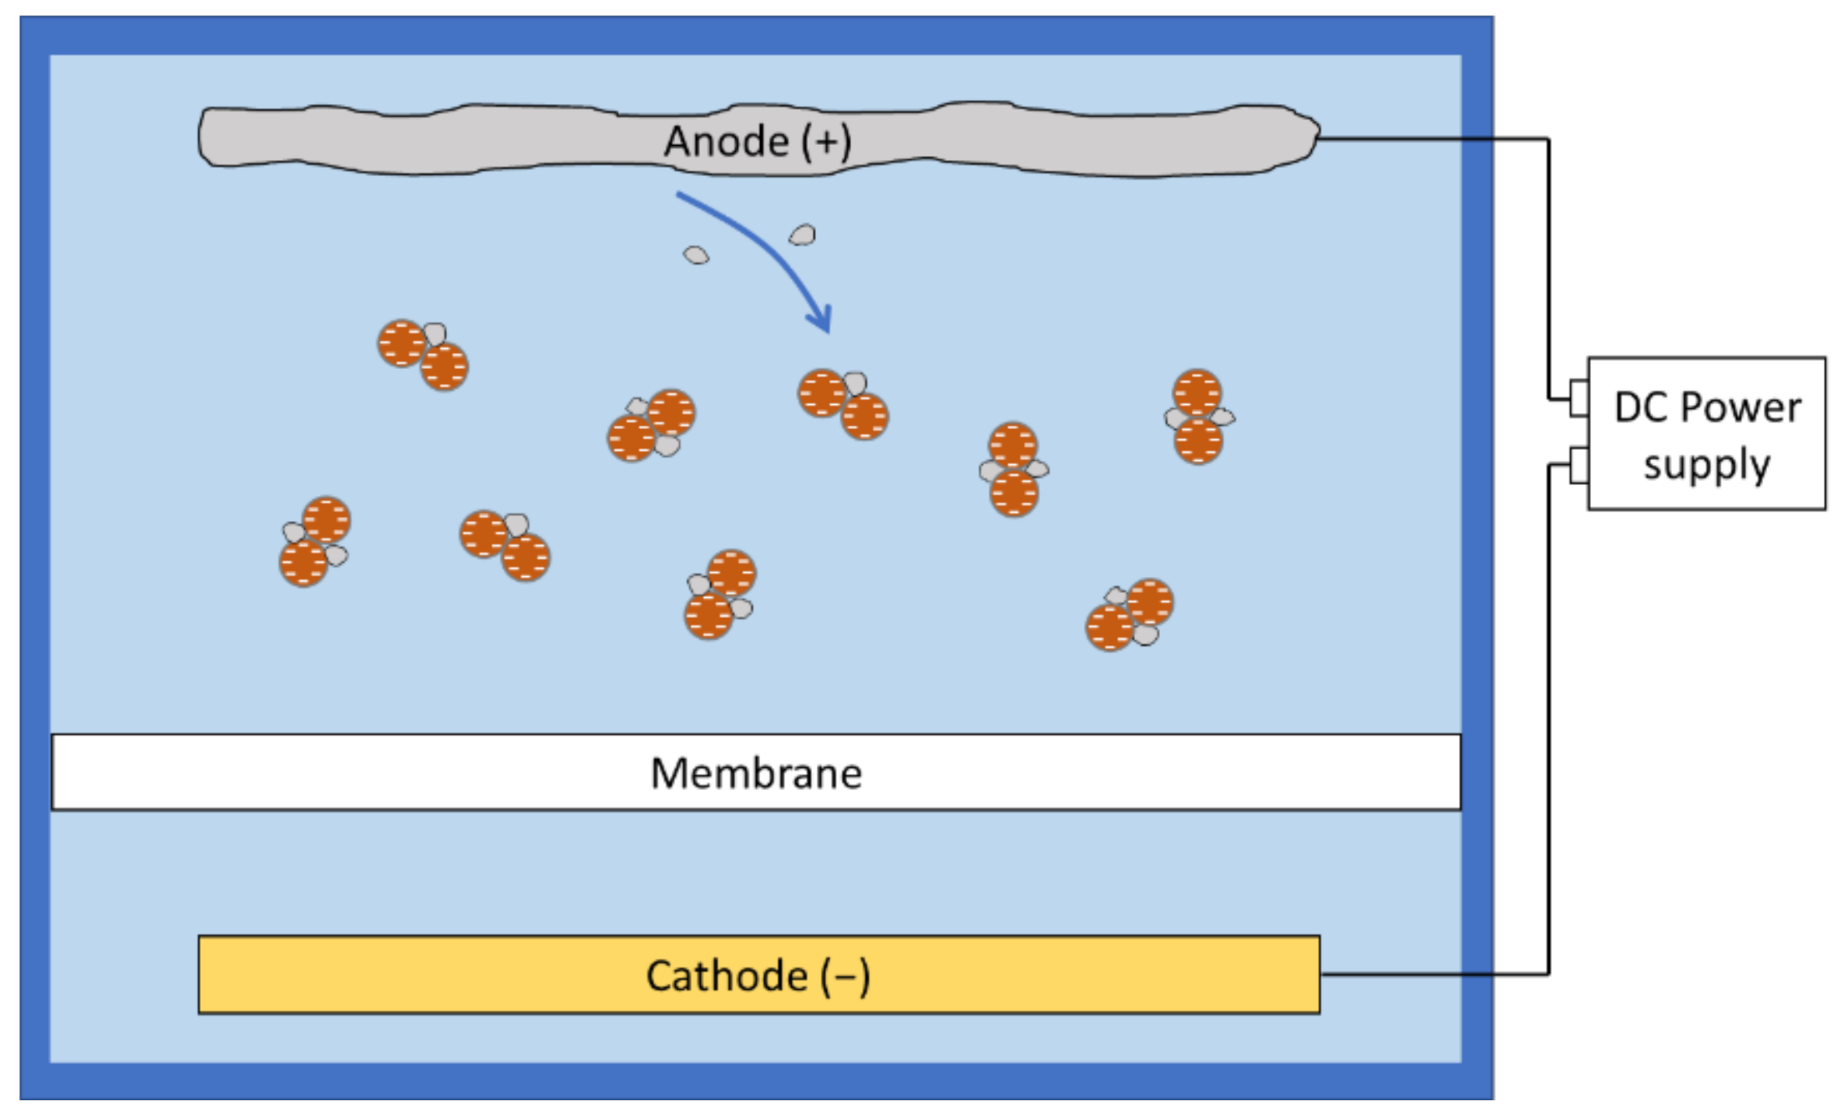
3.4. Electrocoagulation
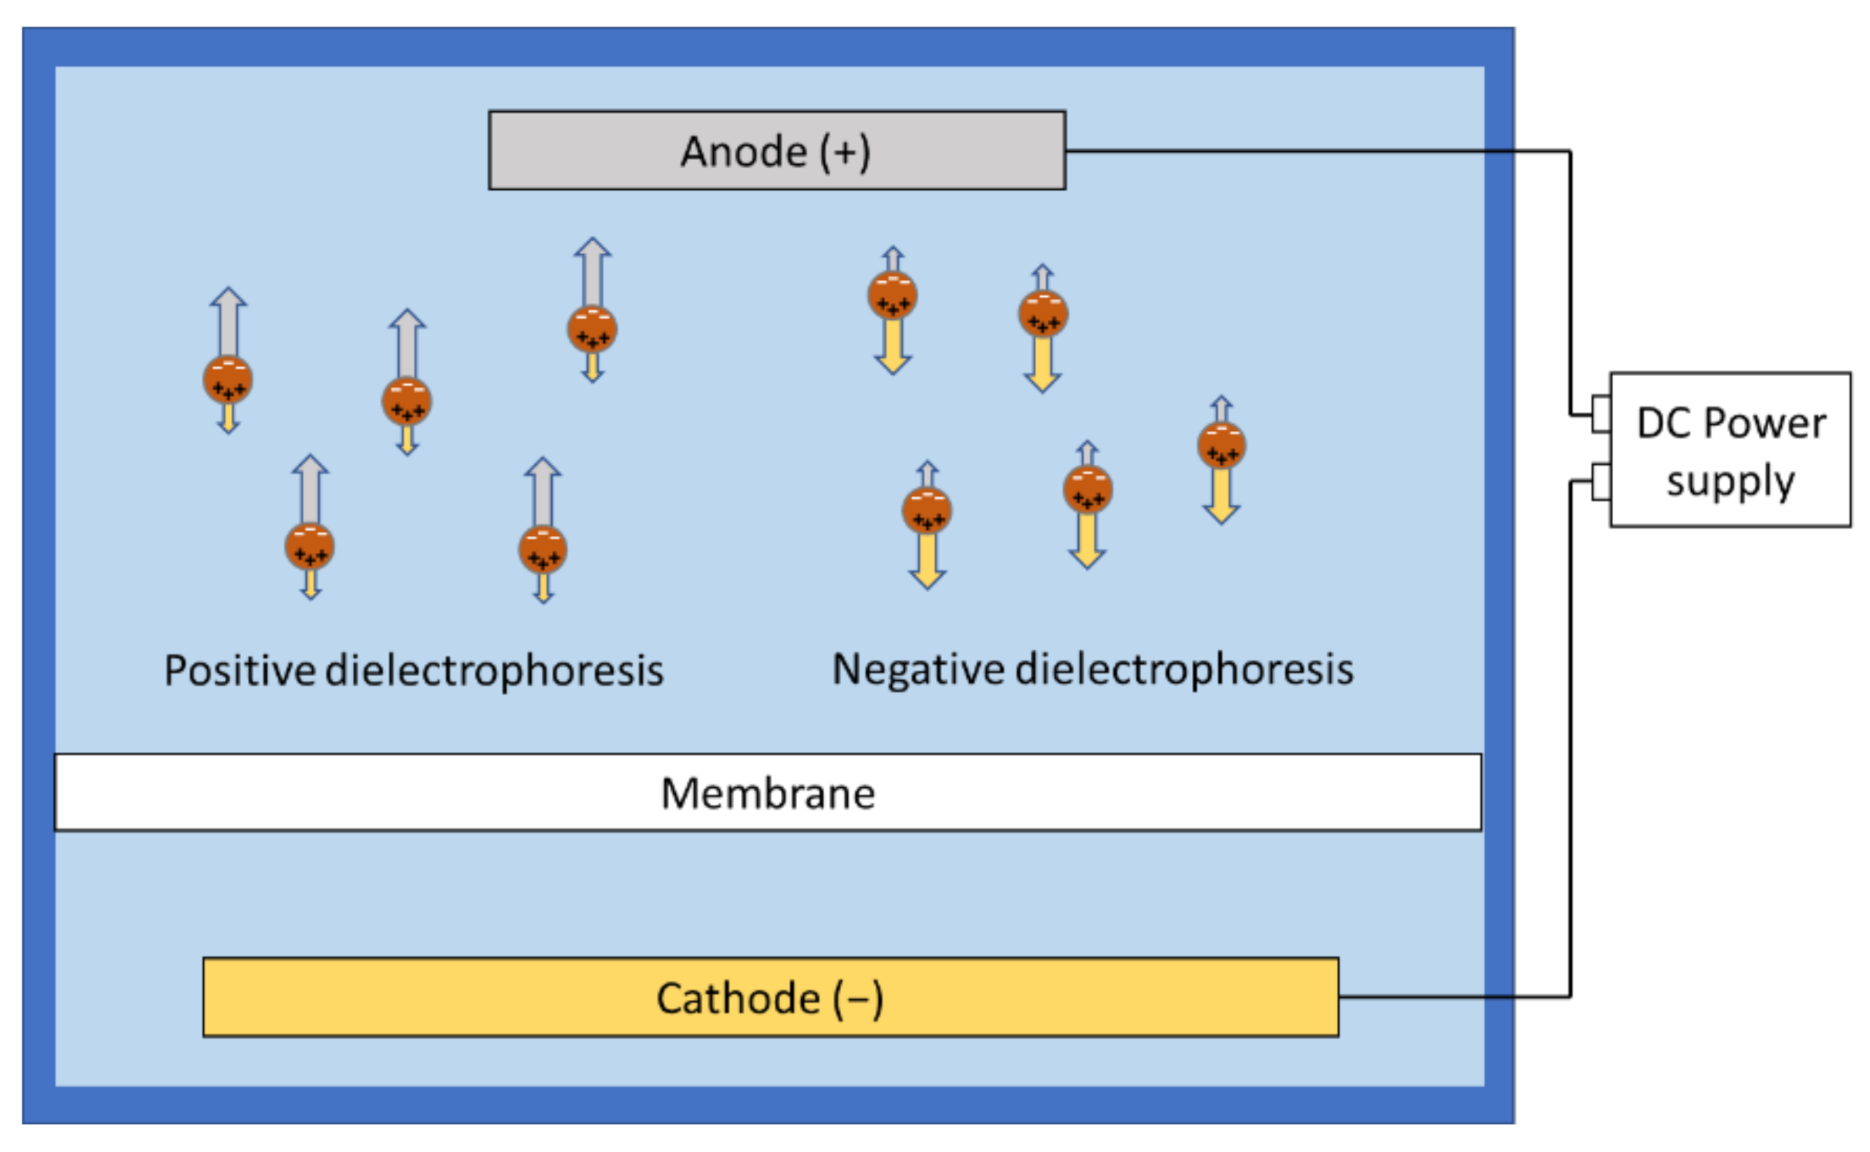
3.5. Dielectrophoresis
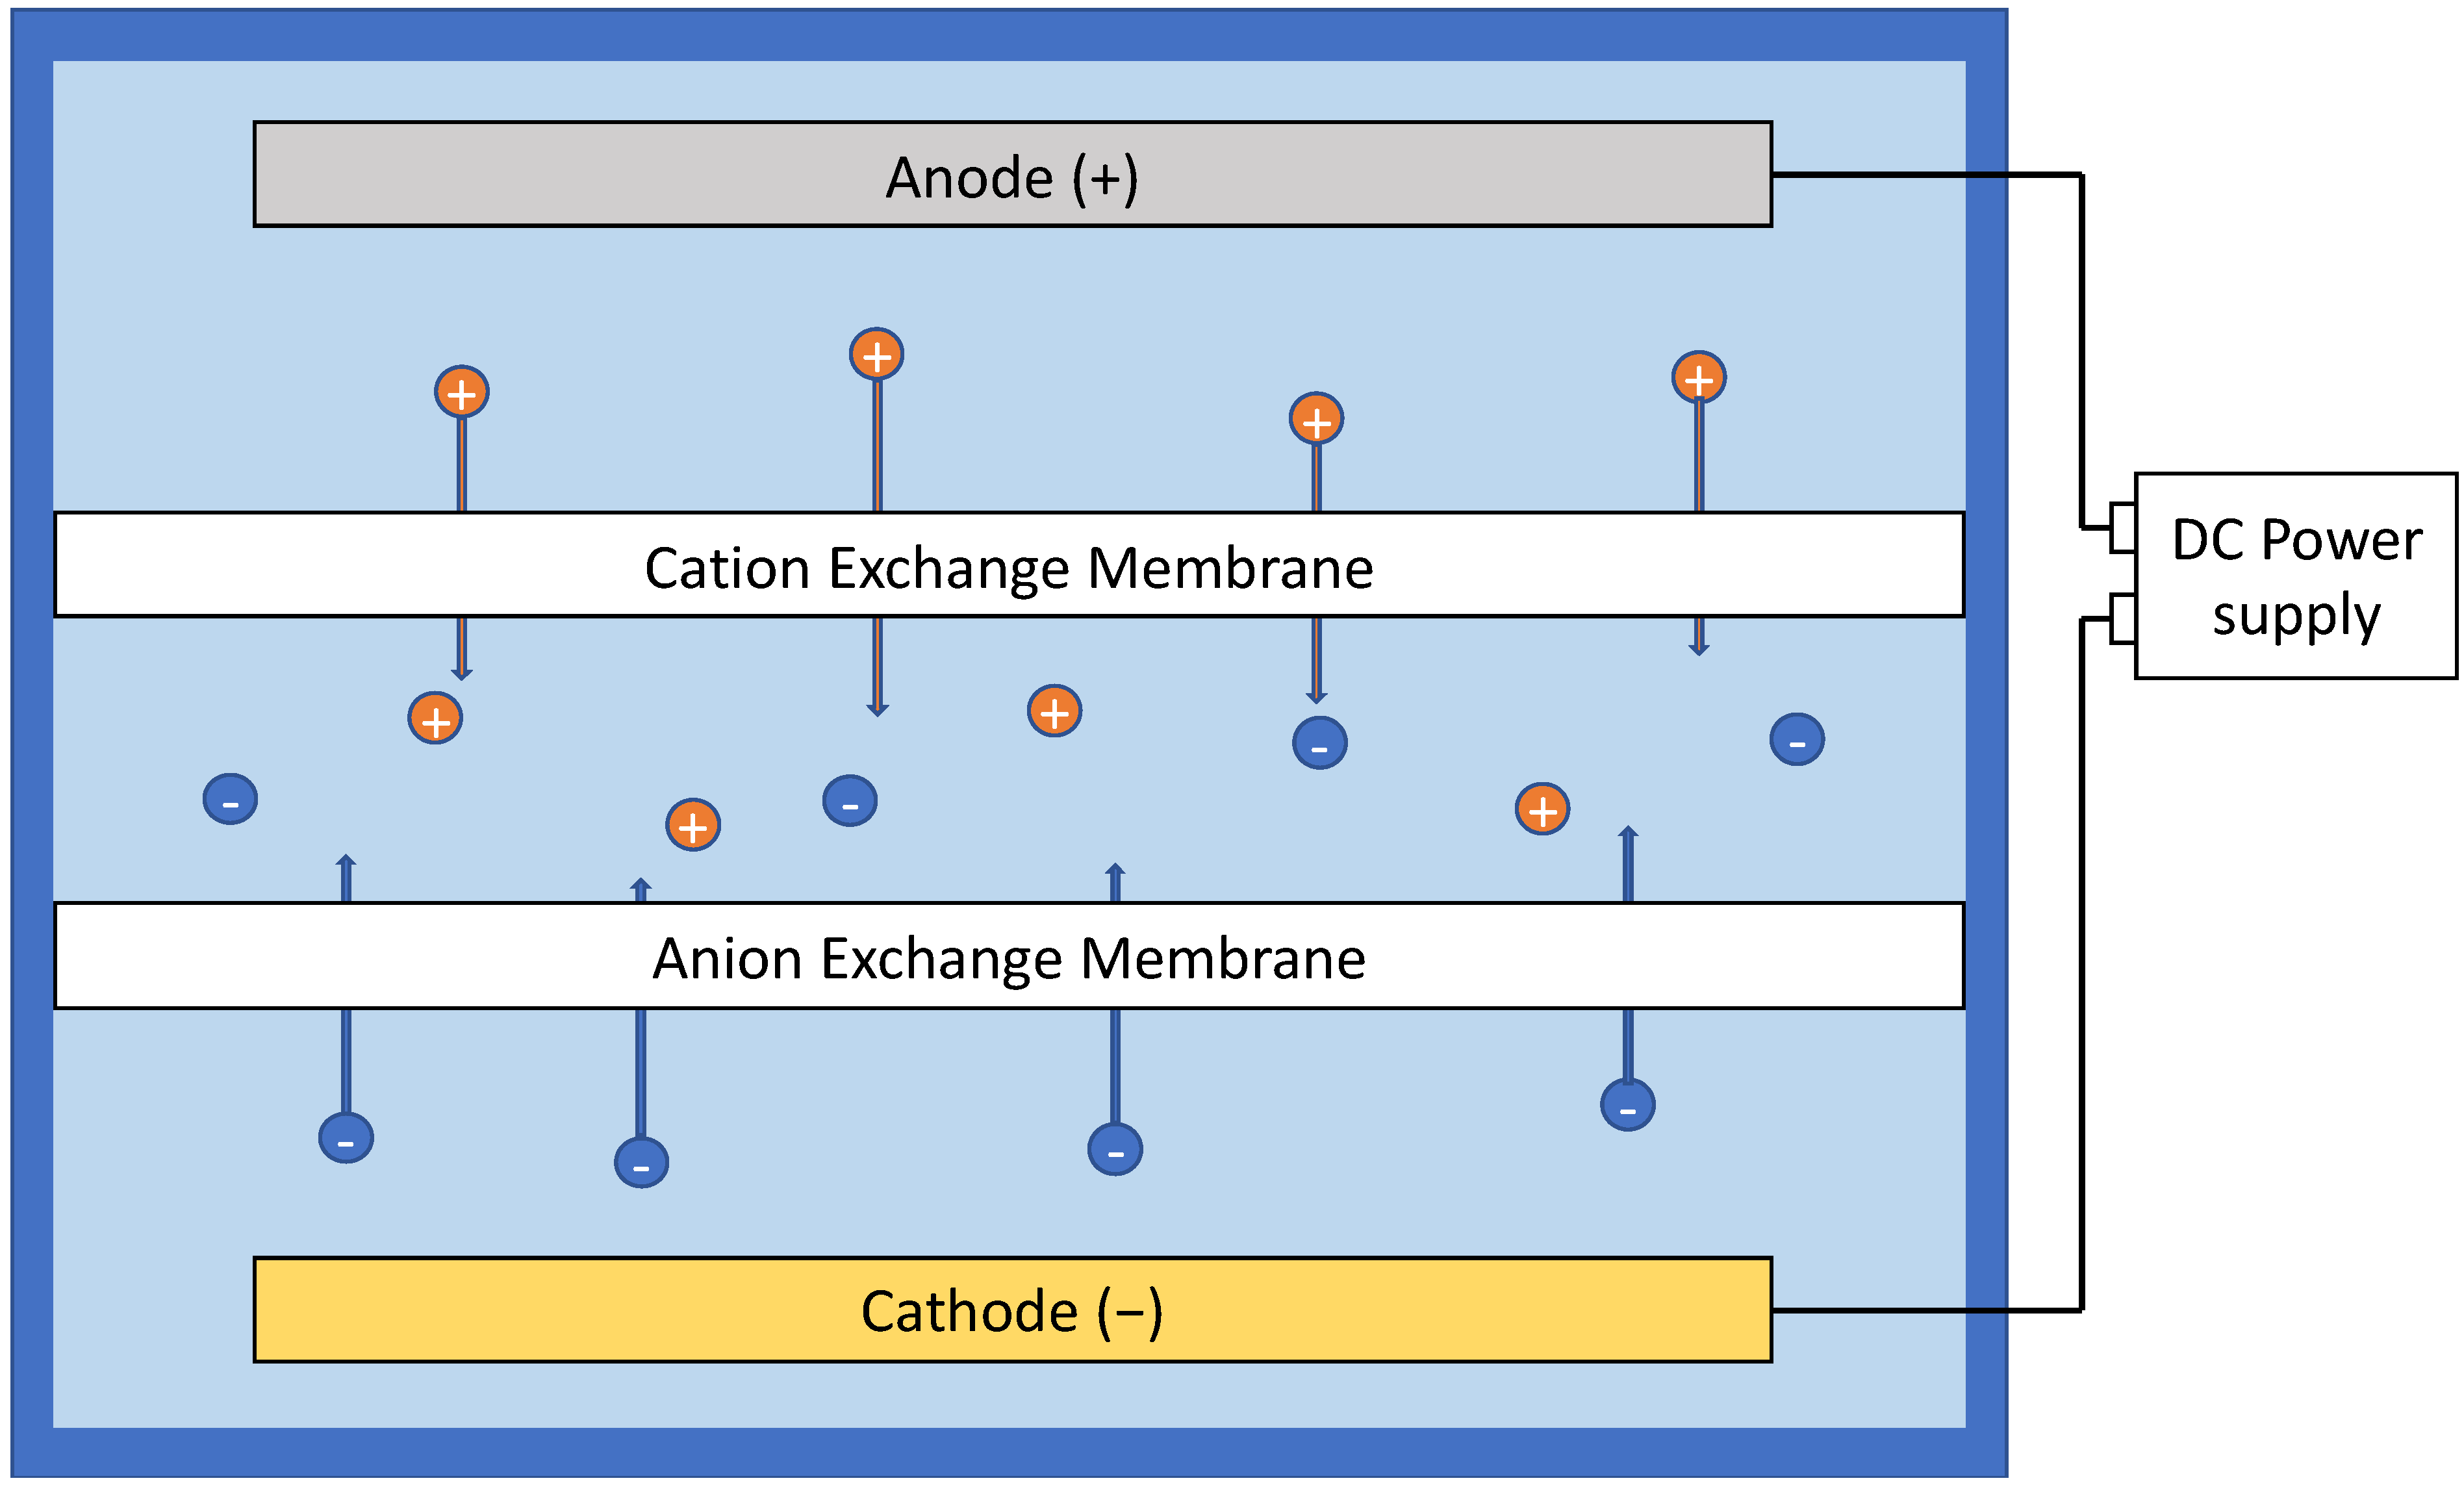
3.6. Electrodialysis
4. Characterization of Electrofiltration
5. Effect of Operational Conditions on Electrofiltration
5.1. Configuration and Installation of Membrane Modules and Electric Fields
5.1.1. Configuration of Membrane Module
5.1.2. Installation of the Electric Field Source Ahead of the Membrane Module
5.1.3. Installation of the Electric Field over the Membrane Module
5.1.4. Using the Membrane as an Electrode
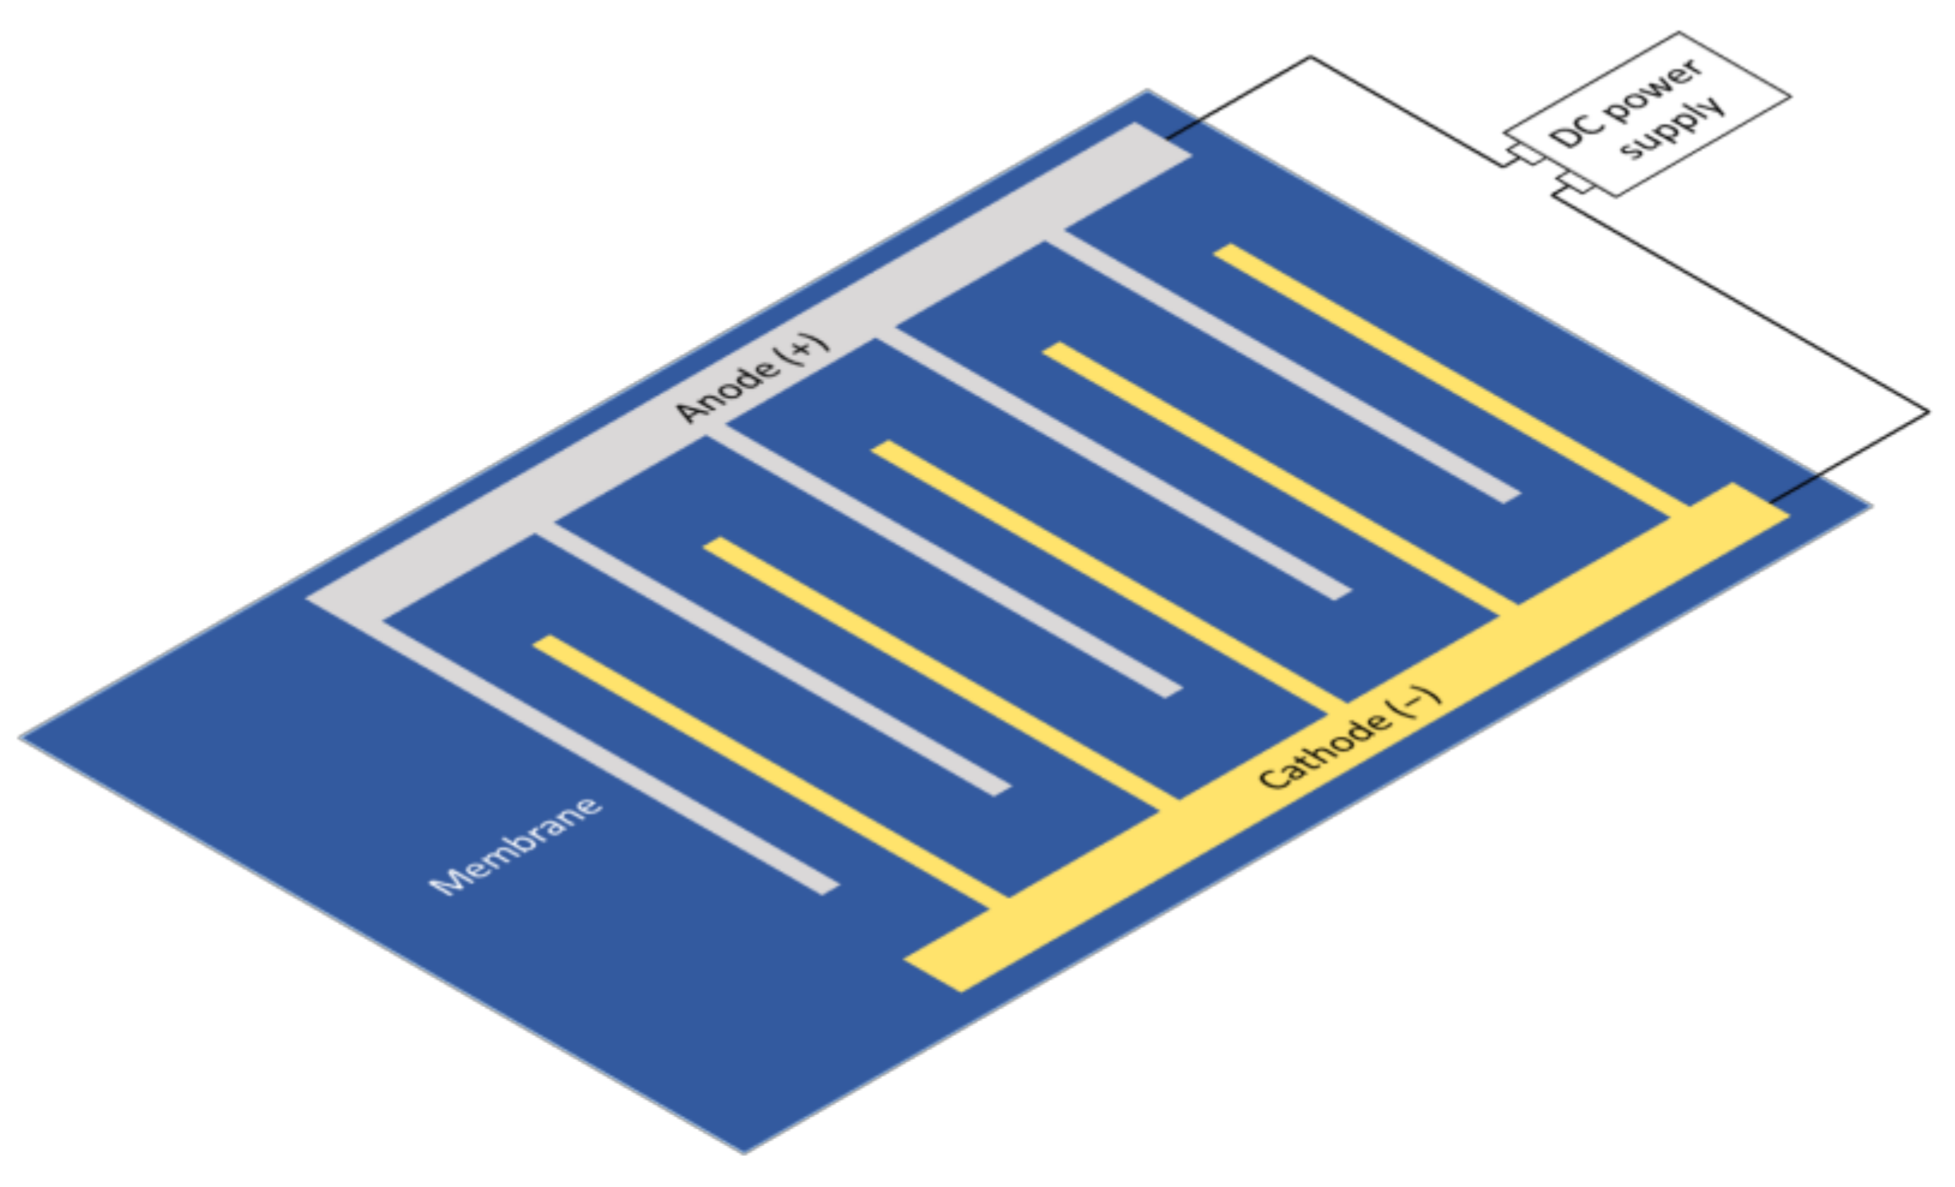
5.1.5. Interdigital Electrodes at the Membrane
5.2. Parameters Related to the Electric Field Parameters
5.2.1. Electric Field Mode
5.2.2. Field Pulsation
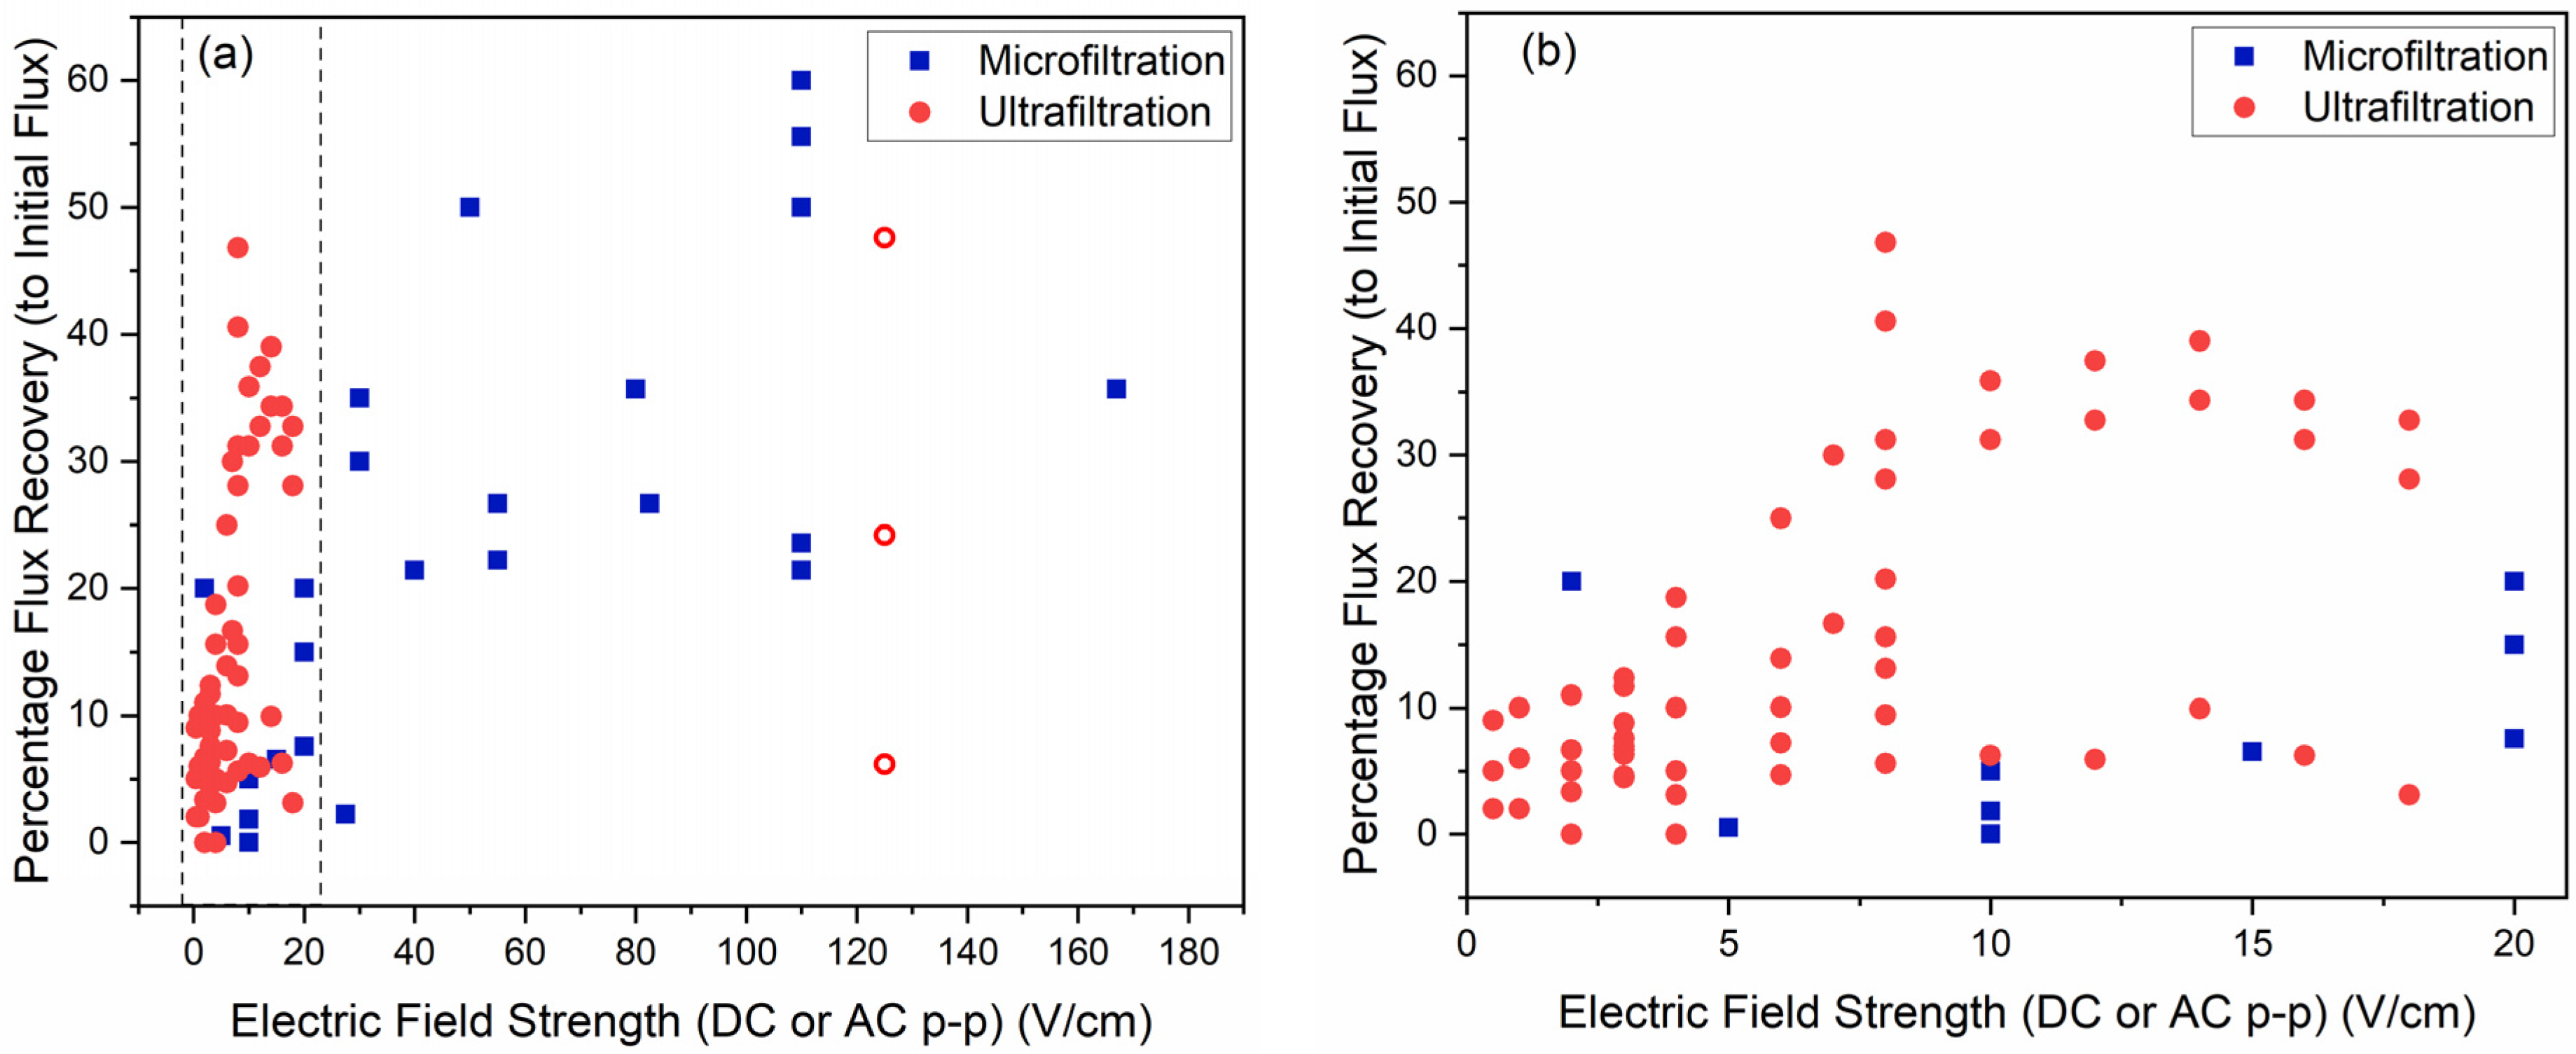
5.2.3. Field Strength
5.2.4. Electric Field Gradient
5.3. Factors Related to the Filtration Setups
5.3.1. Transmembrane Pressure
5.3.2. Crossflow Velocity
5.3.3. Membrane Materials and Modifications
5.3.4. Temperature
5.4. Parameters Related to Water Matrix
5.4.1. Zeta Potential, pH and Ionic Strength
5.4.2. Foulant Concentration
5.4.3. Foulant Size
5.4.4. Foulant Materials
6. Quantification and Modeling Efforts of Electrofiltration
6.1. Hermia’s Law
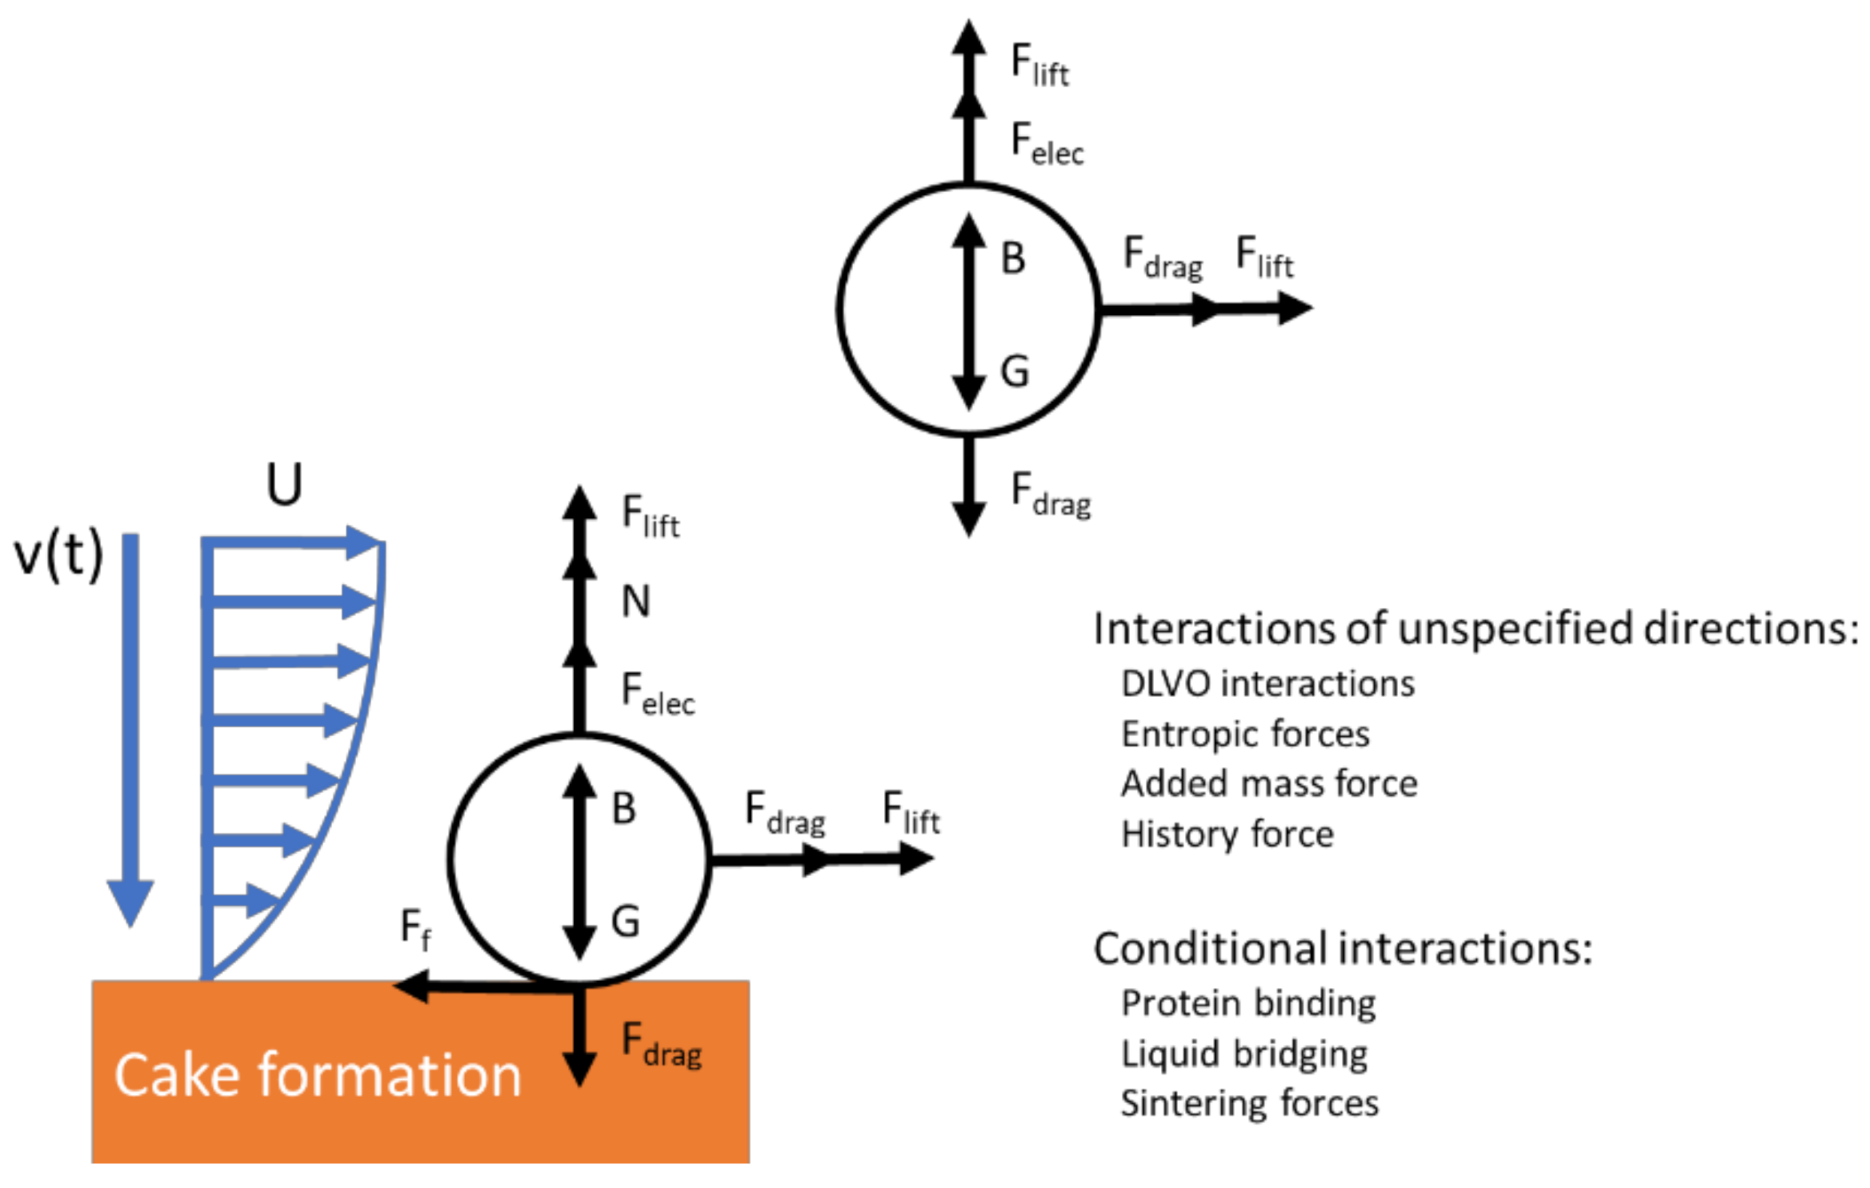
6.2. Electrodynamic Modeling
6.3. Mass Balance Modeling
6.4. Simulation of Cake Layer Structure
7. Energy Cost Analysis
8. Future Prospects
Author Contributions
Funding
Institutional Review Board Statement
Informed Consent Statement
Data Availability Statement
Conflicts of Interest
Abbreviations
| AC | Alternating current |
| ANN | Artificial neural network |
| BSA | Bovine serum albumin |
| CFD | Computational fluid dynamics |
| CNT | Carbon nanotube |
| DC | Direct current |
| MWCNT | Multi-walled carbon nanotube |
| PAN | Polyacrylonitrile |
| PES | Polyethersulfone |
| PP | Polypropylene |
| PVDF | Polyvinylidene difluoride |
| SEM | Scanning Electron Microscope |
Nomenclature
| Cross-sectional permeation area (m2) | |
| Particle radius (m) | |
| Buoyancy (pressure gradient) force (N) | |
| Relative permittivity/Dielectric constant | |
| Diffusivity (m2/s) | |
| Electric displacement field/Electric induction (C/m2) | |
| Electric field strength (V/m) | |
| Critical electric field strength (V/m) | |
| Energy to produce a unit volume of permeate (J/L) | |
| Electric field strength along the z-axis (V/m) | |
| Dielectrophoretic force (N) | |
| Drag force (N) | |
| Electrophoretic force (N) | |
| Friction force (N) | |
| Lift force (N) | |
| Gravitational force (N) | |
| Acceleration of gravity (m/s2) | |
| Magnetic field strength (A/m) | |
| Current density (A/m2) | |
| Initial flux (m/s) | |
| Reported final flux with electric field off (m/s) | |
| Reported final flux with electric field on (m/s) | |
| Permeate flux (m/s) | |
| Clausius-Mossotti factor (F/m) | |
| Fluid permeability of the media (d) | |
| Constant in Hermia’s equation | |
| Bessel function of the first kind of order zero | |
| Bessel function of the first kind of order one | |
| Unit imaginary number | |
| Membrane permeability (m/s/Pa) | |
| Ionic mobility (m2/s/V) | |
| Normal force (N) | |
| Constant in Hermia’s equation | |
| Pressure (Pa) | |
| Electrical power (W) | |
| Liquid pressure (Pa) | |
| Hydraulic dissipated power (W) | |
| Transmembrane pressure (Pa) | |
| Flow rate (m3/s) | |
| Particle charge (C) | |
| Separated charge (C) | |
| Capillary radius (m) | |
| Fouling layer resistance | |
| Membrane resistance (m−1) | |
| Separation distance between the opposite charges (m) | |
| Volumetric specific surface area (m−1) | |
| Temperature ( °C) | |
| Time of filtration (s) | |
| Crossflow (horizontal) profile (m/s) | |
| Crossflow velocity (m/s) | |
| Volume of permeate (L) | |
| Electrophoretic velocity (m/s) | |
| Flux (vertical) as a function of time (m/s) | |
| Flux velocity (m/s) | |
| Average electroosmosis velocity along the z-axis (m/s) | |
| Debye–Hückel parameter | |
| Boundary layer thickness between the capillary wall and the slip plane (m) | |
| Permittivity (F/m) | |
| Vacuum permittivity (F/m) Permittivity of the medium (F/m) | |
| Permittivity of the particle (F/m) Complex permittivity (F/m) | |
| Complex permittivity of the medium (F/m) | |
| Complex permittivity of the particle (F/m) | |
| Zeta potential (V) | |
| Dynamic viscosity (Pa∙s) | |
| Specific conductance of liquid (S/m) | |
| Osmotic pressure (Pa) | |
| Electrophoretic mobility (m2/V/cm) Dipole moment (C∙m) | |
| Fluid density (kg/m3) | |
| Osmotic reflection coefficient | |
| γ | Conductivity (S/m) |
| Porosity | |
| Angular frequency of the electric field (rad/s) |
References
- Pearce, G. Introduction to membranes: Filtration for water and wastewater treatment. Filtr. Sep. 2007, 44, 24–27. [Google Scholar] [CrossRef]
- Pereira Nunes, S.; Peinemann, K.-V. Membrane Technology in the Chemical Industry; Wiley-VCH: New York, NY, USA, 2006. [Google Scholar]
- Guo, W.; Ngo, H.-H.; Li, J. A mini-review on membrane fouling. Bioresour. Technol. 2012, 122, 27–34. [Google Scholar] [CrossRef] [PubMed]
- Aimar, P.; Meireles, M.; Bacchin, P.; Sanchez, V. Fouling and concentration polarisation in ultrafiltration and microfiltration. In Membrane Processes in Separation and Purification; Crespo, J., Böddeker, K., Eds.; Springer: Berlin/Heidelberg, Germany, 1994; pp. 27–57. [Google Scholar] [CrossRef]
- Bacchin, P.; Aimar, P.; Field, R. Critical and sustainable fluxes: Theory, experiments and applications. J. Membr. Sci. 2006, 281, 42–69. [Google Scholar] [CrossRef] [Green Version]
- Shirazi, S.; Lin, C.-J.; Chen, D. Inorganic fouling of pressure-driven membrane processes—A critical review. Desalination 2010, 250, 236–248. [Google Scholar] [CrossRef]
- Sablani, S.; Goosen, M.; Al-Belushi, R.; Wilf, M. Concentration polarization in ultrafiltration and reverse osmosis: A critical review. Desalination 2001, 141, 269–289. [Google Scholar] [CrossRef]
- Giacobbo, A.; Bernardes, A.M.; Rosa, M.J.F.; De Pinho, M.N. Concentration Polarization in Ultrafiltration/Nanofiltration for the Recovery of Polyphenols from Winery Wastewaters. Membranes 2018, 8, 46. [Google Scholar] [CrossRef] [Green Version]
- Wang, Z.; Ma, J.; Tang, C.Y.; Kimura, K.; Wang, Q.; Han, X. Membrane cleaning in membrane bioreactors: A review. J. Membr. Sci. 2014, 468, 276–307. [Google Scholar] [CrossRef]
- Shi, X.; Tal, G.; Hankins, N.P.; Gitis, V. Fouling and cleaning of ultrafiltration membranes: A review. J. Water Process. Eng. 2014, 1, 121–138. [Google Scholar] [CrossRef]
- Yusuf, Z.; Wahab, N.A.; Sahlan, S. Fouling control strategy for submerged membrane bioreactor filtration processes using aeration airflow, backwash, and relaxation: A review. Desalin. Water Treat. 2015, 57, 17683–17695. [Google Scholar] [CrossRef]
- Porcelli, N.; Judd, S. Chemical cleaning of potable water membranes: A review. Sep. Purif. Technol. 2010, 71, 137–143. [Google Scholar] [CrossRef] [Green Version]
- Jiang, S.; Li, Y.; Ladewig, B.P. A review of reverse osmosis membrane fouling and control strategies. Sci. Total. Environ. 2017, 595, 567–583. [Google Scholar] [CrossRef]
- Michałek, K.; Krzysztoforski, J.; Henczka, M.; da Ponte, M.N.; Bogel-Łukasik, E. Cleaning of microfiltration membranes from industrial contaminants using “greener” alternatives in a continuous mode. J. Supercrit. Fluids 2015, 102, 115–122. [Google Scholar] [CrossRef]
- Miller, D.J.; Dreyer, D.R.; Bielawski, C.W.; Paul, D.R.; Freeman, B.D. Surface Modification of Water Purification Membranes. Angew. Chem. Int. Ed. 2017, 56, 4662–4711. [Google Scholar] [CrossRef] [Green Version]
- Ajmani, G.; Goodwin, D.; Marsh, K.; Fairbrother, D.H.; Schwab, K.J.; Jacangelo, J.G.; Huang, H. Modification of low pressure membranes with carbon nanotube layers for fouling control. Water Res. 2012, 46, 5645–5654. [Google Scholar] [CrossRef]
- Madsen, H.; Bajraktari, N.; Hélix-Nielsen, C.; Van der Bruggen, B.; Søgaard, E.G. Use of biomimetic forward osmosis membrane for trace organics removal. J. Membr. Sci. 2015, 476, 469–474. [Google Scholar] [CrossRef]
- Duan, J.; Kim, K.; Daeschel, M.; Zhao, Y. Storability of antimicrobial chitosan-lysozyme composite coating and film-forming solutions. J. Food Sci. 2008, 73, M321–M329. [Google Scholar] [CrossRef]
- He, J.; Siah, T.-S.; Chen, J.P. Performance of an optimized Zr-based nanoparticle-embedded PSF blend hollow fiber membrane in treatment of fluoride contaminated water. Water Res. 2014, 56, 88–97. [Google Scholar] [CrossRef]
- Chun, Y.; Qing, L.; Sun, G.; Bilad, M.R.; Fane, A.G.; Chong, T.H. Prototype aquaporin-based forward osmosis membrane: Filtration properties and fouling resistance. Desalination 2018, 445, 75–84. [Google Scholar] [CrossRef]
- Mostafazadeh, A.K.; Zolfaghari, M.; Drogui, P. Electrofiltration technique for water and wastewater treatment and bio-products management: A review. J. Water Process. Eng. 2016, 14, 28–40. [Google Scholar] [CrossRef]
- Gözke, G.; Posten, C. Electrofiltration of Biopolymers. Food Eng. Rev. 2010, 2, 131–146. [Google Scholar] [CrossRef]
- Li, Y.E.R.; Biswas, P.; Kulkarni, P.; Carns, K.; Patterson, C.; Krishnan, R.; Snha, R. Removal of Waterborne Particles by Electrofiltration: Pilot-Scale Testing. Environ. Eng. Sci. 2009, 26, 1795–1803. [Google Scholar] [CrossRef] [Green Version]
- Moulik, S.P. Physical aspects of electrofiltration. Environ. Sci. Technol. 1971, 5, 771–776. [Google Scholar] [CrossRef]
- Henry, J.D., Jr.; Lawler, L.F.; Kuo, C.H.A. A solid/liquid separation process based on cross flow and electrofiltration. AIChE J. 1977, 23, 851–859. [Google Scholar] [CrossRef]
- Larue, O.; Vorobiev, E. Sedimentation and water electrolysis effects in electrofiltration of kaolin suspension. AIChE J. 2004, 50, 3120–3133. [Google Scholar] [CrossRef]
- Sarkar, B. Enhanced cross-flow ultrafiltration of apple juice using electric field. J. Food Process. Preserv. 2014, 39, 1372–1384. [Google Scholar] [CrossRef]
- Chuang, C.-J.; Wu, C.-Y.; Wu, C.-C. Combination of crossflow and electric field for microfiltration of protein/microbial cell suspensions. Desalination 2008, 233, 295–302. [Google Scholar] [CrossRef]
- Ensano, B.M.B.; Borea, L.; Naddeo, V.; Belgiorno, V.; De Luna, M.D.G.; Ballesteros, F.C.J. Combination of Electrochemical Processes with Membrane Bioreactors for Wastewater Treatment and Fouling Control: A Review. Front. Environ. Sci. 2016, 4, 57. [Google Scholar] [CrossRef] [Green Version]
- Du, F.; Ciaciuch, P.; Bohlen, S.; Wang, Y.; Baune, M.; Thöming, J. Intensification of cross-flow membrane filtration using dielectrophoresis with a novel electrode configuration. J. Membr. Sci. 2013, 448, 256–261. [Google Scholar] [CrossRef]
- Huang, J.; Wang, Z.; Zhang, J.; Zhang, X.; Ma, J.; Wu, Z. A novel composite conductive microfiltration membrane and its anti-fouling performance with an external electric field in membrane bioreactors. Sci. Rep. 2015, 5, 1–8. [Google Scholar] [CrossRef] [Green Version]
- Liu, H.; Zhang, G.; Zhao, C.; Liu, J.; Yang, F. Hydraulic power and electric field combined antifouling effect of a novel conductive poly(aminoanthraquinone)/reduced graphene oxide nanohybrid blended PVDF ultrafiltration membrane. J. Mater. Chem. A 2015, 3, 20277–20287. [Google Scholar] [CrossRef]
- Rajha, H.N.; Boussetta, N.; Louka, N.; Maroun, R.G.; Vorobiev, E. Effect of alternative physical pretreatments (pulsed electric field, high voltage electrical discharges and ultrasound) on the dead-end ultrafiltration of vine-shoot extracts. Sep. Purif. Technol. 2015, 146, 243–251. [Google Scholar] [CrossRef]
- Bani-Melhem, K.; Elektorowicz, M. Performance of the submerged membrane electro-bioreactor (SMEBR) with iron electrodes for wastewater treatment and fouling reduction. J. Membr. Sci. 2011, 379, 434–439. [Google Scholar] [CrossRef]
- Oussedik, S.; Belhocine, D.; Grib, H.; Lounici, H.; Piron, D.; Mameri, N. Enhanced ultrafiltration of bovine serum albumin with pulsed electric field and fluidized activated alumina. Desalination 2000, 127, 59–68. [Google Scholar] [CrossRef]
- Hu, C.; Li, M.; Sun, J.; Liu, R.; Liu, H.; Qu, J. NOM fouling resistance in response to electric field during electro-ultrafiltration: Significance of molecular polarity and weight. J. Colloid Interface Sci. 2018, 539, 11–18. [Google Scholar] [CrossRef]
- Technology trends in membrane filtration use. Filtr. Sep. 2018, 55, 30–33. [CrossRef]
- Meng, F.; Zhang, H.; Yang, F.; Zhang, S.; Li, Y.; Zhang, X. Identification of activated sludge properties affecting membrane fouling in submerged membrane bioreactors. Sep. Purif. Technol. 2006, 51, 95–103. [Google Scholar] [CrossRef]
- Yang, G.C.; Yang, T.-Y.; Tsai, S.-H. Crossflow electro-microfiltration of oxide-CMP wastewater. Water Res. 2003, 37, 785–792. [Google Scholar] [CrossRef]
- Weng, Y.-H.; Li, K.-C.; Chaung-Hsieh, L.H.; Huang, C. Removal of humic substances (HS) from water by electro-microfiltration (EMF). Water Res. 2006, 40, 1783–1794. [Google Scholar] [CrossRef]
- Chen, J.-P.; Yang, C.-Z.; Zhou, J.-H.; Wang, X.-Y. Study of the influence of the electric field on membrane flux of a new type of membrane bioreactor. Chem. Eng. J. 2007, 128, 177–180. [Google Scholar] [CrossRef]
- Du, F.; Hawari, A.; Baune, M.; Thöming, J. Dielectrophoretically intensified cross-flow membrane filtration. J. Membr. Sci. 2009, 336, 71–78. [Google Scholar] [CrossRef]
- Chiu, T.Y. Electrically Assisted Microfiltration of Whey Suspensions using Non-Circular Multichannel Ceramic Membranes. Sep. Sci. Technol. 2013, 48, 84–92. [Google Scholar] [CrossRef]
- Zhang, Q.; Arribas, P.; Remillard, E.M.; García-Payo, C.; Khayet, M.; Vecitis, C.D. Interlaced CNT Electrodes for Bacterial Fouling Reduction of Microfiltration Membranes. Environ. Sci. Technol. 2017, 51, 9176–9183. [Google Scholar] [CrossRef]
- Monfared, M.A.; Sheikhi, M.H.; Kasiri, N.; Mohammadi, T. Experimental investigation of oil-in-water microfiltration assisted by Dielectrophoresis: Operational condition optimization. Chem. Eng. Res. Des. 2018, 137, 421–433. [Google Scholar] [CrossRef]
- Hou, B.; Kuang, Y.; Han, H.; Liu, Y.; Ren, B.; Deng, R.; Hursthouse, A. Enhanced performance and hindered membrane fouling for the treatment of coal chemical industry wastewater using a novel membrane electro-bioreactor with intermittent direct current. Bioresour. Technol. 2018, 271, 332–339. [Google Scholar] [CrossRef] [Green Version]
- Sarkar, B.; Dasgupta, S.; De, S. Effect of electric field during gel-layer controlled ultrafiltration of synthetic and fruit juice. J. Membr. Sci. 2008, 307, 268–276. [Google Scholar] [CrossRef]
- Lee, H.-H.; Weng, Y.-H.; Li, K.-C. Electro-ultrafiltration study on Aldrich humic substances with different molecular weights. Sep. Purif. Technol. 2008, 63, 23–29. [Google Scholar] [CrossRef]
- Song, W.; Su, Y.; Chen, X.; Ding, L.; Wan, Y. Rapid concentration of protein solution by a crossflow electro-ultrafiltration process. Sep. Purif. Technol. 2010, 73, 310–318. [Google Scholar] [CrossRef]
- Sarkar, B.; De, S. Prediction of permeate flux for turbulent flow in cross flow electric field assisted ultrafiltration. J. Membr. Sci. 2011, 369, 77–87. [Google Scholar] [CrossRef]
- Venkataganesh, B.; Maiti, A.; Bhattacharjee, S.; De, S. Electric field assisted cross flow micellar enhanced ultrafiltration for removal of naphthenic acid. Sep. Purif. Technol. 2012, 98, 36–45. [Google Scholar] [CrossRef]
- Agana, B.A.; Reeve, D.; Orbell, J.D. The influence of an applied electric field during ceramic ultrafiltration of post-electrodeposition rinse wastewater. Water Res. 2012, 46, 3574–3584. [Google Scholar] [CrossRef]
- Sun, J.; Hu, C.; Tong, T.; Zhao, K.; Qu, J.; Liu, H.; Elimelech, M. Performance and Mechanisms of Ultrafiltration Membrane Fouling Mitigation by Coupling Coagulation and Applied Electric Field in a Novel Electrocoagulation Membrane Reactor. Environ. Sci. Technol. 2017, 51, 8544–8551. [Google Scholar] [CrossRef] [PubMed]
- Wang, W.; Zhu, L.; Shan, B.; Xie, C.; Liu, C.; Cui, F.; Li, G. Preparation and characterization of SLS-CNT/PES ultrafiltration membrane with antifouling and antibacterial properties. J. Membr. Sci. 2018, 548, 459–469. [Google Scholar] [CrossRef]
- Mao, H.; Qiu, M.; Zhang, T.; Chen, X.; Da, X.; Jing, W.; Fan, Y. Robust CNT-based conductive ultrafiltration membrane with tunable surface potential for in situ fouling mitigation. Appl. Surf. Sci. 2019, 497, 143786. [Google Scholar] [CrossRef]
- Bakr, A.R.; Rahaman, S. Electrochemical efficacy of a carboxylated multiwalled carbon nanotube filter for the removal of ibuprofen from aqueous solutions under acidic conditions. Chemosphere 2016, 153, 508–520. [Google Scholar] [CrossRef]
- Rouina, M.; Kariminia, H.-R.; Mousavi, S.A.; Shahryari, E. Effect of electromagnetic field on membrane fouling in reverse osmosis process. Desalination 2016, 395, 41–45. [Google Scholar] [CrossRef]
- Jiang, W.; Xu, X.; Lin, L.; Wang, H.; Shaw, R.; Lucero, D.; Xu, P. A Pilot Study of an Electromagnetic Field for Control of Reverse Osmosis Membrane Fouling and Scaling During Brackish Groundwater Desalination. Water 2019, 11, 1015. [Google Scholar] [CrossRef] [Green Version]
- Asif, M.B.; Maqbool, T.; Zhang, Z. Electrochemical membrane bioreactors: State-of-the-art and future prospects. Sci. Total. Environ. 2020, 741, 140233. [Google Scholar] [CrossRef]
- Ibeid, S.; Elektorowicz, M.; Oleszkiewicz, J.A. Novel electrokinetic approach reduces membrane fouling. Water Res. 2013, 47, 6358–6366. [Google Scholar] [CrossRef]
- Jones, T. Electromechanics of Particles; Cambridge University Press: Cambridge, UK, 1995. [Google Scholar]
- An, S.J.; Zhu, Y.; Lee, S.H.; Stoller, M.D.; Emilsson, T.; Park, S.; Velamakanni, A.; An, J.; Ruoff, R.S. Thin Film Fabrication and Simultaneous Anodic Reduction of Deposited Graphene Oxide Platelets by Electrophoretic Deposition. J. Phys. Chem. Lett. 2010, 1, 1259–1263. [Google Scholar] [CrossRef]
- Liu, L.; Liu, J.; Gao, B.; Yang, F. Minute electric field reduced membrane fouling and improved performance of membrane bioreactor. Sep. Purif. Technol. 2012, 86, 106–112. [Google Scholar] [CrossRef]
- Masliyah, J.B.S. Electrokinetic and Colloid Transport Phenomenon; John Wiley & Sons, Inc.: Hoboken, NJ, USA, 2006. [Google Scholar]
- Huotari, H.; Trägårdh, G.; Huisman, I. Crossflow Membrane Filtration Enhanced by an External DC Electric Field: A Review. Chem. Eng. Res. Des. 1999, 77, 461–468. [Google Scholar] [CrossRef]
- Hunter, R.J. Foundations of Colloid Science-Oxford University Press; Oxford University Press: New York, NY, USA, 2001. [Google Scholar]
- Wang, C.; Wang, L.; Zhu, X.; Wang, Y.; Xue, J. Low-voltage electroosmotic pumps fabricated from track-etched polymer membranes. Lab Chip 2012, 12, 1710–1716. [Google Scholar] [CrossRef]
- Iwata, M.; Tanaka, T.; Jami, M. Application of Electroosmosis for Sludge Dewatering—A Review. Dry. Technol. 2013, 31, 170–184. [Google Scholar] [CrossRef]
- Kobayashi, K.; Iwata, M.; Hosoda, Y.; Yukawa, H. Fundamental study of electroosmotic flow through perforated membrane. J. Chem. Eng. Jpn. 1979, 12, 466–471. [Google Scholar] [CrossRef]
- Kobayashi, K.; Hakoda, M.; Hosoda, Y.; Iwata, M.; Yukawa, H. Electroosmotic flow through particle beds and electroosmotic pressure distribution. J. Chem. Eng. Jpn. 1979, 12, 492–494. [Google Scholar] [CrossRef] [Green Version]
- Vecitis, C.D.; Schnoor, M.H.; Rahaman, S.; Schiffman, J.D.; Elimelech, M. Electrochemical Multiwalled Carbon Nanotube Filter for Viral and Bacterial Removal and Inactivation. Environ. Sci. Technol. 2011, 45, 3672–3679. [Google Scholar] [CrossRef]
- Yang, Y.; Lin, L.; Tse, L.K.; Dong, H.; Yu, S.; Hoffmann, M.R. Membrane-separated electrochemical latrine wastewater treatment. Environ. Sci. Water Res. Technol. 2018, 5, 51–59. [Google Scholar] [CrossRef] [Green Version]
- Hashaikeh, R.; Lalia, B.S.; Kochkodan, V.; Hilal, N. A novel in situ membrane cleaning method using periodic electrolysis. J. Membr. Sci. 2014, 471, 149–154. [Google Scholar] [CrossRef]
- Ahmed, F.; Lalia, B.S.; Kochkodan, V.; Hilal, N.; Hashaikeh, R. Electrically conductive polymeric membranes for fouling prevention and detection: A review. Desalination 2016, 391, 1–15. [Google Scholar] [CrossRef]
- Abid, H.S.; Johnson, D.J.; Clifford, B.; Gethin, D.T.; Bertoncello, P.; Hashaikeh, R.; Hilal, N. Periodic electrolysis technique for in situ fouling control and removal with low-pressure membrane filtration. Desalination 2018, 433, 10–24. [Google Scholar] [CrossRef] [Green Version]
- Vik, E.A.; Carlson, D.A.; Eikum, A.S.; Gjessing, E.T. Electrocoagulation of potable water. Water Res. 1984, 18, 1355–1360. [Google Scholar] [CrossRef]
- Kobya, M.; Can, O.T.; Bayramoglu, M. Treatment of textile wastewaters by electrocoagulation using iron and aluminum electrodes. J. Hazard. Mater. 2003, 100, 163–178. [Google Scholar] [CrossRef]
- Molla, S.H.; Masliyah, J.H.; Bhattacharjee, S. Simulations of a dielectrophoretic membrane filtration process for removal of water droplets from water-in-oil emulsions. J. Colloid Interface Sci. 2005, 287, 338–350. [Google Scholar] [CrossRef] [PubMed]
- Molla, S.; Bhattacharjee, S. Prevention of colloidal membrane fouling employing dielectrophoretic forces on a parallel electrode array. J. Membr. Sci. 2005, 255, 187–199. [Google Scholar] [CrossRef]
- Hawari, A.H.; Du, F.; Baune, M.; Thöming, J. A fouling suppression system in submerged membrane bioreactors using dielectrophoretic forces. J. Environ. Sci. 2015, 29, 139–145. [Google Scholar] [CrossRef]
- Rashed, M.Z.; Williams, S.J. Advances and applications of isomotive dielectrophoresis for cell analysis. Anal. Bioanal. Chem. 2020, 412, 3813–3833. [Google Scholar] [CrossRef]
- Mikhaylin, S.; Nikonenko, V.; Pourcelly, G.; Bazinet, L. Hybrid bipolar membrane electrodialysis/ultrafiltration technology assisted by a pulsed electric field for casein production. Green Chem. 2015, 18, 307–314. [Google Scholar] [CrossRef]
- Young, C.L.; Ingall, E.D. Marine Dissolved Organic Phosphorus Composition: Insights from Samples Recovered Using Combined Electrodialysis/Reverse Osmosis. Aquat. Geochem. 2010, 16, 563–574. [Google Scholar] [CrossRef]
- Rudolph, G.; Virtanen, T.; Ferrando, M.; Güell, C.; Lipnizki, F.; Kallioinen, M. A review of in situ real-time monitoring techniques for membrane fouling in the biotechnology, biorefinery and food sectors. J. Membr. Sci. 2019, 588, 117221. [Google Scholar] [CrossRef]
- Vrouwenvelder, J.S.; Picioreanu, C.; Kruithof, J.C.; Van Loosdrecht, M.C.M. Biofouling in spiral wound membrane systems: Three-dimensional CFD model-based evaluation of experimental data. J. Membr. Sci. 2010, 346, 71–85. [Google Scholar] [CrossRef]
- Bristow, N.W.; Vogt, S.; O’Neill, K.; Vrouwenvelder, J.S.; Johns, M.L.; Fridjonsson, E.O. Flow field in fouling spiral wound reverse osmosis membrane modules using MRI velocimetry. Desalination 2020, 491, 114508. [Google Scholar] [CrossRef]
- Li, C.; Felz, S.; Wagner, M.; Lackner, S.; Horn, H. Investigating biofilm structure developing on carriers from lab-scale moving bed biofilm reactors based on light microscopy and optical coherence tomography. Bioresour. Technol. 2015, 200, 128–136. [Google Scholar] [CrossRef]
- Ngene, I.S.; Lammertink, R.G.; Wessling, M.; Van Der Meer, W.G.J. A microfluidic membrane chip for in situ fouling characterization. J. Membr. Sci. 2009, 346, 202–207. [Google Scholar] [CrossRef]
- Hughes, D.J.; Cui, Z.; Field, A.R.W.; Tirlapur, U.K. In Situ Three-Dimensional Characterization of Membrane Fouling by Protein Suspensions Using Multiphoton Microscopy. Langmuir 2006, 22, 6266–6272. [Google Scholar] [CrossRef]
- Virtanen, T.; Parkkila, P.; Koivuniemi, A.; Lahti, J.; Viitala, T.; Kallioinen, M.; Mänttäri, M.; Bunker, A. Characterization of membrane–foulant interactions with novel combination of Raman spectroscopy, surface plasmon resonance and molecular dynamics simulation. Sep. Purif. Technol. 2018, 205, 263–272. [Google Scholar] [CrossRef]
- Li, J.; Hallbauer, D.; Sanderson, R. Direct monitoring of membrane fouling and cleaning during ultrafiltration using a non-invasive ultrasonic technique. J. Membr. Sci. 2003, 215, 33–52. [Google Scholar] [CrossRef]
- Segal, Y.; Linker, R.; Dosoretz, C. Quantitative estimation of protein fouling of ultra-filtration membranes by photoacoustic spectroscopy. Desalination 2011, 271, 231–235. [Google Scholar] [CrossRef]
- Chen, J.; Yang, Y.-C.; Wei, T.-Y. Application of wavelet analysis and decision tree in UTDR data for diagnosis of membrane filtration. Chemom. Intell. Lab. Syst. 2012, 116, 102–111. [Google Scholar] [CrossRef]
- Diaconu, G.; Schäfer, T. Study of the interactions of proteins with a solid surface using complementary acoustic and optical techniques. Biointerphases 2014, 9, 029015. [Google Scholar] [CrossRef]
- Li, X.; Mo, Y.; Li, J.; Guo, W.; Ngo, H.H. In-situ monitoring techniques for membrane fouling and local filtration characteristics in hollow fiber membrane processes: A critical review. J. Membr. Sci. 2017, 528, 187–200. [Google Scholar] [CrossRef]
- Koltuniewicz, A.; Field, R.; Arnot, T. Cross-flow and dead-end microfiltration of oily-water emulsion. Part I: Experimental study and analysis of flux decline. J. Membr. Sci. 1995, 102, 193–207. [Google Scholar] [CrossRef]
- Arnot, T.; Field, R.; Kołtuniewicz, A. Cross-flow and dead-end microfiltration of oily-water emulsions: Part II. Mechanisms and modelling of flux decline. J. Membr. Sci. 2000, 169, 1–15. [Google Scholar] [CrossRef]
- Zhu, Z.; Bals, O.; Grimi, N.; Ding, L.; Vorobiev, E. Qualitative characteristics and dead-end ultrafiltration of chicory juice obtained from pulsed electric field treated chicories. Ind. Crop. Prod. 2013, 46, 8–14. [Google Scholar] [CrossRef]
- Mhemdi, H.; Bals, O.; Grimi, N.; Vorobiev, E. Alternative Pressing/Ultrafiltration Process for Sugar Beet Valorization: Impact of Pulsed Electric Field and Cossettes Preheating on the Qualitative Characteristics of Juices. Food Bioprocess Technol. 2013, 7, 795–805. [Google Scholar] [CrossRef]
- Nakatsuka, S.; Nakate, I.; Miyano, T. Drinking water treatment by using ultrafiltration hollow fiber membranes. Desalination 1996, 106, 55–61. [Google Scholar] [CrossRef]
- Zumbusch, P.V.; Kulcke, W.; Brunner, G. Use of alternating electrical fields as anti-fouling strategy in ultrafiltration of biological suspensions—Introduction of a new experimental procedure for crossflow filtration. J. Membr. Sci. 1998, 142, 75–86. [Google Scholar] [CrossRef]
- Gryta, M. The influence of magnetic water treatment on CaCO3 scale formation in membrane distillation process. Sep. Purif. Technol. 2011, 80, 293–299. [Google Scholar] [CrossRef]
- Weigert, T.; Altmann, J.; Ripperger, S. Crossflow electrofiltration in pilot scale. J. Membr. Sci. 1999, 159, 253–262. [Google Scholar] [CrossRef]
- Huotari, H.M.; Huisman, I.H.; Trägårdh, G. Electrically enhanced crossflow membrane filtration of oily waste-water using the membrane as a cathode. J. Membr. Sci. 1999, 156, 49–60. [Google Scholar] [CrossRef]
- Piry, A.; Heino, A.; Kühnl, W.; Grein, T.; Ripperger, S.; Kulozik, U. Effect of membrane length, membrane resistance, and filtration conditions on the fractionation of milk proteins by microfiltration. J. Dairy Sci. 2012, 95, 1590–1602. [Google Scholar] [CrossRef]
- Song, L. Flux decline in crossflow microfiltration and ultrafiltration: Mechanisms and modeling of membrane fouling. J. Membr. Sci. 1998, 139, 183–200. [Google Scholar] [CrossRef]
- Jönsson, C.; Jönsson, A.-S. Influence of the membrane material on the adsorptive fouling of ultrafiltration membranes. J. Membr. Sci. 1995, 108, 79–87. [Google Scholar] [CrossRef]
- Grossman, A.D.; Yang, Y.; Yogev, U.; Camarena, D.C.; Oron, G.; Bernstein, R. Effect of ultrafiltration membrane material on fouling dynamics in a submerged anaerobic membrane bioreactor treating domestic wastewater. Environ. Sci. Water Res. Technol. 2019, 5, 1145–1156. [Google Scholar] [CrossRef]
- Fan, X.; Liu, Y.; Quan, X.; Chen, S. Highly Permeable Thin-Film Composite Forward Osmosis Membrane Based on Carbon Nanotube Hollow Fiber Scaffold with Electrically Enhanced Fouling Resistance. Environ. Sci. Technol. 2018, 52, 1444–1452. [Google Scholar] [CrossRef]
- Maharubin, S.; Zhou, Y.; Tan, G.Z. Development and Investigation on a Silver Nanoparticle-Incorporated Electrofiltration System for Biofouling Control. IEEE Trans. Nanotechnol. 2018, 17, 948–954. [Google Scholar] [CrossRef]
- Li, R.; Wu, Y.; Shen, L.; Chen, J.; Lin, H. A novel strategy to develop antifouling and antibacterial conductive Cu/polydopamine/polyvinylidene fluoride membranes for water treatment. J. Colloid Interface Sci. 2018, 531, 493–501. [Google Scholar] [CrossRef]
- Zhao, X.; Liu, C. One-step fabricated bionic PVDF ultrafiltration membranes exhibiting innovative antifouling ability to the cake fouling. J. Membr. Sci. 2016, 515, 29–35. [Google Scholar] [CrossRef]
- Formoso, P.; Pantuso, E.; De Filpo, G.; Nicoletta, F.P. Electro-Conductive Membranes for Permeation Enhancement and Fouling Mitigation: A Short Review. Membranes 2017, 7, 39. [Google Scholar] [CrossRef] [Green Version]
- Nady, N.; Franssen, M.C.; Zuilhof, H.; Eldin, M.S.M.; Boom, R.; Schroën, K. Modification methods for poly(arylsulfone) membranes: A mini-review focusing on surface modification. Desalination 2011, 275, 1–9. [Google Scholar] [CrossRef]
- Yang, B.; Geng, P.; Chen, G. One-dimensional structured IrO2 nanorods modified membrane for electrochemical anti-fouling in filtration of oily wastewater. Sep. Purif. Technol. 2015, 156, 931–941. [Google Scholar] [CrossRef]
- Wen, Y.; Yuan, J.; Ma, X.; Wang, S.; Liu, Y. Polymeric nanocomposite membranes for water treatment: A review. Environ. Chem. Lett. 2019, 17, 1539–1551. [Google Scholar] [CrossRef]
- Fu, W.; Zhang, W. Microwave-enhanced membrane filtration for water treatment. J. Membr. Sci. 2018, 568, 97–104. [Google Scholar] [CrossRef]
- Davis, M.L. Wastewater Engineering Design Principles and Practice; McGraw-Hill: New York, NY, USA, 2010. [Google Scholar]
- Zularisam, A.; Ismail, A.; Salim, M.R. Behaviours of natural organic matter in membrane filtration for surface water treatment—A review. Desalination 2006, 194, 211–231. [Google Scholar] [CrossRef] [Green Version]
- Hofmann, R.; Käppler, T.; Posten, C. Pilot-scale press electrofiltration of biopolymers. Sep. Purif. Technol. 2006, 51, 303–309. [Google Scholar] [CrossRef]
- Polyakov, Y.S.; Zydney, A.L. Ultrafiltration membrane performance: Effects of pore blockage/constriction. J. Membr. Sci. 2013, 434, 106–120. [Google Scholar] [CrossRef]
- Hermia, J. Blocking filtration. Application to non-newtonian fluids. In Mathematical Models and Design Methods in Solid-Liquid Separation; Rushton, A., Ed.; NATO ASI Series (Series E: Applied Sciences); Springer: Dordrecht, The Netherlands, 1985. [Google Scholar] [CrossRef]
- Koĺtuniewicz, A.B.; Field, R. Process factors during removal of oil-in-water emulsions with cross-flow microfiltration. Desalination 1996, 105, 79–89. [Google Scholar] [CrossRef]
- Chen, J.C.; Kim, A.S. Monte Carlo simulation of colloidal membrane filtration: Principal issues for modeling. Adv. Colloid Interface Sci. 2006, 119, 35–53. [Google Scholar] [CrossRef]
- Marshall, J.S.L. Adhesive Particle Flow: A Discrete-Element Approach; Cambridge University Press: New York, NY, USA, 2014. [Google Scholar]
- Belfort, G. Fluid mechanics in membrane filtration: Recent developments. J. Membr. Sci. 1989, 40, 123–147. [Google Scholar] [CrossRef]
- Belfort, G.; Nagata, N. Fluid mechanics and cross-flow filtration: Some thoughts. Desalination 1985, 53, 57–79. [Google Scholar] [CrossRef]
- Belfort, G. Membrane modules: Comparison of different configurations using fluid mechanics. J. Membr. Sci. 1988, 35, 245–270. [Google Scholar] [CrossRef]
- Keir, G.; Jegatheesan, V. A review of computational fluid dynamics applications in pressure-driven membrane filtration. Rev. Environ. Sci. Bio/Technol. 2013, 13, 183–201. [Google Scholar] [CrossRef]
- Ghidossi, R.; Veyret, D.; Moulin, P. Computational fluid dynamics applied to membranes: State of the art and opportunities. Chem. Eng. Process. Process. Intensif. 2006, 45, 437–454. [Google Scholar] [CrossRef]
- Chen, J.C.; Elimelech, M.; Kim, A.S. Monte Carlo simulation of colloidal membrane filtration: Model development with application to characterization of colloid phase transition. J. Membr. Sci. 2005, 255, 291–305. [Google Scholar] [CrossRef]
- Boyle, P.M.; Houchens, B.C.; Kim, A.S. Simulation of colloidal fouling by coupling a dynamically updating velocity profile and electric field interactions with Force Bias Monte Carlo methods for membrane filtration. J. Colloid Interface Sci. 2013, 399, 77–86. [Google Scholar] [CrossRef]
- Shetty, G.R.; Chellam, S. Predicting membrane fouling during municipal drinking water nanofiltration using artificial neural networks. J. Membr. Sci. 2003, 217, 69–86. [Google Scholar] [CrossRef]
- Abiodun, O.I.; Jantan, A.; Omolara, A.E.; Dada, K.V.; Mohamed, N.A.; Arshad, H. State-of-the-art in artificial neural network applications: A survey. Heliyon 2018, 4, e00938. [Google Scholar] [CrossRef] [Green Version]
- Sarkar, B.; Sengupta, A.; De, S.; DasGupta, S. Prediction of permeate flux during electric field enhanced cross-flow ultrafiltration—A neural network approach. Sep. Purif. Technol. 2009, 65, 260–268. [Google Scholar] [CrossRef]
- Bowen, W.; Kingdon, R.S.; Sabuni, H.A. Electrically enhanced separation processes: The basis of in situ intermittent electrolytic membrane cleaning (IIEMC) and in situ electrolytic membrane restoration (IEMR). J. Membr. Sci. 1989, 40, 219–229. [Google Scholar] [CrossRef]
- Karagiannis, I.C.; Soldatos, P.G. Water desalination cost literature: Review and assessment. Desalination 2008, 223, 448–456. [Google Scholar] [CrossRef]
- Porcelli, N.; Judd, S. Chemical cleaning of potable water membranes: The cost benefit of optimisation. Water Res. 2010, 44, 1389–1398. [Google Scholar] [CrossRef]
- Boretti, A.; Rosa, L. Reassessing the projections of the World Water Development Report. NPJ Clean Water 2019, 2, 15. [Google Scholar] [CrossRef]
- Yalcinkaya, F.; Boyraz, E.; Maryska, J.; Kucerova, K. A Review on Membrane Technology and Chemical Surface Modification for the Oily Wastewater Treatment. Materials 2020, 1, 493. [Google Scholar] [CrossRef] [PubMed] [Green Version]


| Feed Water Composition | Characterization of Membrane Fouling | Electric Field | Experimental Setup | Membrane Type | Fouling Mitigation Effect | Publication Year |
|---|---|---|---|---|---|---|
| Prefiltered (1.2 μm) oxide-chemical-mechanical polishing wastewater: pH 9.84, conductivity 145.1 μS/cm, Total alkalinity 70 mg/L eq CaCO3, TS 55.8 mg/L, Turbidity 0.39 NTU, Si 79.81 mg/L, Al 0.09 mg/L, Fe 0.12 mg/L, Cu 0.19 mg/L, Ca 0.03 mg/L, Mg 0.04 mg/L, K 21.3 mg/L | Flux monitoring; scanning electron microscopy (SEM) | Continuous direct current (DC) up to 167 V/cm; Pulsed with 10 min intervals; | Bench-scale up to 2 h; Flat plate crossflow; Parallel electrode plates (material unspecified) | Polyvinylidene difluoride (PVDF), 0.1 μm | The continuous DC field retains up to about 40% more of the initial flux by the end of the filtration; The pulsed electric field retained up to about 10% more of the initial flux by the end of the filtration. | 2003 [39] |
| Prefiltered (0.45 μm) humic acid (aq): 1 g/L | Flux monitoring; Foulant rejection rate; SEM | Continuous DC up to 116 V/cm | Bench-scale up to 2 h; Flat plate crossflow; Parallel electrode plates (anode: platinum; cathode: titanium) | Polyethersulfone (PES), 0.1 μm | The DC field retains up to 60% of the initial flux by the end of filtration compared to without the field | 2006 [40] |
| Activated sludge: COD 310–740 mg/L, pH 5–8, turbidity 100–500 NTU, SS 400–800 mg/L, ζ-potential −18.4~−22.6 mV, temperature 15–25 °C | Flux monitoring | Continuous DC up to 30 V/cm | Pilot-scale up to 16 h; Bioreactor with spiral hollow fiber membrane module; Parallel electrode plates (stainless steel) | Polypropylene (PP), pore size unreported | The DC field retains up to about 15% more of the initial flux by the end of filtration | 2007 [41] |
| BSA/yeast mixture (aq): BSA 1000 ppm, yeast 1000 ppm, pH 4, 5 or 7 | Flux monitoring; Foulant cake weighing; Foulant rejection rate | Continuous DC up to 50 V/cm; pulsed DC (30 s/30 s) up to 50 V/cm; | Bench-scale up to 1 h; Flat plate crossflow; Parallel electrode plates (material unspecified) | Nylon, 0.2 or 0.45 μm | The continuous DC field retains up to about 40% more of the initial flux by the end of filtration; The pulsed DC field has the similar performance compared to the continuous field when on, but slightly lower flux compared to without the field when off | 2008 [28] |
| Clay suspension: 5 g/L, about 200 nm diameter | Flux monitoring | Continuous inhomogeneous 200 kHz alternating current peak-to-peak (AC p-p) up to 16 V/cm; Same field setup, with 10 min on and 10 min off; Same field setup, with 5 min on and 15 min off | Bench-scale up to 6 h; Flat plate crossflow; An electrode plate and a parallel grid electrode (stainless steel) | PVDF, 0.2 μm; Cellulose, 30 kDa | Compared to without an electric field, the continuous electric field took 2 times as long to reach 50% of the initial flux; The 10/10 pulsed AC field took 2.5 times as long to reach 50% of the initial flux; The 5/15 pulsed AC field took 3.3 times as long | 2009 [42] |
| Clay suspension: 5 g/L, 100–3000 nm diameter | Flux monitoring | Continuous inhomogeneous AC field gradient up to 4.18 × 10¹⁵ V2 m−3 | Bench-scale up to 6 h; Flat plate crossflow; Interdigitated electrodes (stainless steel) | PVDF, 0.2 μm | The continuous AC field retains up to 30% more of the initial flux compared to without the field; The pulsed AC field retains up to 50% more of the initial flux compared to without the field | 2013 [30] |
| Whey (from bovine milk) suspension (aq): 1000 mg/L, about 1–30 μm diameter | Flux monitoring | Continuous DC field up to 20 V/cm | Bench-scale up to 60 min; Hollow fiber module crossflow; An electrode wire at the centerline of the tubular module and an electrode cylinder wrapping around the tubular module (platinum) | Ceramic, 0.2 μm | The final flux under the influence of DC field is about twice as high as without the field; The final COD in the flux under the influence of DC is about 33% more compared to that without the field | 2013 [43] |
| Bovine serum albumin (BSA) (aq): 50 mg/L, pH 8.5; sodium alginate (aq): 50 mg/L, pH 8.5; humic acid (aq): 50 mg/L, pH 8.5; silicon dioxide particles (aq): 1000 mg/L, pH 8.5 | Flux monitoring; Electrochemical impedance spectroscopy; Confocal laser scanning microscopy | 2 V/cm continuous DC; | Pilot-scale up to 96 days; Bioreactor; Customized membrane with conductive mesh layer between support layer and active layer (stainless steel) | PVDF, 0.062 ± 0.024 μm | Transmembrane pressure builds up twice or thrice as fast as without the electric field; The relative flux under the electric field is enhanced to about 20% more of the initial flux. | 2015 [31] |
| Pseudomonas fluorescens dispersion: 107 CFU/mL | Flux monitoring; SEM | Continuous inhomogeneous DC field up to 45 V/cm; Continuous inhomogeneous 10 kHz AC field up to 45 V/cm | Bench-scale up to 1 h; Dead-end filtration; Interlaced electrodes (carbon nanotube) | PVDF, 0.3 μm | Transmembrane pressure builds up at half speed with the DC field; Transmembrane pressure builds up at one third speed with the AC field | 2017 [44] |
| Synthetic oily wastewater | Flux monitoring; Foulant rejection rate | Continuous inhomogeneous 320 kHz AC p-p up to 270 V (field strength unspecified) | Bench-scale up to 1 h; Flat plate crossflow; An electrode plate and a parallel grid electrode (stainless steel) | Cellulose acetate, 0.45 μm | The AC field retains up to about 10% more of the initial flux by the end of filtration compared to without the field | 2018 [45] |
| Real coal chemistry wastewater: COD 1486.4 ± 102.4 mg/L, BOD5 253.3 ± 18.2 mg/L, total phenols 233.8 ± 21.2 mg/L, TOC 335.6 ± 22.3 mg/L, NH4-N 127.2 ± 8.5 mg/L | Foulant rejection rate; Laser diffraction particle size analyzer; Zetasizer; UV-vis spectrometer; DNA sequencing; | Pulsed direct current field current density 1.33 mA/cm2 with 30 s cycles, 5–10 s on | Bench-scale; Bioreactor; Parallel plate electrodes sandwiching the hollow fiber module (anode: stainless steel; cathode: graphite) | Material unspecified, 0.4 μm | With the 24 s off/6 s on field, the COD and phenol rejection rates are 83.53% and 93.28%, respectively, compared to 71.24% and 82.43% without the electric field | 2019 [46] |
| Feed Water Composition | Characterization of Membrane Fouling | Electric Field | Experimental Setup | Membrane Type | Fouling Mitigation Effect | Publication Year |
|---|---|---|---|---|---|---|
| BSA (aq): 3 or 10 g/L, 67 kDa BSA molecular weight, NaCl 0.15 mol/L | Flux monitoring | Pulsed direct current (DC) field 2 or 7 V/cm at 30 Hz | Bench-scale up to 100 min; Flat sheet crossflow; An electrode plate and a parallel grid electrode (titanium) | Polyvinylidene difluoride (PVDF), 25 kDa (~1.78 nm) | The electric field allowed about 300% increase in permeate flux | 2000 [35] |
| Synthetic juice: pectin and sucrose 1 kg/m3 and 14 brix, or 3 kg/m3 and 12 brix, 5 kg/m3 and 10 brix; Natural mosambi fruit juice | Flux monitoring; Zetasizer; Spectrophotometer; | Continuous DC field strength up to 8 V/cm | Bench-scale up to 30–40 min; Flat plate crossflow; Parallel electrode plates (anode: platinum coated titanium; cathode: stainless steel) | Polysulfone (PS), 50 kDa (~2.4 nm) | The maximum electric field strength increased the final flux by ~200% compared to without the field | 2008 [47] |
| Humic acid: 48 DOC mg/L, diameter > 3 kDa; 24 DOC mg/L, diameter 0.5 to 3 kDa; 29 DOC mg/L, <0.5 kDa | Flux monitoring; Zetasizer; UV-vis spectrometer; Atomic force microscopy (AFM) | Continuous DC up to 125 V/cm | Bench-scale up to 5 h; Flat plate crossflow; Parallel electrode plates (platinum and titanium) | Polyacrylonitrile (PAN), 100 kDa (~30 nm) | Up to 50% flux recovery for larges HA group under 125 V/cm field compared to without the electric field | 2008 [48] |
| BSA (aq): 69 kDa, 0.5, 1 or 1.5 g/L, pH 8 | Flux monitoring; UV-vis spectrometer; Zetasizer | Continuous DC up to 30 V/cm | Bench-scale up to 3 h; Flat plate crossflow; Parallel electrode plates (titanium coated ruthenium) | PS, 50 or 100 kDa | Higher electric field strength led to less concentration polarization layer resistance, higher flux and higher protein rejection rate | 2010 [49] |
| BSA (aq): (1) 0.1 kg/m3, (2) 1.0 kg/m3, or (3) 1.5 kg/m3, 66.5 kDa, NaCl ionic strength 1.0 mM, pH 7.4 | Flux monitoring; Zetasizer; UV-vis spectrometer; | Continuous direct current up to 20 V/cm | Bench-scale up to 40 min; Flat plate crossflow; An electrode plate and a parallel grid electrode (anode: platinum coated titanium; cathode: stainless steel) | Polyphenylene ethersulfone (PES) membrane, 30 kDa | In general, an increased transmembrane pressure and/or increased electric field strength enhances membrane filtration flux as well as an increased cake layer concentration; The theoretical model for flux provided good prediction for ±7% error | 2011 [50] |
| Synthetic wastewater: glucose 310 mg/L, peptone 252 mg/L, yeast extract 300 mg/L, (NH4)2SO4 200 mg/L, KH2PO4 37 mg/L, MgSO4∙7H2O mg/L, MnSO4∙H2O 4.5 mg/L, FeCl3∙6H2O 0.4 mg/L, CaCl2∙2H2O 4 mg/L, KCl 25 mg/L, NaHCO3 25 mg/L | Flux monitoring; Water quality monitoring; | Pulsed DC intensity 1 V/cm, 15 min on/45 min off | Pilot-scale up to 53 days; Hollow fiber module bioreactor; Electrodes are concentric hollow cylinders surrounding the membrane module (stainless steel) | Commercial membrane module, specifications unspecified | Under the electric field, membrane permeability was improved by 16.3% compared to that without an electric field | 2011 [34] |
| Synthetic wastewater: Sodium dodecyl sulfate 8.1 mM (critical micelle concentration), naphthenic acid 500 mg/L, pH 3, 5, 7 or 9, NaCl 0, 0.01, 0.05 or 0.1 M | Flux monitoring; UV-vis spectrometer; | Continuous DC up to 10 V/cm | Bench-scale up to 1 h; Flat plate crossflow; An electrode plate and a parallel grid electrode (anode: platinum coated titanium; cathode: stainless steel) | PES, 10 kDa | In a 2 V/cm increment to 10 V/cm, up to 14% more initial flux was recovered; In a constant setup of 10 V/cm, 24% more of the initial flux was recovered | 2012 [51] |
| Cathode electrodeposition paint (aq): 91–342 nm diameter, 5% v/v, conductivity 102.0 µS/cm, TDS 79.9 mg/L, turbidity 4644.3 NTU | Flux monitoring; Zetasizer; | Continuous DC up to 2.45 V/cm | Bench-scale up to 2 h; Crossflow with hollow fiber module; Ring electrodes at the inlet and outlet of the module, respectively, (stainless steel) | Ceramic, 50 nm | The filtration flux in electric field-assisted filtration is lower than that without the field | 2012 [52] |
| BSA (aq): 0.5 g/L | Flux monitoring; Field emission scanning electron microscope (FESEM); Fourier transform infrared (FTIR); Contact angle analyzer; X-ray photoelectron spectroscopy (XPS); AFM | Hydraulic cleaning with 1 V/cm DC field for 2 h after filtration | Bench-scale up to 2 h; Dead-end; Electric field cleaning after filtration (reduced graphene oxide) | Synthesized poly(aminoanthraquinone)/reduced graphene oxide nanohybrid blended PVDF, ~10 nm | Fouling rate decreased by about 63.5% under the external field | 2015 [32] |
| Vine shoot dispersion (aq): 9.09 pph (wt) | Flux monitoring; UV-vis spectrometer; High-performance liquid chromatography (HPLC); | Pretreatment with high voltage electric discharge of 40 kV at a duration of 10 µs at 0.5 Hz; Pretreatment with pulsed electric field up to 13.3 kV/cm at a duration of 10 µs at 0.5 Hz | Bench-scale; Dead-end; Electrodes composed of a needle and a plate (stainless steel) | PES, 50 kDa | Higher power input provided better break down of vine shoot and, therefore, better recovery of product polyphenol, but the increased cell break down led to more fouling | 2015 [33] |
| Synthetic wastewater: Prefiltered (0.45 μm) humic acid 10–270 kDa, kaolinite 50 mg/L, 400–1200 nm diameter, DOC 5 mg/L | Flux monitoring; UV-vis spectrometry; SEM; Fourier transform infrared spectrometry; Particle size analyzer | Continuous DC intensity up to 20 A/m2, field intensity up to 2 V/cm | Bench-scale up to 15 min; Hollow fiber module crossflow; Parallel electrode plates (aluminum) | PVDF, 100 kDa (~30 nm) | Up to 50% more concentration reduction for humic acid in effluent under the electric field | 2017 [53] |
| E. coli dispersion | Flux monitoring; UV-vis spectrometer; SEM | Continuous DC ~1.5 V/cm | Bench-scale up to 3 h; Flat plate crossflow; Parallel electrode plates (carbon nanotube) | Synthesized sodium lignosulfonate functionalized carbon nanotubes (CNT)/PES, ~40–60 nm | Under a weak electric field, antibacterial properties were found for the synthesized membrane; no antibacterial properties was observed without the electric field | 2018 [54] |
| Prefiltered (5–10 kDa, 10–30 kDa, >30 kDa) humic acid (815 ± 12 mg/L); Synthetic water sample (aq): NOM from lake sediment, separated in to (1) humic acid, (2) fulvic acid, and (3) hydrophilic substances, each adjusted to 5 mg DOC/L | Flux monitoring; UV spectrometer; Total organic carbon analyzer; AFM; Contact angle analyzer; Gel permeation chromatography; SEM; FTIR | Continuous DC up to 4 V/cm | Bench-scale up to 30 min; Dead-end; Parallel electrode plates (stainless steel) | PVDF, 10 kDa (~1.42 nm) | The electric field retains up to 10% more of the initial flux compared to without the electric field | 2019 [36] |
| Humic acid (aq): 200 ppm (wt); Humic acid w/Na2SO4: humic acid, 200 ppm (wt), Na2SO4 0.05 M | Flux monitoring; Foulant rejection rate; Transmission electron microscopy; Linear sweep voltammetry | Continuous DC up to −0.5 V/cm | Bench-scale up to 140 min; Flat plate crossflow; Three-electrode system, the membrane as the working electrode and a parallel counter electrode (carbon nanotube) | Synthesized CNT/Al nanoparticles, 472 kDa dextran rejection (~26.9 nm) | Up to about 10% more of the initial flux retained by the electric field for humic acid solution; Up to about 5% more of the initial flux retained by the electric field for humic acid/Na2SO4 solution | 2019 [55] |
| Feed Water Composition | Characterization of Membrane Fouling | Electric Field | Experimental Setup | Membrane Type | Fouling Mitigation Effect | Publication Year |
|---|---|---|---|---|---|---|
| Ibuprofen solution: 1, 10 or 20 mg/L, pH 2–7.3 | UV-vis spectrometer; SEM; | Continuous direct current of 1, 2 or 3 V (field strength unspecified) | Bench-scale up to 135 min; Dead-end; Membrane as the anode and a titanium ring separated by a rubber ring as cathode | Synthesized pristine multiwalled carbon nanotubes (MWCNT) or carboxylated multiwalled carbon nanotubes (MWCNT-COOH) | Near 100% removal of ibuprofen at pH at 3 V for MWCNT-COOH, compared to 0% removal at 0 V for both membranes at pH 2 or 6 | 2016 [56] |
| Feed Water Composition | Characterization of Membrane Fouling | Electric Field | Experimental Setup | Membrane Type | Fouling Mitigation Effect | Publication Year |
|---|---|---|---|---|---|---|
| CaCO3 (aq): 5.5 mmol, pH 2–11 | Flux monitoring; Salt rejection rate measuring; SEM | Continuous alternating current 25 A, 50 Hz | Pilot-scale up to 38 h; Commercial RO module; Electric circuit coils around the RO module (copper) | Commercial RO module, unspecified material | The electromagnetic field retained about 20% more of the initial flow compared to without the field after operation, and rejected 20% more salt | 2016 [57] |
| Groundwater: TDS 5670 ± 346 mg/L, pH 7.3 ± 0.1, conductivity 6300 ± 353 µS/cm, alkalinity 222 ± 20 mg/L (CaCO3 eq), Chloride 538.5 ± 24.1 mg/L, sulfate 2952.5 ± 234.6 mg/L, hardness 2488 ± 42 mg/L, Magnesium 486 ± 15 mg/L, potassium ±0.2 mg/L, silicon dioxide 22.5 ± 1.6 mg/L, sodium 691 ± 74 mg/L, strontium 8.2 ± 0.2 mg/L | Flux monitoring; Ion chromatography; SEM; EDS; X-ray diffraction | Continuous random electric field by HydroFLOW, 150 kHz | Pilot-scale up to 753 h; Commercial RO module; HydroFLOW (ferrites surrounded the tubing, magnetic fields along the ferrites induced by the electric field) | Commercial RO module, polyamide | The EMF significantly reduced membrane scaling and improved RO performance by 38.3% and 14.3% in terms of normalized water permeability decline rate after 150 h and 370 h operation, respectively. | 2019 [58] |
Publisher’s Note: MDPI stays neutral with regard to jurisdictional claims in published maps and institutional affiliations. |
© 2021 by the authors. Licensee MDPI, Basel, Switzerland. This article is an open access article distributed under the terms and conditions of the Creative Commons Attribution (CC BY) license (https://creativecommons.org/licenses/by/4.0/).
Share and Cite
Shen, Y.; Badireddy, A.R. A Critical Review on Electric Field-Assisted Membrane Processes: Implications for Fouling Control, Water Recovery, and Future Prospects. Membranes 2021, 11, 820. https://0-doi-org.brum.beds.ac.uk/10.3390/membranes11110820
Shen Y, Badireddy AR. A Critical Review on Electric Field-Assisted Membrane Processes: Implications for Fouling Control, Water Recovery, and Future Prospects. Membranes. 2021; 11(11):820. https://0-doi-org.brum.beds.ac.uk/10.3390/membranes11110820
Chicago/Turabian StyleShen, Yuxiang, and Appala Raju Badireddy. 2021. "A Critical Review on Electric Field-Assisted Membrane Processes: Implications for Fouling Control, Water Recovery, and Future Prospects" Membranes 11, no. 11: 820. https://0-doi-org.brum.beds.ac.uk/10.3390/membranes11110820