
Cobalt-Doped Carbon Nitride Frameworks Obtained from Calcined Aromatic Polyimines as Cathode Catalyst of Anion Exchange Membrane Fuel Cells


Abstract
:1. Introduction
2. Materials and Methods
2.1. Materials
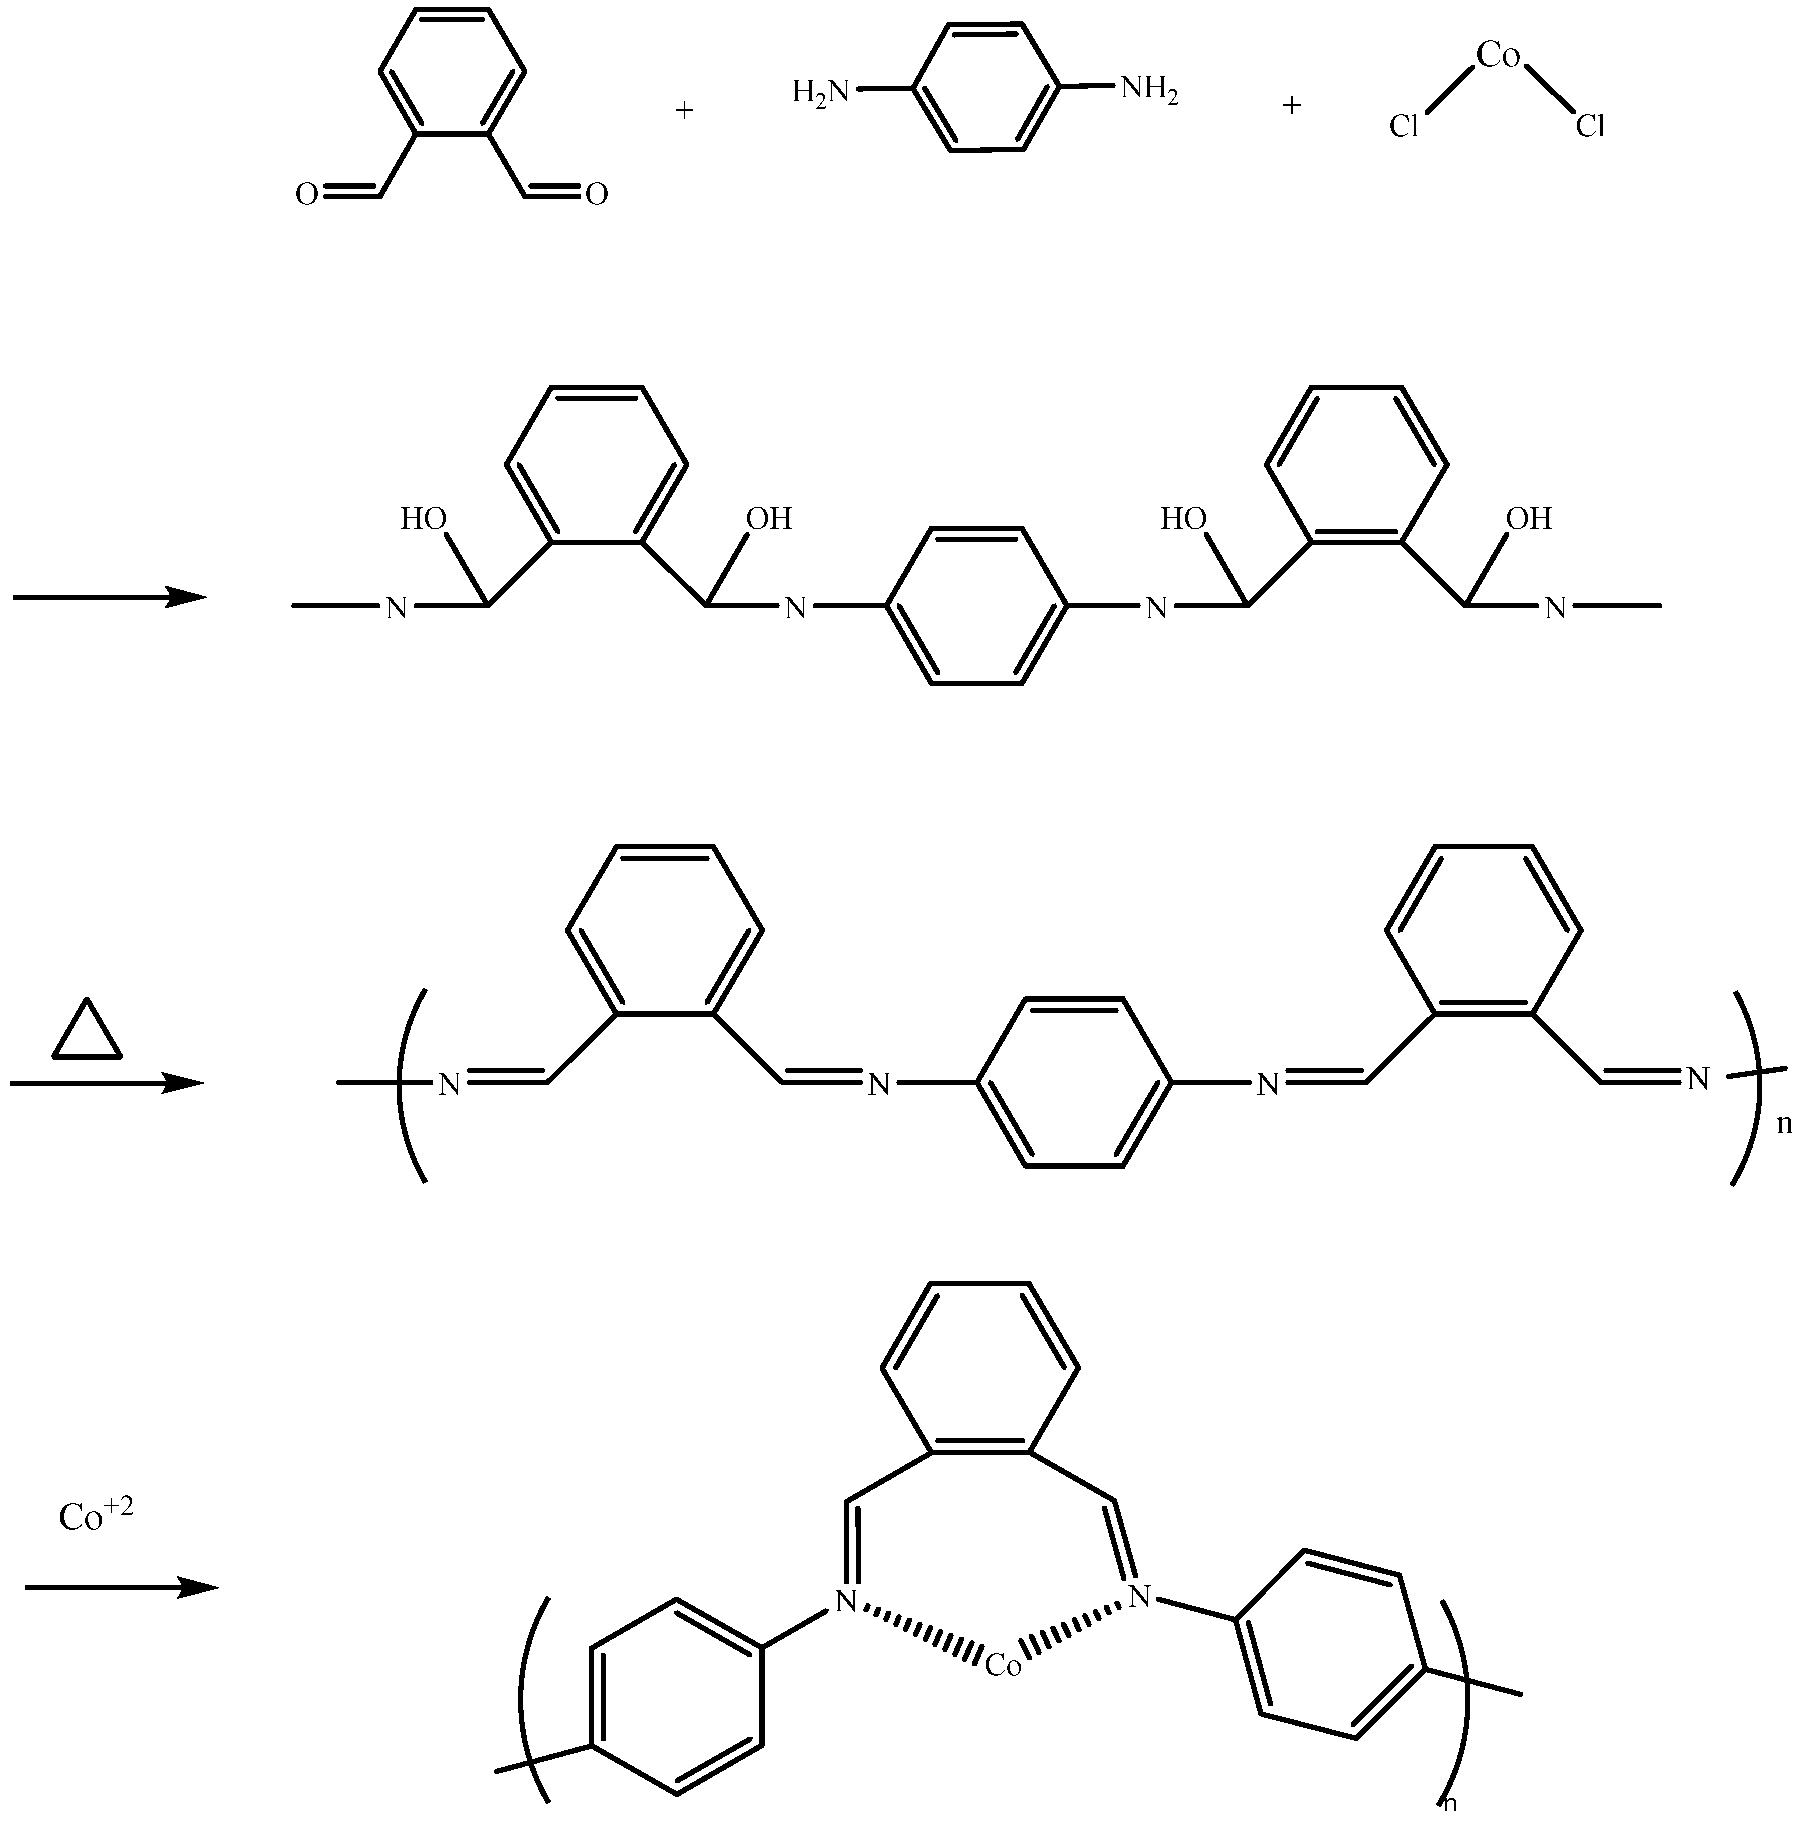
2.2. Preparation of CoNC Catalyst
2.3. FTIR Spectroscopy
2.4. Ultrviolet−Visible Spectroscopy (UV–Vis)
2.5. X-ray Photoelectron Spectroscopy (XPS)
2.6. Raman Spectroscopy
2.7. Wide Angle X-ray Diffraction: Powder X-ray Diffraction (WXRD)
2.8. Scanning Electron Microscopy (SEM)
2.9. Transmission Electron Microscopy (TEM)
2.10. Energy Dispersive X-ray Spectra (EDs)
2.11. Surface Area and Pore Size Measurement (BET Method)
2.12. Electrochemical Characterization
2.12.1. Current–Potential Polarization (CV)-Linear Scan Voltammetry (LSV)
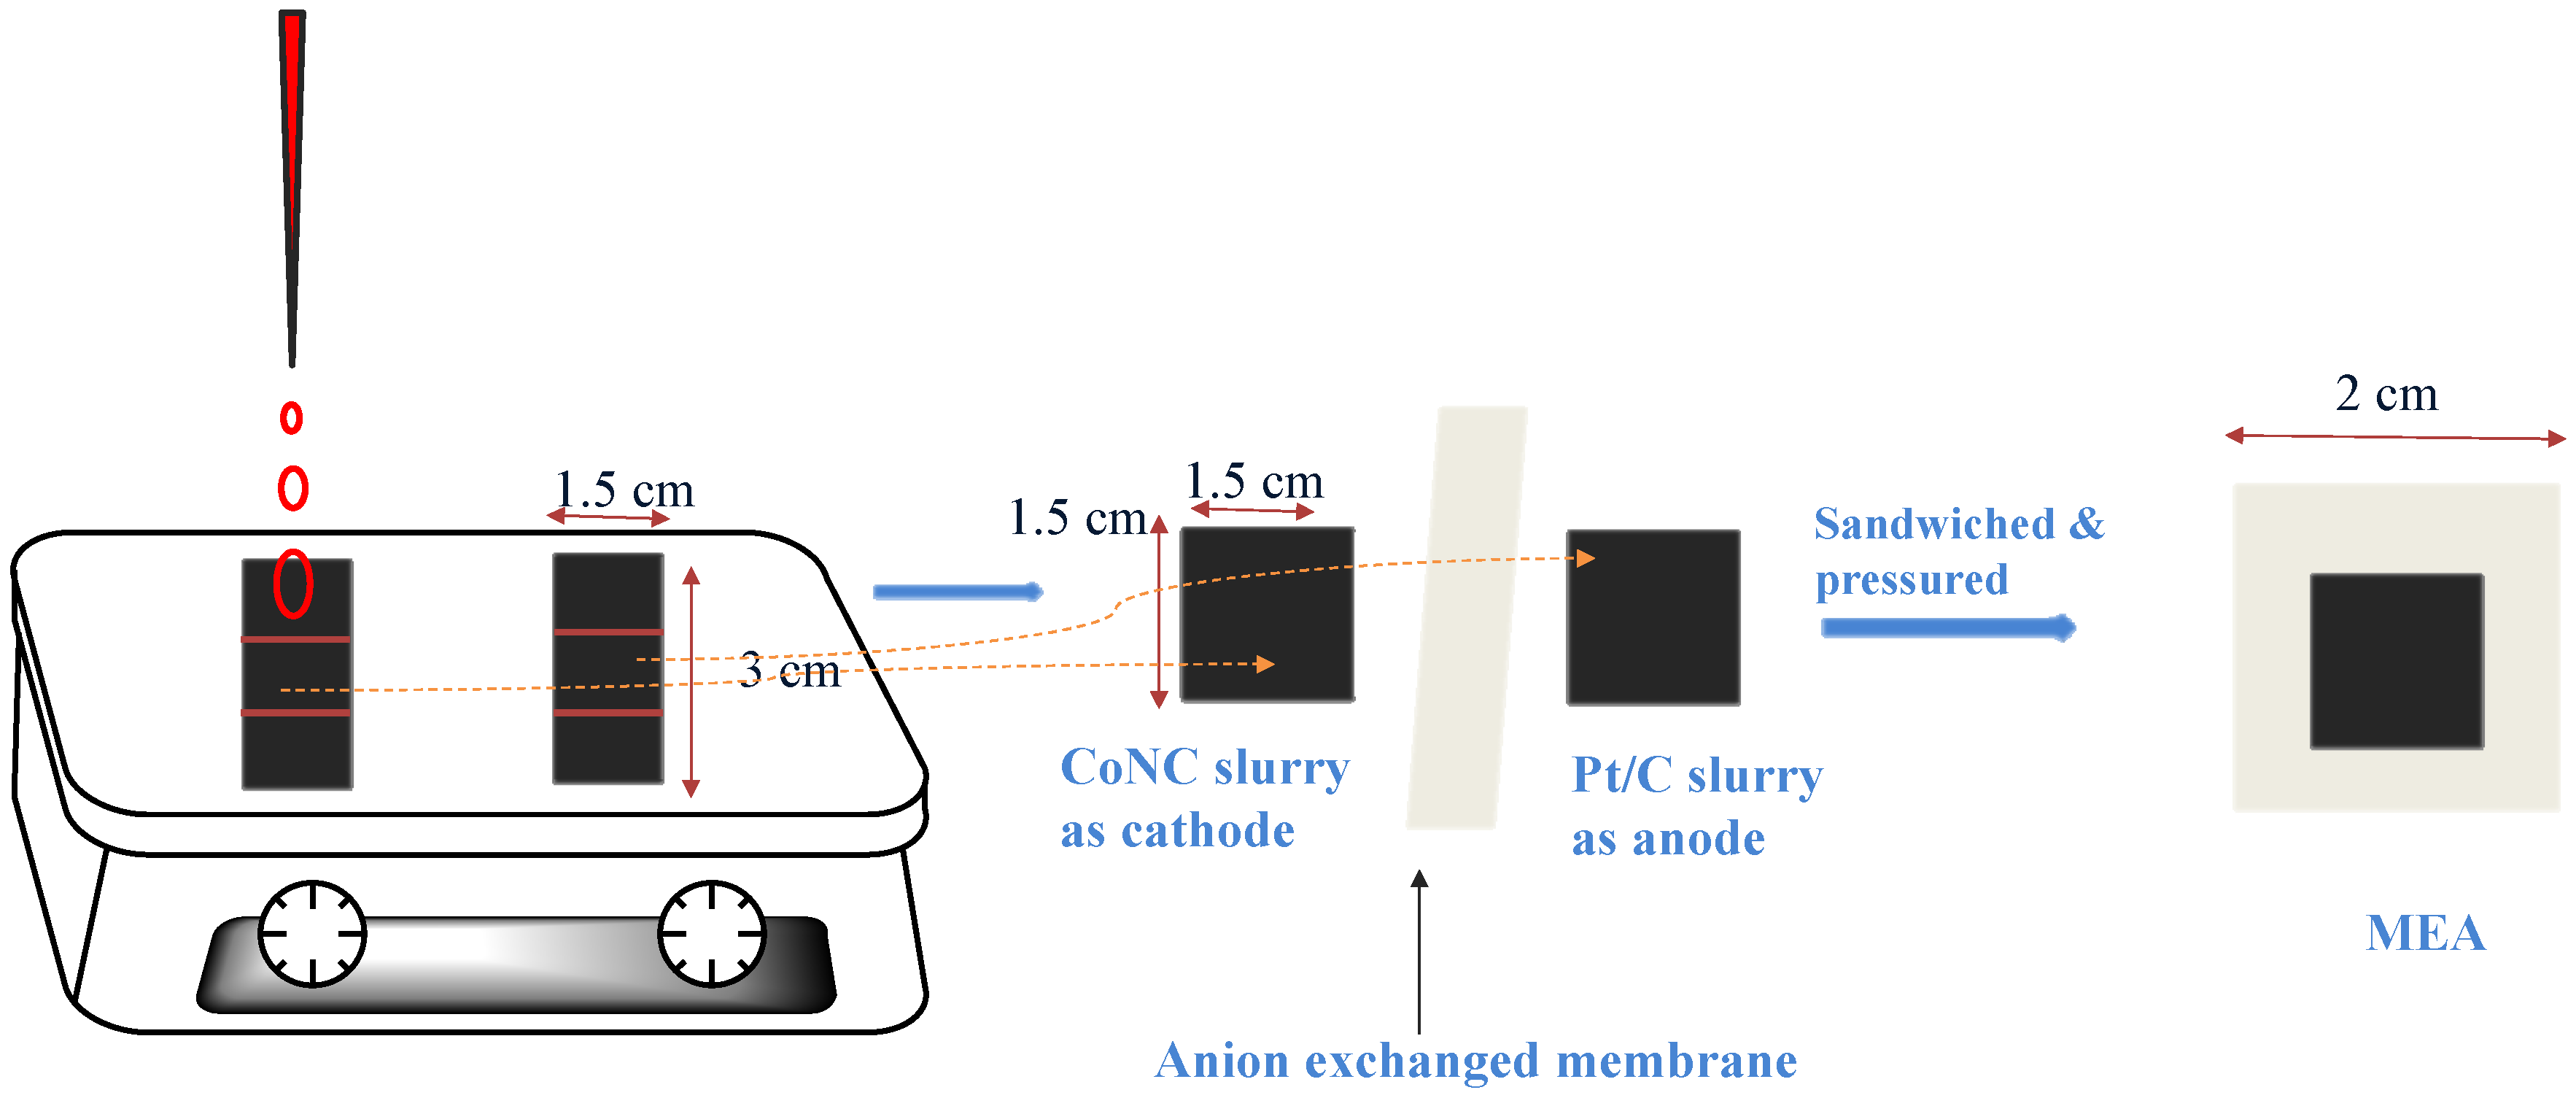
2.12.2. MEA Preparation
2.12.3. Single-Cell Performance Testing
3. Results and Discussion
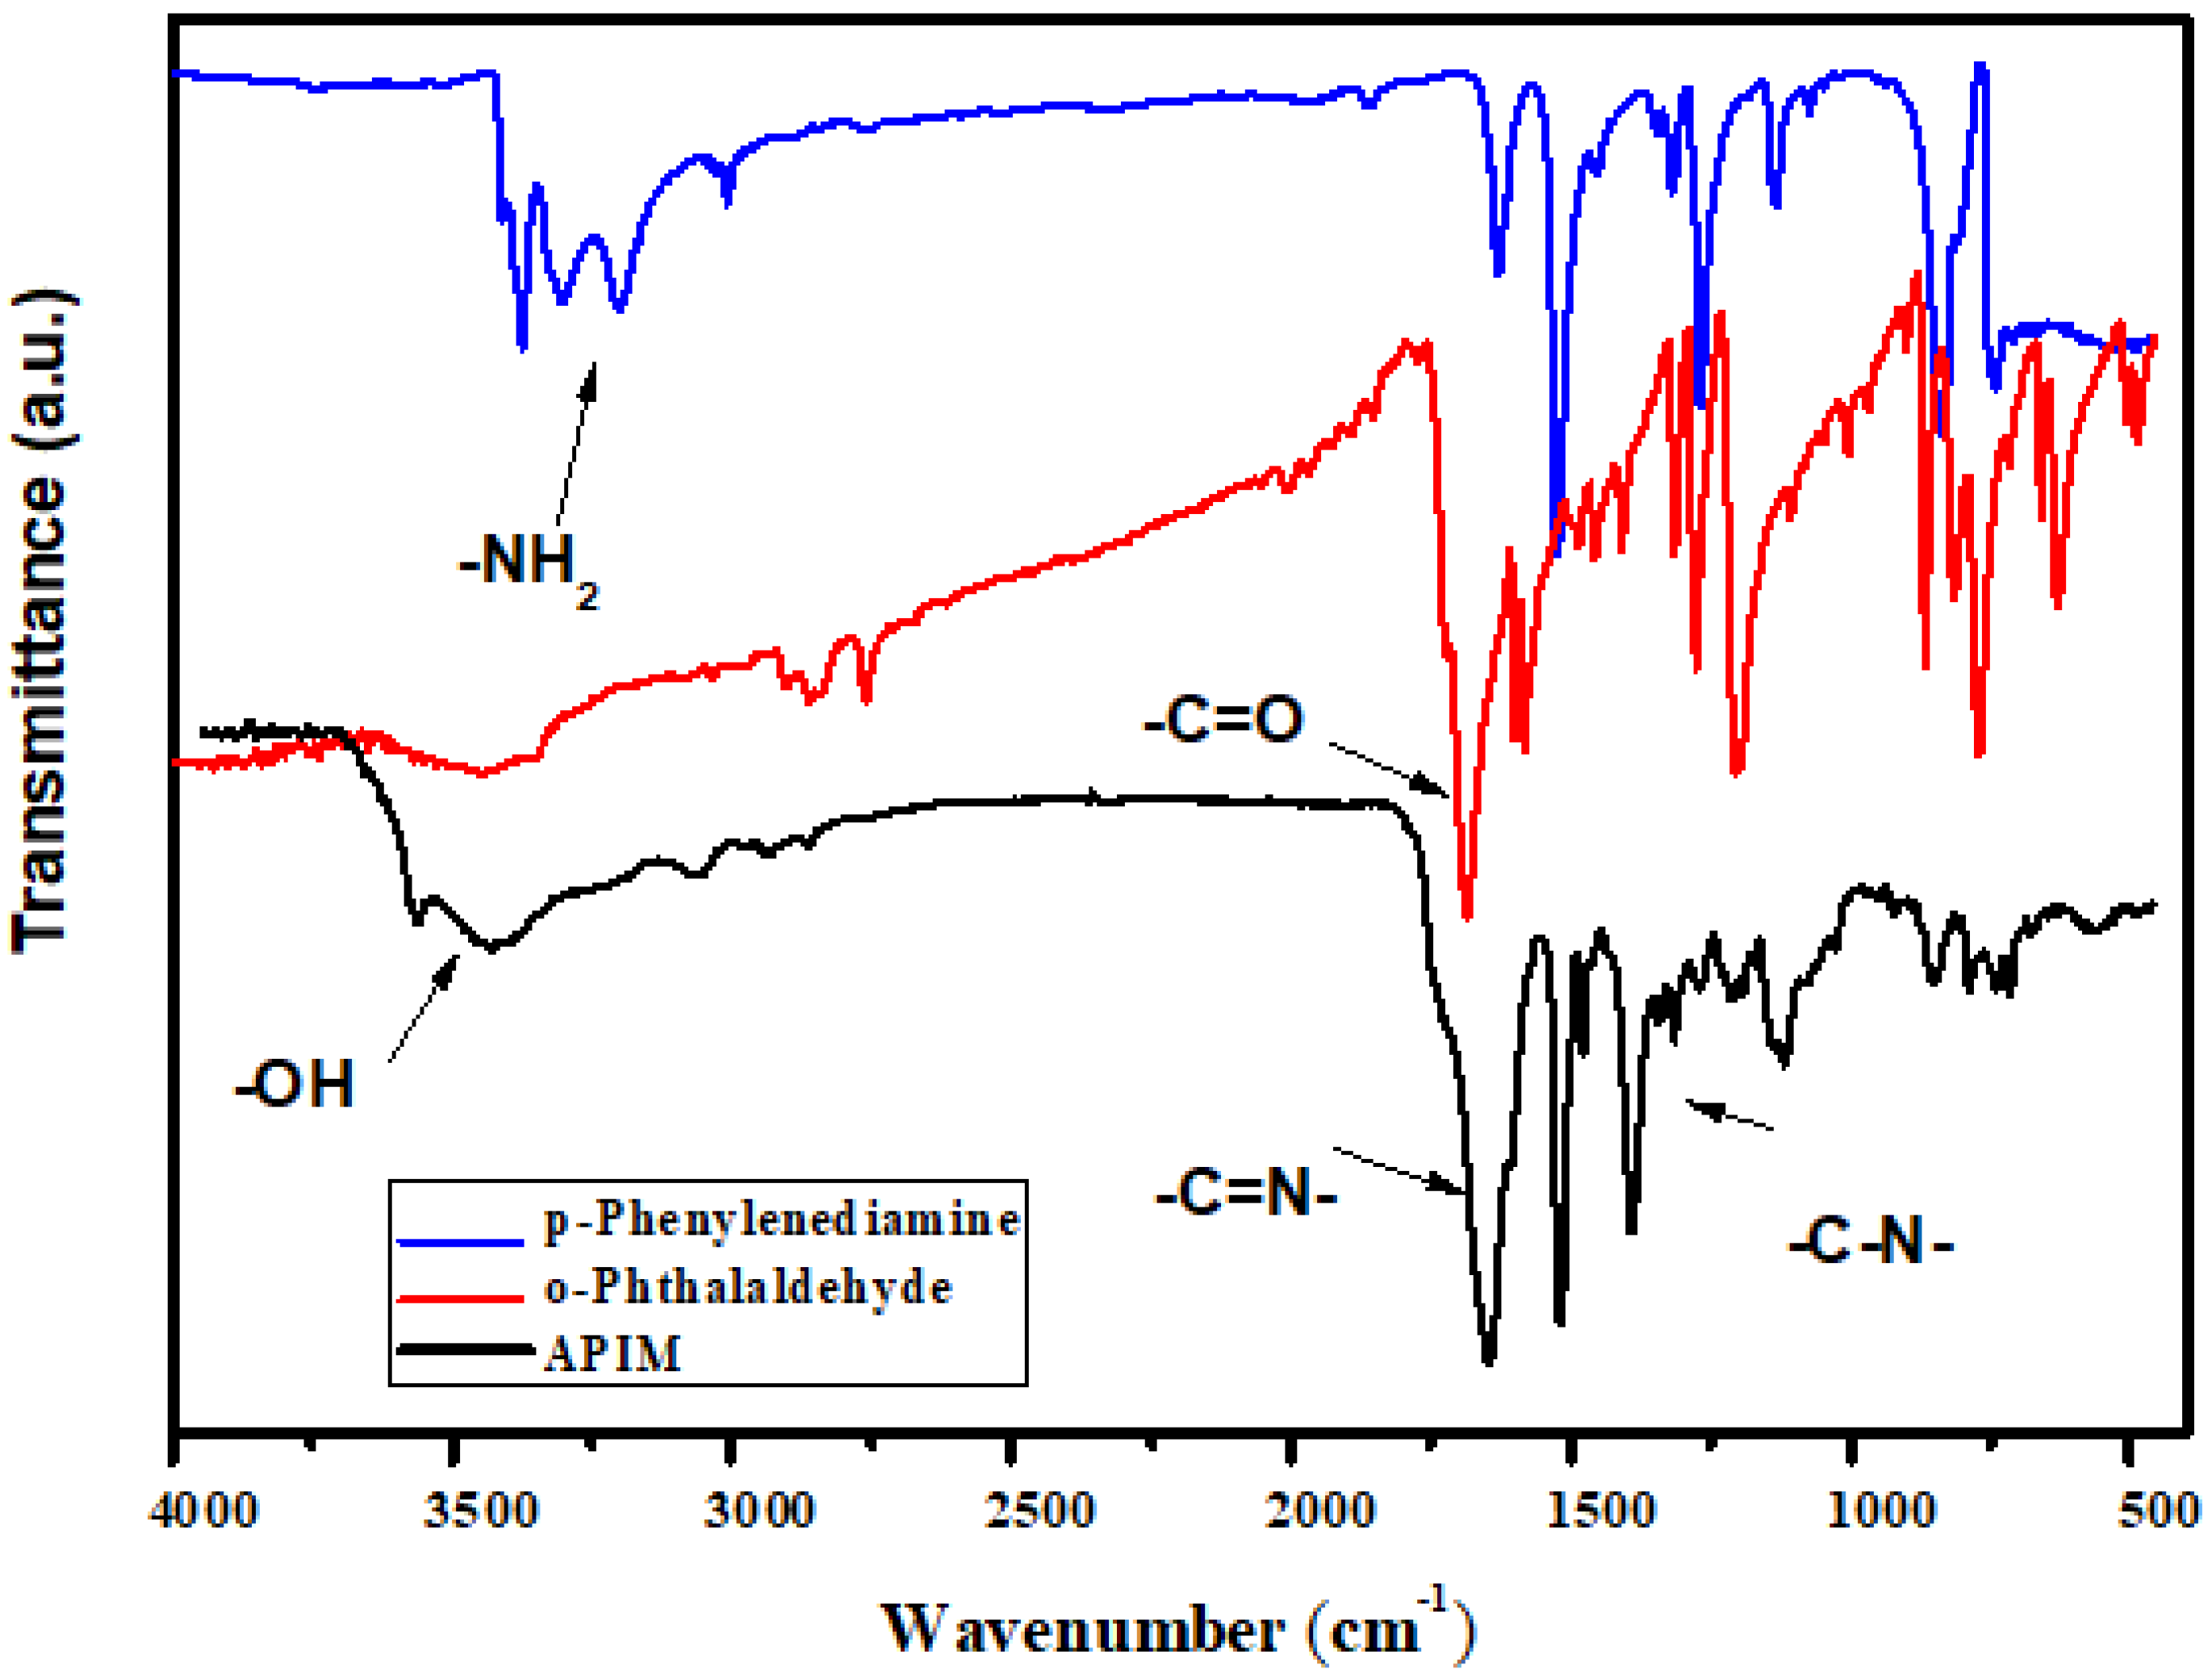
3.1. FTIR Spectra
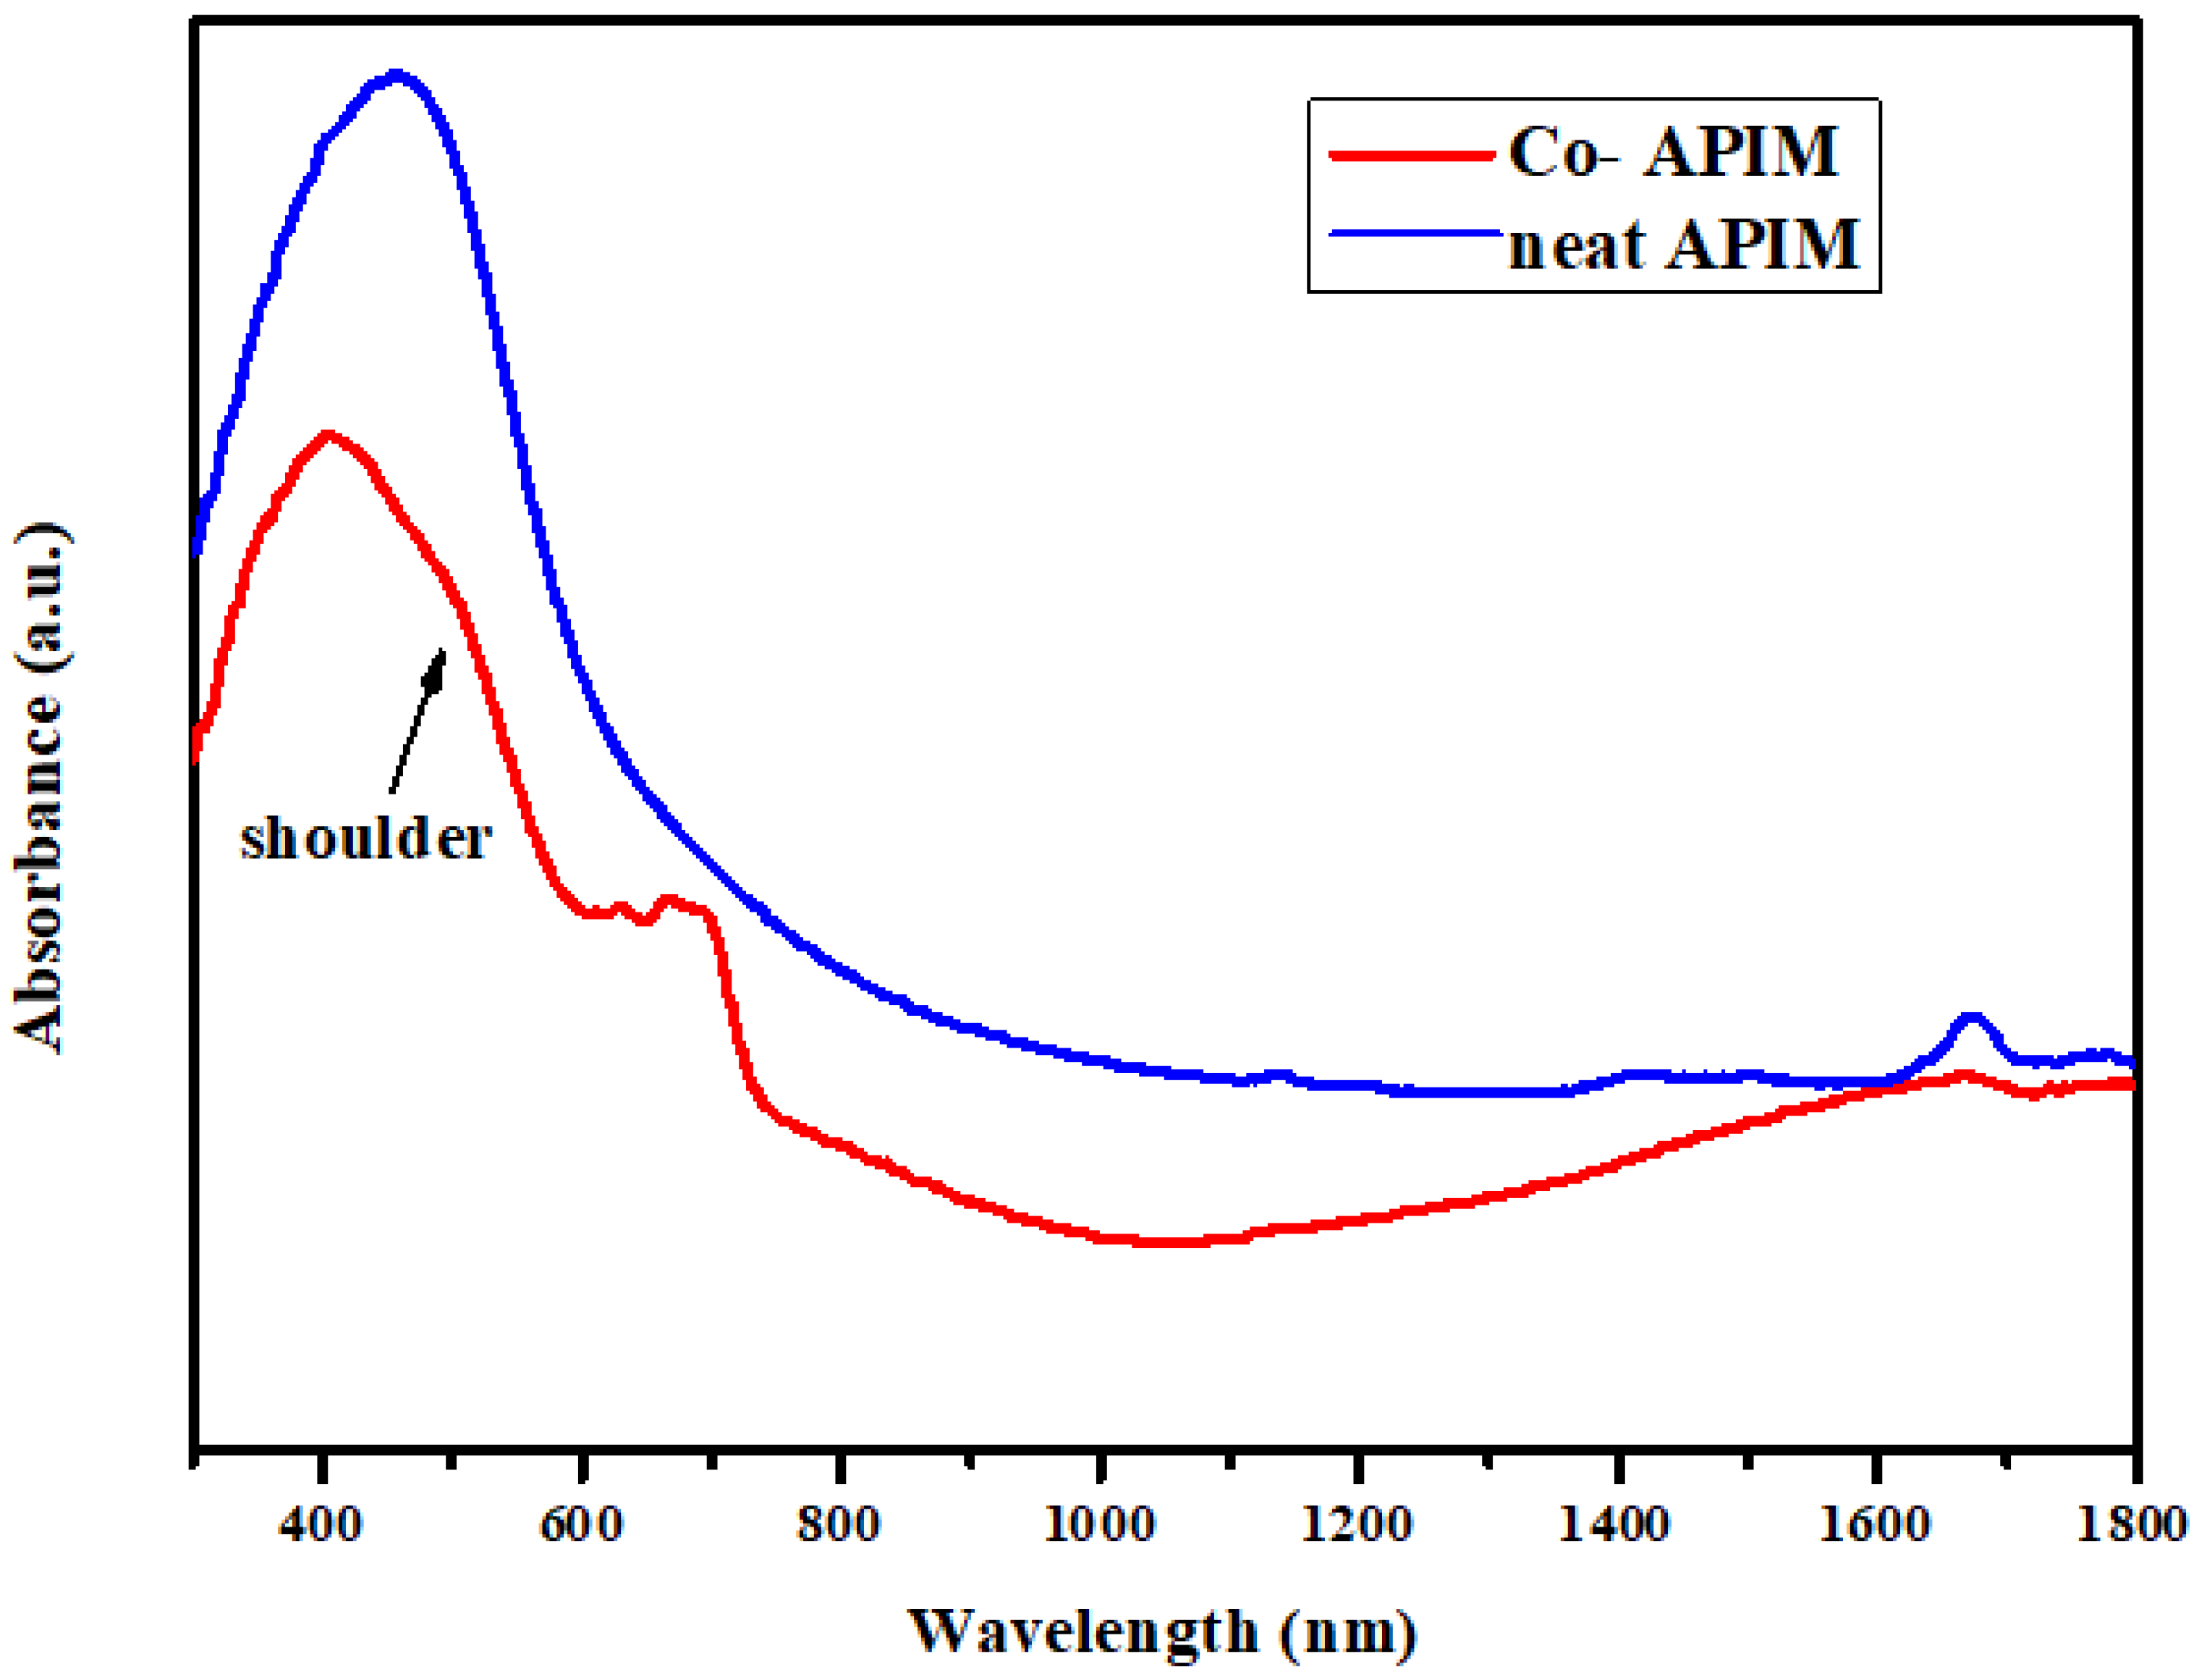
3.2. UV–Vis Spectra
3.3. XPS
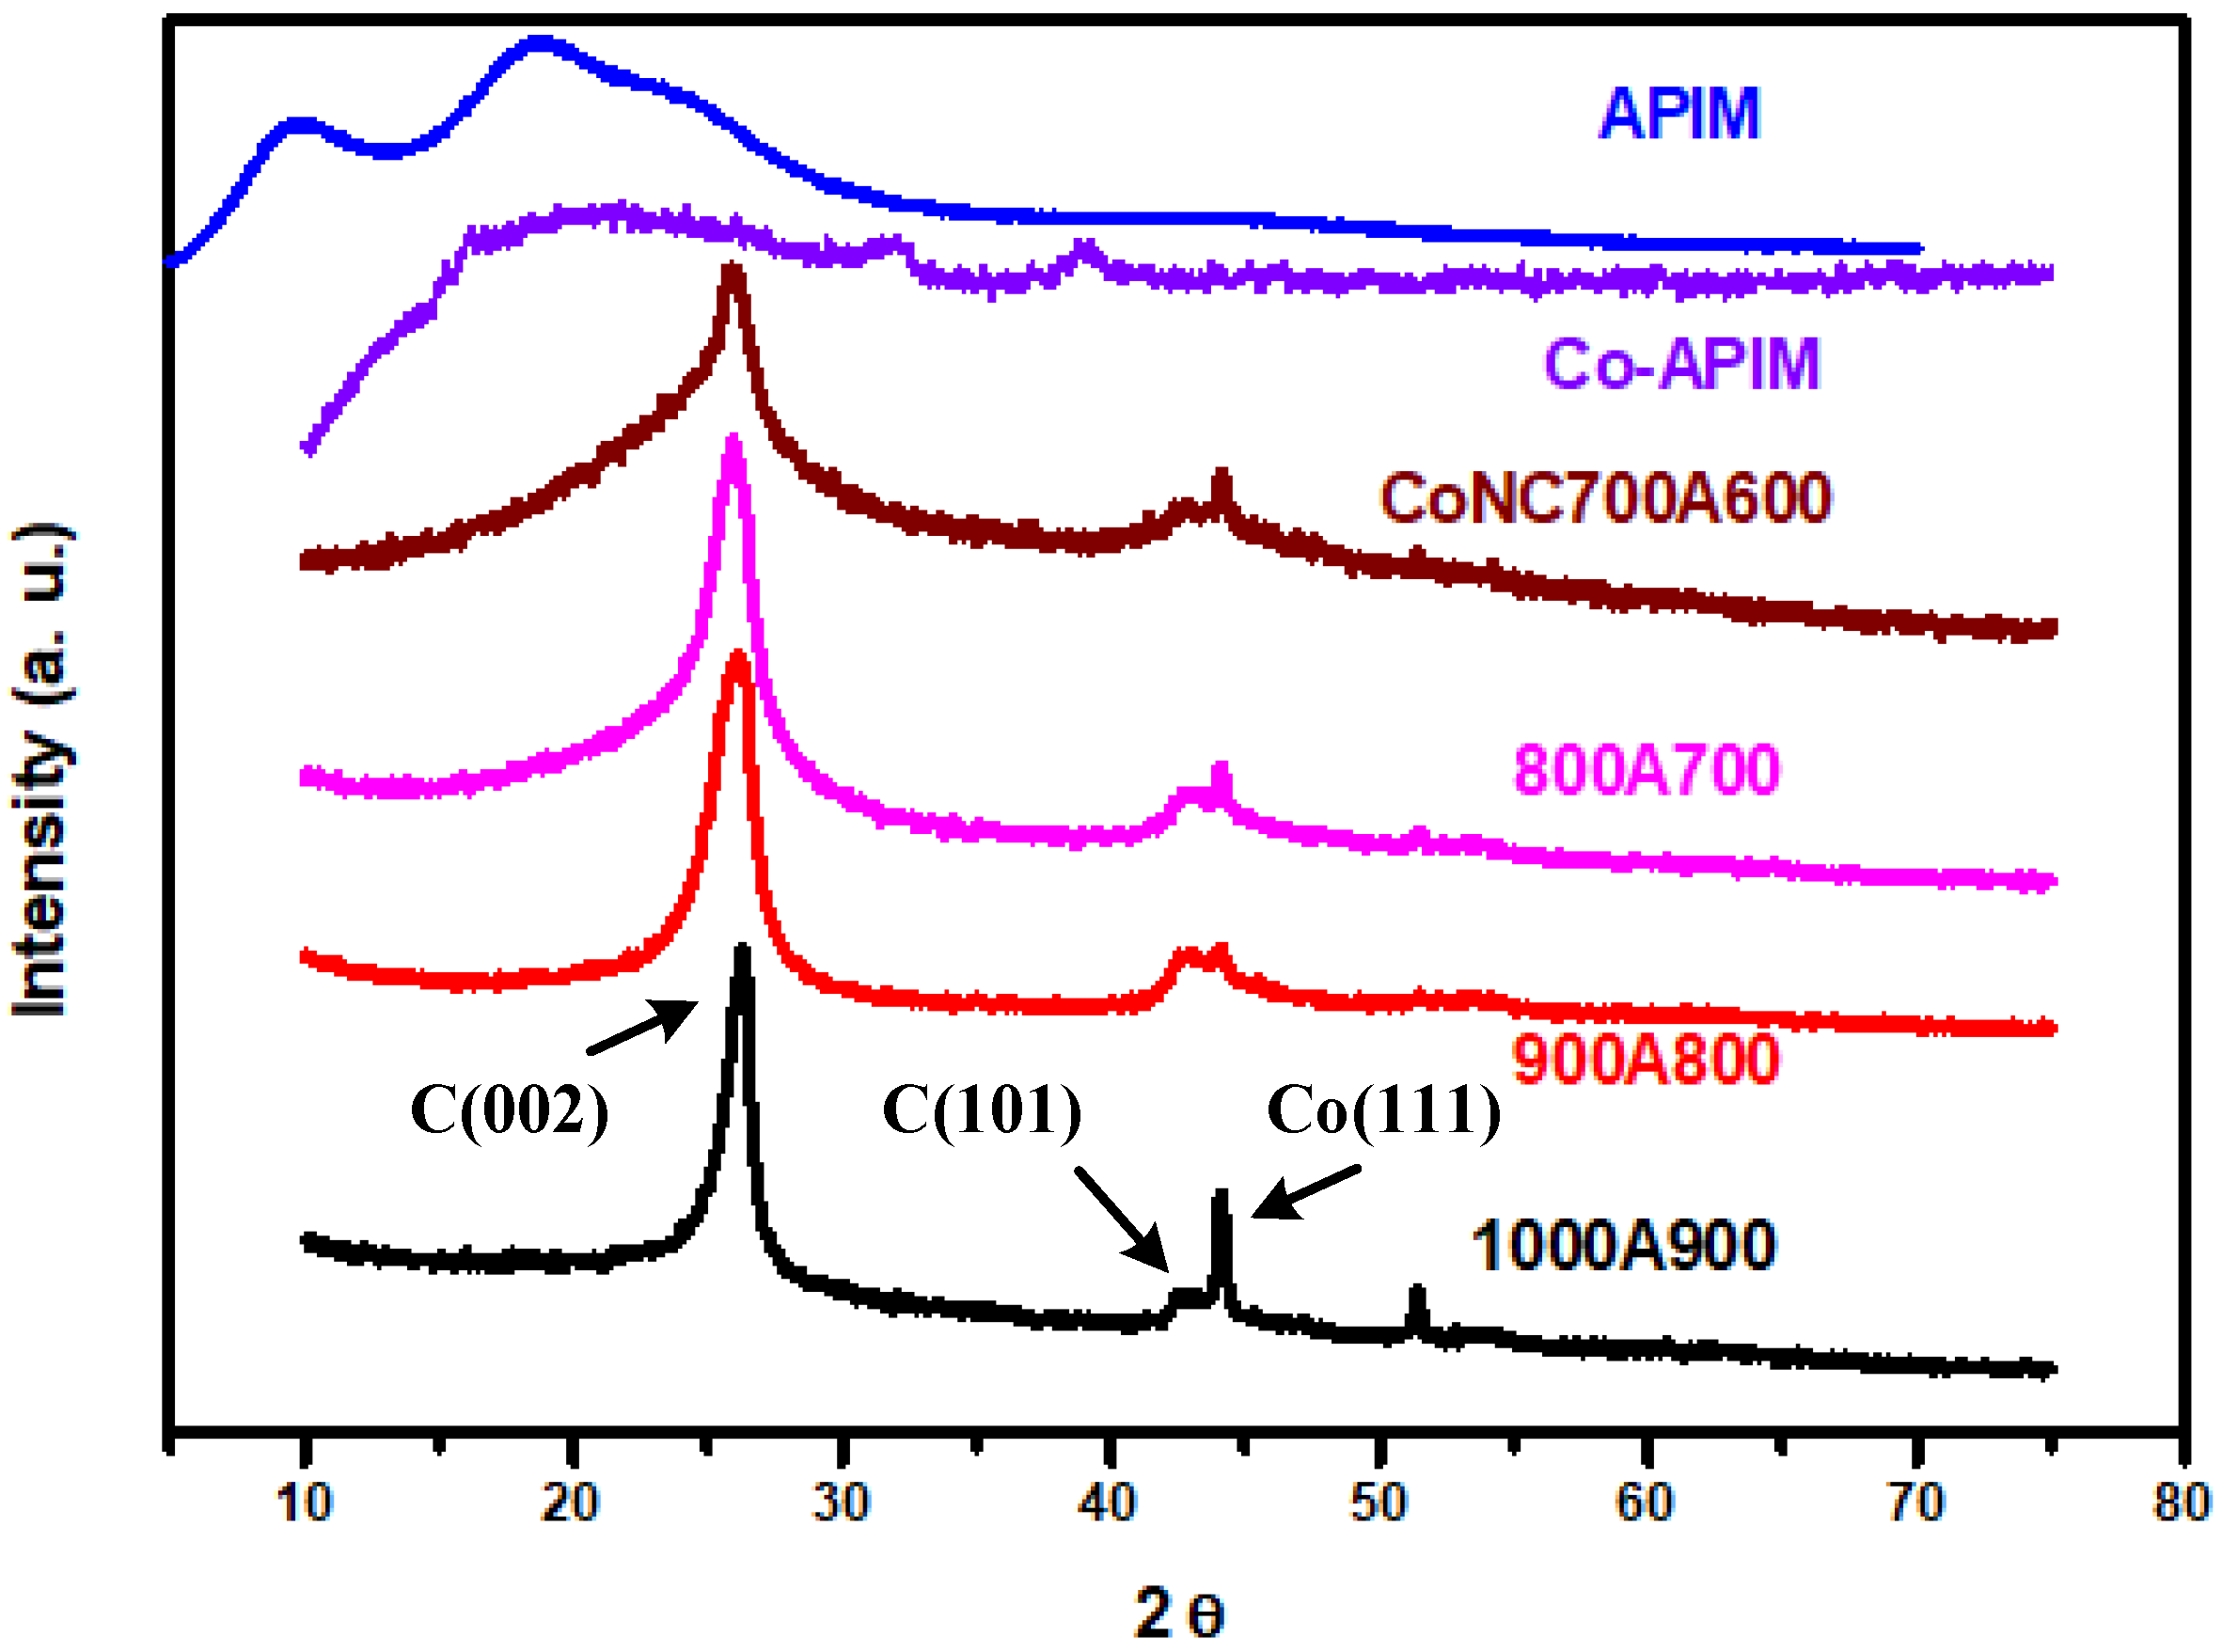
3.4. WXAD Pattern
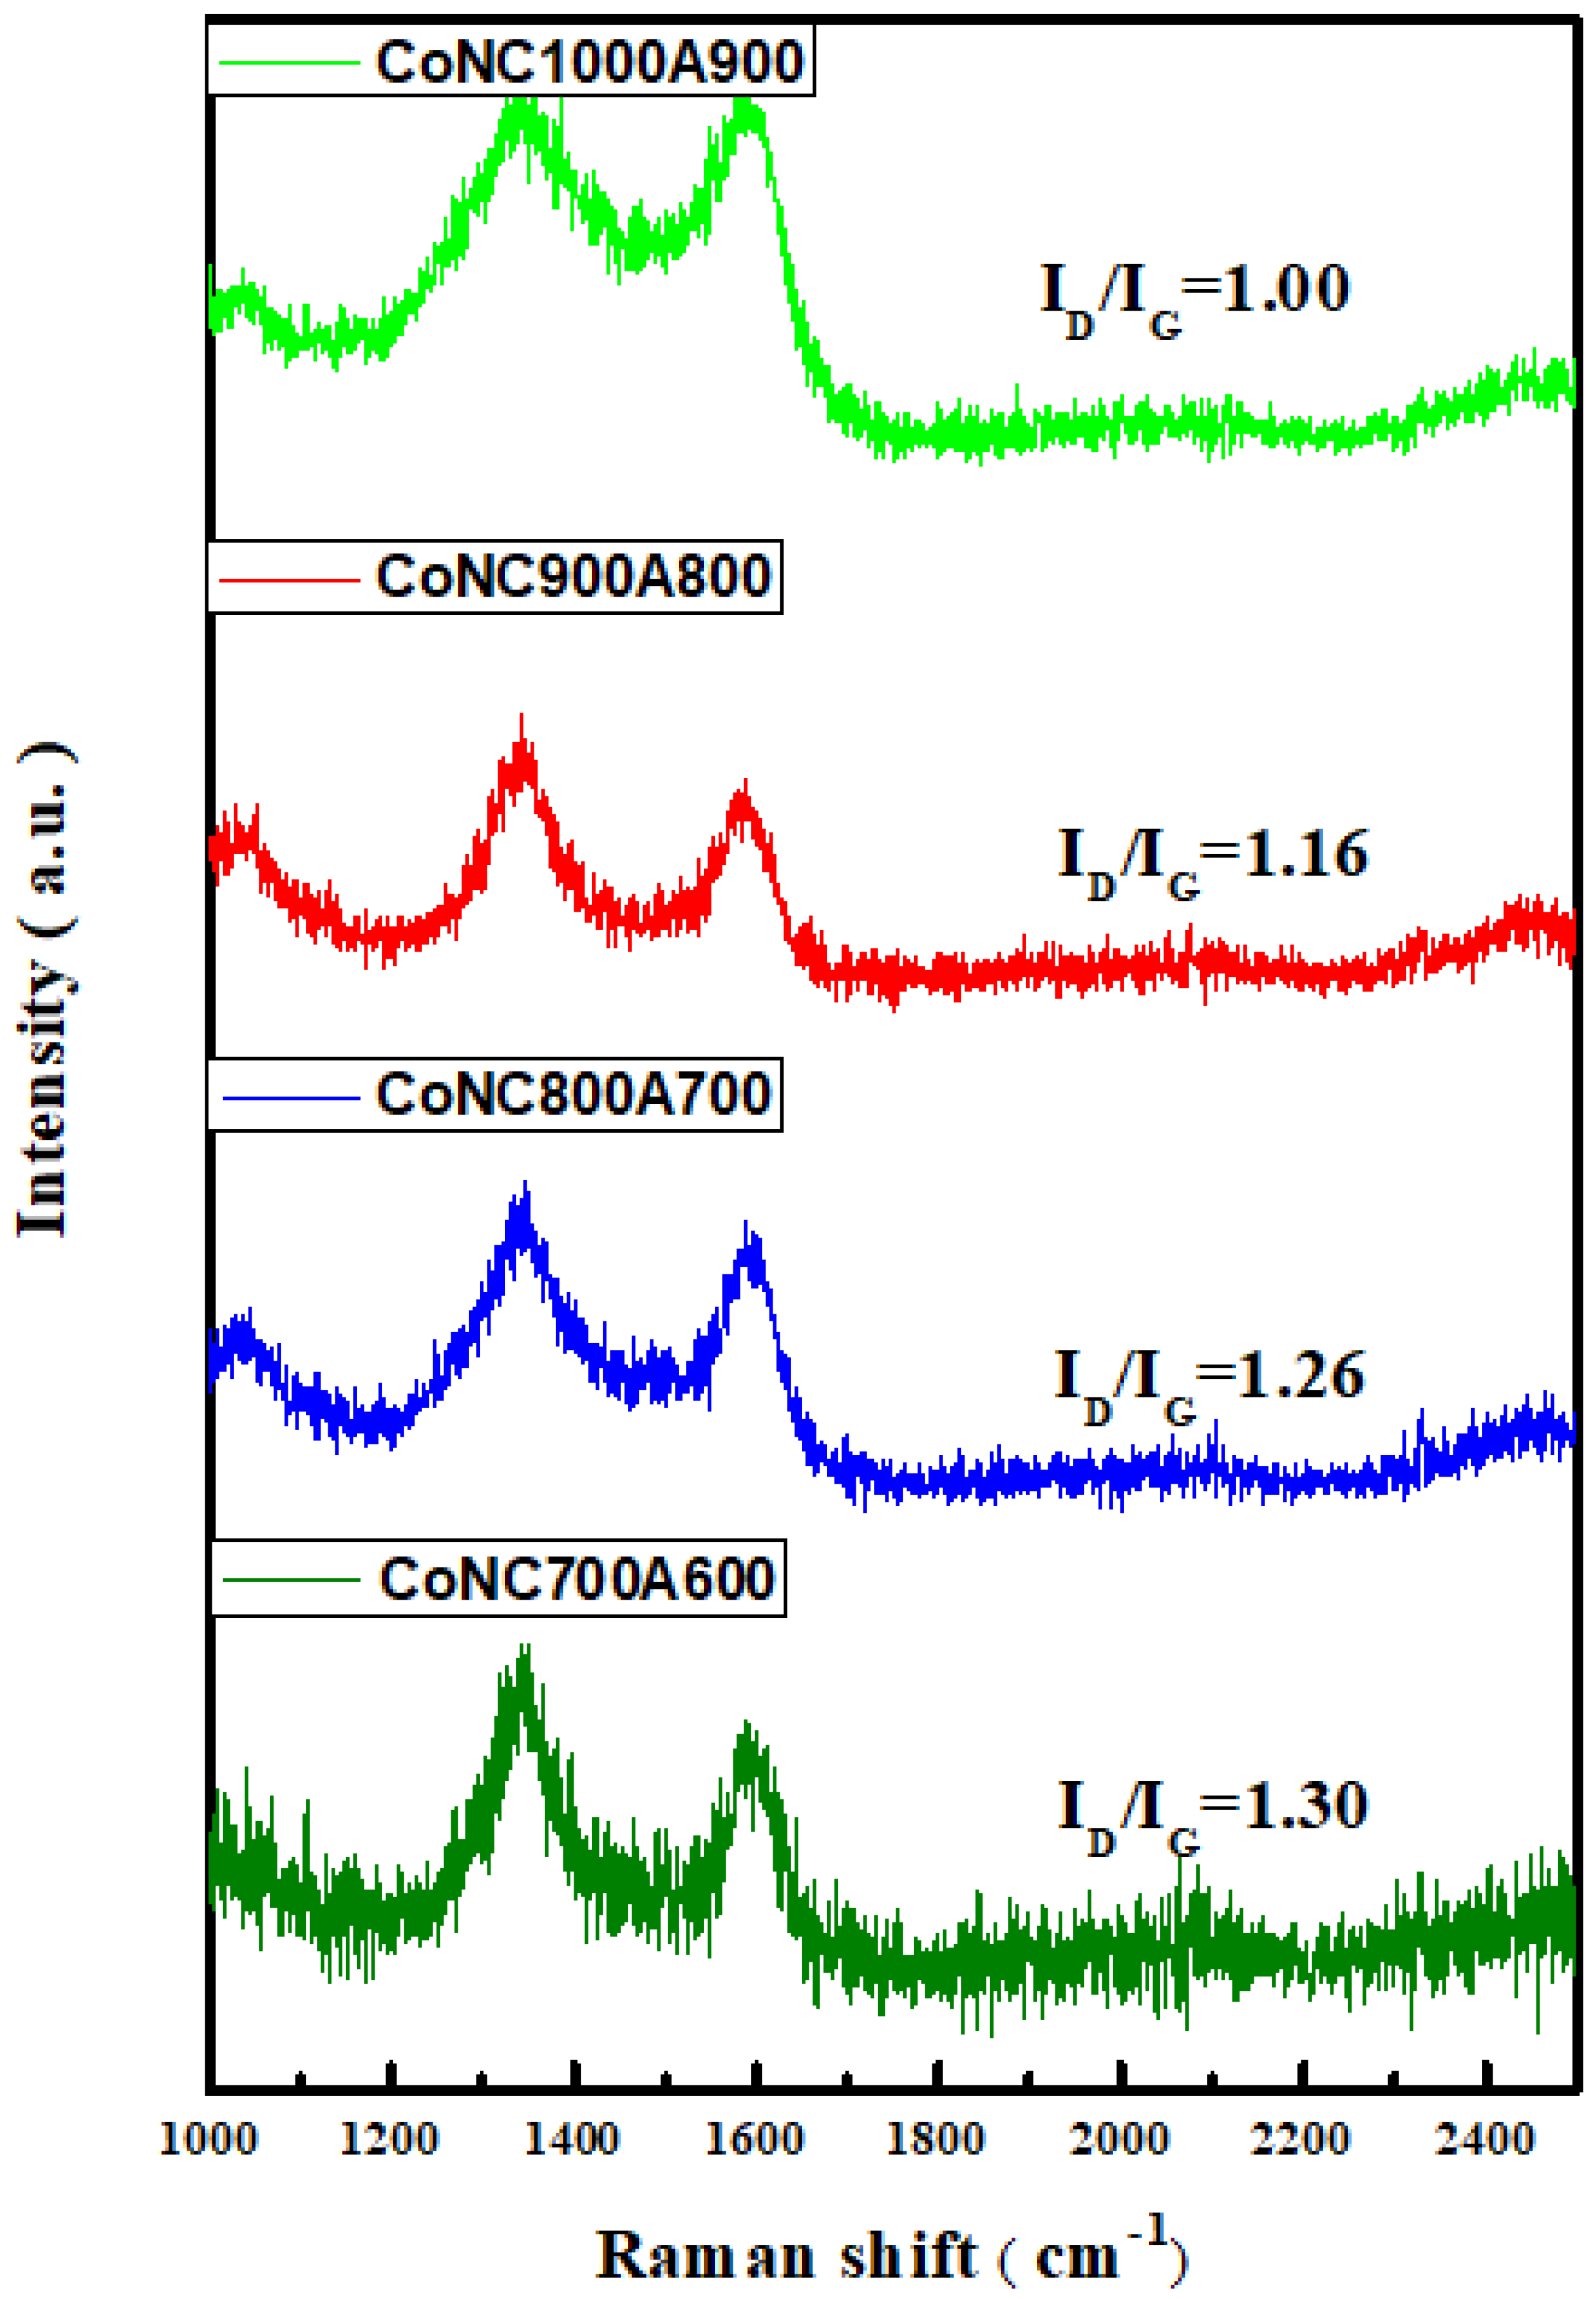
3.5. Raman Spectroscopy
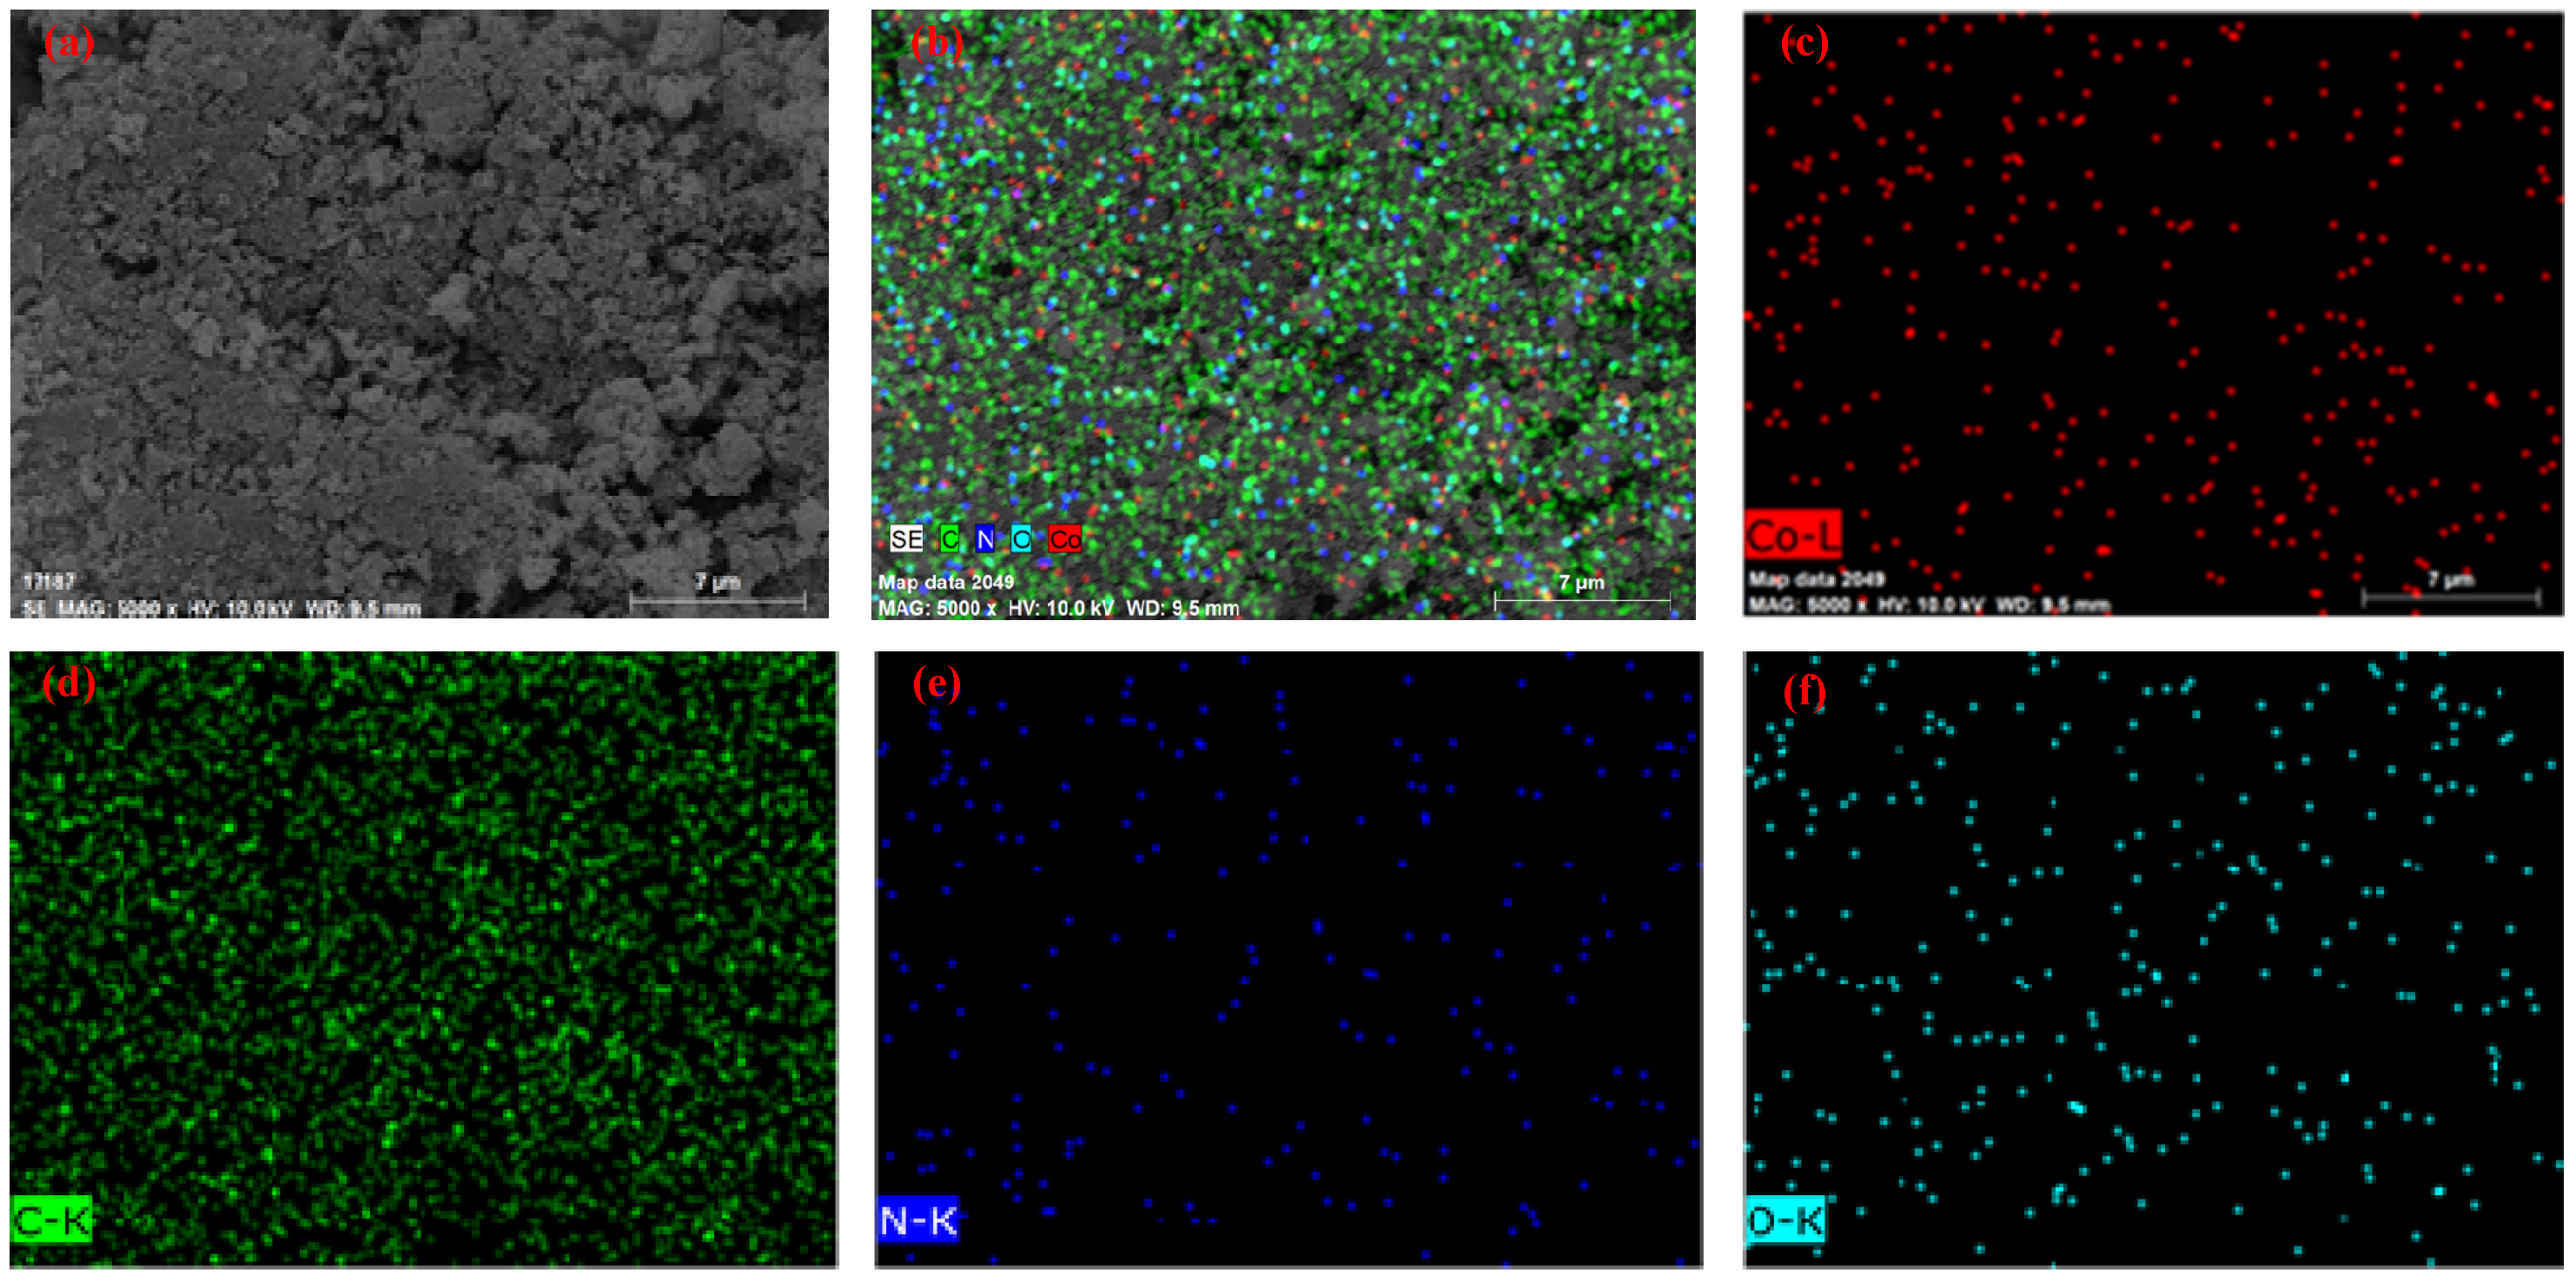
3.6. SEM Micropictures
3.7. TEM Micropicture
3.8. EDs Spectra
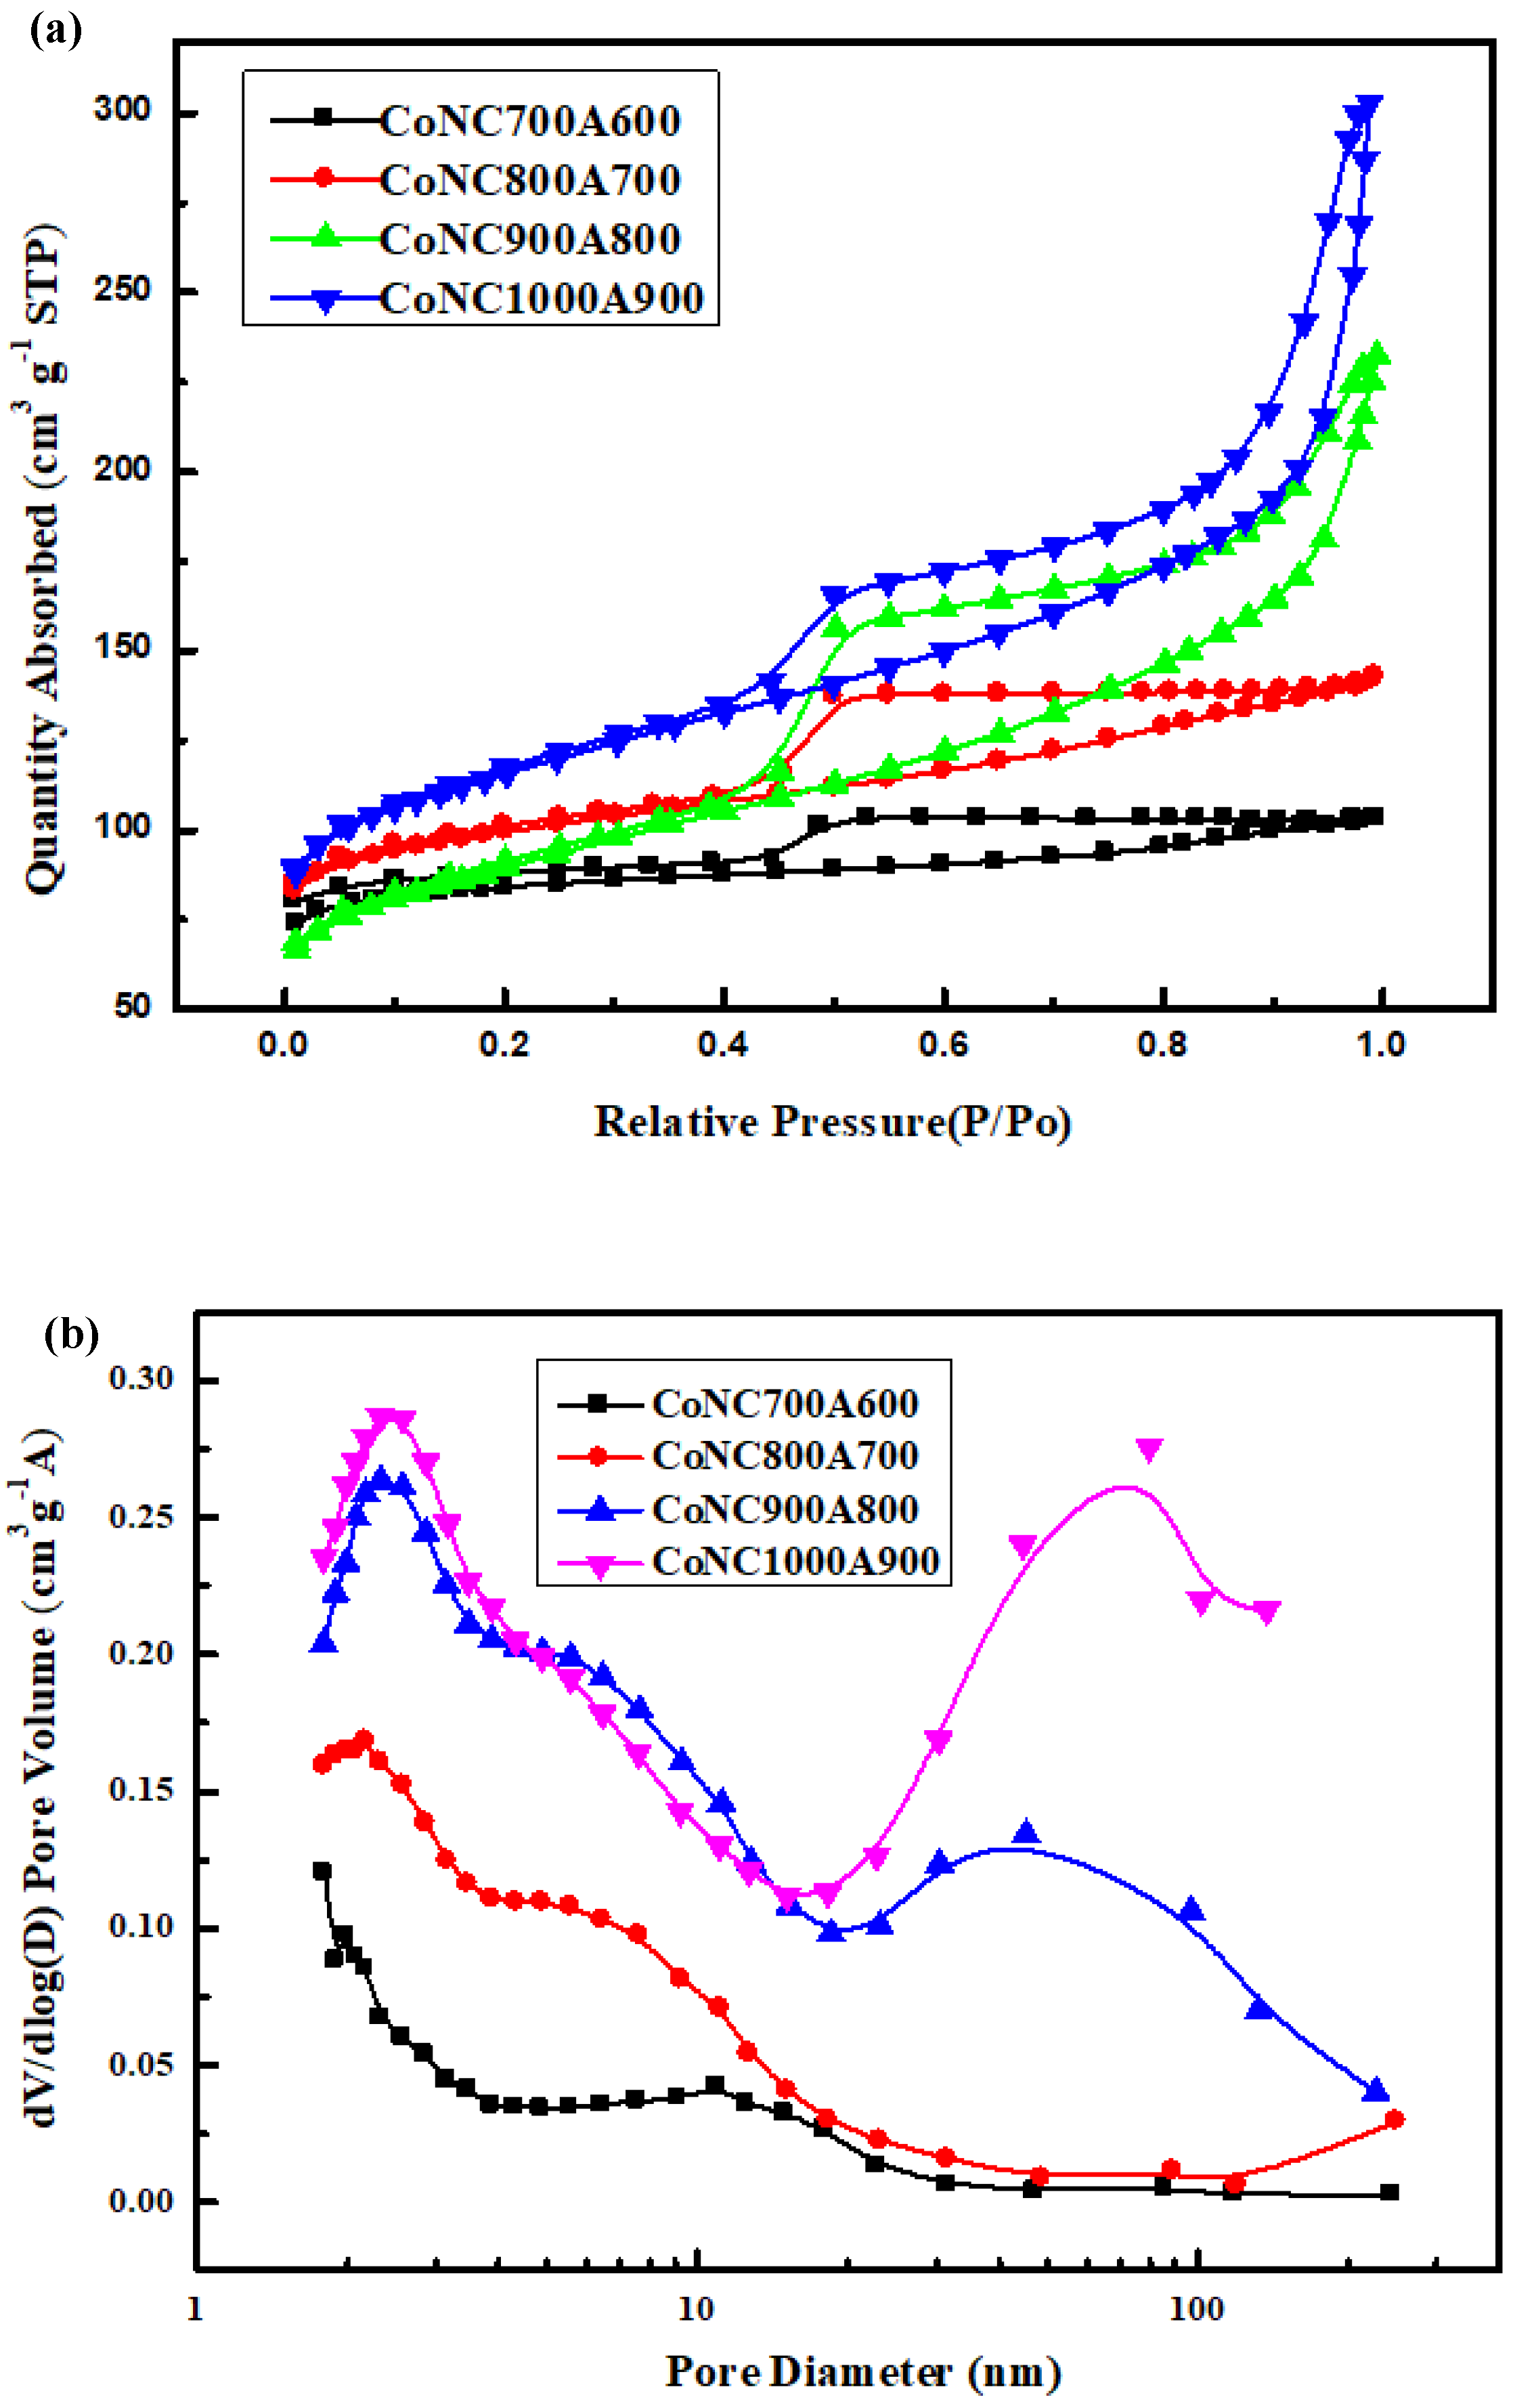
3.9. Surface Area and Pore Size
3.10. Electrochemical Properties
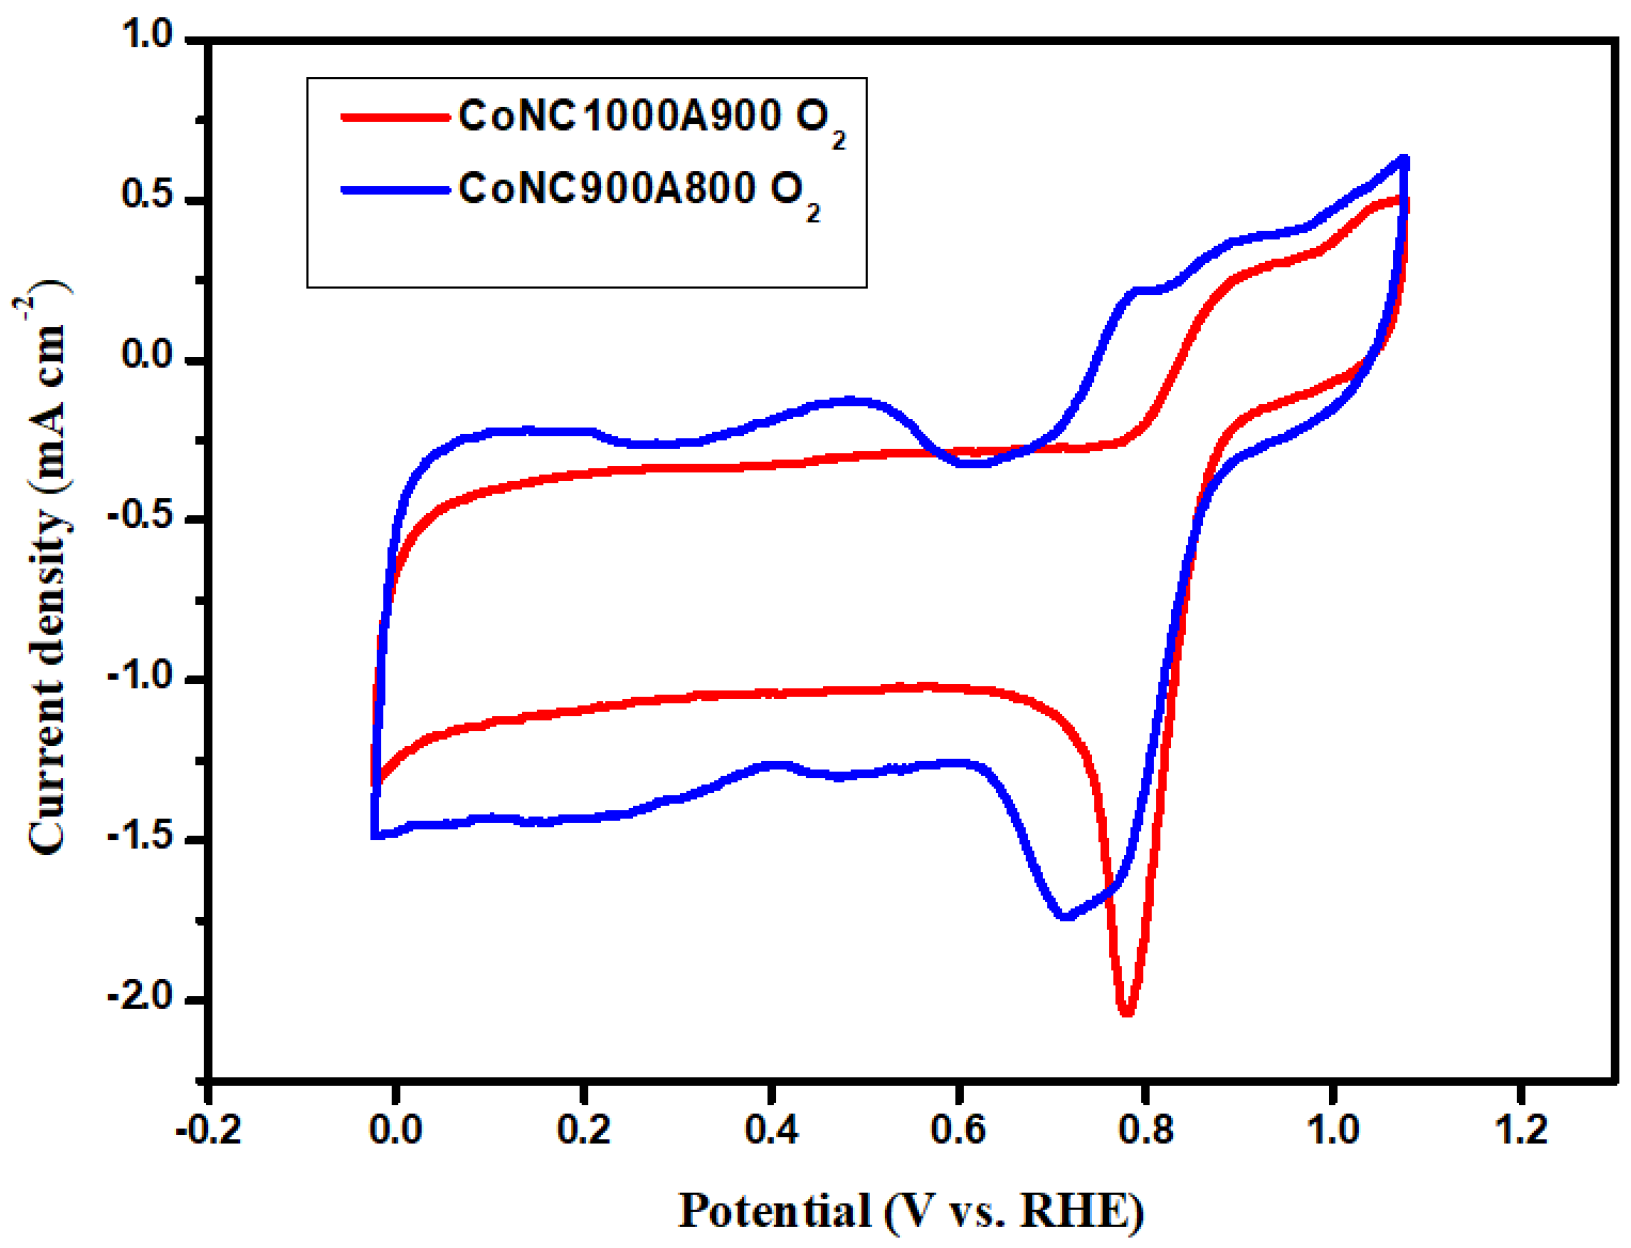
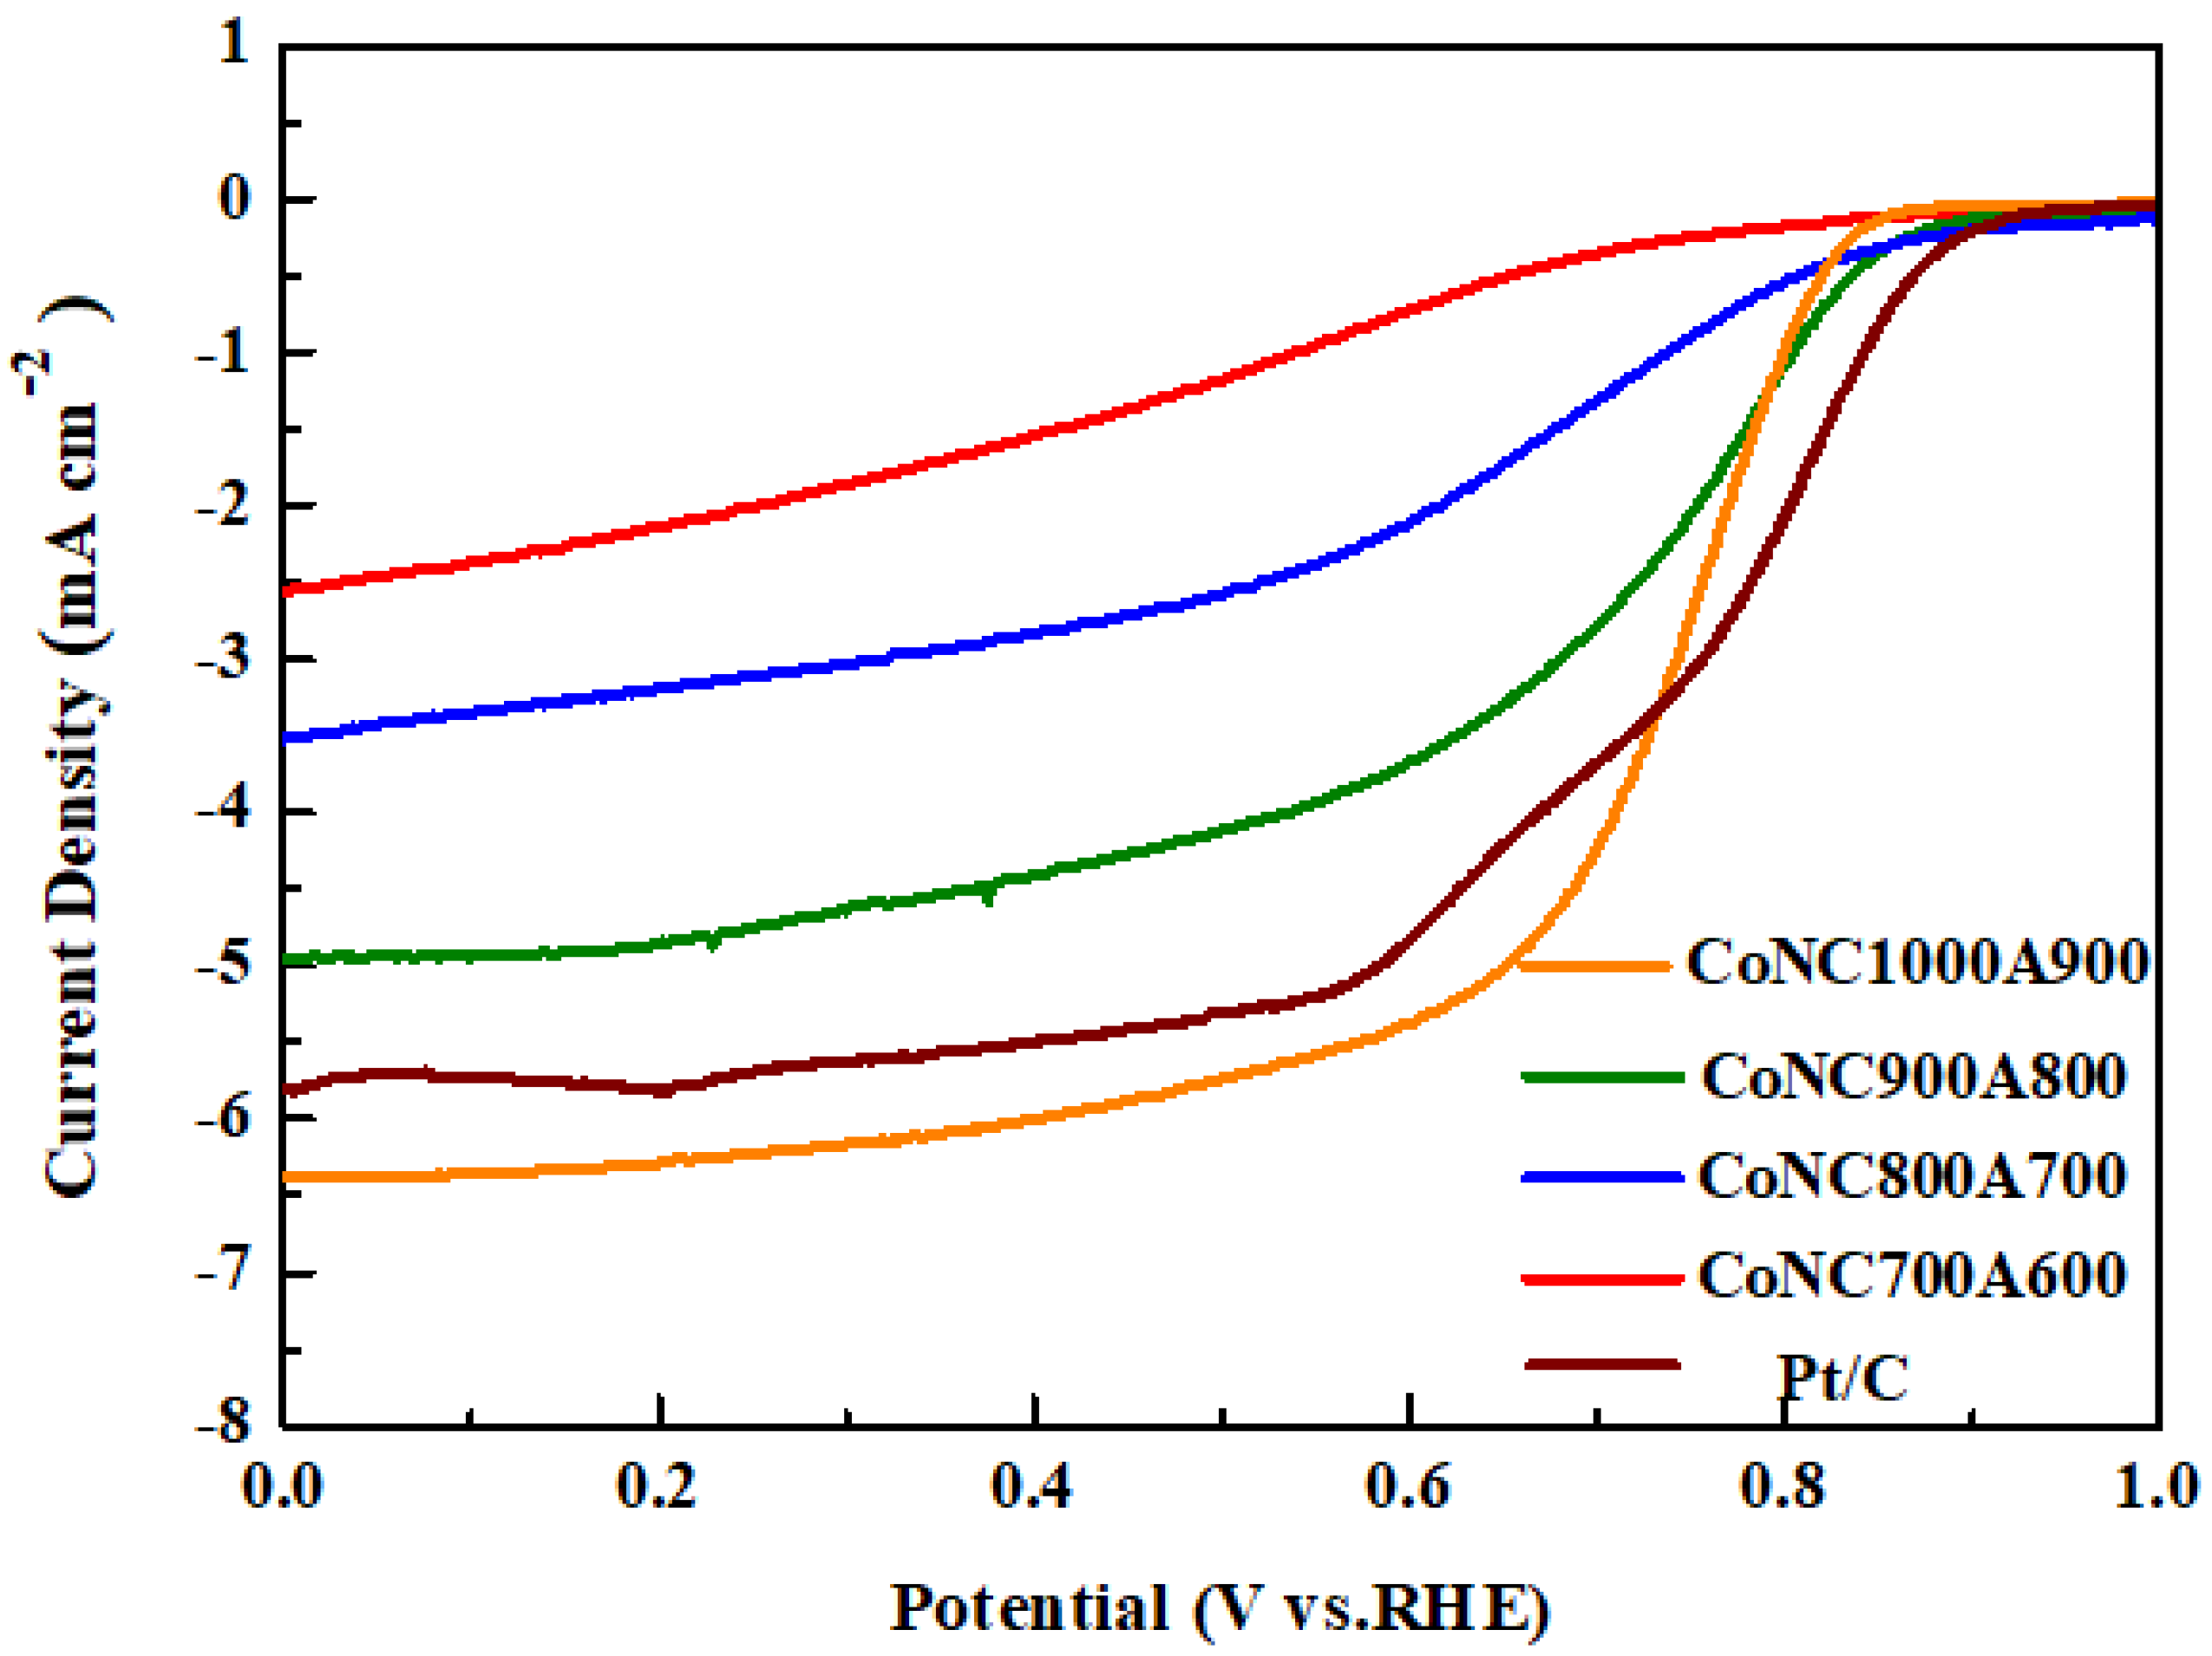
3.10.1. CV and LSV Curves
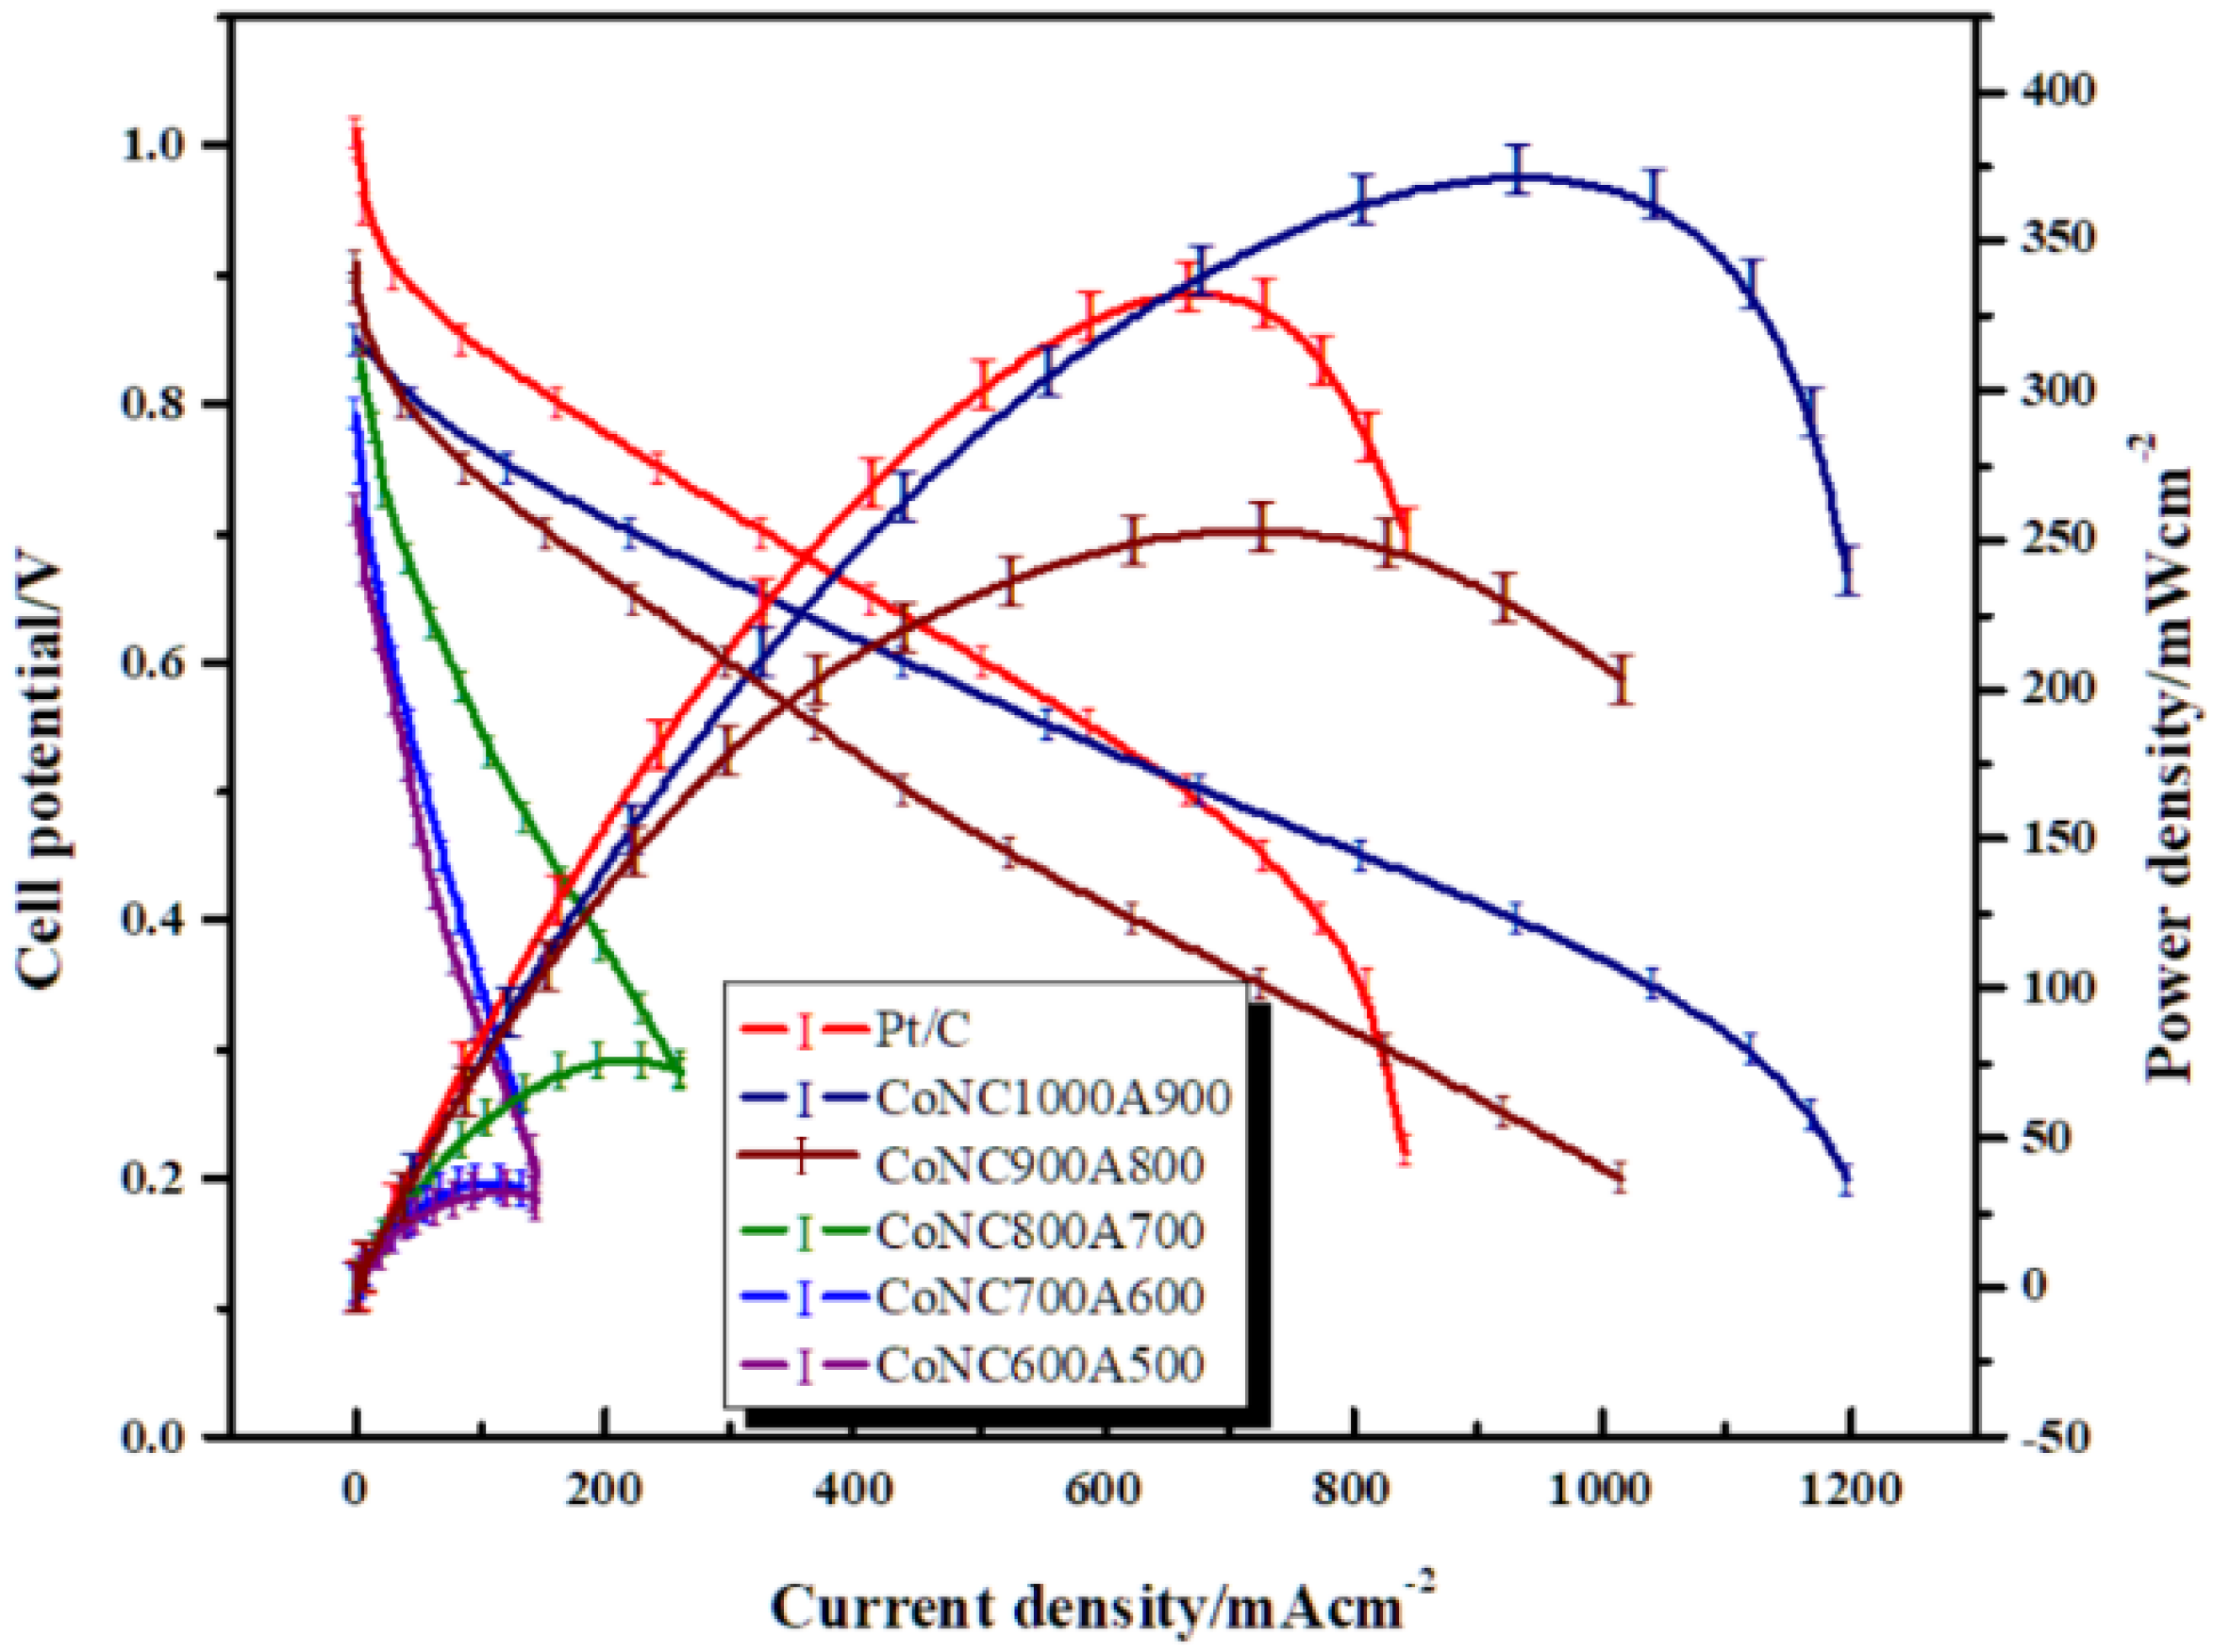
3.10.2. Single Cell Testing
4. Conclusions
Supplementary Materials
Author Contributions
Funding
Institutional Review Board Statement
Informed Consent Statement
Acknowledgments
Conflicts of Interest
References
- He, D.; Zeng, C.; Xu, C.; Cheng, N.; Li, H.; Mu, S.; Pan, M. Polyaniline-functionalized carbon nanotube supported platinum catalysts. Langmuir 2011, 27, 5582–5588. [Google Scholar] [CrossRef] [PubMed]
- Michel, M.; Ettingshausen, F.; Scheiba, F.; Wolz, A.; Roth, C. Using layer-by-layer assembly of polyaniline fibers in the fast preparation of high performance fuel cell nanostructured membrane electrodes. Phys. Chem. Chem. Phys. 2008, 10, 3796–3801. [Google Scholar] [CrossRef] [PubMed]
- Kinoshita, K. Carbon: Electrochemical and Physicochemical Properties; Wiley: New York, NY, USA, 1988; pp. 5–10. [Google Scholar]
- Kinoshita, K.; Bett, J.A.S. Potentiodynamic analysis of surface oxides on carbon blacks. Carbon 1973, 11, 403–411. [Google Scholar] [CrossRef]
- Pyun, S.I.; Lee, E.J.; Kim, T.Y.; Lee, S.J.; Ryu, Y.G.; Kim, C.S. Role of surface oxides in corrosion of carbon black in phosphoric acid solution at elevated temperature. Carbon 1994, 32, 155–159. [Google Scholar]
- Yang, Z.; Wang, M.; Liu, G.; Chen, M.; Ye, F.; Zhang, W.; Yang, W.; Wang, X. Octahedral Pt-Ni nanoparticles prepared by pulse-like hydrothermal method for oxygen reduction reaction. Ionics 2019, 26, 293–300. [Google Scholar] [CrossRef]
- Wu, R.-H.; Tsai, M.-J.; Ho, K.-S.; Wei, T.-E.; Hsieh, T.-H.; Han, Y.-K.; Kuo, C.-W.; Tseng, P.-H.; Wang, Y.-Z. Sulfonated polyaniline nanofiber as Pt-catalyst conducting support for proton exchange membrane fuel cell. Polymer 2014, 55, 2035–2043. [Google Scholar] [CrossRef]
- Wang, Y.-Z.; Chang, K.-J.; Hung, L.-F.; Ho, K.-S.; Chen, J.-P.; Hsieh, T.-H.; Chao, L. Carboxylated carbonized polyaniline nanofibers as Pt-catalyst conducting support for proton exchange membrane fuel cell. Synth. Met. 2014, 188, 21–29. [Google Scholar] [CrossRef]
- Wang, Y.-Z.; Ko, T.-H.; Huang, W.-Y.; Hsieh, T.-H.; Ho, K.-S.; Chen, Y.-Y.; Hsieh, S.-J. Preparation of Pt-Catalyst by Poly(p-phenylenediamine) Nanocomposites Assisted by Microwave Radiation for Proton Exchange Membrane Fuel Cell. Polymers 2018, 10, 1388. [Google Scholar] [CrossRef] [Green Version]
- Tsai, M.-J.; Hsieh, T.-H.; Wang, Y.-Z.; Ho, K.-S.; Chang, C.-Y. Microwave Assisted Reduction of Pt-Catalyst by N-Phenyl-p-Phenylenediamine for Proton Exchange Membrane Fuel Cells. Polymers 2017, 9, 104. [Google Scholar] [CrossRef] [Green Version]
- Huang, W.-Y.; Chang, M.-Y.; Wang, Y.-Z.; Huang, Y.-C.; Ho, K.-S.; Hsieh, T.-H.; Kuo, Y.-C. Polyaniline Based Pt-Electrocatalyst for a Proton Exchanged Membrane Fuel Cell. Polymers 2020, 12, 617. [Google Scholar] [CrossRef] [Green Version]
- Bai, L.; Hsu, C.-S.; Alexander, D.T.L.; Chen, H.M.; Hu, X. A Cobalt–Iron Double-Atom Catalyst for the Oxygen Evolution Reaction. J. Am. Chem. Soc. 2019, 141, 14190–14199. [Google Scholar] [CrossRef]
- Liang, X.; Li, Z.; Xiao, H.; Zhang, T.; Xu, P.; Zhang, H.; Gao, Q.; Zheng, L. Two Types of Single-Atom FeN4 and FeN5 Electrocatalytic Active Centers on N-Doped Carbon Driving High Performance of the SA-Fe-NC Oxygen Reduction Reaction Catalyst. Chem. Mater. 2021, 33, 5542–5555. [Google Scholar] [CrossRef]
- Peng, X.; Omasta, T.J.; Magliocca, E.; Wang, L.G.; Varcoe, J.R.; Mustain, W.E. Nitrogen-doped Carbon–CoOx Nanohybrids: A Precious Metal Free Cathode that Exceeds 1.0 W cm−2 Peak Power and 100 h Life in Anion-Exchange Membrane Fuel Cells. Angew. Chem. 2019, 58, 1046–1051. [Google Scholar] [CrossRef] [PubMed] [Green Version]
- Kisand, K.; Sarapuu, A.; Danilian, D.; Kikas, A.; Kisand, V.; Rähn, M.; Treshchalov, A.; Käärik, M.; Merisalu, M.; Paiste, P.; et al. Transition metal-containing nitrogen-doped nanocarbon catalysts derived from 5-methylresorcinol for anion exchange membrane fuel cell application. J. Colloid Interface Sci. 2021, 584, 263–274. [Google Scholar] [CrossRef]
- Zhang, J.; Pei, Y.; Zhu, W.; Liu, Y.; Yin, Y.; Qin, Y.; Guiver, M.D. Ionomer dispersion solvent influence on the microstructure of Co–N–C catalyst layers for anion exchange membrane fuel cell. J. Power Sources 2021, 484, 229259. [Google Scholar] [CrossRef]
- Wang, Y.-Z.; Huang, W.-Y.; Hsieh, T.-H.; Jheng, L.-C.; Ho, K.-S.; Huang, S.-W.; Chao, L. FeNxC Based Catalysts Prepared by the Calcination of Iron-Ethylenediamine@Polyaniline as the Cathode-Catalyst of Proton Exchange Membrane Fuel Cell. Polymers 2019, 11, 1368. [Google Scholar] [CrossRef] [PubMed] [Green Version]
- Huang, W.-Y.; Jheng, L.-C.; Hsieh, T.-H.; Ho, K.-S.; Wang, Y.-Z.; Gao, Y.-J.; Tseng, P.-H. Calcined Co(II)-Triethylenetetramine, Co(II)-Polyaniline-Thiourea as the Cathode Catalyst of Proton Exchanged Membrane Fuel Cell. Polymers 2020, 12, 3070. [Google Scholar] [CrossRef] [PubMed]
- Cheng, Y.-W.; Huang, W.-Y.; Ho, K.-S.; Hsieh, T.-H.; Jheng, L.-C.; Kuo, Y.-M. Fe, N-Doped Metal Organic Framework Prepared by the Calcination of Iron Chelated Polyimines as the Cathode-Catalyst of Proton Exchange Membrane Fuel Cells. Polymers 2021, 13, 3850. [Google Scholar] [CrossRef]
- Miao, Z.; Xia, Y.; Liang, J.; Xie, L.; Chen, S.; Li, S.; Wang, H.-L.; Hu, S.; Han, J.; Li, Q. Constructing Co–N–C Catalyst via a Double Crosslinking Hydrogel Strategy for Enhanced Oxygen Reduction Catalysis in Fuel Cells. Small 2021, 17, 2100735. [Google Scholar] [CrossRef]
- Chen, P.-W.; Li, K.; Yu, Y.-X.; Zhang, W.-D. Cobalt-doped graphitic carbon nitride photocatalysts with high activity for hydrogen evolution. Appl. Surf. Sci. 2017, 392, 608–615. [Google Scholar] [CrossRef]
- Venegas, R.; Recio, F.J.; Zuñiga, C.; Viera, M.; Oyarzún, M.-P.; Silva, N.; Neira, K.; Marco, J.F.; Zagal, J.H.; Tasca, F. Comparison of the catalytic activity for O2 reduction of Fe and Co MN4 adsorbed on graphite electrodes and on carbon nanotubes. Phys. Chem. Chem. Phys. 2017, 19, 20441–20450. [Google Scholar] [CrossRef] [PubMed]
- Zhang, G.; Huang, C.; Wang, X. Dispersing Molecular Cobalt in Graphitic Carbon Nitride Frameworks for Photocatalytic Water Oxidation. Small 2015, 11, 1215–1221. [Google Scholar] [CrossRef]
- Lilloja, J.; Kibena-Põldsepp, E.; Sarapuu, A.; Kodali, M.; Chen, Y.; Asset, T.; Käärik, M.; Merisalu, M.; Paiste, P.; Aruväli, J.; et al. Cathode Catalysts Based on Cobalt- and Nitrogen-Doped Nanocarbon Composites for Anion Exchange Membrane Fuel Cells. ACS Appl. Energy Mater. 2020, 3, 5375–5384. [Google Scholar] [CrossRef]
- Zhao, H.; Xing, T.; Li, L.; Geng, X.; Guo, K.; Sun, C.; Zhou, W.; Yang, H.; Song, R.; An, B. Synthesis of cobalt and nitrogen co-doped carbon nanotubes and its ORR activity as the catalyst used in hydrogen fuel cells. Int. J. Hydrogen Energy 2019, 44, 25180–25187. [Google Scholar] [CrossRef]
- Qiao, X.; Jin, J.; Fan, H.; Cui, L.; Ji, S.; Li, Y.; Liao, S. Cobalt and Nitrogen Co-Doped Graphene-Carbon Nanotube Aerogel as an Efficient Bifunctional Electrocatalyst for Oxygen Reduction and Evolution Reactions. Catalysts 2018, 8, 275. [Google Scholar] [CrossRef] [Green Version]
- Cao, K.-W.; Huang, H.; Li, F.-M.; Yao, H.-C.; Bai, J.; Chen, P.; Jin, P.-J.; Deng, Z.-W.; Zeng, J.-H.; Chen, Y. Co nanoparticles supported on three-dimensionally N-doped holey graphene aerogels for electrocatalytic oxygen reduction. J. Colloid Interface Sci. 2020, 559, 143–151. [Google Scholar] [CrossRef]
- Wang, Z.; Xiao, S.; Zhu, Z.; Long, X.; Zheng, X.; Lu, X.; Yang, S. Cobalt-Embedded Nitrogen Doped Carbon Nanotubes: A Bifunctional Catalyst for Oxygen Electrode Reactions in a Wide pH Range. ACS Appl. Mater. Interfaces 2015, 7, 4048–4055. [Google Scholar] [CrossRef]
- Lu, Y.; Wen, X.; Chen, X.; Chu, P.K.; Tang, T.; Mijowska, E. Nitrogen-doped porous carbon embedded with cobalt nanoparticles for excellent oxygen reduction reaction. J. Colloid Interface Sci. 2019, 546, 344–350. [Google Scholar] [CrossRef] [PubMed]
- Noh, W.Y.; Lee, J.H.; Lee, J.S. Nitrogen-doped carbon nanotube–graphene hybrid stabilizes MxN (M = Fe, Co) nanoparticles for efficient oxygen reduction reaction. Appl. Catal. B Environ. 2020, 268, 118415. [Google Scholar] [CrossRef]
- Jasinski, R. A new fuel cell cathode catalyst. Nature 1964, 201, 1212. [Google Scholar] [CrossRef]
- Bagotzky, V.S.; Tarasevich, M.R.; Radyushkina, K.A.; Levina, O.A.; Andrusyova, S.I. Electrocatalysis of the oxygen reduction process on metal chelates in acid electrolyte. J. Power Sources 1978, 2, 233–240. [Google Scholar] [CrossRef]
- Ratso, S.; Sahraie, N.R.; Sougrati, M.T.; Käärik, M.; Kook, M.; Saar, R.; Paiste, P.; Jia, Q.; Leis, J.; Mukerjee, S.; et al. Synthesis of highly-active Fe–N–C catalysts for PEMFC with carbide-derived carbons. J. Mater. Chem. A 2018, 6, 14663–14674. [Google Scholar] [CrossRef]
- Mamtani, K.; Singh, D.; Tian, J.; Millet, J.M.; Miller, J.T.; Co, A.C.; Ozkan, U.S. Evolution of N-coordinated iron–carbon (FeNC) catalysts and their oxygen reduction (ORR) performance in acidic media at various stages of catalyst. Catal. Lett. 2016, 146, 1749–1770. [Google Scholar] [CrossRef]
- Logeshwaran, N.; Ramakrishnan, S.; Chandrasekaran, S.S.; Vinothkannan, M.; Kim, A.R.; Sengodan, S.; Velusamy, D.B.; Varadhan, P.; He, J.-H.; Yoo, D.J. An efficient and durable trifunctional electrocatalyst for zinc–air batteries driven overall water splitting. Appl. Catal. B Environ. 2021, 297, 120405. [Google Scholar] [CrossRef]
- Kim, M.-J.; Kim, S.; Park, J.E.; Hwang, C.-C.; Lee, S.; Kang, S.Y.; Jung, D.; Cho, Y.-H.; Kim, J.; Lee, K.-S.; et al. Controlling active sites of Fe–N–C electrocatalysts for oxygen electrocatalysis. Nano Energy 2020, 78, 105395. [Google Scholar] [CrossRef]
- Elayappan, V.; Shanmugam, R.; Chinnusamy, S.; Yoo, D.J.; Mayakrishnan, G.; Kim, K.; Noh, H.S.; Kim, M.K.; Lee, H. Three-dimensional bimetal TMO supported carbon based electrocatalyst developed via dry synthesis for hydrogen and oxygen evolution. Appl. Surf. Sci. 2020, 505, 144642. [Google Scholar] [CrossRef]
- Kannan, R.; Kim, A.R.; Yoo, D.J. Enhanced electrooxidation of methanol, ethylene glycol, glycerol, and xylitol over a polypyrrole/manganese oxyhydroxide/palladium nanocomposite electrode. J. Appl. Electrochem. 2014, 44, 893–902. [Google Scholar] [CrossRef]
- Vijayakumar, E.; Ramakrishnan, S.; Sathiskumar, C.; Yoo, D.J.; Balamurugan, J.; Noh, H.S.; Kwon, D.; Kim, Y.H.; Lee, H. MOF-derived CoP-nitrogen-doped carbon@ NiFeP nanoflakes as an efficient and durable electrocatalyst with multiple catalytically active sites for OER, HER, ORR and rechargeable zinc-air batteries. Chem. Eng. J. 2022, 428, 131115. [Google Scholar] [CrossRef]
- Yeager, E. Dioxygen electrocatalysis: Mechanisms in relation to catalyst structure. J. Mol. Catal. 1986, 38, 5–25. [Google Scholar] [CrossRef]


| Pyridinic N | Co-N | Pyrrolic N | Graphitic N | |
|---|---|---|---|---|
| CoNC 700A600 | 7.1 | 12.7 | 70 | 15.6 |
| CoNC 800A700 | 18.6 | 38.2 | 24.2 | 12.1 |
| CoNC 900A800 | 23.8 | 26.9 | 33.7 | 10.6 |
| CoNC 1000A900 | 61.6 | 25.2 | 9.1 | 4.1 |
| CoNC | BET (m2 g−1) | Micropore (m2 g−1) | Mesopore (m2 g−1) | Total Volume (cm3) | Micropore Volume (cm3) | Mesopore Volume (cm3) | BJH Adsorption Average Pore Diameter (nm) |
|---|---|---|---|---|---|---|---|
| 700A600 | 257.41 | 198.79 | 58.62 | 0.53 | 0.41 | 0.12 | 4.12 |
| 800A700 | 296.82 | 100.09 | 197.89 | 0.9 | 0.56 | 0.34 | 5.78 |
| 900A800 | 312.95 | 194.06 | 118.88 | 0.91 | 0.31 | 0.61 | 6.15 |
| 1000A900 | 393.94 | 126.31 | 268.89 | 2.03 | 0.65 | 1.39 | 10.34 |
| Onset Potential (V) | Half-Wave Potential (V) | Limiting Current Density (mA cm−2) | |
|---|---|---|---|
| Pt/C | 0.95 | 0.83 | −5.29 |
| CoNC 700A600 | 0.90 | 0.62 | −2.56 |
| CoNC 800A700 | 0.90 | 0.70 | −3.49 |
| CoNC 900A800 | 0.92 | 0.75 | −4.97 |
| CoNC 1000A900 | 0.93 | 0.77 | −6.24 |
| Cathode Catalysts | Power Density (mW cm−2) |
|---|---|
| Pt/C | 334.7 |
| CoNC-600A500 | 32.2 |
| CoNC-700A600 | 34.9 |
| CoNC-800A700 | 76 |
| CoNC-900A800 | 254.7 |
| CoNC-1000A900 | 374.3 |
Publisher’s Note: MDPI stays neutral with regard to jurisdictional claims in published maps and institutional affiliations. |
© 2022 by the authors. Licensee MDPI, Basel, Switzerland. This article is an open access article distributed under the terms and conditions of the Creative Commons Attribution (CC BY) license (https://creativecommons.org/licenses/by/4.0/).
Share and Cite
Hsieh, T.-H.; Chen, S.-N.; Wang, Y.-Z.; Ho, K.-S.; Chuang, J.-K.; Ho, L.-C. Cobalt-Doped Carbon Nitride Frameworks Obtained from Calcined Aromatic Polyimines as Cathode Catalyst of Anion Exchange Membrane Fuel Cells. Membranes 2022, 12, 74. https://0-doi-org.brum.beds.ac.uk/10.3390/membranes12010074
Hsieh T-H, Chen S-N, Wang Y-Z, Ho K-S, Chuang J-K, Ho L-C. Cobalt-Doped Carbon Nitride Frameworks Obtained from Calcined Aromatic Polyimines as Cathode Catalyst of Anion Exchange Membrane Fuel Cells. Membranes. 2022; 12(1):74. https://0-doi-org.brum.beds.ac.uk/10.3390/membranes12010074
Chicago/Turabian StyleHsieh, Tar-Hwa, Sin-Nan Chen, Yen-Zen Wang, Ko-Shan Ho, Jung-Kuan Chuang, and Lin-Chia Ho. 2022. "Cobalt-Doped Carbon Nitride Frameworks Obtained from Calcined Aromatic Polyimines as Cathode Catalyst of Anion Exchange Membrane Fuel Cells" Membranes 12, no. 1: 74. https://0-doi-org.brum.beds.ac.uk/10.3390/membranes12010074