

An Untargeted Metabolomics Strategy to Identify Substrates of Known and Orphan E. coli Transporters


1
Novo Nordisk Foundation Center for Biosustainability, Technical University of Denmark, Søltofts Plads, Building 220, 2800 Kogens Lyngby, Denmark
2
Department of Biochemistry, Cell and Systems Biology, Institute of Systems, Molecular and Integrative Biology, University of Liverpool, Crown St, Liverpool L69 7ZB, UK
*
Author to whom correspondence should be addressed.
†
These authors contributed equally to this work.
Membranes 2024, 14(3), 70; https://0-doi-org.brum.beds.ac.uk/10.3390/membranes14030070
Submission received: 22 January 2024
/
Revised: 8 March 2024
/
Accepted: 14 March 2024
/
Published: 20 March 2024
(This article belongs to the Collection Feature Papers in Biological Membrane Functions)
Abstract
:Transport systems play a pivotal role in bacterial physiology and represent potential targets for medical and biotechnological applications. However, even in well-studied organisms like Escherichia coli, a notable proportion of transporters, exceeding as many as 30%, remain classified as orphans due to their lack of known substrates. This study leveraged high-resolution LC-MS-based untargeted metabolomics to identify candidate substrates for these orphan transporters. Human serum, including a diverse array of biologically relevant molecules, served as an unbiased source for substrate exposure. The analysis encompassed 26 paired transporter mutant contrasts (i.e., knockout vs. overexpression), compared with the wild type, revealing distinct patterns of substrate uptake and excretion across various mutants. The convergence of candidate substrates across mutant scenarios provided robust validation, shedding light on novel transporter-substrate relationships, including those involving yeaV, hsrA, ydjE, and yddA. Furthermore, several substrates were contingent upon the specific mutants employed. This investigation underscores the utility of untargeted metabolomics for substrate identification in the absence of prior knowledge and lays the groundwork for subsequent validation experiments, holding significant implications for both medical and biotechnological advancements.
1. Introduction
Transport systems, which selectively move substrates across cell membranes, constitute an important component of bacterial physiology. The ability to manipulate bacterial transporters both genetically and chemically has applications in both medicine (as a major component of antibiotic resistance due to evolved adaptations in efflux transporters [1,2,3,4]) and microbial cell factories (as a reliable way to increase product yield and tolerance of toxic products to increase efflux from the intracellular space into the extracellular medium [5,6,7,8,9,10,11,12]). Transporters are similarly required to maximize substrate uptake [13,14,15,16].
Escherichia coli is a model organism and has been intensively studied, with the full genome first published in 1997 [17]. Of the 4146 genes in the E. coli K-12 MG1655 chromosome, some 598 (around 15%) encode established or predicted membrane transporters [18]. Despite intensive research on E. coli, more than a quarter of these transporters (currently 160 to our best approximation) are considered y-genes or orphans (see also [19]), in that they have no assigned substrate. Even in the cases of those for which a substrate has been identified, it may be far from the best or main natural substrate (see, for example, [20]).
Finding substrates and elucidating the structure activity relationship of orphan bacterial transporters is a challenging proposition. Many nutrient importers have numerous transporters of different affinities and specificities (for example tryptophan and tyrosine can enter E. coli cells via several different transporters [21,22,23,24,25,26]) and given this redundancy, perturbation of a single transporter may not abolish import of the substrate, as well as the inevitability of inducing pleiotropic effects [27,28]. Furthermore, many efflux proteins export numerous xenobiotics, with substrates overlapping between transporters [29]. While there are techniques to allow measurement of transport directly on isolated transporters [30,31], this is only practically feasible when one has at least some idea of substrate selectivity. Given there are still many E. coli transporters with no assigned substrate (and that the annotation of transporters in other industrially relevant microorganisms is similarly lacking [32,33]), there is a need for a methodology that can in an unbiased way identify candidate substrates for orphan transporters.
Human serum is effectively a mix of many thousands of biologically relevant molecules [34,35], that provides a cheap and unbiased means of providing them to cells, in concentrations that plausibly reflect natural exposure [36]. Previously, incubation of human cells in serum followed by LC-MS has been used to identify substrates being imported and excreted into different cell lines using both low-resolution [20] and more recently high-resolution [37] methods.
In the present study, we sought to apply these high-resolution methods to E. coli cells, utilizing single gene transporter overexpression cells derived from the ASKA collection [38] and single gene transporter knockouts from the KEIO collection [39]. Cells were incubated in human serum, and we measured changes in extracellular compound levels (the exo-metabolome [40] or metabolic footprint [41]) over a period of up to 30 min. We were able to detect a total of around 5000 compounds, many of which were identified with reasonably high confidence. We used automated analysis to screen time-course curves of wild type (WT) E. coli, with which we compared 26 transporter mutant pairs. Using this method, we observed clear differential uptake and excretion of diverse compounds. In addition, metabolite variations converged across mutant contrasts, as well as mutant-dependent associations, were systematically assessed for probing candidate substrates of putative transporters utilized in this study and aligned with their respective affiliation in the Transporter Classification Database [42].
2. Materials and Methods
2.1. Bacterial Strains and Cultures
The reference strain (the wild type) E. coli BW25113 utilized in this study was initially streaked on LB Agar. A selection of 26 transporters, as detailed in Table 1, was chosen for the experimental investigation. Each specific E. coli strain with a gene knockout corresponding to the selected transporters was obtained from the KEIO collection [39] and subsequently streaked onto LB Agar containing 25 µg/mL kanamycin for selection. Additionally, for each transporter gene of interest, independent overexpression vectors were obtained from the single gene overexpression (ASKA) collection [38]. Transformants were streaked on LB Agar supplemented with 25 µg/mL chloramphenicol for selection. For the preparation of overnight cultures, individual colonies were carefully picked and inoculated into 50 mL of LB medium, which was appropriately supplemented with the corresponding antibiotic. These cultures were incubated overnight at 37 °C with agitation at 300 rpm.
2.2. Serum Incubation Experiments
Overnight cultures were pelleted with centrifugation and then washed twice in 30 mL of glucose solution. OD was measured following the second resuspension in glucose to determine cell density. Cells were pelleted a final time and resuspended to a density of 6 × 10⁹ cells. A volume of 500 µL of the washed cells was dispensed in 96 deep well plates such that each recipient well contained 3 × 10⁹ cells. The plate was then centrifuged to pellet cells and the glucose solution removed. The runs were configured for both mutant contrasts alongside with the wild type E. coli BW25113 as a control in each run. For each cell type, three technical replicates were considered for each specified time point (0, 5, 15, and 30 min).
Cell pellets were resuspended in 200 µL of pre-warmed human serum (Pooled gender, purchased from BioIVT-West Sussex, Burgess Hill, United Kingdom) and incubated at 37 °C for the indicated time (30, 15, or 5 min). For the zero-time point, cells were resuspended in serum immediately before centrifugation. To control for breakdown or appearance of compounds over time within the serum, triplicate control wells of serum alone with no cells were included for all time points. Following incubation plates were centrifuged at 4000 rpm for 10 min at 4 °C and 150 µL of spent serum supernatant was transferred to a fresh plate and stored at −80 °C until purification. Pooled serum samples were prepared by mixing the remaining spent serum from all wells.
2.3. Preparation for Metabolomics Analysis
Samples were thawed and 100 µL of each sample was mixed with 350 µL of acetonitrile. From this mixture 250 µL was added to an Ostro Protein Precipitation and Phospholipid Removal Plate (Waters, Taastrup, Denmark) and filtered with positive pressure. Filtered samples were dried in a vacuum centrifuge and re-suspended in 100 µL of LCMS grade water.
2.4. LC-MS(MS) Analysis
The LC-MS(MS) analysis was performed using a Vanquish Duo UHPLC binary system (Thermo Fisher Scientific, Waltham, MA, USA) coupled to an Orbitrap IDX Tribrid Mass Spectrometer (Thermo Fisher Scientific, Waltham, MA, USA). The chromatographic separation was achieved using a Waters ACQUITY BEH C18 (10 cm × 2.1 mm, 1.7 μm) column equipped with an ACQUITY BEH C18 guard column kept at 40 °C. The mobile phases consisted of MilliQ© water + 0.1% formic acid (A) and acetonitrile + 0.1% formic acid (B). The initial composition was 2%B, held for 0.8 min, followed by a linear gradient till 5% in 3.3 min, and afterward, 100%B was reached in 10 min and held for 1 min before going back to initial conditions. Re-equilibration time was 2.7 min. Flow rate was kept constant at 0.35 mL/min and injection volume was 1 µL. The MS measurements were performed in positive- and negative-heated electrospray ionization (HESI) mode with a voltage of 3500 and 2500 V, respectively, acquiring in full scan MS spectra in profiling mode using a resolution of 120,000 in the mass range of 70–1000 Da. The AcquireX workflow for automated generation of a background exclusion list from a blank sample was used during the data-dependent acquisition (DDA). The DDA acquisition settings were the following: automatic gain control (AGC) target value set at 4 × 10⁵ for the full MS and 5 × 10⁴ for the MS/MS spectral acquisition, the mass resolution was set to 120,000 for full scan MS and 60,000 for MS/MS events. Precursor ions were fragmented with stepped High-energy collision dissociation (HCD) using collision energies of 20, 40, and 60. The DDA spectra were acquired only on QC pooled samples.
2.5. Data Preprocessing and Analysis
Data processing was performed using Compound Discoverer 3.1, essentially as described in [24]. Briefly, raw instrument data (.RAW) were imported to Compound Discoverer (CD version 3.1) and analyzed using the workflow described in Wright et al. [37]. Peak areas were exported, and a QC based LOESS signal correction was performed in R (version 4.2.3) as previously described [35] using the loess.as function of the fANCOVA package. The confidence level system utilized in the study aligns with established metabolomics reporting standards (see reference), ensuring a robust compound identification process. Criteria for confidence level assignment are based on matching scores exceeding 70 in mzVault and mzCloud databases (levels 1 and 2, respectively), a “Full match” in the Annotation Source (level 3), the presence of a molecular formula (level 4), and a confirmed molecular weight (level 5).
Compounds being imported and exported were identified by automated analysis in R. Within this analysis package, basic univariate statistical analyses were conducted on log2 transformed data using a paired t-test. Volcano plots were then generated using these data, with a significance threshold of p < 0.05 and an absolute log2 fold change > 0.5 set to determine a significant alteration in compound abundance across time points. Following this, a Principal Components Analysis was employed to visualize trends in the differentially transported molecules.
Compounds were defined as being imported or exported if they: 1. could be fit to a linear regression with an adjusted R2 value greater than 0.7; 2. could be fit to an exponential regression with an adjusted R2 value greater than 0.7; or if 3. the compound showed greater than a 3-fold change over the first 15 min and a greater than 5-fold change over the 30 min of incubation. For identification of differences in transport for mutants, two criteria were explored. First, compounds which showed a 2-fold or higher change in peak area at the 5, 15, or 30 min time point compared to the WT strain, and without any overlap between the WT and mutant values at a given time point were selected. Second, strains where a significant difference between the WT and mutant values (p < 0.01) were also selected. Time-course graphs were generated to compare WT and each transporter mutant for all compounds that met these criteria and manually inspected for transport differences. These graphs underwent meticulous manual review to discern distinct transport discrepancies and deselect highly noisy data, and the finally selected molecules per a transporter mutant were exported in the form of tables. Comparisons were performed in R, and graphs were generated using ggplot2 package. All code used for data analysis is available along with the raw data at github.com.
3. Results and Discussion
3.1. Metabolite Profiling of Strains and Compound Identification
The experimental design involved the examination of transporter mutants alongside with the WT, and a serum-only control, with samples taken at 0, 5, 15, and 30 min. The selection of transporters, as detailed in Table 1, predominantly focused on transporters that have not been associated with specific substrates in previous research (i.e., uncharacterized, or putative), aiming to uncover potential new substrate-transporter relationships. Additionally, a selection of transporters with (at least some) known substrates was also included in the study. This dual approach aimed to confirm the method’s accuracy in replicating known or similar interactions while simultaneously investigating potential candidate substrates for uncharacterized transporters.
For compound identification, MS/MS analysis was performed exclusively on pooled QC samples and processing was carried out simultaneously in Compound Discoverer (CD V3.1, see methods). The study adhered to the confidence level system of Schymanski et al. [43] with an overview provided in Table 2. In the positive Electrospray Ionisation mode (ESI+), 9406 compounds were detected, of which 3671 (39%) were unique (based on exact mass, retention time, and a maximum QC CV of 30%). MS/MS data were obtained for 5607 (60%) of these compounds, with 5305 (56%) showing the preferred ion. Identification confidence levels included 16 level 1 matches (0.2%) to reference standards, and 1363 level 5 identifications (14%) based on mass. In the negative Electrospray Ionisation mode (ESI-), 4092 compounds were identified, with 1632 (40%) unique and 3287 (80%) providing MS/MS data, including a higher proportion of level 1 identifications at 67 compounds (2%). A significant portion of the annotations are considered putative, with 75% in ESI+ and 62% in ESI- categorized as level 3 of identification. Compounds with confidence levels 1 through 3 were predominantly included, and their corresponding levels were indicated in figure legends in the following sections. Efforts are underway to develop more comprehensive in-house spectral libraries, which are expected to be integrated into subsequent analyses. The LC-MS/MS method demonstrates a high-capacity for identifying diverse metabolites reliably and accurately, benefiting from the synergistic use of both ESI+ and ESI- modes in metabolomic analysis.
3.2. The Differential Transport of Metabolites
To evaluate the differential uptake and excretion of serum components following incubation at different time points, a simple univariate analysis was performed using the data obtained at the start and the end of the incubation period (i.e., at time points 0 and 30 min). The WT cells and all transporter mutants utilized in this study showed apparent differences in the number and magnitude of metabolites being taken up or excreted, similarly to what has been observed previously with different eukaryotic cell lines [37]. Examples of volcano plots showing this differential analysis are shown in Supplementary Figure S1. In addition, principal component analysis (PCA) showed a clear difference in metabolite transport in response to transporter modulation and captured an apparent time-dependency in metabolite transport kinetics. Examples of PCA scores plots of some representative mutants are shown in Supplementary Figure S2.
At the level of single molecules, several data filtration criteria were set to perform the initial evaluation of their transport profiles and interpret their potential transport direction based on the respective genetic perturbations (see methods for details). Briefly, time course data were examined to select molecules that demonstrated significant changes in concentration over time. Filtration criteria were applied to identify molecules that exhibited differential transport dynamics between the WT and each transporter mutant. Statistical analysis confirmed the significance of these differences. Eventually, time-course graphs were generated to visualize variations between WT and each transporter mutant for the selected molecules. Examples of time-course graphs illustrating the transport profiles of example metabolites are shown in Figure 1. The observed trends in peak area changes provide insights into the dynamics of metabolite uptake (depletion) or excretion (increase or export) over time. By comparing the trends in peak area changes of a molecule between the wild type cells and either the knockout mutant or the overexpression mutant, it is possible to infer a tentative direction of transport. Detailed findings on a broader array of putative transporter mutants are presented in the next section.
3.3. Probing Candidate Substrates of Putative Transporters
The intricate interplay between putative transporters and their cargo was explored based on a systematic comparison of metabolite dynamics in paired knockout and overexpression mutants (referred to as mutant contrasts). First, the convergence of metabolites between mutant contrasts was assessed to enhance the confidence in the selected candidate substrates. Additionally, the mutually interpreted transport directions of these candidates in mutant contrasts provided a dual validation approach that further reinforces the understanding of the transporter-substrate relationships. Secondly, mutant-dependent metabolite variations (i.e., diverged occurrences that were encountered where a range of metabolites exhibited unique associations with either the overexpression or knockout mutants) were also considered. The identified instances in this study demonstrated that the extent of this convergence or divergence varied across mutants. Examples of some pairs of mutants are shown in Figure 2 to illustrate this. Eventually, all findings were aligned with the respective transporter affiliation in the Transporter Classification Database [42]. In this context, a selection of representative putative transporters from various transporter families are provided as illustrative examples. Comprehensive data for all the tested transporters can be found in the Supplementary Material and Supplementary Data S1, which includes a set of fully tabulated data.
3.4. Candidate Substrates of yeaV
Within this dataset, yeaV emerged as a noteworthy putative transporter that showed associations with a diverse array of metabolite alterations in mutant contrasts. Examples of these metabolites are pantothenic acid and kynurenic acid. As shown in Figure 3, yeaV overexpression mutants displayed a greater reduction in the extracellular levels of both metabolites when compared to the WT, indicating an enhanced uptake activity for these molecules. Conversely, the WT exhibited a more substantial depletion of both metabolites over time compared to yeaV knockout mutants, suggesting an impaired uptake mechanism due to the loss of yeaV function. In addition, a similar metabolite shift suggested a decent uptake of ureidosuccinic acid, aspartic acid, and gallic acid (see Figure S3). Complementarily, there was a discernible depletion of several amino acids (or their acetylated forms), such as carnitine, serine, glutamic acid, N-acetyl-aspartic acid concomitant with yeaV overexpression (see Figure S4). In TCD, yeaV is listed as an uncharacterized putative member of the Betaine/Carnitine/Choline Transporter (BCCT) family [42]. Transport proteins within the BCCT family are recognized for their role in shuttling quaternary ammonium compounds, including betaine, carnitine, and choline, which are pivotal in cellular processes like osmoprotection, metabolism, and stress responses. The observations reported here are in line with the BCCT established functions and endorses a potential versatility of yeaV to transport a broad array of substrates.
3.5. Candidate Substrates of hsrA
In the investigation of hsrA, an uncharacterized member of the Drug:H+ Antiporter-2 (DHA2) Family of transporters [42], a diverse array of metabolite variations emerged. Given the pivotal role of antiporters in cellular metabolite transport, the two mutant scenarios employed in this study displayed an overlapping pattern in line with this function. As shown in Figure 4, hsrA overexpression mutant showed an enhanced excretion of serine compared to the WT, whereas hsrA knockout mutant showed a clear impairment in the excretion of this molecule in comparison to the WT. These findings suggest a potential involvement of hsrA in the export of serine under the experimental conditions used here. On the other hand, hsrA overexpression mutants exhibited a near depletion of extracellular hydroxyglutaric acid. In contrast, hsrA knockout mutant showed an impaired uptake of hydroxyglutaric acid compared to the parental strain. Similarly, consistent uptake trends were observed in both mutant scenarios for metabolites such as orotic acid, ureidosuccinic acid, and aspartic acid (Supplementary Data S1). Furthermore, there were additional independent instances in either knockout or overexpression mutants that suggest hsrA’s involvement in the transport of a variety of molecules including organic acids, phenolic compounds, and amino acids. Notably, among these molecules, methionine, and 5′-S-Methyl-5′-thioadenosine contain sulfur, aligning with previous findings of accumulating sulfur containing amino acids like homocysteine under hsrA overexpression. However, further investigations are required to fully elucidate these observations. Overall, these results align with the established functions of the DHA2 family and suggest a potential versatility of hsrA in transporting a wide range of substrates.
3.6. Candidate Substrates of ydjE
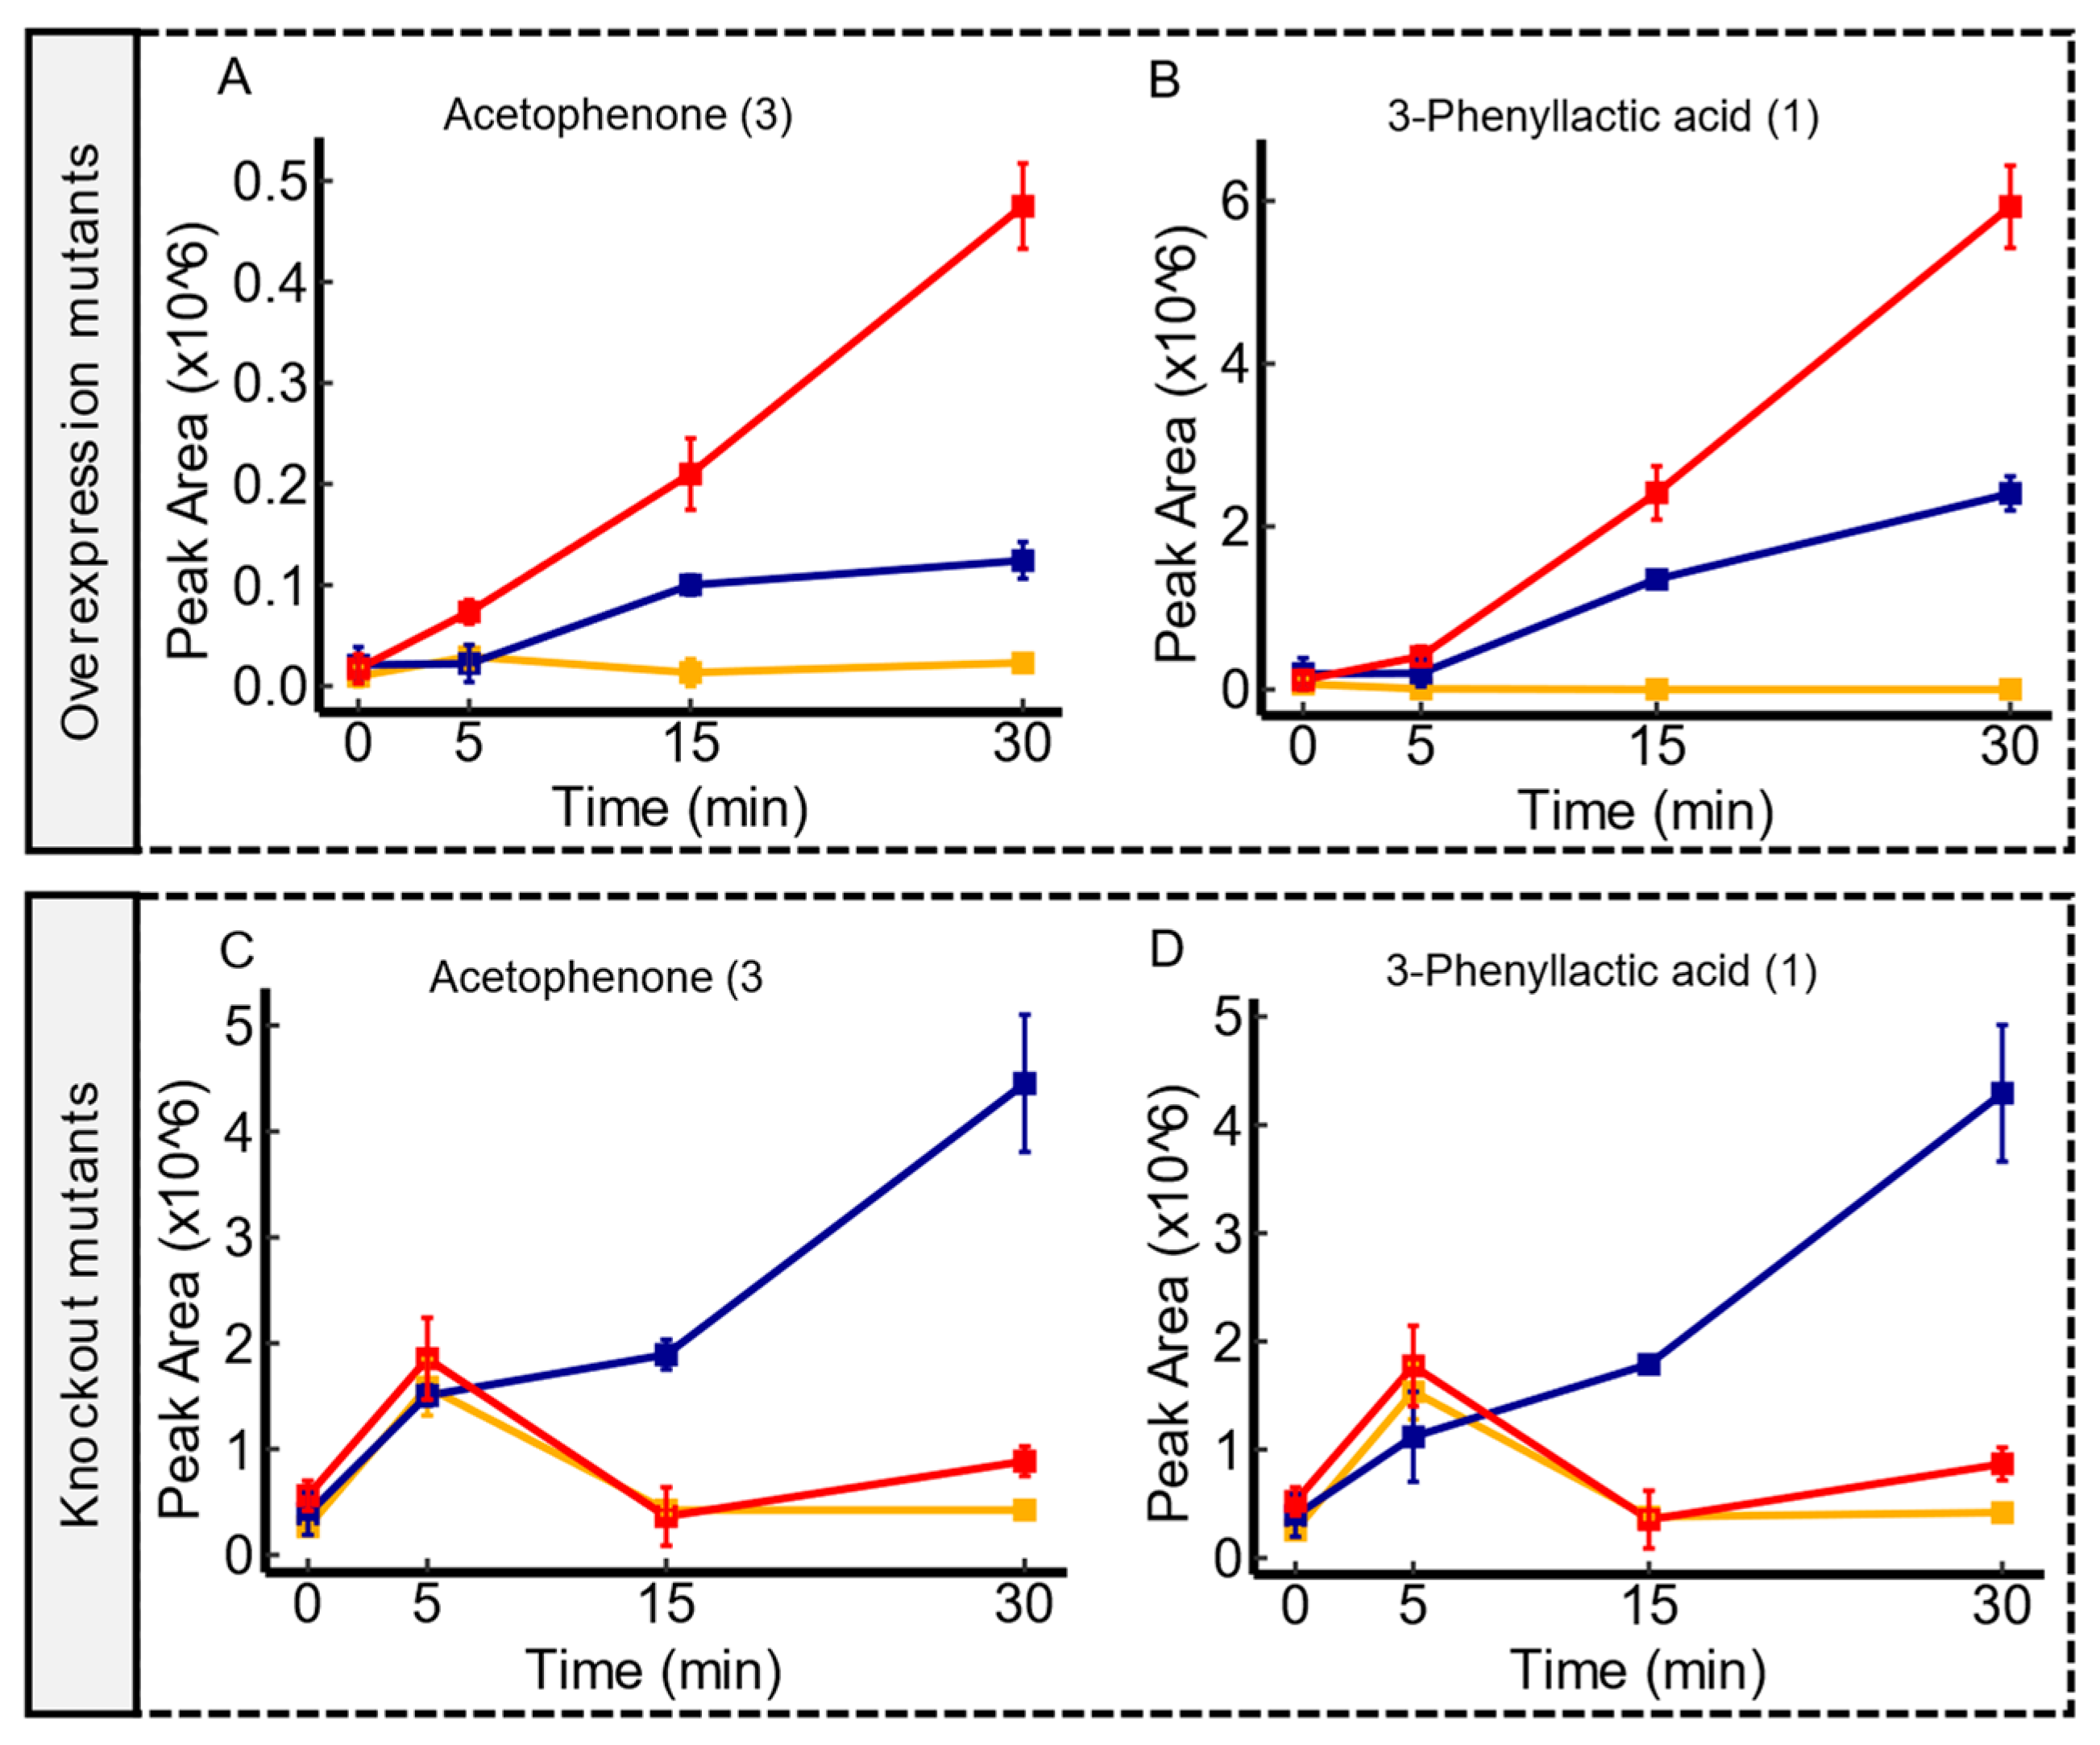
The experiments conducted on ydjE transporter mutants demonstrated correlations with a broad spectrum of metabolites. Notably, two overlapping associations emerged in both mutant contrasts, strongly suggesting an export activity for both acetophenone and 3-phenyllactic acid. As illustrated in Figure 5, ydjE overexpression mutants demonstrated a consistent increase in the peak area throughout the incubation period, surpassing the WT, which implies (modulo pleiotropic effects), an enhanced export capacity, for these metabolites. Conversely, ydjE knockout mutants exhibited a clear impairment in the export of these metabolites when compared to the WT. Additionally, several associations were reported explicitly with either knockout mutants or overexpression mutants, showing the export of several molecules tentatively identified as amino acids (or their acetylated forms) and carboxylic acids (refer to Supplementary Data S1). Despite the affiliation of ydjE within the sugar porter (SP) family [42], a classification that was predicted based on sequence homology alone, the results showed here have revealed associations with metabolites that are not typically related to sugars. While the primary function of transporters in the SP family is sugar transport, it is not uncommon for transporters to exhibit promiscuity and transport other substrates as well in certain cellular contexts [45,46]. Nevertheless, the specific substrate preferences and regulatory mechanisms of ydjE are still unknown, and further research is needed to confirm the complete range of substrates transported by ydjE and the physiological significance of these transport activities in E. coli.
3.7. Candidate Substrates of yddA
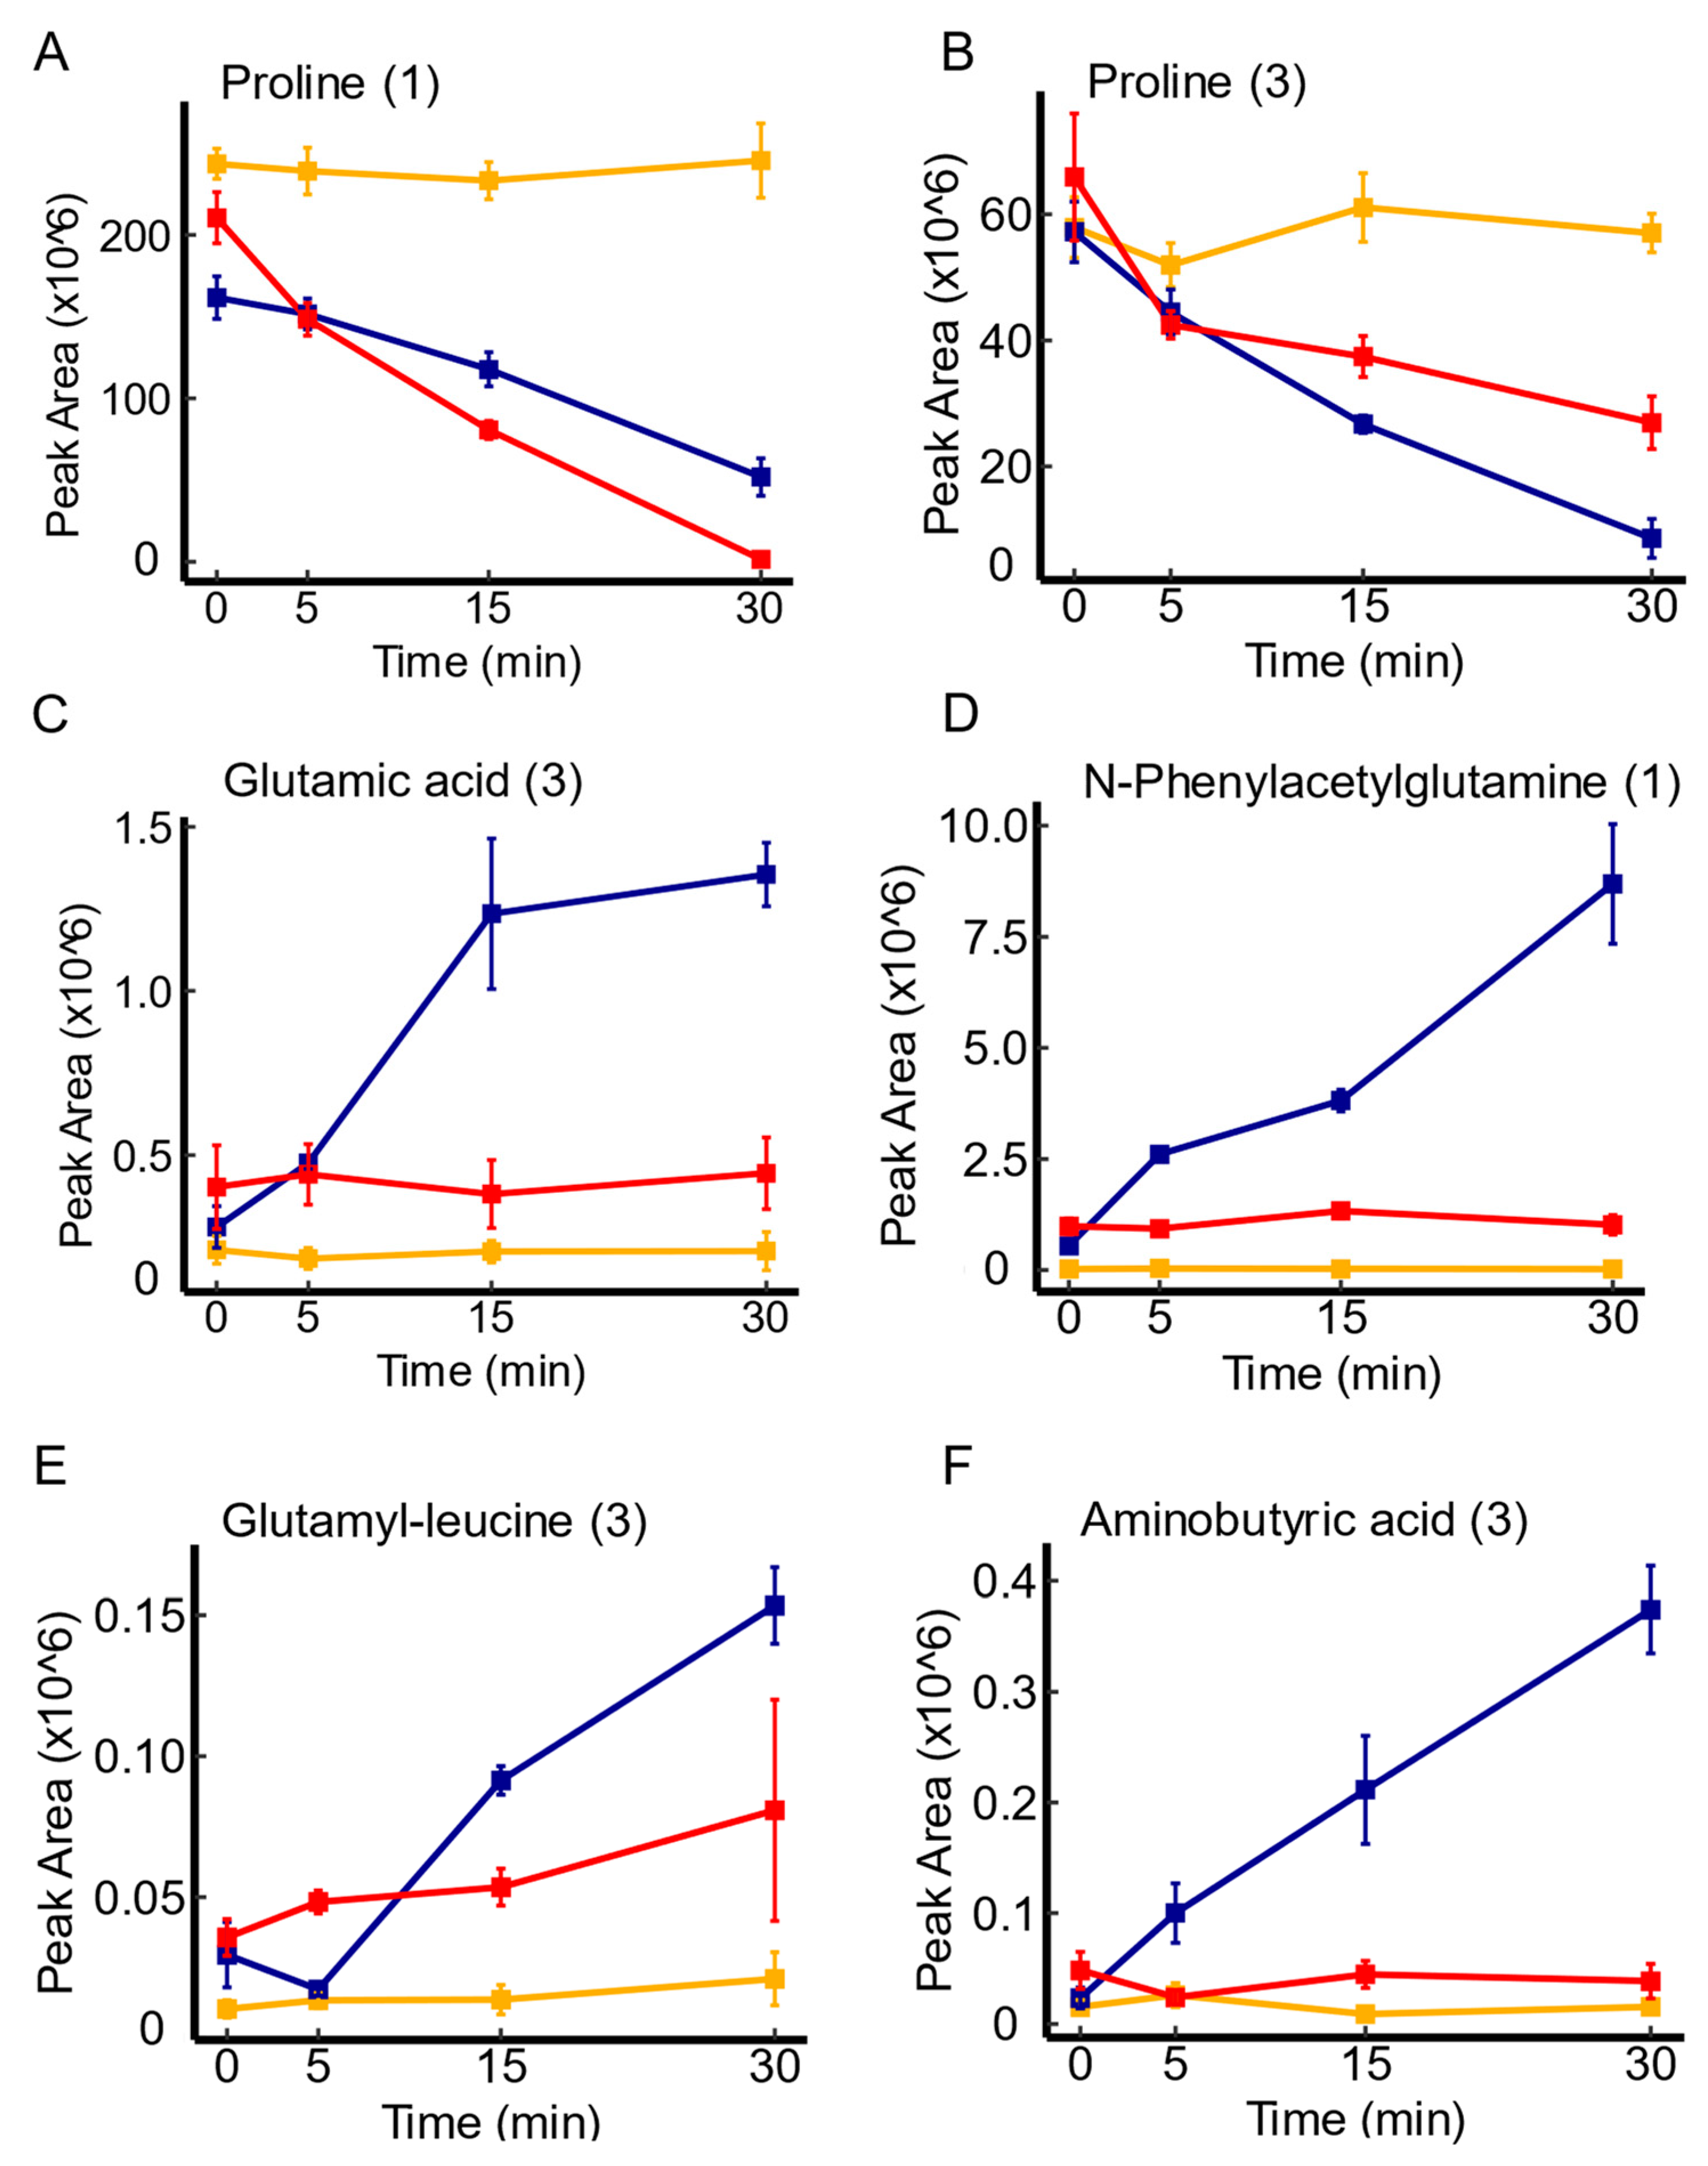
In the investigation of yddA, a putative transporter of the ABC transporter family [42], mutant-dependent metabolite variations were more evident. Notably, yddA overexpression was linked to various metabolites, with amino acids and their derivatives being the most prevalent, including proline, glutamic acid, amino butyric acid, glutamyl-leucine, and phenylacetylglutamine. Figure 6 illustrate the enhanced depletion of these molecules over time in comparison to the WT. Of note, proline was the only molecule that showed convergence between mutant contrasts with an impaired uptake in yddA knockout mutants, highlighting the uptake pattern of this amino acid (see Figure 6A,B). In addition to amino acids, the analysis revealed similar uptake trends of organic acids (e.g., benzoic acid, ibotenic acid), aromatic compounds (e.g., 4-hydroxybenzaldehyde, coumarin), and essential primary metabolites like N(2)-succinyl-glutamic acid, in comparison to the WT. Previous studies have suggested that yddA is part of a three-gene cluster (yddA-yddB-ppqL) which may represent a 3-component iron-uptake system [47]. It has been found that overexpression of cloned yddA in the drug-supersensitive strain E. coli strain did not alter its resistance phenotype against many different drug and toxic compounds [28,29,48]. Moreover, previous investigations into fluorophore accumulation did not reveal substantial changes in mutants lacking yddA [28,29,48]. These prior findings, combined with our observations, support the potential role of yddA in the uptake of metabolites with biological significance such as amino acids. However, this would require further investigations.
3.8. Remaining Transporters
The experiments performed here on 52 mutant strains, alongside with their parental strain, showed a relatively high capacity of the LC-MS method used here to operate at a reasonably high throughput. The cases represented earlier were illustrative examples; however, the remaining transporters and their respective candidate substrates are comprehensively listed in the Supplementary Data S1. The majority of the candidate substrates associated with the remaining transporters exhibited discernible metabolic alterations that were contingent upon the specific mutants employed. This observation underscores the intricate nature of transporter-substrate interactions, where the transport dynamics are influenced by specific genetic perturbations plus an unknown extent of pleiotropic effects. However, grouping of the candidate substrates based on their chemical properties or functional groups can provide insights on the preferred versus broader activity of a given putative membrane transporters. On the other hand, there was a moderate overlap between metabolites being imported or exported across mutants. Among these molecules were pantothenic acid, carnitine, adenine, uracil, organic acids, and some dipeptides. This convergence aligns with the notion of their essentiality to E. coli and their role in various cellular processes, and is likely best understood in the context of functional promiscuity of most membrane transporters [45,49,50].
4. Conclusions
Identifying substrates of microbial membrane transporters is of major relevance to medicine and industrial biotechnology. However, as with other genes in E. coli, more than 30% of the reported membrane transporter families remain insufficiently characterized or lack proper functional annotation [19,42]. Assigning a functional role to individual transporters based on the concept of “having a substrate, seeking a transporter” were solved using many suitable assays [5,28,30,31,51,52,53]. However, solving the inverse problem, “having a transporter, seeking substrate(s)”, is more challenging. In this study, a high-resolution untargeted metabolomics approach was harnessed to decipher candidate substrates of orphan transporters in E. coli illuminating dynamic uptake and excretion profiles exhibited by 26 transporter mutant pairs in comparison to their parental strain. Overall, the results presented here demonstrated: (1) the utility of untargeted metabolomics approach, coupled with the use of human serum, as a method to decipher candidate substrates of known and orphan transporters, obviating the need for prior knowledge. (2) The convergence of candidate substrates with a mutual metabolite shifts in mutant pairs provide a dual validation approach that further reinforces our findings. This convergence clearly underpinned the candidate substrates of many transporters such as yeaV, hsrA, ydjE, and yddA, all of which are novel assignments. (3) The use of intact E. coli cells provides a physiologically relevant environment for studying transporter-substrate interactions. This ensures that the observed transport activities are occurring in a structurally and functionally maintained integrity, while isolating the effect of specific transporters when deleted or overexpressed.
Complex transporter networks and the tentative annotation of most of the identified compounds represent major challenges to the methodology introduced here. More specifically, the presence of functionally redundant transporters with broader substrates specificity may obscure the activity of the transport of interest. However, we have previously introduced an evolutionary selection-based approach that successfully addressed this challenge by combing both chemical and genetic perturbations to reveal such redundant mechanisms [46]. Despite the presence of many interesting cases where compounds’ annotations were tentative, the availability of computational tools capable of highly accurate molecular structure predictions from fragmentation data, as exemplified by Shirvastava et al. [54], offers a pathway for subsequent validation experiments. In addition, computational studies on transcriptomic data, such as weighted-gene correlation network analysis (WGCNA) and inference methods like independent component analysis (ICA), could infer a hypothesis about functions of putative transporters [19,55]. A synergetic combination of these computational inferences and the data obtained from this study can provide a good starting point to drive subsequent validation experiments in extended studies. Overall, the approach introduced in this study pave the way for the discovery of transporter functions and their biotechnological and medical applications.
Supplementary Materials
The following supporting information can be downloaded at: https://0-www-mdpi-com.brum.beds.ac.uk/article/10.3390/membranes14030070/s1, the dataset supporting the results of this article is included in the article (and its Supplementary files). Two files were attached separately: (1) Supplementary File containing all supplementary figures. (2) Supplementary Data S1 File: Spreadsheet containing all selected candidate substrates for each transporter mutant. Figure S1: Differential uptake and excretion of serum metabolites by the wild type (E. coli) and examples of different transporter mutants over a period of 30 min. Figure S2: PCA Scores plots of spent serum after incubation for 0 and 30 min with different transporter mutants. Figure S3: Temporal Transport Dynamics of uredosuccinic acid, aspartic acid, and gallic acid in yeaV mutant contrasts. Figure S4: Temporal Transport Dynamics of four molecules under the overexpression of yeaV.
Author Contributions
Conceptualization, D.B.K.; Methodology, M.S.R., L.J.M. and D.R.; Data curation, M.S.R., L.J.M. and D.R.; software, M.S.R. and L.J.M.; Formal analysis, M.S.R. and L.J.M.; Funding acquisition, D.B.K.; Project administration, D.B.K.; Resources, D.B.K.; Supervision, D.B.K.; Visualization, M.S.R. and L.J.M.; Writing—original draft, M.S.R. and L.J.M.; Writing—review and editing, all authors. All authors have read and agreed to the published version of the manuscript.
Funding
This work was funded by the Novo Nordisk Foundation through the Center for Biosustainability at the Technical University of Denmark (grant number: NNF20CC0035580).
Institutional Review Board Statement
Not applicable.
Data Availability Statement
The dataset supporting the results of this article is included in the article (and its Supplementary Files). Raw LC-MS data are available at github.com.
Acknowledgments
We thank Christina Lenhard for her skillful technical support.
Conflicts of Interest
The authors declare no conflicts of interest.
References
- Thakur, V.; Uniyal, A.; Tiwari, V. A Comprehensive Review on Pharmacology of Efflux Pumps and Their Inhibitors in Antibiotic Resistance. Eur. J. Pharmacol. 2021, 903, 174151. [Google Scholar] [CrossRef]
- Nishino, K.; Yamasaki, S.; Nakashima, R.; Zwama, M.; Hayashi-Nishino, M. Function and Inhibitory Mechanisms of Multidrug Efflux Pumps. Front. Microbiol. 2021, 12, 737288. [Google Scholar] [CrossRef]
- Alam, S.; Doherty, E.; Ortega-Prieto, P.; Arizanova, J.; Fets, L. Membrane Transporters in Cell Physiology, Cancer Metabolism and Drug Response. Dis. Model. Mech. 2023, 16, dmm050404. [Google Scholar] [CrossRef]
- Giacomini, K.M.; Huang, S.M.; Tweedie, D.J.; Benet, L.Z.; Brouwer, K.L.R.; Chu, X.; Dahlin, A.; Evers, R.; Fischer, V.; Hillgren, K.M.; et al. Membrane Transporters in Drug Development. Nat. Rev. Drug Discov. 2010, 9, 215–236. [Google Scholar] [CrossRef]
- Kell, D.B.; Swainston, N.; Pir, P.; Oliver, S.G. Membrane Transporter Engineering in Industrial Biotechnology and Whole Cell Biocatalysis. Trends Biotechnol. 2015, 33, 237–246. [Google Scholar] [CrossRef]
- Jezierska, S.; Van Bogaert, I.N.A. Crossing Boundaries: The Importance of Cellular Membranes in Industrial Biotechnology. J. Ind. Microbiol. Biotechnol. 2017, 44, 721–733. [Google Scholar] [CrossRef]
- Borodina, I. Understanding Metabolite Transport Gives an Upper Hand in Strain Development. Microb. Biotechnol. 2019, 12, 69–70. [Google Scholar] [CrossRef]
- Salvador López, J.M.; Van Bogaert, I.N.A. Microbial Fatty Acid Transport Proteins and Their Biotechnological Potential. Biotechnol. Bioeng. 2021, 118, 2184–2201. [Google Scholar] [CrossRef]
- Mukhopadhyay, A. Tolerance Engineering in Bacteria for the Production of Advanced Biofuels and Chemicals. Trends Microbiol. 2015, 23, 498–508. [Google Scholar] [CrossRef]
- Zhu, Y.; Zhou, C.; Wang, Y.; Li, C. Transporter Engineering for Microbial Manufacturing. Biotechnol. J. 2020, 15, 1900494. [Google Scholar] [CrossRef]
- Kell, D.B. Control of Metabolite Efflux in Microbial Cell Factories: Current Advances and Future Prospects. In Fermentation Microbiology and Biotechnology, 4th ed.; CRC Press: Boca Raton, FL, USA, 2018; pp. 117–138. [Google Scholar] [CrossRef]
- Kell, D.B. The Transporter-Mediated Cellular Uptake and Efflux of Pharmaceutical Drugs and Biotechnology Products: How and Why Phospholipid Bilayer Transport Is Negligible in Real Biomembranes. Molecules 2021, 26, 5629. [Google Scholar] [CrossRef]
- Khunnonkwao, P.; Jantama, S.S.; Kanchanatawee, S.; Jantama, K. Re-Engineering Escherichia Coli KJ122 to Enhance the Utilization of Xylose and Xylose/Glucose Mixture for Efficient Succinate Production in Mineral Salt Medium. Appl. Microbiol. Biotechnol. 2018, 102, 127–141. [Google Scholar] [CrossRef] [PubMed]
- Yang, L.; Malla, S.; Özdemir, E.; Kim, S.H.; Lennen, R.; Christensen, H.B.; Christensen, U.; Munro, L.J.; Herrgård, M.J.; Kell, D.B.; et al. Identification and Engineering of Transporters for Efficient Melatonin Production in Escherichia Coli. Front. Microbiol. 2022, 13, 880847. [Google Scholar] [CrossRef] [PubMed]
- Carreón-Rodríguez, O.E.; Gosset, G.; Escalante, A.; Bolívar, F. Glucose Transport in Escherichia Coli: From Basics to Transport Engineering. Microorganisms 2023, 11, 1588. [Google Scholar] [CrossRef] [PubMed]
- Gosset, G. Improvement of Escherichia Coli Production Strains by Modification of the Phosphoenolpyruvate: Sugar Phosphotransferase System. Microb. Cell Fact. 2005, 4, 14. [Google Scholar] [CrossRef] [PubMed]
- Blattner, F.R.; Plunkett, G.; Bloch, C.A.; Perna, N.T.; Burland, V.; Riley, M.; Collado-Vides, J.; Glasner, J.D.; Rode, C.K.; Mayhew, G.F.; et al. The Complete Genome Sequence of Escherichia Coli K-12. Science 1997, 277, 1453–1462. [Google Scholar] [CrossRef] [PubMed]
- Elbourne, L.D.H.; Tetu, S.G.; Hassan, K.A.; Paulsen, I.T. TransportDB 2.0: A Database for Exploring Membrane Transporters in Sequenced Genomes from All Domains of Life. Nucleic Acids Res. 2017, 45, D320. [Google Scholar] [CrossRef]
- Ghatak, S.; King, Z.A.; Sastry, A.; Palsson, B.O. The Y-Ome Defines the 35% of Escherichia Coli Genes That Lack Experimental Evidence of Function. Nucleic Acids Res. 2019, 47, 2446–2454. [Google Scholar] [CrossRef] [PubMed]
- Gründemann, D.; Harlfinger, S.; Golz, S.; Geerts, A.; Lazar, A.; Berkels, R.; Jung, N.; Rubbert, A.; Schömig, E. Discovery of the Ergothioneine Transporter. Proc. Natl. Acad. Sci. USA 2005, 102, 5256–5261. [Google Scholar] [CrossRef] [PubMed]
- Liu, S.; Xu, J.Z.; Zhang, W.G. Advances and Prospects in Metabolic Engineering of Escherichia Coli for L-Tryptophan Production. World J. Microbiol. Biotechnol. 2022, 38, 22. [Google Scholar] [CrossRef]
- Andrews, A.E.; Lawley, B.; Pittard, A.J. Mutational Analysis of Repression and Activation of the TyrP Gene in Escherichia Coli. J. Bacteriol. 1991, 173, 5068–5078. [Google Scholar] [CrossRef]
- Brown, K.D. Maintenance and Exchange of the Aromatic Amino Acid Pool in Escherichia Coli. J. Bacteriol. 1971, 106, 70–81. [Google Scholar] [CrossRef]
- Hiraga, S.; Ito, K.; Matsuyama, T.; Ozaki, H.; Yura, T. 5-Methyltryptophan-Resistant Mutations Lniked with the Arginine G Marker in Escherichia Coli. J. Bacteriol. 1968, 96, 1880–1881. [Google Scholar] [CrossRef] [PubMed]
- Young, G.B.; Jack, D.L.; Smith, D.W.; Saier, M.H. The Amino Acid/Auxin: Proton Symport Permease Family. Biochim. Biophys. Acta 1999, 1415, 306–322. [Google Scholar] [CrossRef] [PubMed]
- Sarsero, J.P.; Wookey, P.J.; Gollnick, P.; Yanofsky, C.; Pittard, A.J. A New Family of Integral Membrane Proteins Involved in Transport of Aromatic Amino Acids in Escherichia Coli. J. Bacteriol. 1991, 173, 3231–3234. [Google Scholar] [CrossRef]
- Featherstone, D.E.; Broadie, K. Wrestling with Pleiotropy: Genomic and Topological Analysis of the Yeast Gene Expression Network. Bioessays 2002, 24, 267–274. [Google Scholar] [CrossRef]
- Jindal, S.; Yang, L.; Day, P.J.; Kell, D.B. Involvement of Multiple Influx and Efflux Transporters in the Accumulation of Cationic Fluorescent Dyes by Escherichia Coli. BMC Microbiol. 2019, 19, 195. [Google Scholar] [CrossRef] [PubMed]
- Nishino, K.; Yamaguchi, A. Analysis of a Complete Library of Putative Drug Transporter Genes in Escherichia Coli. J. Bacteriol. 2001, 183, 5803–5812. [Google Scholar] [CrossRef] [PubMed]
- Mirandela, G.D.; Tamburrino, G.; Hoskisson, P.A.; Zachariae, U.; Javelle, A. The Lipid Environment Determines the Activity of the Escherichia Coli Ammonium Transporter AmtB. FASEB J. 2019, 33, 1989–1999. [Google Scholar] [CrossRef]
- Malla, S.; van der Helm, E.; Darbani, B.; Wieschalka, S.; Förster, J.; Borodina, I.; Sommer, M.O.A. A Novel Efficient L-Lysine Exporter Identified by Functional Metagenomics. Front. Microbiol. 2022, 13, 855736. [Google Scholar] [CrossRef]
- Sá-Correia, I.; Godinho, C.P. Exploring the Biological Function of Efflux Pumps for the Development of Superior Industrial Yeasts. Curr. Opin. Biotechnol. 2022, 74, 32–41. [Google Scholar] [CrossRef]
- Erian, A.M.; Egermeier, M.; Marx, H.; Sauer, M. Insights into the Glycerol Transport of Yarrowia Lipolytica. Yeast 2022, 39, 323–336. [Google Scholar] [CrossRef]
- Zelena, E.; Dunn, W.B.; Broadhurst, D.; Francis-McIntyre, S.; Carroll, K.M.; Begley, P.; O’Hagan, S.; Knowles, J.D.; Halsall, A.; Wilson, I.D.; et al. Development of a Robust and Repeatable UPLC-MS Method for the Long-Term Metabolomic Study of Human Serum. Anal. Chem. 2009, 81, 1357–1364. [Google Scholar] [CrossRef]
- Dunn, W.B.; Broadhurst, D.; Begley, P.; Zelena, E.; Francis-Mcintyre, S.; Anderson, N.; Brown, M.; Knowles, J.D.; Halsall, A.; Haselden, J.N.; et al. Procedures for Large-Scale Metabolic Profiling of Serum and Plasma Using Gas Chromatography and Liquid Chromatography Coupled to Mass Spectrometry. Nat. Protoc. 2011, 6, 1060–1083. [Google Scholar] [CrossRef] [PubMed]
- O’Hagan, S.; Kell, D.B. Consensus Rank Orderings of Molecular Fingerprints Illustrate the Most Genuine Similarities between Marketed Drugs and Small Endogenous Human Metabolites, but Highlight Exogenous Natural Products as the Most Important ‘Natural’ Drug Transporter Substrates. ADMET DMPK 2017, 5, 85–125. [Google Scholar] [CrossRef]
- Wright Muelas, M.; Roberts, I.; Mughal, F.; O’Hagan, S.; Day, P.J.; Kell, D.B. An Untargeted Metabolomics Strategy to Measure Differences in Metabolite Uptake and Excretion by Mammalian Cell Lines. Metabolomics 2020, 16, 107. [Google Scholar] [CrossRef] [PubMed]
- Chen, H.; Venkat, S.; Wilson, J.; McGuire, P.; Chang, A.L.; Gan, Q.; Fan, C. Genome-Wide Quantification of the Effect of Gene Overexpression on Escherichia Coli Growth. Genes 2018, 9, 414. [Google Scholar] [CrossRef]
- Baba, T.; Ara, T.; Hasegawa, M.; Takai, Y.; Okumura, Y.; Baba, M.; Datsenko, K.A.; Tomita, M.; Wanner, B.L.; Mori, H. Construction of Escherichia Coli K-12 in-Frame, Single-Gene Knockout Mutants: The Keio Collection. Mol. Syst. Biol. 2006, 2, 2006.0008. [Google Scholar] [CrossRef]
- Kell, D.B.; Brown, M.; Davey, H.M.; Dunn, W.B.; Spasic, I.; Oliver, S.G. Metabolic Footprinting and Systems Biology: The Medium Is the Message. Nat. Rev. Microbiol. 2005, 3, 557–565. [Google Scholar] [CrossRef]
- Allen, J.; Davey, H.M.; Broadhurst, D.; Heald, J.K.; Rowland, J.J.; Oliver, S.G.; Kell, D.B. High-Throughput Classification of Yeast Mutants for Functional Genomics Using Metabolic Footprinting. Nat. Biotechnol. 2003, 21, 692–696. [Google Scholar] [CrossRef]
- Saier, M.H.; Reddy, V.S.; Tsu, B.V.; Ahmed, M.S.; Li, C.; Moreno-Hagelsieb, G. The Transporter Classification Database (TCDB): Recent Advances. Nucleic Acids Res. 2016, 44, D372–D379. [Google Scholar] [CrossRef]
- Schymanski, E.L.; Jeon, J.; Gulde, R.; Fenner, K.; Ruff, M.; Singer, H.P.; Hollender, J. Identifying Small Molecules via High Resolution Mass Spectrometry: Communicating Confidence. Environ. Sci. Technol. 2014, 48, 2097–2098. [Google Scholar] [CrossRef] [PubMed]
- Conway, J.R.; Lex, A.; Gehlenborg, N. UpSetR: An R Package for the Visualization of Intersecting Sets and Their Properties. Bioinformatics 2017, 33, 2938–2940. [Google Scholar] [CrossRef] [PubMed]
- Lewinson, O.; Adler, J.; Sigal, N.; Bibi, E. Promiscuity in Multidrug Recognition and Transport: The Bacterial MFS Mdr Transporters. Mol. Microbiol. 2006, 61, 277–284. [Google Scholar] [CrossRef]
- Radi, M.S.; Munro, L.J.; Salcedo-Sora, J.E.; Kim, S.H.; Feist, A.M.; Kell, D.B. Understanding Functional Redundancy and Promiscuity of Multidrug Transporters in E. Coli under Lipophilic Cation Stress. Membranes 2022, 12, 1264. [Google Scholar] [CrossRef] [PubMed]
- McHugh, J.P.; Rodríguez-Quiñones, F.; Abdul-Tehrani, H.; Svistunenko, D.A.; Poole, R.K.; Cooper, C.E.; Andrews, S.C. Global Iron-Dependent Gene Regulation in Escherichia Coli. A New Mechanism for Iron Homeostasis. J. Biol. Chem. 2003, 278, 29478–29486. [Google Scholar] [CrossRef] [PubMed]
- Kobayashi, N.; Nishino, K.; Yamaguchi, A. Novel Macrolide-Specific ABC-Type Efflux Transporter in Escherichia Coli. J. Bacteriol. 2001, 183, 5639–5644. [Google Scholar] [CrossRef]
- Smith, H.E.; Blair, J.M.A. Redundancy in the Periplasmic Adaptor Proteins AcrA and AcrE Provides Resilience and an Ability to Export Substrates of Multidrug Efflux. J. Antimicrob. Chemother. 2014, 69, 982–987. [Google Scholar] [CrossRef]
- Wong, K.; Ma, J.; Rothnie, A.; Biggin, P.C.; Kerr, I.D. Towards Understanding Promiscuity in Multidrug Efflux Pumps. Trends Biochem. Sci. 2014, 39, 8–16. [Google Scholar] [CrossRef]
- Radi, M.S.; SalcedoSora, J.E.; Kim, S.H.; Sudarsan, S.; Sastry, A.V.; Kell, D.B.; Herrgård, M.J.; Feist, A.M. Membrane Transporter Identification and Modulation via Adaptive Laboratory Evolution. Metab. Eng. 2022, 72, 376–390. [Google Scholar] [CrossRef]
- Stanchev, L.D.; Møller-Hansen, I.; Lojko, P.; Rocha, C.; Borodina, I. Screening of Saccharomyces Cerevisiae Metabolite Transporters by 13C Isotope Substrate Labeling. Front. Microbiol. 2023, 14, 1286597. [Google Scholar] [CrossRef] [PubMed]
- Darbani, B.; Stovicek, V.; van der Hoek, S.A.; Borodina, I.; Darbani, B.; Stovicek, V.; van der Hoek, S.A.; Borodina, I. Engineering Energetically Efficient Transport of Dicarboxylic Acids in Yeast Saccharomyces Cerevisiae. Proc. Natl. Acad. Sci. USA 2019, 116, 19415–19420. [Google Scholar] [CrossRef] [PubMed]
- Shrivastava, A.D.; Swainston, N.; Samanta, S.; Roberts, I.; Muelas, M.W.; Kell, D.B. MassGenie: A Transformer-Based Deep Learning Method for Identifying Small Molecules from Their Mass Spectra. Biomolecules 2021, 11, 1793. [Google Scholar] [CrossRef] [PubMed]
- Sastry, A.V.; Gao, Y.; Szubin, R.; Hefner, Y.; Xu, S.; Kim, D.; Choudhary, K.S.; Yang, L.; King, Z.A.; Palsson, B.O. The Escherichia Coli Transcriptome Mostly Consists of Independently Regulated Modules. Nat. Commun. 2019, 10, 5536. [Google Scholar] [CrossRef]
Figure 1.
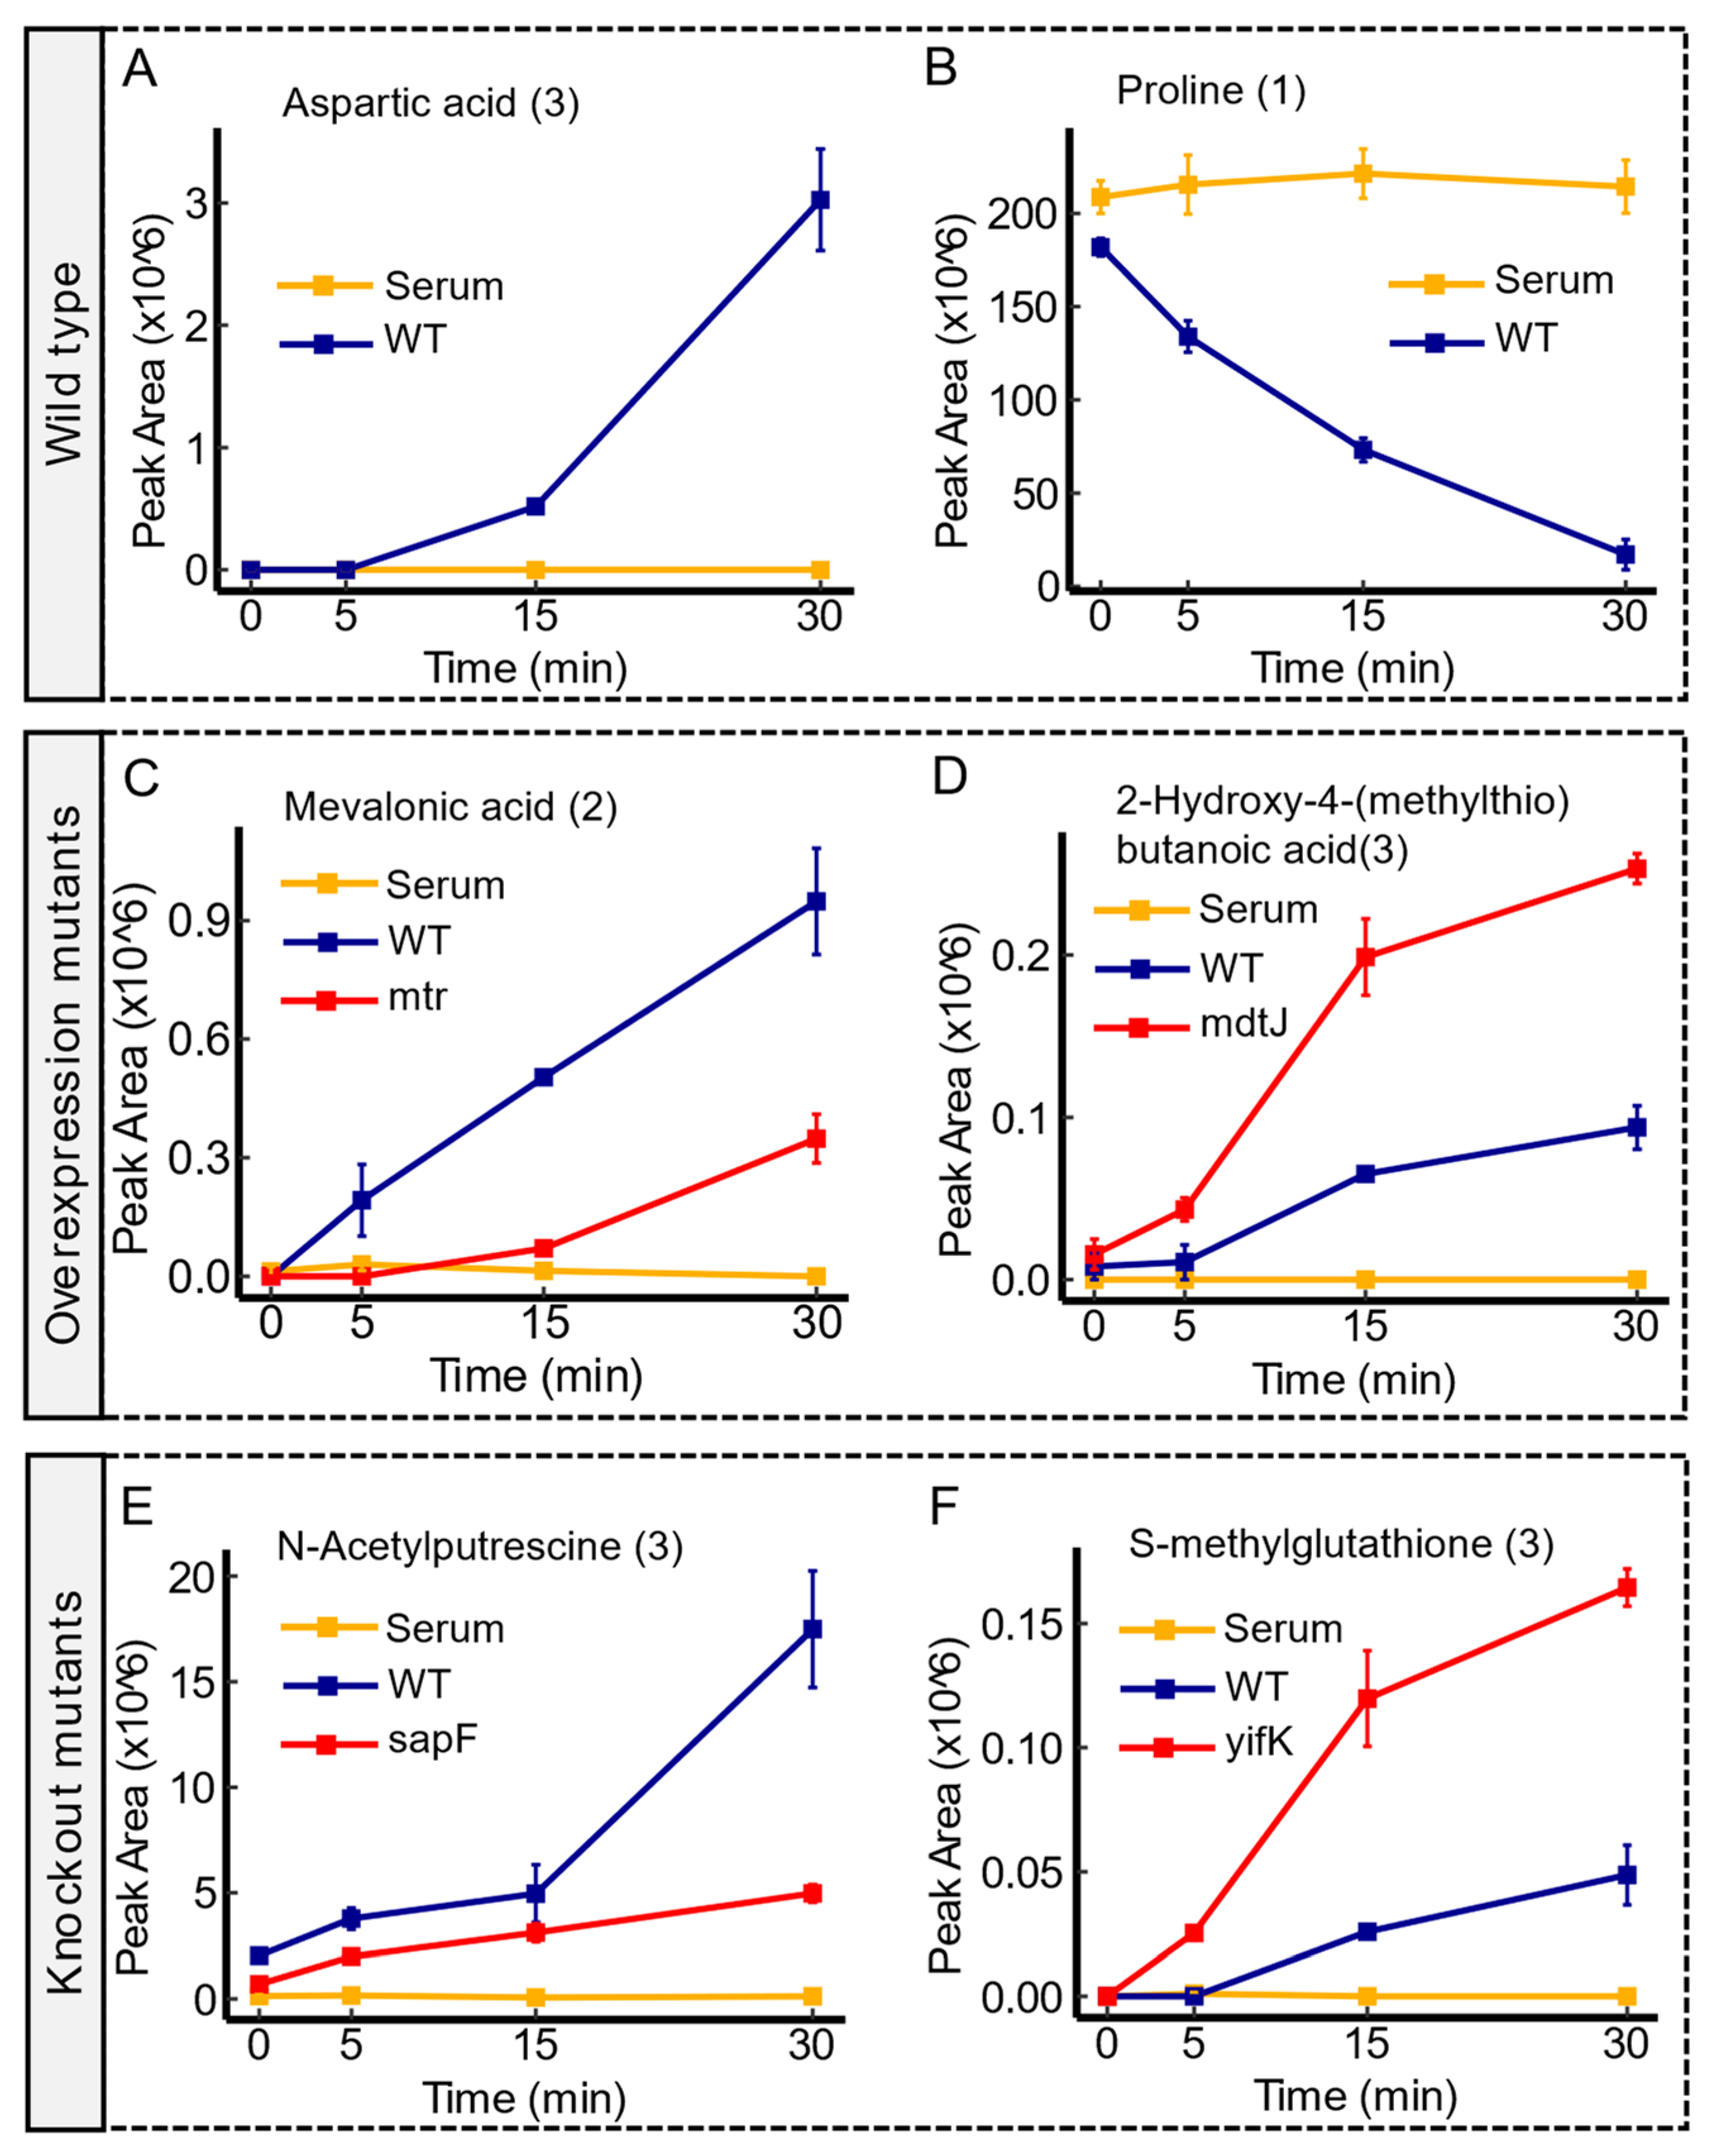
Examples of time-course analysis of transport dynamics in the wild type and transporter mutants. Panel (A,B) showcase an export of aspartic acid, and an import of proline, respectively, in the WT. Panel (C,D) outline the transport profiles of mevalonic acid and 2-Hydroxy-4-(methylthio)butanoic acid in mtr and mdtJ overexpression mutants, respectively. The dynamic alteration, characterized by an enhanced depletion (uptake) of mevalonic acid in mtr mutants compared to the wild type, suggests an increased uptake associated with the enhanced expression of mtr permease. However, the observed trend in peak area between the mdtJ mutant and the wild type suggests an enhanced export of 2-Hydroxy-4-(methylthio)butanoic acid under overexpression of mdtJ. Panel (E,F) delineate the transport profiles of N-acetylputrescine and S-methylglutathione in sapF and yifK knockout mutants, respectively. Compared to the wild type, the observed trend in sapF mutant shows an impaired export of N-acetylputrescine. Conversely, the trend of the peak area in yifK mutant versus the WT implies an impaired import function of S-methylglutathione. Serum controls are represented in yellow, WT in blue, and transporter mutants in red. Confidence levels for compound identification are indicated in brackets. Error bars denote standard errors, n = 3.
Figure 1.
Examples of time-course analysis of transport dynamics in the wild type and transporter mutants. Panel (A,B) showcase an export of aspartic acid, and an import of proline, respectively, in the WT. Panel (C,D) outline the transport profiles of mevalonic acid and 2-Hydroxy-4-(methylthio)butanoic acid in mtr and mdtJ overexpression mutants, respectively. The dynamic alteration, characterized by an enhanced depletion (uptake) of mevalonic acid in mtr mutants compared to the wild type, suggests an increased uptake associated with the enhanced expression of mtr permease. However, the observed trend in peak area between the mdtJ mutant and the wild type suggests an enhanced export of 2-Hydroxy-4-(methylthio)butanoic acid under overexpression of mdtJ. Panel (E,F) delineate the transport profiles of N-acetylputrescine and S-methylglutathione in sapF and yifK knockout mutants, respectively. Compared to the wild type, the observed trend in sapF mutant shows an impaired export of N-acetylputrescine. Conversely, the trend of the peak area in yifK mutant versus the WT implies an impaired import function of S-methylglutathione. Serum controls are represented in yellow, WT in blue, and transporter mutants in red. Confidence levels for compound identification are indicated in brackets. Error bars denote standard errors, n = 3.

Figure 2.
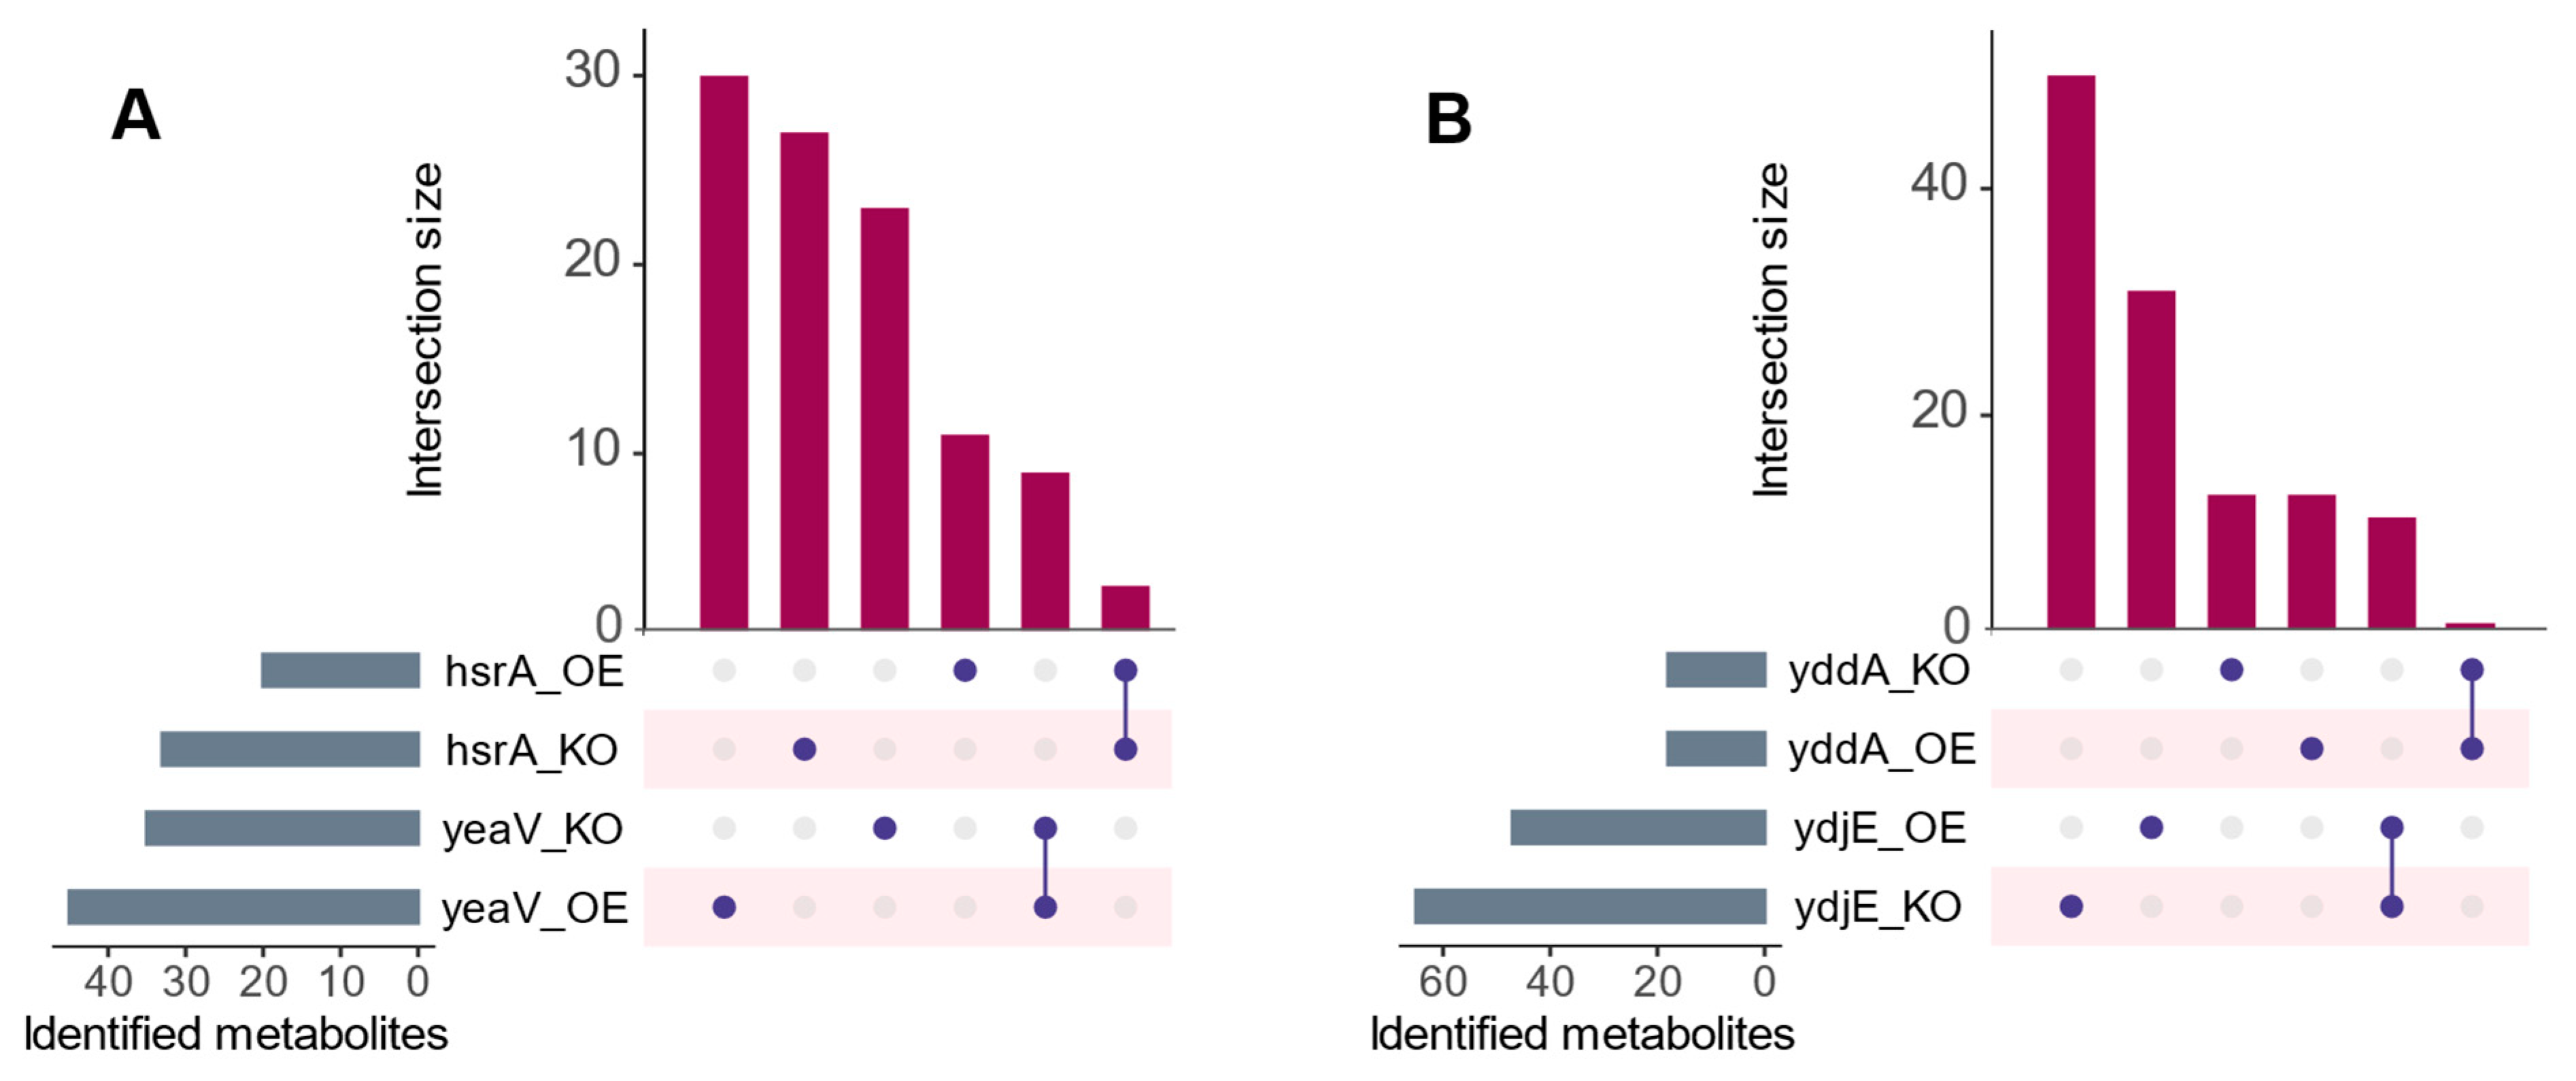
UpsetR [44] plot showing metabolites that are shared and unique across different examples of mutant pairs. (A) shows hsrA and yeaV, and (B) shows yddA and ydjE mutant pairs. Each horizontal bar represents a specific set of metabolites identified in each respective mutant, while the vertical bars show the size of intersections between mutant pairs (i.e., the number of metabolites that are common to both mutants being compared). Depicted is the possible convergence and divergence of metabolites that showed differential transport relevant to the parental strain. Despite the presence of converged instances between mutant contrasts, mutant-dependent metabolite variations were more prevalent. OE abbreviates overexpression mutants and KO abbreviates knockout mutants.
Figure 2.
UpsetR [44] plot showing metabolites that are shared and unique across different examples of mutant pairs. (A) shows hsrA and yeaV, and (B) shows yddA and ydjE mutant pairs. Each horizontal bar represents a specific set of metabolites identified in each respective mutant, while the vertical bars show the size of intersections between mutant pairs (i.e., the number of metabolites that are common to both mutants being compared). Depicted is the possible convergence and divergence of metabolites that showed differential transport relevant to the parental strain. Despite the presence of converged instances between mutant contrasts, mutant-dependent metabolite variations were more prevalent. OE abbreviates overexpression mutants and KO abbreviates knockout mutants.

Figure 3.
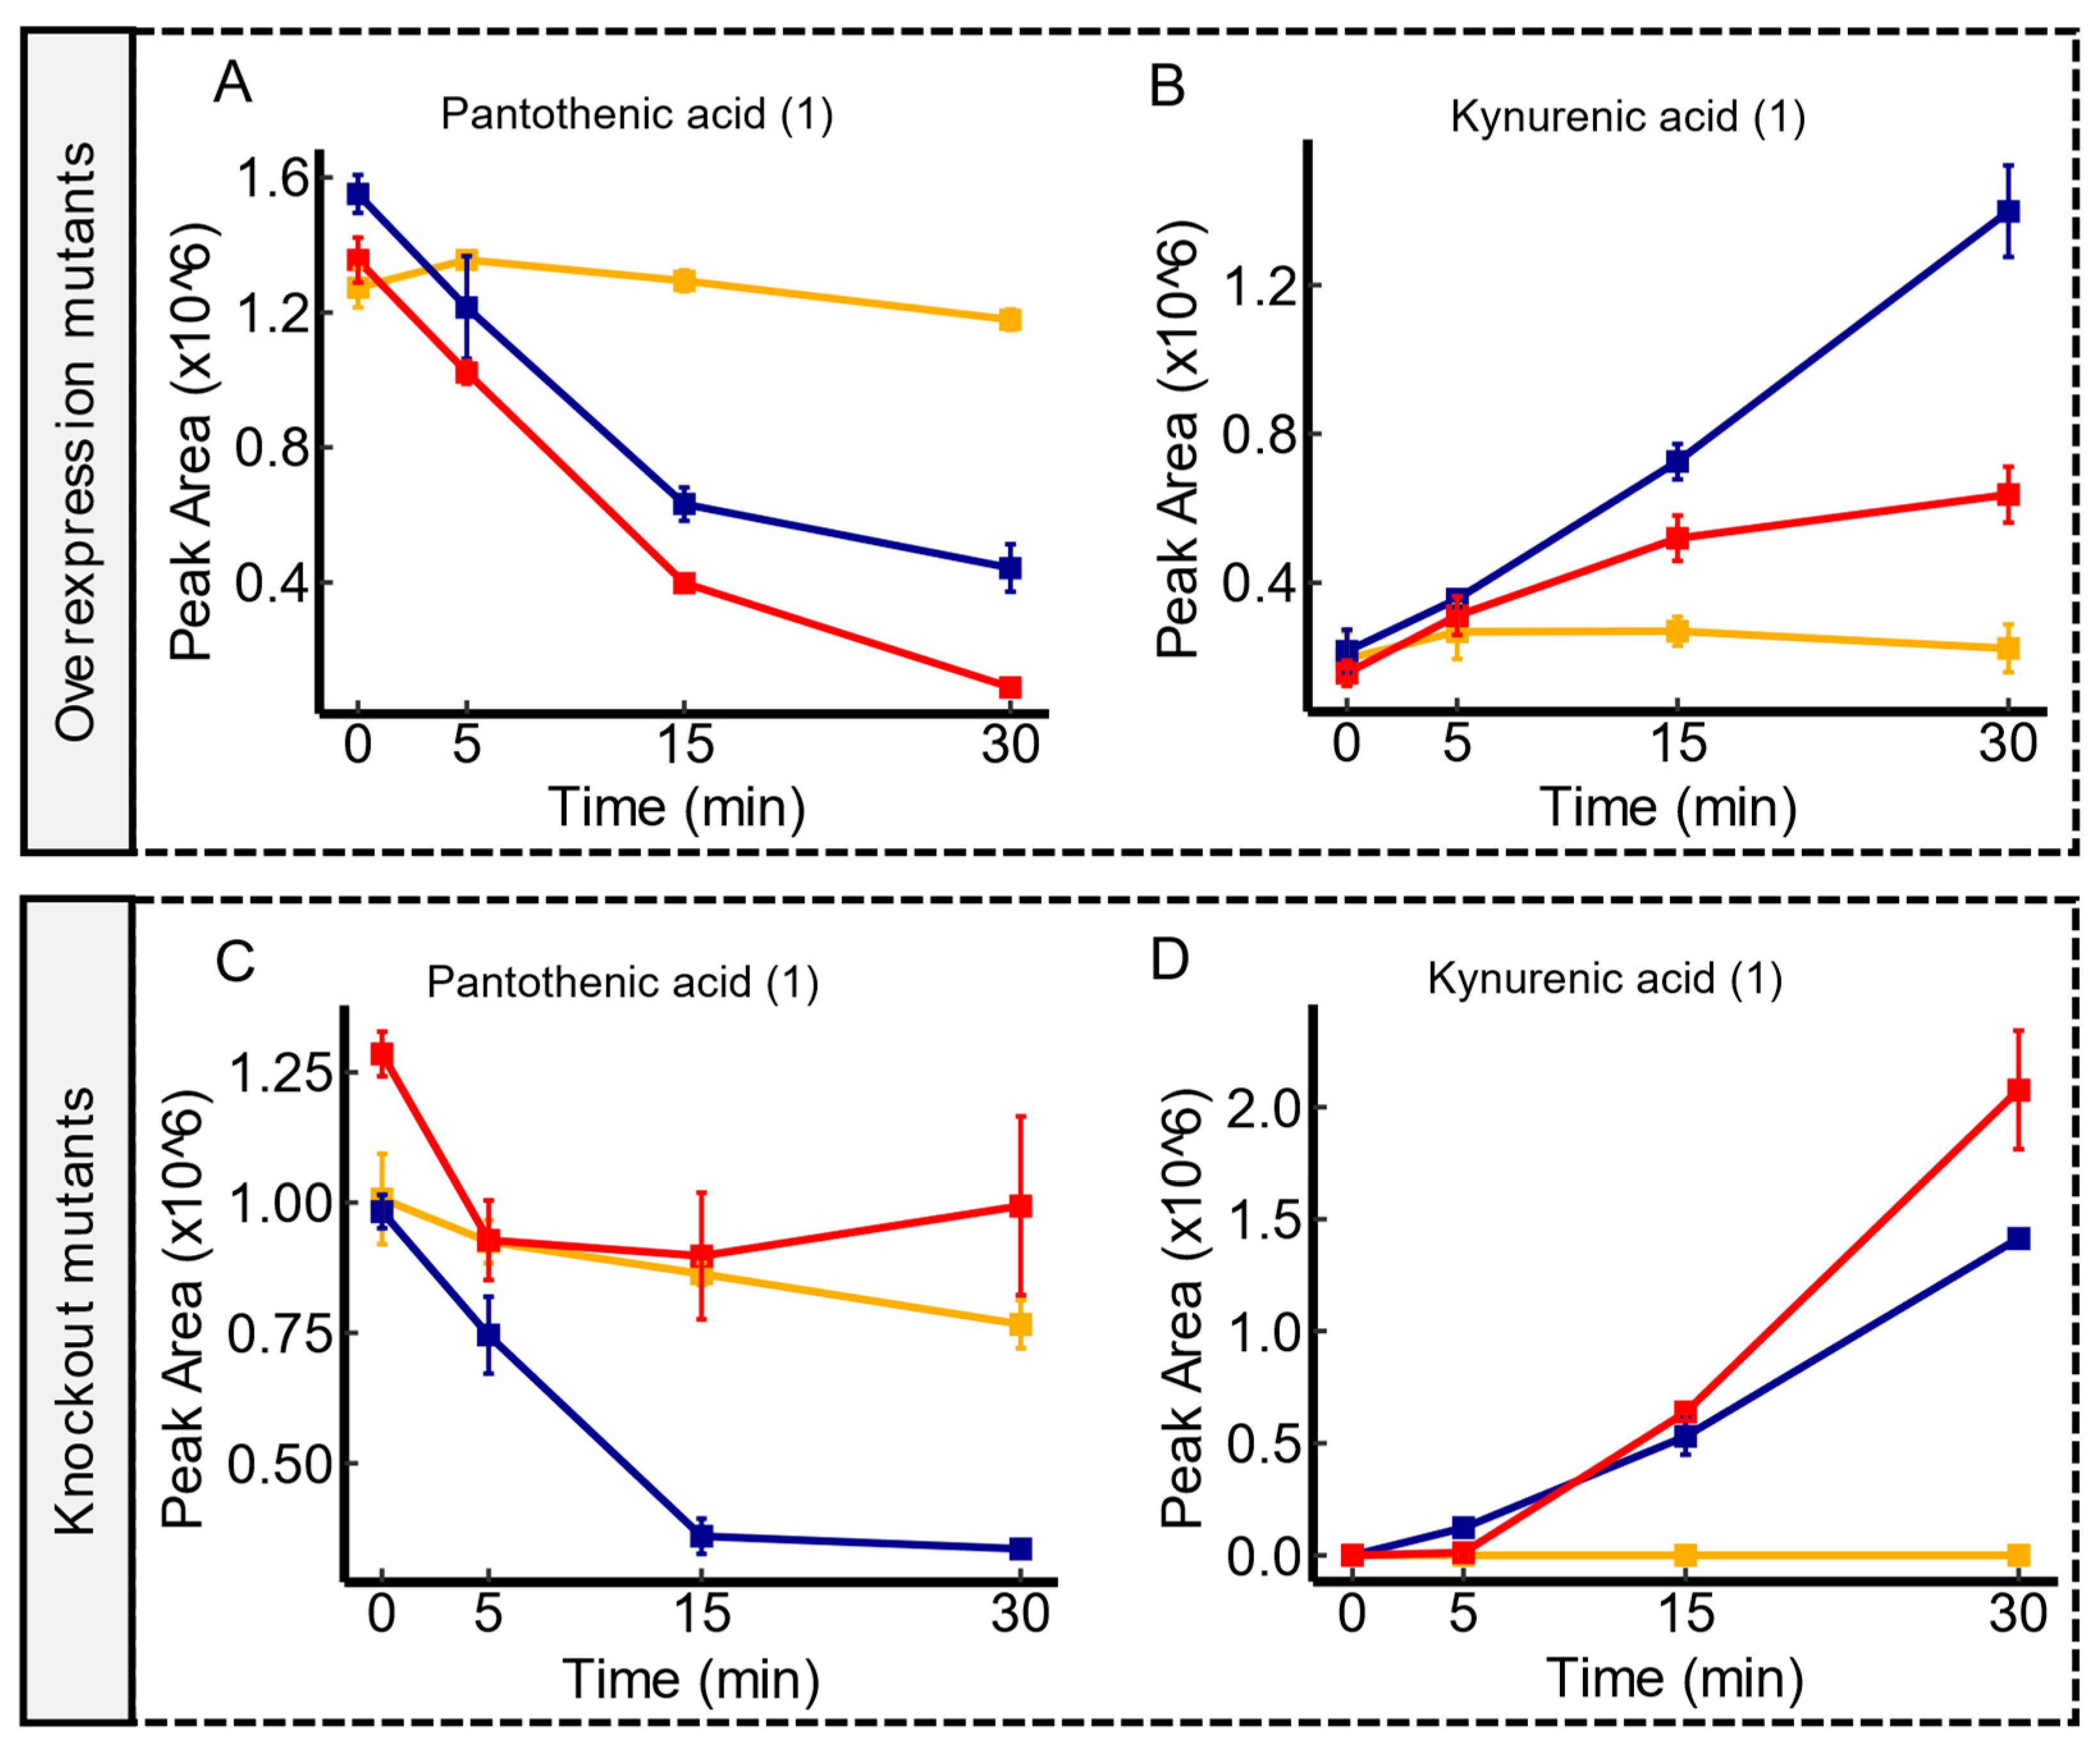
Temporal Transport Dynamics of pantothenic acid and kynurenic acid in yeaV mutant contrasts. Panel (A,B) illustrate a pronounced depletion of both metabolites in yeaV overexpression mutants in comparison to the WT. In contrast, the wild type displayed a more substantial depletion of both metabolites in comparison to yeaV knockout mutants as shown in panel (C,D). Serum controls are represented in yellow, WT in blue, and transporter mutants in red. Confidence levels for compound identification are indicated in brackets. Error bars denote standard errors, n = 3.
Figure 3.
Temporal Transport Dynamics of pantothenic acid and kynurenic acid in yeaV mutant contrasts. Panel (A,B) illustrate a pronounced depletion of both metabolites in yeaV overexpression mutants in comparison to the WT. In contrast, the wild type displayed a more substantial depletion of both metabolites in comparison to yeaV knockout mutants as shown in panel (C,D). Serum controls are represented in yellow, WT in blue, and transporter mutants in red. Confidence levels for compound identification are indicated in brackets. Error bars denote standard errors, n = 3.

Figure 4.
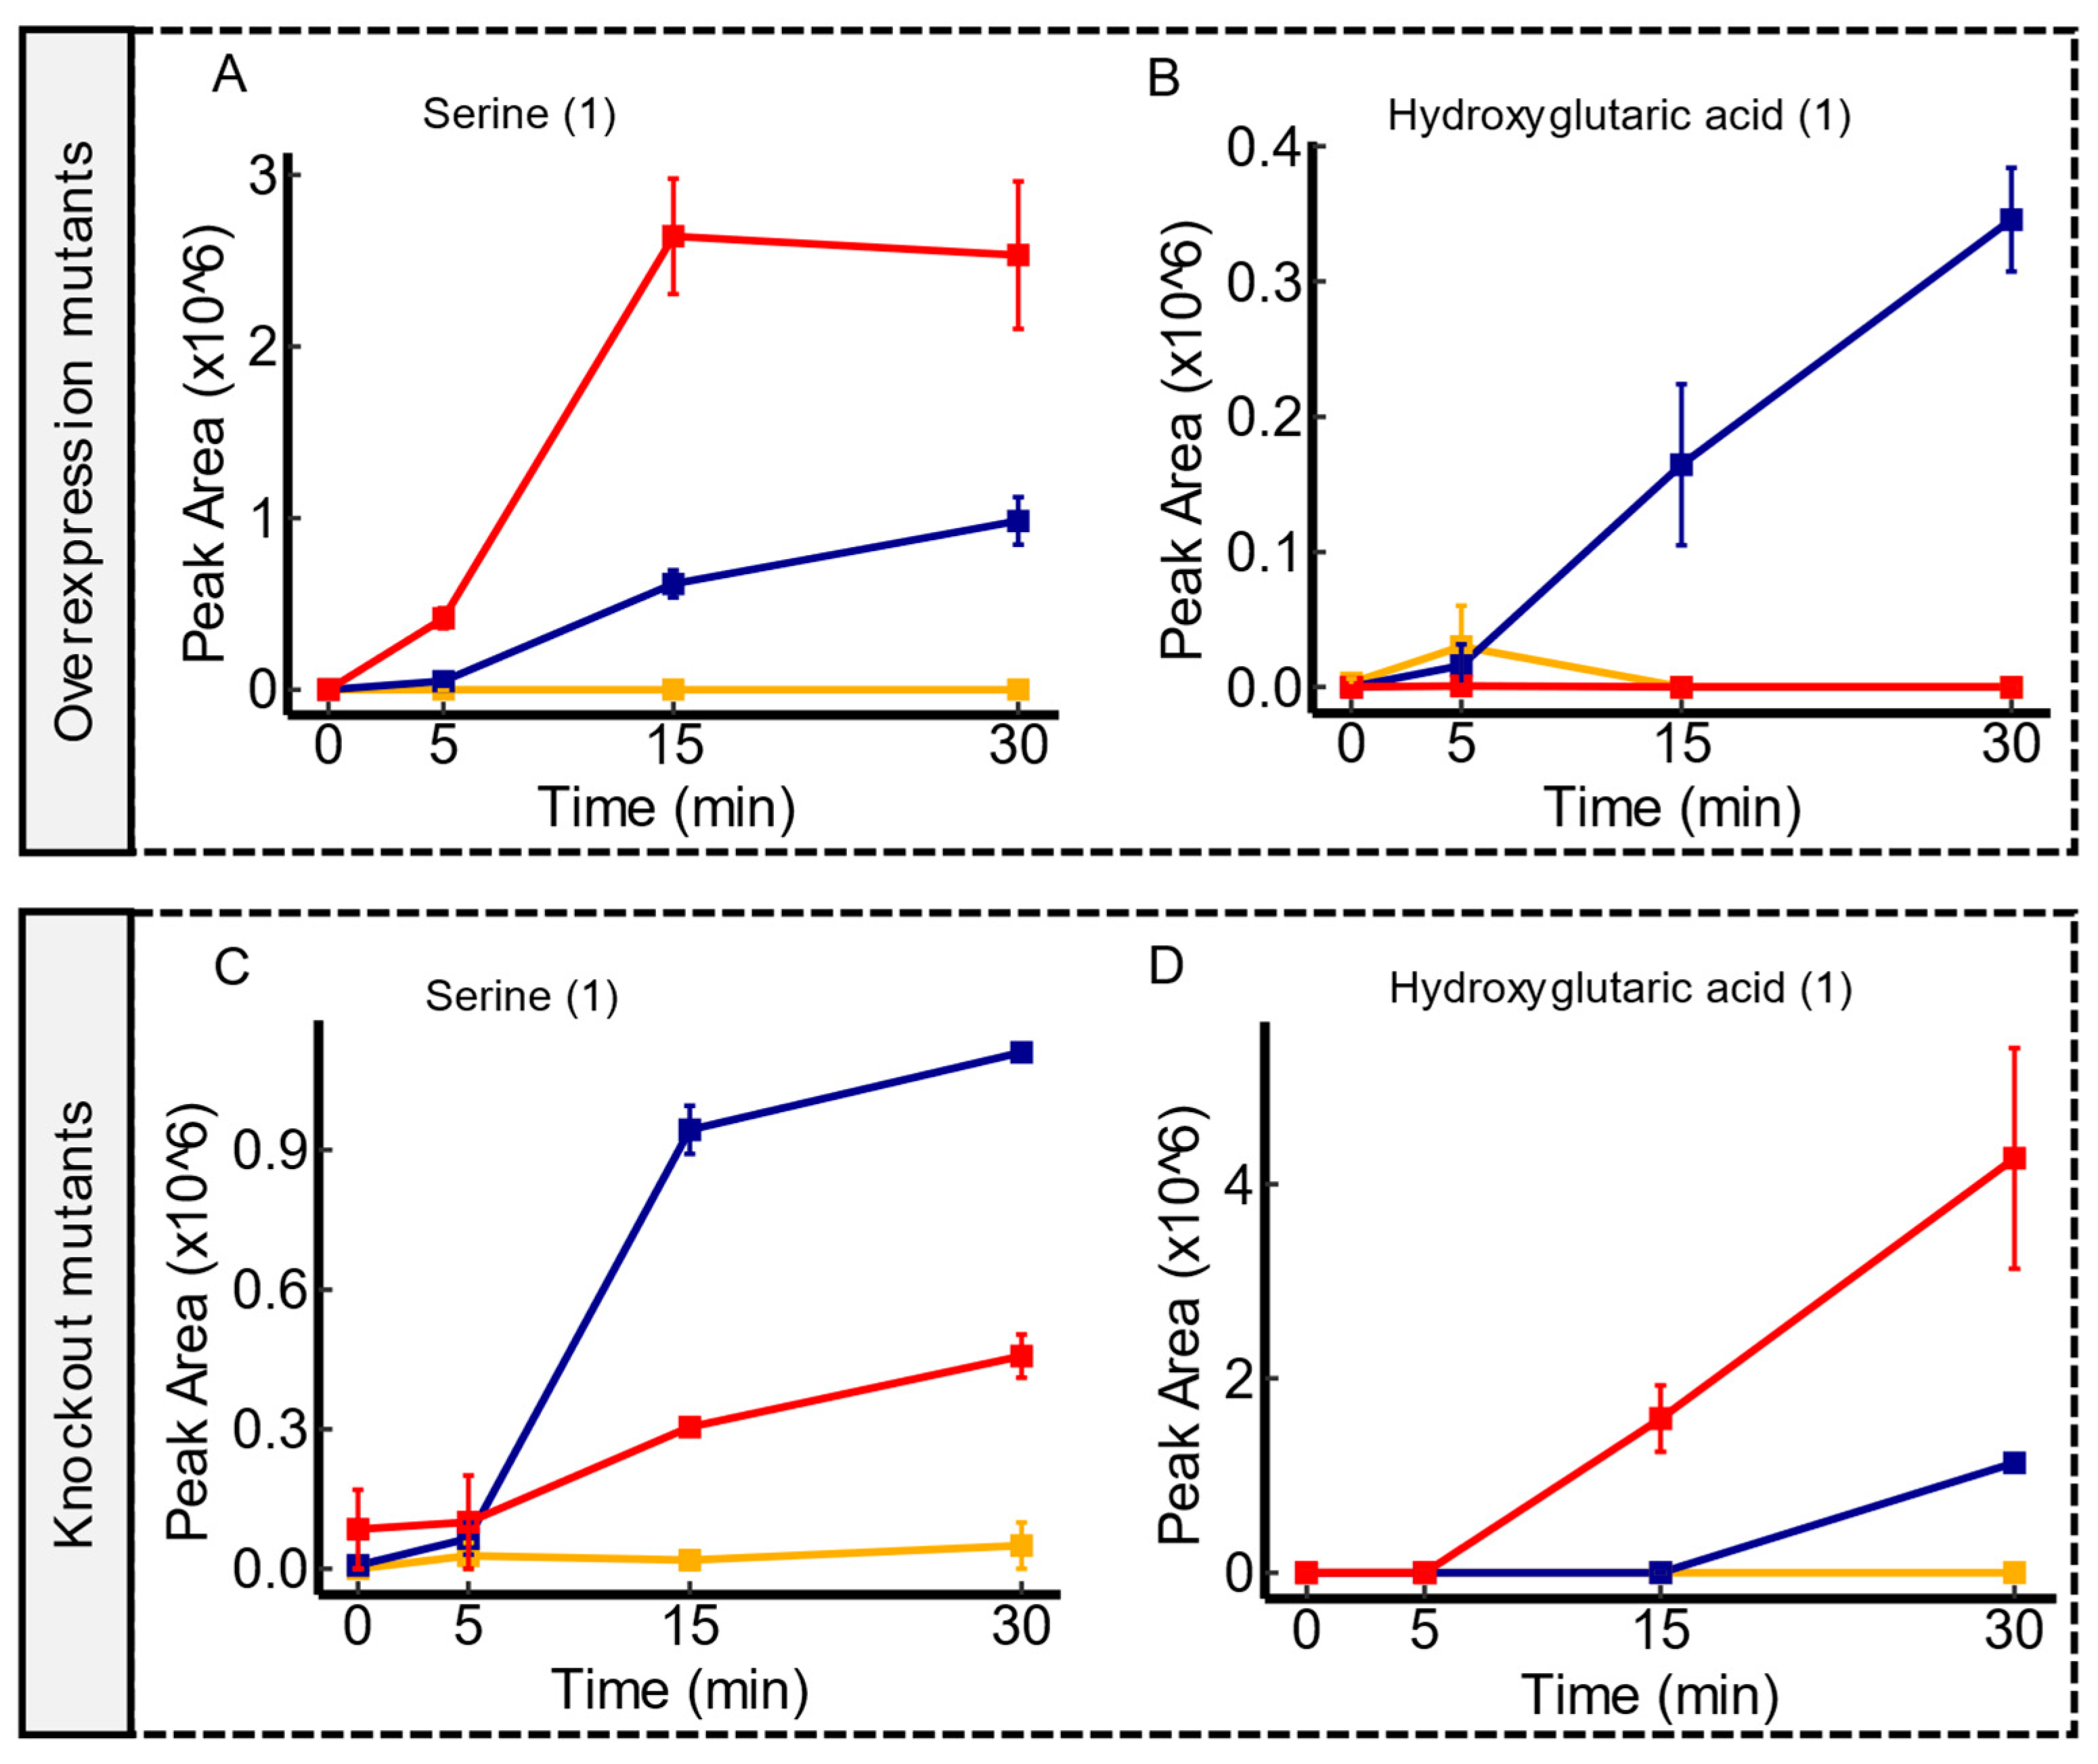
Time course illustrations of changes in serine and hydroxyglutaric acid in hsrA mutant comparisons. Compared to the WT, hsrA overexpression mutants displayed an enhanced extrusion of serine compared to the WT, as shown in panel (A). However, hsrA knockout mutants showed an impaired excretion of serine, as shown in panel (C). Panel (B) demonstrates a near depletion of hydroxyglutaric acid in hsrA overexpression mutants in comparison to the WT, while panel (D) displays the impaired uptake of this molecule in hsrA knockout mutants. Serum controls are represented in yellow, WT in blue, and transporter mutants in red. Confidence levels for compound identification are indicated in brackets. Error bars denote standard errors, n = 3.
Figure 4.
Time course illustrations of changes in serine and hydroxyglutaric acid in hsrA mutant comparisons. Compared to the WT, hsrA overexpression mutants displayed an enhanced extrusion of serine compared to the WT, as shown in panel (A). However, hsrA knockout mutants showed an impaired excretion of serine, as shown in panel (C). Panel (B) demonstrates a near depletion of hydroxyglutaric acid in hsrA overexpression mutants in comparison to the WT, while panel (D) displays the impaired uptake of this molecule in hsrA knockout mutants. Serum controls are represented in yellow, WT in blue, and transporter mutants in red. Confidence levels for compound identification are indicated in brackets. Error bars denote standard errors, n = 3.

Figure 5.
Time-course illustrations of changes in acetophenone and 3-phenyllactic acid by the ydjE mutant contrasts. Compared to the WT, ydjE overexpression mutants displayed an enhanced extrusion of acetophenone and 3-phenyllactic acid, as shown in panel (A,B), respectively. However, ydjE knockout mutants showed an impaired excretion of acetophenone and 3-phenyllactic acid in comparison to the WT, as shown in panel (C,D), respectively. Serum controls are represented in yellow, WT in blue, and transporter mutants in red. Confidence levels for compound identification are indicated in brackets. Error bars denote standard errors, n = 3.

Figure 6.
Time course illustrations of changes in several metabolites associated with yddA expression. Panel (A,B) represents the uptake pattern of proline in yddA overexpression and knockout mutants, respectively, in comparison to the WT. Panels (C–F) represent metabolite variations explicitly associated with yddA overexpression mutants, and depict a more efficient depletion patterns of the respective metabolites in comparison to the WT. Serum controls are represented in yellow, WT in blue, and transporter mutants in red. Confidence levels for compound identification are indicated in brackets. Error bars denote standard errors, n = 3.


Table 1.
A list of transporters selected for evaluation. Family and substrate information is derived from the Transporter Classification Database [42] (accessible at http://tcdb.org, accessed on 26 February 2024).
Table 1.
A list of transporters selected for evaluation. Family and substrate information is derived from the Transporter Classification Database [42] (accessible at http://tcdb.org, accessed on 26 February 2024).
| Transporter/TC# a | Family | Previously Identified Substrates |
|---|---|---|
| yddG/2.A.7.17.2 | Aromatic Amino Acid/Paraquat Exporter (ArAA/P-E) | Aromatic amino acids |
| Mtr/2.A.42.1.2 | The Hydroxy/Aromatic Amino Acid Permease (HAAAP) | Tryptophan |
| ybbW/2.A.39.3.8 | Nucleobase:Cation Symporter-1 (NCS1) | Allantoin |
| ynfM/2.A.1.36.1 | Acriflavin-sensitivity (YnfM) Family | Arabinose |
| uraA/2.A.40.1.1 | Nucleobase/Ascorbate Transporter (NAT) or Nucleobase:Cation Symporter-2 (NCS2) | Uracil |
| sapF/3.A.1.5.42 | Peptide/Opine/Nickel Uptake Transporter (PepT) | Putrescine |
| yeeE(tsuA)/9.B.102.1.2 | The YedE/YeeE (YeeE) | Thiosulfate |
| yifK/2.A.3.1.15 | Amino Acid Transporter (AAT) | Serine and threonine |
| mdtJ/2.A.7.1.9 | Small multidrug resistance (SMR) | Spermidine, SDS b, deoxycholate |
| yojI/3.A.1.113.3 | The Peptide-3 Exporter (Pep3E) | Microcin |
| ydfJ/2.A.1.6.9 | Metabolite:H+ Symporter (MHS) | K+ * |
| ydhK/2.A.85.1.6 | The Aromatic Acid Exporter (ArAE) | Uncharacterized |
| yeaV/2.A.15.2.3 | The Betaine/Carnitine/Choline Transporter (BCCT) Family | Uncharacterized |
| yfdV/2.A.69.3.5 | Auxin Efflux Carrier (AEC) | Uncharacterized |
| yfdC/1.A.16.4.1 | Formate-Nitrite Transporter (FNT) | Uncharacterized |
| rarD/2.A.7.7.2 | Chloramphenicol-Sensitivity Protein | Uncharacterized |
| hsrA/2.A.1.3.51 | Drug:H+ Antiporter-2 (14 Spanner) (DHA2) | Uncharacterized |
| yfcJ/2.A.1.46.6 | Uncharacterized Major Facilitator-5 (UMF5) | Uncharacterized |
| ydjX/9.B.27.1.1 | Death Effector Domain A (DedA) | Uncharacterized |
| dcuD/2.A.61.1.2 | The C4-dicarboxylate Uptake C (DcuC) Family | Uncharacterized |
| mdlA/3.A.1.106.13 | Lipid Exporter (LipidE) Family | Uncharacterized |
| ydjE/2.A.1.1.92 | Sugar Porter (SP) | Uncharacterized |
| yddA/3.A.1.203.11 | The Peroxysomal Fatty Acyl CoA Transporter (P-FAT) | Uncharacterized |
| ygiS/3.A.1.5.41 | The ATP-binding cassette superfamily | Uncharacterized |
| yiaV/8.A.1.1.4 | The Membrane Fusion Protein (MFP) Family | Uncharacterized |
| yidE/2.A.81.1.5 | Aspartate:Alanine Exchanger (AAEx) Family | Uncharacterized |
a Transporter Classification Database accession number, b sodium dodecyl sulfate, * Functions as an ion channel.
Table 2.
Overview of LC-MS/MS results of serum QC samples obtained following preprocessing using CD3.1.
Table 2.
Overview of LC-MS/MS results of serum QC samples obtained following preprocessing using CD3.1.
| ESI+ | % All Compounds | ESI− | % All Compounds | |
|---|---|---|---|---|
| Features Compounds Unique Compounds | 531,376 | 135,776 | ||
| 9406 | 4092 | |||
| 3671 | 39% | 1632 | 40% | |
| MS2 No MS2 | 5607 | 60% | 3287 | 80% |
| 3779 | 40% | 805 | 20% | |
| MS2 Preferred Ion | 5305 | 56% | 3213 | 79% |
| MS2 Other Ion | 302 | 3% | 74 | 2% |
| Level 1 (Match to reference standard) * | 16 | 0.2% | 67 | 2% |
| Level 2 (Probable structure, mzCloud > 70%) * Level 3 (Tentative Candidate, match to predicted composition) * | 461 | 5% | 70 | 2% |
| 7062 | 75% | 2520 | 62% | |
| Level 4 (Molecular formula) * | 504 | 5% | 251 | 6% |
| Level 5 (Mass) * | 1363 | 14% | 1184 | 29% |
* Identification levels are based on criteria described by Schymanski et al. [43].
Disclaimer/Publisher’s Note: The statements, opinions and data contained in all publications are solely those of the individual author(s) and contributor(s) and not of MDPI and/or the editor(s). MDPI and/or the editor(s) disclaim responsibility for any injury to people or property resulting from any ideas, methods, instructions or products referred to in the content. |
© 2024 by the authors. Licensee MDPI, Basel, Switzerland. This article is an open access article distributed under the terms and conditions of the Creative Commons Attribution (CC BY) license (https://creativecommons.org/licenses/by/4.0/).
Share and Cite
MDPI and ACS Style
Radi, M.S.; Munro, L.J.; Rago, D.; Kell, D.B. An Untargeted Metabolomics Strategy to Identify Substrates of Known and Orphan E. coli Transporters. Membranes 2024, 14, 70. https://0-doi-org.brum.beds.ac.uk/10.3390/membranes14030070
AMA Style
Radi MS, Munro LJ, Rago D, Kell DB. An Untargeted Metabolomics Strategy to Identify Substrates of Known and Orphan E. coli Transporters. Membranes. 2024; 14(3):70. https://0-doi-org.brum.beds.ac.uk/10.3390/membranes14030070
Chicago/Turabian StyleRadi, Mohammad S., Lachlan J. Munro, Daniela Rago, and Douglas B. Kell. 2024. "An Untargeted Metabolomics Strategy to Identify Substrates of Known and Orphan E. coli Transporters" Membranes 14, no. 3: 70. https://0-doi-org.brum.beds.ac.uk/10.3390/membranes14030070
Note that from the first issue of 2016, this journal uses article numbers instead of page numbers. See further details here.