Article

Finite Element Analysis of Ball Burnishing on Ball-End Milled Surfaces Considering Their Original Topology and Residual Stress

by
Cyrus Amini
1,
Ramón Jerez-Mesa
2,*,
J. Antonio Travieso-Rodriguez
3,
Jordi Llumà
4 and
Aida Estevez-Urra
5
1
Mechanical Engineering Department, University of Tabriz, 29 Bahman Blvd 5138855471, Tabriz 51368, Iran
2
Department of Engineering, Faculty of Science and Technology, Universitat de Vic · Universitat Central de Catalunya, C. de la Laura 13, 08500 Vic, Spain
3
Department of Mechanical Engineering, Universitat Politècnica de Catalunya, Av. Eduard Maristany 10–14, 08019 Barcelona, Spain
4
Department of Science and Material Engineering, Universitat Politècnica de Catalunya, Av. Eduard Maristany 10–14, 08019 Barcelona, Spain
5
Department of Mechanical and Manufacturing Engineering, Universidad de Sevilla, C. de los Descubirmientos s/n, 41092 Sevilla, Spain
*
Author to whom correspondence should be addressed.
Submission received: 20 April 2020 / Revised: 7 May 2020 / Accepted: 12 May 2020 / Published: 14 May 2020
(This article belongs to the Special Issue State-of-Art within 3D Printing and Advanced Machining Processes)

Abstract

:
Ball burnishing is a superfinishing operation whose objective is the enhancement of surface integrity of previously machined surfaces, hence its appropriateness to complement chip removal processes at the end of a production line. As a complex process involving plastic deformation, friction and three-dimensional interaction between solids, numerical solutions and finite element models have typically included a considerable amount of simplifications that represent the process partially. The aim of this paper is to develop a 3D numerical finite element model of the ball burnishing process including in the target workpiece real surface integrity descriptors resulting from a ball-end milled AISI 1038 surface. Specifically, its periodical topological features are used to generate the surface geometry and the residual stress tensor measured on a real workpiece is embedded in the target surface. Secondly, different models varying the effect of the coefficient of friction and the direction of application of burnishing passes with regards to the original milling direction are calculated. Results show that the resulting topology and residual stresses are independent of the burnishing direction. However, it is evident that the model outputs are highly influenced by the value of the coefficient of friction. A value of 0.15 should be implemented in order to obtain representative results through finite element models.

1. Introduction

Ball burnishing is a method applied to providing residual stress at the surface layers of engineering materials, as well as reducing the scale of the roughness of machined surfaces. It has a special role in the industry as a means of enhancing surface quality and fatigue resistance [1]. In ball burnishing, a force whose direction is normal to the machined surface is applied by a ball embedded in the tool in order to generate high local stresses. The result is based on inducing enough amount of plastic deformation to succeed in deforming the surface irregularities [2]. This technique is known for providing minimum relaxation and cold work in comparison to other methods for surface improvement [3]. Furthermore, it is an easily automatable process, because it can be executed through the same machine where the previous machining process has been performed [4]. The process also has some drawbacks, like the fact that a bad planification of the process can lead to unburnished parts of the material [5]. Using a ball as indenter can also be a focus of rise in improductivity time, as it allows the user to apply more pressure, but it also experiences higher wear after several cycles, and a change of radius of rounding shall be observed, which demands the substitution of the ball [6].
The transverse pitch of the classical burnishing paths (zig-zag or spiral), which is the space between a pair of guide lines of the path, causes places without burnishing in addition to marks due to the transverse movement of the ball. In other words, in the case of classical path, the transverse movement of the ball acts as transverse roughness, which can be considered as the main disadvantage of these paths. To overcome this disadvantage, a new trajectory of burnishing tool is created to achieve a widespread multidirectional burnishing process of the surface.
The advances on the ball burnishing technology are extensively based on experimental testing, focusing on process parameter optimization or result evaluation [7,8,9]. Many empirical works have been developed to determine the effects of different process parameters (burnishing force, number of passes, feed or ball diameter) to obtain the best results, in terms of roughness [10], hardness [11], residual stress [12] or fatigue lifespan. However, theoretical and numerical models dealing with the process are scarce in the bibliography. Furthermore, these models have been developed by assuming numerous hypothesis to simplify its implementation, including friction, which is one of the main drivers of plastic deformation [13]. Therefore they cannot fully account for the actual process dynamics and kinematics. For instance, Yen et al. (2005) [14] proposed a 2D model based on plane strain for the prediction of residual stress on a cylindrical material, neglecting both the friction phenomena and the original residual stress due to the previous machining process. The control of the burnishing force was mastered by controlling the depth of penetration of the ball inside the workpiece. Sartkulvanich et al. (2007) [15] proposed a finite element model to study the burnishing process which also neglected friction. Mohammadi et al. (2014) [16] developed a finite element model based on the Johnson-Cook plasticity theory without considering the initial roughness to investigate the effect of main parameters in ball burnishing.The theoretical results were afterwards combined with design of experiments and the response surface method to obtain the optimum set of parameters.
Contrary to the references included in the previous paragraph, other authors have included the modelling of the original surface roughness in their works. Bougharrio et al. (2010) [17] developed a 2D simulation that was restricted to a single pass of a rigid ball on a cylindrical workpiece. A real roughness pattern on the target surface was implemented and, regarding the symmetry of the problem and assuming plane strain, the calculations were simplified by including only 1/4 of the workpiece and 1/8 of the burnishing ball in the simulation. The obtained results showed an improvement at the surface roughness and compressive residual stress. However, this model could not predict the magnitude of the final roughness. Rao et al. (2011) [18] made a 2D model including a triangle on the surface as one peak of roughness in order to investigate variation of roughness due to variation of force burnishing. Maximov et al. (2012) [19] developed a 2D model including roughness and friction in order to estimate residual stress. In their works, the spherical motion was modelled through simultaneous rolling and translation, so that the size of the FEM problem was decreased. Other authors considered the initial texture as a result of a semicircular profile pattern [20], or a triangular one [2]. Balland et al. (2013) [2] modelled a roughness pattern by successive triangles deployed on a cylindrical workpiece and evaluated the final residual stress. They assumed that the machining effects, i.e., the residual stress due to turning before burnishing were negligible. Rodriguez et al. (2012) [20] prepared a 2D model in ANSYS based on the approach used by Sartkulvanich in order to quantify the final residual stress. A semicircular periodic pattern was implemented as roughness profile. Sayahi et al. (2013) [21] provided a 3D simulation in ABAQUS to estimate the residual stress without roughness. The model was based on displacement control and maximum penetration that corresponded to the force burnishing at every pass, so that the process was simulated to optimize the burnishing parameters in order to achieve maximum depth with compressive residual stress. Saldaña et al. (2015) [22] used a special subroutine in ANSYS for providing random distribution of roughness on bars, considering a bilinear material for simplification. In more recent models, the modelling of ball burnishing has been focused on the ultrasonic-assisted process [23,24]. However, the computation time required to introduce this oscillatory movement of the ball does not help to introduce friction as a variable of study, and, therefore, still explore a side of the process complementary to the work presented here.
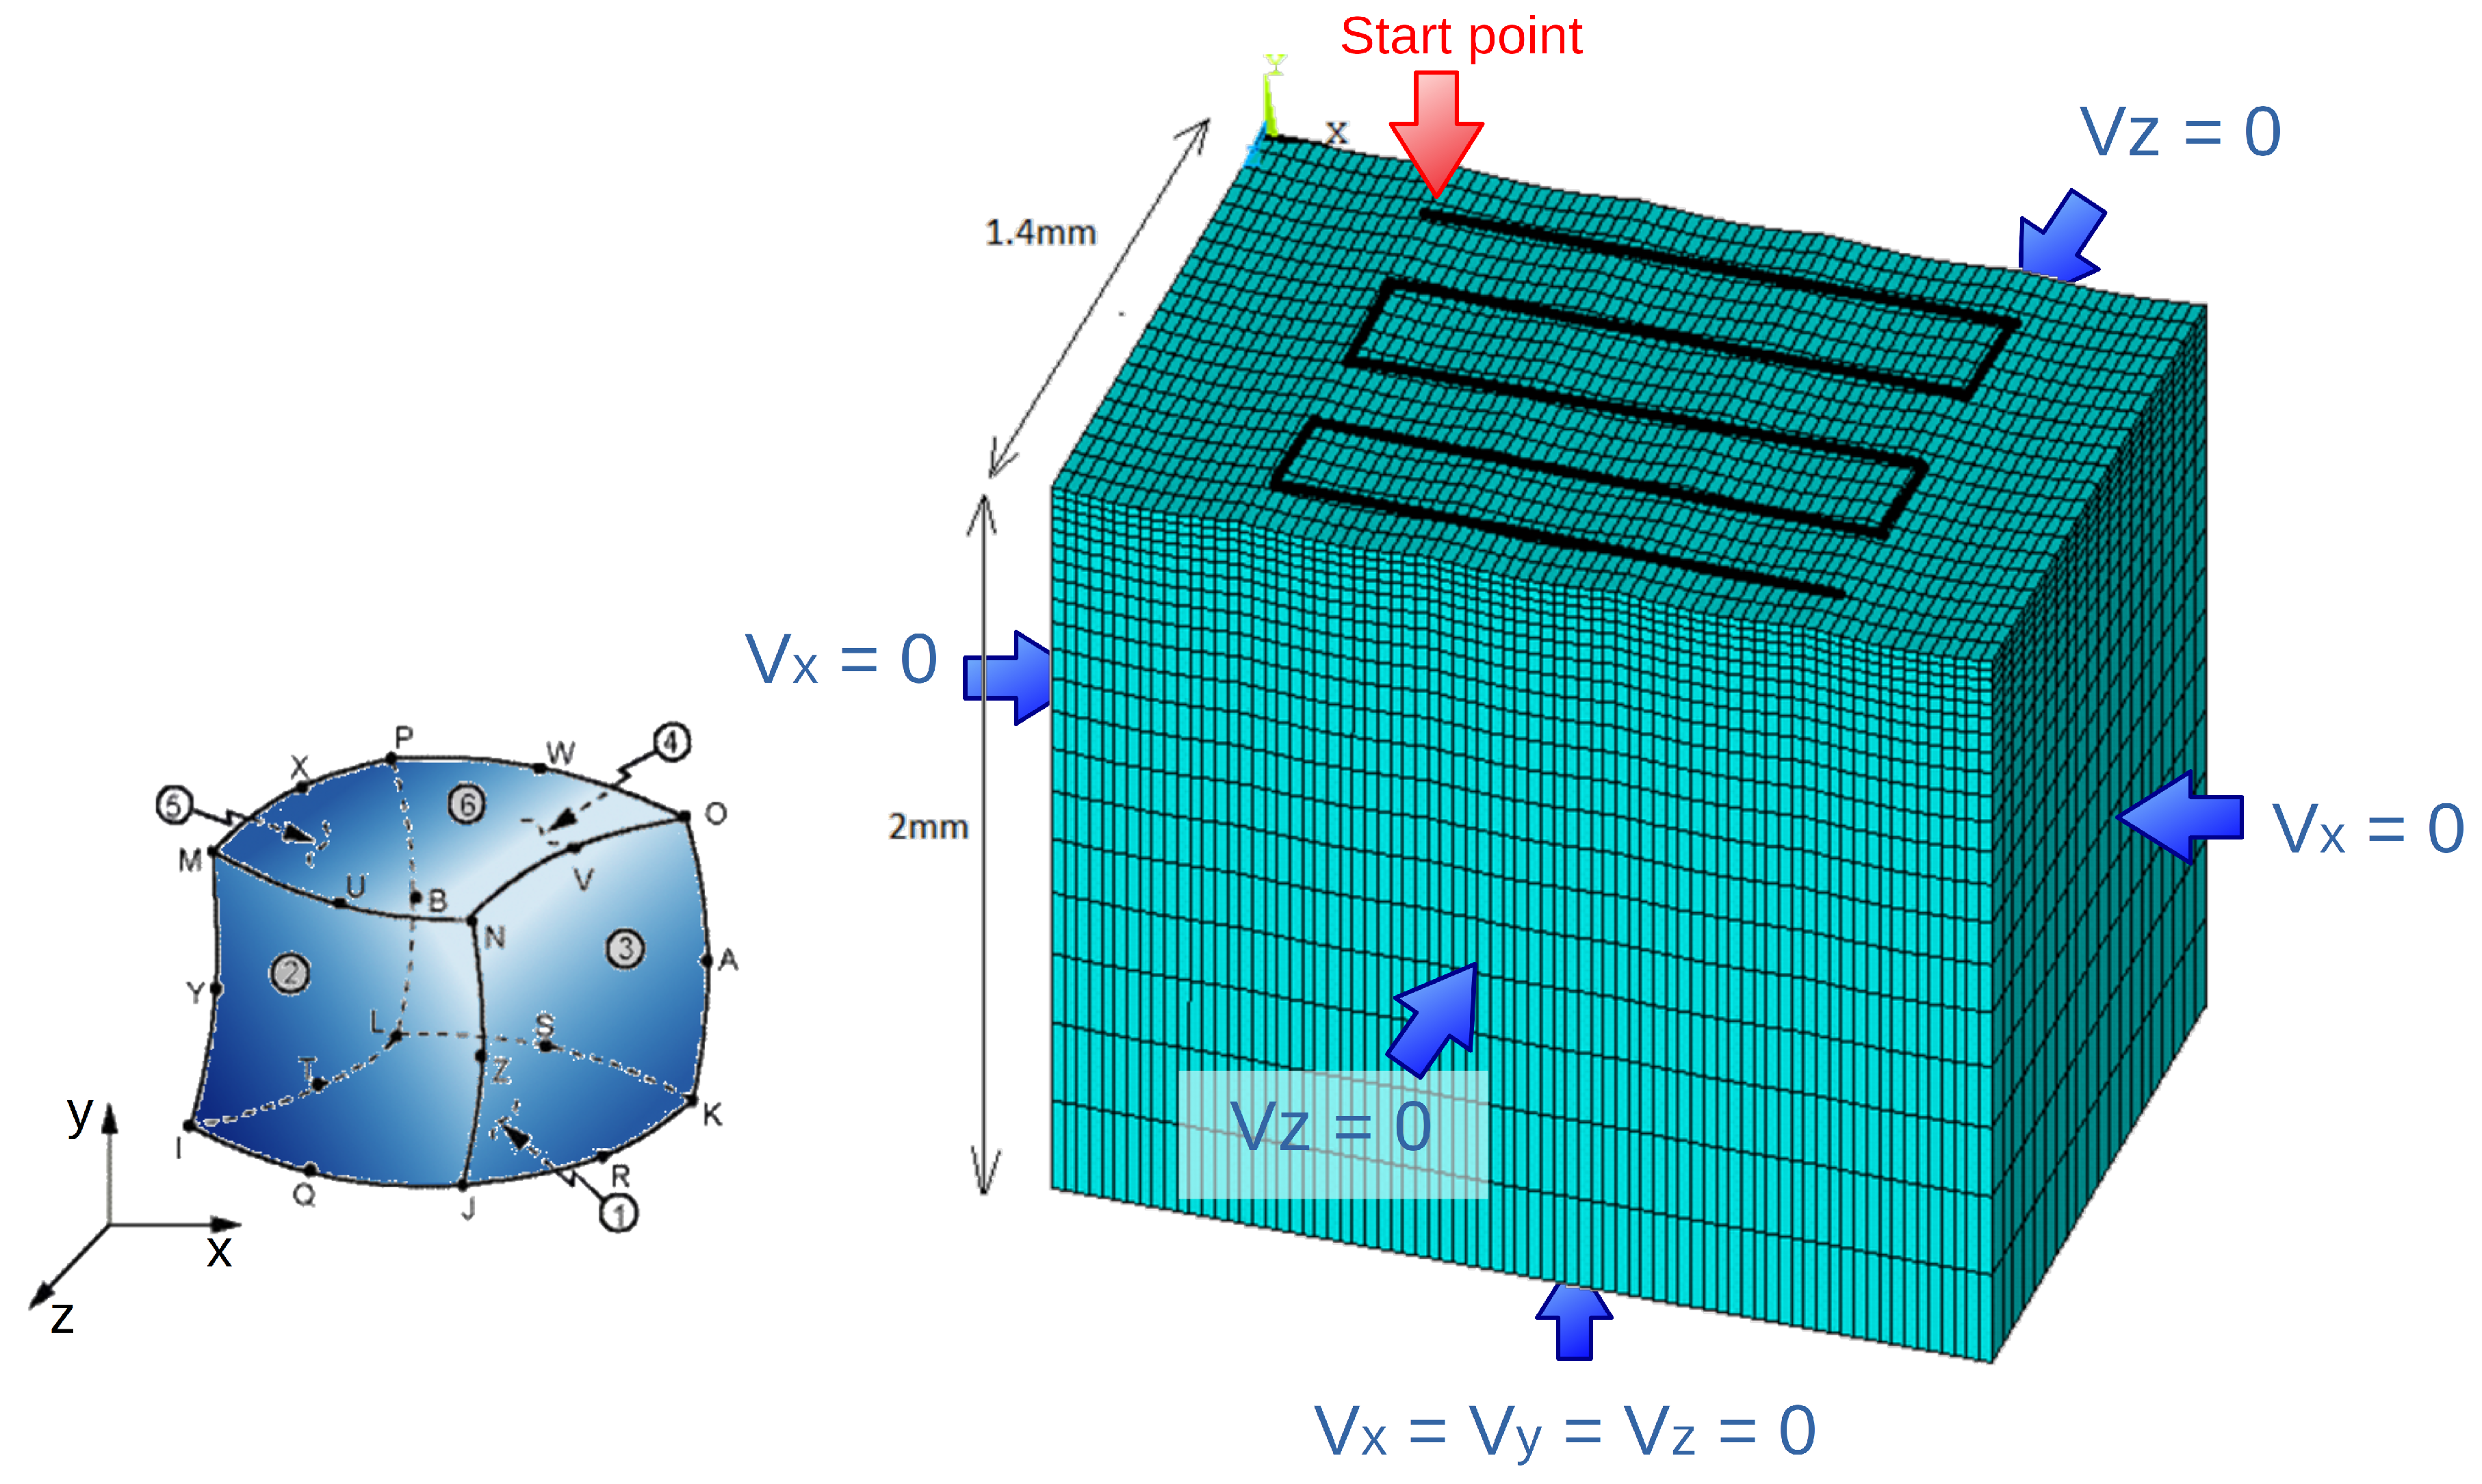
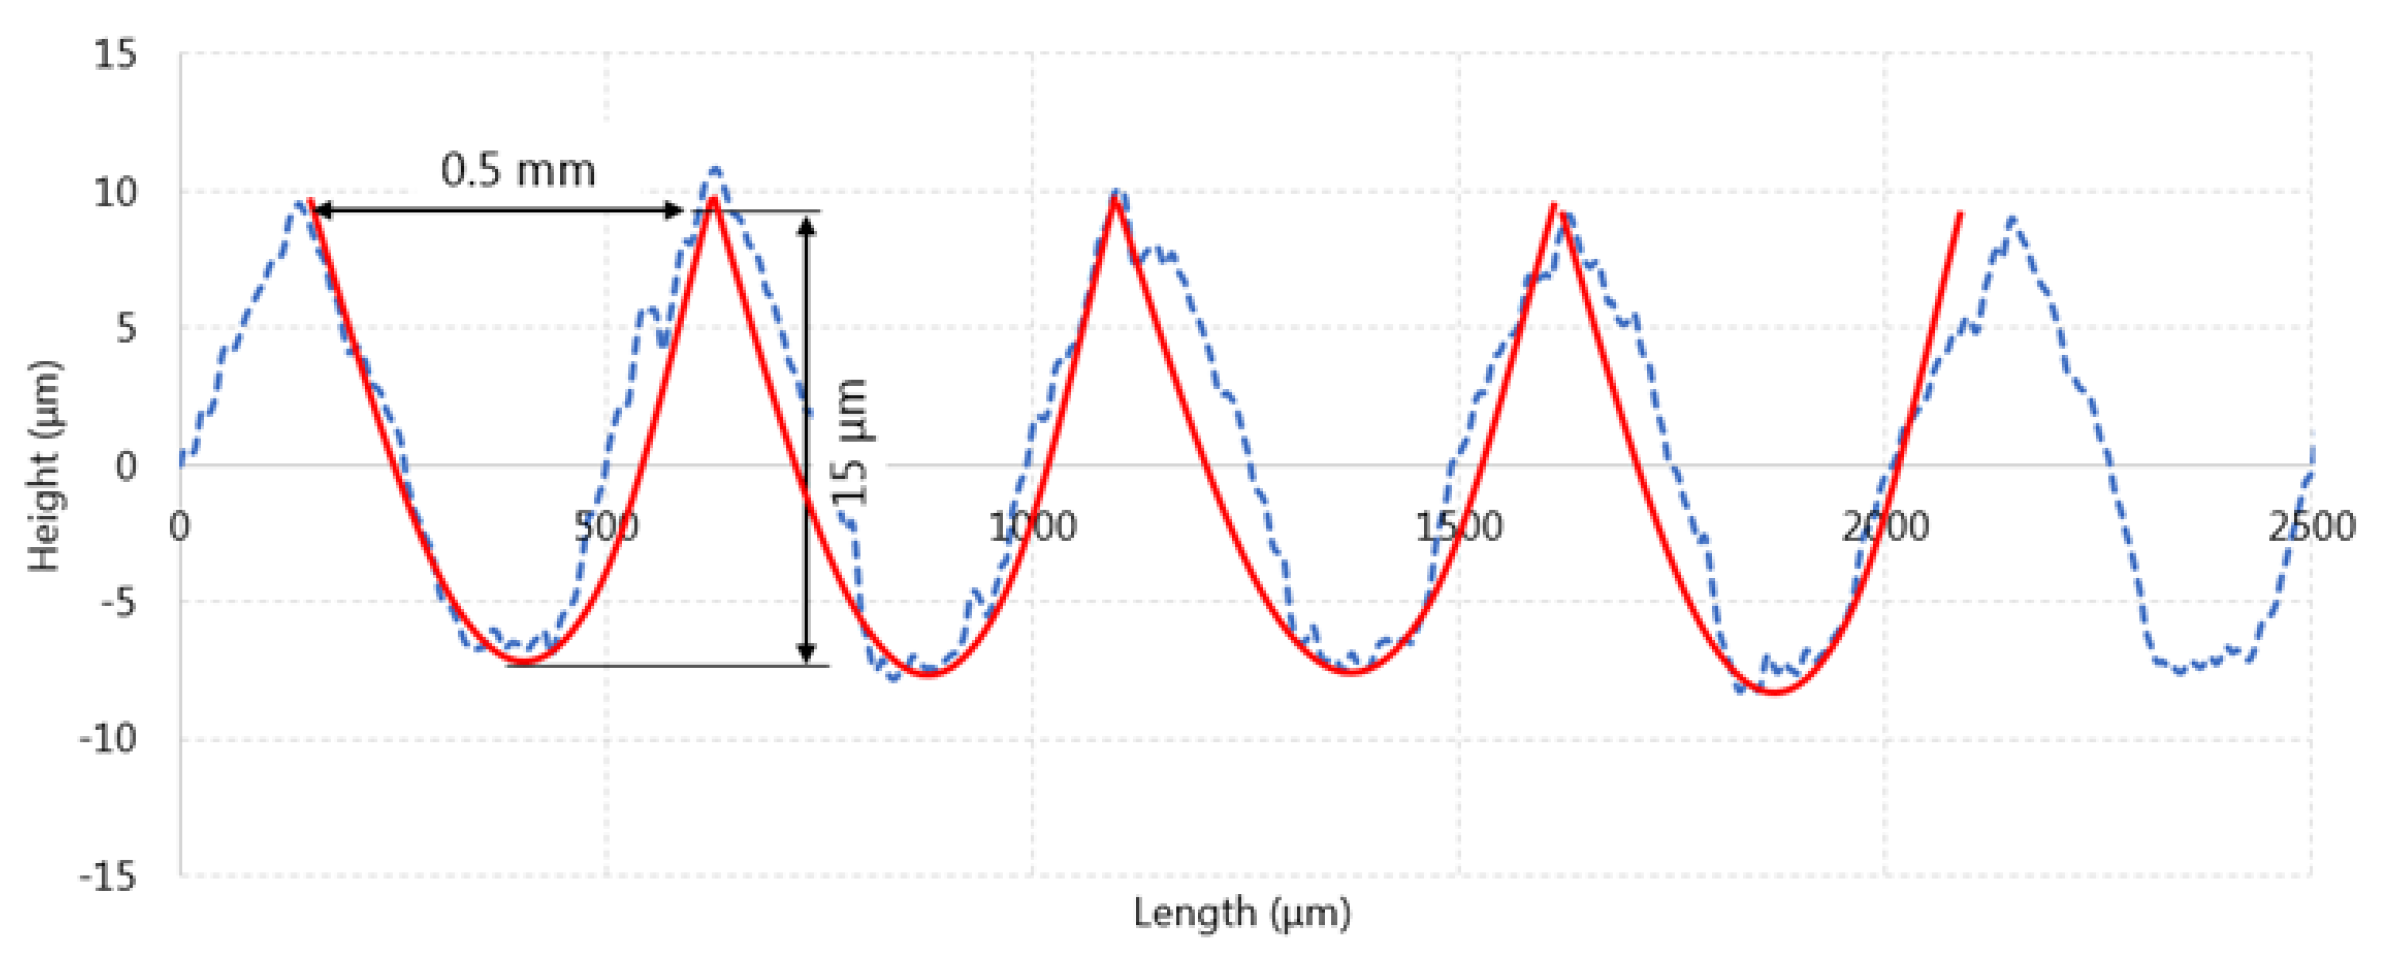
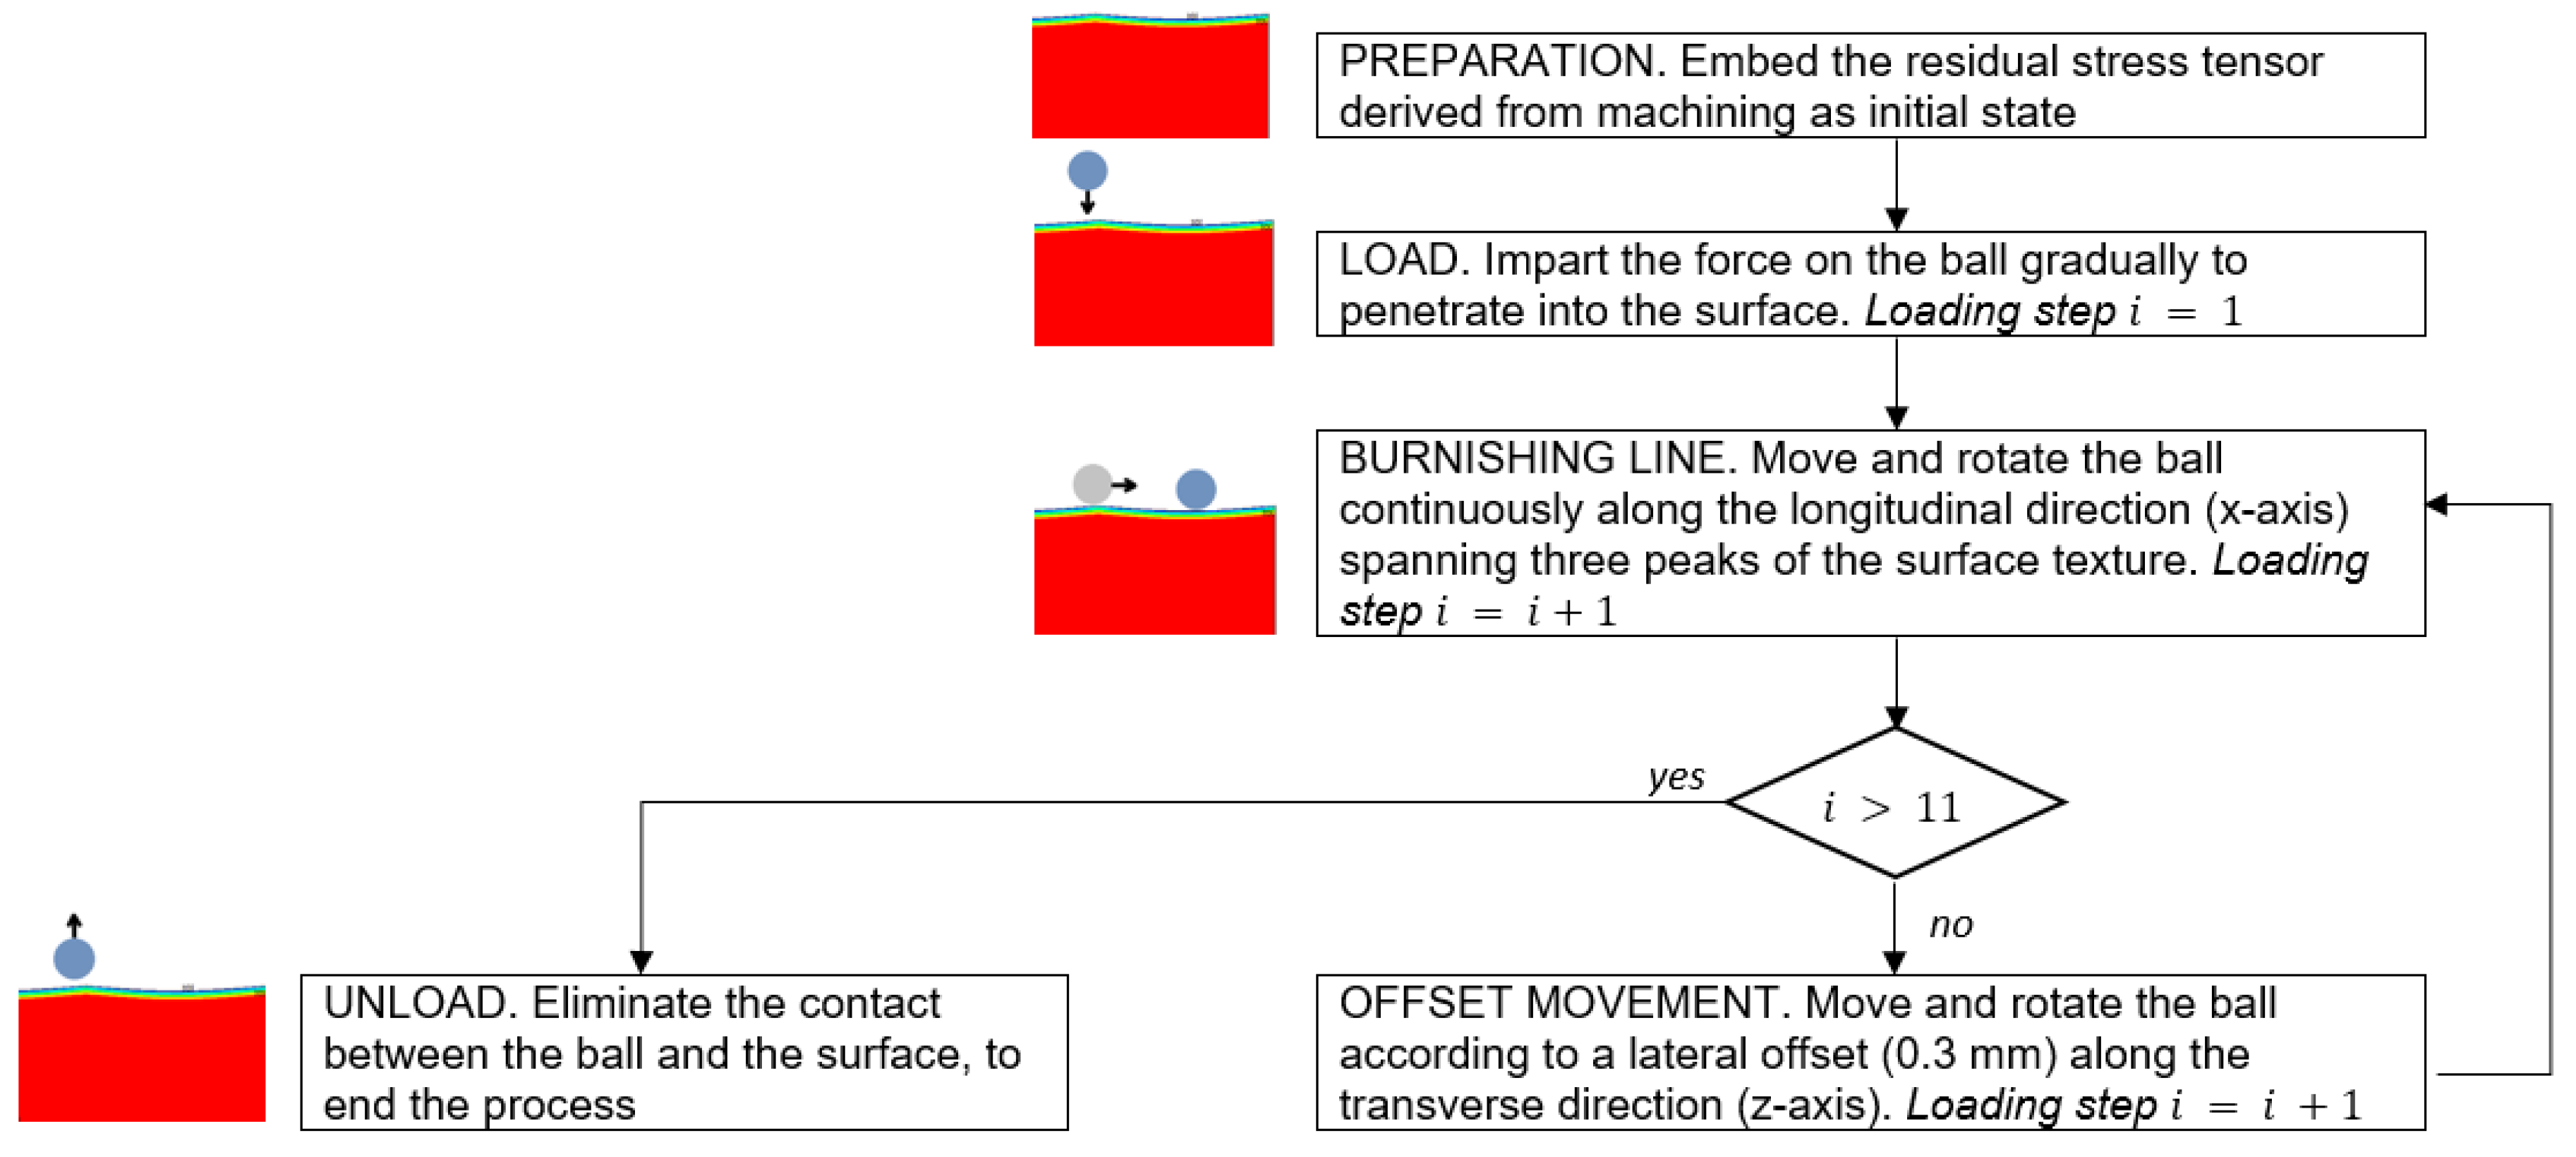
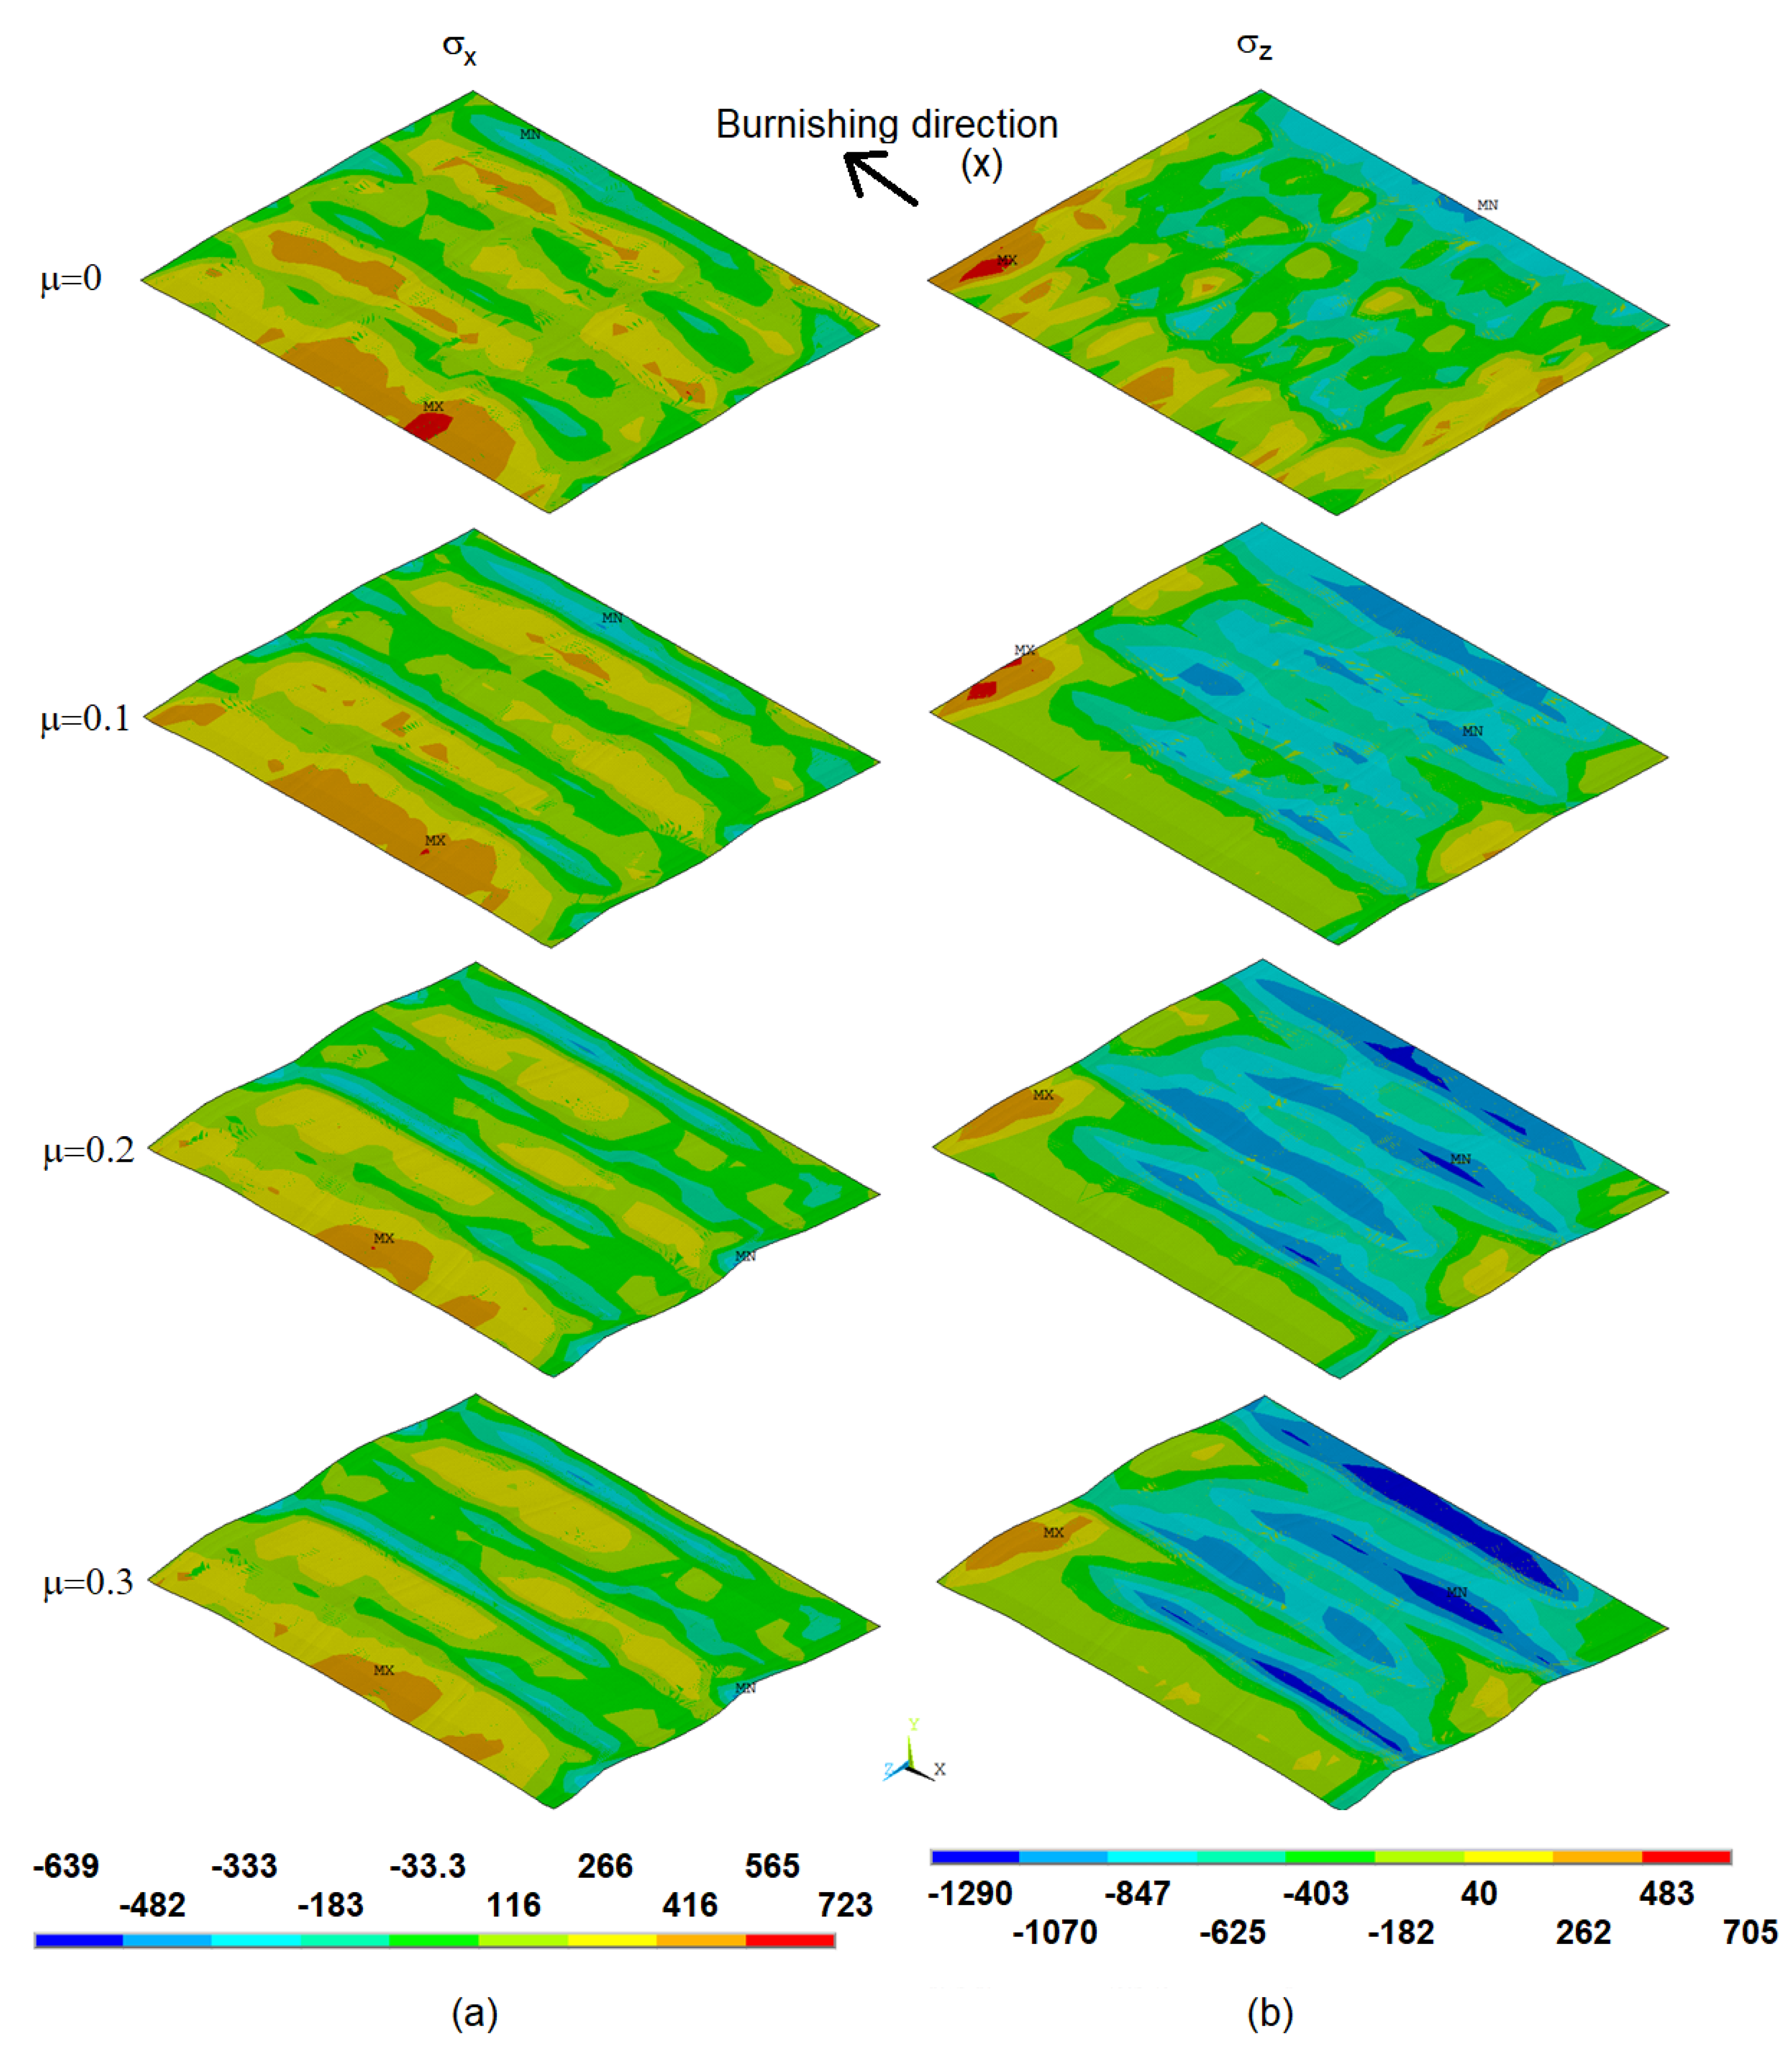
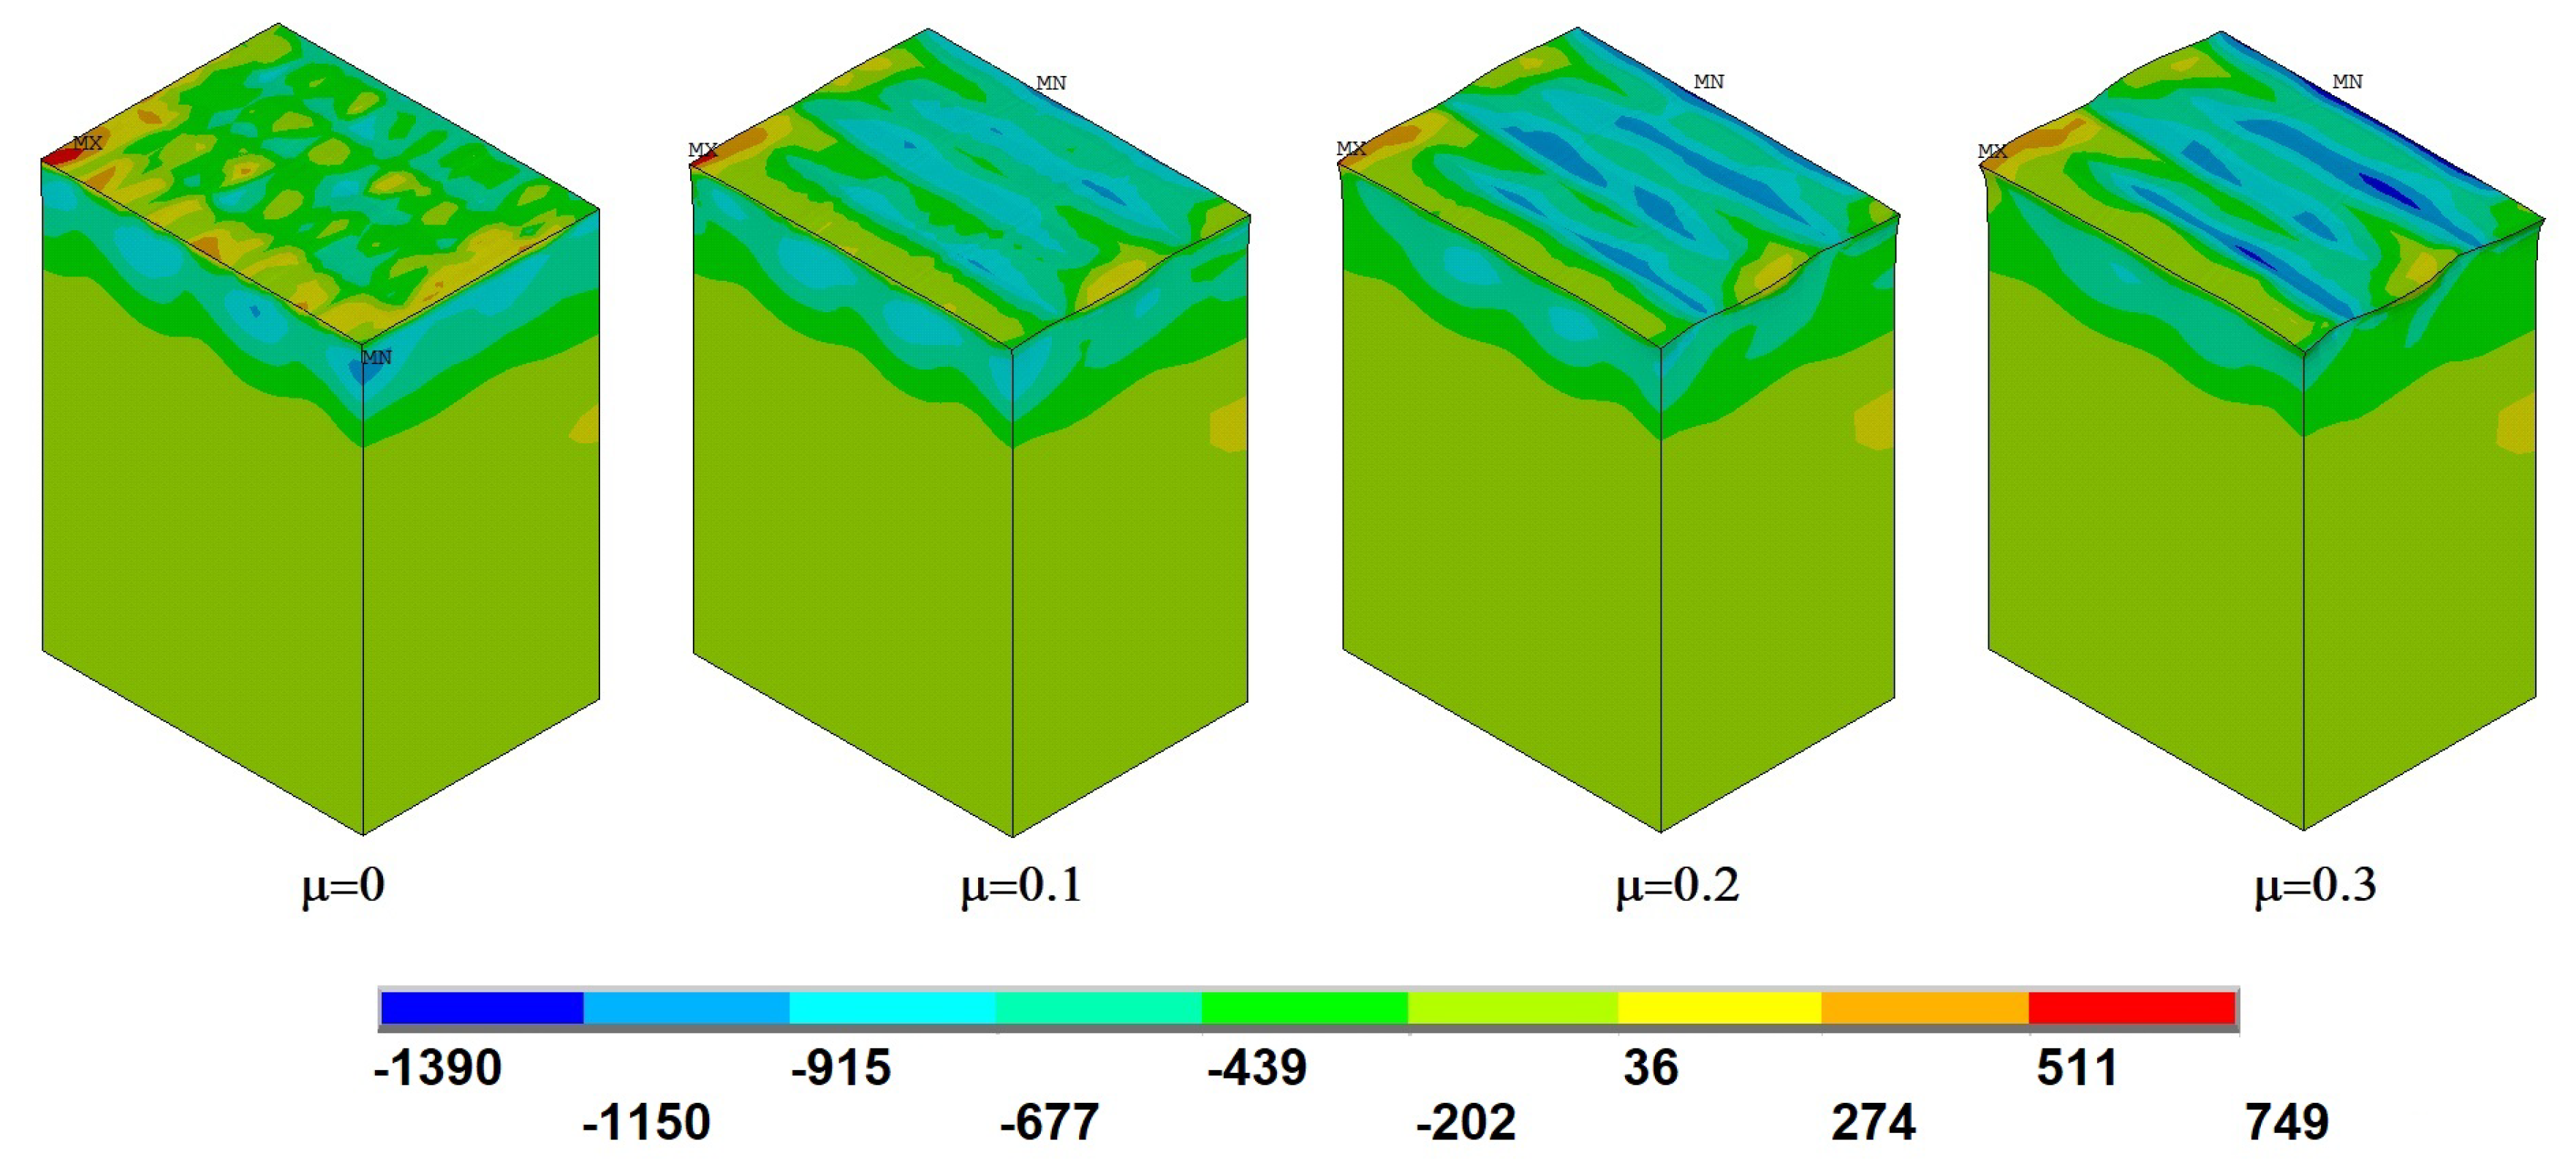
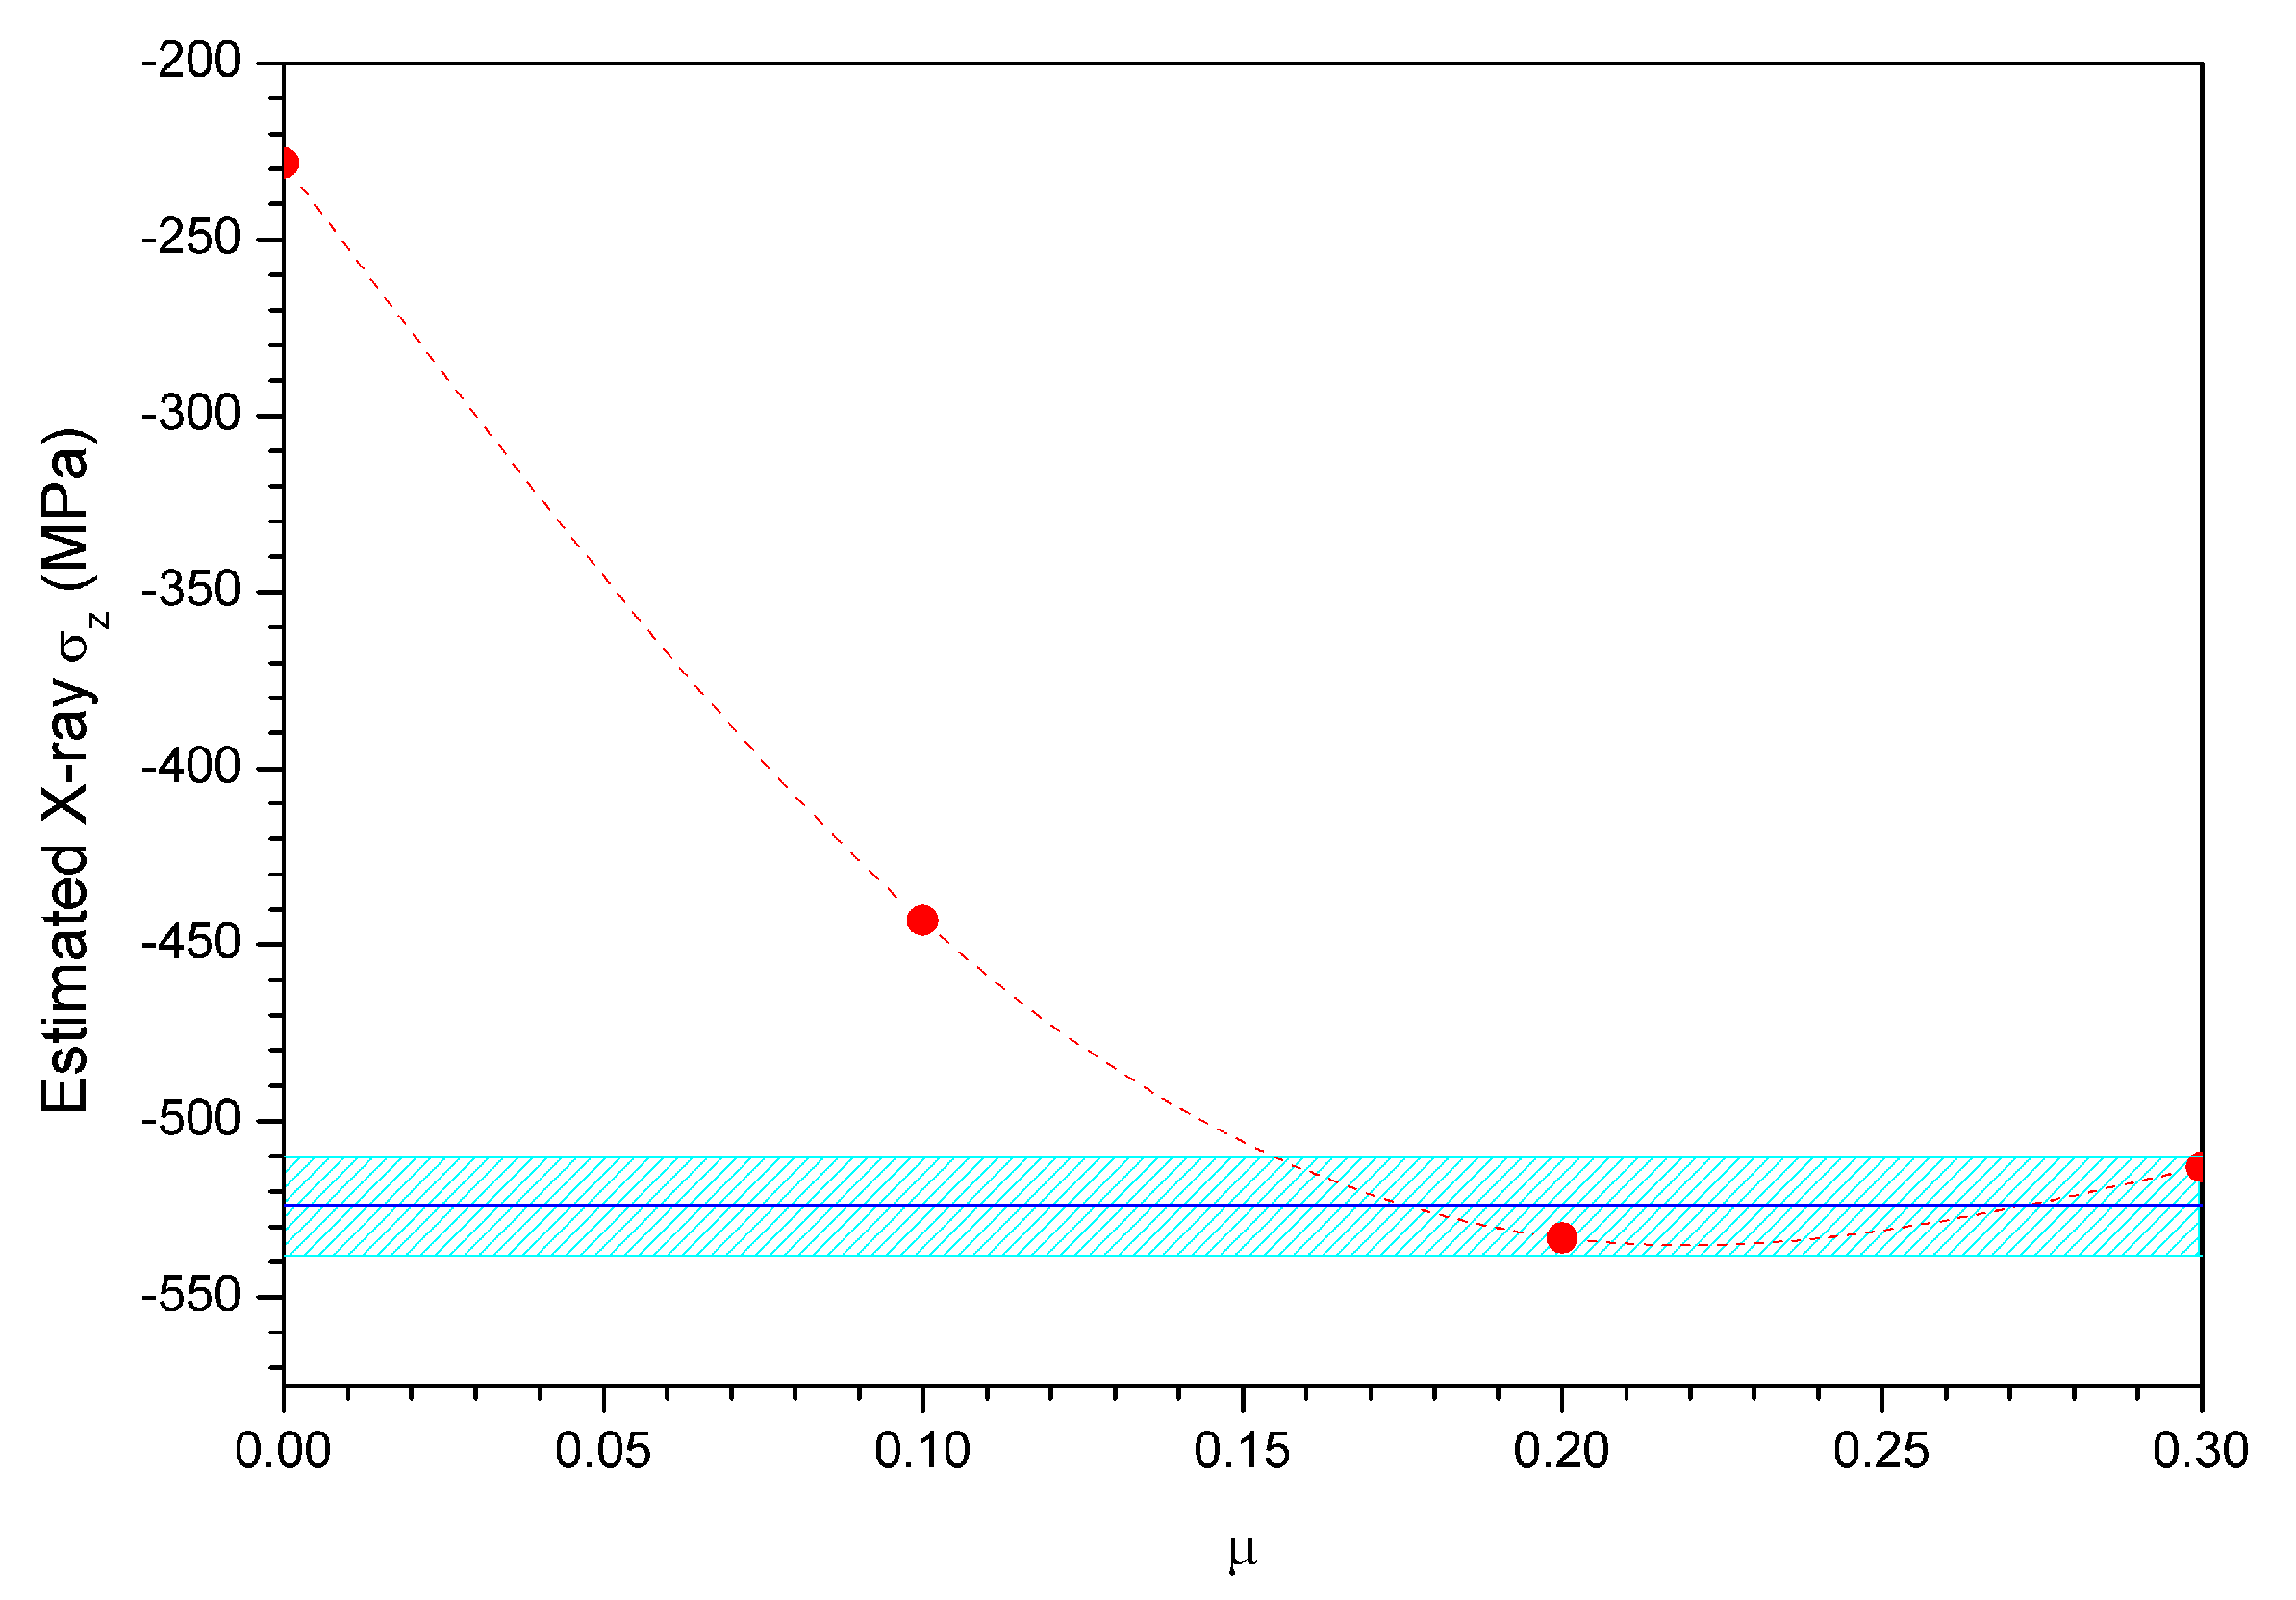
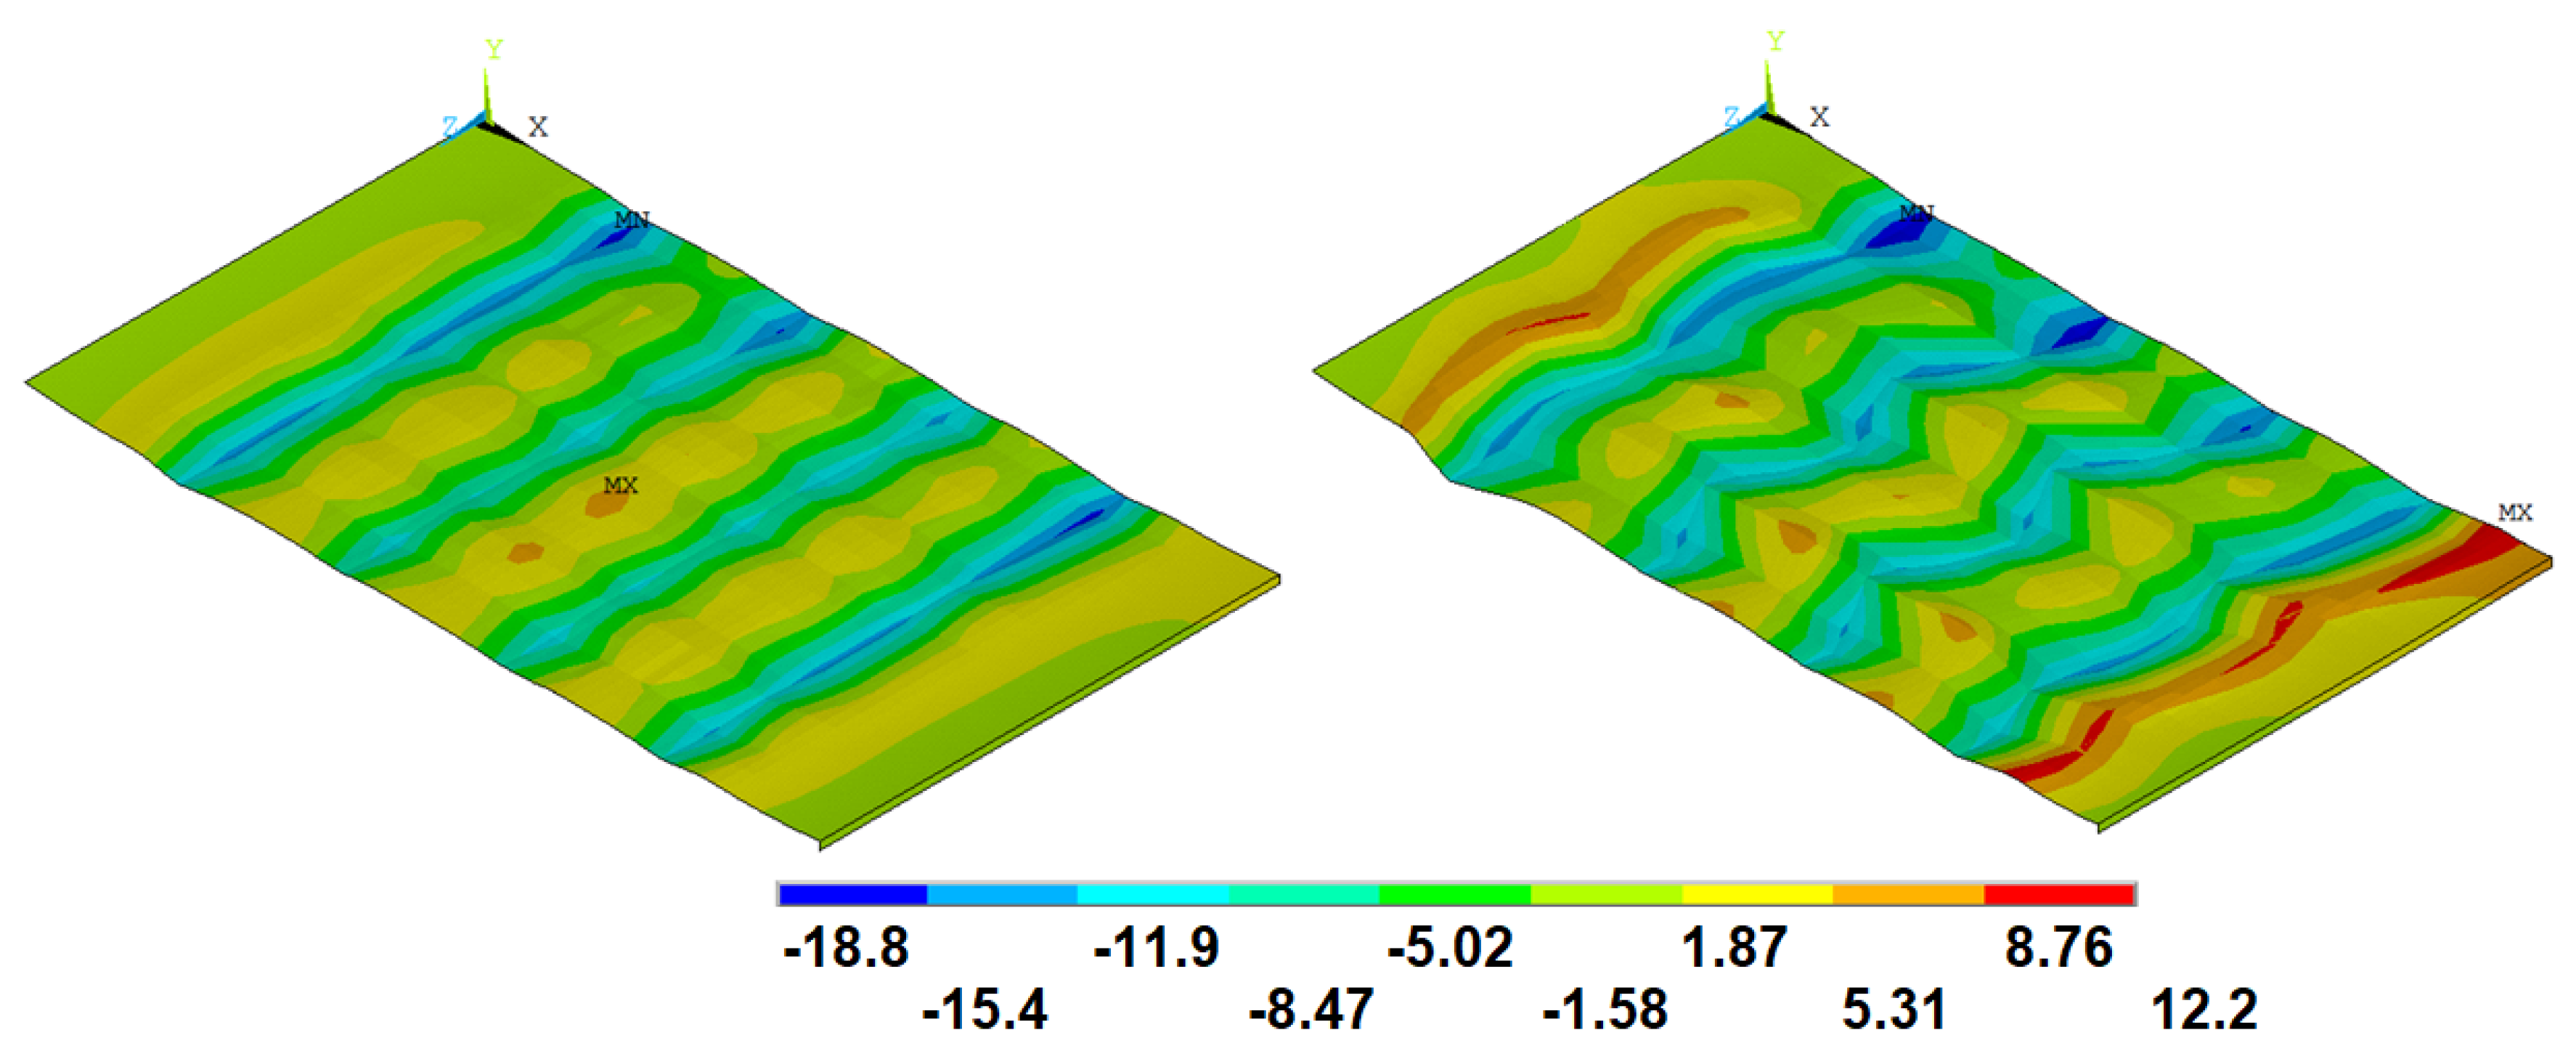
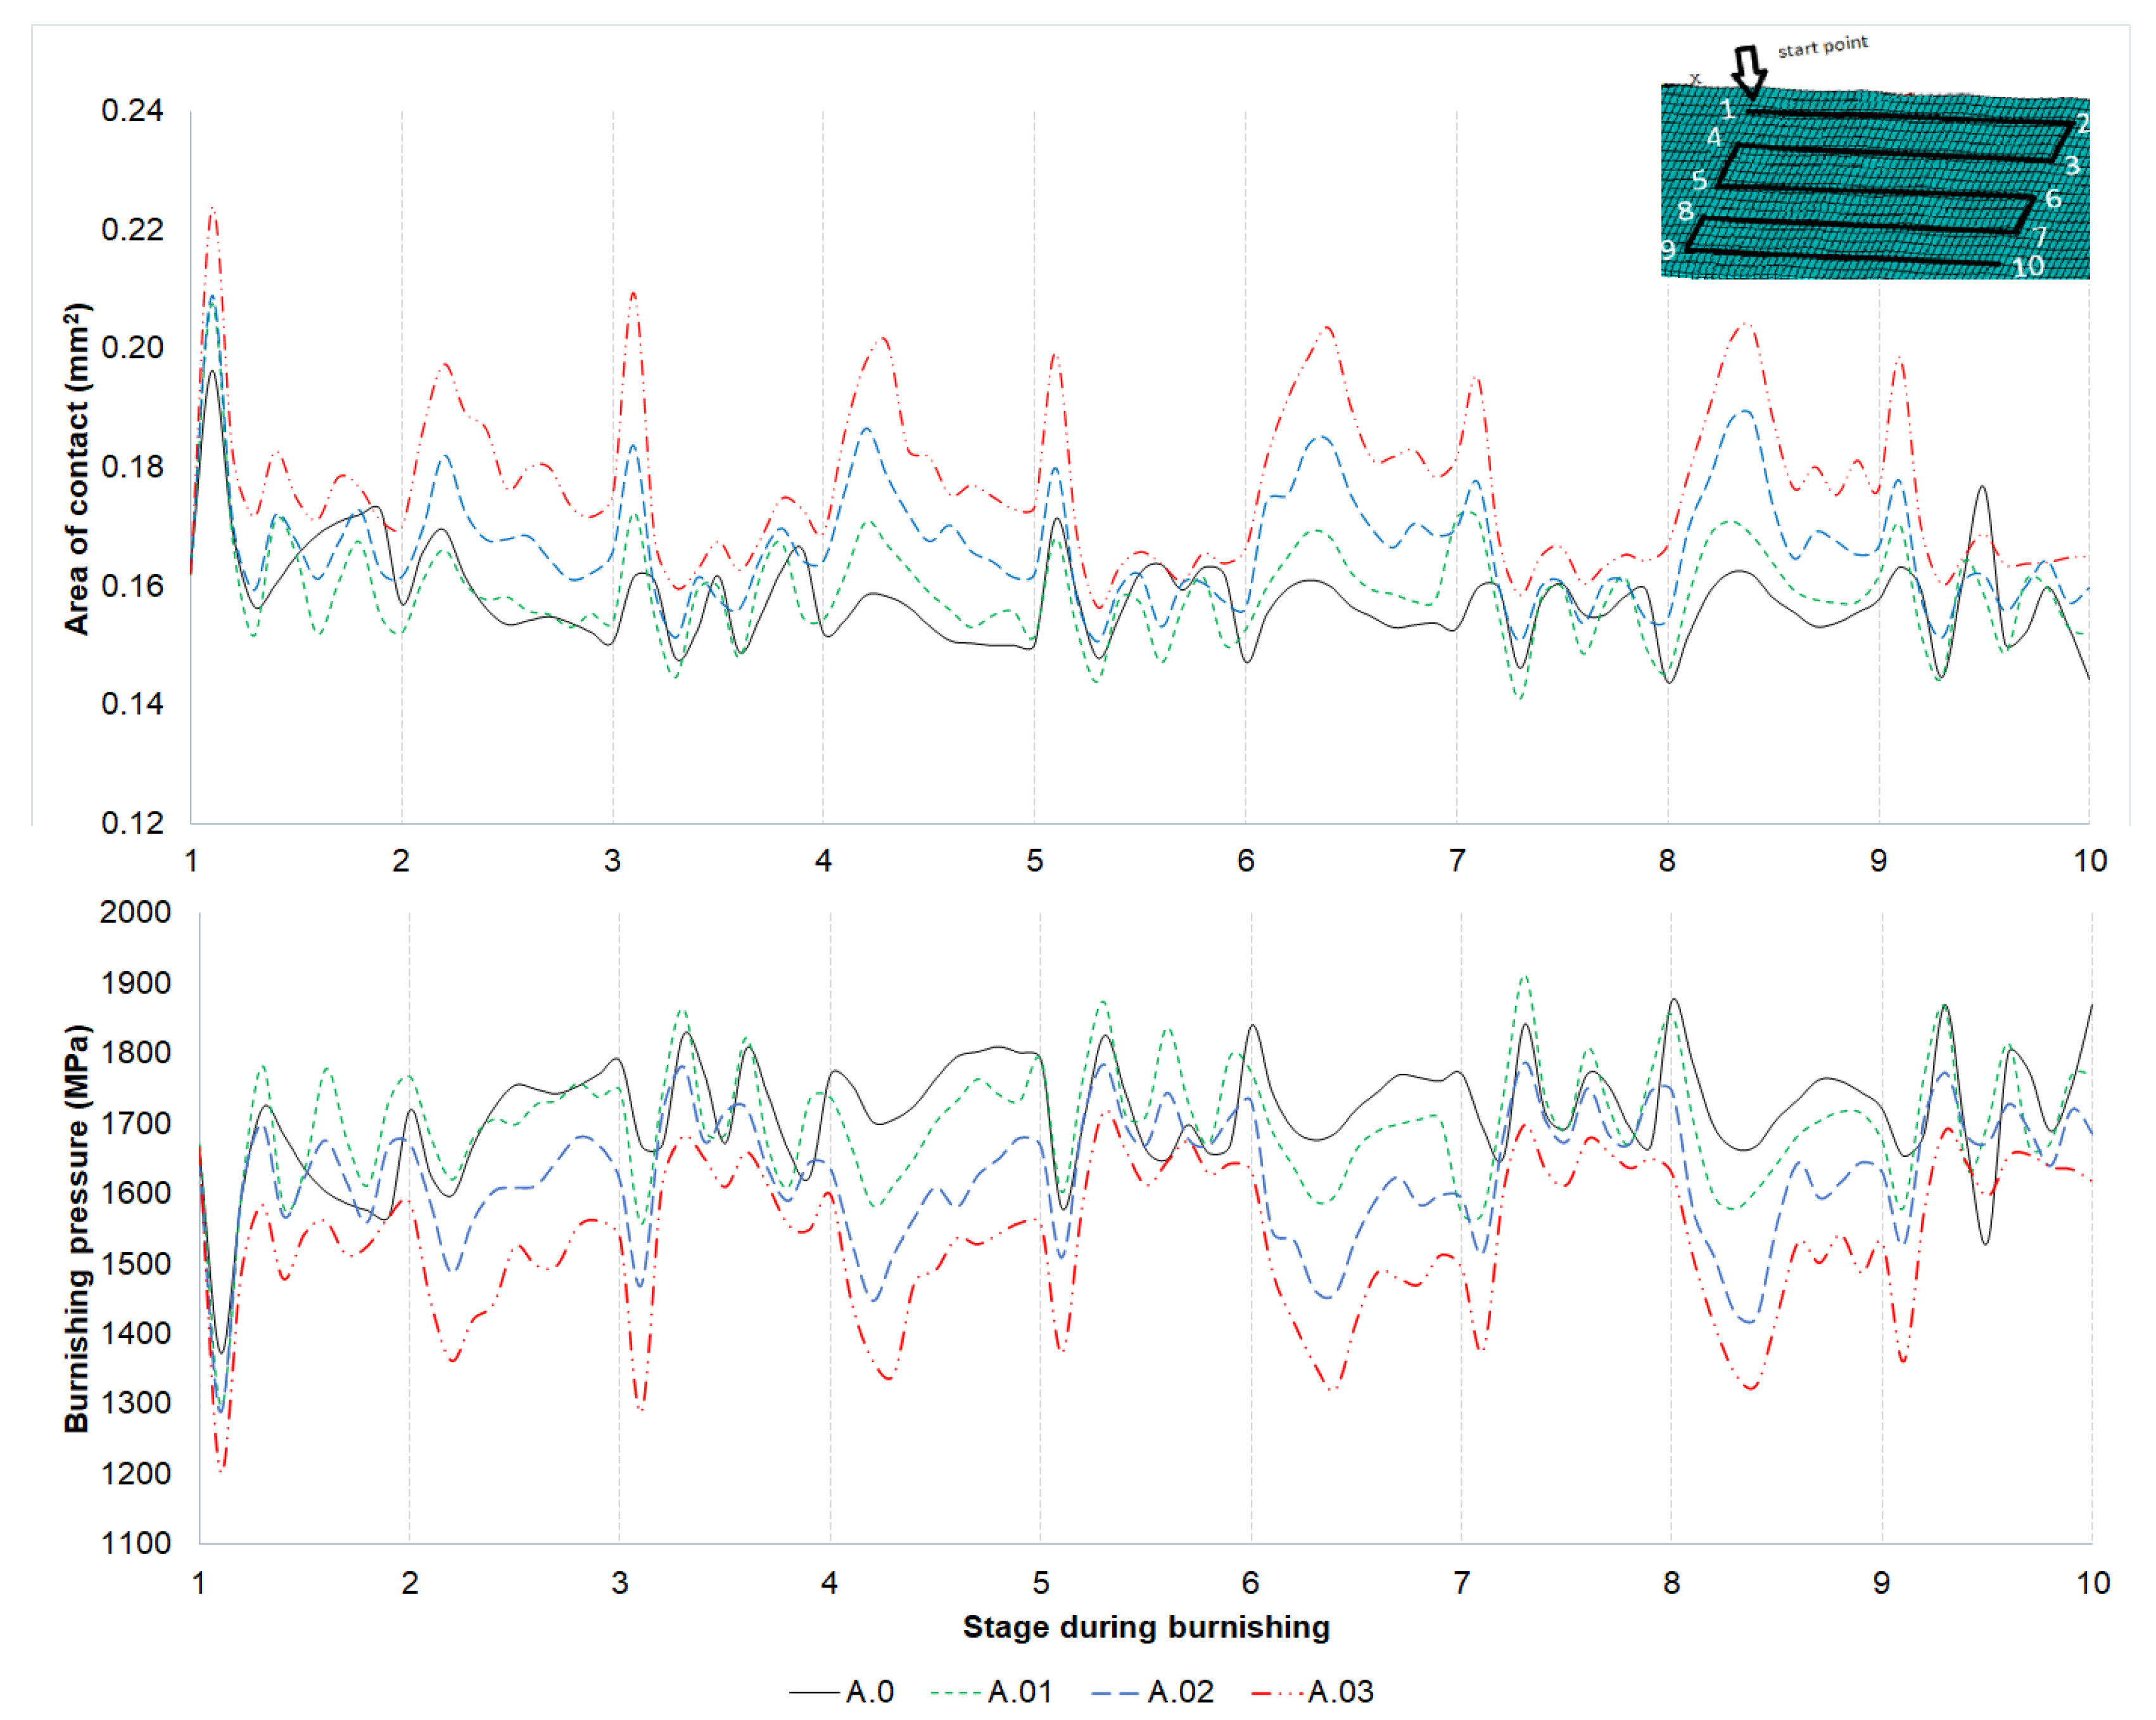
The bibliographical sources consulted for the elaboration of this paper evidence that previous references dealing with ball burnishing model incorporate diverse simplifications, i.e., considering it either non-frictional, or a bidimensional or neglecting the effects of the previous machining on the results. In this paper, we show the results of a new model that eliminates those simplification, thus showing a more comprehensive approach to the understanding of the process. Indeed, these parameters are crucial to define the maximum contact pressure, and, therefore, shall define the final effect of the ball burnishing process and cannot be neglected. Hence the focus of this paper, in which less restrictive hypothesis are applied and it is demonstrated how different friction coefficients affect the surface area involved in the contact of the ball with the roughness peaks, as well as the final residual stress. Secondly, we include a three-dimensional distribution of the material composing the surface texture, acknowledging like that the surface topography affects three-dimensionally the mechanics of the process. It should be noted that even a perfect bidimensional modelling implies errors in the estimation of the driving force for the burnishing, as the contact area of a circle with a flat triangular profile is very different from the three-dimensional approach represented by a sphere with a wavy surface. More specifically, the periodical topological features of a real ball-end milled are implemented in the model, along with the actual residual stress state derived from the machining process itself. For that reason, the actual texture of the target surface after machining must be entirely considered to have a reliable model.
The elements of analysis introduced in this FEM can be considered a leap forward in the field of ball burnishing modelling, as they represent the ball burnishing impact on real surfaces, as shall be observed by comparing them with actual experimental results. This constitutes the main novelty of this contribution. This model features the process on ball-end milled AISI 1038 surfaces, and is highly valuable for process result prediction and phenomenology study, as this kind of surface is often found in real manufacturing contexts.

2. Material Characterization

2.1. Power-Law Model for Plastic Behaviour

The material selected for the target surface to be treated through ball burnishing was AISI 1038 steel. It was acquired as laminated bars with a 40 × 80-mm 2 section. In order to introduce the mechanical properties of the material in the FEM, uniaxial tensile tests were performed on flat specimens, equipped with extensometer to record the deformation experimented by it during the test (Table 1). The tests and specimens were designed and performed according to the ISO 6892 standard, with a 10-mm/min velocity, in a workroom at ambient temperature.
The plastic behaviour of the material was modelled through a power-law model represented by Hollomon’s equation (Equation (1)), whose characteristic parameters were obtained experimentally by calculating the main descriptors of the strain-stress curve of the different specimens, following standardized calculations established in the aforementioned standard.
σ = K ϵ n
where σ is the stress, K is the stress for unitary strain, ϵ is the real plastic strain experienced by the material, and n is the self-hardening coefficient of the material.

2.2. Hardness Quantification

The material hardness was measured through Vickers microindentation tests, applying a 100-g load, on a specimen extracted from the core material. 50 measurements were taken and averaged, so that the material hardness was calculated as 175 ± 10 HV.

3. 3D Finite Element Model

To simulate the three-dimensional ball burnishing process, the commercial FEM software ANSYS was used. Since the inertia effects are very small, they were neglected. On the other hand, the static analysis was performed implicitly with ANSYS. Although previous results from literature showed that friction, and the original roughness profile at the surface layers due to machining have no direct impact on the effects derived by the burnishing force, recent advances have shown that they should indeed be taken into account, as they are highly relevant to understand the effects of ball burnishing [25]. This is due to the fact that the displacement of the surface material caused by the cold plastic deformation process, accounted mainly by piling up and protrusion effects, are not negligible. For the works included in this contribution, the coefficient of friction was estimated in different simulations. Finally, the design was done so that an approximation of the contact surface between the burnishing ball and the surface material during the ball burnishing process was achieved. This last application of the model is especially helpful to understand the actual mechanical interaction between the ball and the surface, as determining the involved contact area during the process is obviously impossible in an experimental context. The following subsections describe the specific aspects of the model.

3.1. General Description

In order to model the workpiece, a higher order 3D element composed of 20 nodes, named SOLID186 in ANSYS®, was used. Each node has three degrees of freedom: translations in the nodal x, y, and z directions. Since this type of element exhibits quadratic displacement behaviour, it is more accurate in estimating displacement than other elements with linear shape functions. This feature makes it well suited to model irregular meshed areas, and the simulation utilizes an hexahedral type of element (Figure 1). On the other hand, since the underlying solid elements have midside nodes at the contact interface because of the quadratic shape function, elements satisfying this condition were used to represent and compute contact and sliding between 3-D surfaces including the burnishing ball and the material irregularities. In ANSYS®, this kind of elements are CONTA174 and TARGE170. Specifically, the CONTA174 element type has the same geometric characteristics as the solid element face with which it is connected. Meanwhile the coulomb friction and shear stress friction are allowed in the CONTA174.
The augmented Lagrangian method was used as a contact algorithm in the simulation. The contact stress (pressure and frictional stresses) are augmented during equilibrium iterations, so that the final penetration is smaller than the allowable tolerance (TOLN). Compared to the penalty method, the augmented Lagrangian method usually leads to better conditioning and is less sensitive to the magnitude of the contact stiffness.
Gaussian points were defined to detect the contact areas between the ball and the surface, governed by the Coulomb-Mohr’s frictional model without cohesion (Equation (2)).
τ = μ p b
where τ is the frictional shear stress at the contact surface, μ is the coefficient of friction and p b is the burnishing pressure due to the contact of the ball and the surface material, calculated through Equation (3).
p b = F b A b
where F b is the burnishing force exerted by the burnishing ball and A b is the area of contact between the burnishing ball and the material on the surface.
The friction coefficient μ was kept constant in each simulation. This will prove useful when the contact pressure is evaluated at all steps of the simulation. The ball was modelled as a rigid sphere with a diameter of 10 mm, moving and rotating along the burnishing paths deployed on the target surface, as shown in Figure 1. The surface of the rigid ball is associated with a pilot node at its geometric centre, whose motion governs the entire ball surface displacement.
To simulate the ball burnishing process, the ball is pressed on the surface so that the total force was set at 270 N, because this preload was successfully tested in actual experimental tests performed to complement the model, and explained in [25]. Then, the ball rotates freely with frictional sliding along longitudinal paths over the surface, spanning four peaks of the periodic texture profile. The lateral offset between passes was fixed at 0.3 mm. Finally, the contact ball with surface was eliminated. Due to high non-linearity in the contact surfaces and rotation during the process, number of iterations were set as 200, and the maximum number of load steps were set in 10,000. The number of elements which were used for the work surface and the ball were respectively 30,000 and 5400.

3.2. Surface Texture Modelling

The target surface was included in the model by developing a three-dimensional periodic texture generated from a peak-valley profile whose dimensions were based on a real one obtained by ball end-milling with a 10-mm diameter hemispherical milling tool and by adjacent lateral passes with a 0.3-mm lateral offset (Figure 2). The real profile was numerically measured through an ALICONA Infinite Focus device equipped with a 10x objective with a 100-nm vertical resolution. To define the base profile, no filter was applied on the texture to retain all the height points, so that the P profile parameters were used to generate the original texture. More specifically, the  P s m and P z factors according to the UNE-EN ISO 1302:2002 standard, were approximated to 0.5 mm and 15 μ m respectively, to generate a simple unit that was juxtaposed to generate a reference profile. Table 2 shows all the dimensional parameters defining the surface. Three-dimensional parameters were also retained for the sake of comparing with ulterior results.

3.3. Boundary Conditions and Initial States

All degrees of freedom of the displacements perpendicular to the four lateral faces of the block were constrained, as was shown in Figure 1. On the other hand, the residual stress state of the original surface (Table 3) was implemented at the modelled surface by embedding a representative tensor obtained from experimental measurements performed by x-ray diffraction on a real workpiece with a K α Cu radiation, applying the sin 2 p s i method [26]. As this method does not penetrate deeply in the material layers, the flat tensor was implemented at a 10– μ m depth in the model. The x direction indicates the burnishing direction, whereas the z direction is perpendicular to burnishing.
The FEMs were simulated by considering five different scenarios (Table 4). The first four ones contemplate different friction coefficients between the ball and the surface peaks, including the non-friction scenario (simulation A.0). On the other hand, the remaining two contemplate the implementation of the residual stress tensor by flipping the axes, to contemplate the application of ball burnishing to evaluate the effect of changing the relative direction of burnishing with regards to the original machining.

3.4. Simulation Steps

Every simulation included in Table 4 was composed of a sequence of ten different steps represented by the flow chart in Figure 3. Besides the main simulation represented in that diagram, a special macro was incorporated as a subroutine in order to define the instantaneous common nodes between the elements of the ball and the surface peaks in contact, by returning those elements where forces are not zero. Like that, the area of contact between both solids can be estimated. This parameter is of high interest, as it defines the degree of plastic deformation that could be potentially attained through pressure by the burnishing ball. It must be noted that, after all calculations performed as described for the elemental areas, the summation of the reaction forces for the involved elements was calculated as 270 ± 2.5 N, to prove that the imparted force along the simulation was within the desired range.
Once all burnishing conditions were simulated, the new surfaces textures were analysed by generating datasets representing the point heights, as a result of the change of nodal displacement in the vertical direction ( u y ). The residual stress at longitudinal and transverse directions were also returned. The resulting surfaces were directly compared to surfaces burnished on the machined surface with the ball burnishing tool developed and manufactured by Jerez-Mesa et al. (2018) [27].

4. Result Discussion

4.1. Superficial Residual Stress after Ball Burnishing

The resulting residual stress tensor after the simulation proves that it is ball burnishing that dominates and defines the preferential direction of the residual stress obtained after the process, regardless of its distribution on the original machined surface. This result can be easily observed in Table 5, where all simulations present higher compressive residual stress along the original direction, regardless of the relative orientation of the original machining and the burnishing direction. These values are even higher as the coefficient of friction increases. This could be explained by the fact that, as  μ increases, the ball engages with the material more easily, thus deriving in further cold work on the surface. Results also show that if the coefficient of friction is lower than 0.1, then burnishing could lead to residual stress relaxation, what could be detrimental for the material in terms of crack propagation prevention. Therefore, a minimum friction coefficient of 0.1 should be required to guarantee enough cold work so that the burnishing ball does not relax residual stress that was obtained during the previous machining phase.
In overall, it can be observed that the effect of ball burnishing is more conspicuous in the direction perpendicular to burnishing, regardless of the original residual stress distribution, as most other articles state. This effect is graphically depicted in Figure 4, where all residual stress fields are represented for A simulations. Specifically, the component perpendicular to burnishing σ z is more sensible to friction variation, as its evolution is towards more compressive values as it increases. On the contrary, although  σ x also experiments change, it is not so pronounced.
Figure 4 also shows that the border of all burnished patches present a higher residual stress than in their central areas. Friction and irregular contact surface cause that the amount of superficial compressive residual stress increases along every path where the ball is in direct contact with workpiece, while the approximation of stress at the points located among paths is closer to the experimental values. For this reason, to compare the experimental results with FEM simulation, the mean of the twelve paths in the middle of the burnished area have been later on considered.

4.2. Deep Residual Stress after Ball Burnishing

The residual stress in deeper layers of the material can also be computed through the model, although they are not the main focus because of the high cost of obtaining the in-depth profile experimentally to confirm the adequacy of the model. However, the average value of deep residual stresses down to a certain depth can be obtained as a representative value of the process, and later compared to X-ray diffraction results.
Figure 5 shows the evolution of deep residual stress in the direction perpendicular to burnishing ( σ z ), which has been described in the previous section as the most affected by the process. This new representation shows that the effect of increasing the coefficient of friction derives in a slight relaxation of deep compressive residual stresses, which is obvious considering that the model searches equilibrium. If the compressive residual stress at the surface increases, then it must be reduced in deeper layers, as has been observed in previous works [7].
These results have also been used to compute the average residual stress values that could be experimentally obtained through X-ray diffraction measurements. For steel alloys, the depth of penetration of this technique is around 15 μ m. Specifically, the nodes composing the volume of the material down to that depth have been considered and their residual stress values averaged to obtain a representative value of overall residual stress after the process with different coefficients of friction. Figure 6 shows the resulting residual stress in the direction perpendicular to burnishing, as well as a band that represents the actual value obtained through X-ray diffraction on the test workpiece. The image shows that a coefficient of friction of 0.2 already is representative of the residual stress obtained on a real workpiece. In fact, even slightly lower values would also agree with the real result.

4.3. Plastic Deformation after Ball Burnishing

The residual plastic deformation can be also quantified by analysing the displacement experienced by the nodes after the process. The nodes located in their new positions after their displacement were exported as a height dataset, and the representative S q and S a amplitude parameters computed, based on a mean square plane calculated in the same routine. Table 6 presents the results, showing that the degree of plastic deformation experienced by the surface does not depend on the original residual stress distribution, as tests with identical coefficients of friction (A.0 & B.0 and A.03 & B.03) present similar S a values. On the other hand, it could be stated that the surface texture results obtained experimentally agree with those corresponding to the extrapolation of the resulting surfaces obtained with coefficients of friction 0.1 and 0.2. This observation, along with the previous deep residual stress results, evidence that a coefficient of friction of 0.15 could be adequate to predict texture results in this kind of simulations.
Figure 7 evidences the results described above. As it can be observed, the texture obtained after a highest coefficient of friction presents a higher variability of heights and depths in the surface represented by different colours, that is, a highest difference between peaks and valleys. This graphical result also depicts that a higher coefficient of friction increases the pile-up effect, as the boundaries of the burnishing patch in the surface simulated with μ = 0.3 presents more acute valleys than the rest of the imprint. Numerical values for further insight on this effect are presented in Table 7. This effect is accordance with results observed in spherical indentation tests [28], which can be assimilated to the process tackled with in this paper. Consequently, a different behaviour of the system according to the coefficient of friction that characterizes it can be identified. This relationship is discussed further in the next subsection.

4.4. Effect of the Coefficient of Friction on the Interaction Between Ball and Surface

Previous results have shown that the coefficient of friction has been determinant in the results obtained after ball burnishing. More specifically, as its value increases, the surface presents higher compressive residual stress, whereas texture is not improved to such a higher extent. This behavior cannot be explained phenomenologically through experimental application, due to technical limitations to observe the ball-surface contact interface. However, it can be hypothesized that the reason behind this effect is that different coefficients of friction derive in different contact mechanics between the burnishing ball and the material distributed on the surface texture features. To understand the reason behind this observation, a special macro to calculate the involved contact area of the surface with the ball during the burnishing simulations was implemented. To that effect, the CONTA174 and TARGE170 element types were implemented in the model. Since the type of analysis is static, here time is a counter. Accordingly, the instantaneous location of the pilot node at the centre of the ball can be determined in terms of time through a counter. The value of the displacement of that pilot node along the x and z directions, u x and u z respectively, is set to zero at the start point of each simulation. The former represents paths 1–2, 3–4, 5–6, 7–8 and 9–10 represented in Figure 1, whereas the latter refers to paths 2–3, 4–5, 6–7 and 8–9. The time elapsed for each load step is 1 s, and the increment is of 0.1 s.
Figure 8 shows the approximate burnishing pressure (according to Equation (3)) with regards to the position of the ball computed for all simulations with the same original residual stress distribution (noted as A simulations). The trend and evolution of the burnishing pressure is similar for all tests, but its absolute value is higher as the coefficient is lower. That change of pressure can be attributed to the variability of the area of contact as the process evolves. This numerical results evidence that, indeed, the ball and the surface engage to one another differently depending on the kind of friction interaction they are experiencing during the processing. Hence the high influence of that parameter in the effectiveness of the process itself.
The increase of burnishing pressure with the reduction of the coefficient of friction can also be interpreted in terms of local yielding. When there is no friction it is easier for the material to flow below the burnishing ball and mainly receive compression stress, that induces low plastic strain. As the friction increases, the material tends to pile up in front of the ball and is forced to flow around it, inducing shear stresses and a large plastic strain. As Wang and Chung (2013) [29] point out, the higher the friction, the higher the value of deviatoric stresses because of lateral forces. This explains also the fact that deep residual stress are slightly relaxed when the residual stress on the surface is more compressive, because in order to be compressed on the surface, the bottom layers must be drawn. The computation of the von Mises stress and the shear stress at the contact surface applying the Coulomb-Mohr’s frictional model described in Equation (2) evidence that, indeed, the increase of the coefficient of friction derives in a higher overall von Mises stress, mostly accounted by the shear stress (Table 8). That is, plastic strain, that induces cold work, succeeds in introducing a large amount of dislocations in the crystal lattice, which accumulate elastic energy. Hence the higher value of the compressive residual stress.

5. Conclusions

In this paper, an innovative FEM of a ball burnishing process has been presented. Compared to other models found in the bibliography and presented in the introduction of this paper, this one incorporate and combines three distinctive features:
  • It evaluates three-dimensional interaction between solids (ball and surface topology).
  • It incorporates the 3D texture of a real surface machined through ball-end milling.
  • The actual surface residual stress after machining has been embedded in the system.
The different simulations performed have proven that the relative direction of burnishing passes with regards to the original direction of the original ball-end milling do not influence the results in terms of texture or residual stress. In fact, it is the coefficient of friction the factor that primarily dominates the residual stress distribution, being the component perpendicular to ball burnishing the predominant value in the 2-dimensional tensor. The high influence of the coefficient of friction has been explored by calculating the real area of contact between the burnishing ball and the surface, concluding that this area increases as the coefficient of friction is higher, and causes a better engagement of the ball with the material. Hence the lower burnishing pressure that provokes a lower reduction of the surface texture. At the same time, the compressive residual stress values increase with a higher value of the coefficient of friction. However, the model suggests that a lack of friction could derive in residual stress relaxation in the burnishing direction.
The comparison of the model outputs with experimental results, both in texture and deep residual stress terms, show that a coefficient of friction around 0.15 is the most representative of the actual process. It can also be stated that surface texture and residual stress cannot be simultaneously improved for any coefficient of friction, at least with the ball burnishing conditions that have been simulated in this model.

Author Contributions

Conceptualization, R.J.-M.; methodology, R.J.-M., J.A.T.-R. and J.L.; software, C.A.; validation, R.J.-M., J.A.T.-R., J.L. and A.E.-U.; formal analysis, C.A. and R.J.-M.; investigation, C.A. and R.J.-M.; resources, R.J.-M., J.A.T.-R. and J.L.; data curation, C.A.; writing—original draft preparation, C.A.; writing—review and editing, R.J.-M., J.A.T.-R., J.L. and A.E.-U.; visualization, R.J.-M.; supervision, J.A.T.-R.; project administration, J.L.; funding acquisition, R.J.-M. and J.A.T.-R. All authors have read and agreed to the published version of the manuscript.

Funding

Financial support for this study was provided by the Ministry of Science, Innovation and Universities of Spain, through grant RTI2018-101653-B-I00, which is greatly appreciated. Also by the regional government of Catalonia and FEDER funds for regional development through grant IU68-016744.

Conflicts of Interest

The authors declare no conflict of interest.

Abbreviations

The following abbreviations and symbols are used in this manuscript:
F E M Finite element model
EYoung’s modulus
A b Area of contact during burnishing
p b Burnishing pressure
F b Burnishing force
KStress for unitary strain
nSelf-hardening coefficient
P a Average surface roughness of the P profile
P q Root mean square surface roughness of the P profile
P s m Mean period of the P profile
u i Vertical displacement of the nodes in the i direction
S a Average surface texture amplitude
S q Root mean square surface texture amplitude
S 10 z Mean 10 height-peak texture amplitude
σ 0 . 2 Elastic limit at 0.2% deformation
ϵ Real plastic strain
σ x Residual stress along the burnishing direction
σ z Residual stress along the machining direction i.e., perpendicular to the burnishing direction
τ x z Shear stress in the xz plane
μ Coefficient of friction

References

  1. Nalla, R.; Altenberger, I.; Noster, U.; Liu, G.; Scholtes, B.; Ritchie, R. On the influence of mechanical surface treatments—deep rolling and laser shock peening—on the fatigue behavior of Ti–6Al–4V at ambient and elevated temperatures. Mater. Sci. Eng. A 2003, 355, 216–230. [Google Scholar] [CrossRef]
  2. Balland, P.; Tabourot, L.; Degre, F.; Moreau, V. Mechanics of the burnishing process. Precis. Eng. 2013, 37, 129–134. [Google Scholar] [CrossRef]
  3. Prevéy, P.S. The Effect of Cold Work on the Thermal Stability of Residual Compression in Surface Enhanced IN718; Technical Report; Lambda Research: Cincinnati, OH, USA, 2000. [Google Scholar]
  4. Jerez-Mesa, R.; Travieso-Rodríguez, J.A.; Landon, Y.; Dessein, G.; Lluma-Fuentes, J.; Wagner, V. Comprehensive analysis of surface integrity modification of ball-end milled Ti-6Al-4V surfaces through vibration-assisted ball burnishing. J. Mater. Process. Technol. 2019, 267, 230–240. [Google Scholar] [CrossRef]
  5. Alghazoul, R.; Makki, A.; Abdel Wahab, M. Improvement of Flat Surfaces Quality of Aluminum Alloy 6061-O By A Proposed Trajectory of Ball Burnishing Tool. CMC Comput. Mater. Contin. 2019, 61, 555–568. [Google Scholar]
  6. Swirad, S. The effect of burnishing parameters on steel fatigue strength. Nonconv. Technol. Rev. 2007, 1, 113–118. [Google Scholar]
  7. García-Granada, A.A.; Gomez-Gras, G.; Jerez-Mesa, R.; Travieso-Rodriguez, J.A.; Reyes, G. Ball-burnishing effect on deep residual stress on AISI 1038 and AA2017-T4. Mater. Manuf. Process. 2017, 32, 1279–1289. [Google Scholar] [CrossRef]
  8. Gomez-Gras, G.; Travieso-Rodriguez, J.A.; Jerez-Mesa, R.; Lluma-Fuentes, J.; de la Calle, B.G. Experimental study of lateral pass width in conventional and vibrations-assisted ball burnishing. Int. J. Adv. Manuf. Technol. 2016, 87, 363–371. [Google Scholar] [CrossRef] [Green Version]
  9. Robles, A.S.; De la Peña, J.Á.D.; García, A.d.J.B.; Gómez, E.A.; MORA, H.P.; Robles, N.S. El proceso de bruñido con bola: Estado del arte de una tecnología en desarrollo. DYNA 2017, 92, 28–33. [Google Scholar] [CrossRef] [Green Version]
  10. Ding, Z.; Zhao, J.; Liu, H.; Dong, Y. Effects of ball burnishing on surface properties of SKD11 mold steel. Eng. Res. Express 2020, 2, 025004. [Google Scholar] [CrossRef]
  11. Hamadache, H.; Bourebia, M.; Taamallah, O.; Laouar, L. Surface hardening of 36 NiCrMo 6 steel by ball burnishing process. Mater. Res. Express 2019, 6, 106538. [Google Scholar] [CrossRef]
  12. Kuznetsov, V.; Smolin, I.Y.; Dmitriev, A.; Tarasov, S.Y.; Gorgots, V. Toward control of subsurface strain accumulation in nanostructuring burnishing on thermostrengthened steel. Surf. Coat. Technol. 2016, 285, 171–178. [Google Scholar] [CrossRef]
  13. González-Rojas, H.A.; Travieso-Rodríguez, J.A. Physical model to predict the ball-burnishing forces. Adv. Mater. Res. 2012, 498, 195–200. [Google Scholar] [CrossRef]
  14. Yen, Y.; Sartkulvanich, P.; Altan, T. Finite element modeling of roller burnishing process. CIRP Ann. 2005, 54, 237–240. [Google Scholar] [CrossRef]
  15. Sartkulvanich, P.; Altan, T.; Jasso, F.; Rodriguez, C. Finite element modeling of hard roller burnishing: An analysis on the effects of process parameters upon surface finish and residual stresses. J. Manuf. Sci. Eng. 2007, 129, 705–716. [Google Scholar] [CrossRef]
  16. Mohammadi, F.; Sedaghati, R.; Bonakdar, A. Finite element analysis and design optimization of low plasticity burnishing process. Int. J. Adv. Manuf. Technol. 2014, 70, 1337–1354. [Google Scholar] [CrossRef]
  17. Bougharriou, A.; Saï, K.; Bouzid, W. Finite element modelling of burnishing process. Mater. Technol. 2010, 25, 56–62. [Google Scholar] [CrossRef]
  18. Rao, J.M.; Reddy, A.C.K.; Rao, P.R.; Mayuri, B. Finite element approach for the prediction of residual stresses in aluminum workpieces produced by roller burnishing. Int. J. Des. Manuf. Technol. 2011, 2, 0976–6995. [Google Scholar]
  19. Maximov, J.; Duncheva, G. Finite element analysis and optimization of spherical motion burnishing of low-alloy steel. Proc. Inst. Mech. Eng. Part C J. Mech. Eng. Sci. 2012, 226, 161–176. [Google Scholar] [CrossRef]
  20. Rodríguez, A.; de Lacalle, L.L.; Celaya, A.; Lamikiz, A.; Albizuri, J. Surface improvement of shafts by the deep ball-burnishing technique. Surf. Coat. Technol. 2012, 206, 2817–2824. [Google Scholar] [CrossRef]
  21. Sayahi, M.; Sghaier, S.; Belhadjsalah, H. Finite element analysis of ball burnishing process: Comparisons between numerical results and experiments. Int. J. Adv. Manuf. Technol. 2013, 67, 1665–1673. [Google Scholar] [CrossRef]
  22. Saldaña-Robles, A.; Aguilera-Gómez, E.; Plascencia-Mora, H.; Ledesma-Orozco, E.; Reveles-Arredondo, J.; Saldaña-Robles, N. FEM burnishing simulation including roughness. Mechanik 2015, 88, 79–91. [Google Scholar] [CrossRef] [Green Version]
  23. Teimouri, R.; Amini, S.; Guagliano, M. Analytical modeling of ultrasonic surface burnishing process: Evaluation of residual stress field distribution and strip deflection. Mater. Sci. Eng. A 2019, 747, 208–224. [Google Scholar] [CrossRef]
  24. Teimouri, R.; Amini, S.; Bami, A.B. Evaluation of optimized surface properties and residual stress in ultrasonic assisted ball burnishing of AA6061-T6. Measurement 2018, 116, 129–139. [Google Scholar] [CrossRef]
  25. Jerez-Mesa, R.; Landon, Y.; Travieso-Rodriguez, J.A.; Dessein, G.; Lluma-Fuentes, J.; Wagner, V. Topological surface integrity modification of AISI 1038 alloy after vibration-assisted ball burnishing. Surf. Coat. Technol. 2018, 349, 364–377. [Google Scholar] [CrossRef] [Green Version]
  26. Withers, P.J.; Bhadeshia, H. Residual stress. Part 1–measurement techniques. Mater. Sci. Technol. 2001, 17, 355–365. [Google Scholar] [CrossRef]
  27. Jerez-Mesa, R.; Travieso-Rodriguez, J.A.; Gomez-Gras, G.; Lluma-Fuentes, J. Development, characterization and test of an ultrasonic vibration-assisted ball burnishing tool. J. Mater. Process. Technol. 2018, 257, 203–212. [Google Scholar] [CrossRef] [Green Version]
  28. Taljat, B.; Pharr, G.M. Development of pile-up during spherical indentation of elastic–plastic solids. Int. J. Solids Struct. 2004, 41, 3891–3904. [Google Scholar] [CrossRef]
  29. Wang, Q.J.; Chung, Y.W. Encyclopedia of Tribology; Springer: Berlin, Germany, 2013. [Google Scholar]
Figure 1. Left. SOLID186 homogeneous structural solid geometry. Right. Overview of modelled surface, boundary conditions and path followed during ball burnishing.
Metals 10 00638 g001
Figure 2. Real roughness profile obtained through ball end milling (discontinuous line) and approximate profile extruded to generate the surface (continuous line).
Metals 10 00638 g002
Figure 3. Flow diagram showing the simulation steps of ball burnishing.
Metals 10 00638 g003
Figure 4. Evolution of residual stress (MPa) as the coefficient of friction increases. (a). Along the burnishing direction. (b). Perpendicular to the burnishing direction.
Metals 10 00638 g004
Figure 5. Deep residual stress (MPa) perpendicular to the burnishing direction ( σ z ) as the coefficient of friction increases.
Metals 10 00638 g005
Figure 6. Averaged residual stress of all nodes down to a 15- μ m depth vs coefficient of friction. Blue band: experimental residual stress obtained through X-ray diffraction.
Metals 10 00638 g006
Figure 7. Surface topology after simulation ( μ m). Left. μ = 0. Right. μ = 0.3
Metals 10 00638 g007
Figure 8. Evolution of process descriptors along the different steps of the simulation for different coefficients of friction. Top. Contact area between the ball and surface material. Bottom. Burnishing pressure.
Metals 10 00638 g008
Table 1. Mechanical properties of the AISI 1038 alloy considered in the FEM.
TestE (GPa) σ 0 . 2 (MPa)K (MPa)n
Uniaxial tensile stress tests211.34448211170.190
Ultrasound testing211.795---
Table 2. Texture (S) and 2D roughness profile (P) parameters defining the texture implemented in the FEM.
ParameterReal ValueValue for the Extruded Profile
Roughness profile (2D) P a ( μ m)4.254
P s m (mm)0.52460.5
P z ( μ m)15.451815
Texture (3D) S a ( μ m)4.4964
S q ( μ m)5.0582
S 10 z ( μ m)15.8388
Table 3. Flat residual stress tensor implemented on the surface due to previous machining based on experimental tests.
σ x (MPa) σ z (MPa) τ xz (MPa)
−368 ± 11−537 ± 26−8 ± 4
Table 4. Six FEM scenarios and justification regarding the reason to include them in the study.
Simulation σ x (MPa) σ z (MPa) τ xz (MPa) μ Justification
A.0−368 ± 11−537 ± 26−8 ± 40
A.010.1Assess the effect of the
A.020.2coefficient of friction
A.030.3
B.0−537 ± 26−368 ± 11−8 ± 40Assess the effect of changing the burnishing
B.030.3direction with regards to the original machining
Table 5. Maximum compressive residual stress obtained for each FEM simulation.
Simulation μ Original SurfacesSimulated Surfaces
σ x (MPa) σ z (MPa) max σ x (MPa) max σ z (MPa)
A.00−368 ± 11−537 ± 26−268−948
A.010.1−361−1001
A.020.2−393−1140
A.030.3−407−1290
B.00−537 ± 26−368 ± 11−632−944
B.030.3−632−1290
Table 6. Surface amplitude descriptive parameters for the experimental surfaces and surfaces derived from the five FEMs.
SourceState of Surface S a ( μ m) S q ( μ m)
Experimental [25]Before burnishing4.2544.810
After burnishing1.9562.430
FEMA.01.4651.947
A.011.6601.970
A.022.2162.823
A.032.7452.961
B.01.4101.710
B.032.7823.012
Table 7. Pile up effect estimation after all simulations with the same residual stress distribution.
Simulation μ Pile up at Boundaries ( μ m)
A.003.6–6.2
A.010.13.8–6.4
A.020.26.0–8.9
A.030.38.7–12.2
Table 8. Estimation of local von Mises and maximum shear stress for simulations with different coefficients of friction.
Simulation μ τ max (MPa) τ max Increase σ vM (MPa) σ vM Increase
A.00355 ± 55base800 ± 50base
A.010.1415 ± 3517%940 ± 6018%
A.020.2470 ± 2032%1065 ± 6533%
A.030.3535 ± 3551%1250 ± 6057%

