Tool Performance Optimization While Machining Aluminium-Based Metal Matrix Composite
by
 , , , and
Usama Umer
1,* ,
,
Mustufa Haider Abidi
1 ,
,
Jaber Abu Qudeiri
2,
Hisham Alkhalefah
1 and
Hossam Kishawy
3 1
Advanced Manufacturing, Institute, King Saud University, Riyadh 11421, Saudi Arabia
2
Mechanical Engineering Department, College of Engineering, United Arab Emirates University, Al-Ain-15551, UAE
3
Machining Research Laboratory, University of Ontario Institute of Technology, Oshawa, ON L1G 0C5, Canada
*
Author to whom correspondence should be addressed.
Metals 2020, 10(6), 835; https://0-doi-org.brum.beds.ac.uk/10.3390/met10060835
Submission received: 14 April 2020
/
Revised: 19 June 2020
/
Accepted: 22 June 2020
/
Published: 24 June 2020
(This article belongs to the Special Issue Optimization and Analysis of Metal Cutting Processes)
Abstract
:Finite element (FE) models and the multi objective genetic algorithm (MOGA-II) have been applied for tool performance optimization while machining aluminum-based metal matrix composites. The developed and verified FE models are utilized to generate data for the full factorial design of experiment (DOE) plan. The FE models consist of a heterogenous workpiece, which assumes uniform distribution of reinforced particles according to size and volume fraction. Cutting forces, chip morphology, temperature contours, stress distributions in the workpiece and tool by altering cutting speed, feed rate, and reinforcement particle size can be estimated using developed FE models. The DOE data are then utilized to develop response surfaces using radial basis functions. To reduce computational time, these response surfaces are used as solver for optimization runs using MOGA-II. Tool performance has been optimized with regard to cutting temperatures and stresses while setting a limit on specific cutting energy. Optimal solutions are found with low cutting speed and moderate feed rates for each particle size metal matrix composite (MMC).
1. Introduction
A composite is made up of a base or matrix material with dispersed elements in the forms of fibers, whiskers, and particles. Both matrix and dispersed components possess their own microstructure and properties, and the patterns of distribution decide particular properties such as strength and wear resistance. Metal matrix composites (MMCs) are utilized in numerous fields such as automotive and aerospace industries owing to their exceptional attributes such as high rigidity, superior resistance to corrosion and wear, and satisfactory fatigue life. Typically, the MMCs are fabricated using near net shape production processes. Machining processes are, however, unavoidable for obtaining the required characteristics for the composite parts.
MMCs are usually made up of soft metallic material acting as a matrix along with hard ceramic reinforcement particles as dispersed elements. During a machining process, these hard-reinforcing particles result in a shorter tool life and unwanted workpiece surface. High cutting forces and excessive tool wear are common observations while machining MMCs, for example, in a recent study by Repeto et al. [1]. Good control of MMC machining is thus an arduous task, and an in-depth knowledge of the characteristics of reinforcement particles on process variables is necessary.
There have been several attempts made to model machining of MMCs and some of the major research works are described in this section. Kishawy et al. [2] predicted the cutting forces in orthogonal machining of MMCs by utilizing specific cutting energy and shear area. Pramanik et al. [3] discussed a mechanistic model for cutting forces during machining of aluminium-based MMC. Three components were considered for each cutting and thrust force, that is, force owing to chip formation, force owing to the ploughing action, and force required for particle fracture. Merchant’s analysis was employed in combination with slip line field theory and Griffith theory of fracture to calculate the forces needed for chip formation, ploughing, and fracture of particles, respectively. A good correlation was reported between the proposed model and the experimental results. Ghandehariun et al. [4] developed an analytical cutting force model. It considers the impacts of reinforcement particle size and volume fraction. The model and experimental results were compared against various compositions of workpieces and process parameters and good correlations were testified.
With advancements in computational technology, the use of numerical models to enhance manufacturing processes is exponentially increasing and MMC machining is no exception. Researchers primarily use three techniques to model MMCs’ machining, including micromechanics models, homogeneous material equivalent (EHM) models, and hybrid models. Development of models based on micromechanics approach poses several challenges with the current modeling techniques. One of the main problems is the simulation of the interface between matrix and reinforcing particles, which can imitate the real debonding phenomenon. When properly implemented, these models can simulate particle fracture and debonding from the matrix as well as calculate global variables such as cutting forces, chip morphology, stress distribution, and temperature distribution. In contrast, EHM model implementation is quite similar to homogeneous material modeling, once a constitutive material model is available. With reasonable accuracy, these models can predict cutting forces, chip morphology, and stress and temperature distributions. However, the major drawback of these models is the inability to simulate reinforced particle dynamics during chip evolution. EHM is used in hybrid models to predict global variables such as cutting forces and chip morphology, while the micromechanics method is used as a sub-model to simulate phenomena around the tip of the tool to visualize tool–particles and tool–chip interactions.
An earlier attempt was made by Monaghan and Brazil [5] to develop a micromechanics-based model. They predicted residual stresses and debonding of particles from the matrix during MMC machining. The failure at the particle–matrix interface was estimated based on stress distribution and no insight was provided regarding the particle–matrix bonding. In another study, Ramesh et al. [6] simulated particle debonding and predicted cutting forces and stress distributions during MMC machining with a diamond tool. Different scenarios were considered for tool–material interactions and normal and shear stresses were predicted for each case. El-Gallab and Sklad [7] modelled residual stresses and sub-surface damage during orthogonal cutting of aluminum-based SiC-reinforced MMC. Feed rate was found to be the dominant factor to control both sub-surface damage and residual stresses. Both of these performance measures increase upon increasing the feed rate.
Pramanik et al. [8] conducted a comprehensive study for exploring the tool–particle interactions during MMC orthogonal machining. Stress and strain distributions were calculated for various particle positions with respect to the cutting tool and showed that they are accountable for particles debonding from the matrix, sub-surface damage, and wear of the tool.
Zhou et al. [9] proposed a hybrid approach for modeling machining of SiC-reinforced aluminum-based MMC. They utilized a 2D EHM model to evaluate stress distributions and the results were transferred to a micromechanics model to simulate reinforcement particles debonding. An improved hybrid model was illustrated by Dandekar and Shin [10] for machining of MMC. Cohesive zone elements (CZEs) were applied as the interface between workpiece and reinforcement particles to model particle debonding. They calculated sub-surface damages from the proposed model and verified them experimentally. Two models were developed with CZE with and without a parting line. While the other two developed without CZE and the particle debonding were expected from matrix failure around the interface. It was concluded that the model with CZE and parting line exhibited better results with respect to cutting forces and chip morphology. Surface defects were modeled by Tao et al. [11] by utilizing the meso-scale finite element model during machining of a high volume fraction of Al/SiC composites. Two types of models were developed, one with round reinforcement particles and the other with polygonal reinforcement particles. The results showed that micro fracture, particle’s rotation and pull-out, and big cleavage are the main mechanisms for the formation of surface defects.
A detailed study regarding tool–particle interactions using micromechanics-based models was performed by Ghandehariun et al. [12]. These models were able to simulate particle debonding and fracture and the models were verified by experimental cutting force data. In another study [13], the same models were used to assess the influences of varying cutting speed on different performance measures such as cutting forces, chip morphology, and particles’ debonding and fracture. Zhou et al. [14] used FE models and validated that through experimental investigations to study the machinability of Al/SiC MMCs containing a high volume fraction of SiC particles. The accuracy of the predictions of surface defects has been shown to be largely reliant on the fracture model adopted for the reinforcement particles. They concluded that broken edges are mainly owing to the creation of the negative shear plane in the workpiece.
Pramanik and Zhang [15] developed FE models to analyze particle debonding and fracture during MMC machining by evaluating stresses and strains in the workpiece. The investigations were carried out along primary, secondary, and tertiary shear zones. They demonstrated that particle fracturing occurs instantly upon contact with the cutting tool inside the tertiary shear zone. In contrast, both debonding and fracture happen for the particles at the secondary shear zone as they are interacting with the tool and other particles.
From the above literature analysis, it can be inferred that the modeling work for MMC machining needs improvement in several respects and a substantial amount of the work is lagging in temperature analysis, explicitly with regard to tool performance optimization. The objective of this study is to optimize tool performance in terms of tool stresses and tool–chip interface temperatures while constraining specific cutting energy. The optimization would be carried out by developed FE models, which are able to predict various performance measures like cutting forces, temperature, stresses, and chip morphology. The models are developed using uniform distribution of reinforcement particles in the MMC matrix. Hence, the effect of different particle sizes on output variables can be predicted along with variation in cutting parameters. Therefore, optimized solutions are obtained for each particle size. The FE models are verified by the published results as reported in [16]. In contrast to the traditional approach based on design of experiments (DOE) with real experiments, this method utilizes verified FE models to reduce costly experimental runs. Furthermore, the development of response surfaces eliminates the need to generate new FE models that are not available in the DOE matrix.
2. Materials and Methods
2.1. Finite Element Models
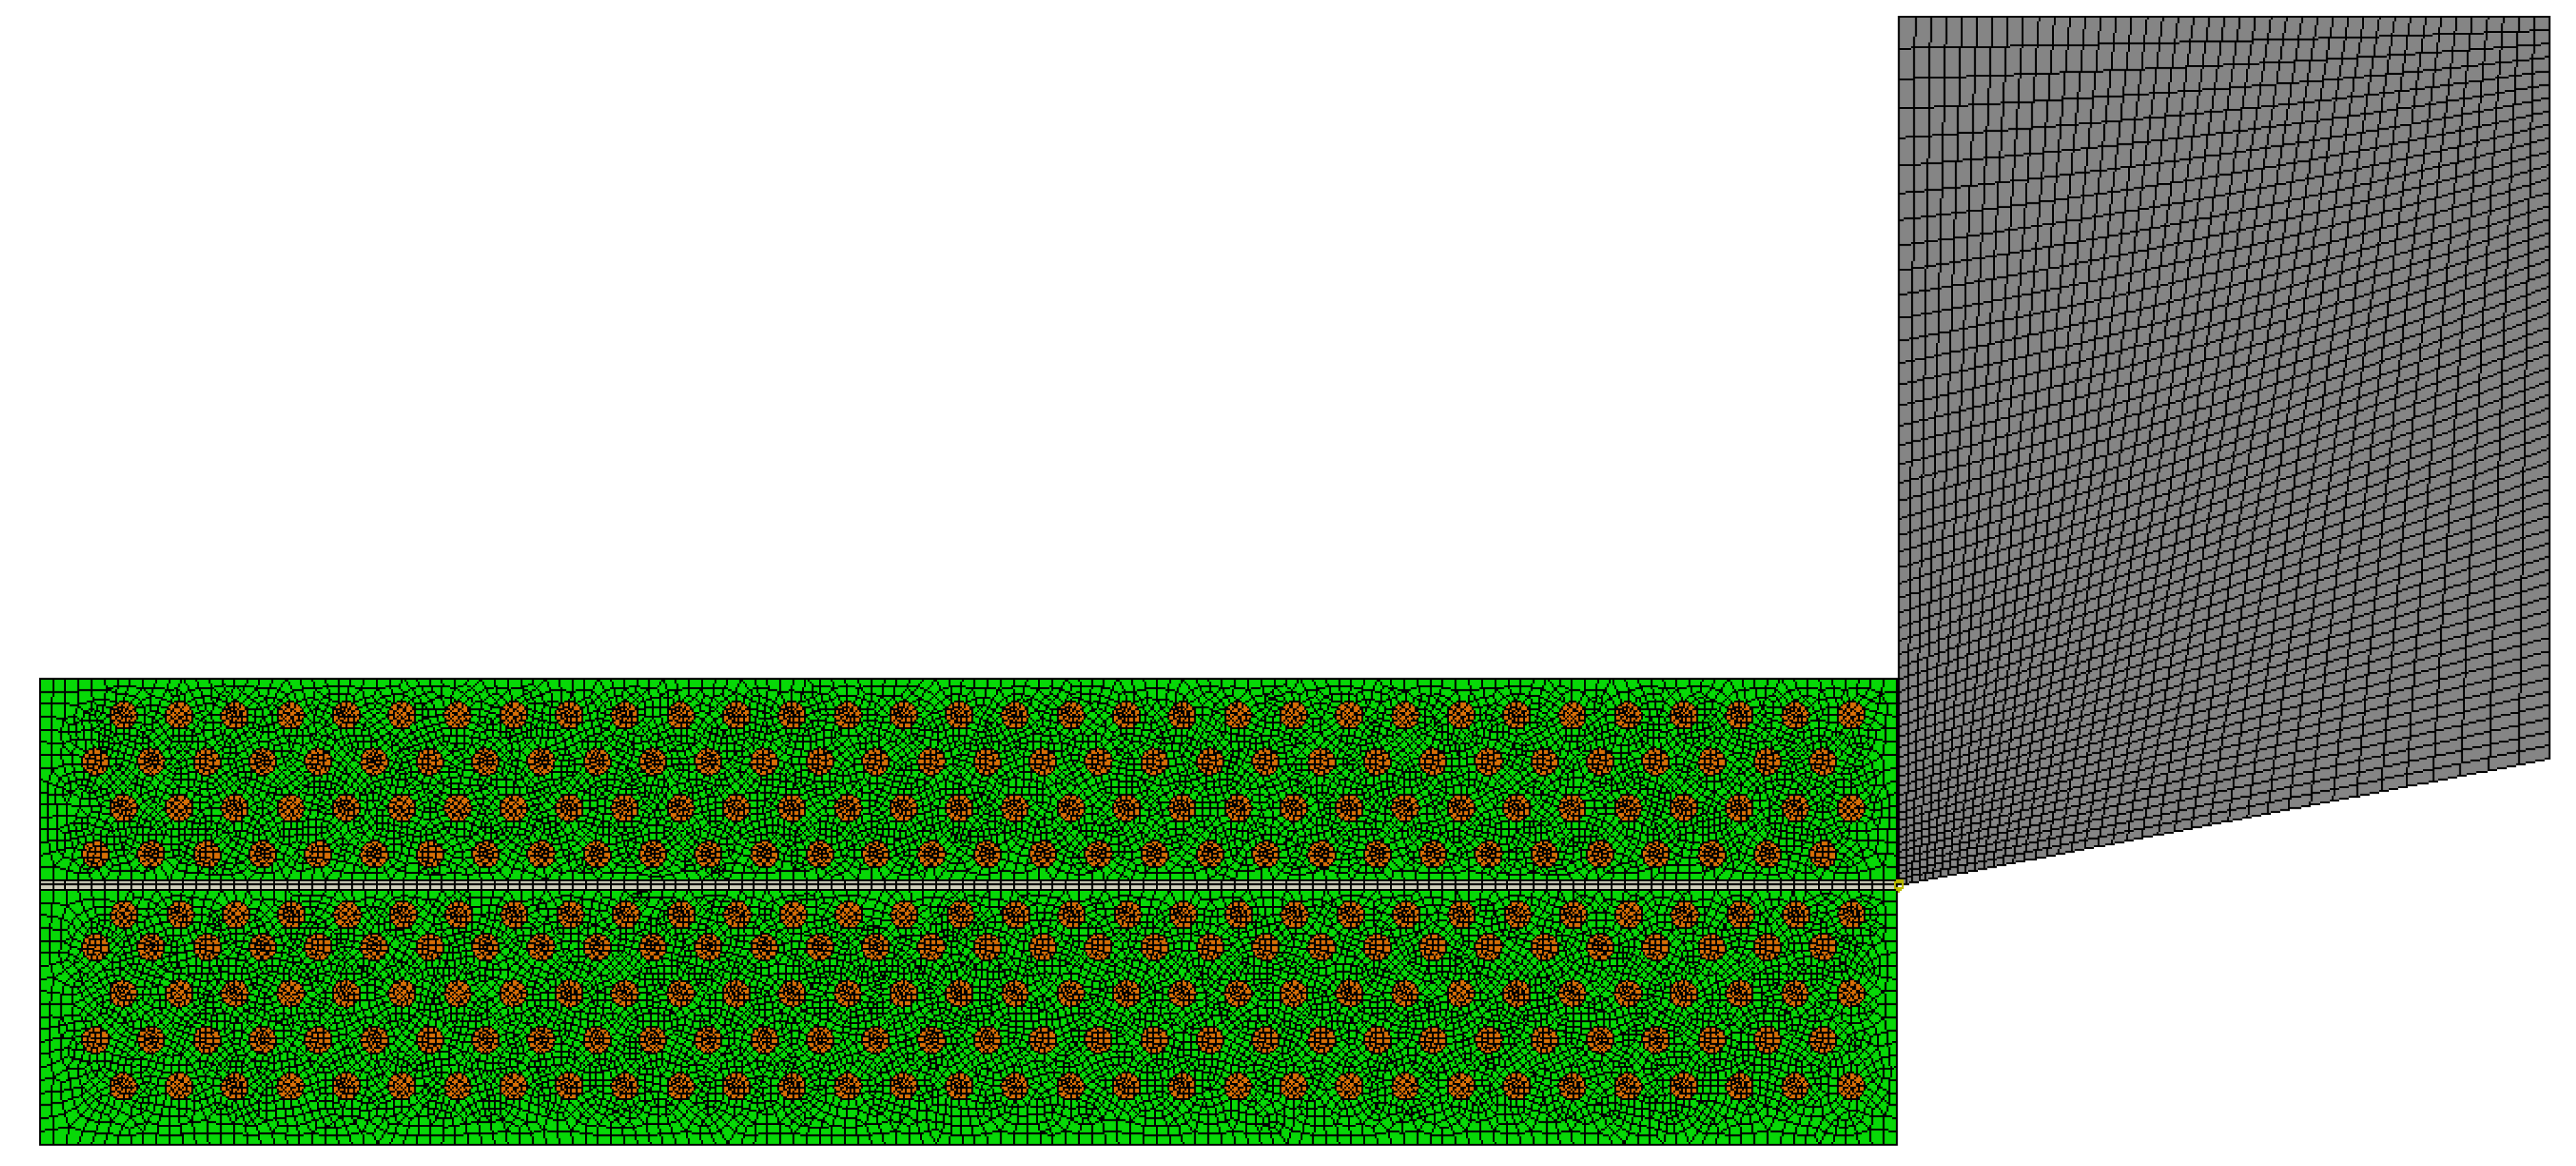
Figure 1 depicts the undeformed mesh for the tool and the workpiece. The workpiece and cutting tool contains a total of 21,836 elements. Mesh was refined at the tool tip to accommodate for high temperature gradients. Four-node continuum plane strain elements with reduced integration and temperature degree of freedom (CPE4RT) were selected for the study. The MMC workpiece was developed assuming circular reinforced particles with uniform distribution, as shown in Figure 1. A single mesh was used for the entire workpiece, so that no tie-constraints between matrix and reinforcement particles were necessary. A parting line was created with assigned damage criterion to facilitate smooth chip formation. ABAQUS/Explicit was utilized for coupled temperature displacement analysis with the fixed workpiece and moving tool.
The developed models were verified using cutting forces and temperature data published in [16]. The MMC workpiece was based on aluminum alloy Al-359 as matrix with silicon carbide particles as reinforcement. The average particles diameters were 10, 15, and 20 µm. The polycrystalline diamond (PCD) cutting tool used for the analysis has an average grain size of 15 μm. Table 1 shows the physical and mechanical properties of the matrix, reinforcement particles, and tool material. The cutting parameters and tool geometry specifications are listed in Table 2.
2.2. Material and Friction Models
Matrix material is considered as temperature-dependent elasto-plastic material until the damage criterion is met. The Johnson-Cook strain, strain rate, and temperature dependent plasticity model were employed to determine the mises flow stress. The model is appropriate for machining processes because the workpiece material is subjected to large strains, high strain rates, and high temperatures. The mises flow stress is given as follows:
where is the equivalent plastic strain, is the equivalent plastic strain rate, is the reference strain rate, is the working temperature, is the transition temperature, and is the workpiece’s melting temperature. The Johnson-Cook equation has five material constants, namely, A for yield stress constant, B for strain hardening constant, n for strain hardening exponent, C for strain rate hardening constant, and m for coefficient of temperature dependence. These material constants were estimated by experiments such as torsion tests, tensile tests, and dynamic split hopkinson bar tests, and can include data across a wide range of strain, strain rates, and temperatures. The Johnson-Cook constants used in the FE model are shown in Table 3 [17].
A parting line composed of sacrificial elements was used to model the chip separation from the workpiece. These elements were assigned with Johnson–Cook progressive damage criterion, which considers strain, strain rate, temperature, and pressure stress. For each item, the damage factor was estimated and is given as follows:
where is the change in equivalent plastic strain during the integration step and is the fracture strain, which depends on strain rate, temperature, pressure, and von mises stress. Damage factor D measures damage in the element; when D = 1.0, fracture will occur, and the element is removed from the simulation. The fracture strain is given by the following:
where is the ratio of pressure stress to von mises stress. D1 to D5 are material constants and determined by tensile and torsion tests. The Johnson–Cook damage parameters for matrix materials are listed in Table 4.
The debonding between matrix and reinforcement is usually modelled by two methods. The first one is to use cohesive zone elements that are degraded with separation. The interface bonding strength of around 50 J/m2 is taken by some researchers [10,12]. The other method is to use matrix element failure around the reinforcement particles and the debonding energy corresponds to the failure stress–strain values as given by the Johnson-Cook damage law in Equation (3).
The coulomb’s friction law is considered to model the contact between tool and workpiece. According to coulomb’s law, when the shear flow stress of the workpiece material is greater than the critical value of frictional stress, there is no sticking and the relative motion or slip will occur, and vice-versa. Therefore, the frictional stress is given by the following:
where s, p, and τ are the frictional, normal, and shear flow stress at the tool rake face, respectively. The coefficient of friction is taken as 0.15 from the work of Zhu and Kishawy [18].
As the computational cost of the explicit analysis depends on the size of the smallest element, the severe deformation in matrix material owing to hard reinforcement particles results in very slow processing. Adding mass artificially to the selected elements can reduce this problem to some extent and helps in speeding up the processing time. This option is selected for MMC cutting simulation and is termed as mass scaling in ABAQUS/Explicit® [19].
3. Results and Discussions
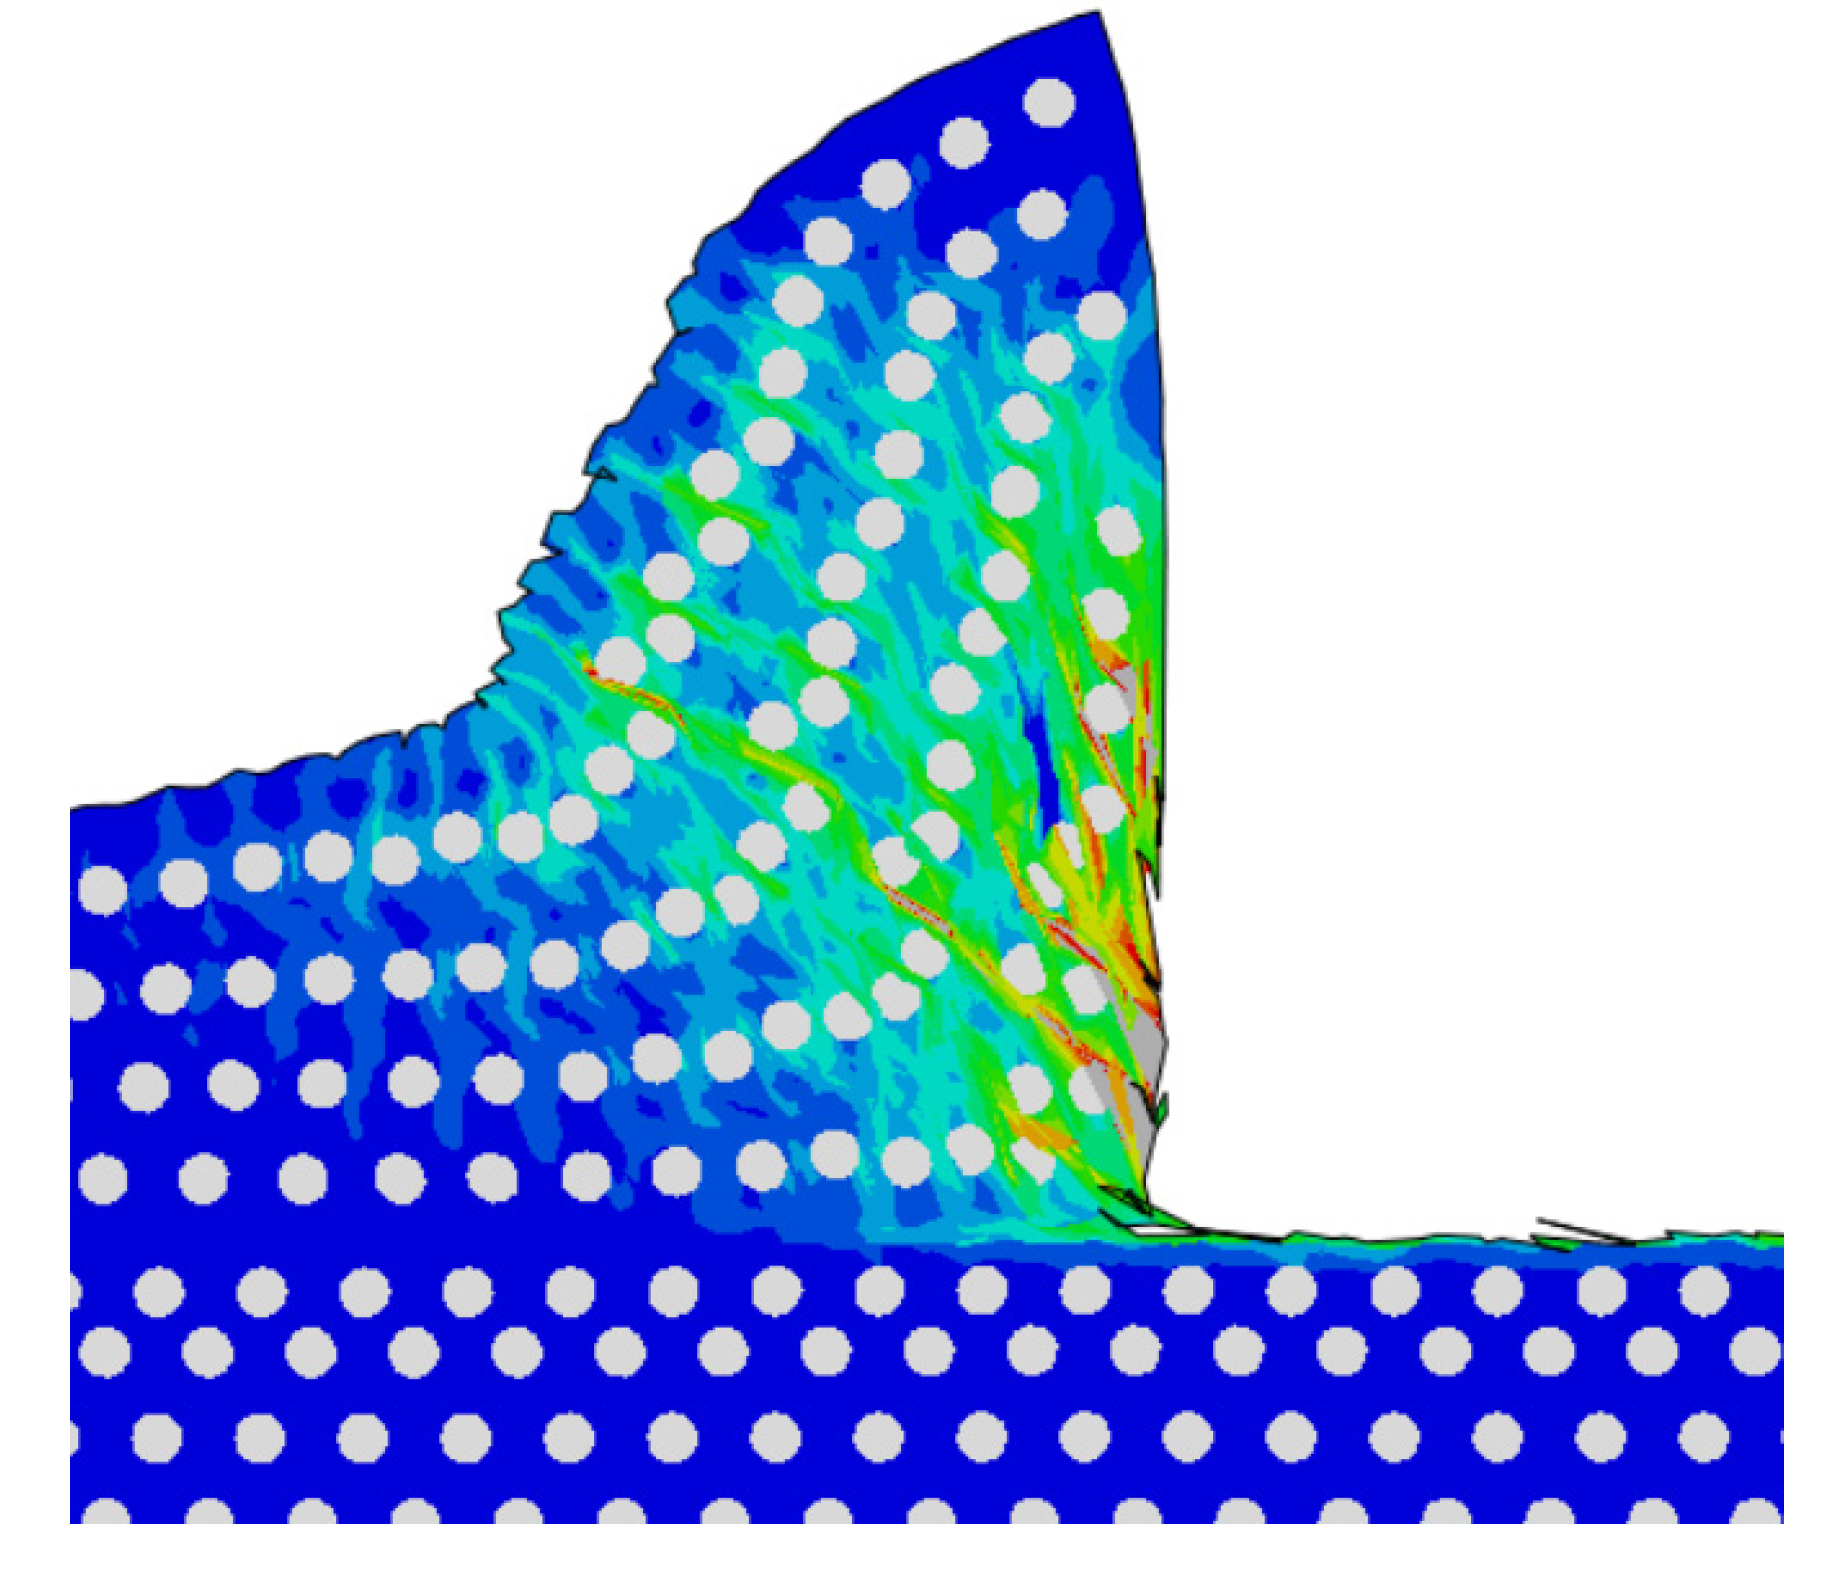
The resulting chip formation with 60 m/min cutting speed and 0.1 mm/rev feed rate is shown in Figure 2. High strained regions can be visualized on the chip surface as the aluminum alloy is heavily deformed between hard SiC particles forming recurring shear bands. The higher temperatures at the tool–chip interface along with sticking friction also result in large strains [16,20].
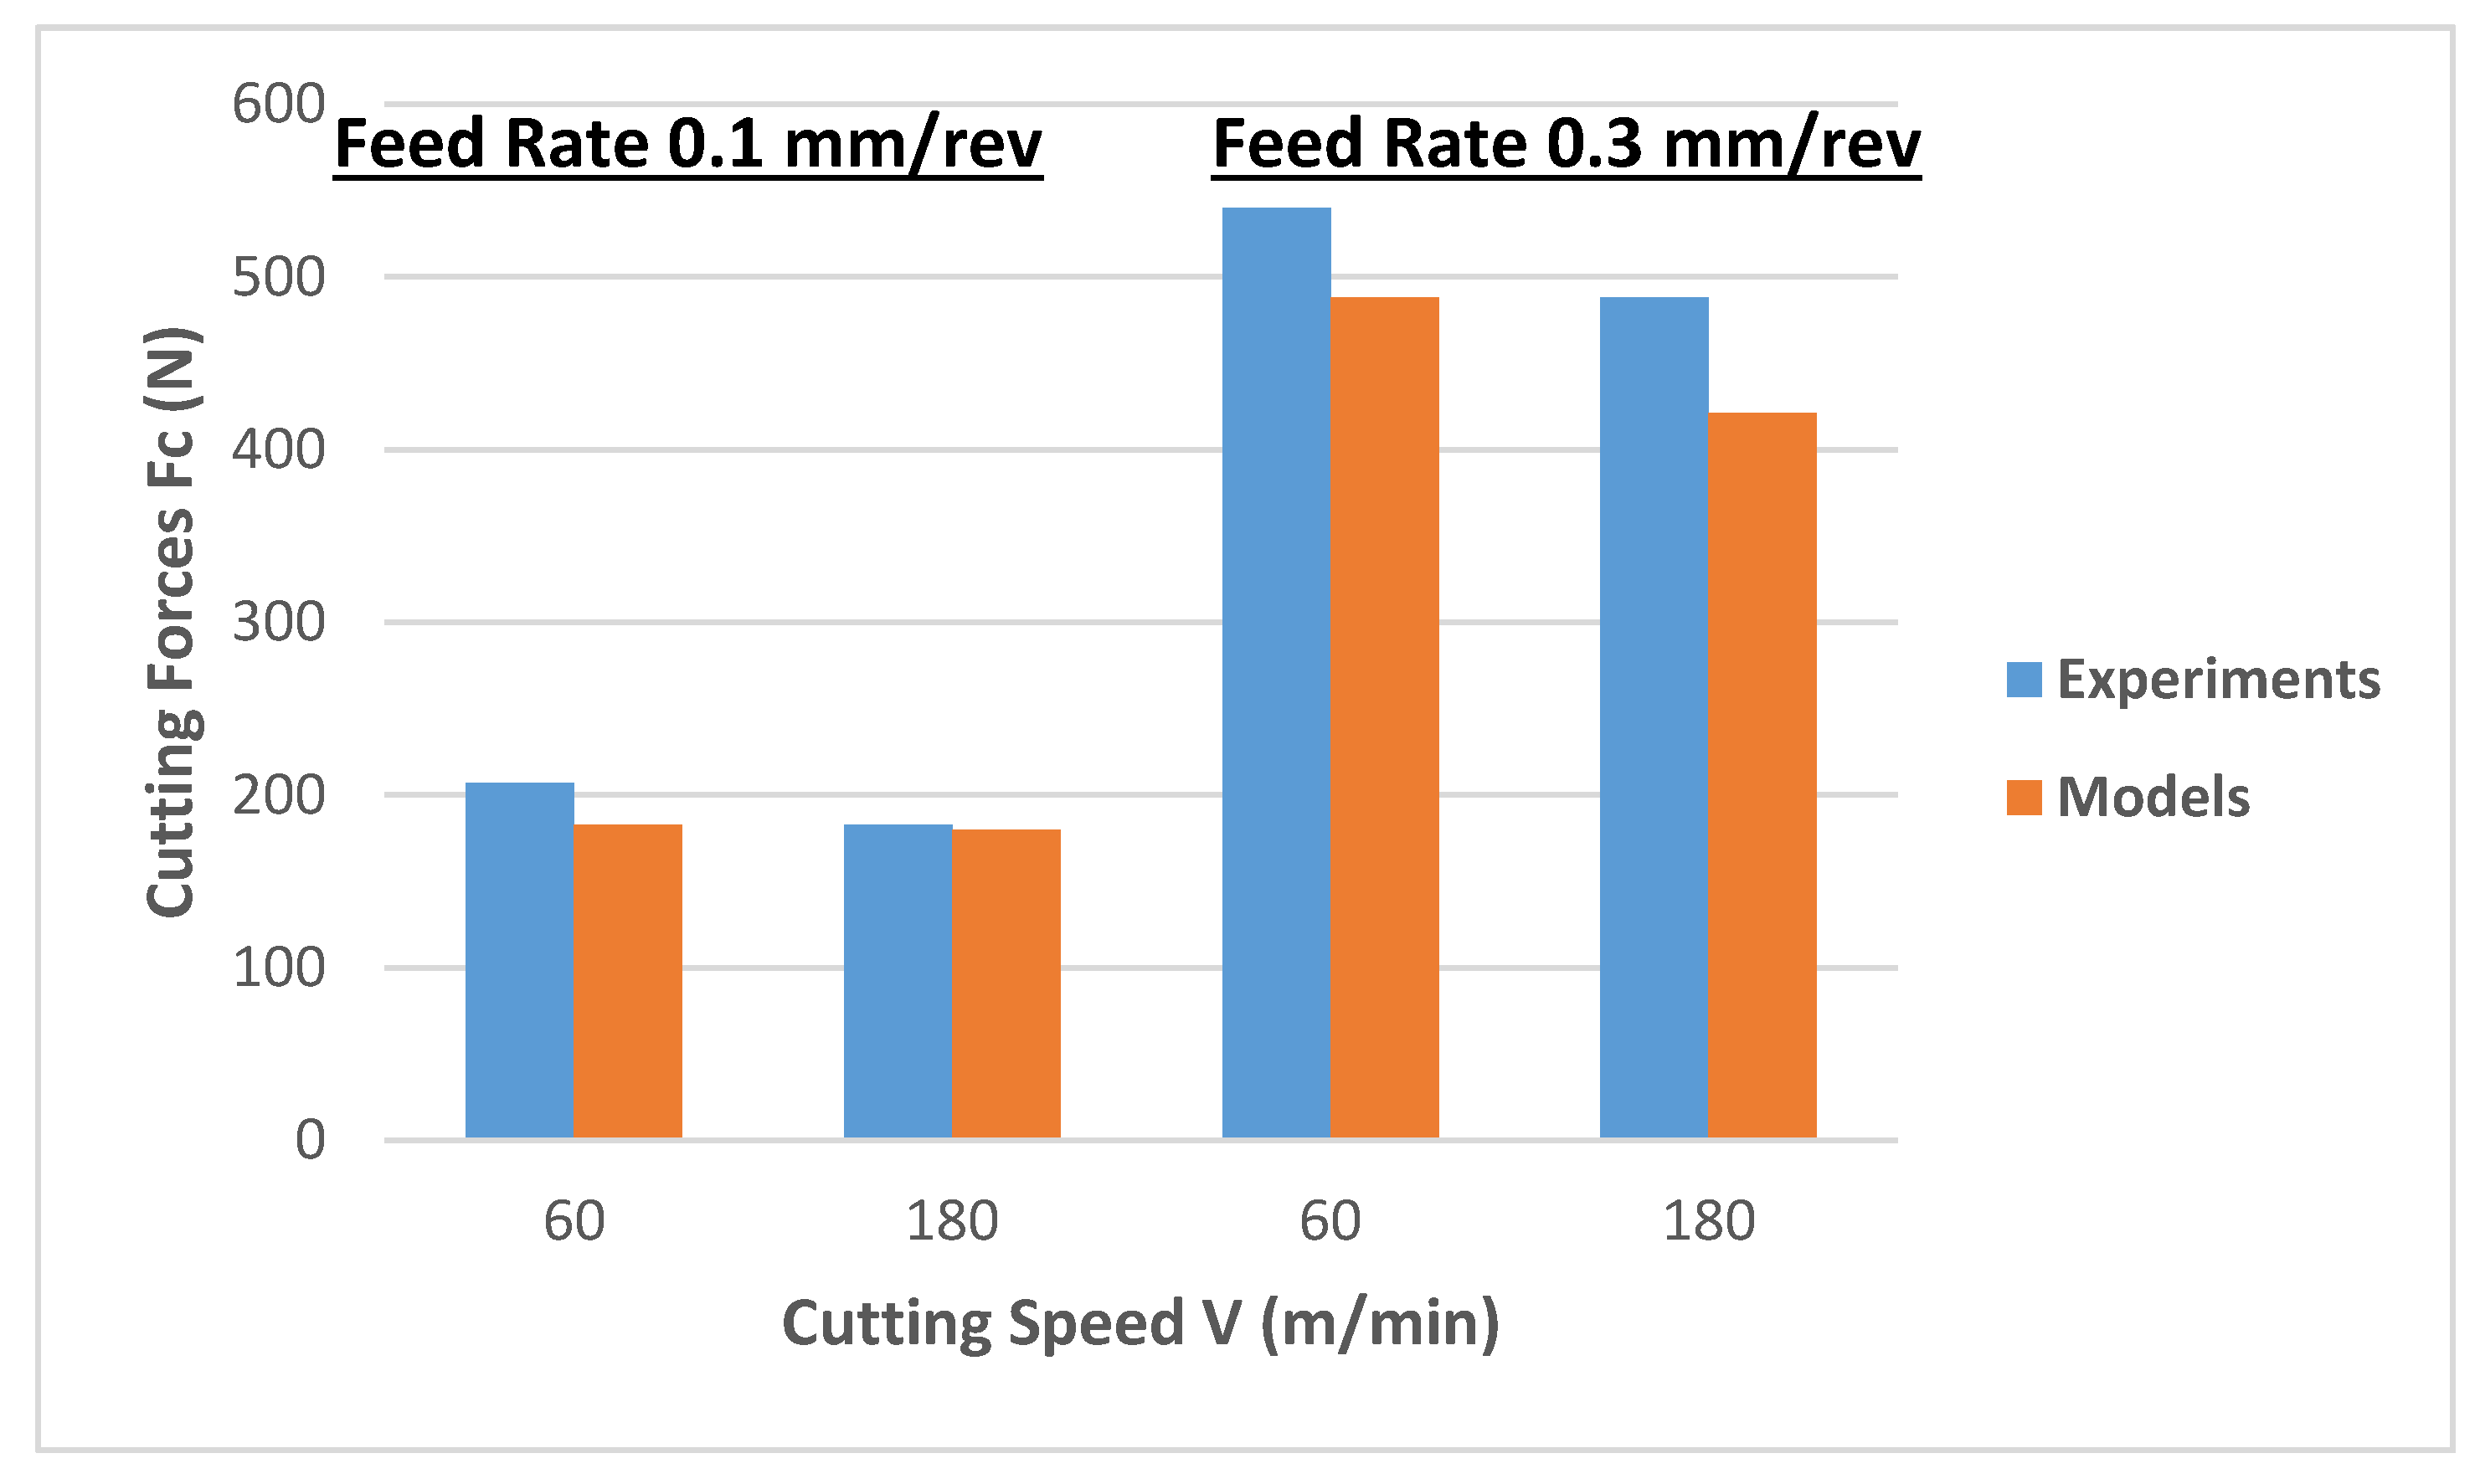
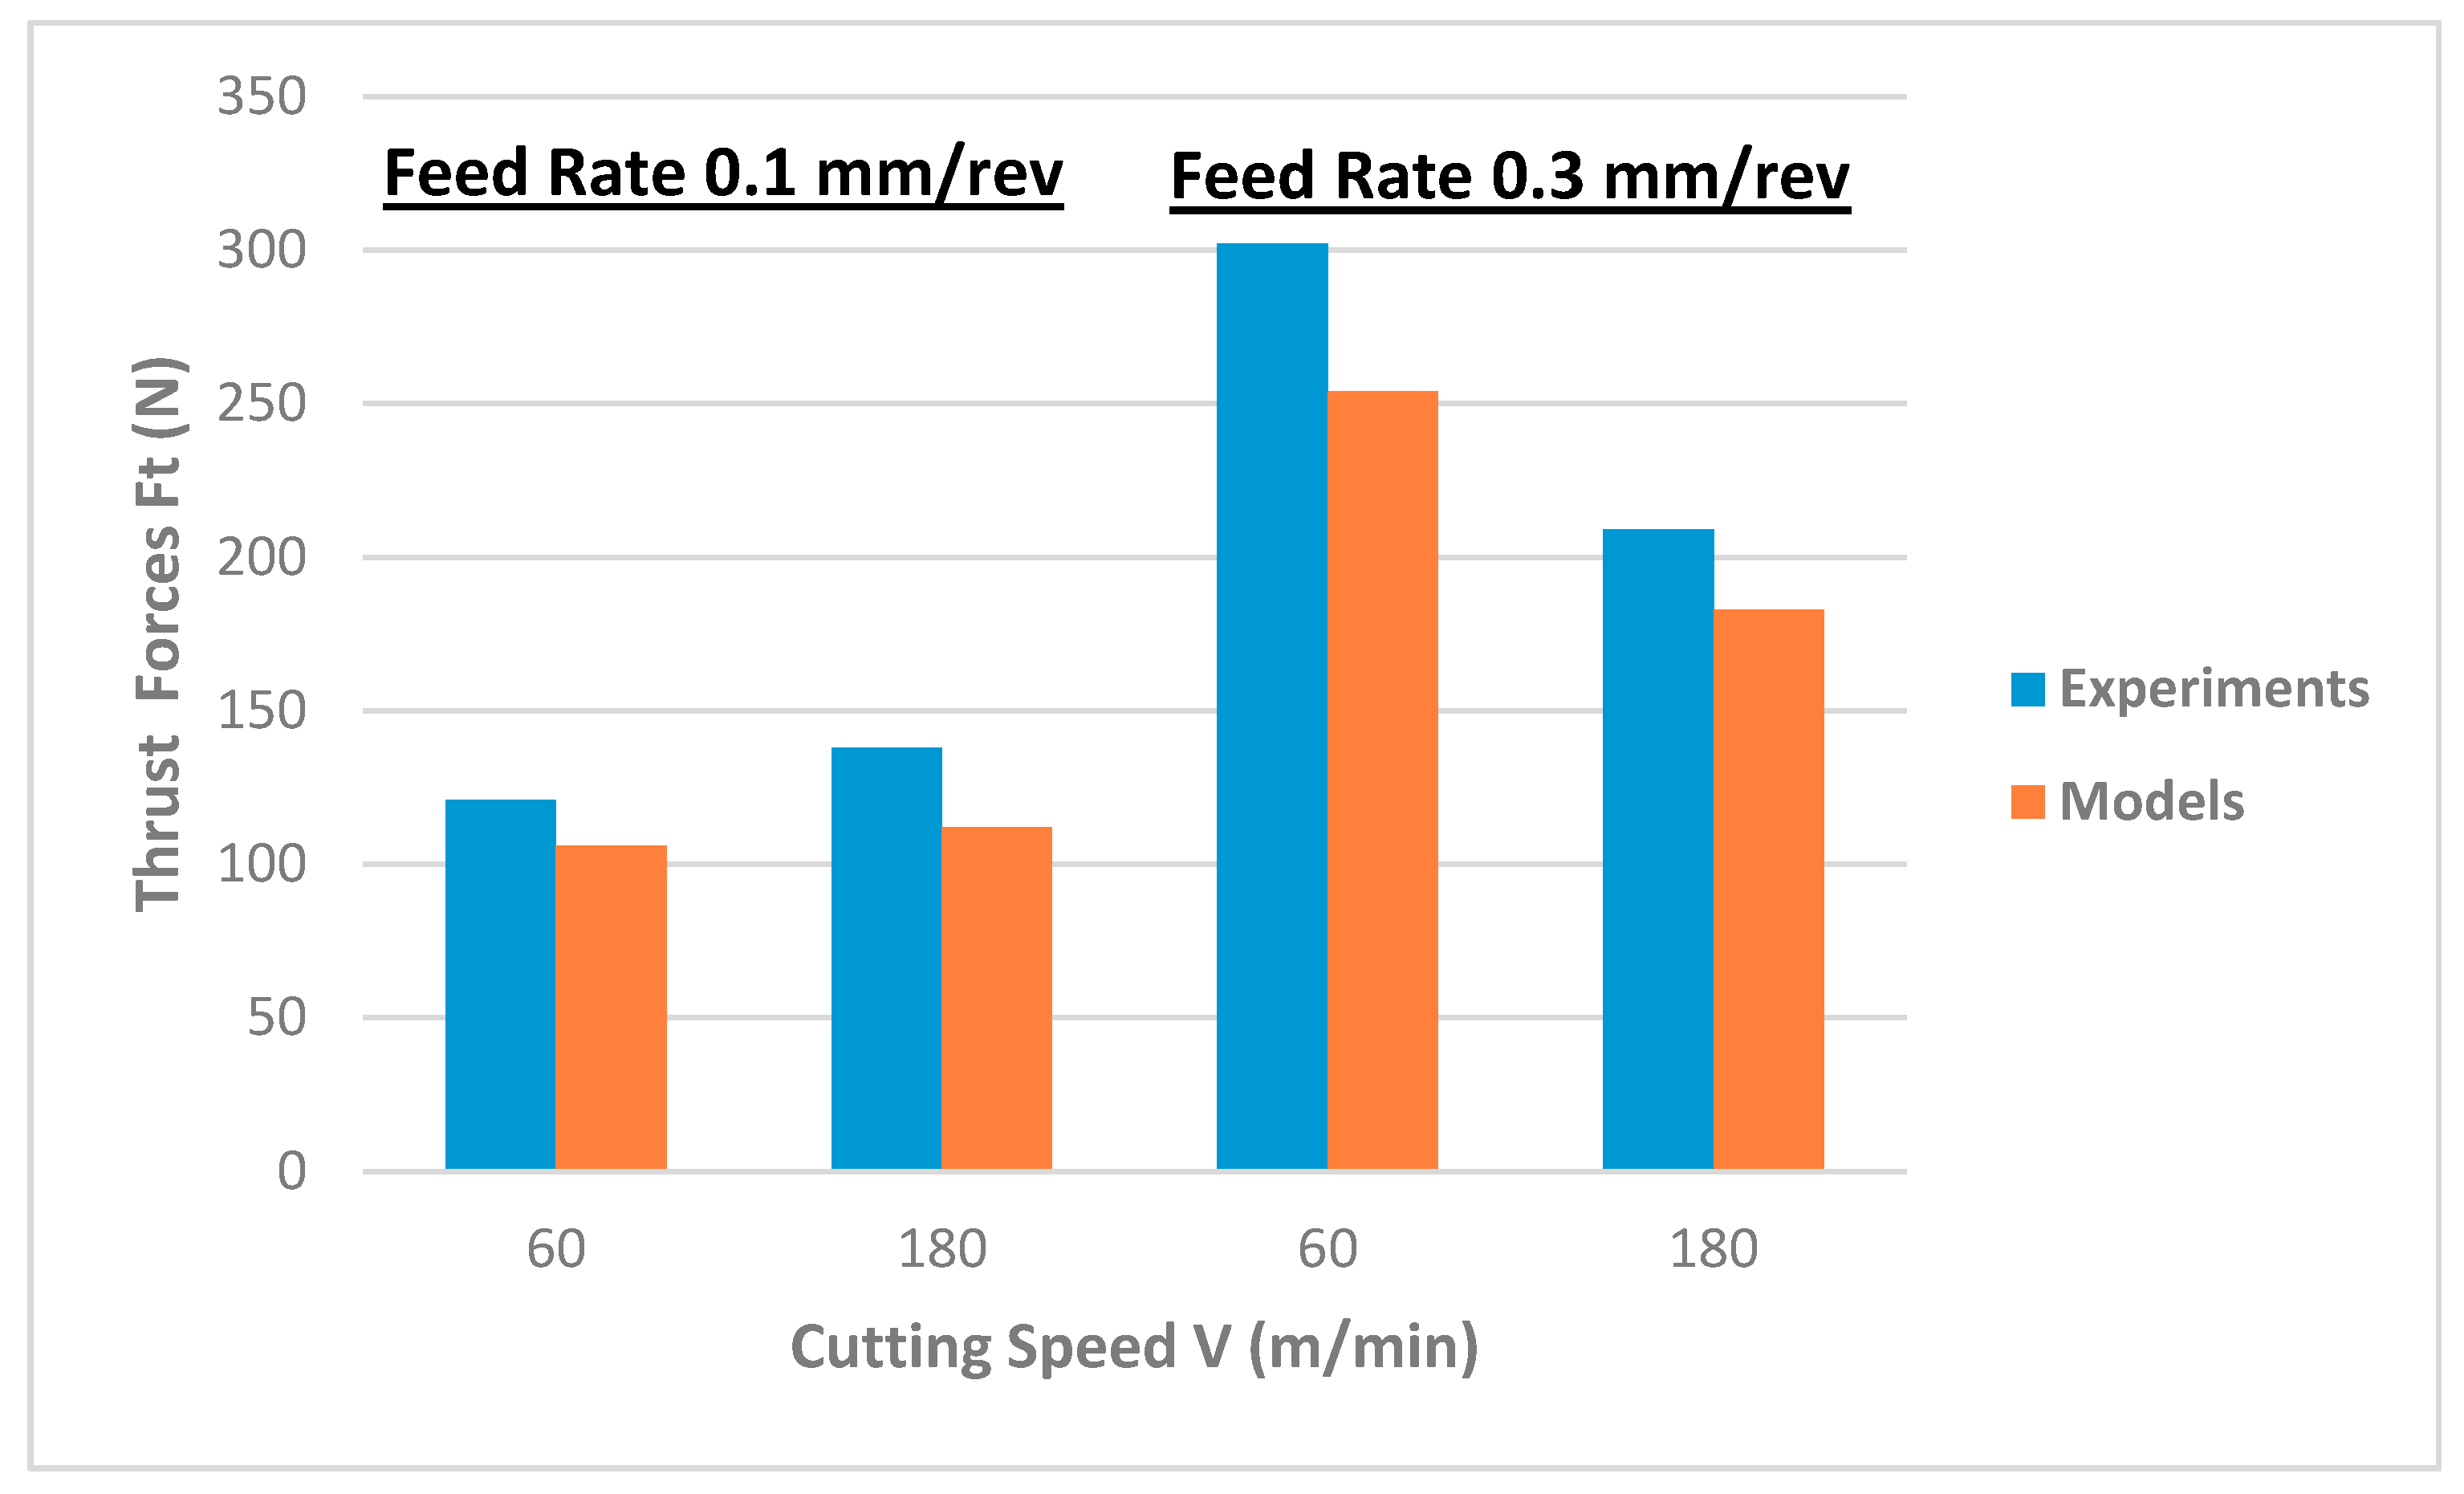
The cutting and thrust forces acquired by means of simulations are compared against experimental values in Figure 3 and Figure 4. It can be visualized that the impact of cutting speed at low feed levels is negligible and the same is revealed by FE models. However, both cutting and thrust forces decrease with an increase in cutting speed at higher feed levels. In contrast, the effect of feed rate is quite clear and shows a significant increase with an increase in feed rate. A similar trend is shown by FE models with errors between 9% and 13% for cutting forces and 12% and 16% for thrust forces. The differences are owing to various assumptions considered during the development of FE models like using a sharp tool edge; absence of tool wear; and utilization of a simplified friction model, for example, use of a constant coefficient of friction. In addition, according to some researchers, the predictions of Johnson-Cook model parameters based on Split-Hopkinson bar tests are based on strain rate functions that are different from the ones found for metal cutting.
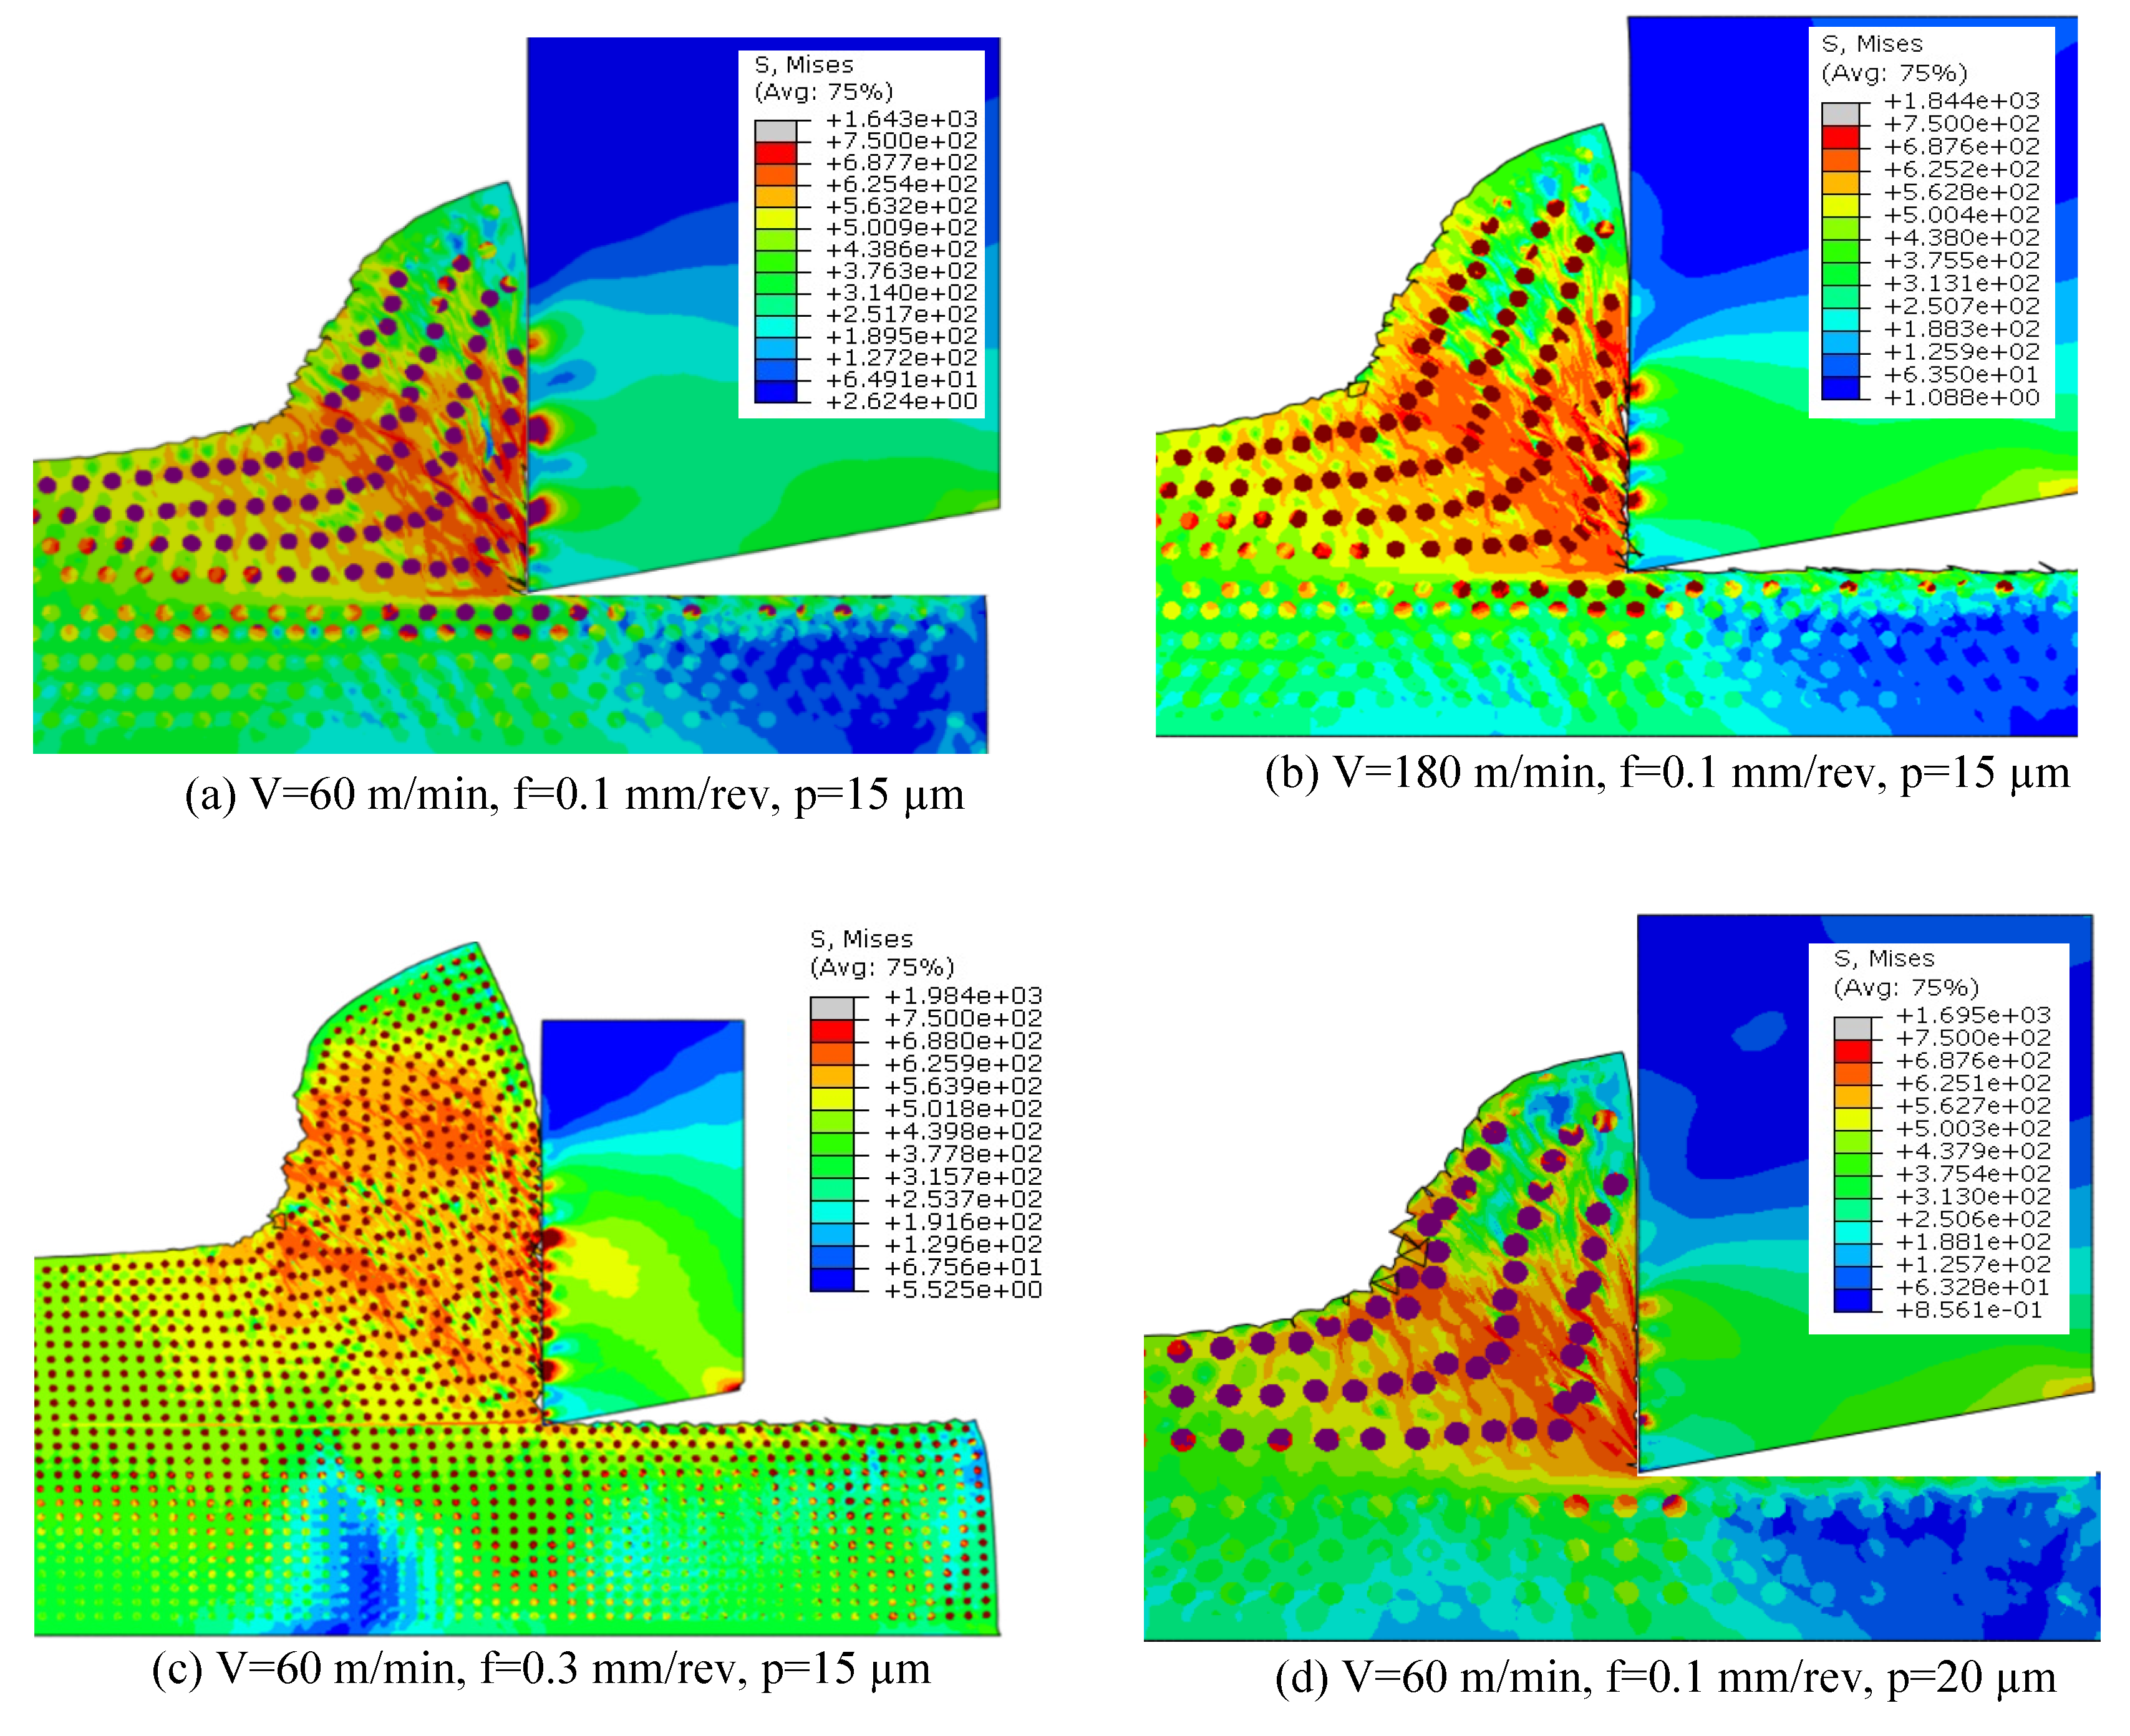
Figure 5 shows stress contours with different cutting parameters and MMC configurations. It is apparent that the stress contours for MMC are quite different in comparison with the homogeneous alloys. For homogeneous alloys, high stresses are usually restricted to the primary shear zone. However, for MMC, high stresses are extended to the secondary shear zone, that is, at the tool–chip interface. The profile of the high stressed area at the secondary shear zone depends on the chip loading at the tool rake face, which in turn depends on many factors like friction, temperature, and normal and shear stresses. In addition, the overall stress contour for particle-based composites also depends on particle size and position in the metal matrix. Large particles and high-volume fractions give rise to the tool stresses. Large particles have more kinetic energy and their probability of debonding and fracture increases. This results in high tool stresses, which lead to chipping and groove formation. Similarly, a high volume fraction escalates the number of impacts of reinforcement particles on the tool face, leading to high tool stresses. One of the features of MMC stress contours is that the reinforcement particles at the chip–workpiece interface are aligned with the shear plane, as depicted in Figure 5. These observations were also discussed by other researchers while doing numerical studies and MMC cutting experiments [21,22]. Similarly, the stress contours inside the cutting tool are very much different than machining with homogenous alloys. Alternate high stress regions can be visualized at the chip–tool interface owing to more chip load because of hard SiC particles. As depicted in Figure 5b, workpiece and cutting tool stresses escalate as cutting speed increases from 60 m/min to 180 m/min. The kinetic energy of the hard reinforcement particles escalates with the rise in cutting speed, which in turn increases the impact and abrasive actions of the hard SiC particles [23]. Figure 5c shows the mises stress when the feed rate changes from 0.1 to 0.3 m/min. The regions of high stresses are more frequent at the tool–chip interface owing to the greater number of reinforcement particles. These recurring impacts of hard SiC particles with the tool surfaces result in high stresses. In addition, these impacts are found to be responsible for the formation of grooves and tool-chipping [24,25,26]. The outcome of change in reinforcement particle size from 15 to 20 µm is shown in Figure 5d. Mises stresses are high owing to large reinforcement particles. Large particles have greater momentum, which can lead to more groove formation and chipping of the tool [27].
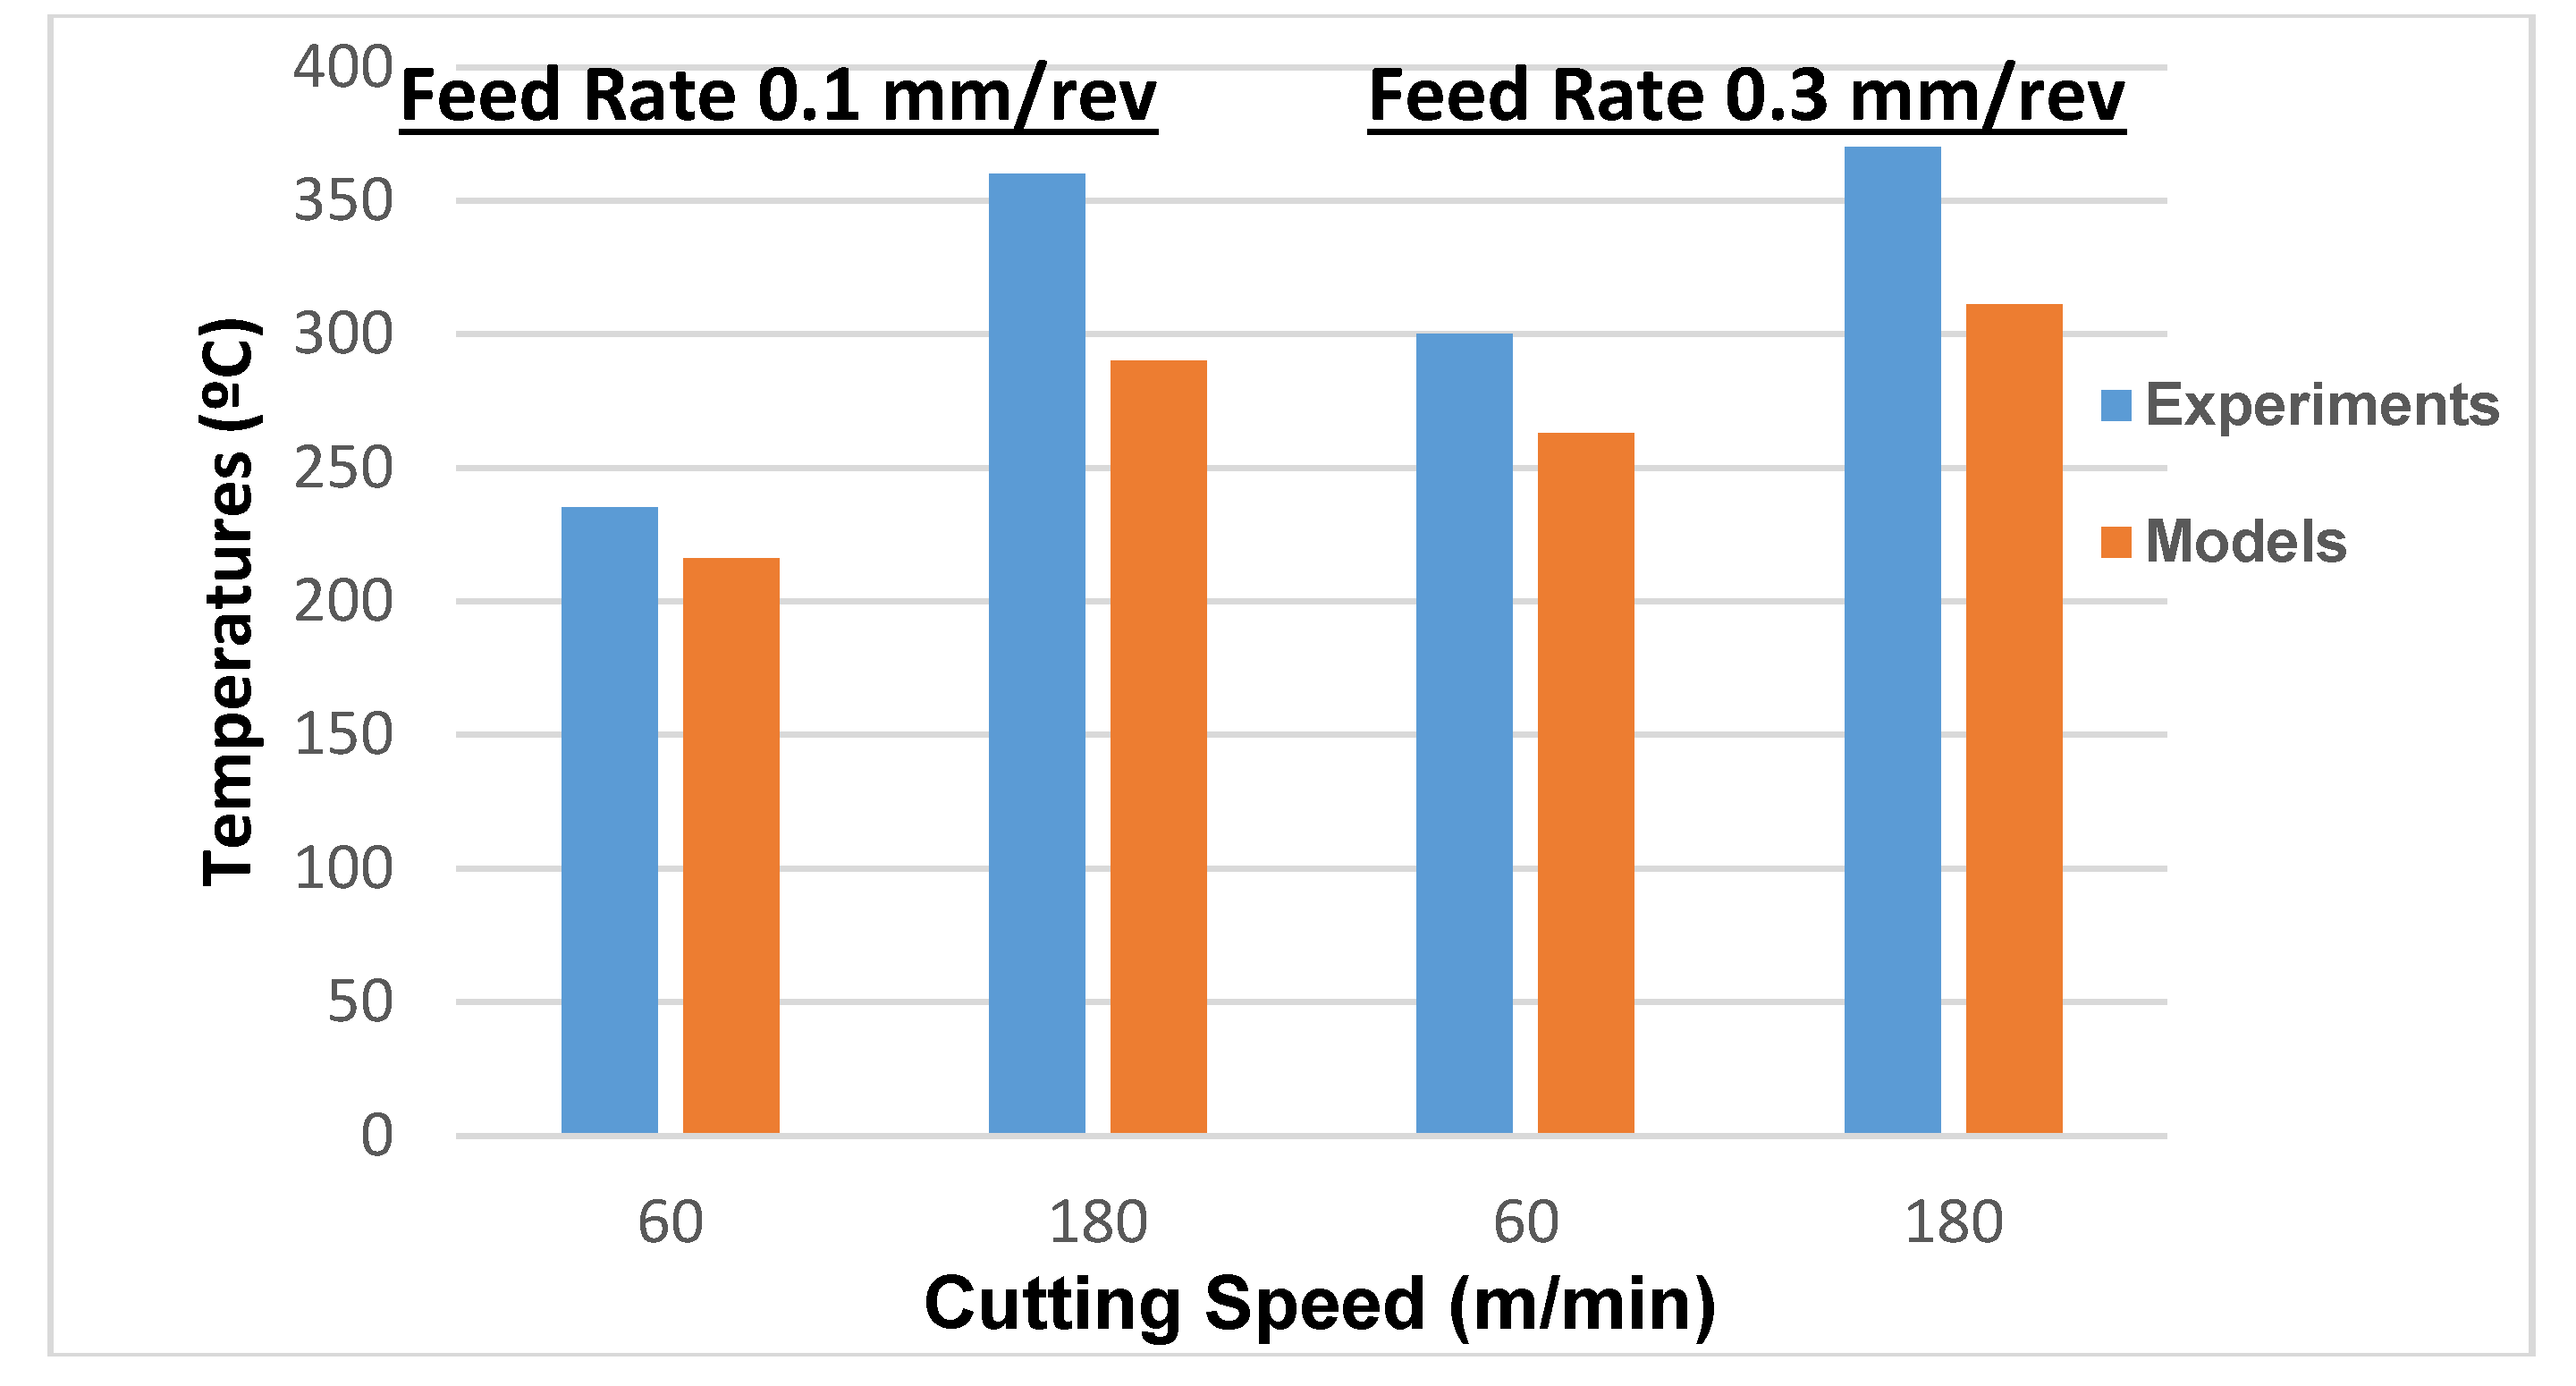
Figure 6 shows the average temperature obtained through experiments and FE models at the tool–chip contact zone. The influence of the change in cutting speed and feed rate with FE models is nearly similar compared with the experimental results. The effect of cutting speed on temperature is more as compared with the feed rate, as shown in Figure 6. At a low feed rate (i.e., low undeformed chip thickness), the effect of cutting speed is more pronounced as compared with at higher feed rates. At a low feed rate, the impact of cutting speed on the average tool–chip temperature is higher owing to the size effect, that is, most of the available energy is consumed in plowing rather than cutting. With higher feed rates (large undeformed chip thickness), more energy is consumed in cutting, that is, low specific cutting energy is required.
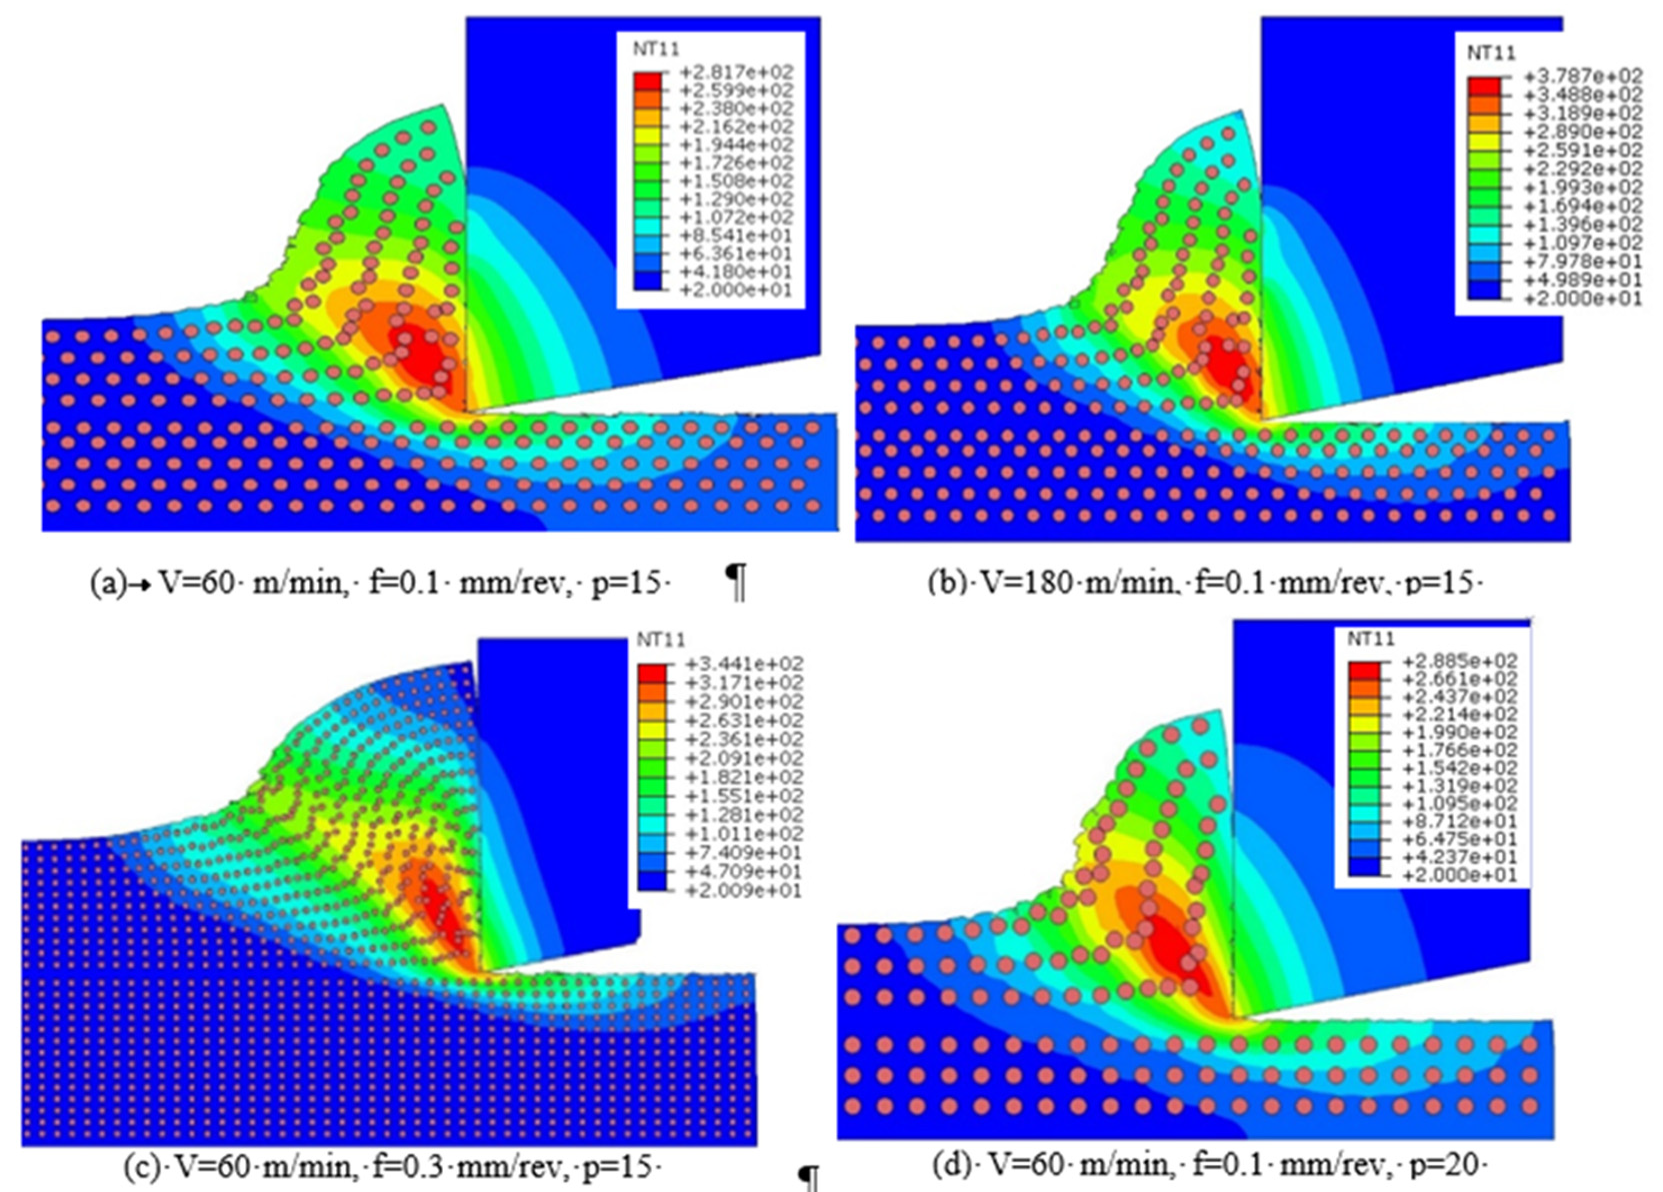
Figure 7 shows the temperature profiles for workpiece and cutting tools at different cutting parameters and particle sizes. For all cases, the high temperature area is around the tool tip, comprising fractions of primary and secondary shear zones. Temperatures rise with increased cutting speed, as shown in Figure 7b. It can be seen that, with an increase in cutting speed, the high temperature zone gets smaller on account of less time available for heat dissipation. Figure 7c shows the temperature contours when feed rate changes to 0.3 mm/rev. As shown, the increase in feed rate amplifies the tool–chip contact length, which in turn enlarges the high temperature area. However, the effect of increasing the cutting speed on maximum temperature is greater as compared with the feed rate effect. Figure 7d shows the effects on temperature profile when particle size is increased from 15 to 20 µm. Though maximum temperature is found to increase, the high temperature area gets smaller owing to the decrease in particle density, as depicted in Figure 7d.
The developed FE models are utilized to form a full-factorial DOE using three levels of cutting speed (V), feed rate (f), and particle size (p), as shown in Table 5. The average tool–chip interface temperature (T), maximum normal stress on the cutting tool (S), and specific cutting energy (U) are used as output variables to optimize MMC cutting. Using the results of DOE, response surfaces based on radial basis functions are generated in order to obtained optimization runs that are not available in the original DOE matrix.
The aim of the optimization study is to reduce the tool–chip interface temperature and maximum normal stress on the tool, keeping a limit to specific cutting energy required. The objectives and constraint are listed in Table 6. An upper limit of 800 J/mm3 is taken as the constraint for specific cutting energy. Ideally, low values of specific cutting energy are desirable, but this is associated with higher feed rates. Higher feed rates result in high cutting forces and will also deteriorate the cutting tool.
The choice of constraint value for specific cutting energy is a kind of compromise between cutting efficiency and faster production rates. The optimization search is carried out using a multi-objective genetic algorithm (MOGA-II). It uses an efficient search method to improve the genetic algorithm performance. It avoids converging at local optimal frontiers and preserves some good solutions.
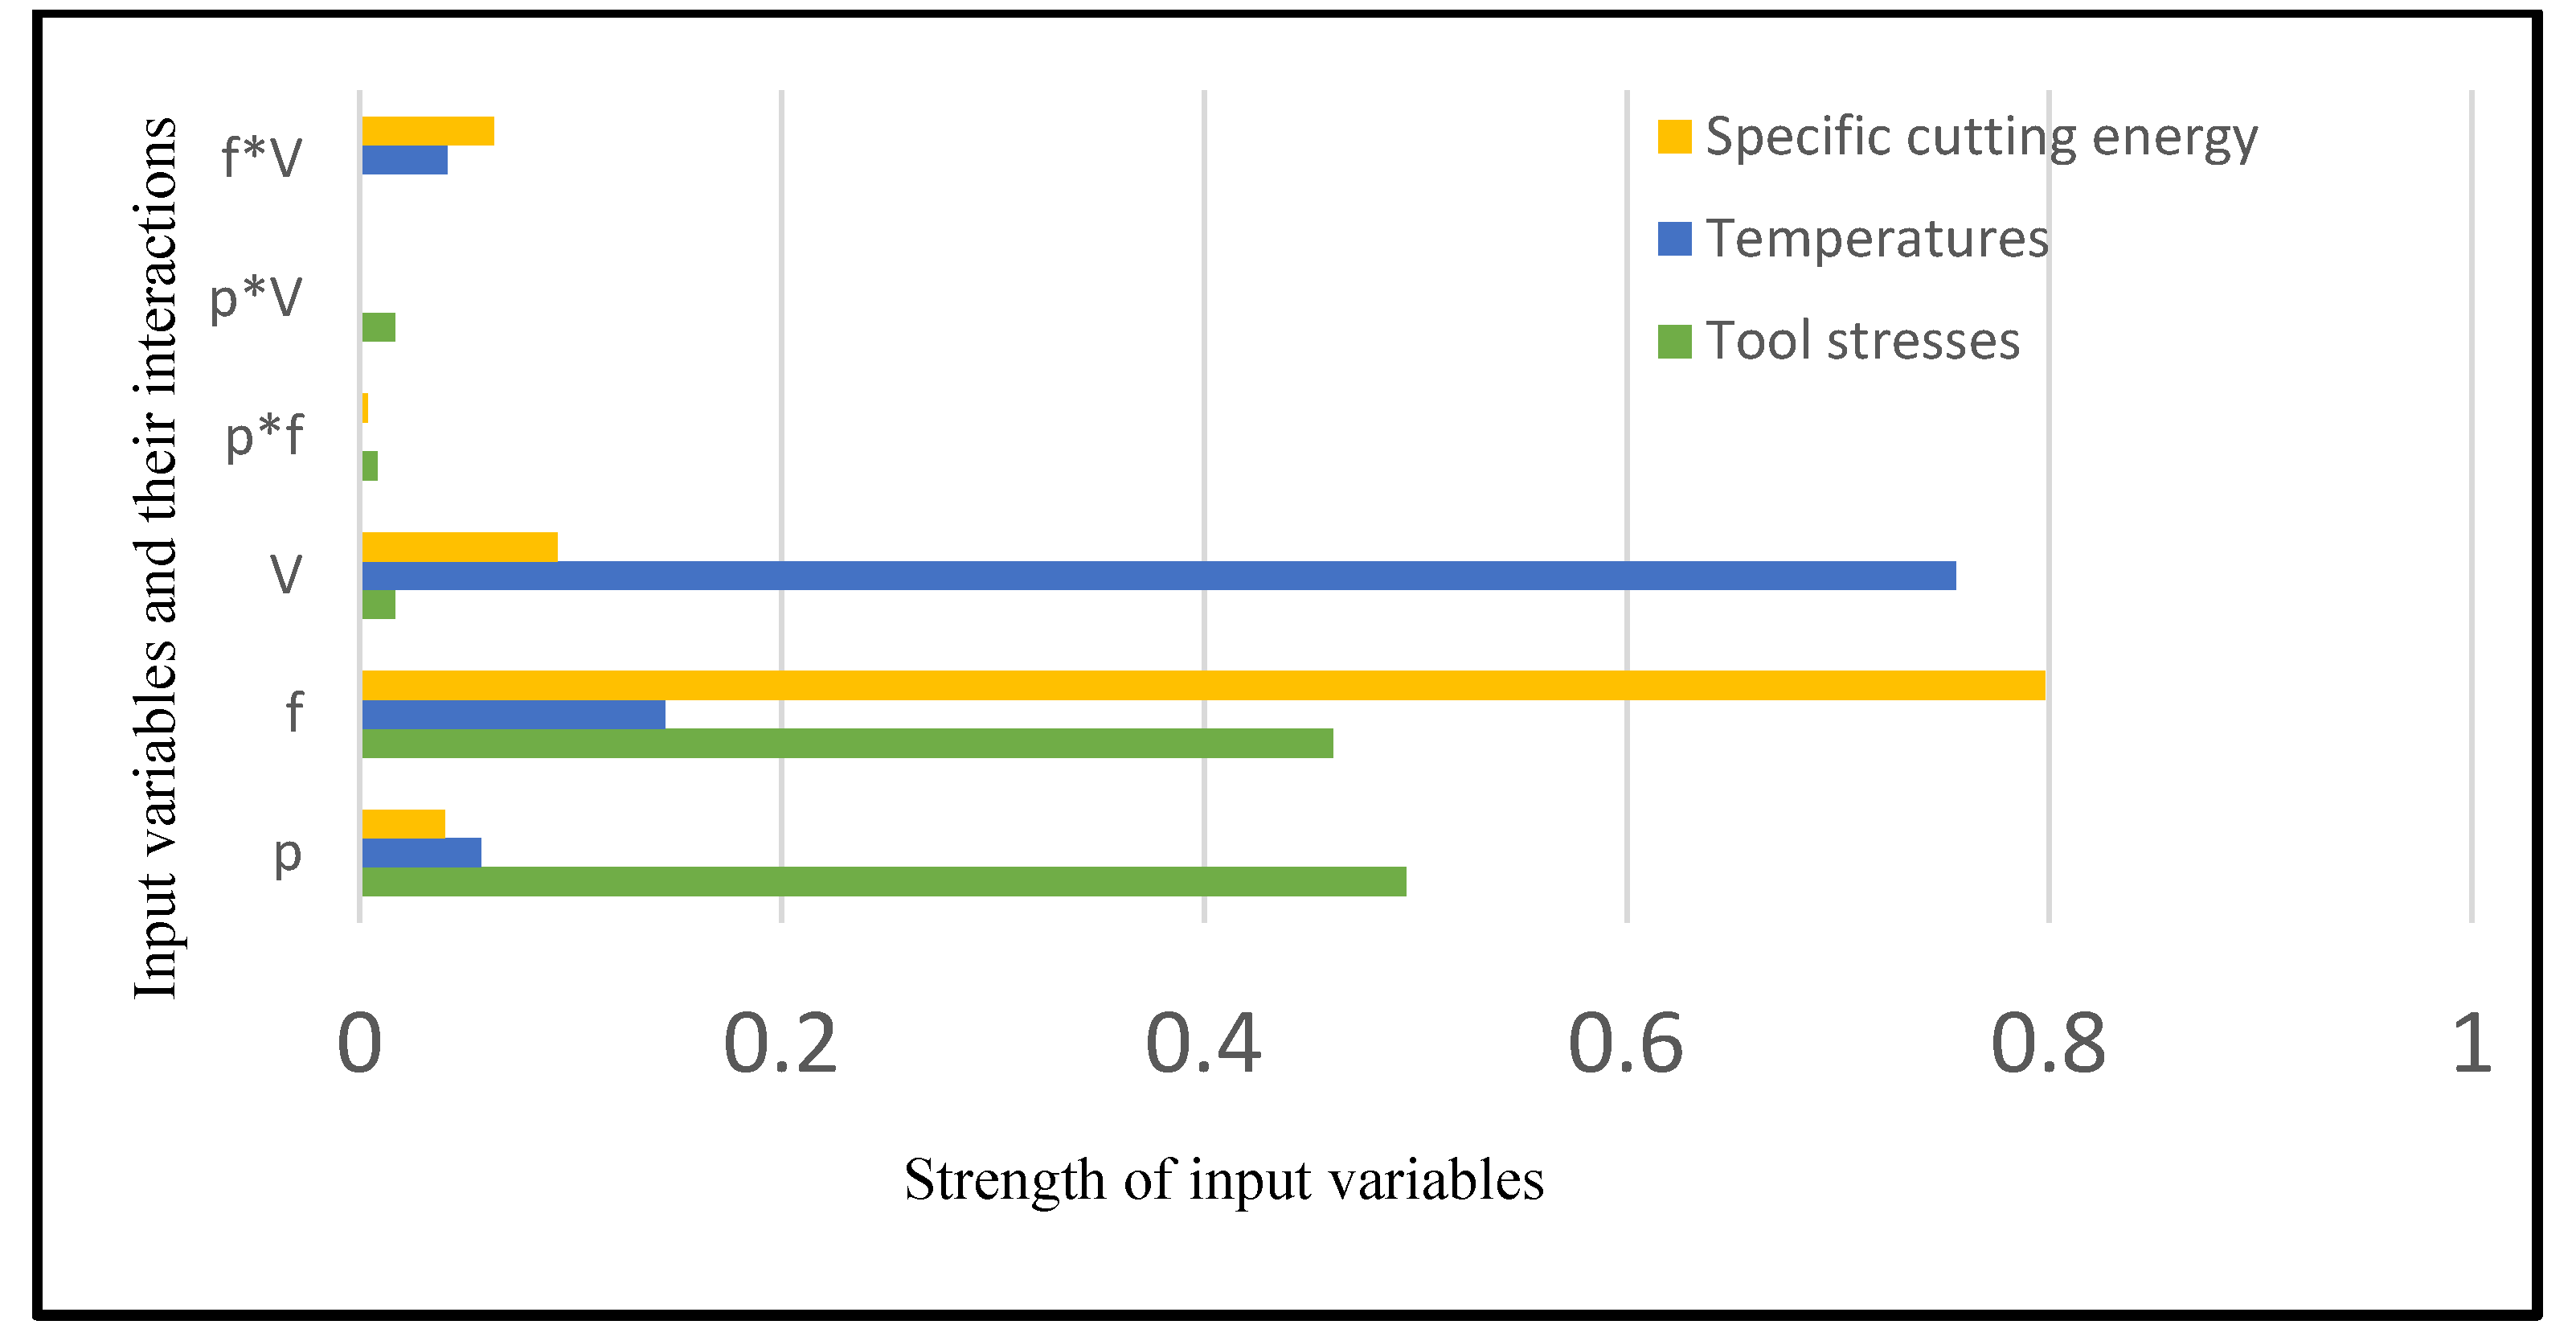
The effects of input parameters on tool stresses, interface temperatures, and specific cutting energy obtained through smoothing spline analysis of variance (ANOVA) are shown in Figure 8. It shows that particle size has the greatest effect on tool stresses following feed rate. The influence of cutting speed and other interactions is negligible for tool stresses. The average tool–chip interface temperature is mostly governed by cutting speed followed by feed rate and reinforcement particle size. The interactions of cutting speed and feed rate also have a noticeable effect (around 5%), as depicted in Figure 8. Feed rate is the most influential parameter for specific cutting energy and the dependency is around 80%. In contrast, the total contribution of cutting speed, interaction of cutting speed and feed rate, and particle size on specific cutting energy is less than 18%, as shown in Figure 8.
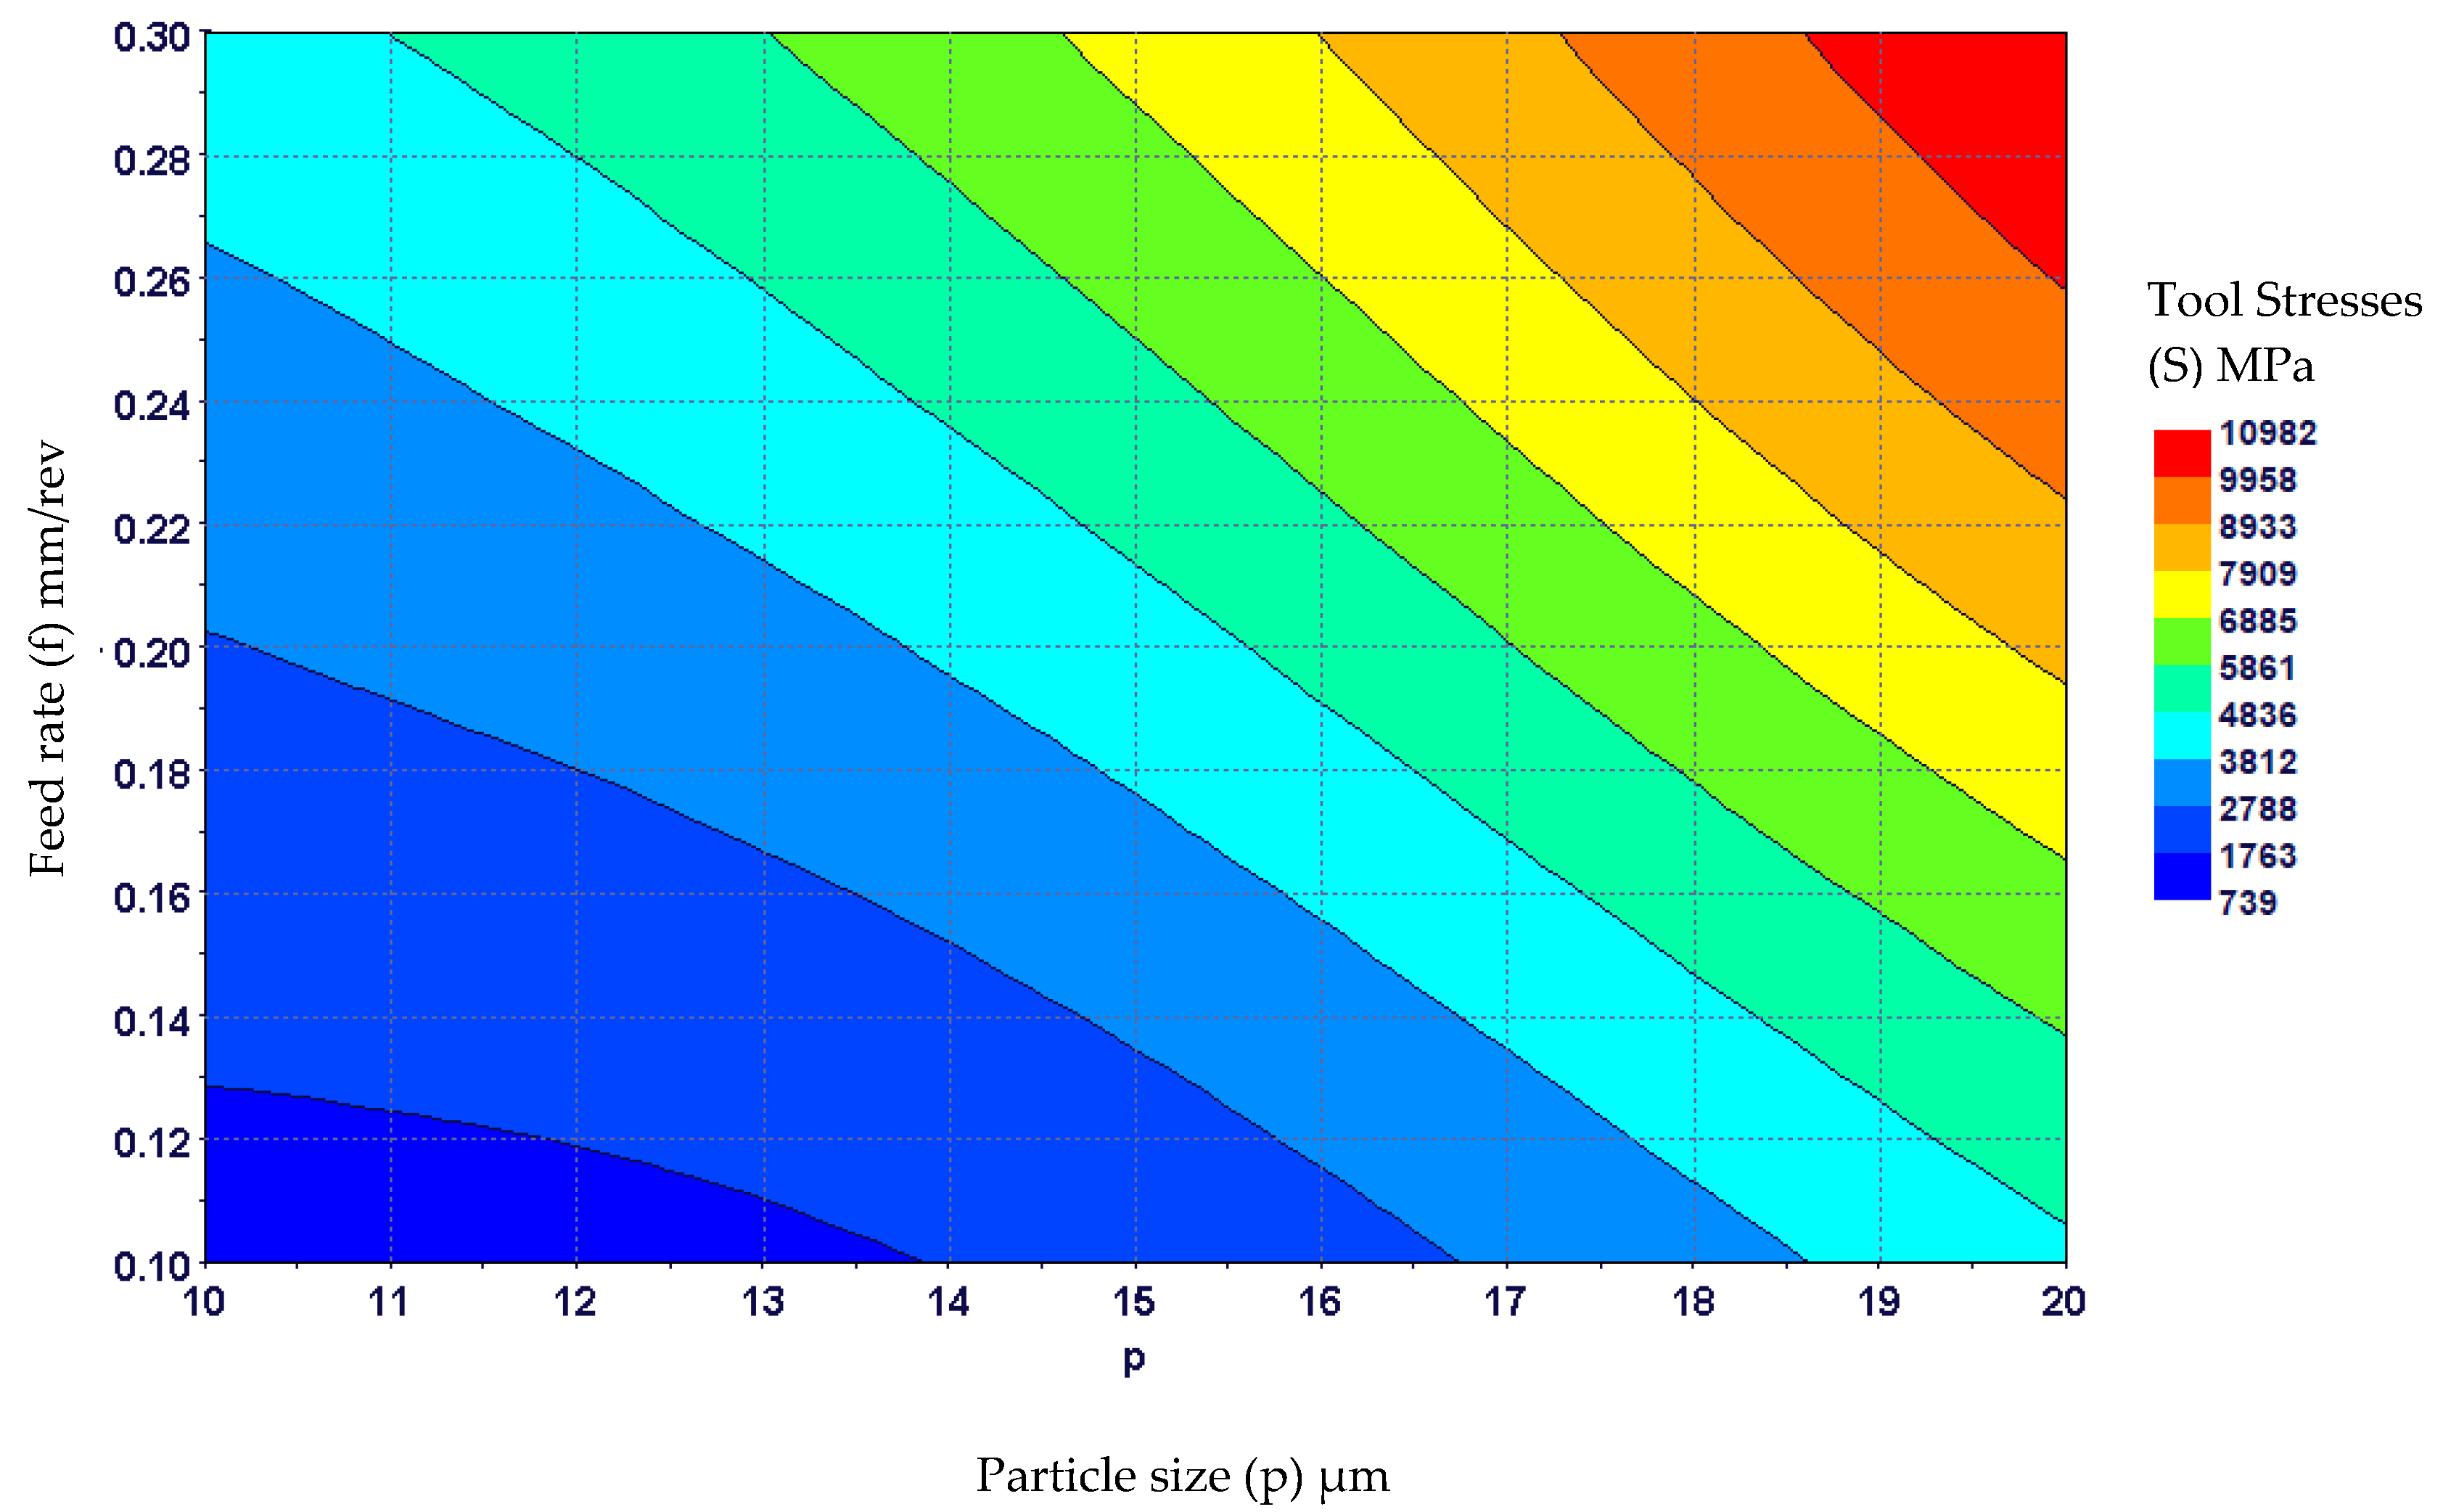
The combined effects of reinforcement particle size and feed rate on tool stresses generated by response surface based on radial basis function are shown in Figure 9. The effects of particle size and feed rate are straight forward and show a rise in tool stresses in a linear fashion. Maximum tool stresses are obtained with large particle sizes and high feed rates. It is obvious that tool stresses are low for particle sizes up to 15 µm and feed rates below 0.2 mm/rev.
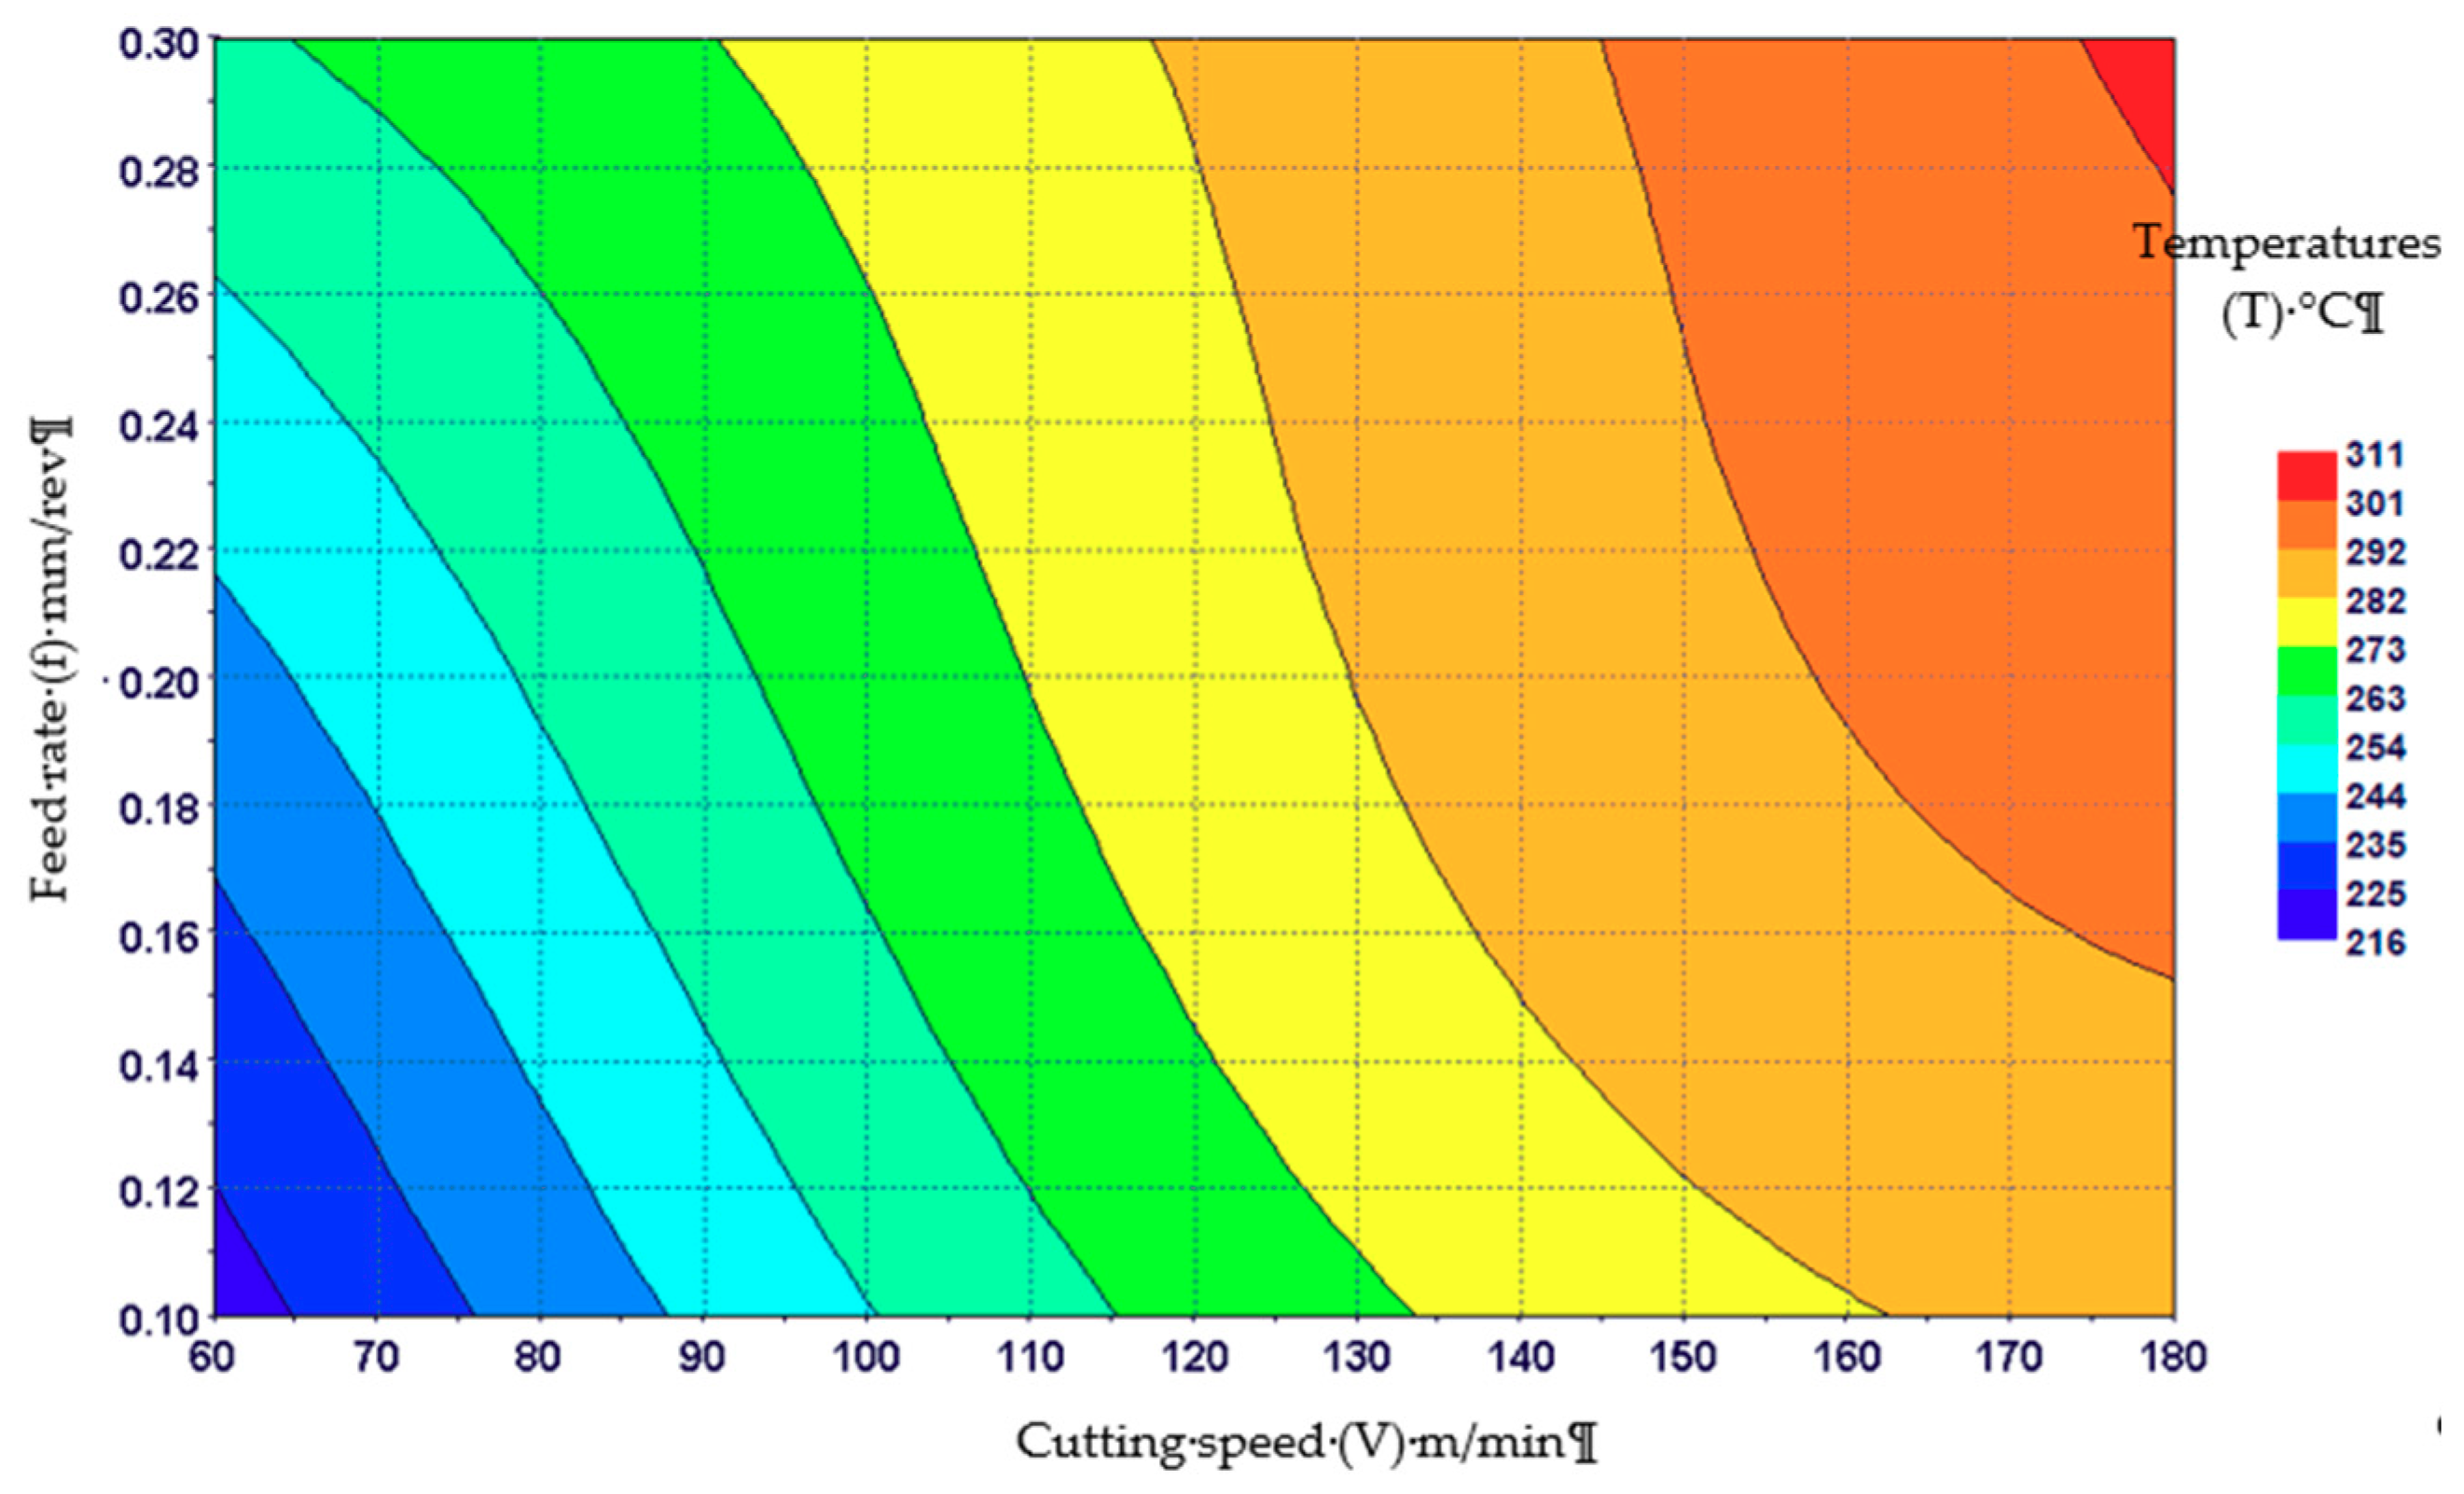
Figure 10 shows the pooled effect of cutting speed and feed rate on average tool–chip interface temperature. It is clear that the temperature rises with both cutting speed and feed rate, but the effect of cutting speed is more distinct and more rapid than the feed rate. Maximum temperatures are found at higher cutting speeds and feed rates. As illustrated in Figure 10, the effect of feed rate is found to decrease at higher cutting speeds.
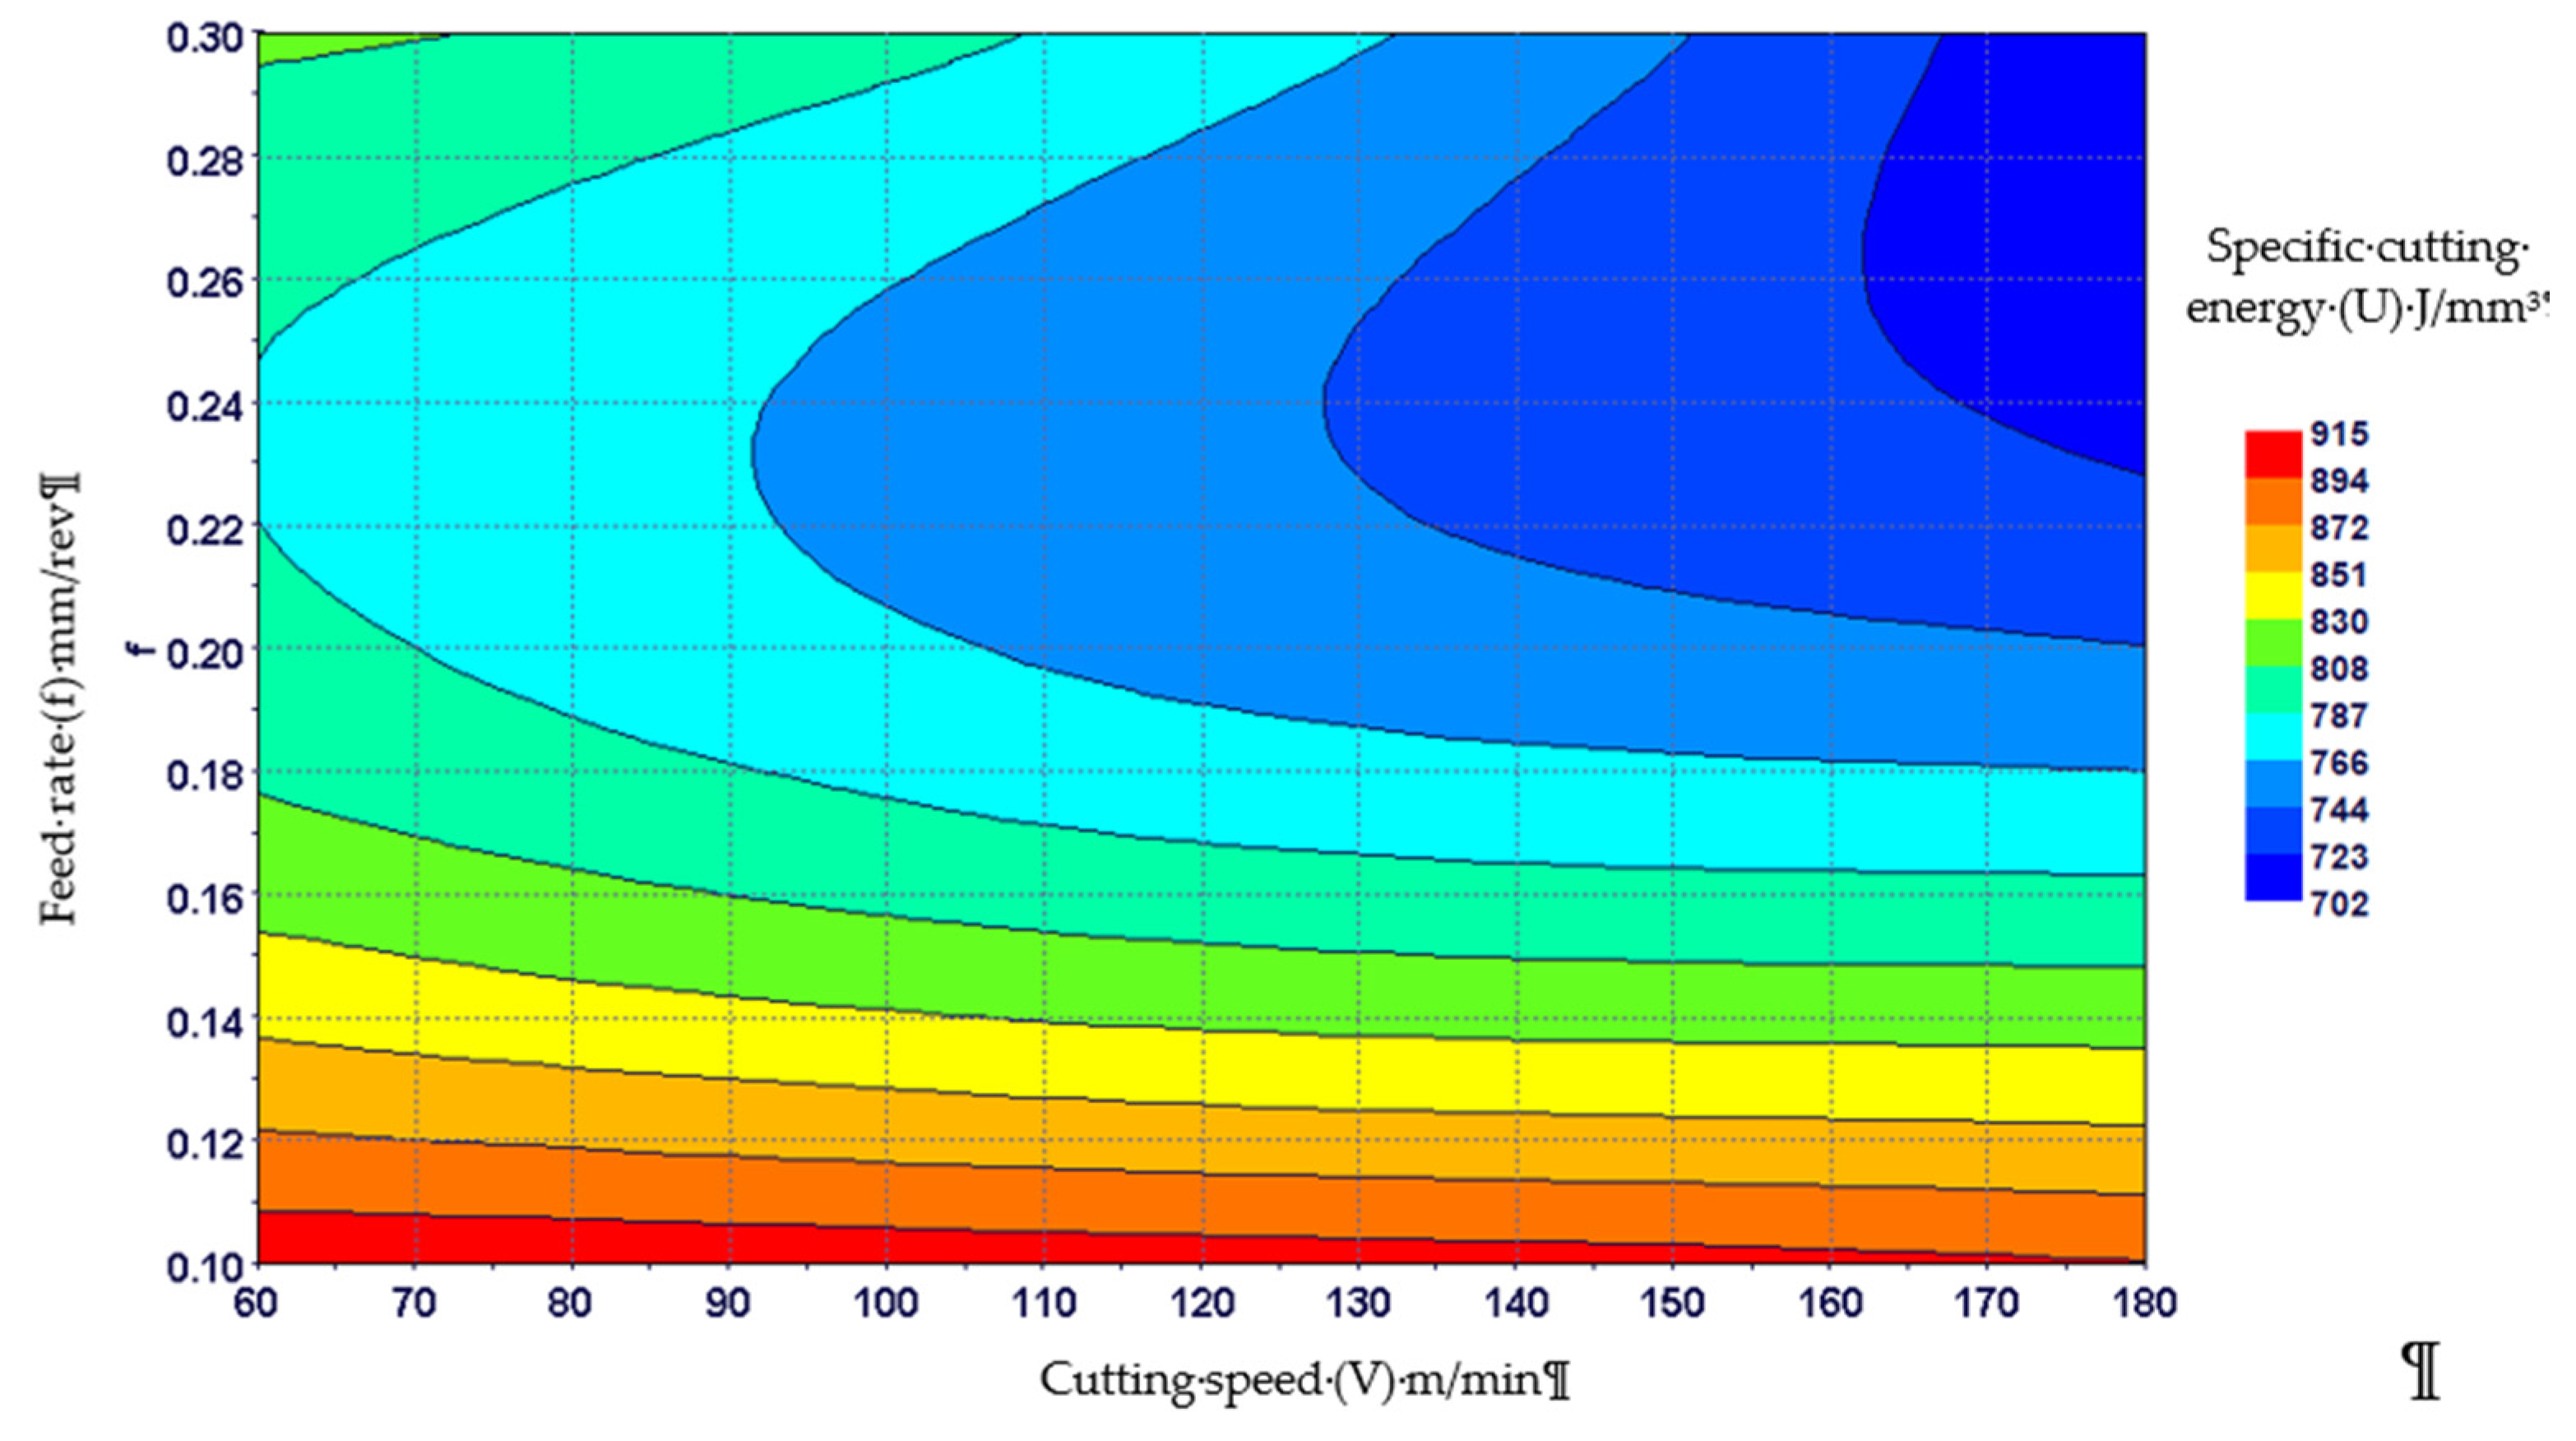
Figure 11 shows the pooled effects of cutting speed and feed rate on specific cutting energy. A low specific cutting energy zone can be marked at higher feed rates, in particular with a higher cutting speed. In comparison, higher specific cutting energies are required at lower feed rates, irrespective of the cutting speed. As explained earlier, this is a well-known behavior called size-effect, showing a strong dependency of specific cutting energy on feed rate. It can be inferred that, at low to moderate feed rates, the effect of cutting speed on specific cutting energy is almost negligible. A slight variation in specific cutting energy with cutting speed can be observed at higher feed rates. This might be owing to pronounced thermal softening effects at higher feed rates.
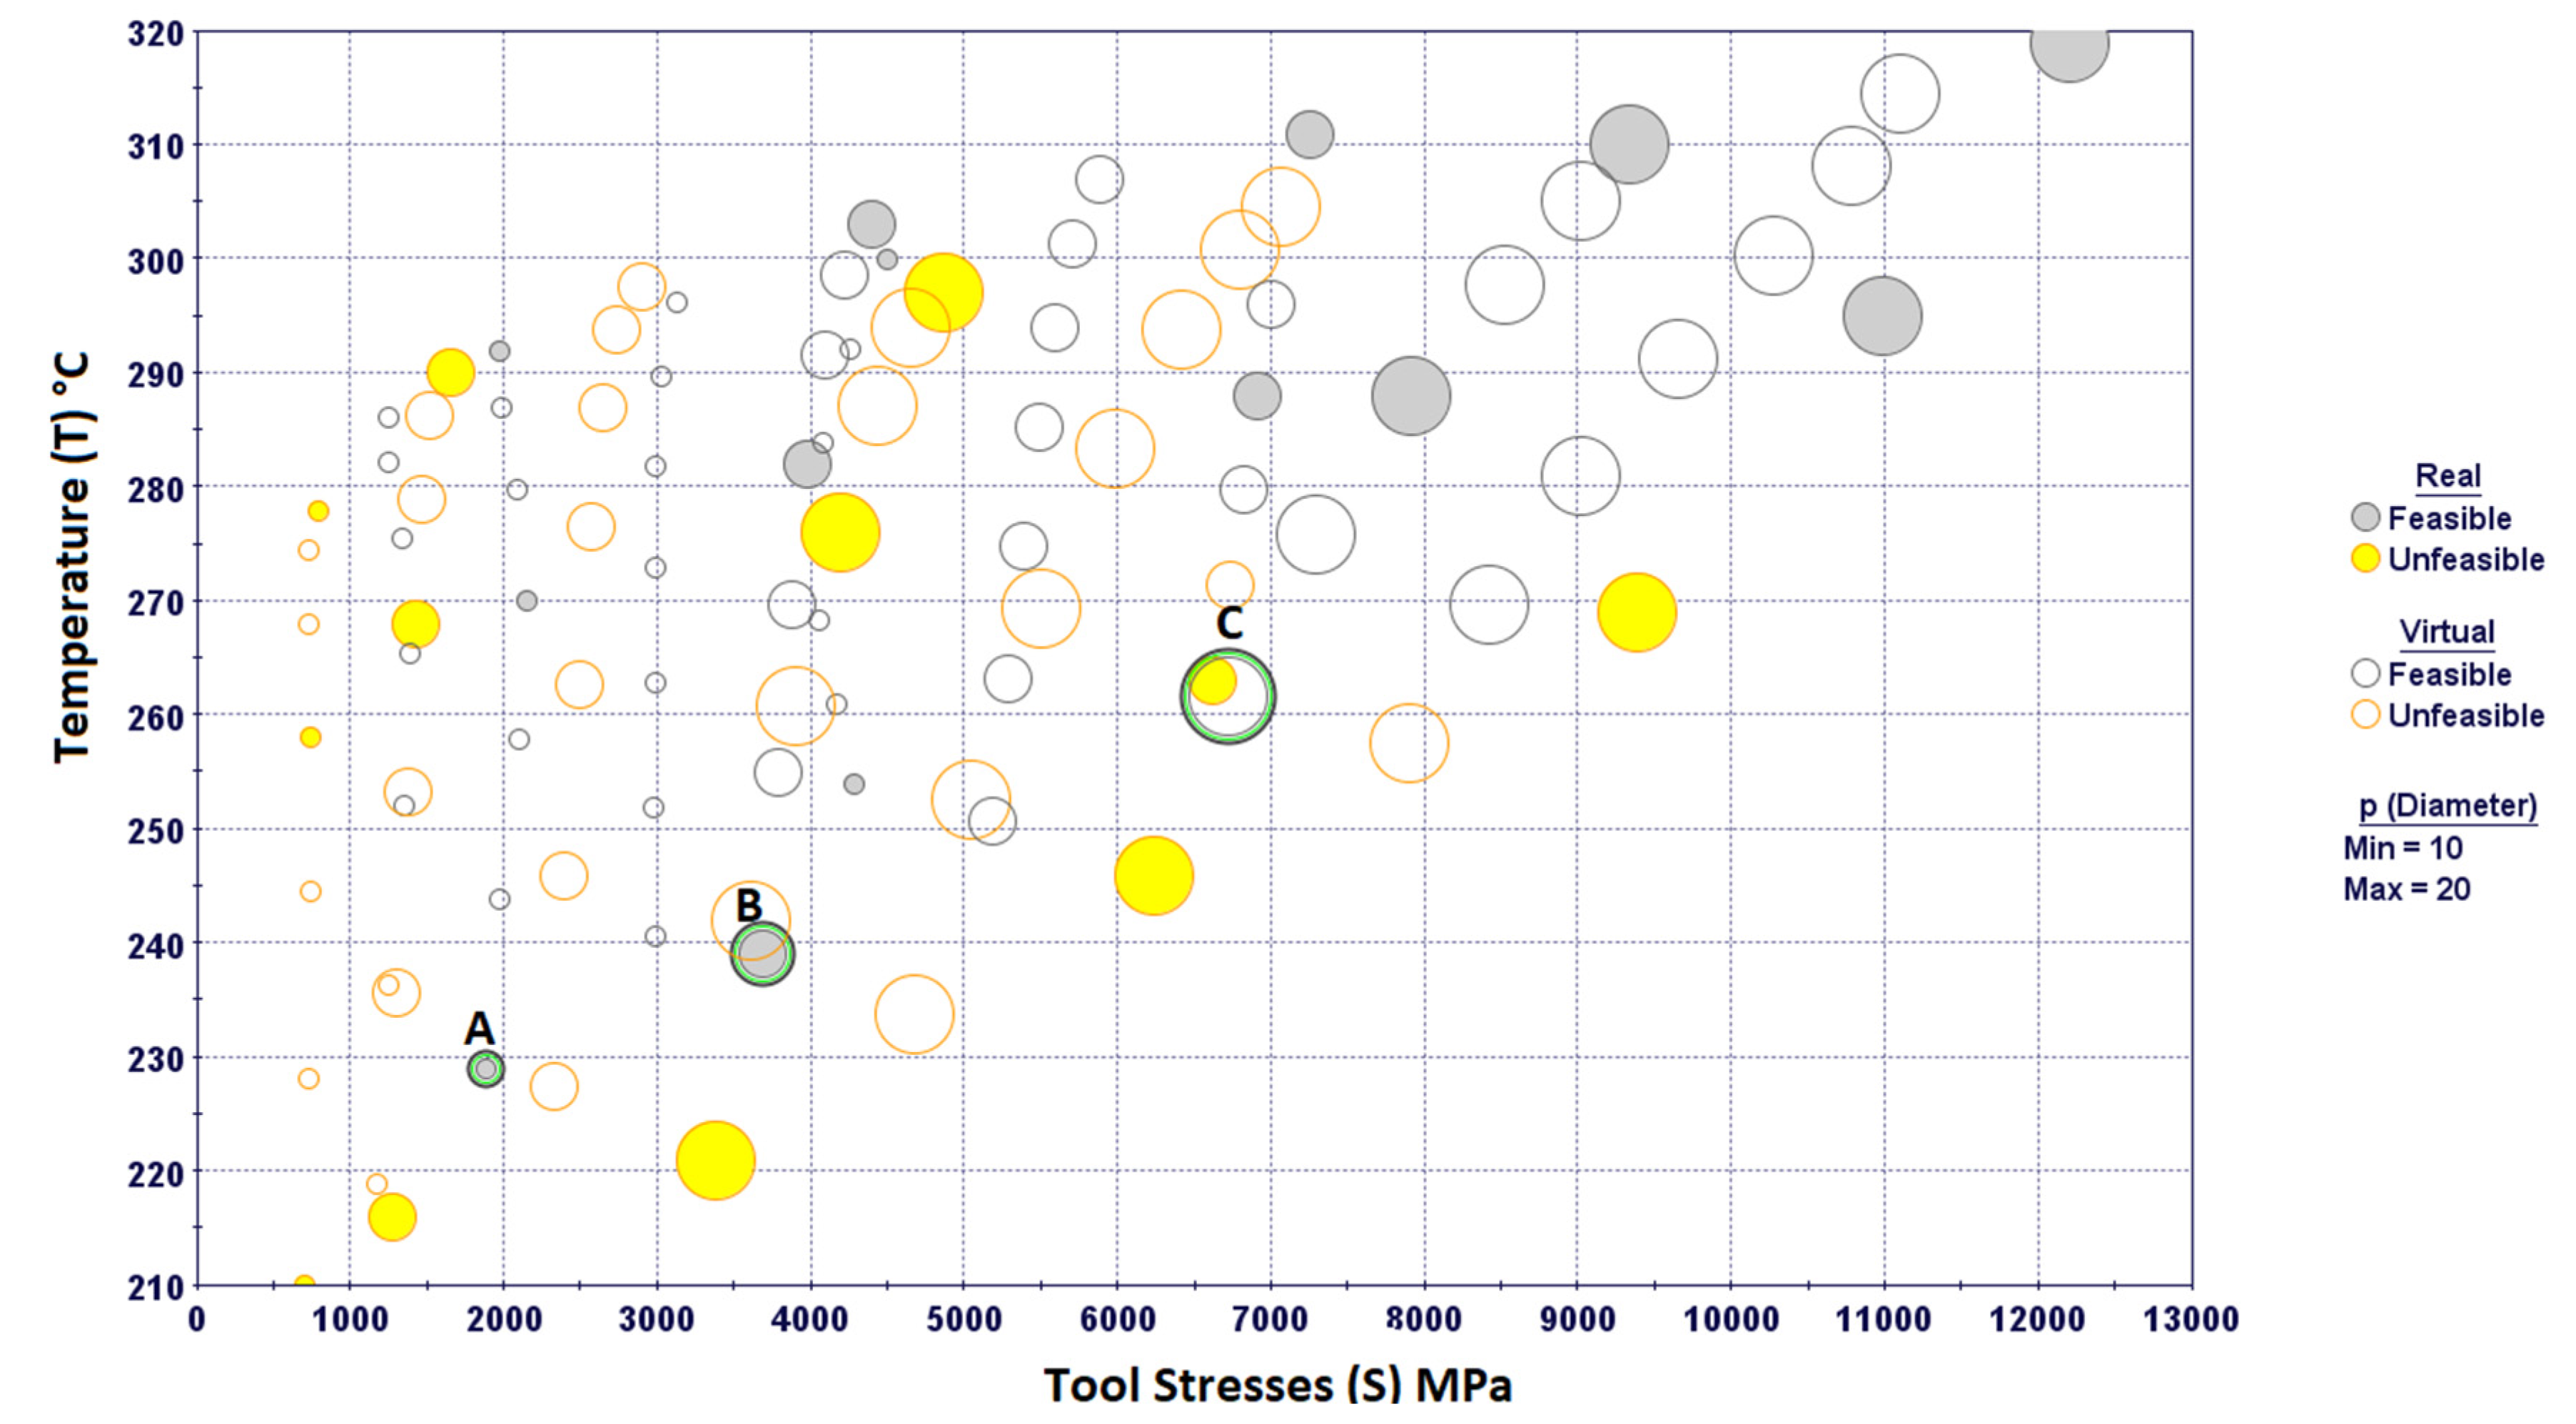
The total number of evaluations using MOGA-II is equal to the number of generations requested multiplied by the number of experimental runs (design points) in the DOE matrix. Figure 12 shows a 3D bubble chart containing all the design points obtained after optimization runs. Real design points correspond to the experimental runs in the DOE matrix, whereas virtual ones are obtained using the developed response surfaces. The design points that violate the constraints in the optimization problem are considered as unfeasible. In Figure 12, the design points are plotted against two performance variables, that is maximum normal stress on the tool (S) and average tool–chip interface temperature (T). The diameter of the bubbles represents reinforcement particle size. As the objective is to minimize both stress and temperature, the design points at the lower left corner of the chart should be considered as optimal solutions. The relationship between tool stresses and particle sizes is very much clear from Figure 12, as the low stress area is mostly occupied by small particles. The design points marked as A, B, and C can be considered as optimal solutions for each particle size category. These design points are non-dominated as a further reduction in stress or temperature results in violating the constraint, that is, they are associated with high specific cutting energies. For example, consider point A, which is taken as optimal for particle size of 10 µm. As shown in Figure 12, no feasible point exists below and to the left of A, that is, all points having low stresses and temperatures as compared with A, have high specific cutting energies, that is, they are unfeasible. Similar are the cases for other particle size categories. B is the optimal point for a particle size of 15 µm and C refers to optimal point for a particle size of 20 µm.
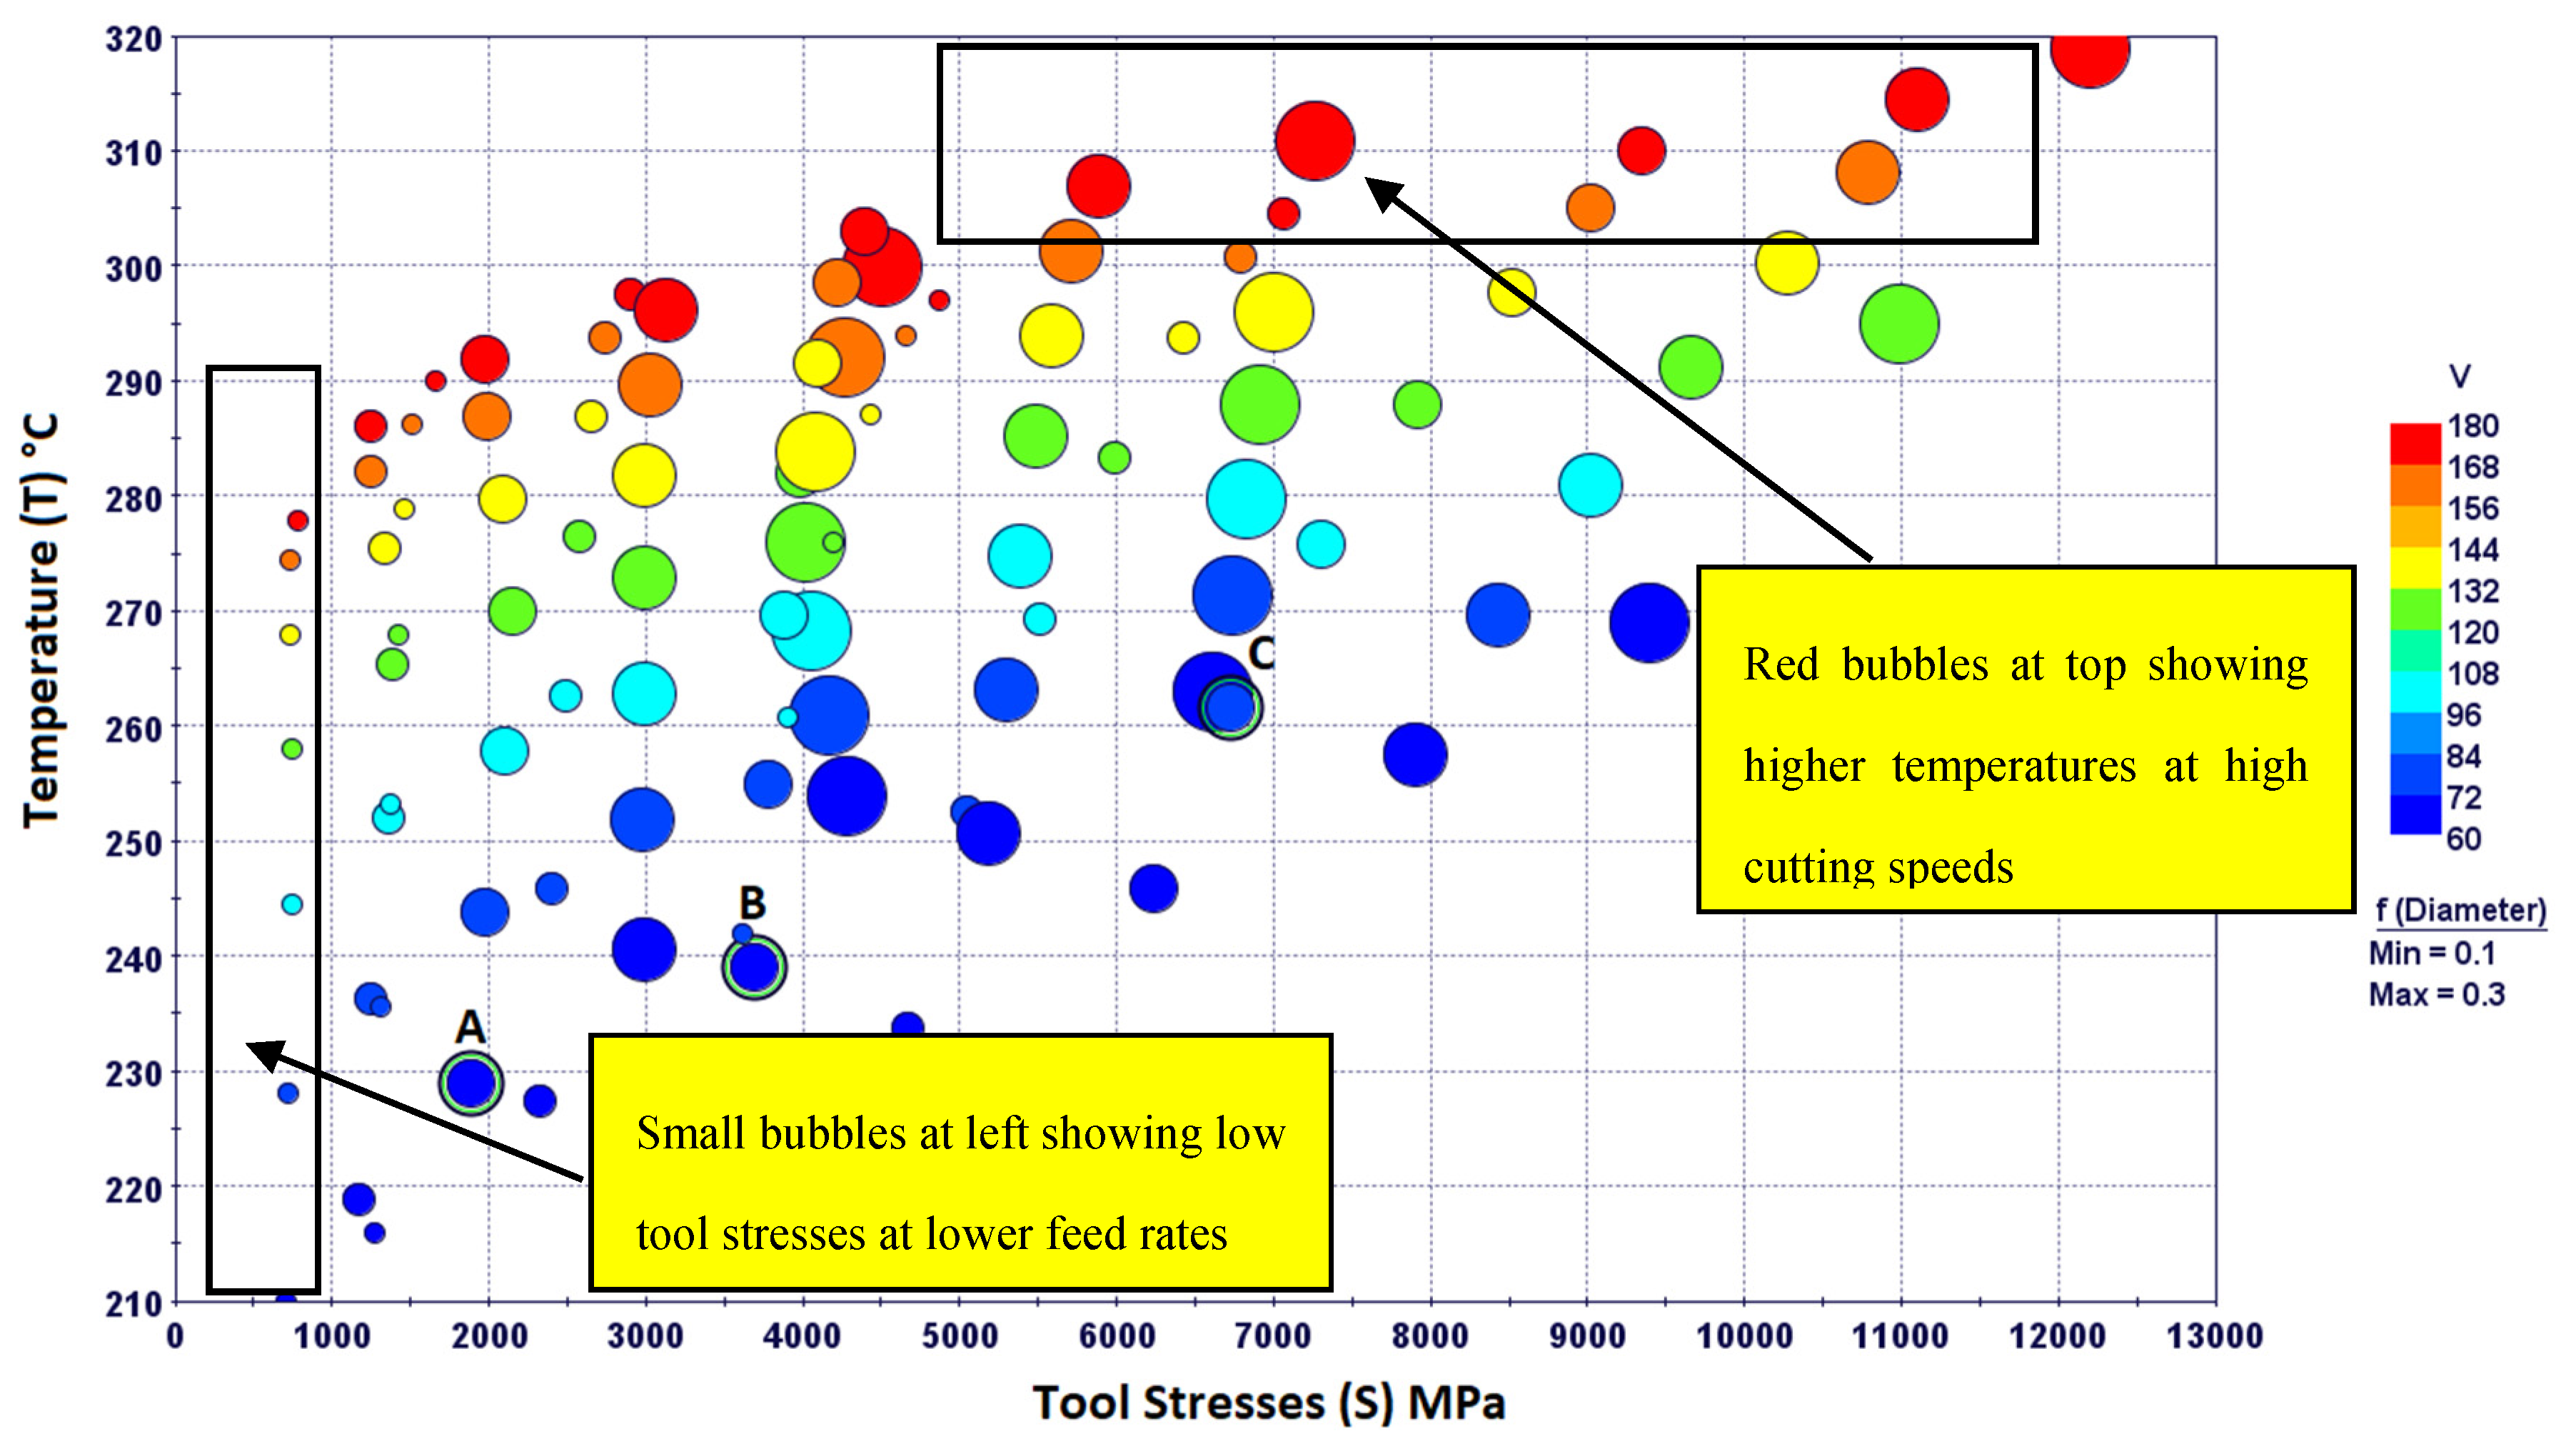
Figure 13 shows a 4D bubble chart illustrating the relationships between stress, temperature, cutting speed, and feed rate. The color of the bubble represents the cutting speed, while the size of bubbles shows the feed rate. It can be seen that smaller bubbles are at the extreme left, whereas large size bubbles are at the right side of the diagram. This shows a general trend that tool stresses increase with feed rate. Similarly, most of the blue bubbles (with low cutting speeds) are found at the bottom of the diagram, whereas red bubbles (with high cutting speeds) can be seen on the top. This simply shows an increase in average tool–chip interface temperatures with the cutting speeds. It is obvious that all optimal points are blue colored having medium size, that is, optimal solutions are obtained at low cutting speeds and moderate feed rates.
4. Conclusions
In this study, an optimisation method for MMC machining was developed based on FE models and response surfaces. Tool performance was optimized in terms of stresses and temperatures, while putting a limit on specific energy consumption. FE models were developed based on uniform distribution of reinforcement particles in the metal matrix. Chip separation criterion was chosen based on element deletion method using the Johnson–Cook damage model. The model results in terms of cutting and thrust forces and average tool–chip interface temperatures are found to be in good agreement with the experimental results. The models are capable of simulating the effects of varying particle size in addition to the cutting parameters. The model behaviour is discussed and found to be in line with the previous research findings. The following remarks can be concluded from the study.
- The deformed chip in the FE model for MMC machining contains localized regions of high strains owing to hard reinforcement particles. The chip profile is very much aligned with the experimental results.
- High tool stresses are observed with higher feed rates and large reinforcement particles.
- Average tool–chip interface temperature increases with both cutting speed and feed rate. However, the effect of cutting speed is more rapid and pronounced as compared with the feed rate.
- Higher specific cutting energy is required at lower feed rates irrespective of the cutting speed. Moreover, at moderate feed rates, the effect of cutting speed is negligible.
- An increase in particle size also leads to an increase in specific cutting energy.
- The optimal design points have low cutting speeds and moderate feed rates.
Author Contributions
Conceptualization, U.U., and H.K.; Data curation, U.U., M.H.A., and J.A.Q.; Formal analysis, U.U., M.H.A., and H.A.; Funding acquisition, U.U. and M.H.A.; Investigation, J.A.Q., H.K., and H.A.; Methodology, U.U., M.H.A., and H.K.; Resources, U.U.; Supervision, J.A.Q. and H.A.; Visualization, H.K., M.H.A., and J.A.Q.; Writing—original draft, U.U. and M.H.A.; Writing—review and editing, U.U., H.A. and M.H.A. All authors have read and agreed to the published version of the manuscript.
Funding
This research and APC was funded by the National Plan for Science, Technology, and Innovation (MAARIFAH), King Abdulaziz City for Science and Technology, Kingdom of Saudi Arabia, Award No. 13-ADV-971-02.
Acknowledgments
This project was funded by the National Plan for Science, Technology, and Innovation (MAARIFAH), King Abdulaziz City for Science and Technology, Kingdom of Saudi Arabia, Award No. 13-ADV-971-02.
Conflicts of Interest
The authors declare no conflict of interest.
References
- Repeto, D.; Fernandez-Vidal, S.; Mayuet, P.F.; Salguero, J.; Batista, M. On the Machinability of an Al-63%SiC Metal Matrix Composite. Materials 2020, 13, 1186. [Google Scholar] [CrossRef] [PubMed] [Green Version]
- Kishawy, H.A.; Kannan, S.; Balazinski, M. An Energy Based Analytical Force Model for Orthogonal Cutting of Metal Matrix Composites. CIRP Ann. 2004, 53, 91–94. [Google Scholar] [CrossRef]
- Pramanik, A.; Zhang, L.; Arsecularatne, J. Prediction of cutting forces in machining of metal matrix composites. Int. J. Mach. Tools Manuf. 2006, 46, 1795–1803. [Google Scholar] [CrossRef] [Green Version]
- Ghandehariun, A.; Kishawy, H.A.; Balazinski, M. On machining modeling of metal matrix composites: A novel comprehensive constitutive equation. Int. J. Mech. Sci. 2016, 107, 235–241. [Google Scholar] [CrossRef]
- Monaghan, J.; Brazil, D. Modelling the flow processes of a particle reinforced metal matrix composite during machining. Compos. Part A Appl. Sci. Manuf. 1998, 29, 87–99. [Google Scholar] [CrossRef]
- Ramesh, M.; Chan, K.C.; Lee, W.B.; Cheung, C.F. Finite-element analysis of diamond turning of aluminium matrix composites. Compos. Sci. Technol. 2001, 61, 1449–1456. [Google Scholar] [CrossRef]
- El-Gallab, M.S.; Sklad, M. Machining of aluminum/silicon carbide particulate metal matrix composites. J. Mater. Process. Technol. 2004, 152, 23–34. [Google Scholar] [CrossRef]
- Pramanik, A.; Zhang, L.; Arsecularatne, J. An FEM investigation into the behavior of metal matrix composites: Tool–particle interaction during orthogonal cutting. Int. J. Mach. Tools Manuf. 2007, 47, 1497–1506. [Google Scholar] [CrossRef]
- Zhou, L.; Huang, S.T.; Wang, D.; Yu, X.L. Finite element and experimental studies of the cutting process of SiCp/Al composites with PCD tools. Int. J. Adv. Manuf. Technol. 2010, 52, 619–626. [Google Scholar] [CrossRef]
- Dandekar, C.R.; Shin, Y.C. Multi-step 3-D finite element modeling of subsurface damage in machining particulate reinforced metal matrix composites. Compos. Part A Appl. Sci. Manuf. 2009, 40, 1231–1239. [Google Scholar] [CrossRef]
- Wang, T.; Xie, L.; Wang, X. Simulation study on defect formation mechanism of the machined surface in milling of high volume fraction SiCp/Al composite. Int. J. Adv. Manuf. Technol. 2015, 79, 1185–1194. [Google Scholar] [CrossRef]
- Ghandehariun, A.; Kishawy, H.A.; Umer, U.; Hussein, H.M. Analysis of tool-particle interactions during cutting process of metal matrix composites. Int. J. Adv. Manuf. Technol. 2015, 82, 143–152. [Google Scholar] [CrossRef]
- Ghandehariun, A.; Kishawy, H.A.; Umer, U.; Hussein, H.M. On tool–workpiece interactions during machining metal matrix composites: Investigation of the effect of cutting speed. Int. J. Adv. Manuf. Technol. 2015, 84, 2423–2435. [Google Scholar] [CrossRef]
- Zhou, L.; Cui, C.; Zhang, P.; Ma, Z. Finite element and experimental analysis of machinability during machining of high-volume fraction SiCp/Al composites. Int. J. Adv. Manuf. Technol. 2016, 91, 1935–1944. [Google Scholar] [CrossRef]
- Pramanik, A.; Zhang, L.C. Particle fracture and debonding during orthogonal machining of metal matrix composites. Adv. Manuf. 2017, 5, 77–82. [Google Scholar] [CrossRef] [Green Version]
- Liu, J.; Chou, Y.K. Cutting Tool Temperature Analysis in Heat-Pipe Assisted Composite Machining. J. Manuf. Sci. Eng. 2007, 129, 902–910. [Google Scholar] [CrossRef] [Green Version]
- Lesuer, D.R.; Kay, G.; LeBlanc, M. Modeling large strain, high rate deformation in metals. In Proceedings of the Third Biennial Tri-Laboratory Engineering Conference on Modeling and Simulation, Pleasanton, CA, USA, 03–15 November 1999; Lawrence Livermore National Laboratory: Livermore, CA, USA. [Google Scholar]
- Zhu, Y.; Kishawy, H. Influence of alumina particles on the mechanics of machining metal matrix composites. Int. J. Mach. Tools Manuf. 2005, 45, 389–398. [Google Scholar] [CrossRef]
- Abaqus V 6.14 Documentation. Available online: http://130.149.89.49:2080/v6.14/ (accessed on 22 June 2020).
- Fathipour, M.; Zoghipour, P.; Tarighi, J.; Yousefi, R. Investigation of Reinforced Sic Particles Percentage on Machining Force of Metal Matrix Composite. Mod. Appl. Sci. 2012, 6, 9–20. [Google Scholar] [CrossRef]
- Monaghan, J.; Brazil, D. Modeling the sub-surface damage associated with the machining of a particle reinforced MMC. Comput. Mater. Sci. 1997, 9, 99–107. [Google Scholar] [CrossRef]
- El-Gallab, M.; Sklad, M. Machining of Al/SiC particulate metal matrix composites, Part-II. J. Mater. Process. Technol. 1998, 83, 277–285. [Google Scholar] [CrossRef]
- Hung, N.P.; Venkatesh, V.C.; Loh, N.L. Machining of metal matrix composites. Manuf. Eng. Mater. Process. 1999, 53, 295–356. [Google Scholar]
- El-Gallab, M.; Sklad, M. Machining of Al/SiC particulate metal-matrix composites, Part-I. J. Mater. Process. Technol. 1998, 83, 151–158. [Google Scholar] [CrossRef]
- Ding, X.; Liew, W.; Liu, X. Evaluation of machining performance of MMC with PCBN and PCD tools. Wear 2005, 259, 1225–1234. [Google Scholar] [CrossRef]
- Chambers, A. The machinability of light alloy MMCs. Compos. Part A Appl. Sci. Manuf. 1996, 27, 143–147. [Google Scholar] [CrossRef]
- Quan, Y.; Zhou, Z.; Ye, B. Cutting process and chip appearance of aluminum matrix composites reinforced by SiC particle. J. Mater. Process. Technol. 1999, 91, 231–235. [Google Scholar] [CrossRef]
Figure 1.
Finite element (FE) model for metal matrix composite (MMC) cutting.

Figure 2.
Deformed workpiece showing equivalent plastic strain contour.

Figure 3.
Cutting forces from experimental works [16] and simulations.
Figure 3.
Cutting forces from experimental works [16] and simulations.

Figure 4.
Thrust forces from experimental works [16] and simulations.
Figure 4.
Thrust forces from experimental works [16] and simulations.

Figure 5.
Mises stress contours (MPa) at different cutting parameters and MMC configuration. (a) V = 60 m/min, f = 0.1 mm/rev, p = 15 µm; (b) V = 180 m/min, f = 0.1 mm/rev, p = 15 µm; (c) V = 60 m/min, f = 0.3 mm/rev, p = 15 µm; (d) V = 60 m/min, f = 0.1 mm/rev, p = 20 µm.
Figure 5.
Mises stress contours (MPa) at different cutting parameters and MMC configuration. (a) V = 60 m/min, f = 0.1 mm/rev, p = 15 µm; (b) V = 180 m/min, f = 0.1 mm/rev, p = 15 µm; (c) V = 60 m/min, f = 0.3 mm/rev, p = 15 µm; (d) V = 60 m/min, f = 0.1 mm/rev, p = 20 µm.

Figure 6.
Temperature results from experimental works [16] and simulations.
Figure 6.
Temperature results from experimental works [16] and simulations.

Figure 7.
Temperature contour at different cutting parameters and MMC configuration. (a) V = 60 m/min, f = 0.1 mm/rev, p = 15 µm; (b) V = 180 m/min, f = 0.1 mm/rev, p = 15 µm; (c) V = 60 m/min, f = 0.3 mm/rev, p = 15 µm; (d) V = 60 m/min, f = 0.1 mm/rev, p = 20 µm.
Figure 7.
Temperature contour at different cutting parameters and MMC configuration. (a) V = 60 m/min, f = 0.1 mm/rev, p = 15 µm; (b) V = 180 m/min, f = 0.1 mm/rev, p = 15 µm; (c) V = 60 m/min, f = 0.3 mm/rev, p = 15 µm; (d) V = 60 m/min, f = 0.1 mm/rev, p = 20 µm.

Figure 8.
Strength of input parameters on tool stresses, temperatures, and specific cutting energy.

Figure 9.
Combined effects of reinforcement particle size and feed rate on tool stresses.

Figure 10.
Combined effects of cutting speed and feed rate on average tool–chip interface temperatures.
Figure 10.
Combined effects of cutting speed and feed rate on average tool–chip interface temperatures.

Figure 11.
Combined effects of cutting speed and feed rate on specific cutting energy.

Figure 12.
A 3D bubble chart showing feasible, unfeasible, and optimal design points.

Figure 13.
A 4D bubble chart with two input and two output parameters.


Table 1.
Workpiece and cutting tool materials’ composition and properties. PCD, polycrystalline diamond.
Table 1.
Workpiece and cutting tool materials’ composition and properties. PCD, polycrystalline diamond.
| Matrix Al359 | Reinforcement Particle (SiC) | Cutting Tool (PCD) | |
|---|---|---|---|
| Density (kg/m3) | 2700 | 4370 | 3500 |
| Young‘s modulus (GPa) | 72 | 408 | 800 |
| Thermal conductivity (W/m/°C) | 180 | 30 | 173 |
| Specific heat (J/Kg/°C) | 963 | 706 | 508 |
Table 2.
Cutting parameters and tool geometry for finite element (FE) models.
| Cutting parameters | |
|---|---|
| Speed | 60, 120, and 180 m/min |
| Feed rate | 0.1, 0.2, and 0.3 mm/rev |
| Depth of cut | 2 mm |
| Cutting tool geometry | |
| Rake angle | 0° |
| Clearance angle | 11° |
| Edge preparation | No |
Table 3.
The Johnson-Cook (JC) equation constants for Al-359 alloy.
| JC Parameters | A (MPa) | B (MPa) | C | n | m | Tmelt |
|---|---|---|---|---|---|---|
| 255 | 361 | 0.01 | 0.18 | 5.5 | 593 |
Table 4.
The Johnson-Cook damage law’s constants for Al-359 alloy.
| JC Parameters | D1 | D2 | D3 | D4 | D5 |
|---|---|---|---|---|---|
| 0.071 | 1.248 | −1.142 | 0.147 | 0.1 |
Table 5.
Full-factorial design of experiments (DOE) and the results obtained using FE models.
| Id | V(m/min) | f (mm/rev) | p (µm) | T (°C) | U (J/mm3) | S (MPa) |
|---|---|---|---|---|---|---|
| 1 | 60 | 0.1 | 10 | 210 | 890 | 704 |
| 2 | 60 | 0.2 | 10 | 229 | 773 | 1879 |
| 3 | 60 | 0.3 | 10 | 254 | 793 | 4276 |
| 4 | 120 | 0.1 | 10 | 258 | 885 | 739 |
| 5 | 120 | 0.2 | 10 | 270 | 738 | 2148 |
| 6 | 120 | 0.3 | 10 | 276 | 758 | 4006 |
| 7 | 180 | 0.1 | 10 | 278 | 880 | 782 |
| 8 | 180 | 0.2 | 10 | 292 | 723 | 1973 |
| 9 | 180 | 0.3 | 10 | 300 | 683 | 4495 |
| 10 | 60 | 0.1 | 15 | 216 | 915 | 1270 |
| 11 | 60 | 0.2 | 15 | 239 | 795 | 3685 |
| 12 | 60 | 0.3 | 15 | 263 | 813 | 6610 |
| 13 | 120 | 0.1 | 15 | 268 | 910 | 1420 |
| 14 | 120 | 0.2 | 15 | 282 | 760 | 3978 |
| 15 | 120 | 0.3 | 15 | 288 | 778 | 6908 |
| 16 | 180 | 0.1 | 15 | 290 | 900 | 1655 |
| 17 | 180 | 0.2 | 15 | 303 | 745 | 4387 |
| 18 | 180 | 0.3 | 15 | 311 | 702 | 7255 |
| 19 | 60 | 0.1 | 20 | 221 | 935 | 3372 |
| 20 | 60 | 0.2 | 20 | 246 | 808 | 6231 |
| 21 | 60 | 0.3 | 20 | 269 | 828 | 9386 |
| 22 | 120 | 0.1 | 20 | 276 | 930 | 4184 |
| 23 | 120 | 0.2 | 20 | 288 | 773 | 7913 |
| 24 | 120 | 0.3 | 20 | 295 | 793 | 10982 |
| 25 | 180 | 0.1 | 20 | 297 | 920 | 4860 |
| 26 | 180 | 0.2 | 20 | 310 | 758 | 9334 |
| 27 | 180 | 0.3 | 20 | 319 | 717 | 12,203 |
Table 6.
Objective functions and constraint.
| Objective functions |
|
| Constraint |
|
© 2020 by the authors. Licensee MDPI, Basel, Switzerland. This article is an open access article distributed under the terms and conditions of the Creative Commons Attribution (CC BY) license (http://creativecommons.org/licenses/by/4.0/).
Share and Cite
MDPI and ACS Style
Umer, U.; Abidi, M.H.; Qudeiri, J.A.; Alkhalefah, H.; Kishawy, H. Tool Performance Optimization While Machining Aluminium-Based Metal Matrix Composite. Metals 2020, 10, 835. https://0-doi-org.brum.beds.ac.uk/10.3390/met10060835
AMA Style
Umer U, Abidi MH, Qudeiri JA, Alkhalefah H, Kishawy H. Tool Performance Optimization While Machining Aluminium-Based Metal Matrix Composite. Metals. 2020; 10(6):835. https://0-doi-org.brum.beds.ac.uk/10.3390/met10060835
Chicago/Turabian StyleUmer, Usama, Mustufa Haider Abidi, Jaber Abu Qudeiri, Hisham Alkhalefah, and Hossam Kishawy. 2020. "Tool Performance Optimization While Machining Aluminium-Based Metal Matrix Composite" Metals 10, no. 6: 835. https://0-doi-org.brum.beds.ac.uk/10.3390/met10060835
Note that from the first issue of 2016, this journal uses article numbers instead of page numbers. See further details here.