Article

Sustainable Manufacturing and Parametric Analysis of Mild Steel Grade 60 by Deploying CNC Milling Machine and Taguchi Method

1
Department of Industrial Engineering, University of Engineering & Technology, Peshawar 25000, Pakistan
2
Key Laboratory of High Efficiency and Clean Mechanical Manufacture, Ministry of Education, School of Mechanical Engineering, Shandong University, Jinan 251600, China
3
Department of Mechanical Engineering, Khawaja Fareed University of Engineering and Information Technology, Rahim Yar Khan 64200, Pakistan
4
Department of Automated Mechanical Engineering, South Ural State University, Lenin Prosp. 76, 454080 Chelyabinsk, Russia
5
Mechanical Engineering, Imperial College London, Exhibition Road, South Kensington, London SW7 2AZ, UK
6
Design, Manufacturing & Engineering Management, University of Strathclyde, Glasgow G1 1XJ, Scotland, UK
*
Author to whom correspondence should be addressed.
Submission received: 3 September 2020 / Revised: 24 September 2020 / Accepted: 26 September 2020 / Published: 29 September 2020
(This article belongs to the Special Issue Optimization and Analysis of Metal Cutting Processes)

Abstract

:
Design and manufacturing are the key steps in the sustainable manufacturing of any product to be produced. Within the perspective of injection molds production, increased competitiveness and repeated changes in the design require a complete optimized manufacturing process. Local and minor improvements in the milling process do not generally lead to an optimized manufacturing process. The goal of the new geometry and parametric analysis of the mould is to reduce the quality issues in mild steel grade 60. In this explicit research, the surface roughness (smoothness) of indigenously produced injection moulds in the local market in Pakistan is investigated. The CNC milling machine (five-axis) is used for the manufacturing of an injection mould, and the Taguchi method of the design of the experiment is applied for parameters optimization. Hence, the overall process is assisted in balancing the milling machine parameters to trim down the surface roughness issue in mild steel moulds and increase their sustainability. The spindle speed (rpm), the depth of cut (mm), and the feed rate (mm/rev) are considered as input variables for process optimization, and the experiments are performed on mild steel grade 60. It is deduced that the combination of a spindle speed of 800 rpm, feed rate of 10 mm/rev and depth of cut of 0.5 mm is the best case in case of minimum surface roughness, which leads to sustainable products. It is also deduced from ANOVA, that the spindle speed is a factor that affects the surface roughness of mild steel products, while the feed rate turns out to be insignificant.

1. Introduction

CNC milling is a non-traditional machining process that makes use of multi-point rotating cutting tools and computerized controls to take away material from the work-part to produce a desired part or product. Explicitly, milling is the process of removing bits and pieces from a workpiece with the help of rotary cutting tools. The specialized cutter often has many cutting points, which usually move upright on the given axis, with the circumference of the tool into the work part. During the machining operation, the edges of the tool engrave minute cuts in the piece to shape its surface. As the machining continues, the chips are produced continuously, which are chipped off the surface as a resut of cutting. This type of machining is efficient for a wide range of materials such as wood, metal, glass, and plastic. A wide variety of shapes can be produced through this process, i.e., holes, slots, notches, pockets, and grooves.
Sustainable production has always been the main factor for economic growth because of its large technological opportunities and status as an economic multiplier. However, manufacturing industries mostly have carbon footprints that raises concerns regarding the sustainability of product development [1,2,3,
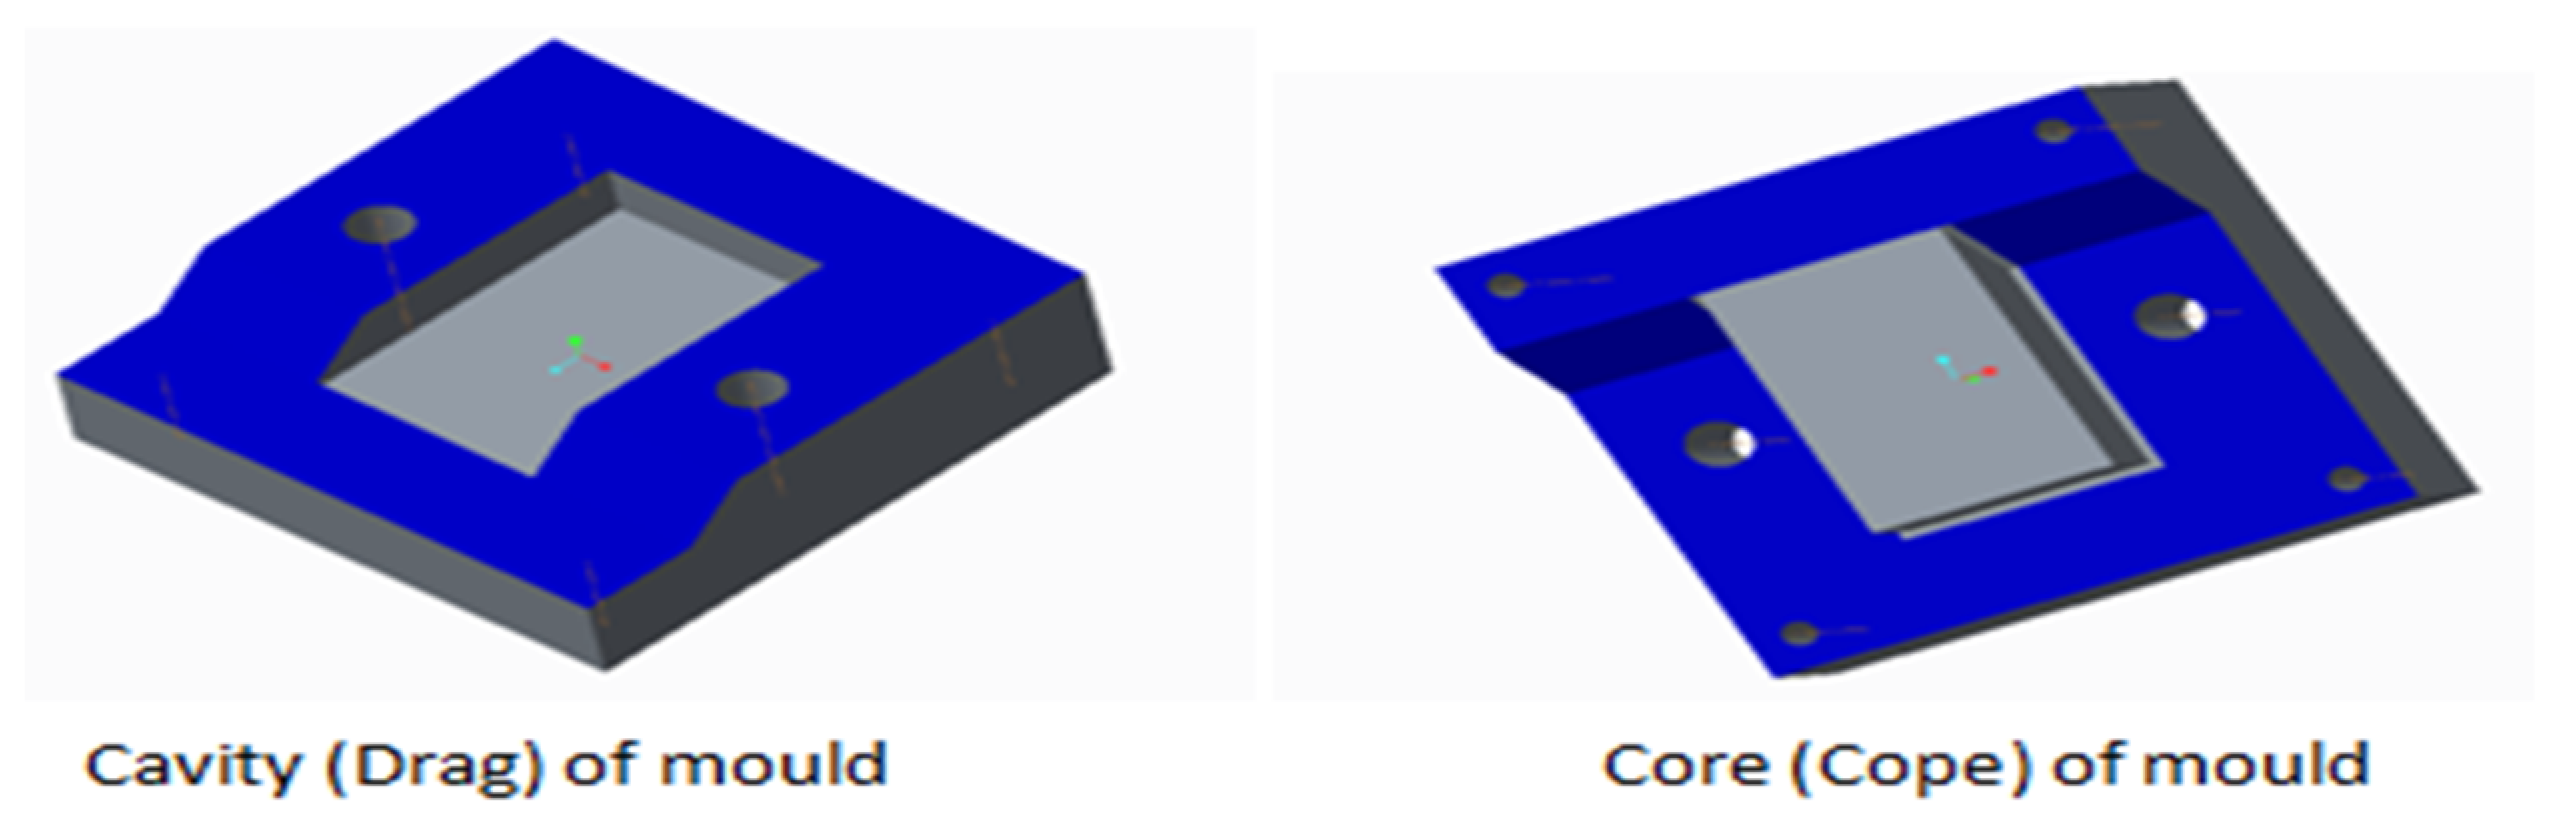
4]. In molding, mould is a term that is used commonly, and it is used to elaborate the process used to make plastic goods. The moulds are essential to produce when production is required at a large scale. Moulds are used to produce products from simple paper clips to complex shapes that are used in complex technologies. Moulds are mostly made from mild steel, aluminum, and beryllium–copper alloys [5]. While manufacturing different moulds, important properies to be taken under consideration in manufacturing and application are good polishing capability, good machining properties, excellent spark erosion properties, easy heat treatment, safe, and good surface finish. Crucial characteristics of injection moulds are uniform composition and liberty from internal damages, toughness, weldability, polishability, and wear resistance.
The design and the production of moulds have a substantial effect on the final product’s cost and quality [6]. With the repeated changes in mould design and increasing competitiveness, it is very helpful to estimate the exact production expenses to optimize the manufacturing process [7]. For achieving a good quality product after manufacturing, it is important to design, analyze, and fabricate moulds in the best possible way. If mistakes/errors occur during designing, analysis, and manufacturing, it will lead to quality problems in the final products.
Several researchers carried out research on different materials using the CNC milling process and deployed different optimization methods to reduce quality issues and sustain and improve the final outcome. Thus far, a number of researchers designed and fabricated injection/insertion moulds for diverse products and processes. Jamshed et al. conducted research on the design of an injection mould for making cam bush containing a submarine gate and for analysis of the mold flow, location of the submarine gate, and the filling rate, having auto desk plastic insight was used [8]. Likewise, Alaneme et al. researched on the mould and dies of a punching machine utilized for the making of cable trays, and the failure analysis was done through microstructural examination, visual examination, hardness testing, and chemical reaction determination [9]. The damages and breakdowns were investigated on a copper mold with chromium layered sides where in analysis, it was pointed out that working conditions cause failure origin and a high content of zinc causes the liquid steel copper wear [10].
Xi-Ping and co-researchers published their research on the stress and thermal study of electric heating rotation of a plastic insertion mould for TV panels and buckling of the mould structure, and the source that causes huge thermal stress was investigated by finite element simulation [11]. Research work was done in which the designing of an insertion mould was highlighted for warpage testing sample and to carry out thermal analysis of the mould. In the same way, a mould was designed by using Unigraphics (Software Version 13.0, Siemens NX). Residual stress analysis (thermal) was also performed by means of LUSAS Analyst (Version 13.5) [12,13,14,15]. The Taguchi method was deployed for diminishing warpage in the modeling of the injection mould, and it was concluded from the results that the melting temperature is a decisive factor on the phenomena of warpage, while the filling time of a mould affected warpage to some extent [16]. Moulds failures were also analyzed under pressure, and the main reasons of failure of the moulds were found to be the nature of the substance used, cyclical temperature to power intensity, as well as the physical and chemical reaction of the casting alloy. The maximum intensity of stress took place at the joining surfaces for the period of filling and short contact of melt in the mould [17,18,19,20,21].
Multi-response optimization was also addressed all together to reduce the ten-spot roughness (Rz), arithmetical roughness (Ra), and machining power consumed (Pm). The influence of depth of cut (ap), spindle speed (S), tip radius (r), and the feed rate (fz) were explored though the grey relational analysis (GRA) technique. It was deduced from the results, that processing factors greatly affected the machining power and the radius had a considerable effect on the roughness criteria [22,23,24]. P20 steel was machined in a CNC milling machine, during which the process parameters that had an impact on the power consumption were investigated. Response surface methodology was deployed, and the cutting speed, the depth of cut, and the feed rate were taken for optimization. ANOVA was applied to find the most influencing factors on power consumption, and it was revealed that the cutting depth/depth of cut slightly influenced the power consumption, while the feed rate and speed of cutting are the considerable parameters in upsetting the power consumption [25].
A method was proposed to perk up the entire cycle of milling and polishing in view of limitations from the machine tool and polishing process. Hence, the complete process is analyzed for balancing the milling as well as polishing times to lessen the total production time. The designed experiments were conducted on an aluminum mould for plastic bottles [26]. Mehdi Moayyedian et al. made the new shape of the entire runner system in the plastic injection molding, and the aim of this geometry was to decrease the cycle time and scrap and also to eject the runner system from the moulds easily. As the contact face of the runner system is reduced with the mould walls, this improved the opening of the runner system from the cavity/drag as well [27]. The designing of a mould in injection molding is a key task with considerable implications to yield productivity and quality. Bush conduit spreading extensively influences injection molding, and it was revealed that the injectant’s polymeric property offers a substantial advantage in the designing of sprue bush [28]. Likewise, Failure Mode and Effect Analysis were used in order to make out the conditions in which a mould for plastic injection can make scrap parts [29]. Similarly, many other researchers conducted research on different materials while machining on CNC milling and were able to reduce quality problems and make the desired outcome sustainable [30,31,32,33].
So far, significant research studies have been executed on CNC milling. However, research studies on specific grades of steel are still not enough. Adel Taha et al. found optimized cutting conditions for face-milling on grade-H steel using the Edgeworth–Pareto method and artificial neural networks. The combination of parameters was adjusted to minimize the surface roughness, improving the accuracy and lessening production costs [34]. Energy consumption and surface quality associated with the material removal rate and costs were investigated for AISI 1045 steel during face milling. It was revealed that the optimized milling performance for fast manufacturing is possible through gray relational analysis [35]. Experimental research was performed to flatten the material using the face mill wear effect by various cutting conditions of steel 45 [36].
Manufacturing sectors are striving hard to achieve sustainability by making changes in systems, products, and processes. Likewise, local manufacturers and industrialists in Peshawar (Pakistan) were coming across an issue of surface unevenness in the moulds of mild steel grade 60 due to the limitations of applications of scientific optimization techniques on particular issues, and there was no consideration of applying optimized parameters in the local market [37,38,39,40]. In this research, the issue of surface roughness has been tackled and optimized with selected process parameters, while optimization of the selected material is carried out using a CNC milling machine. The results suggested that the optimized process parameters of the milling machine optimized the surface roughness in the final outcome, and the desired products with superior quality have been achieved. Ultimately, sustainability in the form of less surface roughness has been achieved. This would lead to less waste material and increased productivity.

2. Materials and Methods

To achieve the desired output, it is imperative to plan an acceptable and suitable methodology for the research work. Hence, a proper methodology has been planned and designed. It was observed from the literature review and local market surveys in Peshawar that there are limited skilled people and advanced machines that cause quality issues in the form of surface roughness, wastage of materials, time, and power consumption in final manufactured moulds. More specifically, mild steel grade 60 is selected, as manufacturers were facing problems in moulds of this specific material, and the limitation of the application of optimization techniques leads to difficulties in the machining process and surface roughness issues. This material is ductile, low cost, easily available, and not as hard compared to other types of steel.
The mould is modeled in PTC CREO 3.0 software, and the experimental setup is done for mould manufacturing. After designing it in CREO, it is fabricated using a CNC five-axis machine. Parameters such asthe depth of cut, the speed of the spindle, and the feed rate are optimized to reduce the surface roughness in grade 60 mild steel moulds.

2.1. Mould’s Modeling

Surface roughness is a serious issue, and it is important to reduce it in final products/moulds of mild steel. It is deduced from the literature that the modeling (designing) of each and every component of mould [41,42,43,44] plays a vital role in the quality of products. Hence, these parts are modeled in CREO software instead of machining the mouldparts directly. Modeling of mould is also carried out to complete the overall product development process. Generally, mould has a core, cavity, and mounting bosses. The core shows the internal surface of the mould, and the cavity shows the outer surface of the mould, while mounting bosses keep the core and cavity in fixed positions. In this research, mould is made in several parts and modeled in CREO software. Drawings of drag and cope and other smaller parts are also created and are shown in Figure 1 and Figure 2 respectively.
The final part to be made inside the cavity of the mould is 20 mm high and 65 mm in breadth. The revolve command and the extrude command are used in modeling of the cavity in CREO software, while some other commands are also used in the modeling of different parts. Slight changes are made in the cavity, core, and other plates for further processing and can also be seen in Figure 2.
After separately modeling the core and cavity and different parts, they are assembled using different assembling commands to form a complete mould. Then, the same parts are communicated through software with the milling machine for fabrication.

2.2. Experimental Setup

As the modeling process is completed, the whole process of manufacturing the same mould is executed through a milling machine (CNC five-axes). Each and every step of this specific research, i.e., from machining to surface roughness measurment, is shown via the experimental setup/scheme given in Figure 3. In Figure 3, 1 shows different parts of the machine, 2 shows the machining of parts, 3 shows the desktop that helps in guiding and controlling the machining process, 4 represents the scanning electron microscope for taking micrographs, and 5 represents the roughness tester for finding the surface roughness. The optimization of data is explained in Table 3 in the results and discussion section in detail.
The model of this specific machine is LG-500, Taichung city, Taiwan, power of 15 kVA, 3520 kg weight, frequency of (50/60) Hz, the air taken is 6.5 Kg/cm2 (92 Psi) for pressure operation, and ISO-VG 68 oil lubricator is used.
For the machining of any part through a CNC machine, initially, a program is written, which is then communicated to the machine through a computer. The tools and the workpiece are attached to the machine, which operates as per the program. After the whole setup, machining is executed on actual basis. The cutter assembly of the CNC milling machine is given in Figure 4a. Figure 4b shows the engagement of tool on the workpiece. A sliding motion occurs between the workpiece and the cutter during machining.
The type of cutter used in the machining process is an end mill cutter, and it is specifically called a tungsten carbide end mill cutter. The direction of the movement of the cutter can be in five different directions. However, in this experimental setup, the motion of a tool is restricted in three directions depending upon the requirements. The approximate hardness and chemical composition of a workpiece and a cutter are given in Table 1.

2.3. Manufacturing of Mild Steel Mould

The milling process follows similar fundamental production steps to those of every other computerized machining process that includes modeling a CAD model, altering the model to the CNC program, running the computerized milling machine, and performing the milling operation. During the machining process on a CNC machine, a wide range of tools are utilized for machining a workpiece or any part. A suitable selection of tools is very necessary for the proper machining of a product, and for this purpose, the tool length compensation function is used [45]. According to this particular function, machining is executed automatically without any interruption, even a tool is changed mechanically as per the program cutter path. For good quality milling, a cutter should have many teeth and perfect sharpness, the rpm of tool should be high enough to cut a material significantly, and some other parameters should be taken into consideration.
Mould manufacturing is a complex job [46,47]. In this research, the machining was made possible through three axes of the milling machine, while the fourth and fifth axes were disabled. As the materials brought from the market were not in exact sizes that is why extra material was removed by cutting. After cutting extra materials from the plates, a facing process was carried out on each plate for absolute machining. The speed of the spindle, the feed rate and the depth of cut were changed as per the size and shape of the part while using the same tool during the facing operation. Figure 5 depicts the removal of extra material and facing operation during machining. As this is facing process that is why it is different from Figure 1. Few changes were made in the machining to achieve the final dimensions of the plates.
After a few machining processes, each and every part is completed and then assembled to construct a complete designed mould. During this machining process, an optimization technique is applied on different parameters for sustainable manufacturing which will be discussed in Section 2.4 and Section 3. Complete fabricated mould can be seen in Figure 5.
After fabrication, the same manufactured mould is mounted in a vertical injection/insertion molding machine. There was no scientific knowledge applied on the mild steel moulds by the local manufacturers, which led to the surface roughness issue in products produced during injection molding. Hence, an optimization of parameters for plastic products can be done using this mould. The installed mould in the molding machine is also shown in Figure 5.

2.4. Application of Optimization Technique

The design of experiment is a method that is deployed to unearth a relationship among a number of factors. Input parameters are selected for the desired output [48]. Out of the input/process parameters, some of the factors are controlled by the operators, while other factors are not in the control of the worker. In this explicit research, three controllable input parameters, the feed rate, the speed of the spindle and the depth of cutare chosen and are processed during the manufacturing process of a mould on a milling machine (CNC five-axes) to get an optimized result for surface roughness. For obtaining the expected results, the Taguchi technique of optimization is applied to optimize the parameters. The Taguchi method is selected because it is an optimization technique that determines the finest levels of factors, and it is based on planning, performing, and evaluating results of matrix experiments.
After choosing the parameters such as the spindle speed (rpm), the feed rate (mm/rev) and the depth of cut (mm), three additional different stages of all parameters were considered. The factors and their respective levels are given in Table 2.
The numbers of experiments obtained by applying the Taguchi method of optimization were twenty-seven (27). The obtained combinations in those twenty-seven experiments are given in Appendix A Table A1.
The objective of the selection of the above mentioned parameters in Table 2 was to optimize them to optimize the surface roughness. The surface roughness was calculated through a surface roughness tester (portable). The topology of the machined surfaces is also measured and will be discussed in the results and discussion section.
After measuring the surface roughness for each experiment through a surface roughness tester, analysis of variance was deployed to determine the significant process parameters from the chosen parameters.

3. Results and Discussion

The Taguchi optimization technique from the design of experiments was deployed to find the optimum number of experiments between the input parameters (depth of cut, speed of spindle and feed rate) and an output parameter (surface roughness). The topography and surface roughness have also been measured through an electron microscope and profilometer. The Taguchi method recognizes proper control factors for the optimum findings of the process. Analysis of variance is also used to find the significant factors from the preferred parameters that affect the surface roughness the most. Normality test is deployed to find the normal distribution.
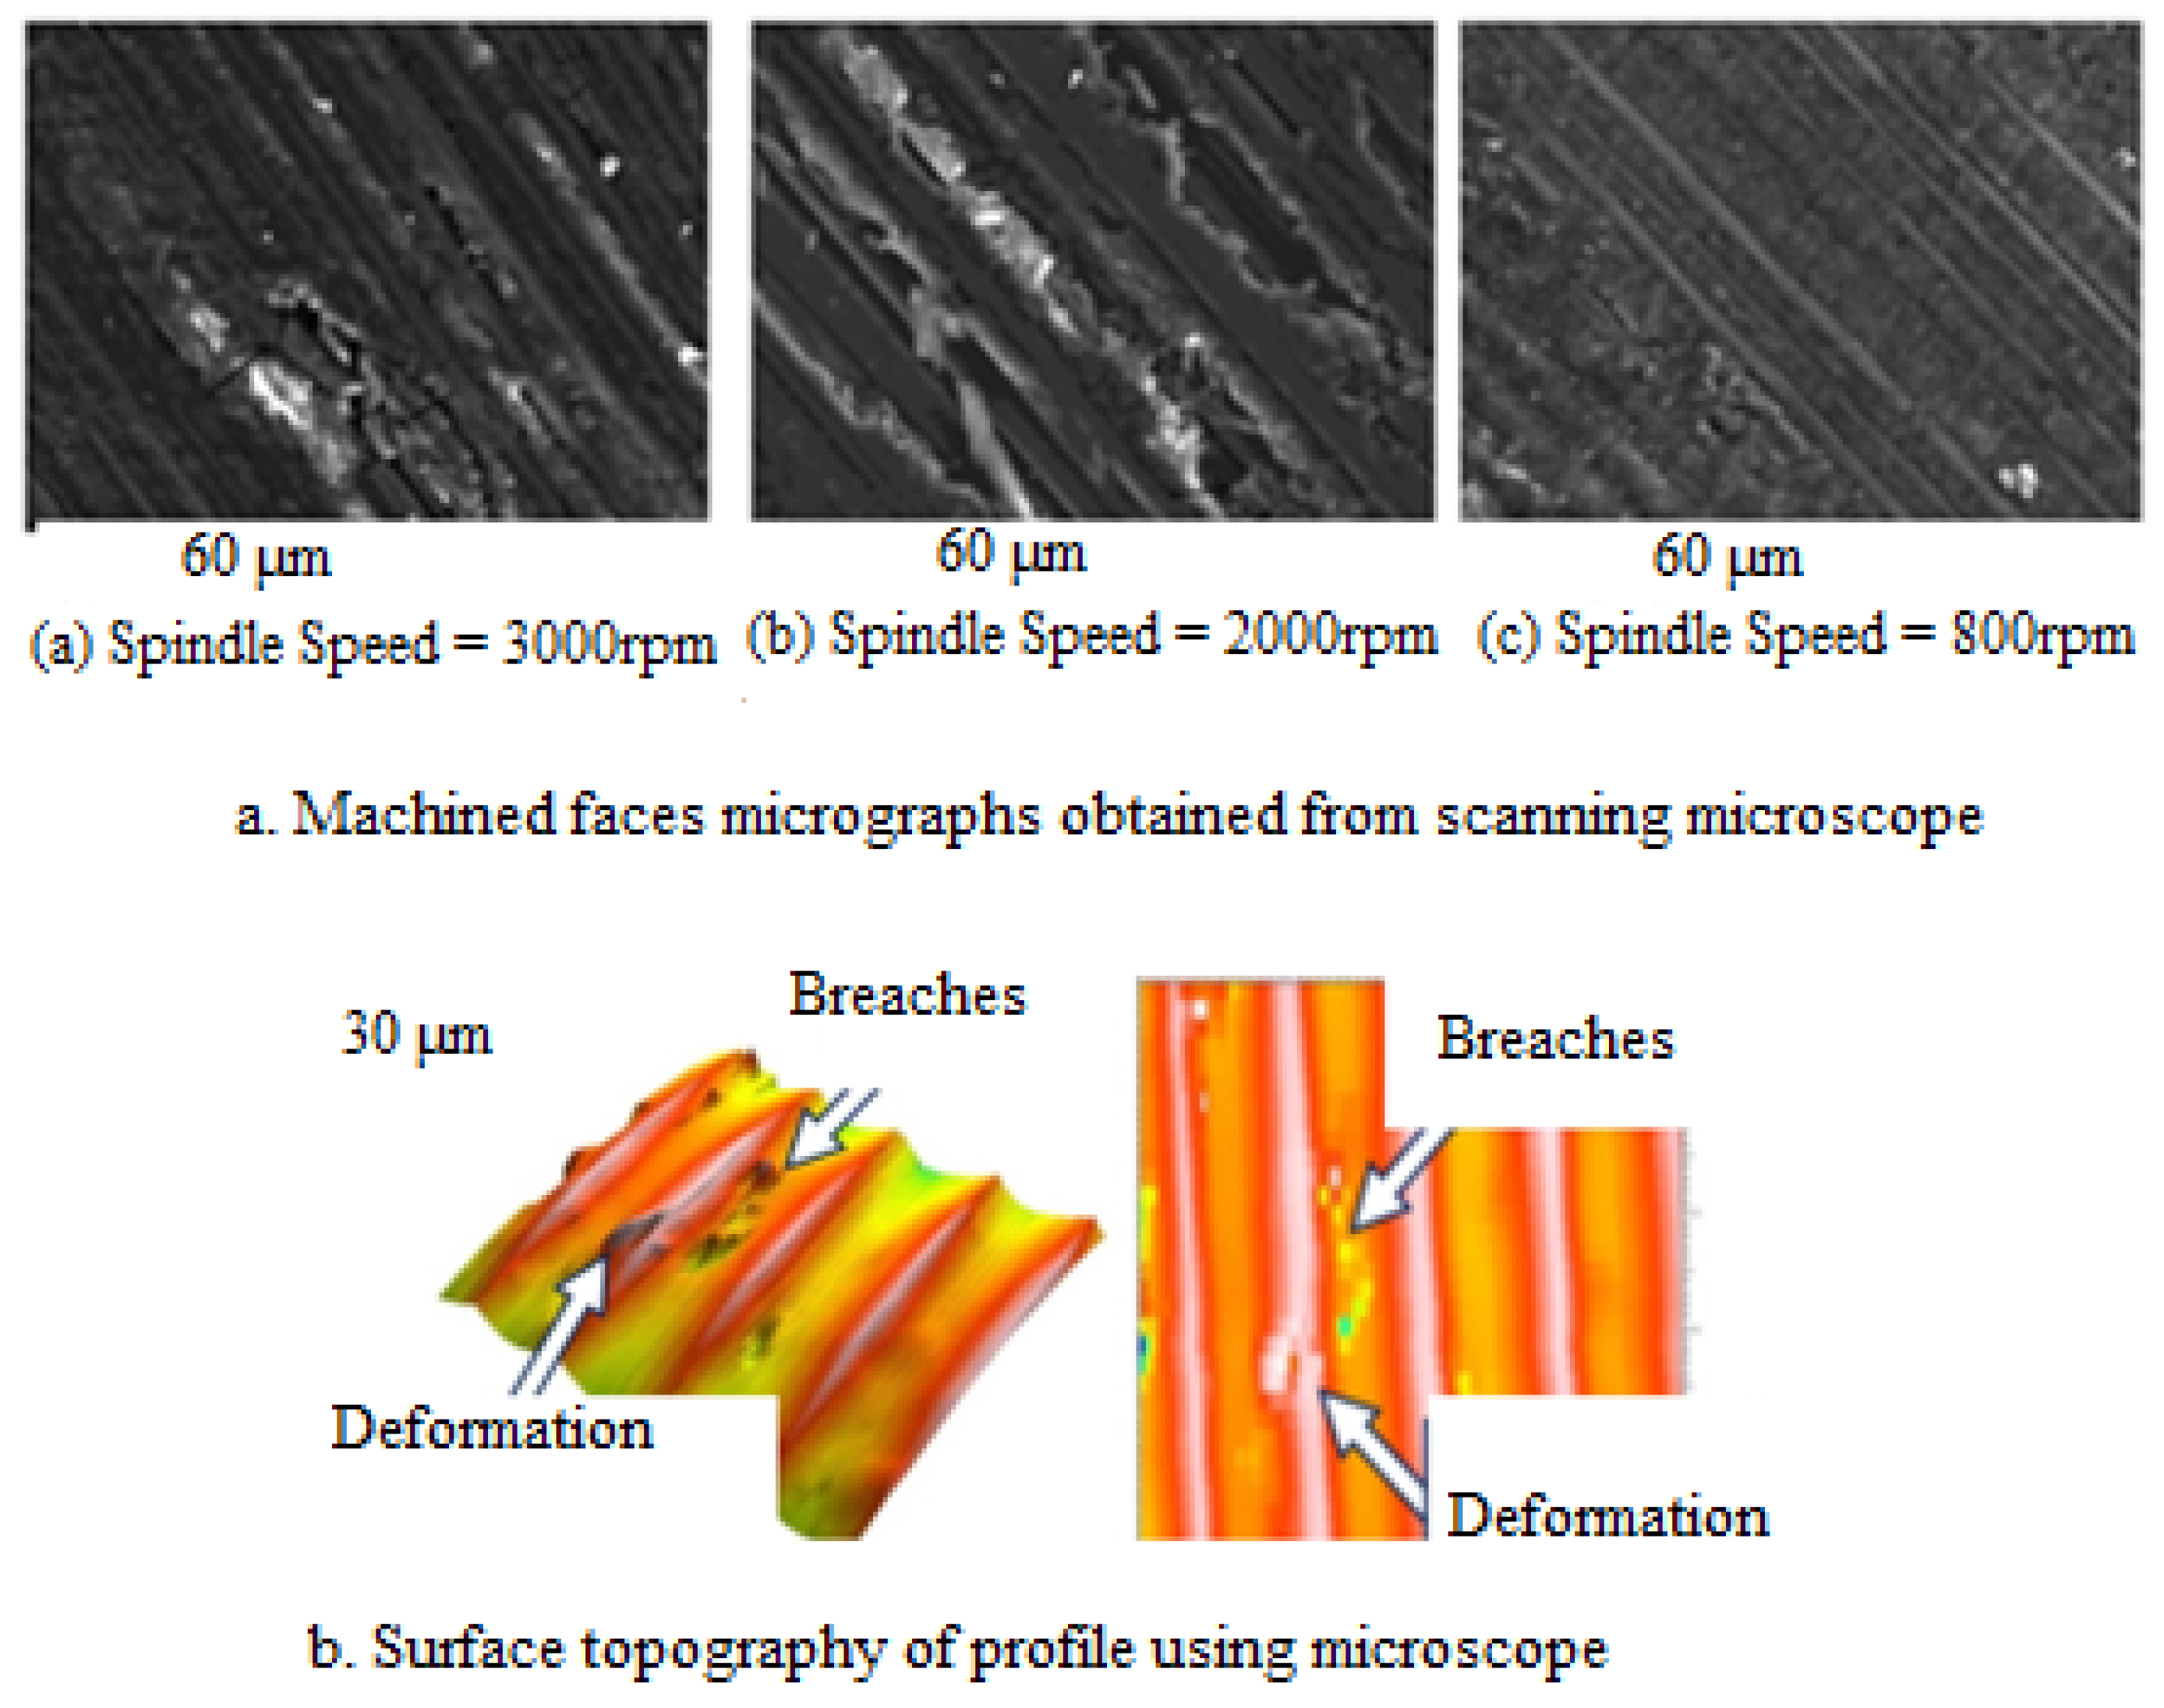
Different instruments are used to find the topography and optimized surface roughness. Scanning electron microscopic images are used for the verification of the morphology and surface integrity of the machined surfaces. The beam of electrons is focused on scanning the surface for producing images of samples. The obtained images of workpiece surfaces from the scanning electron microscope are given in Figure 6. It is evident that brittle and sharp fractures of fibers point out the failure modes.
Figure 6a shows the profile obtained from high, medium and low spindle speed. The surface roughness is enhanced rapidly at the maximum spindle speed. The increase of spindle speed leads to the higher generation of heat and tool wear, which ultimately led to the greater surface roughness. The maximum spindle speed also results in incomplete machining and causes a maximum surface roughness.
Breaches and deformations have also been measured using a microscope. Figure 6b shows the topographies of the surface of one of the plates of the mould obtained from the microscope. After the milling process on the profile, there are several breaches on the faces of mild steel. There is unevenness in the distribution of burrs and breaches. The number of breaches, dimensions of breaches, burrs on the profiles, and material deformations affects the dimension, shape preciseness, and performance of the workpieces. The source of breaches on the machined profile is due to the composition of the exterior layer of the mild steel.
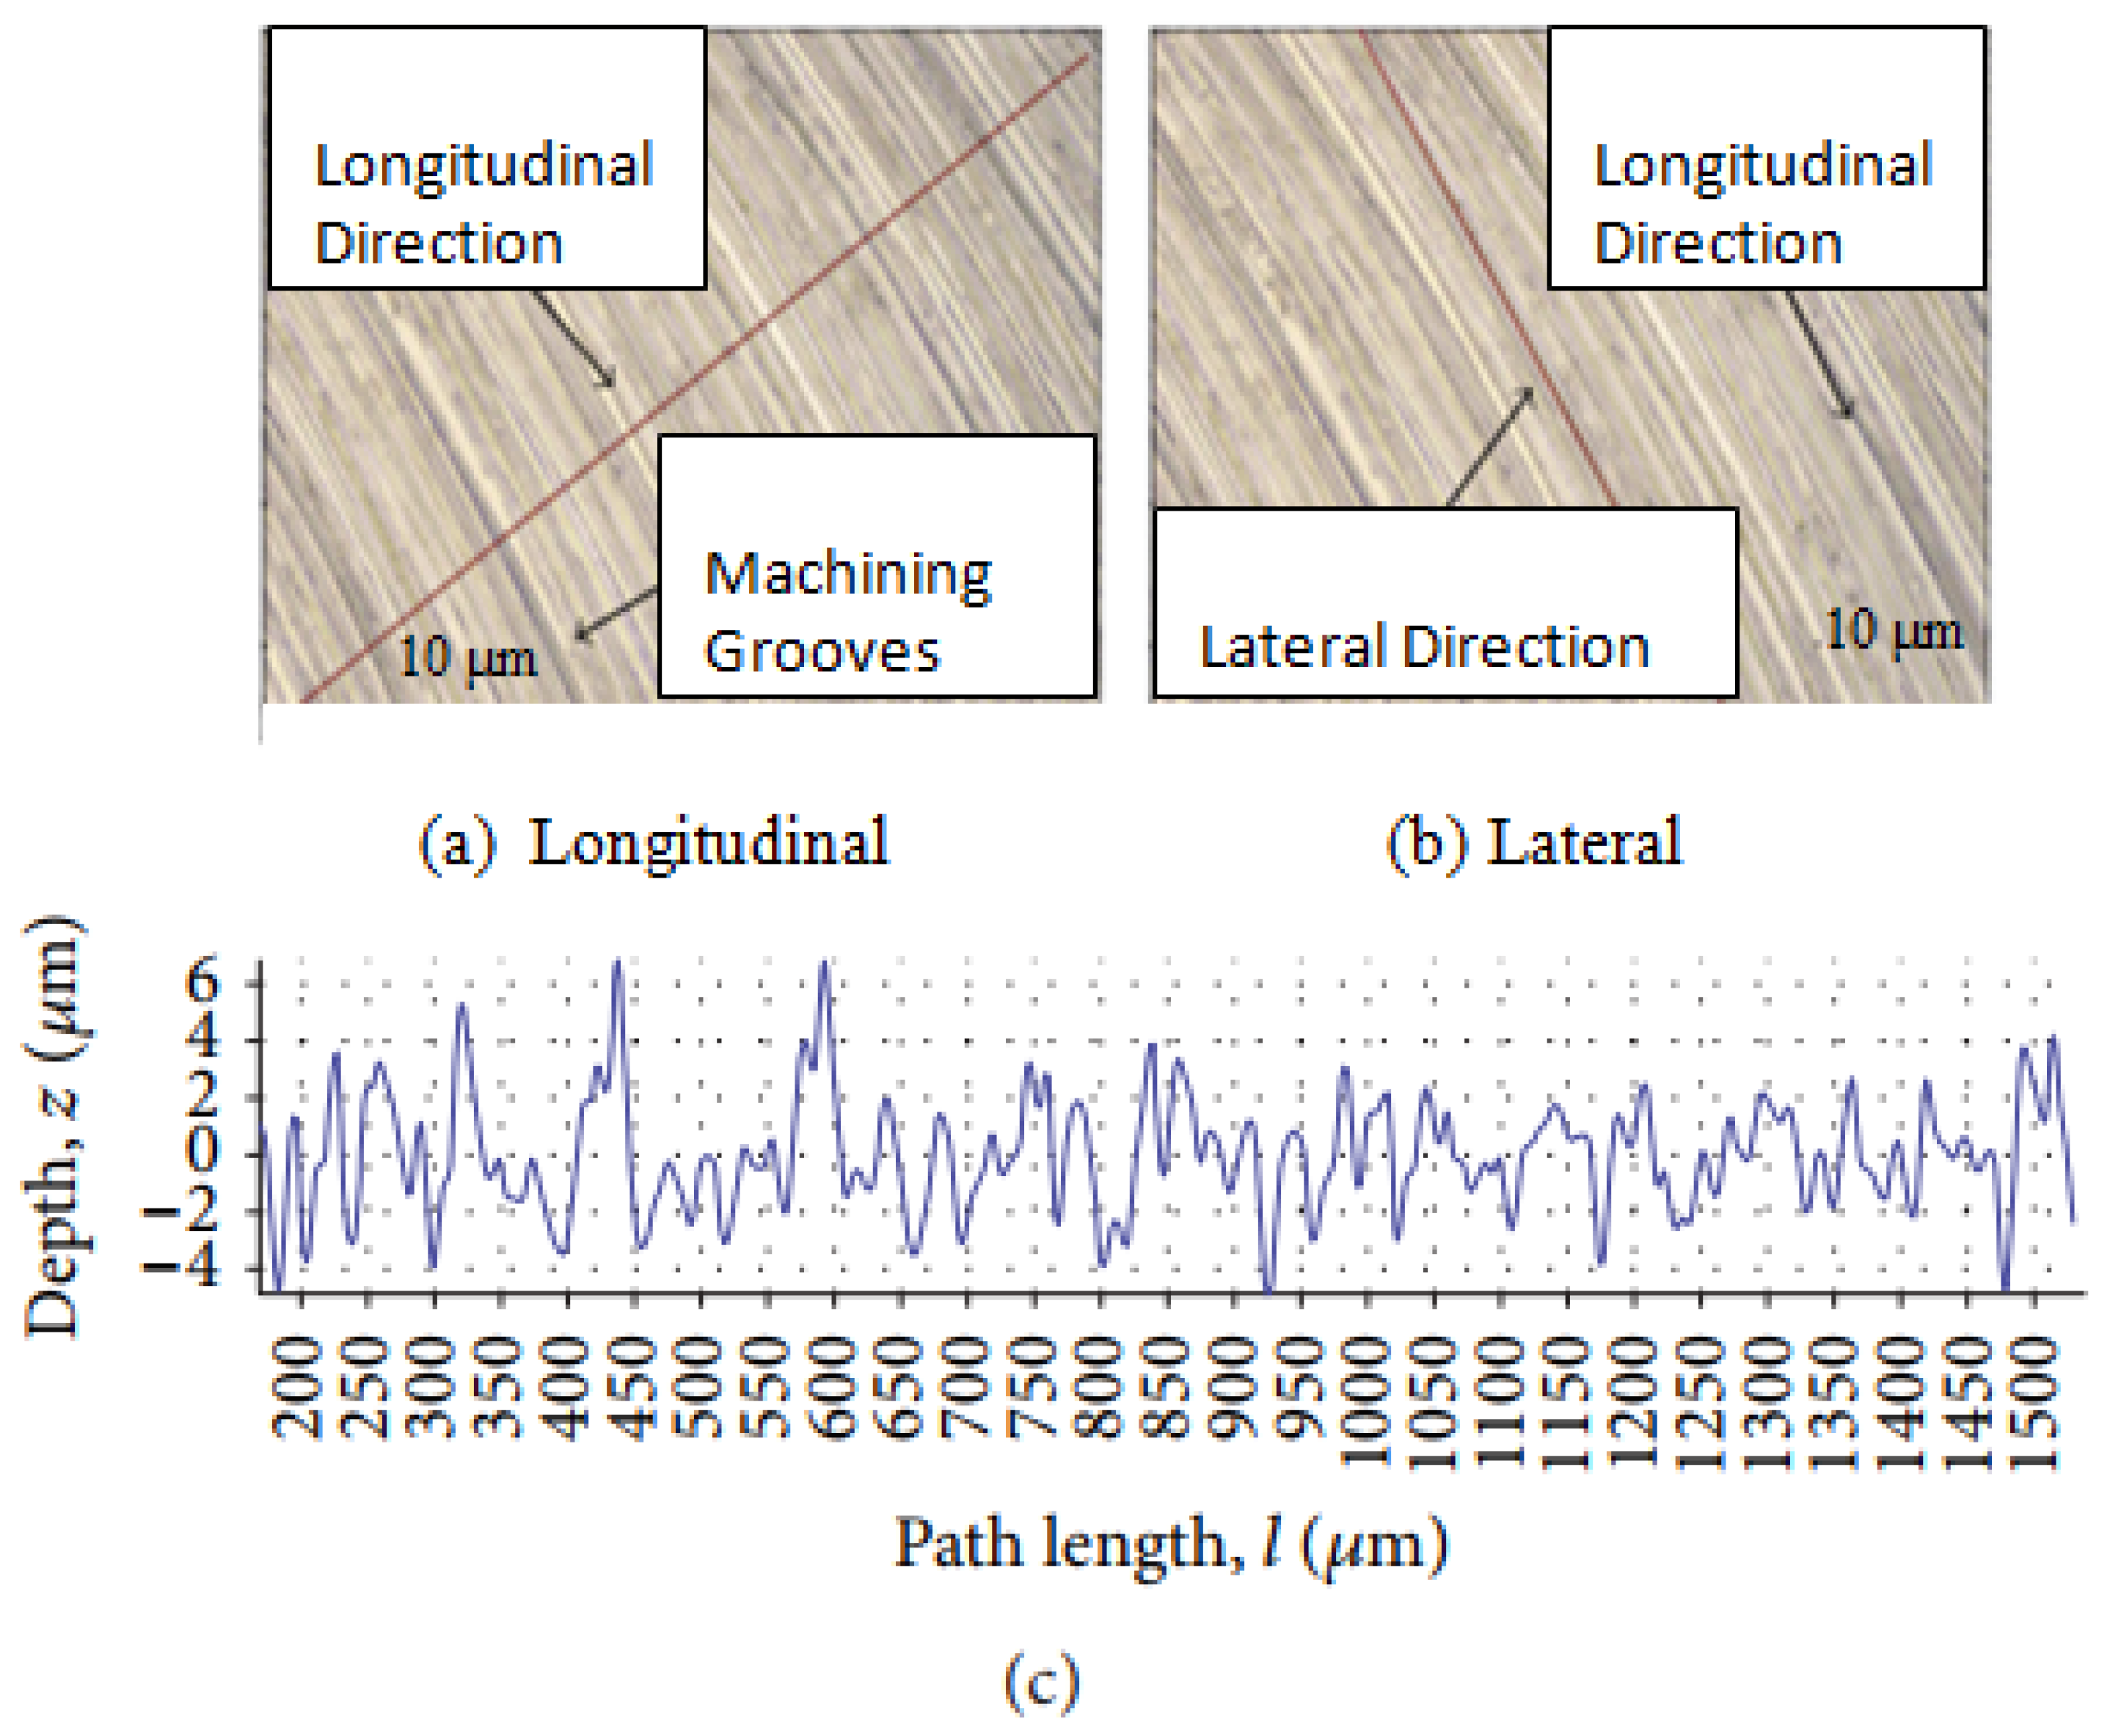
The machined surface was also scanned by using the profilometer and is as given in Figure 7. Roughness measurements are performed on the machined surfaces. The readings are measured in the longitudinal and lateral direction. Figure 7a suggests the line path for finding the roughness values in the perpendicular direction whereas Figure 7b suggests the line path direction parallel to the grooves. Figure 7c shows that the depth of the groove is calculated as a path length function. The line path measures the width and depth of the grooves.
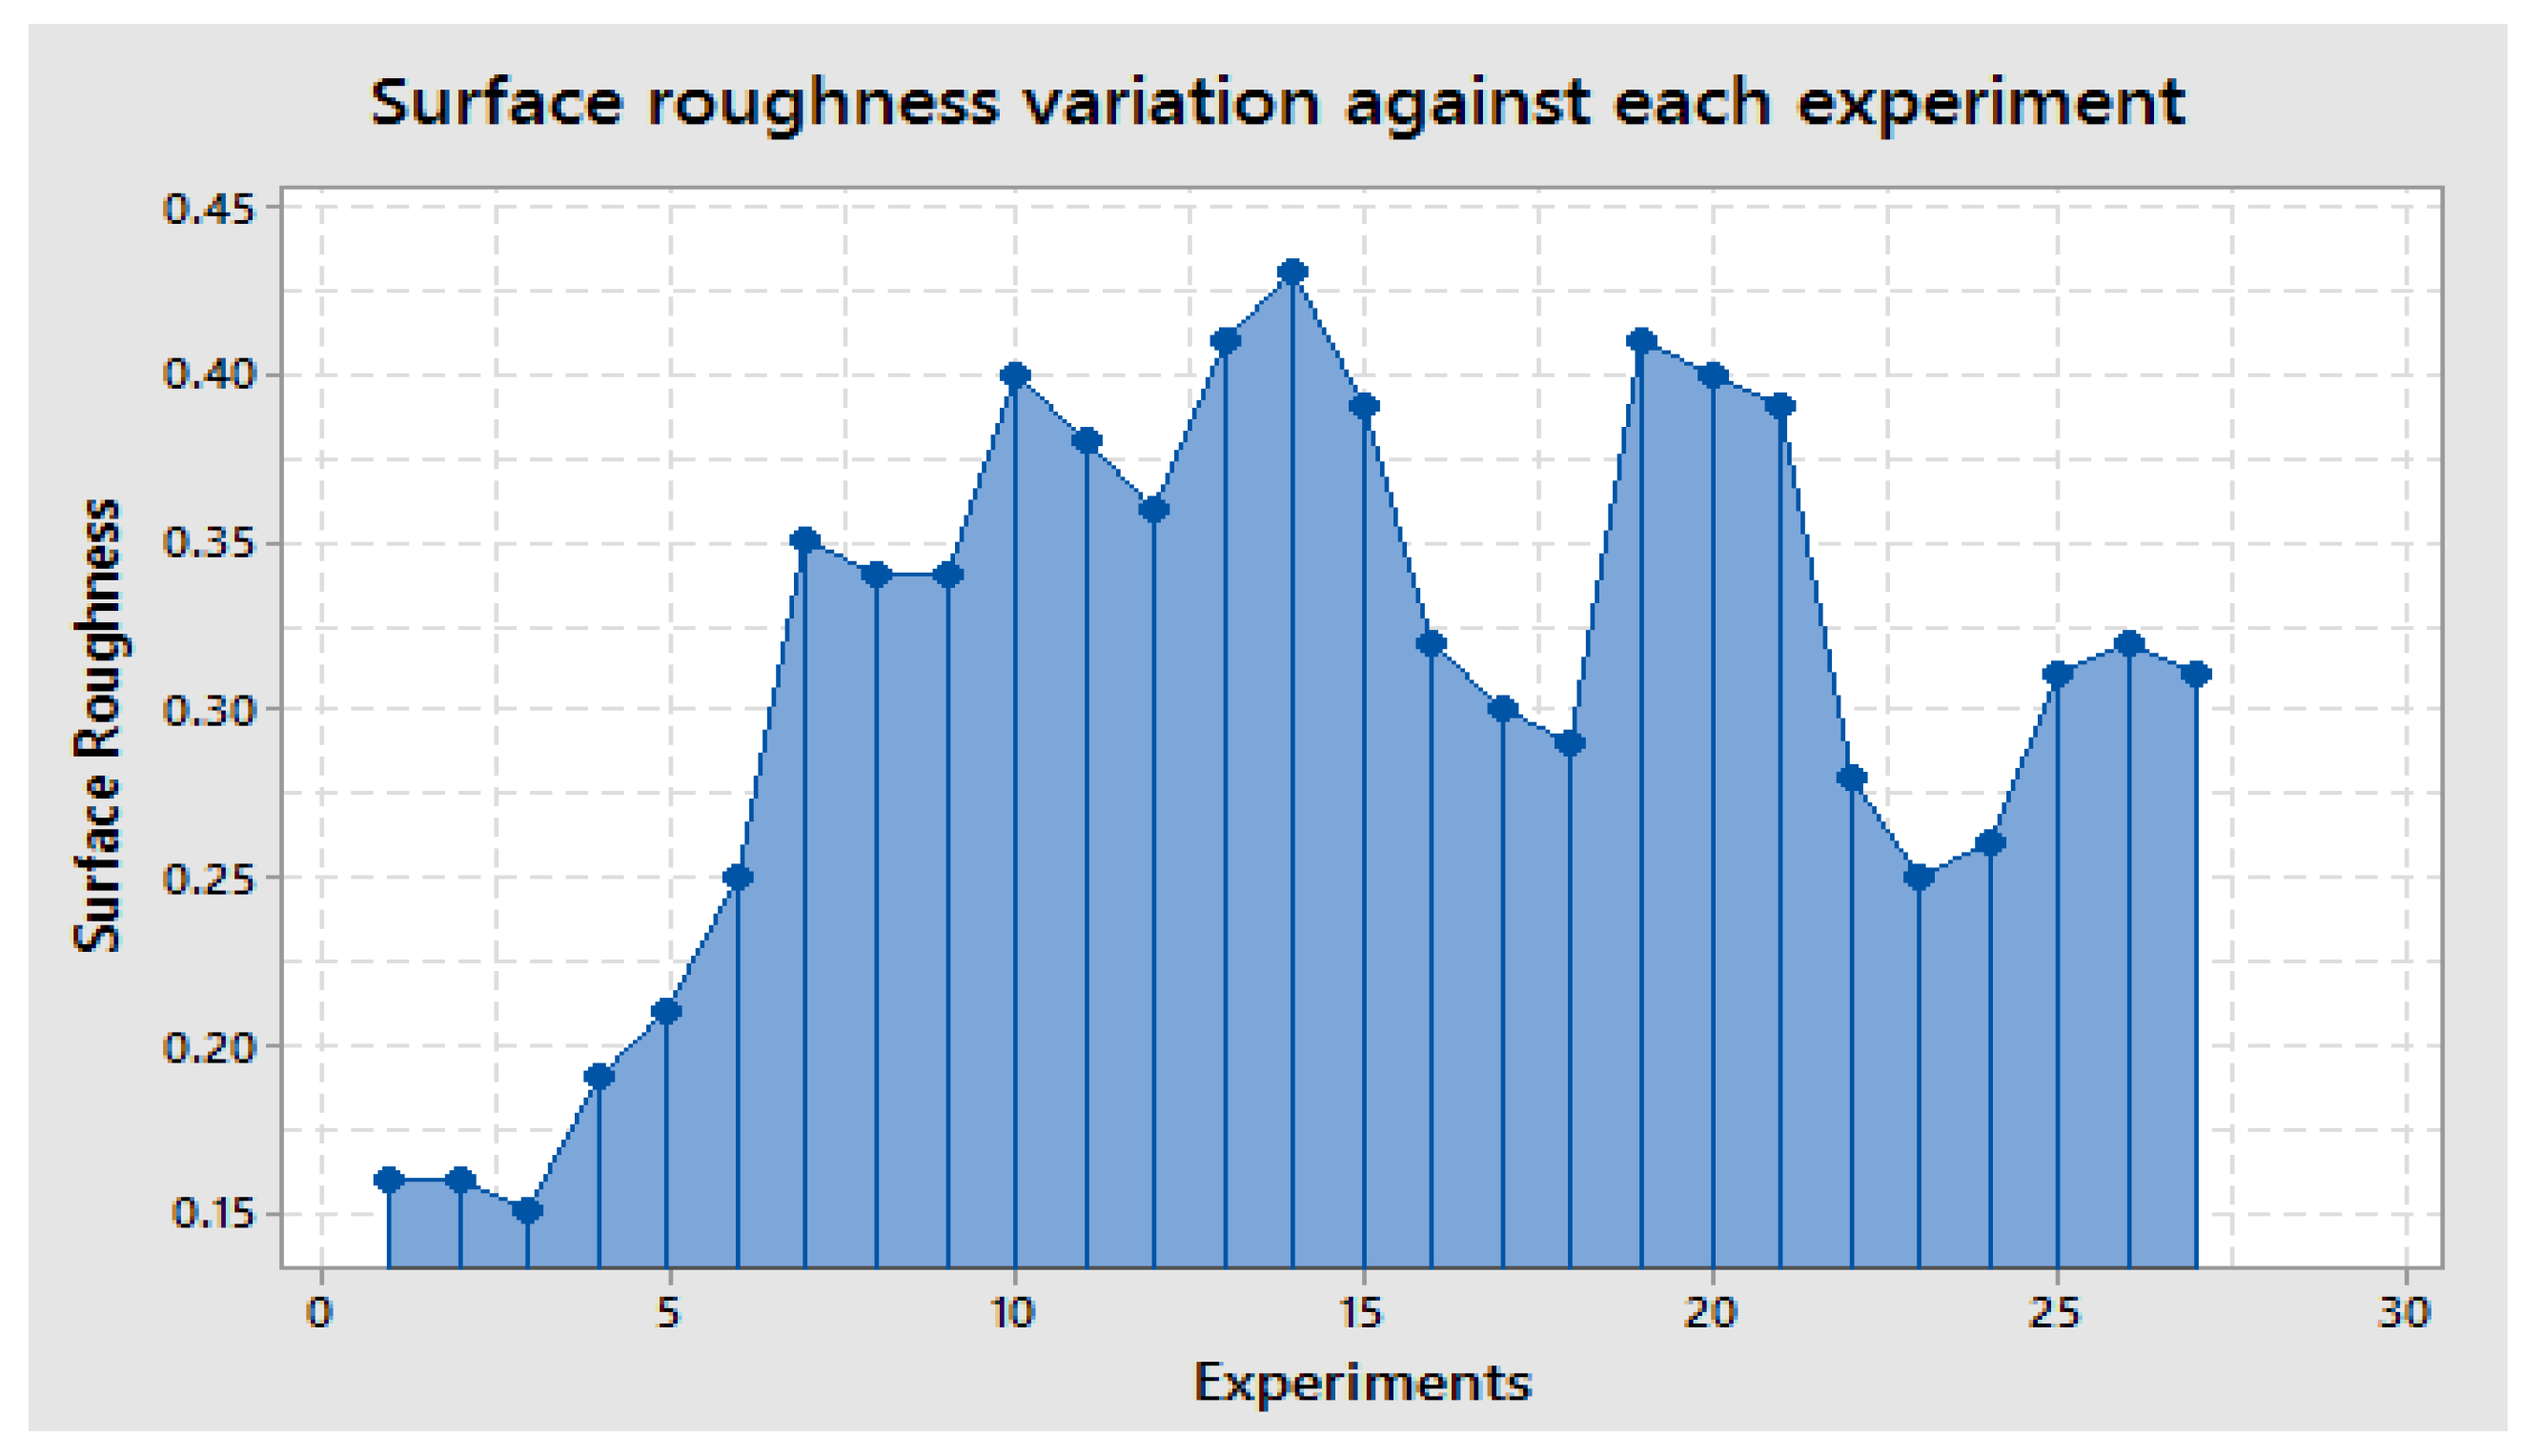
After finding the topography and viewing different sections, a chart is drawn for process parameters against the surface roughness where different combinations of process parameters (experiments) are taken on the x-axis, while surface roughness is taken on the y-axis and is shown in Figure 8.
The highest and the lowest surface roughness calculated from plates by using the Surftest/surface roughness tester are 0.43 μm and 0.15 μm respectively. The respective experiments for the highest and the lowest measured surface roughness are experiments 14 and 3, as shown in Figure 8 and also depicted in Table 3. The highest measured value is the worst case, while the lowest measured value is the best case for mild steel using a CNC 5-axis milling machine.
Hence, it is concluded that a 10 mm/rev feed rate, 800 rpm spindle speed, and 0.05 mm depth of cut (experiment 3) give the lowest and optimized surface roughness, which leads to sustainable manufacturing. ANOVA is also deployed on the chosen parameters to find their significance. It is observed during the analysis of variance from the chosen parameters that the speed of the spindle is the significant and vital factor in changing the surface roughness of the manufactured goods. The p-values for three process parameters are given in Table 4.
The p-value obtained from ANOVA for the spindle speed is 0.003 and it is less than 0.05, which suggests that it is a significant factor. The p-value obtained for the feed rate is 0.766, which shows its insignificance. The depth of cut is not estimated in ANOVA, hence it is removed. Referring to the p-value of the spindle speed which is below 0.05, we can litigate with more than 95% confidence that spindle speed is the significant factor and the response variable changes abruptly by making changes in this factor. Hence, we reject the null hypothesis and p is the probability that justifies the acceptance or rejection of the null hypothesis.The confidence interval taken in this research is 95%. The regression equation shows the relationship between the data if any exists. Future events can also be forcasted from this equation.

Regression Equation

Surface roughness (μm) = −0.0942 + 0.000240 Spindle speed (rpm) + 0.001398 Feed rate (mm/rev) + 0.2964 Depth of cut (mm) − 0.000000 Spindle speed (rpm) * Spindle speed (rpm) − 0.000001 Spindle speed (rpm) * Feed rate (mm/rev) − 0.000142 Spindle speed (rpm) * Depth of cut (mm)
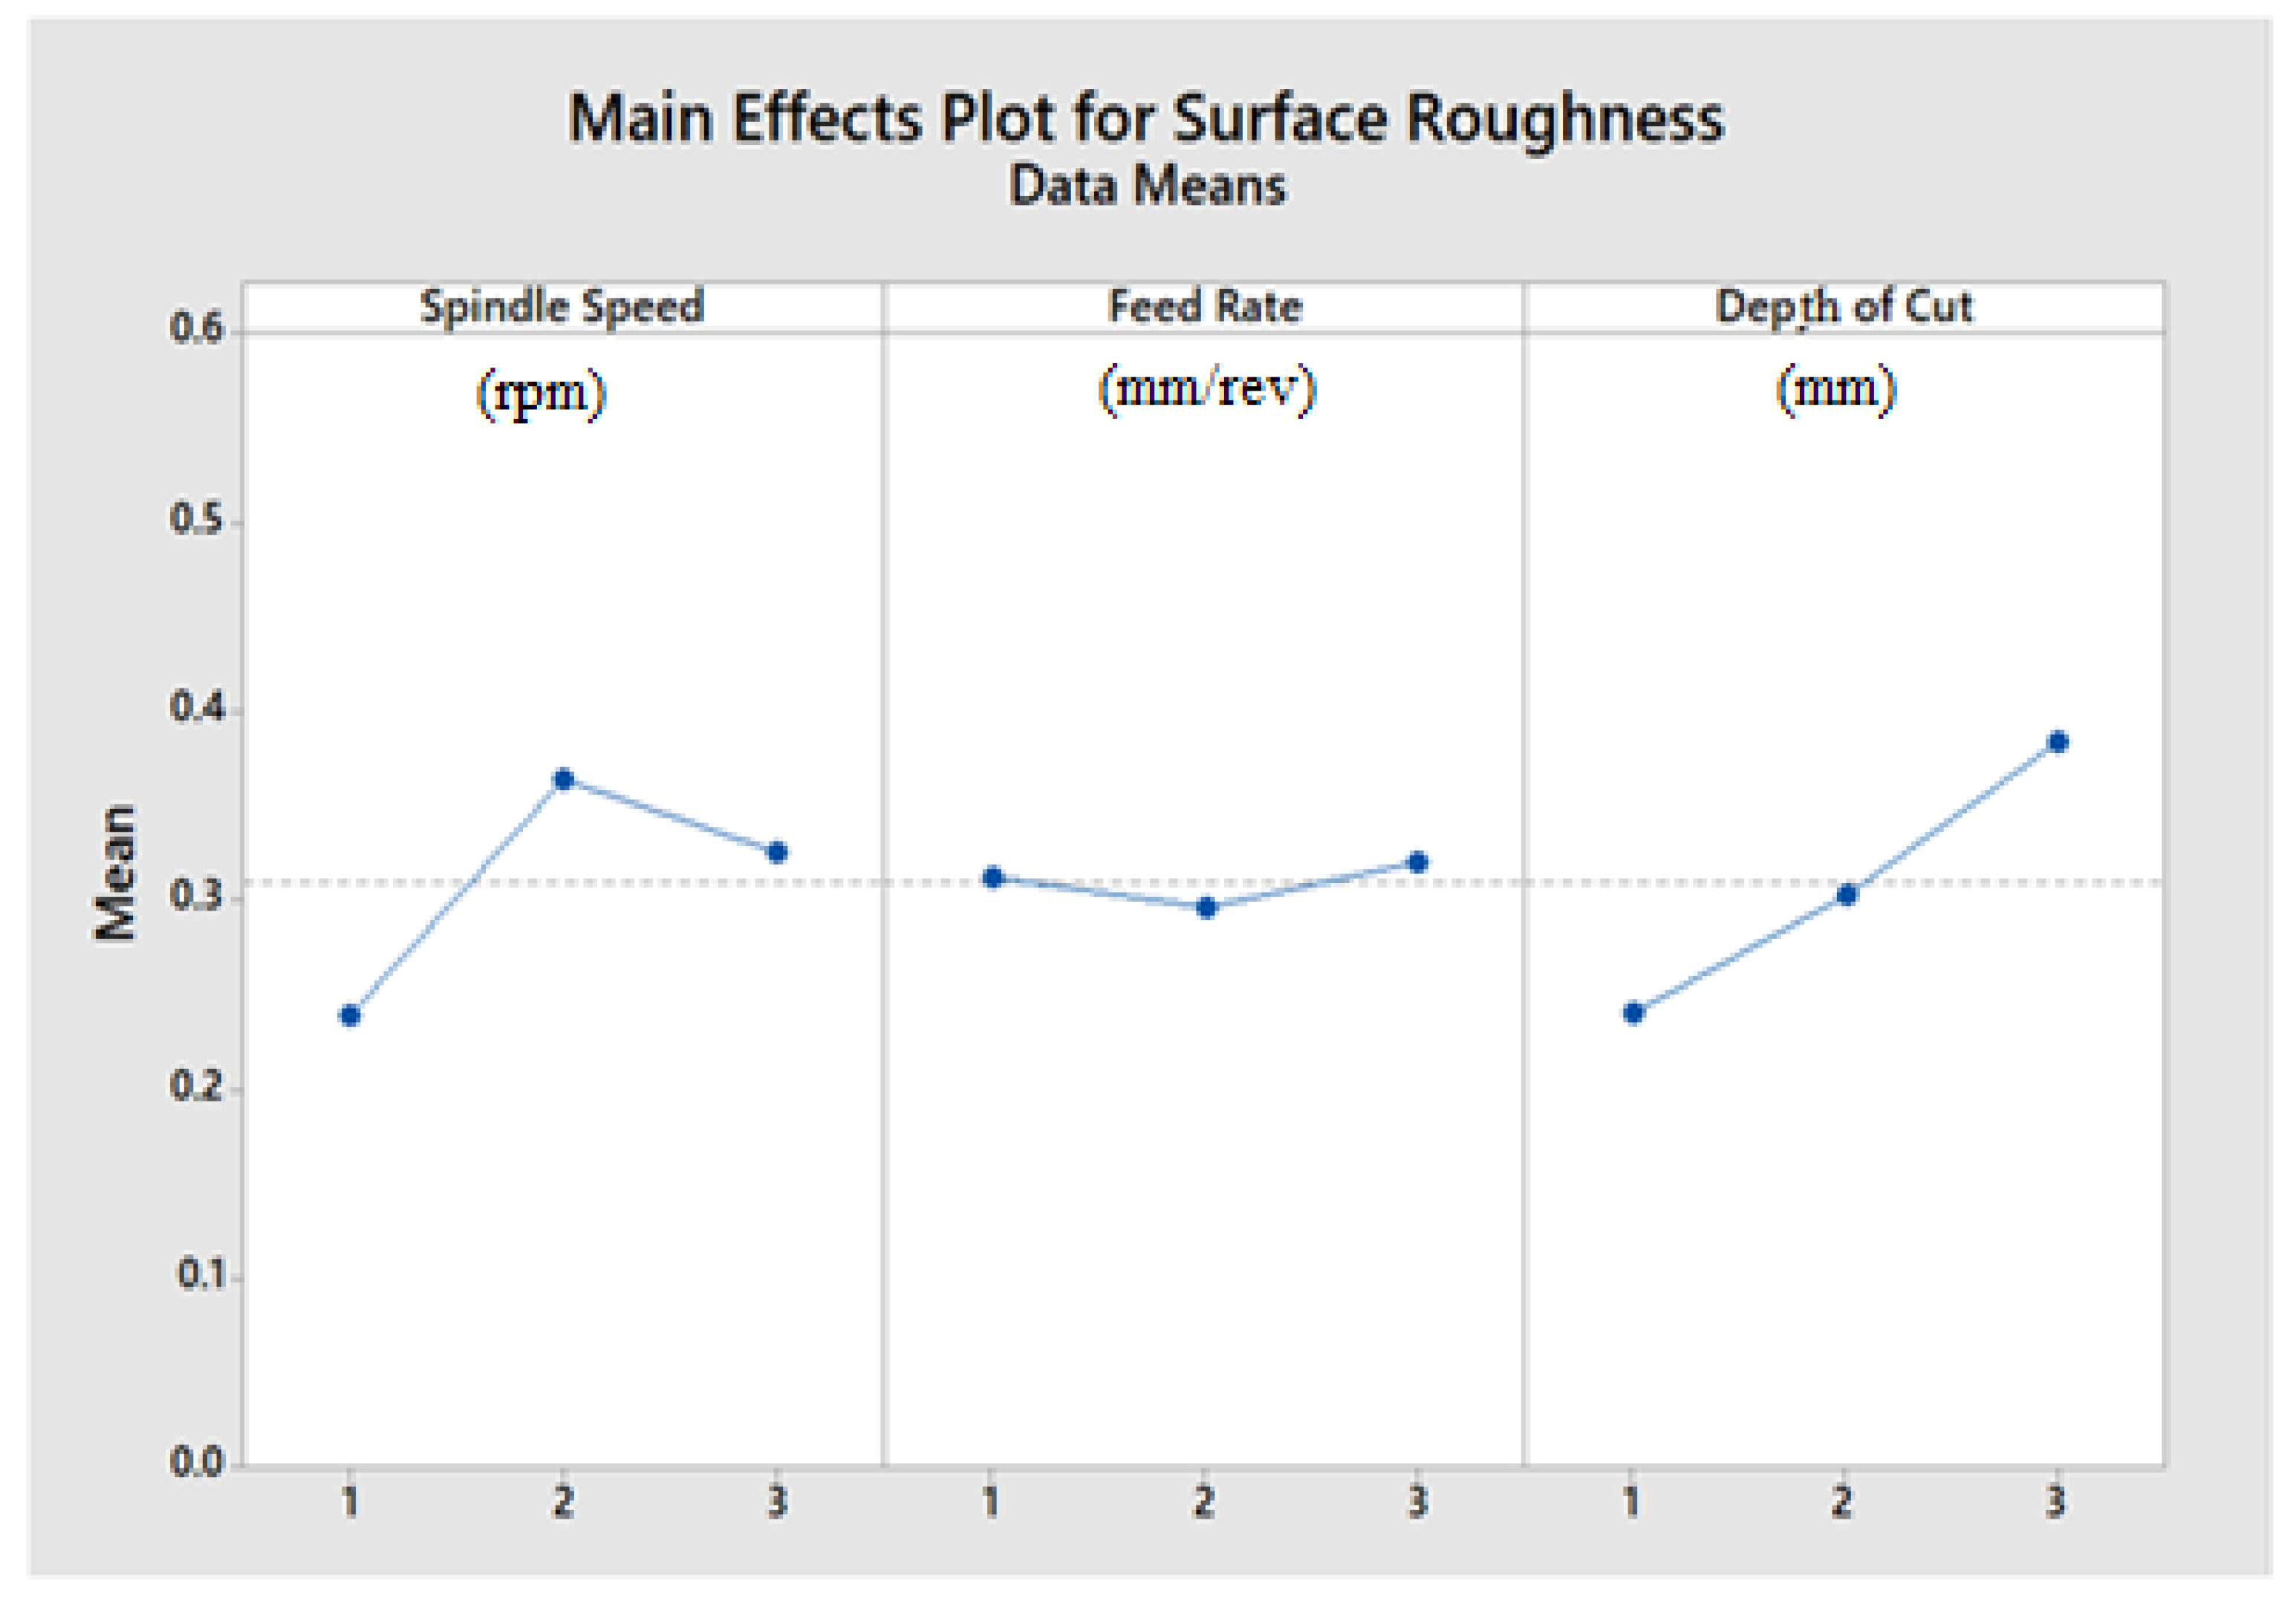
The main effects and interacted plots for surface roughness are graphically given below for output response variables (surface roughness). Figure 9 depicts how the data of three different levels of each parameter, i.e., the speed of spindle, the feed rate, and the depth of cutare varyingand affect the response in the milling process. The following results are deduced from Figure 9. The surface roughness is 0.24 μm at level 1 of the spindle speed, and at level 2, it is almost 0.36 μm, while at level 3, the surface roughness is 0.31 μm. Hence, the lesser surface roughness is at level 1, and the spindle speed turns out to be significant in minimizing the surface roughness, and its significance has also been deduced from the ANOVA. The measured surface roughness is 0.305 μm at level 1 of the feed rate, and at level 2, it is 0.29 μm, while at level 3, the measured surface roughness is 0.31 μm. Hence, the lesser surface roughness is at level 2. Similarly, the measured surface roughness is 0.245 μm at level 1 of the depth of cut, and at level 2, it is 0.29 μm, while 0.37 μm is the measured surface roughness at level 3. Hence, the lesser surface roughness is at level 1.
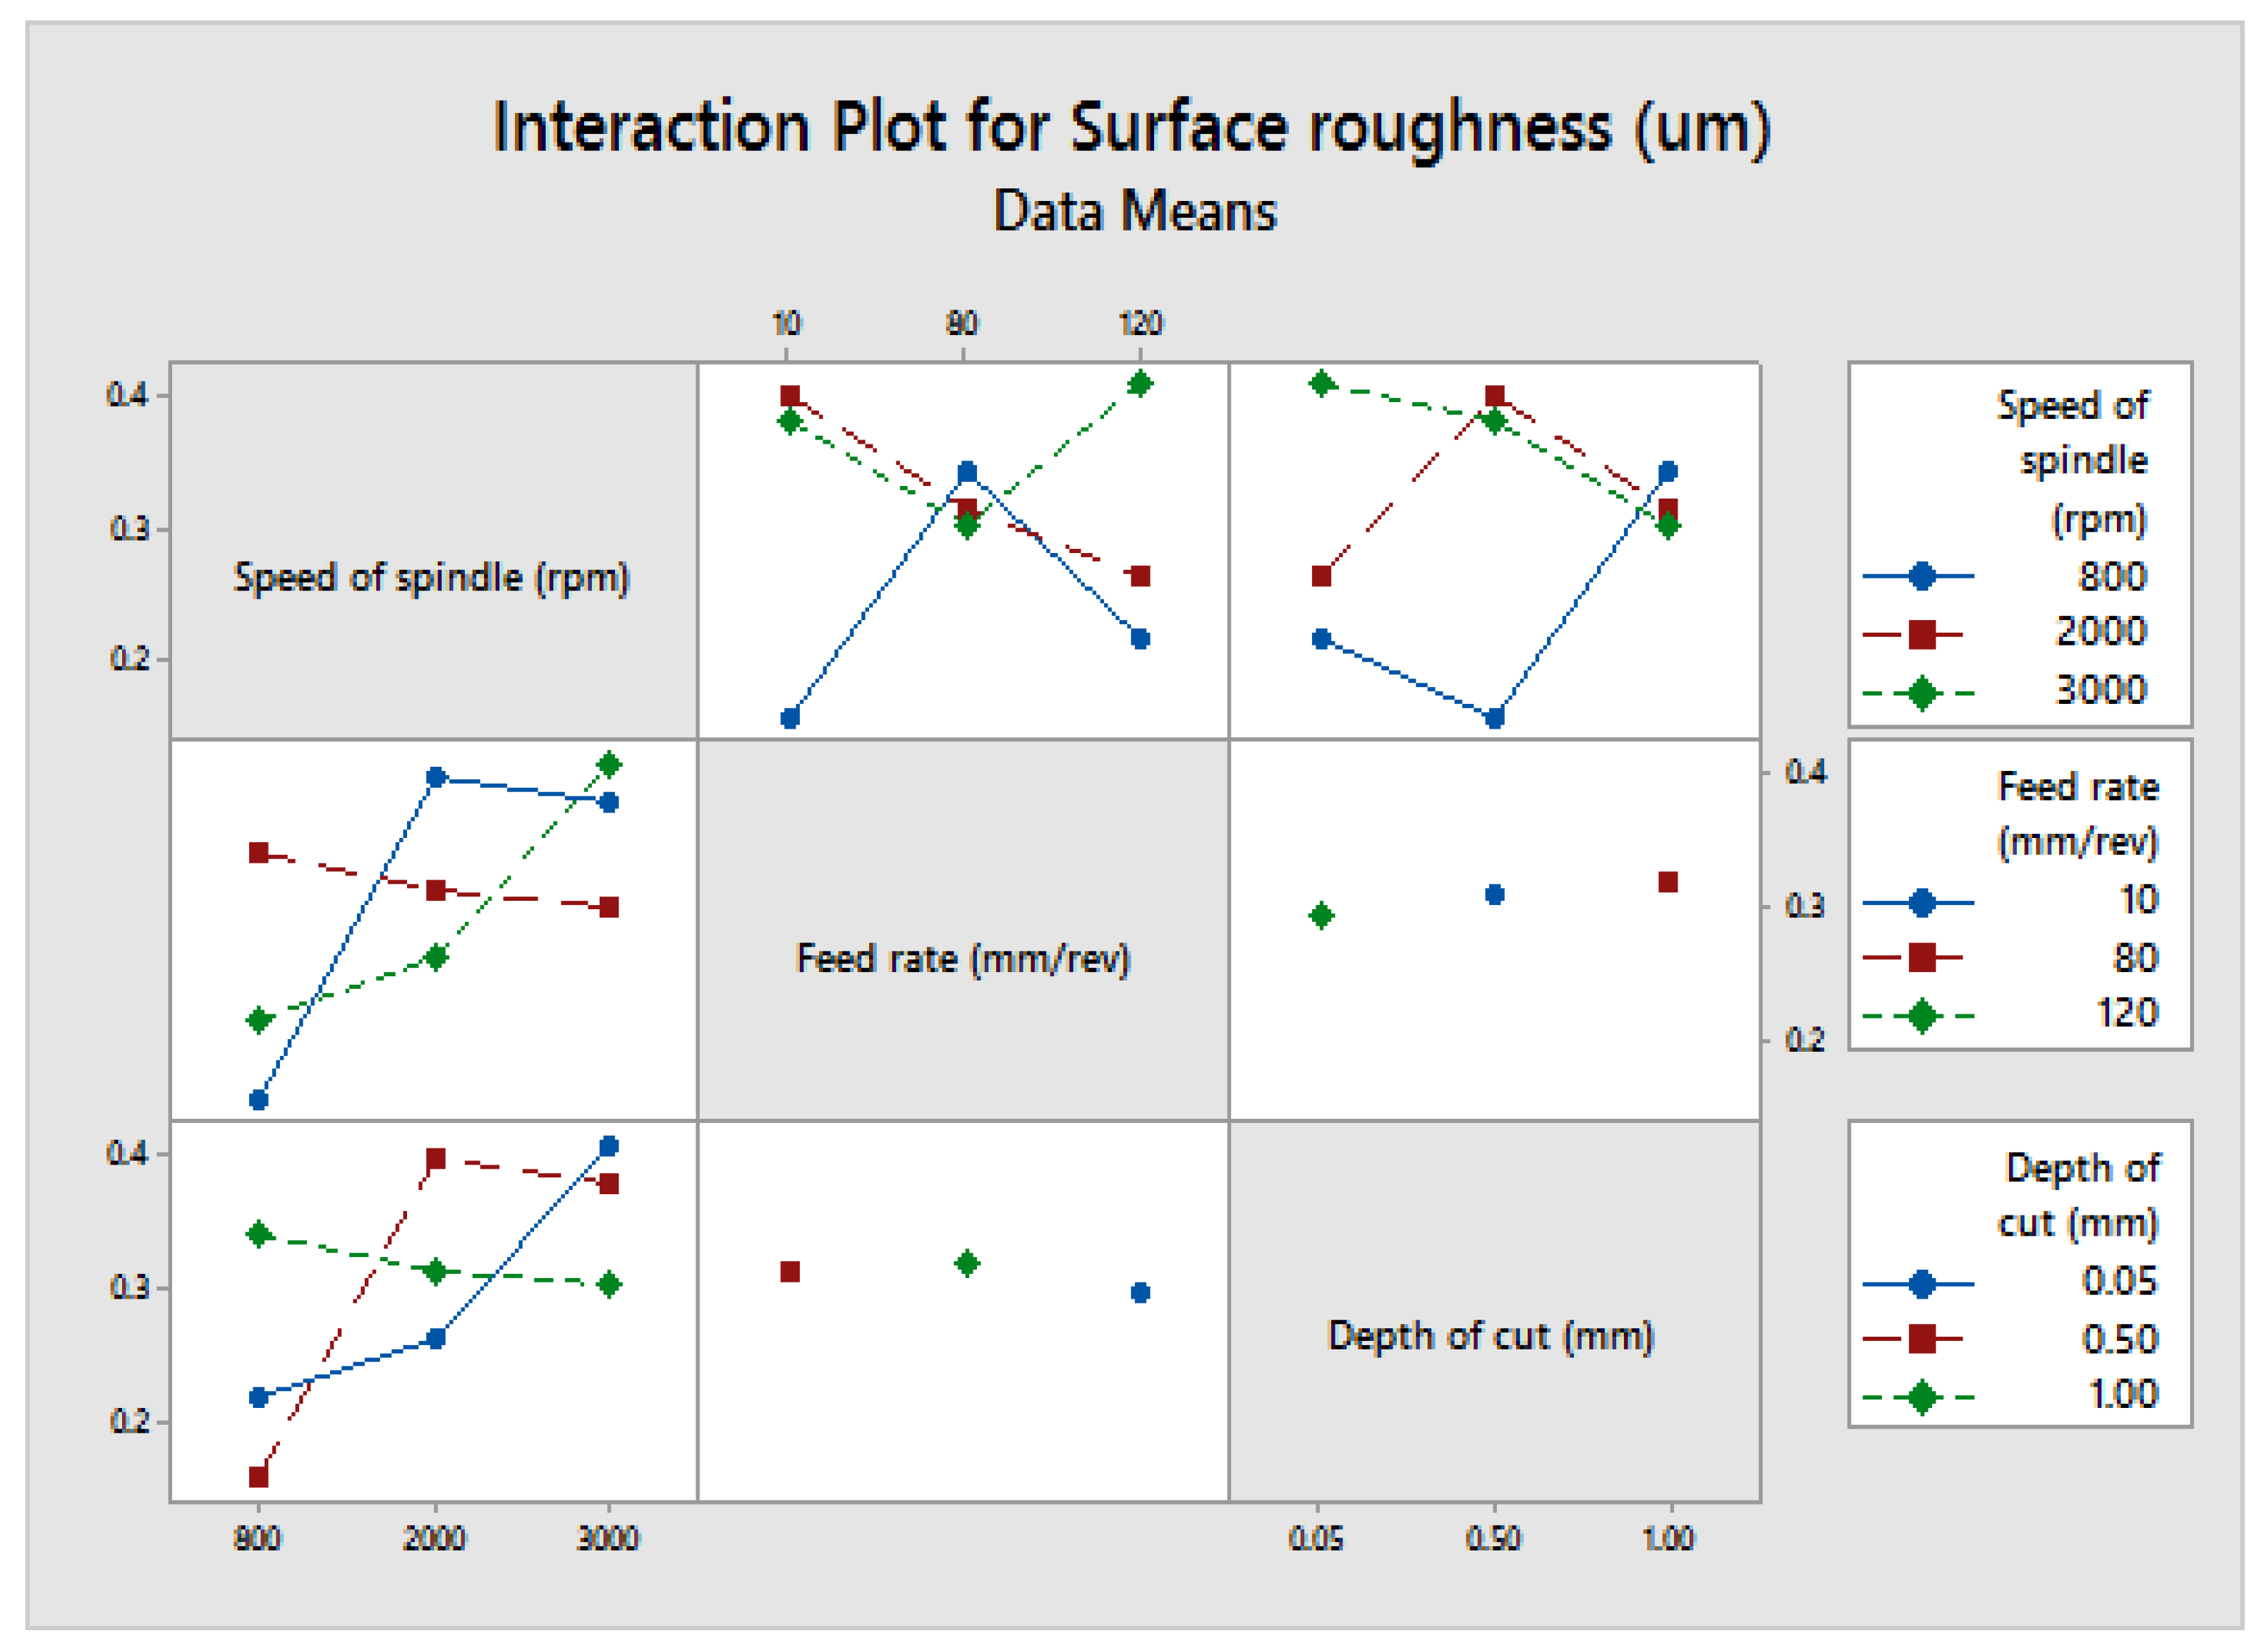
Figure 10 depicts the interaction plot/graph for the surface roughness of mild steel grade 60 and shows thatthe interaction among the different levels of each parameter (the speed of the spindle, the feed rate and the depth of cut) affects the response variable in the milling process. The effect of the interaction of different levels of parameters is different for every different grade of material. It is clearly presented that how the spindle speed, the feed rate and the depth of cut vary and interact at three different levels. The interaction plot shows that if level 1 of the feed rate is taken, i.e., 10 mm/rev, then the surface roughness of the mould against level 1, i.e., 800 rpm of spindle speed, will be minimum. If level 1 of the depth of cut is taken, i.e., 0.05 mm, then the surface roughness of the mould against level 1, i.e., 10 mm/rev of the feed rate, will be minimum and maximum in case of level 3. If level 1 of the spindle speed is taken, i.e., 800 rpm, then the surface roughness of the mould against level 2, i.e., 0.05 mm of the depth of cut, will be minimum and maximum in case of level 1.
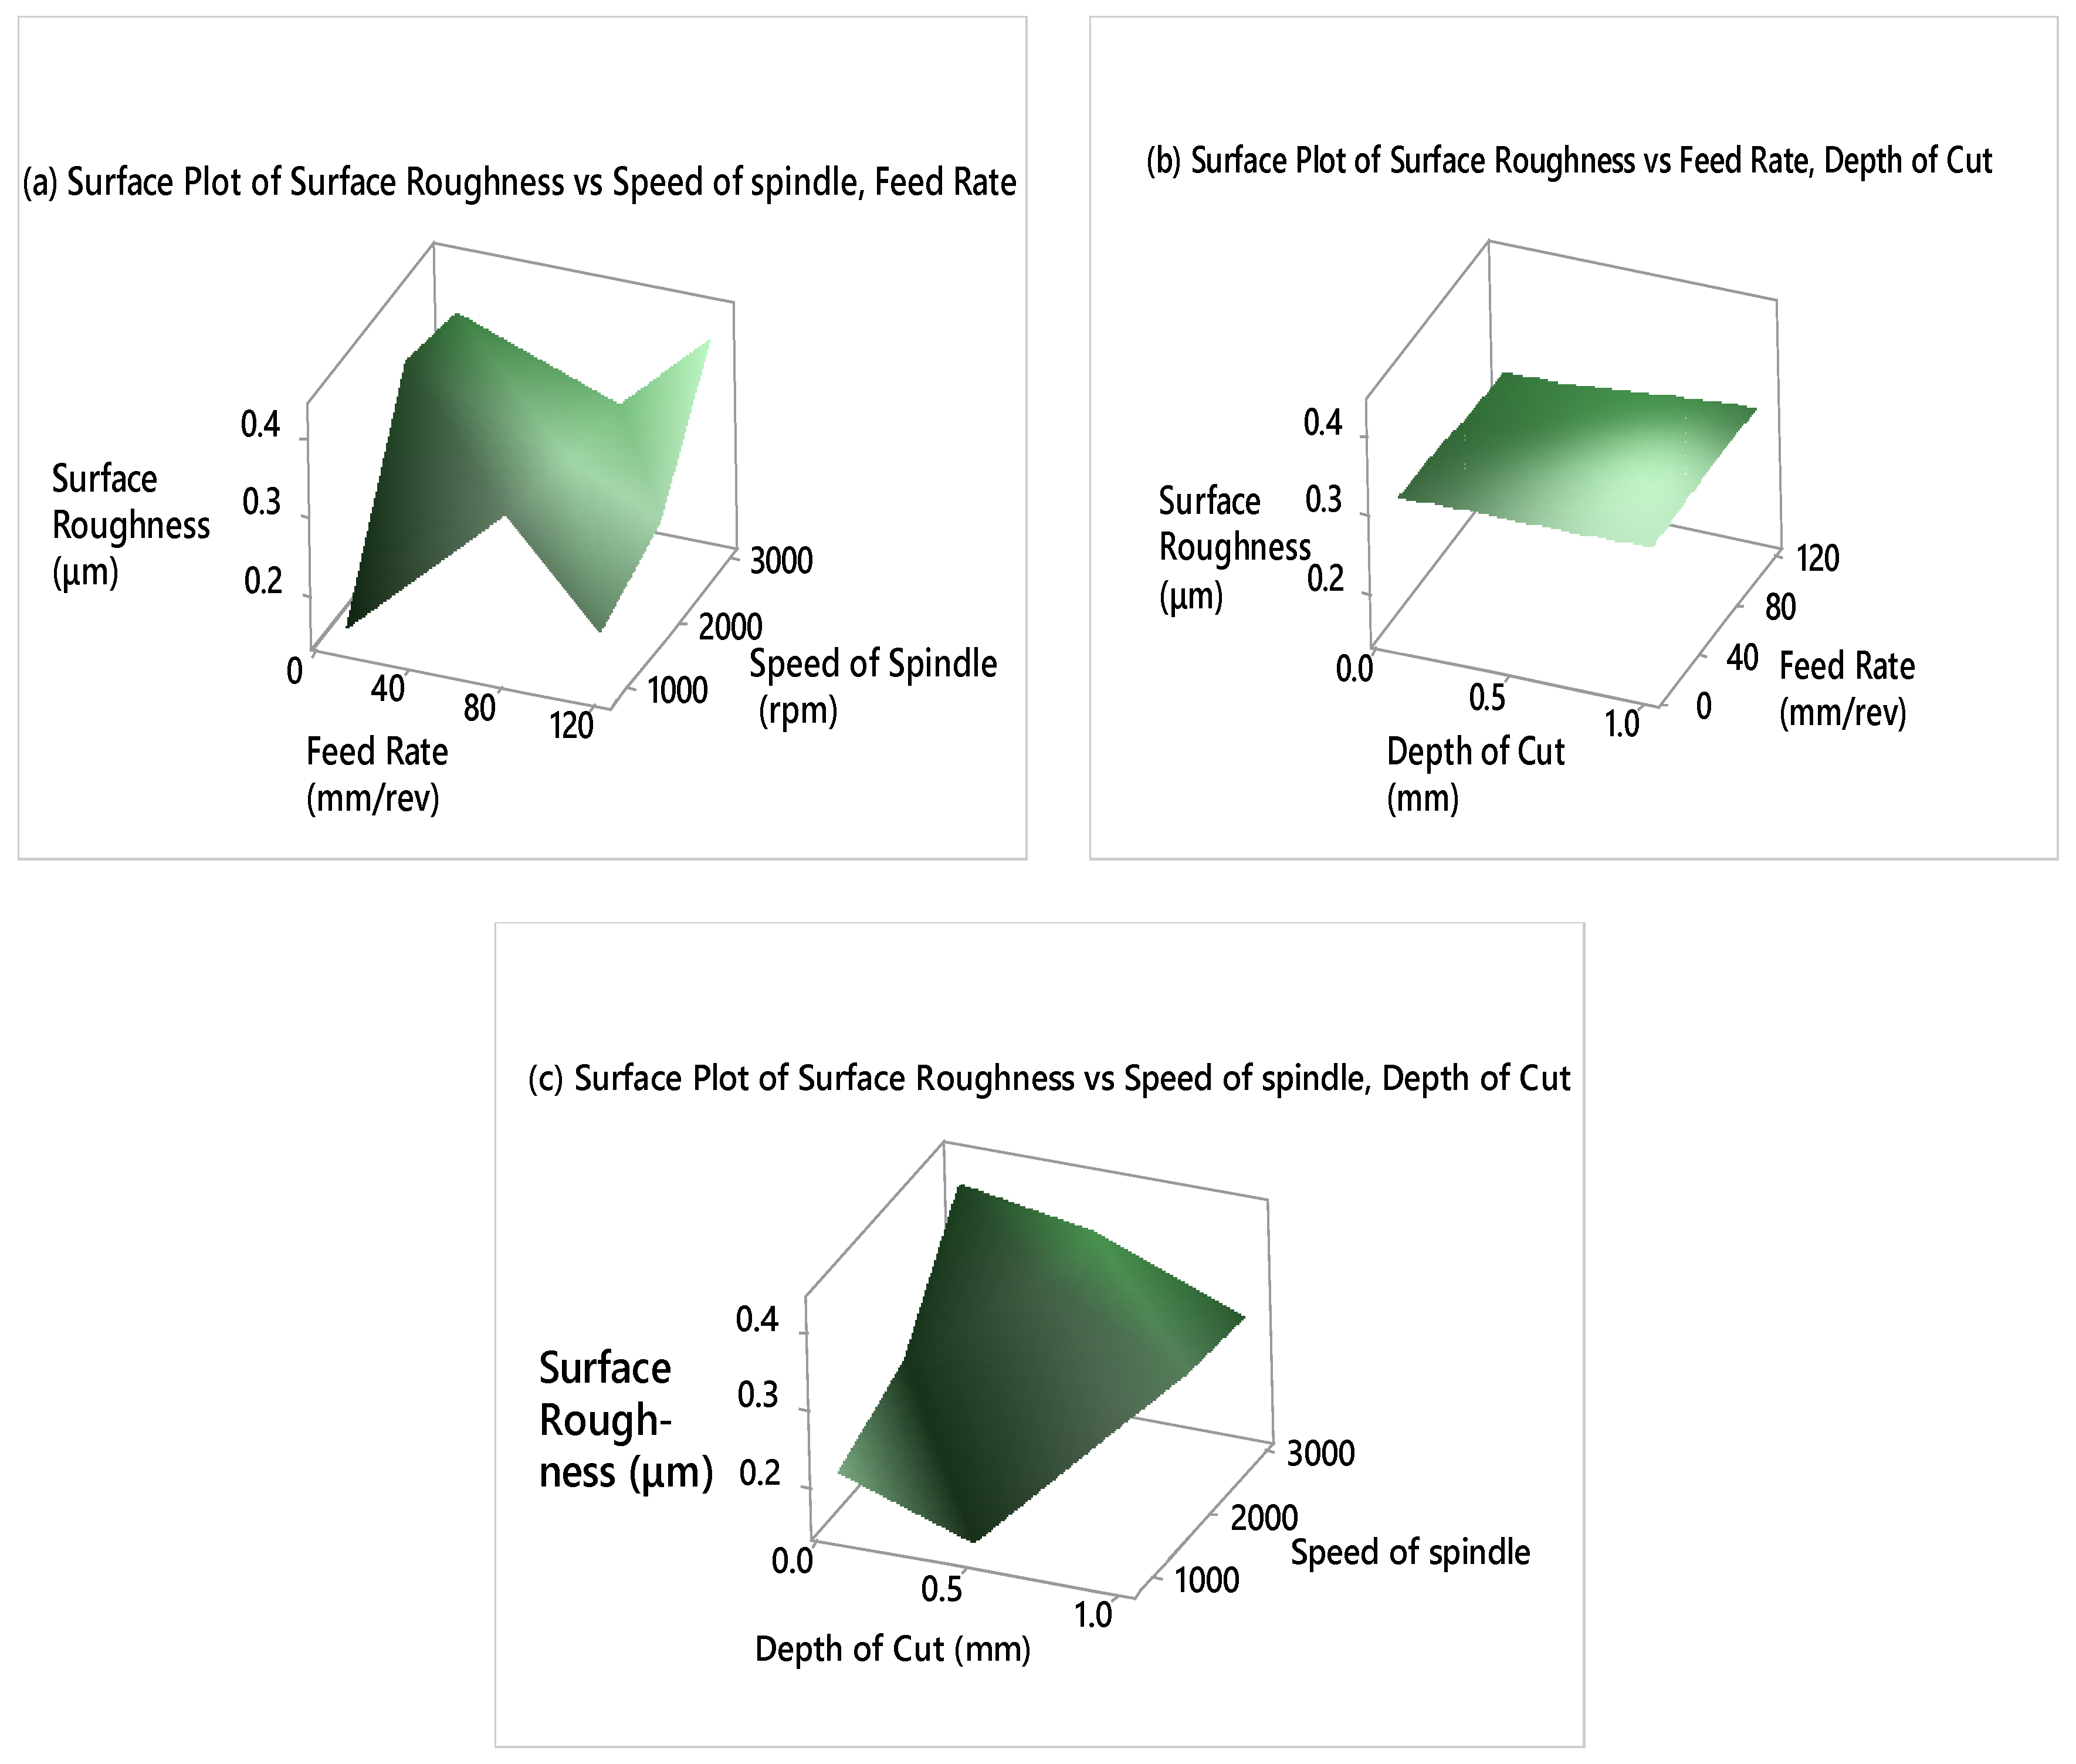
The surface plots of surface roughness are also made against different combinations of process parameters and are shown in Figure 11. It is observed in Figure 11a that if changes are made in a combination of spindle speed and feed rate, the surface roughness changes abruptly. This is because of the significance of the spindle speed, as it has been already observed in ANOVA that the spindle speed affects the surface roughness the most. Figure 11b shows that a combination of feed rate and depth of cut has an almost negligible effect on the surface roughness because of the insignificance of the feed rate and no estimation of the depth of cut. Likewise, Figure 11c suggests that if the feed rate is taken in combination with spindle speed, it will affect the surface roughness but will be better than the first case due to no estimation of depth of cut. Hence, similar to ANOVA, the significance of each parameter has been highlighted, and their combination with each other has been analyzed [35,36,37,38,39,40]. Hence, it is clear from the interaction plot as well that the spindle speed is the main factor affecting the surface roughness, which would ultimately lead to less productivity and increased cost due to extra waste material. Spindle speed was also found to be significant in the machining of stainless steel and end milling of duplex stainless steel [49,50].
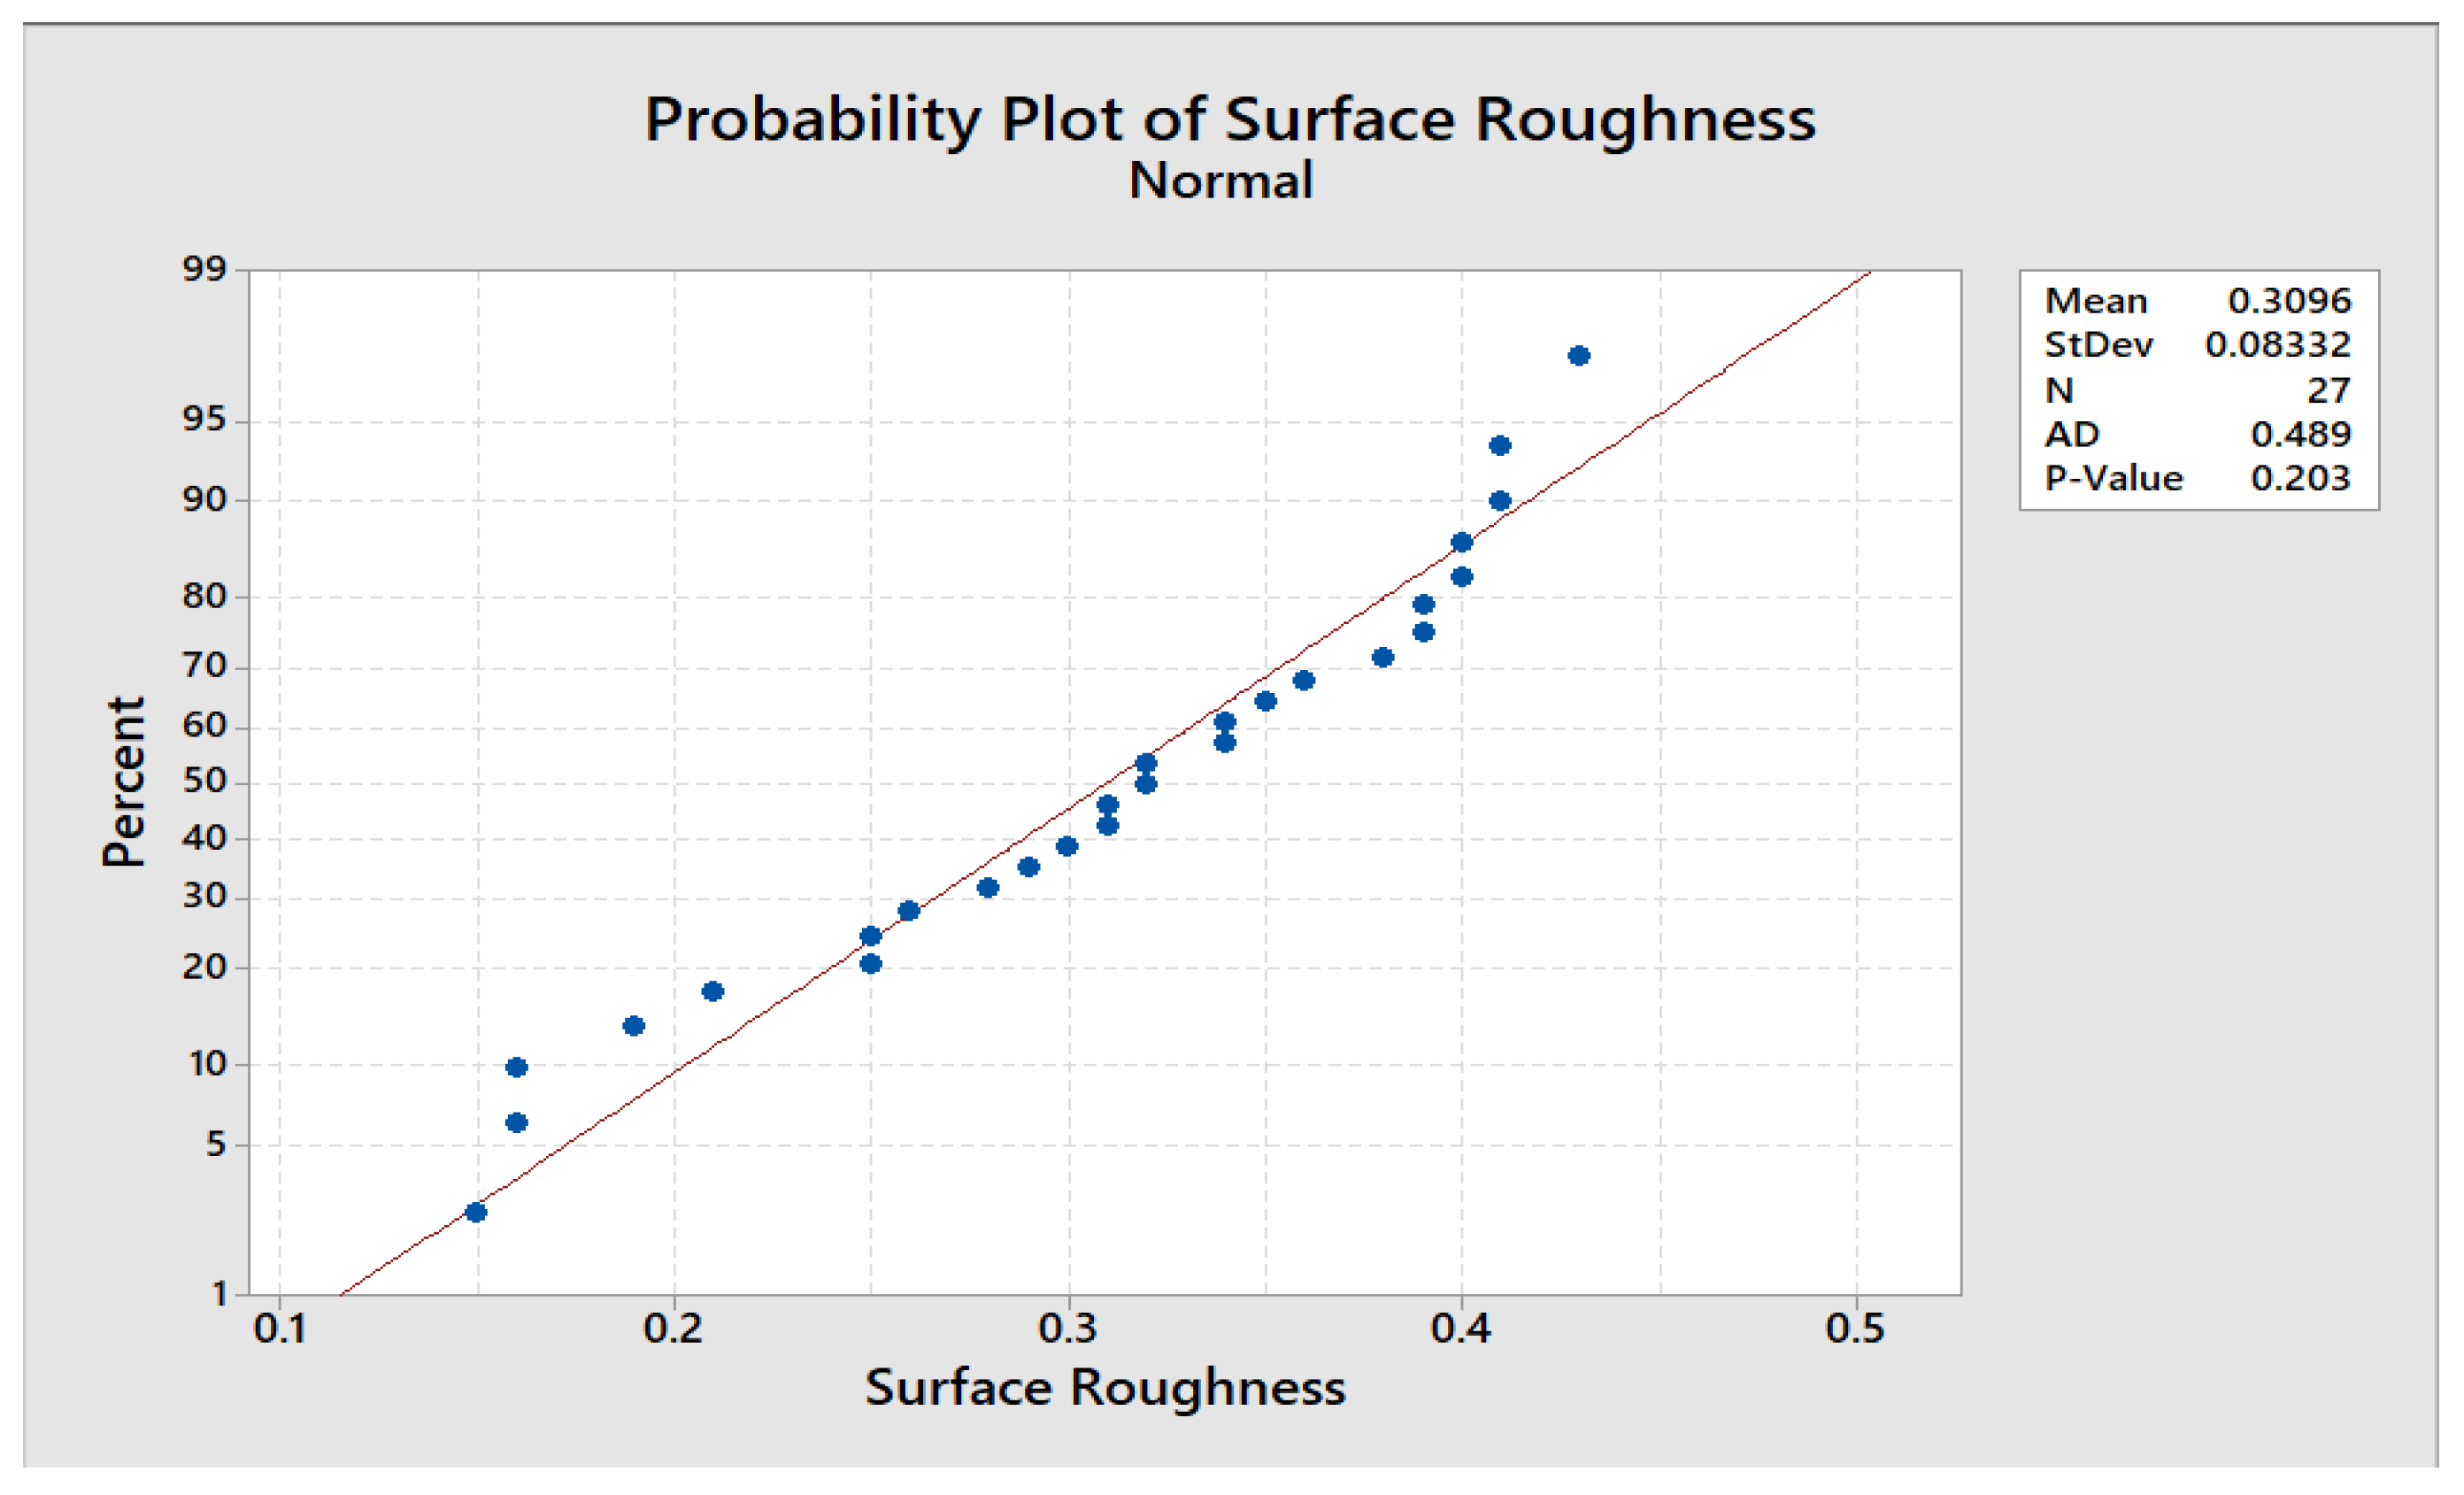
Determining the significance of process variables, finding the main effect plot, interaction plot, and surface plots are vital stages in the whole process. After these stages, it is important to find whether the data follow any distribution or not. A normality test is conducted on the chosen data in MINITAB software to find their normal distribution. For normal distribution, sample data is taken from normally distributed data. ANOVA shows the significance of each parameter, while a normality test shows the significance of the overall data. Figure 12 shows the results of normality test.
After conducting a normality test, it is obvious from Figure 12 that the p-value is 0.203, which is greater than 0.05. Hence, the p-value depicts that the data is following a normal distribution and there are not immense errors in data collection.

4. Conclusion and Future Work

It was observed that the local industry does not have the facility of using scientific tools and optimization methods for their moulds. Local manufacturers and dealers in Peshawar (Pakistan) were facing an issue of surface finish specifically in the moulds of mild steel grade 60, and there was no consideration of applying optimized parameters and sustainable manufacturing in the local market. The mould material surely had an impact on the qualities of the products. Every material works in its own way during machining, and if the mould’s cavity is not well made during machining, it wold surely lead to quality issues during its use in molding machines.
In this research, an essential challenge was the design and fabrication of an injection mould, which is achieved successfully through CREO software and a CNC milling machine respectively. After the design and fabrication of an injection mould, the process parameters (the spindle speed, the depth of cut and the feed rate) were optimized with the help of design of experiments (DOE) for mild steel grade 60, which is the novelty of this research. These parameters have not been optimized for mild steel grade 60 before this research using a CNC five-axis milling machine. The Taguchi optimization method is applied successfully to optimize the process variables for a response. The Taguchi method determines the finest levels of factors, and it is based on planning, performing, and evaluating results of matrix experiments. It is concluded from the results that experiment 3 had the best combination of input process parameters (i.e., 800 rpm speed of spindle, 10 mm/rev the feed rate and 0.5 mm the depth of cut) in order to get the minimum surface roughness in the mould of mild steel grade 60, which would surely lead to sustainable manufacturing.
After the designing and manufacturing process, it was vital to find the significance of each factor. Through the analysis of variance, the significant factor from the chosen factors has been identified through statistical analysis in MINITAB software. A normality test was also conducted on the data in MINITAB software to find its normal distribution. The p-value illustrated that the data was following a normal distribution, and there were no huge errors in the data collection. In short, parameters have been optimized for mild steel grade through the complete product development process. Hence, an issue of surface roughness in mild steel mould originated from a local market has been resolved and a mould of mild steel grade 60 has been made sustainable. The local market can use the same optimized parameters for the manufacturing of sustainable moulds of mild grade 60. The limitation of this specific research is that it focuses only mild steel grade 60, and only three input variables are taken for optimization of the milling process.
Due to the distinctive properties of every material, different researchers have selected different parameters during machining. This specific optimization research has been carried out on mild steel grade 60 using a milling machine (CNC 5-axis) to get an optimized and sustainable product. In the same manner, in the future, research can be carried out for multi-response optimization, as production time might have been affected due to surface roughness optimization. However, the overall process has been improved. Research can also be carried out on the sustainable manufacturing of moulds made from different materials by balancing the required parameters. In addition, a mild steel mould can be made through any other CNC machine for the comparison of its result with the mould made using a CNC 5-axis milling machine. Likewise, new parameters for mild steel grade 60 and other grades of this specific material can also be optimized using different CNC machines. More advanced techniques such as response surface methodology and gray relational analysis can be applied for parameters optimization for mild steel grade 60.

Author Contributions

Conceptualization, S.A., S.N.; methodology, S.A., Q.S.K.; software, S.A.; validation, S.A., A.R.B., I.A.; analysis, A.R.B.; investigation, S.A.; resources, S.A.; data curation, Q.S.K.; writing-original draft preparation S.A.; writing—review andediting, I.A., A.M.K, D.Y.P., C.I.P.; visualization, Q.S.K.; supervision, S.N., A.M.K., D.Y.P.; project administration, S.N.; funding acquisition, S.N.; All authors have read and agreed to the published version of the manuscript.

Funding

University of Engineering & Technology, Peshawar, Pakistan supported this project scientifically and financially.

Conflicts of Interest

The authors declare no conflict of interest.

Nomenclature

CNCComputer Numerical Control
ANOVAAnalysis of Variance
DOEDesign of Experiments
RpmRevolution per Minute
mm/revMillimeter per Revolution
mmMillimeter
RaRoughness Average
3DThree Dimensional

Appendix A

Table A1. Experiments obtained from Taguchi optimization method.
Run OrderVariable/Factor 1Variable/Factor 2Variable/Factor 3
Speed of Spindle (rpm)Feed Rate (mm/rev)Depth of Cut (mm)
1800100.50
2800100.50
3800100.50
48001200.05
58001200.05
68001200.05
7800801.00
8800801.00
9800801.00
103000100.50
113000100.50
123000100.50
1330001200.05
1430001200.05
1530001200.05
163000801.00
173000801.00
183000801.00
192000100.50
202000100.50
212000100.50
2220001200.05
2320001200.05
2420001200.05
252000801.00
262000801.00
272000801.00
Table A2. Experiments and their respective response (surface roughness).
Run OrderVariable 1Variable 2Variable 3Response
Speed of Spindle (rpm)Feed Rate (mm/rev)Depth of Cut (mm)Surface Roughness (um)
1800100.500.16
2800100.500.16
3800100.500.15
48001200.050.19
58001200.050.21
68001200.050.25
7800801.000.35
8800801.000.34
9800801.000.34
103000100.500.40
113000100.500.38
123000100.500.36
1330001200.050.41
1430001200.050.43
1530001200.050.39
163000801.000.32
173000801.000.30
183000801.000.29
192000100.500.41
202000100.500.40
212000100.500.39
2220001200.050.28
2320001200.050.25
2420001200.050.26
252000801.000.31
262000801.000.32
272000801.000.31

References

  1. Wojciechowski, S.; Twardowski, P.; Pelic, M.; Maruda, R.W.; Barrans, S.M.; Krolczyk, G. Precision surface characterization for finish cylindrical milling with dynamic tool displacements model. Precis. Eng. 2016, 46, 158–165. [Google Scholar] [CrossRef]
  2. De Souza, A.M.; Sales, W.F.; Ezugwu, E.; Bonney, J.; Machado, Á.R. Burr formation in face milling of cast iron with different milling cutter systems. Proc. Inst. Mech. Eng. Part B J. Eng. Manuf. 2003, 217, 1589–1596. [Google Scholar] [CrossRef]
  3. Khan, A.M.; Jamil, M.; Salonitis, K.; Sarfraz, S.; Zhao, W.; He, N.; Mia, M.; Zhao, G. Multi-objective optimization of energy consumption and surface quality in nanofluid SQCL assisted face milling. Energies 2019, 12, 710. [Google Scholar] [CrossRef] [Green Version]
  4. Said, Z.; Gupta, M.; Hegab, H.; Arora, N.; Khan, A.M.; Jamil, M.; Bellos, E. A comprehensive review on minimum quantity lubrication (MQL) in machining processes using nano-cutting fluids. Int. J. Adv. Manuf. Technol. 2019, 105, 2057–2086. [Google Scholar] [CrossRef]
  5. Wilczynski, K.; Narowski, P. Simulation studies on the effect of material characteristics and runners layout geometry on the filling imbalance in geometrically balanced injection Molds. Polymers 2019, 11, 639. [Google Scholar] [CrossRef] [PubMed] [Green Version]
  6. Hopmann, C.; Nikoleizig, P. Inverse thermal mold design for injection molds. Int. J. Mater. Form. 2016, 11, 113–124. [Google Scholar] [CrossRef]
  7. Holthusen, A.-K.; Riemer, O.; Schmütz, J.; Meier, A. Mold machining and injection molding of diffractive microstructures. J. Manuf. Process. 2017, 26, 290–294. [Google Scholar] [CrossRef]
  8. Jamsheed, M.; Rahman, A.; Moyeed, M.; Ahmed, G.S. Design and analysis of plastic injection mould for CAM BUSH with submarine gate. Mater. Today Proc. 2015, 2, 2083–2093. [Google Scholar] [CrossRef]
  9. Alaneme, K.K.; Adewuyi, B.; Ofoegbu, F. Failure analysis of mould dies of an industrial punching machine. Eng. Fail. Anal. 2009, 16, 2043–2046. [Google Scholar] [CrossRef]
  10. Barella, S.; Gruttadauria, A.; Mapelli, C.; Mombelli, D. Investigation of failure and damages on a continuous casting copper mould. Eng. Fail. Anal. 2014, 36, 432–438. [Google Scholar] [CrossRef]
  11. Li, X.; Gong, N.-N.; Guan, Y.; Cheng, G. Thermal and stress analysis of rapid electric heating injection mold for a large LCD TV panel. Appl. Therm. Eng. 2011, 31, 3989–3995. [Google Scholar] [CrossRef]
  12. Tang, S.; Kong, Y.; Sapuan, S.; Samin, R.; Sulaiman, S.; Sapuan, S.M. Design and thermal analysis of plastic injection mould. J. Mater. Process. Technol. 2006, 171, 259–267. [Google Scholar] [CrossRef]
  13. Nabila, W.P.N.; Nasir, S.M.; Fathullah, M.; Shuaib, N.A.; Irfan, A.R. Optimization of warpage on plastic part by using response surface methodology (RSM). In Proceedings of the Applied Physics of Condensed Matter (Apcom 2019), StrbskePleso, Slovak Republic, 19–21 June 2019. [Google Scholar] [CrossRef]
  14. Nguyen, T.K.; Hwang, C.J.; Lee, B.-K. Numerical investigation of warpage in insert injection-molded lightweight hybrid products. Int. J. Precis. Eng. Manuf. 2017, 18, 187–195. [Google Scholar] [CrossRef]
  15. Kusić, D.; Hančič, A. Influence of molding conditions on the shrinkage and warpage behavior of standardized test specimens. In Proceedings of the Regional Conference Graz 2015-Polymer Processing Society Pps, Graz, Austria, 21–25 September 2015; AIP Publishing: Graz, Austria, 2016. [Google Scholar]
  16. Tang, S.H.; Tan, Y.; Sapuan, S.M.; Sulaiman, S.; Ismail, N.; Samin, R. The use of Taguchi method in the design of plastic injection mould for reducing warpage. J. Mater. Process. Technol. 2007, 182, 418–426. [Google Scholar] [CrossRef]
  17. Yakovleva, D.; Mukhametzyanova, G.; Kharisov, L. The research of stresses in the molds of injection molding machines. Procedia Eng. 2016, 150, 453–457. [Google Scholar] [CrossRef] [Green Version]
  18. Zabala, B.; Fernandez, X.; Rodriguez, J.; López-Ortega, A.; Fuentes, E.; Bayón, R.; Igartua, A.; Girot, F.; López, A. Mechanism-based wear models for plastic injection moulds. Wear 2019, 440–441, 203105. [Google Scholar] [CrossRef]
  19. Nasiri, S.; Khosravani, M.R. Faults and failures prediction in injection molding process. Int. J. Adv. Manuf. Technol. 2019, 103, 2469–2484. [Google Scholar] [CrossRef]
  20. Parodi, E.; Peters, G.W.M.; Govaert, L.E. Structure-properties relations for polyamide 6, Part 2: Influence of processing conditions during injection moulding on deformation and failure kinetics. Polymers 2018, 10, 779. [Google Scholar] [CrossRef] [Green Version]
  21. Ramachandra, R. Scenario of surface roughness and material removal rate of h 13 mould steel in CNC end milling process. Int. J. Eng. Sci. Math. 2017, 6, 322–327. [Google Scholar]
  22. Nguyen, T.-T.; Pham, Q.-H.; Dang, X.-P.; Doan, T.-K.; Le, X.-H. Optimization parameters of milling process of mould material for decreasing machining power and surface roughness criteria. Teh. Vjesn.-Tech. Gaz. 2019, 26, 1297–1304. [Google Scholar] [CrossRef]
  23. Kalyon, A. Optimization of machining parameters in sinking electrical discharge machine of caldie plastic mold tool steel. Sadhana 2020, 45, 1–13. [Google Scholar] [CrossRef]
  24. Kayir, Y.; Suzgunol, M. Optimization of cutting parameters in drilling AISI P20 die mold steel with taguchi and GRA methods. Gazi Univ. J. Sci. 2018, 31, 898. [Google Scholar]
  25. Mukkoti, V.V.; Sankaraiah, G.; Yohan, M. Effect of process parameters on power consumption in machining of P20 steel in CNC milling. In Proceedings of the 2017 International Conference on Energy, Communication, Data Analytics and Soft Computing (ICECDS), Chennai, India, 1–2 August 2017; Institute of Electrical and Electronics Engineers (IEEE): Chennai, India, 2017; pp. 3217–3220. [Google Scholar]
  26. Grandguillaume, L.; Lavernhe, S.; Quinsat, Y.; Tournier, C. Mold manufacturing optimization: A global approach of milling and polishing processes. Procedia CIRP 2015, 31, 13–18. [Google Scholar] [CrossRef]
  27. Moayyedian, M.; Abhary, K.; Marian, R. New design feature of mold in injection molding for scrap reduction. Procedia Manuf. 2015, 2, 241–245. [Google Scholar] [CrossRef] [Green Version]
  28. Lakkanna, M.; Kumar, G.C.M.; Kadoli, R. Computational design of mould sprue for injection moulding thermoplastics. J. Comput. Des. Eng. 2016, 3, 37–52. [Google Scholar] [CrossRef] [Green Version]
  29. Neamţu, C.; Bodi, S.; GHINEA, R.A.; Attila, P. Failure mode and effect analysis for mold design. Acta Tech.-Ser. Appl. Math. Mech. Eng. 2015, 58, 533–536. [Google Scholar]
  30. Sivaiah, P.; Chakradhar, D. Modeling and optimization of sustainable manufacturing process in machining of 17-4 PH stainless steel. Measurement 2019, 134, 142–152. [Google Scholar] [CrossRef]
  31. Xiong, Y.; Wu, J.; Deng, C.; Wang, Y. Machining process parameters optimization for heavy-duty CNC machine tools in sustainable manufacturing. Int. J. Adv. Manuf. Technol. 2013, 87, 1237–1246. [Google Scholar] [CrossRef]
  32. Varghese, V.; Ramesh, M.; Chakradhar, D. Experimental investigation and optimization of machining parameters for sustainable machining. Mater. Manuf. Process. 2018, 33, 1782–1792. [Google Scholar] [CrossRef]
  33. Khare, S.K.; Agarwal, S. Optimization of machining parameters in turning of AISI 4340 steel under cryogenic condition using taguchi technique. Procedia CIRP 2017, 63, 610–614. [Google Scholar] [CrossRef]
  34. Abbas, A.T.; Pimenov, D.Y.; Erdakov, I.N.; Mikołajczyk, T.; Soliman, M.S.; El-Rayes, M.M. Optimization of cutting conditions using artificial neural networks and the Edgeworth-Pareto method for CNC face-milling operations on high-strength grade-H steel. Int. J. Adv. Manuf. Technol. 2019, 105, 2151–2165. [Google Scholar] [CrossRef] [Green Version]
  35. Pimenov, D.Y.; Abbas, A.T.; Gupta, M.K.; Erdakov, I.N.; Soliman, M.S.; El-Rayes, M.M. Investigations of surface quality and energy consumption associated with costs and material removal rate during face milling of AISI 1045 steel. Int. J. Adv. Manuf. Technol. 2020, 107, 3511–3525. [Google Scholar] [CrossRef]
  36. Pimenov, D.Y. Experimental research of face mill wear effect to flat surface roughness. J. Frict. Wear 2014, 35, 250–254. [Google Scholar] [CrossRef]
  37. Azim, S.; Akhtar, R.; Khalid, Q.S.; Noor, S. Setting of process parameters and effect of mould quality on surface roughness of pharmaceutical cup of polypropylene. J. Eng. Appl. Sci. 2019, 38, 87–97. [Google Scholar]
  38. Wojciechowski, S.; Wiackiewicz, M.; Krolczyk, G. Study on metrological relations between instant tool displacements and surface roughness during precise ball end milling. Measurement 2018, 129, 686–694. [Google Scholar] [CrossRef]
  39. Khan, A.M.; Jamil, M.; Haq, A.U.; Hussain, S.; Longhui, M.; He, N. Sustainable machining. Modeling and optimization of temperature and surface roughness in the milling of AISI D2 steel. Ind. Lubr. Tribol. 2019, 71, 267–277. [Google Scholar] [CrossRef]
  40. Butt, T.Z.; Tabish, T.A.; Ali, S.; Mehmood, Y. A comparative study of mechanical properties and microstructures of deformed bars (grade-60) locally manufactured in pakistan. J. Fac. Eng. Technol. 2014, 21, 153–157. [Google Scholar]
  41. Dadhich, K.; Tiwari, A.N. Design & analysis of plastic hanger component using mold flow software. In Proceedings of the International Conference on Advancements in Computing & Management (ICACM), Jaipur, India, 13–14 April 2019. [Google Scholar] [CrossRef]
  42. Monka, P.; Hloch, S.; Andrej, A.; Somsak, M.; Murgas, F. Simulation tools used at the injection mould design. Manuf. Technol. 2016, 16, 561–569. [Google Scholar] [CrossRef]
  43. Zhou, H. Computer Modeling for Injection Molding: Simulation, Optimization, and Control; Wiley: Hoboken, NJ, USA, 2013. [Google Scholar] [CrossRef]
  44. Al-Ashaab, A.H.; Young, R.I.M. Manufacturing Model: Supporting Concurrency in Injection Moulded Products Design; American Society of Mechanical Engineers, Petroleum Division (Publication) PD: London, UK, 1994; Volume 64, pp. 33–43. [Google Scholar]
  45. Dalavi, A.; Pawar, P.J.; Singh, T.P. Tool path planning of hole-making operations in ejector plate of injection mould using modified shuffled frog leaping algorithm. J. Comput. Des. Eng. 2016, 3, 266–273. [Google Scholar] [CrossRef] [Green Version]
  46. Kalami, H.; Urbanic, R.J. Design and fabrication of a low-volume, high-temperature injection mould leveraging a ‘rapid tooling’ approach. Int. J. Adv. Manuf. Technol. 2019, 105, 3797–3813. [Google Scholar] [CrossRef]
  47. Canciglieri, O.J.; Young, R.I.M. Information sharing in multiviewpoint injection moulding design and manufacturing. Int. J. Prod. Res. 2003, 41, 1565–1586. [Google Scholar] [CrossRef]
  48. Rao, H.P.; Dave, R.; Thakore, R. Optimization of CNC end milling process parameters for aluminium 6061 alloy using carbide tool material by design of experiments. Int. J. Innov. Res. Sci. Technol. 2017, 3, 84–90. [Google Scholar]
  49. Hamdan, A.; Sarhan, A.A.D.; Hamdi, M. An optimization method of the machining parameters in high-speed machining of stainless steel using coated carbide tool for best surface finish. Int. J. Adv. Manuf. Technol. 2011, 58, 81–91. [Google Scholar] [CrossRef]
  50. Philip, S.; Chandramohan, P.; Rajesh, P. Prediction of surface roughness in end milling operation of duplex stainless steel using response surface methodology. J. Eng. Sci. Technol. 2015, 10, 340–352. [Google Scholar]
Figure 1. Cavity and core of mould.
Metals 10 01303 g001
Figure 2. Models of different parts of a mould.
Metals 10 01303 g002
Figure 3. Scheme/experimental setup for surface roughness optimization.
Metals 10 01303 g003
Figure 4. (a) Assembly of end mill cutter and (b) engagement and basic tool motion on workpiece.
Metals 10 01303 g004
Figure 5. Various phases of mould manufacturing.
Metals 10 01303 g005
Figure 6. (a) Machined faces micrographs and (b) surface topography of the profile.
Metals 10 01303 g006
Figure 7. Measurement of surface roughness in (a) longitudinal direction, (b) lateral direction and (c) representation of path length.
Metals 10 01303 g007
Figure 8. Scatterplot of surface roughness (Ra) against experiments.
Metals 10 01303 g008
Figure 9. Main effects plot/graph for Ra.
Metals 10 01303 g009
Figure 10. Interaction plot for Ra.
Metals 10 01303 g010
Figure 11. Surface plots of surface roughness against different combinations of process parameters (a)surface roughness vs. spindle speed and feed rate, (b) surface plot of surface roughness vs. feed rate and depth of cut, (c) surface plot of surface roughness vs. spindle speed and depth of cut.
Metals 10 01303 g011
Figure 12. Normality plot of surface roughness.
Metals 10 01303 g012
Table 1. Hardness and chemical composition of workpiece and cutter.
MaterialsHardnessChemical Composition
Mild Steel (Workpiece)71 HRCManganeseSiliconCarbonSulfurPhosphorus
0.70%0.40%0.16%0.040%0.040%
Tungsten Carbide (Cutter)75 HRCTungstenCarbonIronImpurities
96%3.9%0.02%0.02%
Table 2. Chosen process parameters and their respective levels.
S.NOProcess ParametersLevel/Stage 1Level/Stage 2Level/Stage 3
ISpeed of spindle (rpm)800 rpm2000 rpm3000 rpm
IIFeed rate (mm/rev)10 mm/rev80 mm/rev120 mm/rev
IIIDepth of cut (mm)0.05 mm0.5 mm1.00 mm
Table 3. Maximum and minimum surface roughness.
ExperimentSpeed of Spindle (rpm)Feed Rate (mm/rev)Depth of Cut (mm)Surface Roughness (Ra)Conclusion
3800 rpm10 mm/rev0.5 mm0.15 μmBest case
143000 rpm120 mm/rev0.05 mm0.43 μmWorst case
Table 4. p-values for three process parameters.
S. NOParametersp-ValueConclusion
1Spindle speed (rpm)0.003Significant
2Feed rate (mm/rev)0.766Insignificant
3Depth of cut (mm)Not estimatedRemoved

