1. Introduction
Sheet metal cold forming processes, or deep-drawing processes, play an important role in modern industry, since components of complex geometry can be produced. However, there are some aspects that must be taken into consideration such as: (i) the influence of sheet anisotropy; (ii) the formability limits; and (iii) the spring-back phenomenon that is not negligible. The cold forming process involves plastic deformation, and it should not involve alterations in the thickness of the starting sheet. Actually, the thickness of the blank may have considerable variations during stamping. Cold forming consists of pressing the blank on a punch, by means of a die. The correct execution of the process is ensured by the blank holder, which, by exerting a force on the blank edges, allows the correct material draw-in in the die, avoiding part defects such as wrinkles, thickening, thinning and cracks. It is possible to identify the following main phases of the process: (i) gravity, during which the sheet, resting on the tool, undergoes a first deformation due to its weight; (ii) holding, during which the sheet metal is closed between the die and the blank holder; (iii) stamping, during which die-blank-blank holder system moves towards the punch for the plastic deformation; and (iv) trimming, during which the excess metal is removed while spring-back occurs in the finished part
Deep-drawing process is very effective especially for symmetrical pieces, but, if the component is non-axisymmetric, it is important to have a uniform material flux in the die; in fact, in sheet metal forming, it is fundamental to control the rate of material flow into the die cavity [
1]. To control material flow during drawing operation in order to achieve the optimal forming of a part without cracks and wrinkles, it is generally necessary to slow down the sliding of the blank regions that flow more easily. This can be achieved by calibrating the blank holder force and eventually by drawbeads, which are rib-like projections mounted on the binder and designed with the aim of improving the metal flow control [
2]. For better effectiveness, during the stamping phase, the action of the drawbeads and the force on the blank holder can be differentiated in the different regions of the sheet. This means having active drawbeads and active blank holder control system (different forces on the different segments of the blank holder). A good optimization leads to a better distribution of thickness on the formed part reducing the occurrence of defects such as fracture and wrinkling [
3].
In general, defects on stamped components can be multiple:
Wrinkles are generally caused by insufficient force on blank holder.
Cracks occur when the applied load exceeds the maximum resistance of the material.
Spring-back is due to the deformations of the component in the elastic–plastic field. Spring-back is a critical aspect of drawing processes especially in the automotive industry, where high-dimensional accuracy is often required. Many parameters influence this phenomenon such as Young modulus, yield stress, punch radius and sheet thickness.
The good performances of the deep-drawing process depend on the correct setting of the process parameters that govern the phenomenon such as pressure on the blank holder, gap between die and punch, radius of the tools, lubrication and initial geometry of the blank. In the literature, in fact, several studies evaluate the effects of different process parameters on the quality of the final product [
4,
5].
In this perspective, to support and facilitate the analysis of the criticalities of the process, there is various simulation software such as AutoForm and PamStamp, which is becoming increasingly widespread. The success of these software packages is due to the ability to conduct a preliminary analysis of the process to identify critical parameters, thus reducing the costs of the experimentation (in terms of time, material, energy resources, etc.).
In the present work, the cold forming process for the production of an upper cross member was modeled using the finite element (FE) commercial software AutoForm. Once the process was modeled, it was decided to investigate how some input parameters affect the quality of the final product. The input parameters considered are the blank holder force, friction coefficient and yield stress of blank material. The first was considered a design parameter, while the other two were considered noise parameters. Instead, the quality of the final product was assessed by optimizing at the end of drawing phase the output responses: thickening, insufficient stretch, safe zone, potential splits and thinning.
It is important to consider the noise variables in addition to design variables, because in everyday production it is possible for parts to be produced safely one day, and the next day problems arise even though production condition have apparently not changed. This is probably due to noise and variation during forming process. Therefore, the robustness analysis was indispensable. It can be verified whether a forming process provides stable results under the influence of the noise parameters. Therefore, in this work, after robustness analysis, thanks to the numerical results, metamodels were built with the kriging technique for each quality criterion considered. The combination of finite element analysis with metamodeling techniques is a consolidated methodology in the literature [
6,
7,
8]. Metamodeling is a powerful tool that allows deriving the mathematical relationship between inputs and outputs even when the analysis is based on a deterministic computer experiments.
In the present work, after the metamodeling phase, a multi-objective optimization with a desirability approach was carried out. The innovative aspect of this work is linked to the need to find a regulation curve of the force to be imparted to the blank holder as a function of the yield stress of the material in order to control the process online from the perspective of Industry 4.0.
2. Materials and Methods
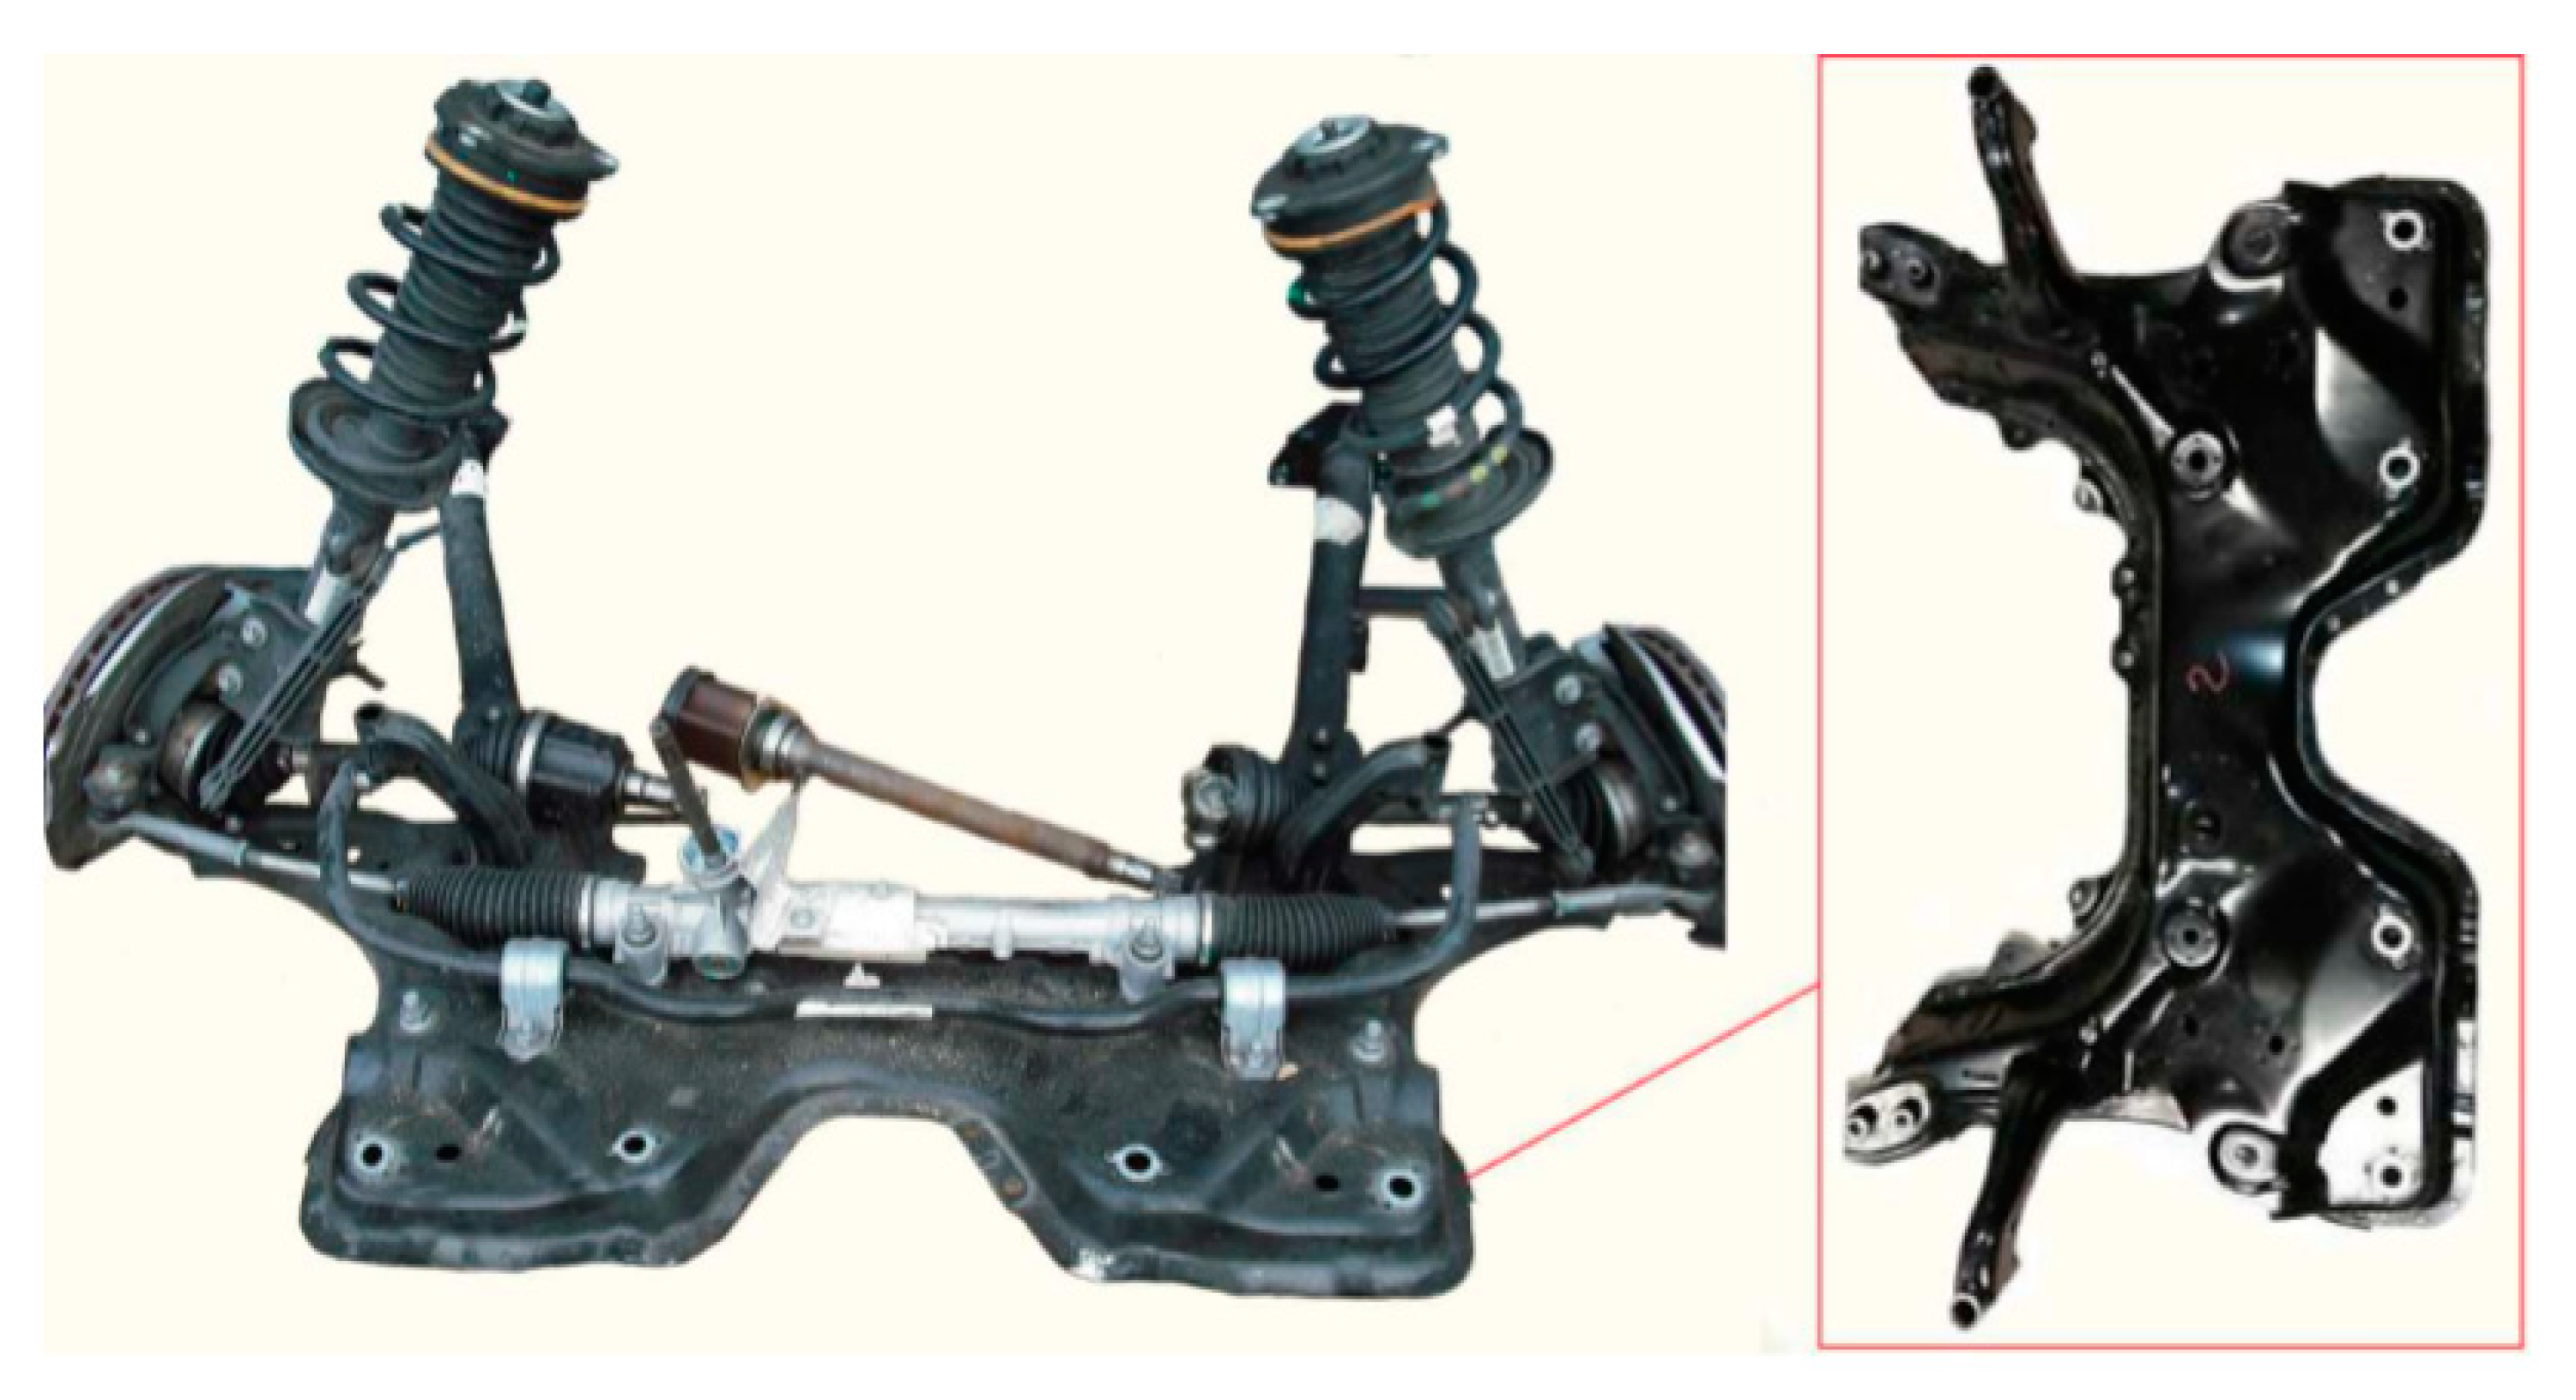
The component studied in this work is the upper front cross member of a car currently being produced at Tiberina company (Sangro – Atessa (CH), Italy);
Figure 1 shows the image of this component realized in HR 440Y580T-FB-UC steel (2 mm thick) that is common in the automotive field for cold forming of structural components. It is a hot-rolled steel strip; in particular, it belongs to the family of ferritic-bainitic steel. This microstructure offers a particularly attractive combination of high strength and good cold workability.
Table 1 shows chemical composition of investigated steel and
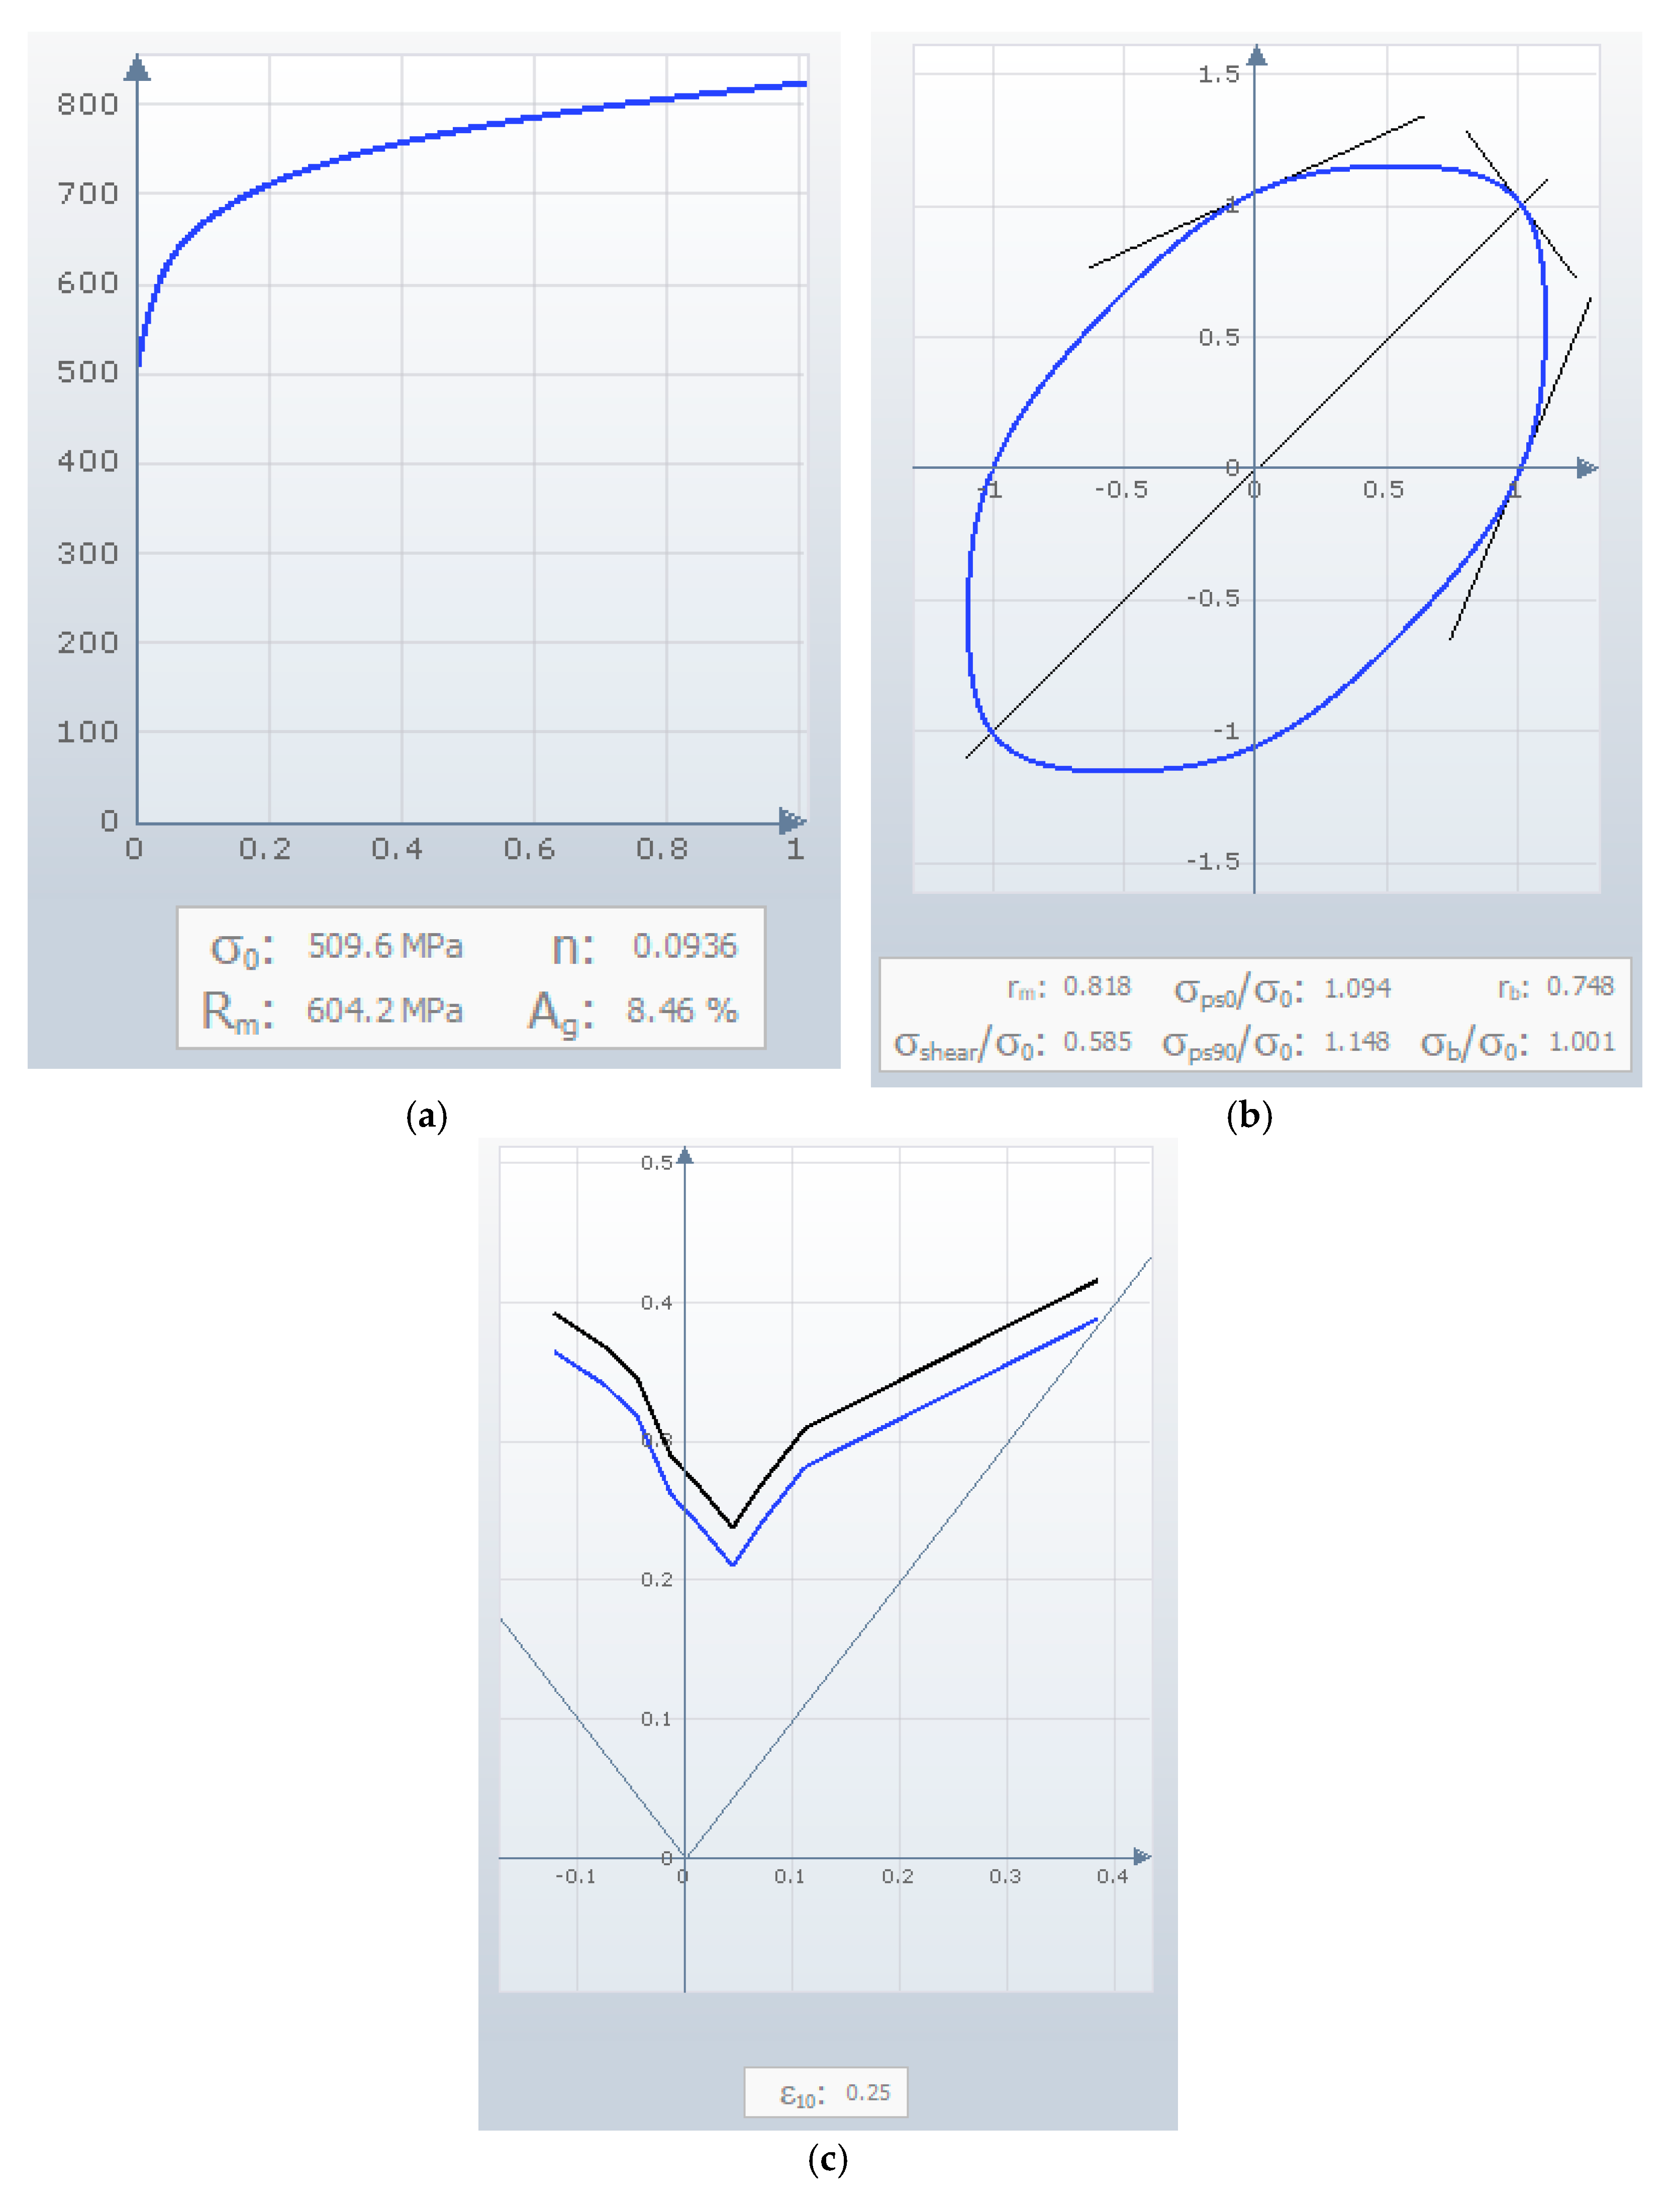
Figure 2 shows the mechanical characteristics of the material considered for the studied component.
Specifically,
Figure 2a shows the hardening curve. AutoForm requires the true stress as a function of true plastic strain measured in the direction of rolling. In this image, the values of the uniform elongation (
Ag), yield stress (
σ0), tensile strength (
Rm) and strain hardening exponent (
n) are highlighted.
Figure 2b shows the yield surface defined with the BBC criterion (Banabic et al.) in order to take into account material anisotropy [
9]. The main values of this model are illustrated in this figure:
rm is the average of plastic strain ratio at 0°, 45° and 90° of rolling direction;
rb is plastic strain ratio at biaxial stress, which is defined as the ratio of strains
ε2 and
ε1;
σb/σ0 is the ratio between onset of yielding at equi-biaxial stress and yield stress;
σps0/σ0 is the ratio between plane strain stress at 0° of rolling direction and yield stress;
σps90/σ0 is the ratio between plane strain stress at 90° of rolling direction and yield stress; and
σshear/σ0 is the ratio between shear stress and yield stress.
Figure 2c shows the Formability Limit Curve (FLC). The curve represents the maximum values of the principal strains ε
1 and ε
2 measured at the onset of material failure.
The goal of industrial digitization is to increase production efficiency and improve the quality of the final product. In fact, aiming at zero defect production, the number of scrap products is reduced and consequently the production costs are reduced. Therefore, it is necessary to optimize and design the process correctly. However, it must be taken into account that unwanted system changes may occur during a production process. In this work, for the examined deep-drawing process, possible fluctuations of the material in a coil (yield stress) and a variation of the lubrication conditions (friction coefficient) were considered. These two parameters are called noise factors; this means that they cannot be controlled. A possible controllable design parameter is the force on the blank holder, which can be adjusted in the production line.
The objective of this work, in fact, is the robust optimization of the process investigated. Moreover, once the process has been optimized, the goal is to find a regulation curve that allows, once it is implemented in the process through an algorithm, to identify how to adjust the force on the blank holder as the yield stress varies for different values of the friction coefficient. In the article by P. Fischer et al. [
10], the control based on the feed-forward algorithm for the force on the blank holder is studied considering the fluctuations of the yield stress measured through the eddy currents.
The methodology adopted to derive the regulation curves is shown in
Figure 3.
In particular: (1) The component and the process phases were modeled in the AutoForm (R8, GmbH, Zurich, Switzerland) environment. (2) Thanks to the AutoForm Sigma module, the process was simulated and studied as the process parameters changed. In particular, the parameters that were changed are the force on the blank holder, the friction coefficient and the yield stress. These last two parameters were considered noise parameters. The target value and a standard deviation to all parameters considered were assigned. The software, then, proceeded to a sampling according to the Latin Hypercube statistical method (Latin Hypercube Sampling, LHS), generating a near-random samples of parameter values. In total, 81 numerical simulations were performed. Once the results of the numerical simulations were obtained, a robust analysis was carried out to analyze the influence of the noise variables on the forming process. The quality indices taken into consideration for this study were thickening, insufficient stretch, safe zone, potential splits and thinning. The results of robust analysis were used to predict the stability and capability of the process. (3) Given the dataset obtained with the numerical simulations of AutoForm Sigma, thanks to the Matlab DACE toolbox (2.0, Technical University of Denmark DK-2800 Kgs, Lyngby, Denmark), the metamodels were obtained. These metamodels allow predicting a new (untried) site [
11]. These sites on which to evaluate the predictor were generated thanks to a definition of a grid points. We chose a 39 × 39 mesh of points distributed equidistantly in the area [0, 100]
2 covered by the design sites. After kriging meta-modeling phase, there was the multi-objective optimization phase. The approach used for optimization is that of desirability. With the optimization phase, the combination of input parameters (force on the blank holder, friction coefficient and yield stress) which guarantees a stamped component without defects (wrinkles, thinning, thickening and breakage) was identified. (4) Considering combination of input parameters that give high desirability, force regulation curves on the blank holder were obtained as a function of the yield stress of the material for three different values of friction coefficient. Finally, by comparing an optimized solution with a non-optimized one, the draw-in of metal sheet was evaluated, and it was observed that the sheet has different sliding in the two conditions.
3. Results
3.1. Design of Stamping Process Using Finite Element Model (FEM)
The process was first numerically modeled using commercial Finite Element (FE) software AutoForm. The numerical model provides for the definition of tools geometries (die, punch and blank holder), the initial blank and their reference systems and material characteristics and production plan (defining the individual operations of the production process).
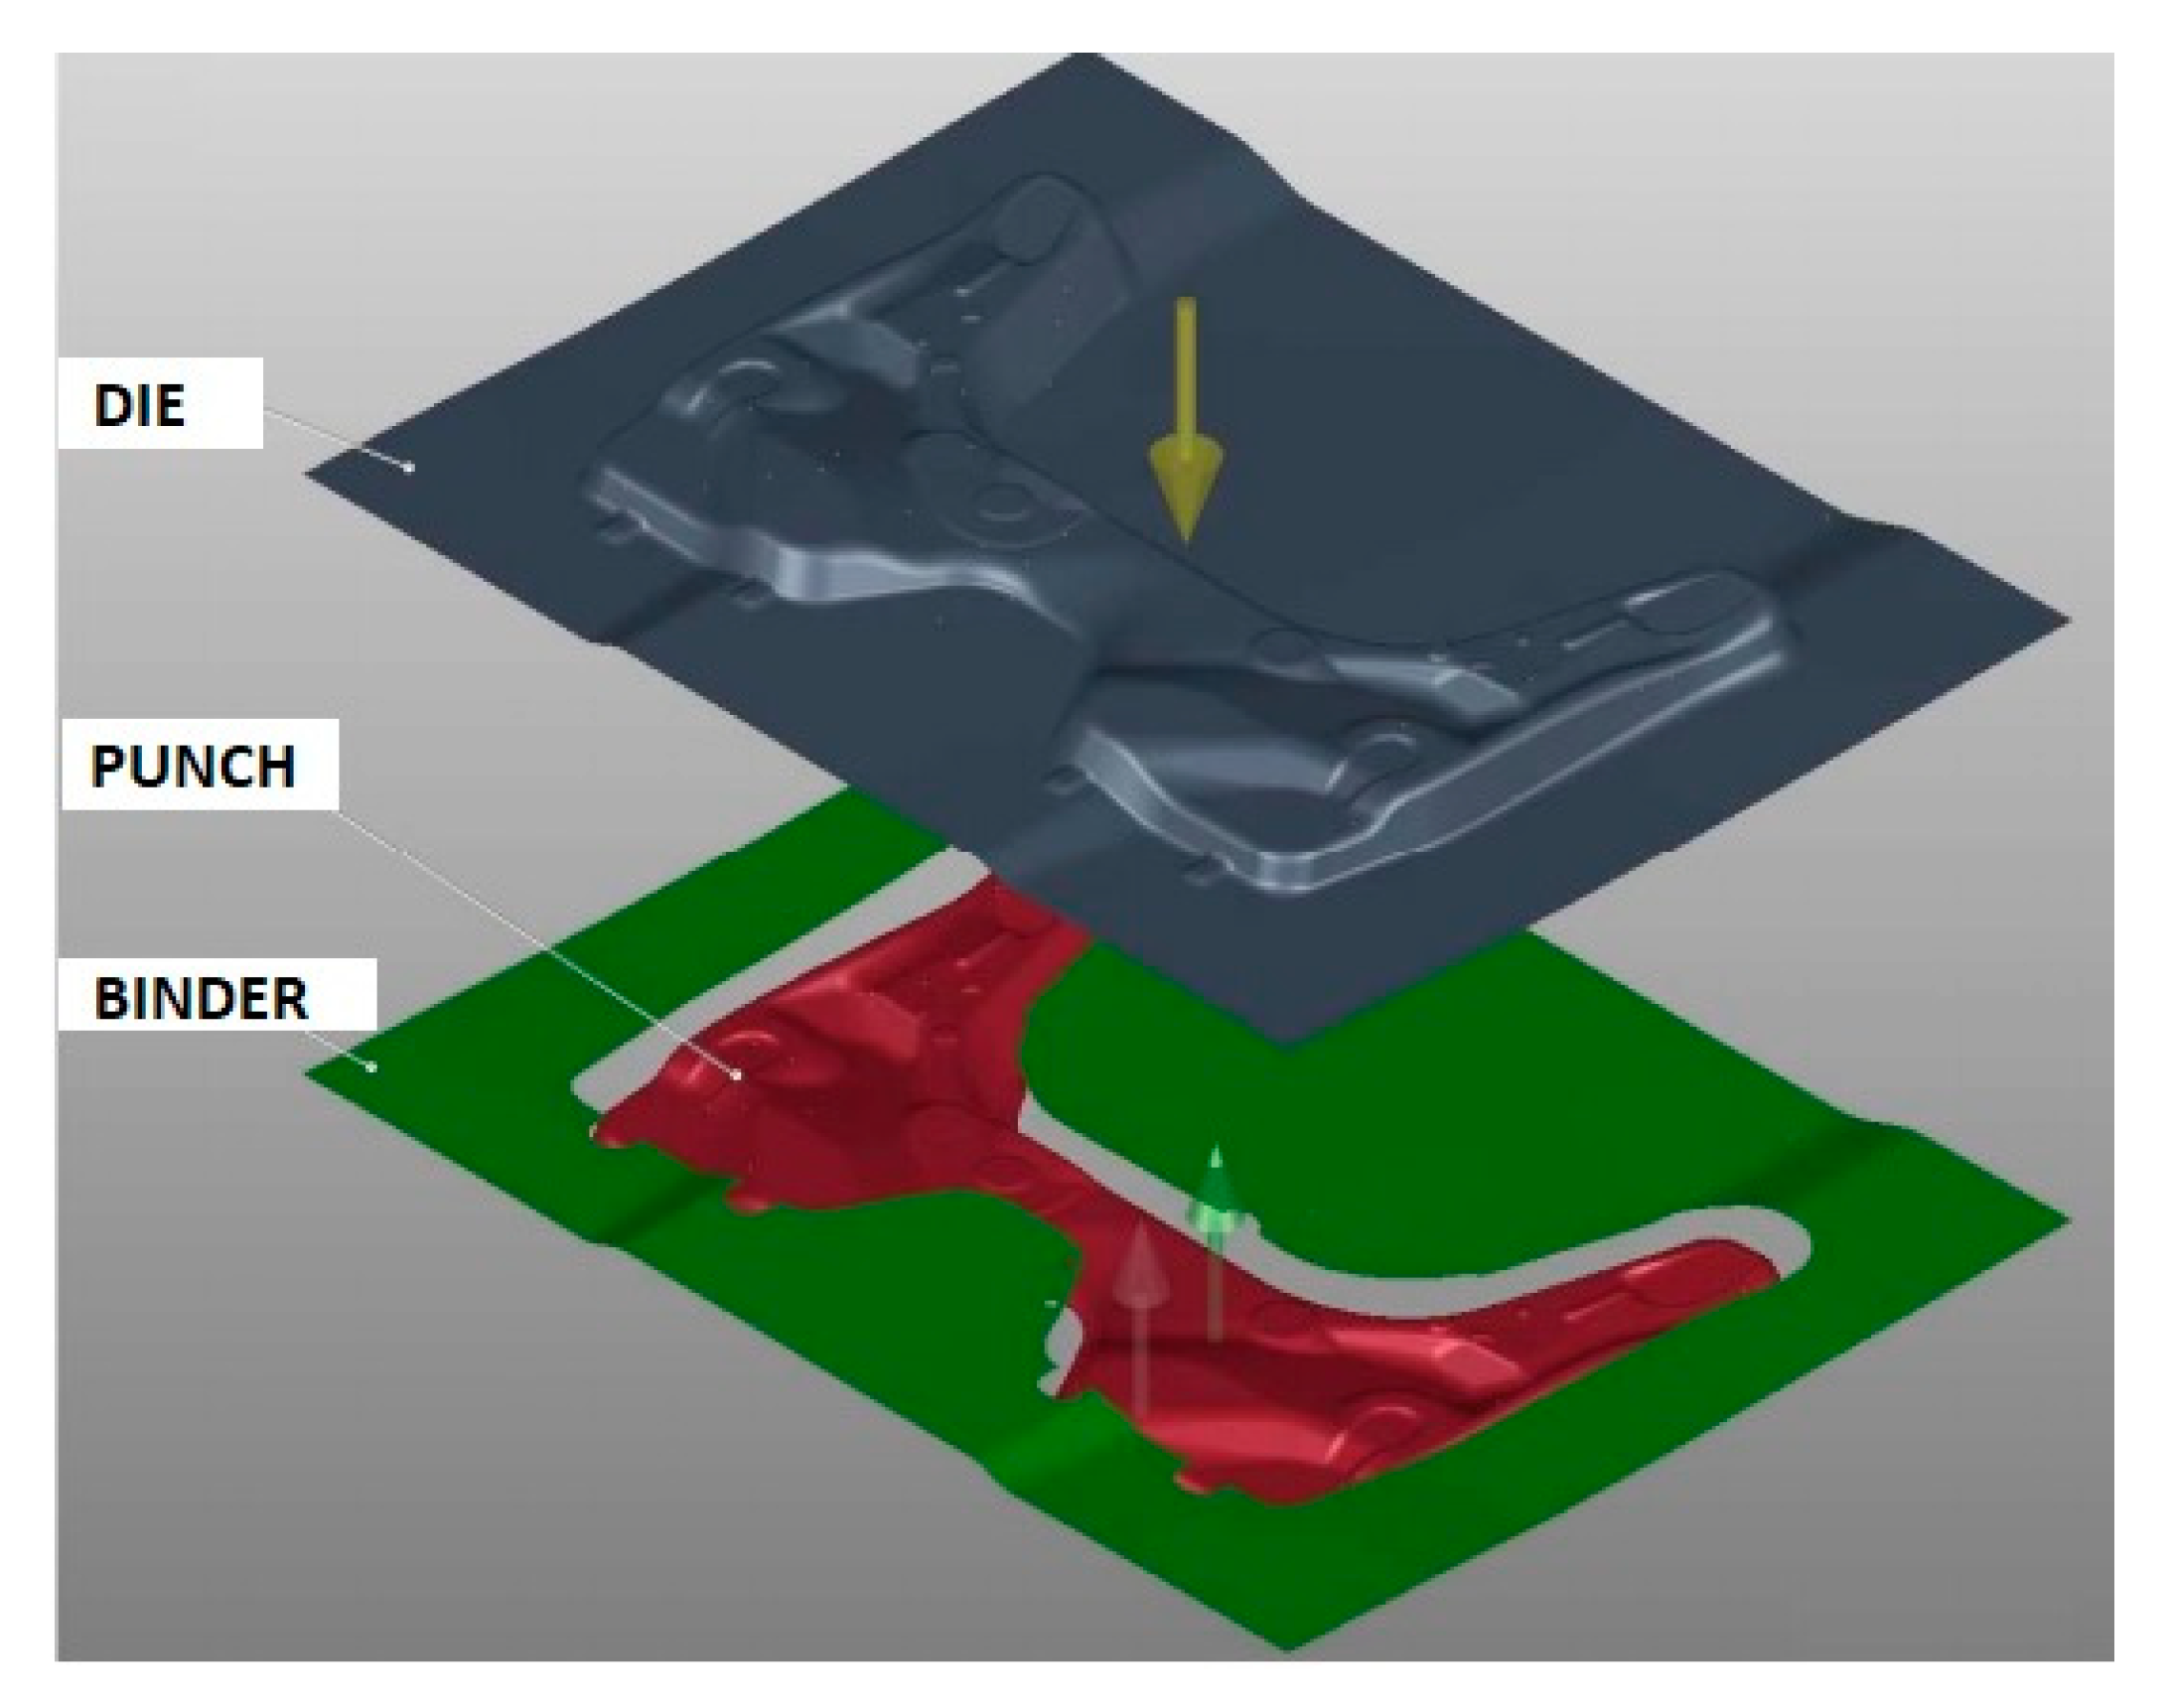
Figure 4 shows the tools modeled in AutoForm.
The die and the punch were defined as rigid tools. The blank holder was defined as a force-controlled tool, which means that the assigned force is automatically increased; if the reaction force acting on the binder exceeds the defined force, the binder always remains closed [
12].
For model construction, a membrane element, extended by an approximate bending stiffness (Bending Enhanced Membrane, BEM) is chosen. AutoForm software uses an adaptive mesh and an implicit solver.
Once the component and the process were modeled, robust analysis was carried out by means of AutoForm-Sigma, an AutoForm module. This tool allows analyzing and improving the robustness of sheet metal products and processes; in fact, it enables identifying which design and noise parameters influence part quality and to what extent. It also supports in determining appropriate correction measures during tryout and production. In addition, it identifies the correction measures that have no effect at all, as well as those that offer a real chance of resolving the particular problem at hand. By analyzing process performance and, in particular, process capability, it is possible to validate the stamping process, minimize part rejects and maximize production efficiency.
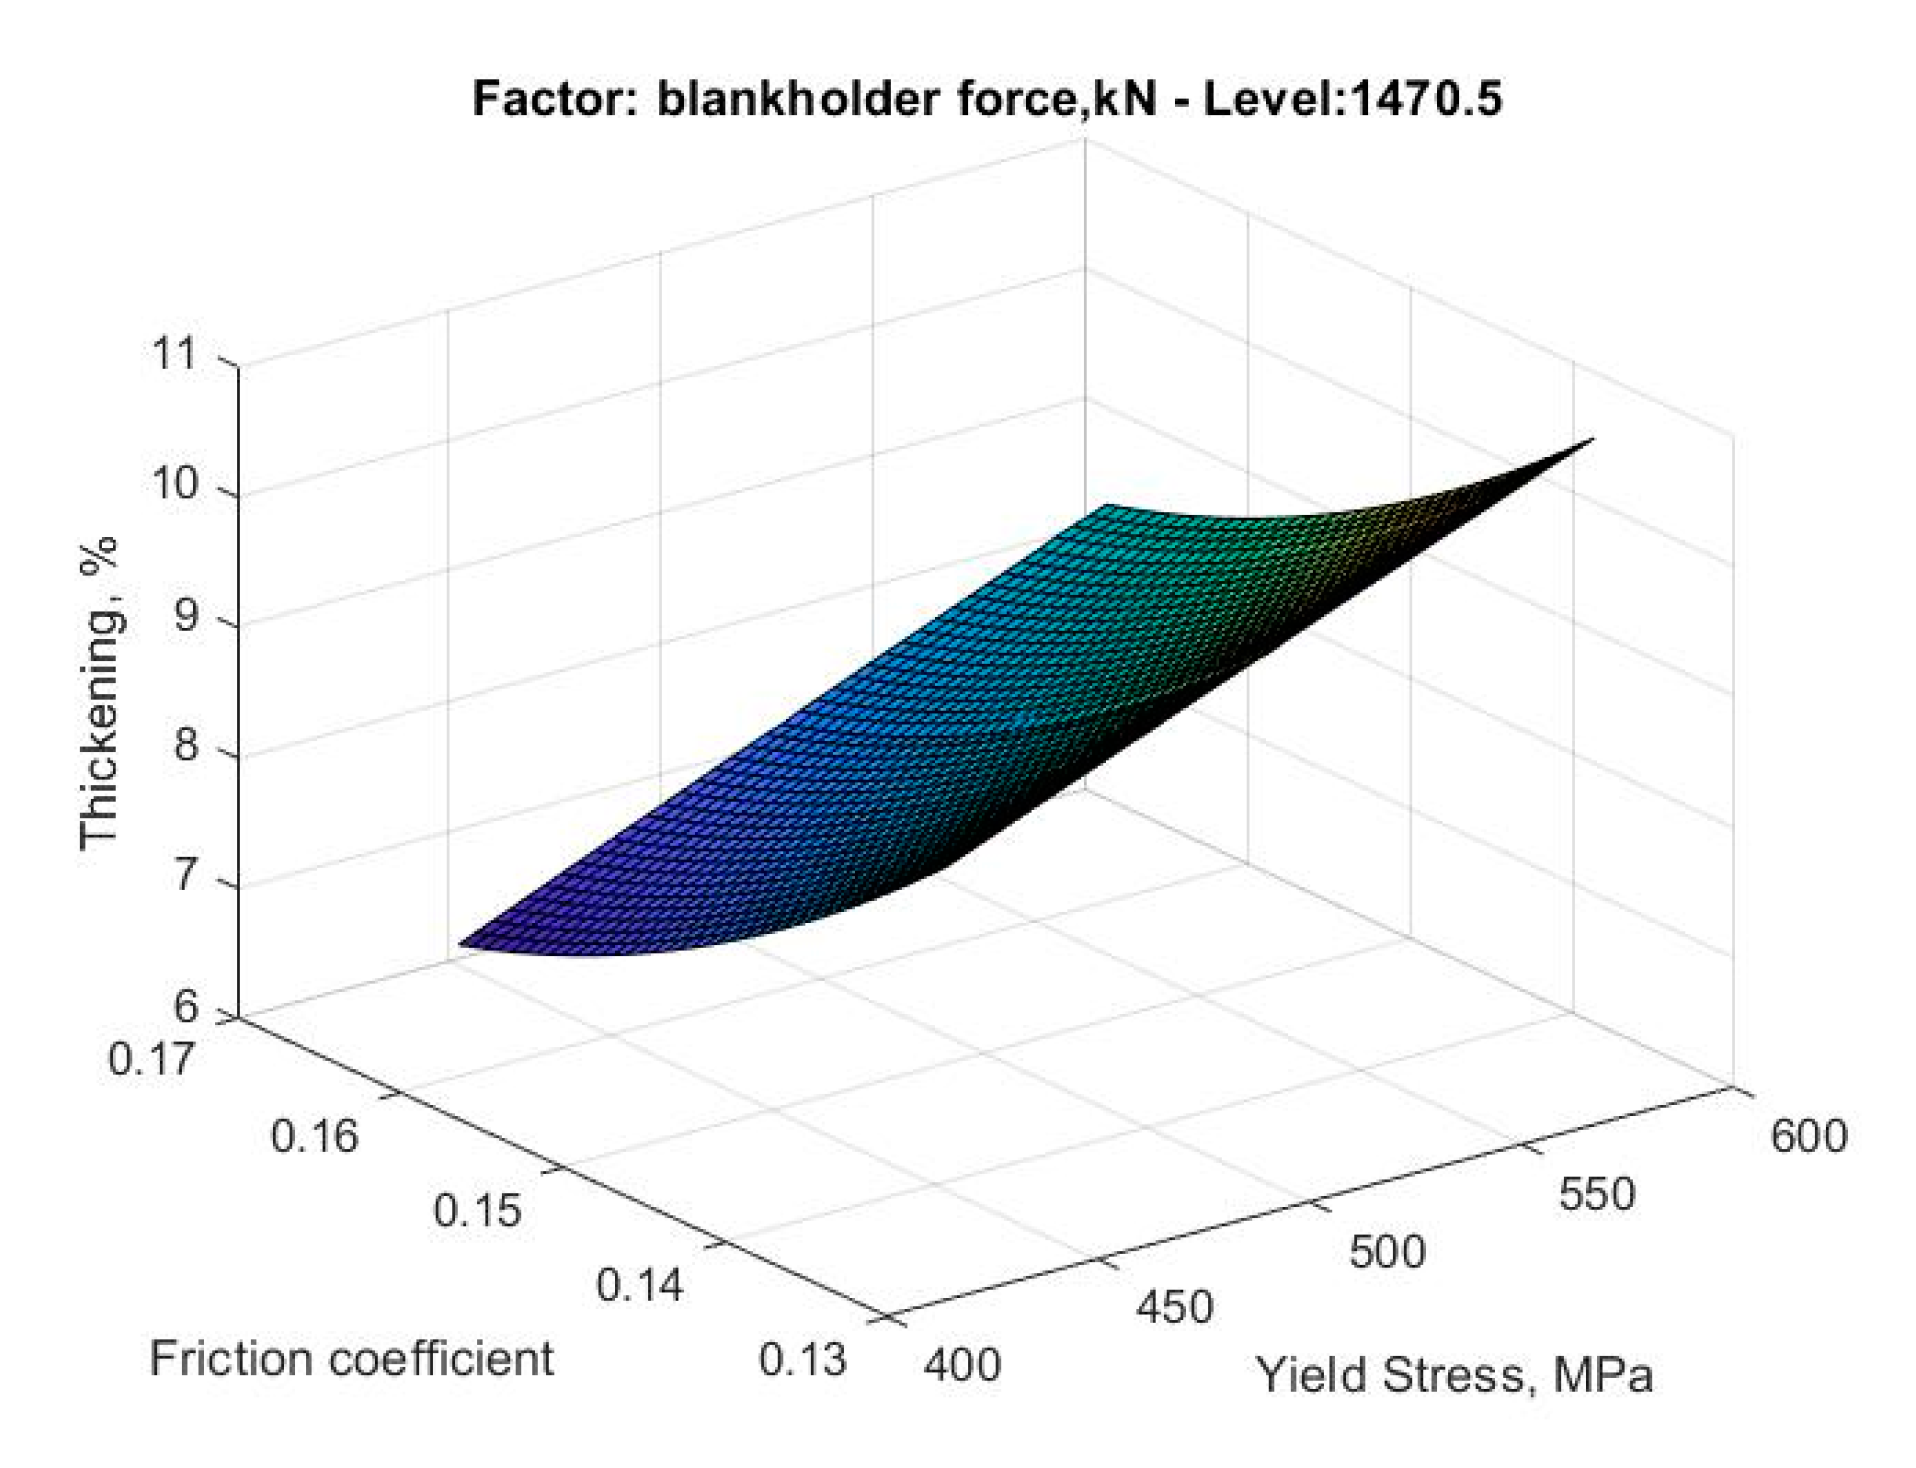
The friction coefficient and the yield stress, as well as the force on the blank holder, are the considered input parameters. The force on the blank holder was considered as a design variable and a variability of 25% was imposed with respect to the nominal value of 1470.5 kN; instead, the friction coefficient and the yield stress were considered noise variables. Variabilities of 10% and 15% were set for the friction coefficient (0.15 as nominal value) and for the yield stress (509.61 MPa as nominal value), respectively. The value of the force on the blank holder was chosen thanks to the design data of the press present in Tiberina Sangro company and the value of yield stress was set according to material datasheet. Instead, the software default value was chosen for the friction coefficient, specifying a mill oil for the lubrication condition. The Coulomb lubrication model was selected for the numerical simulation of deep-drawing process. However, the Coulomb model is only an approximation of the real friction behavior. In fact, the friction coefficient is not a constant in reality, but is dependent on multiple factors such as contact pressure.
The need to distinguish the parameters into two categories (controllable or design variables and non-controllable or noise variables) arises from the need to evaluate the process robustness before production phase. The variability of noise and controllable parameters, in fact, will lead to a response variation, thus causing changes in the product characteristics. If the response differs too much from the expected characteristics, the product may be unacceptable. However, while controllable variables can be corrected in the design phase, or even in-process, the noise variables must be carefully defined and studied; therefore, the process must be developed so as that these variations do not lead to worsening product quality.
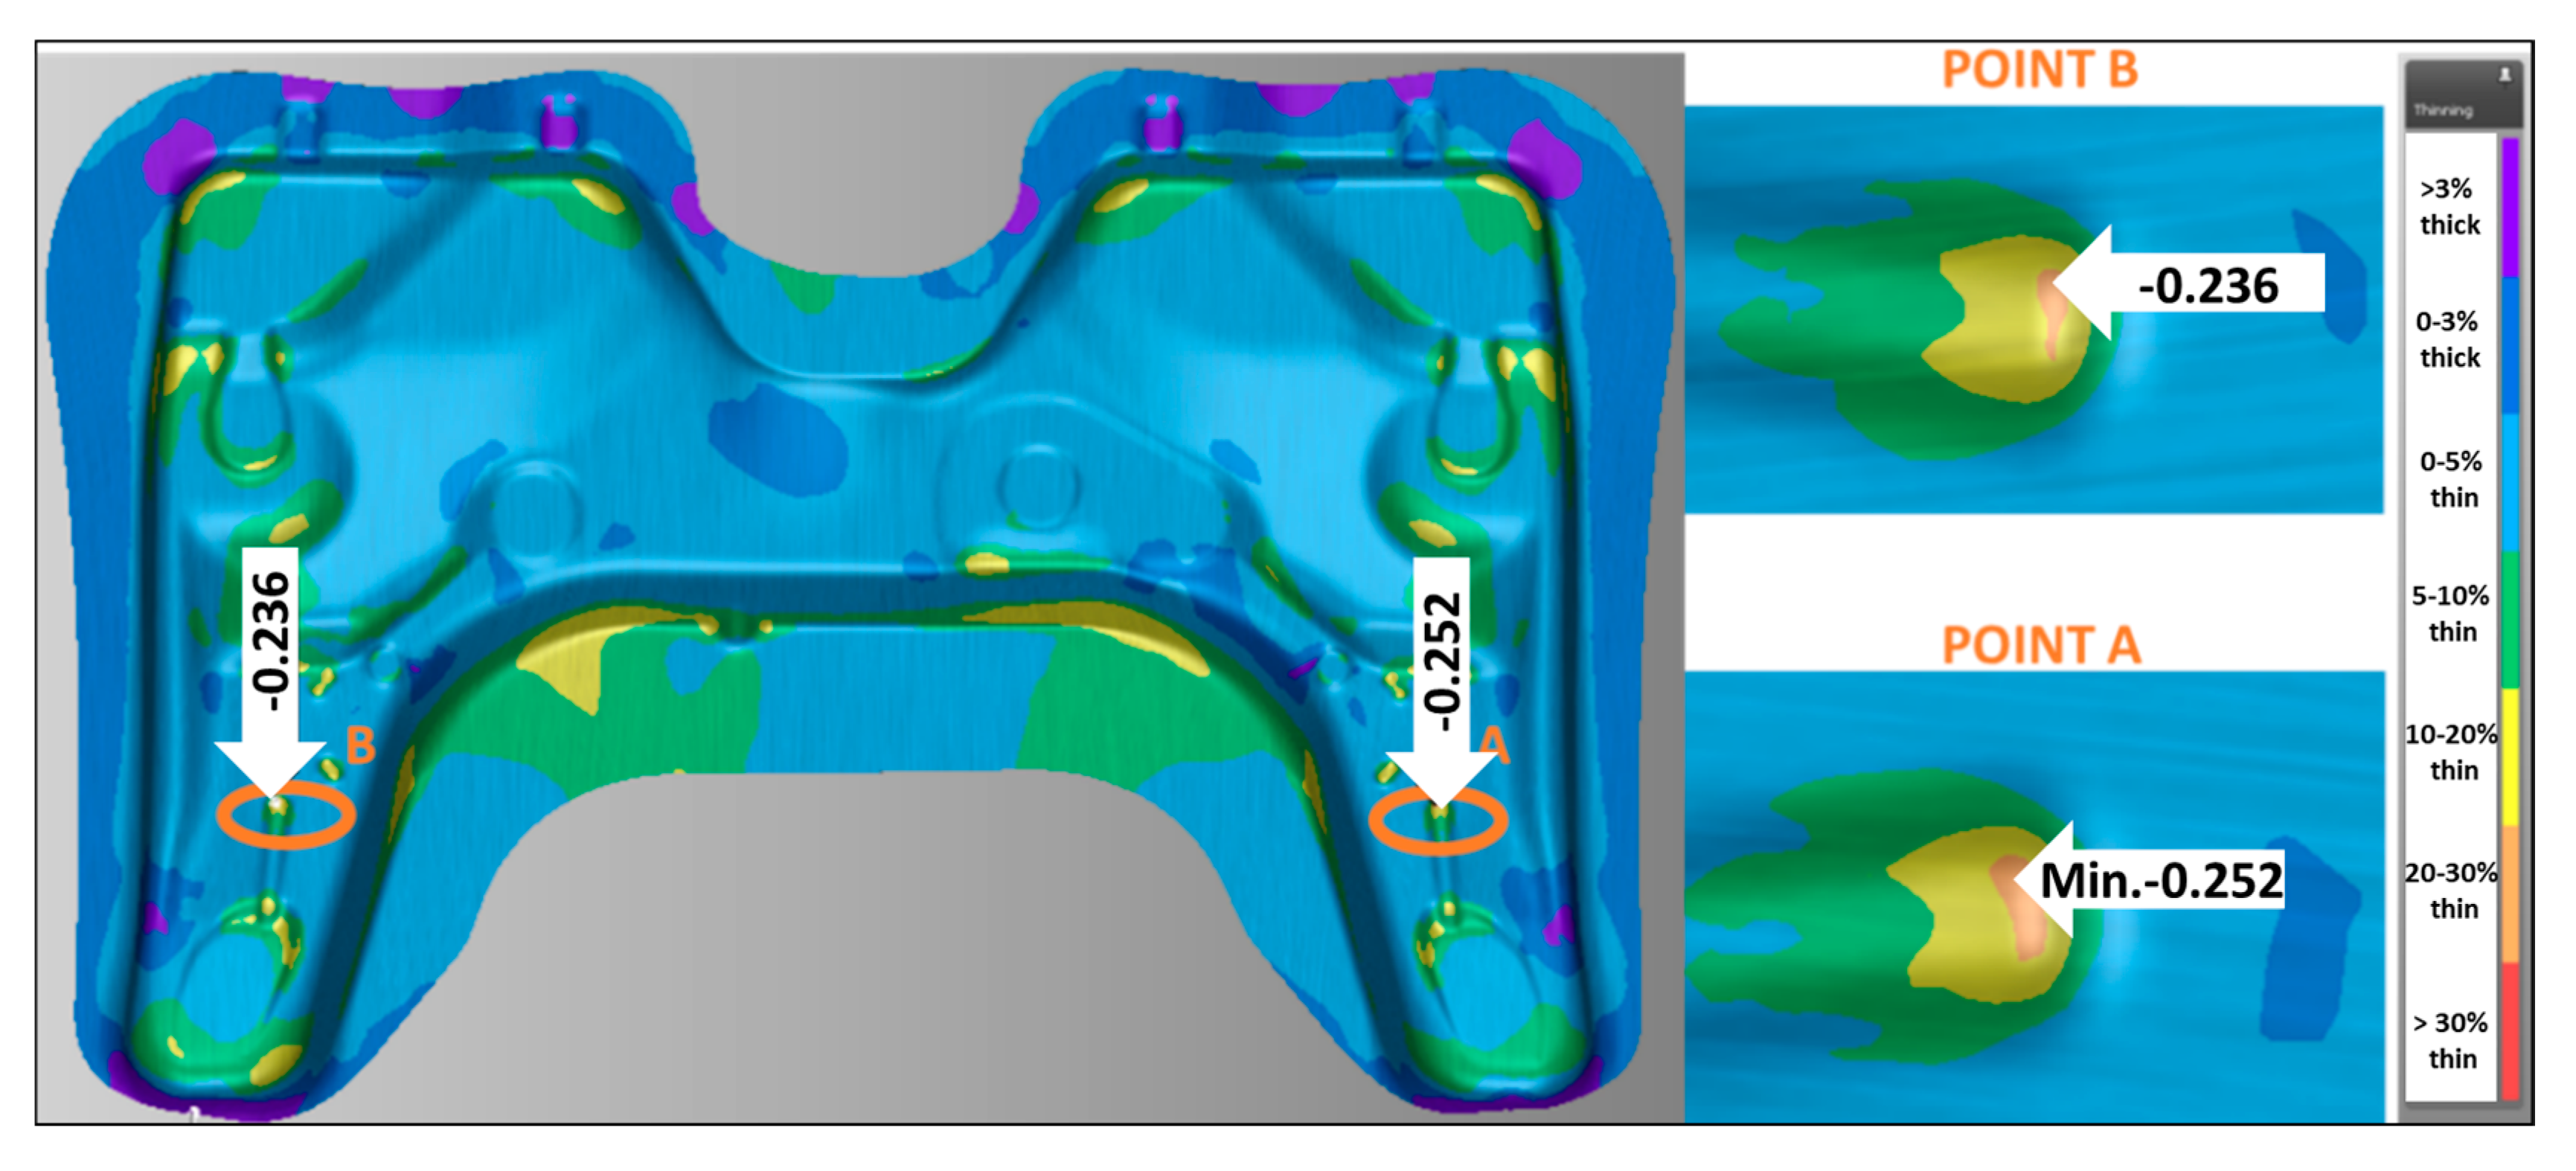
The qualities of the final product were assessed on the basis of the percentage of thickened area, the percentage of the area with insufficient elongation, the percentage of safe zones, the percentage of area with potential cracks and the thinning at the two Critical Points A and B indicated in
Figure 5. These two points are critical because at Point A the minimum global thinning value of 25.2% is reached, while at Point B a value of 23.6% is reached. The different maximum thinning values at Points A and B are justified by the lack of symmetry of the part.
The output variables were evaluated at the end of the drawing phase, before the trimming operation in order to optimize the drawing phase.
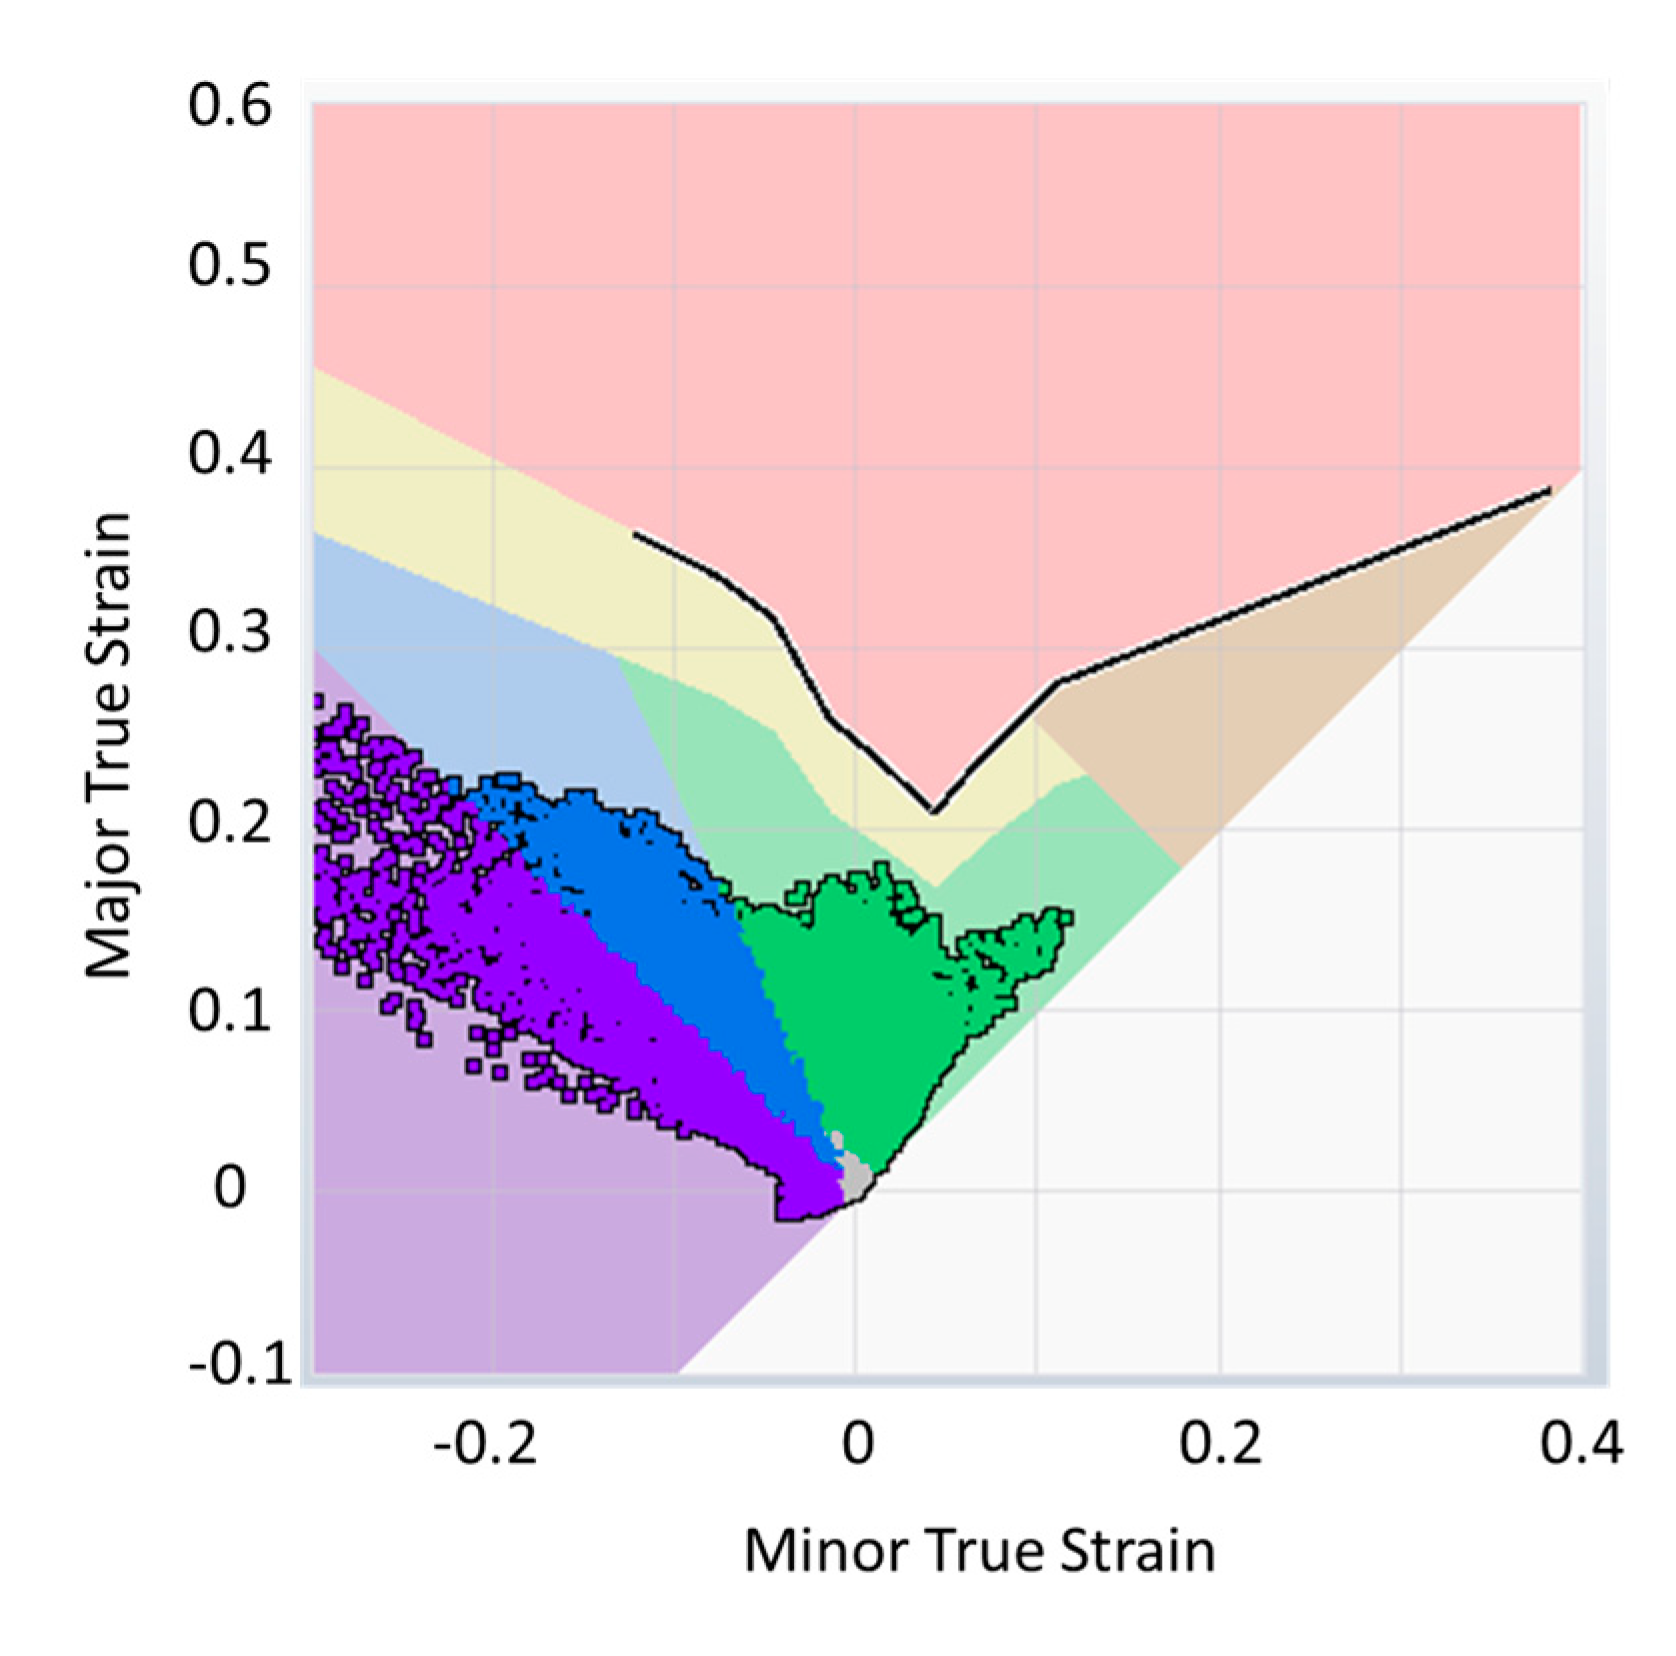
These issues can be determined by means of the Formability Limit Diagram (FLD).
Thanks to the FLC imported during the material definition phase, the software is able to represent the FLD showing the strain state of all elements for each time step.
As an example,
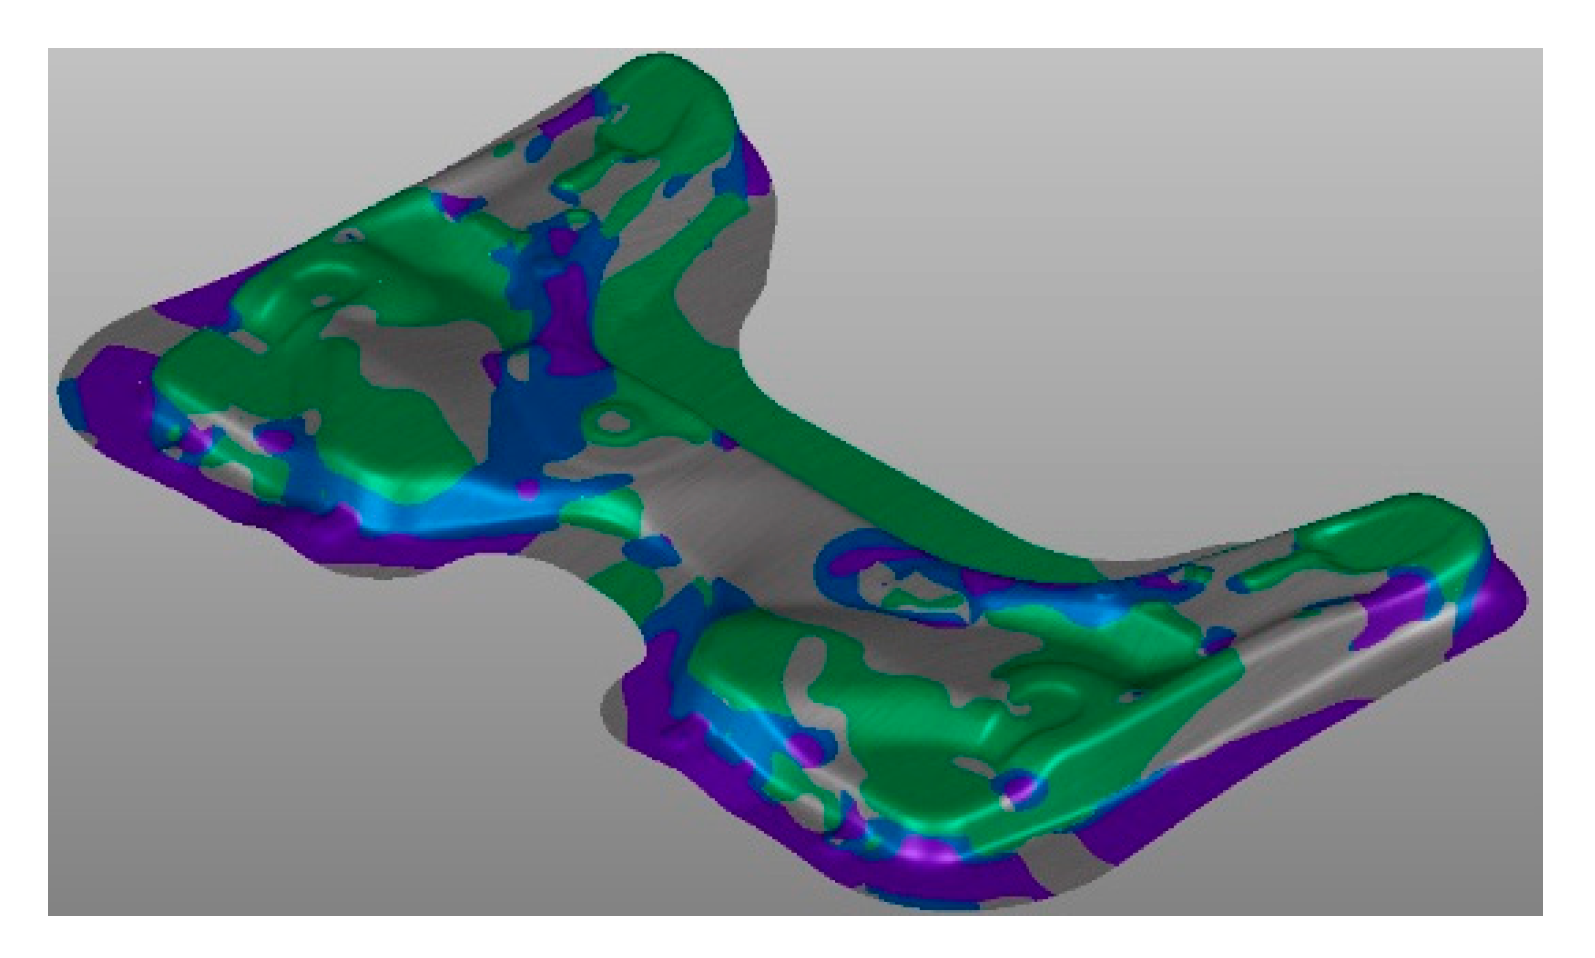
Figure 6 shows the formability limit diagram at the end of drawing phase for the nominal case (process parameters set at the nominal values); the different colored areas represent the behavior of the material during the deformation process.
Figure 7 shows the formability map on the component.
The red region, above the formability limit curve, represents the area of points subject to splits. The area of the points subject to risk of splits is shown in yellow. The regions in which the deformation occurs in an optimal way are highlighted in green. When the material is not sufficiently deformed, it is called insufficient stretch, and this region is colored in gray. The other two regions in blue and purple represent, respectively, the compression zone and the thickening zone, where there may be a greater tendency to wrinkle.
These areas are calculated as the ratio between the area of the finite elements that present critical issues and total area of the component.
The thinning issue shows the thickness variation of the blank during the process. It is important to predict which areas are subjected to excessive thinning because it is more likely that the ruptures occur there.
3.4. Multi-Objective Optimization and Regulation Curve
To obtain an upper cross member free of defects, it is necessary to minimize the percentage of thickening, the percentage of areas with insufficient stretch, the percentage of areas with risk of splits and the percentage of thinning. Moreover, it is necessary to maximize the percentage of safe zones as well. It is clear that these characteristics cannot simultaneously assume the best possible values; therefore, the need to identify a compromise solution arises. This explains the multi-objective nature of optimization.
In this study, the Desirability Function Approach (DFA) was chosen. This approach is one of the most common methods for the optimization of multiple response processes in the industry field. According to this method, when the quality of a product or a process depends on several characteristics, if even one of them exceeds the imposed limits, the product or process is not acceptable. The DFA identifies the operating conditions that return the “most desirable” response values [
15].
For each output variable, the criterion to be followed for optimization was chosen. In particular for the response relating to the percentage of safe zone, the criterion “the larger the better” was chosen, and, for all the other responses, the criterion was “the smaller the better”.
If a “the larger the better” response is desired, i.e., if the response is to be maximized, the desirability function is of the type:
If a “the smaller the better” response is desired, instead, i.e., if the response is to be minimized, the desirability function is defined as follows:
According to this approach, total desirability is defined as:
Table 2 presents the notation related to the equations.
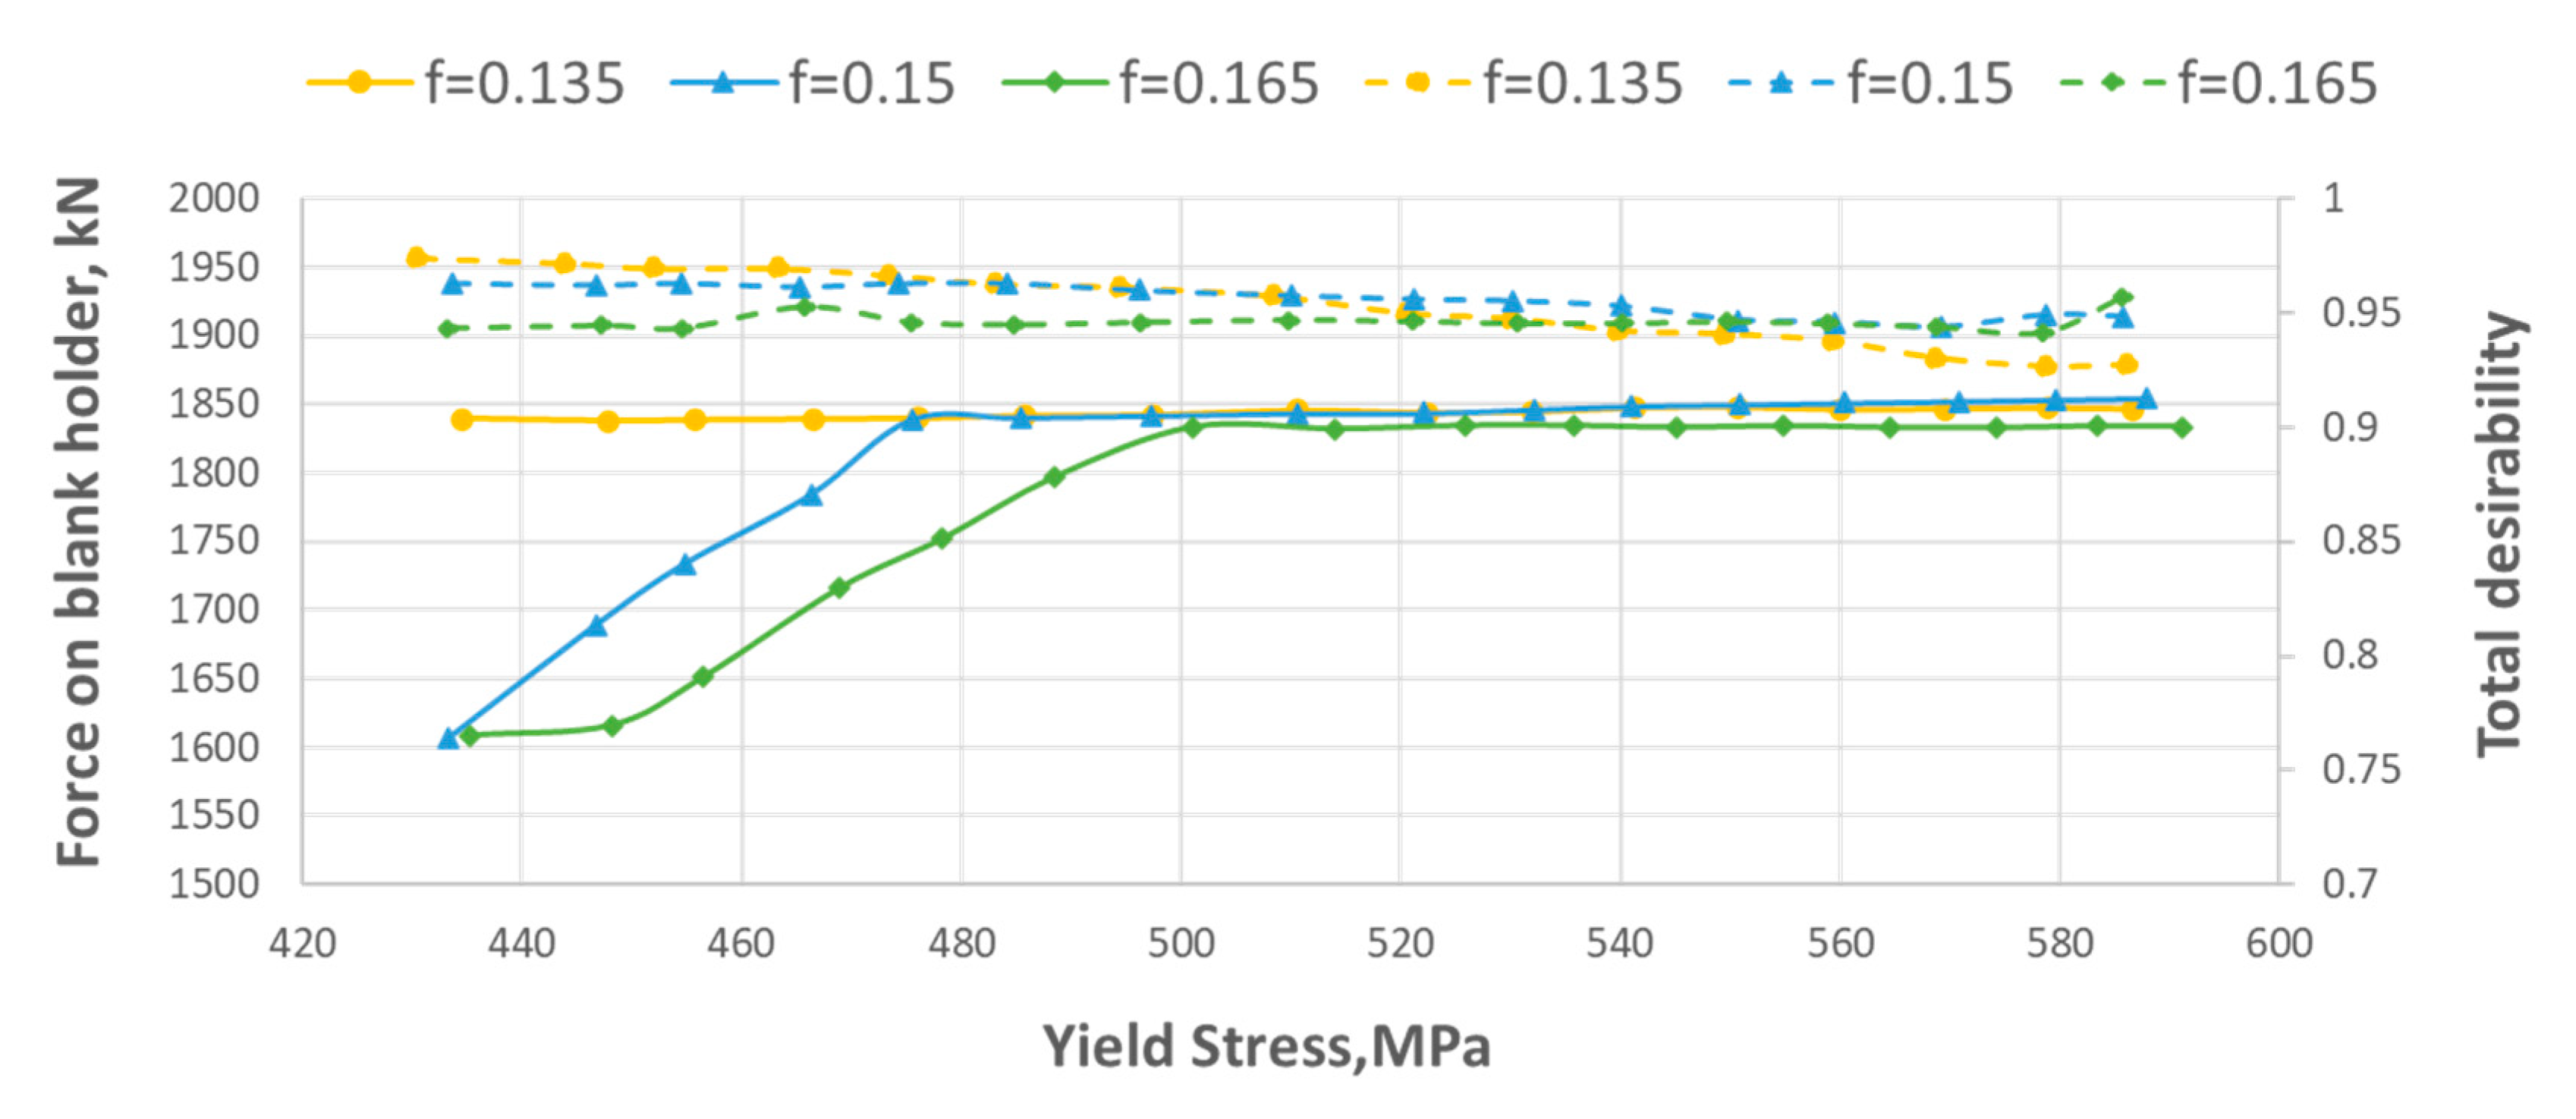
This optimization was a useful tool to obtain the regulation curves shown in
Figure 14. These curves, in fact, were obtained considering the points of maximum desirability (
D > 0.9). In this figure, the desirability curves for each value of the friction coefficient are also shown. In particular, regulation curves of the force on the blank holder as a function of yield stress for all friction coefficient (f) considered are highlighted with solid lines. The curves of the total desirability as a function of the yield stress for all values of the friction coefficient are highlighted with dashed lines.
Figure 14 shows that, at low values of the friction coefficient, the process requires higher force values, while, for the other levels of friction considered, the force initially increases, and then it stabilizes at a constant value. In particular, for a blank with a yield stress lower than 500 MPa and high friction (>0.135), it is necessary to reduce the force on the blank holder. Moreover, at low friction coefficient values, the process is insensitive and the maximum desirability curve is horizontal.
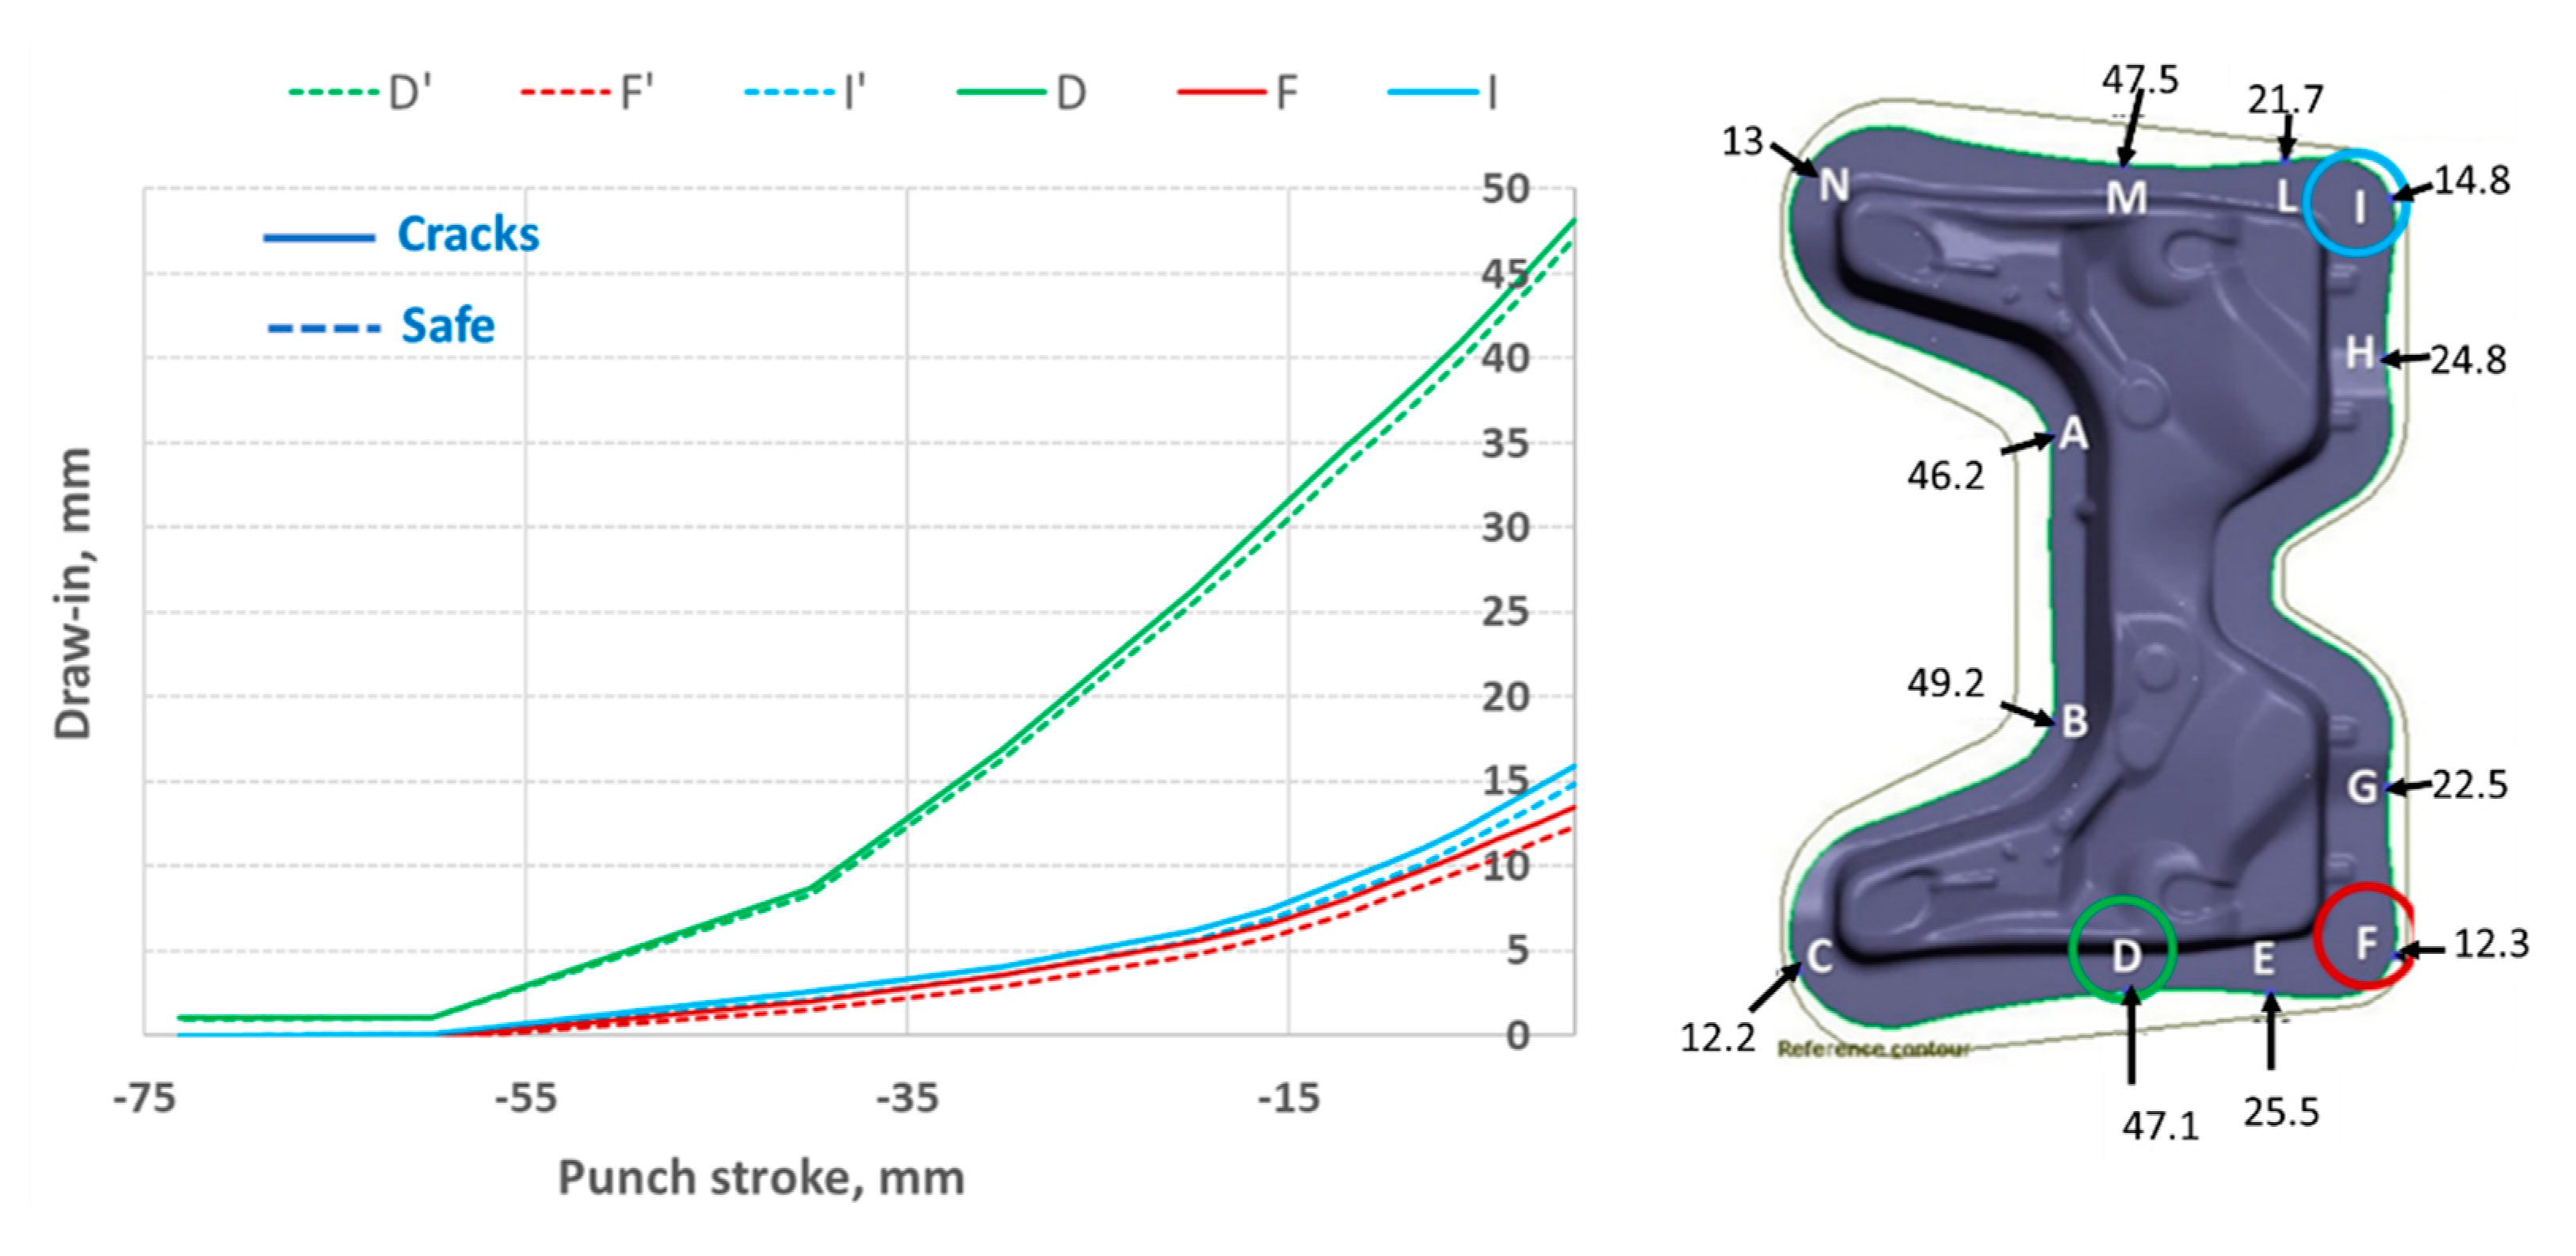
The regulation curves identified provide the control of the deep-drawing process in the case of random variations of the material mechanical characteristics (yield stress and friction coefficient). These noise parameters affect the sheet draw-in. In fact, in
Figure 15, taking some reference points, the draw-in is compared as a function of the punch stroke for one of the conditions with maximum desirability (safe) and for a generic non-optimized condition (cracks).
From the comparison, the different sliding of the sheet is observed in the non-optimized case compared to the optimal case; this leads to excessive thinning or rupture. The comparison in-process of draw-in with the safe condition proves to be a promising strategy for online monitoring of the stamping process. In fact, through laser sensors placed on the most critical points, it is possible to evaluate sliding of the sheet by comparing it with the optimal case. Thus, if there is no correspondence, a signal is sent to the piezoelectric actuators on the blank holder which acts on the force, modifying it. Neugebauer [
16] used piezoelectric actuators for manipulating the blank holder force. The used state variable was the edge draw-in, which was measured by a laser displacement sensor developed in the work of Bräunlich [
17].
Author Contributions
Conceptualization, M.E.P., V.D.L. and L.T.; methodology, M.E.P., V.D.L. and L.T.; software, M.E.P. and V.D.L.; validation, M.E.P. and V.D.L.; formal analysis, M.E.P.,V.D.L. and L.T.; investigation, M.E.P.,V.D.L. and L.T.; resources, M.E.P.,V.D.L. and L.T; data curation, M.E.P.,V.D.L. and L.T; writing—original draft preparation, M.E.P. and L.T.; writing—review and editing, M.E.P. and L.T.; visualization, M.E.P.,V.D.L. and L.T; supervision, L.T; project administration, L.T.; funding acquisition, L.T. All authors have read and agreed to the published version of the manuscript.
Funding
This research was funded by MIUR thanks to the project PICO&PRO.
Institutional Review Board Statement
Not applicable.
Informed Consent Statement
Not applicable.
Data Availability Statement
Not applicable.
Acknowledgments
The authors are grateful to thank MIUR (PICO&PRO project) for funding this research. Moreover, the authors thank Tiberina Sangro company and AutoForm for the technical support.
Conflicts of Interest
The authors declare no conflict of interest.
References
- Bruschi, S.; Altan, T.; Banabic, D.; Bariani, P.F.; Brosius, A.; Cao, J.; Ghiotti, A.; Khraisheh, M.; Merklein, M.; Tekkaya, A.E. Testing and modelling of material behaviour and formability in sheet metal forming. CIRP Ann. Manuf. Technol. 2014, 63, 727–749. [Google Scholar] [CrossRef]
- Schmid, H.; Merklein, M. Study of the mechanical properties of sheet metals drawn through drawbeads. Manuf. Rev. 2019, 6, 14. [Google Scholar] [CrossRef]
- Liu, G.; Lin, Z.; Bao, Y. Optimization design of drawbead in drawing tools of autobody cover panel. J. Eng. Mater. Technol. 2002, 124, 278–285. [Google Scholar] [CrossRef]
- Su, C.; Su, C.; Lou, S.; Xu, T.; Zhang, K.; Wang, Q. Effects of variable blank holder forces and a controllable drawbead on the springback of shallow-drawn TA2M titanium alloy boxes. Int. J. Adv. Manuf. Technol. 2017, 93, 1627–1635. [Google Scholar] [CrossRef]
- Kardan, M.; Parvizi, A.; Askari, A. Influence of process parameters on residual stresses in deep-drawing process with FEM and experimental evaluations. J. Braz. Soc. Mech. Sci. Eng. 2018, 40, 157. [Google Scholar] [CrossRef]
- Prates, P.; Marques, A.E.; Oliveira, M.C.; Fernandes, J.V. Comparing metamodeling techniques for variability analysis in sheet metal forming processes. In AIP Conference Proceedings; AIP Publishing LLC: Coimbra, Portugal, 2019; p. 120003. [Google Scholar]
- Fischer, P.; Harsch, D.; Heingärtner, J. Influence of scattering material properties on the robustness of deep drawing processes. In Proceedings of the Forming Technology Forum 2017, Enschede, The Netherlands, 12–13 October 2017. [Google Scholar]
- Van-Tuan, D.; Labergère, C.; Lafon, P. Adaptive metamodel-assisted shape optimization for springback in metal forming processes. Int. J. Mater. Form. 2019, 12, 535–552. [Google Scholar]
- Banabic, D. Sheet Metal Forming Processes: Constitutive Modelling and Numerical Simulation; Springer Science & Business Media: Berlin/Heidelberg, Germany, 2010. [Google Scholar]
- Fischer, P.; Harsch, D.; Heingärtner, J. Approaches for control in deep drawing. In Proceedings of the Forming Technology Forum, Enschede, The Netherlands, 12–13 October 2017; pp. 12–13. [Google Scholar]
- Lophaven, S.N.; Nielsen, H.B.; Søndergaard, J. Dace A Matlab Kriging Toolbox Version 2.0, August 1, 2002; Imm Informatics and Mathematical Modelling; Technical University of Denmark DK-2800 Kgs: Lyngby, Denmark, 2002. [Google Scholar]
- Available online: https://www.autoform.com/en/ (accessed on 5 January 2021).
- Ling, D.; Williams, D.; Carleer, B.; Stippak, M. Systematic Process Improvement of Stamping Processes. In Key Engineering Materials; Trans Tech Publications Ltd: Dortmund, Germany, 2013; pp. 13–20. [Google Scholar]
- Koehler, J.R.; Owen, A.B. Computer Experiments; Handbook of Statistics; Ghosh, S., Rao, C.R., Eds.; Elsevier Science: New York, NY, USA, 1996. [Google Scholar]
- Bhaskar, P.; Sahoo, S.K. Optimization of Machining Process by Desirability Function Analysis (DFA): A Review. CVR J. Sci. Technol. 2020, 18, 138–143. [Google Scholar] [CrossRef]
- Neugebauer, R.; Hoffmann, M.; Roscher, H.; Scheffler, S.; Wolf, K. Control of sheet-metal forming processes with piezoactuators in smart structures. In Proceedings of the Smart Structures and Materials 2006: Industrial and Commercial Applications of Smart Structures Technologies, San Diego, CA, USA, 30 March 2006. [Google Scholar]
- Bräunlich, H. Blecheinzugsregelung Beim Tiefziehen Mit Niederhalter-ein Beitrag zur Erhöhung der Prozessstabilität; Verlag Wiss. Scripten: Chemnitz, Germany, 2002. [Google Scholar]
Figure 1.
Upper cross member B-Suv.
Figure 2.
(a) Hardening curve; (b) yield surface with BBC criterion; and (c) Formability Limit Curve (FLC).
Figure 3.
Scheme of adopted methodology.
Figure 4.
Tools geometry (die, punch and binder or blank holder).
Figure 5.
Critical Points A and B for the evaluation of thinning.
Figure 6.
Formability limit diagram (FLD).
Figure 7.
Formability map on component at the end of drawing phase.
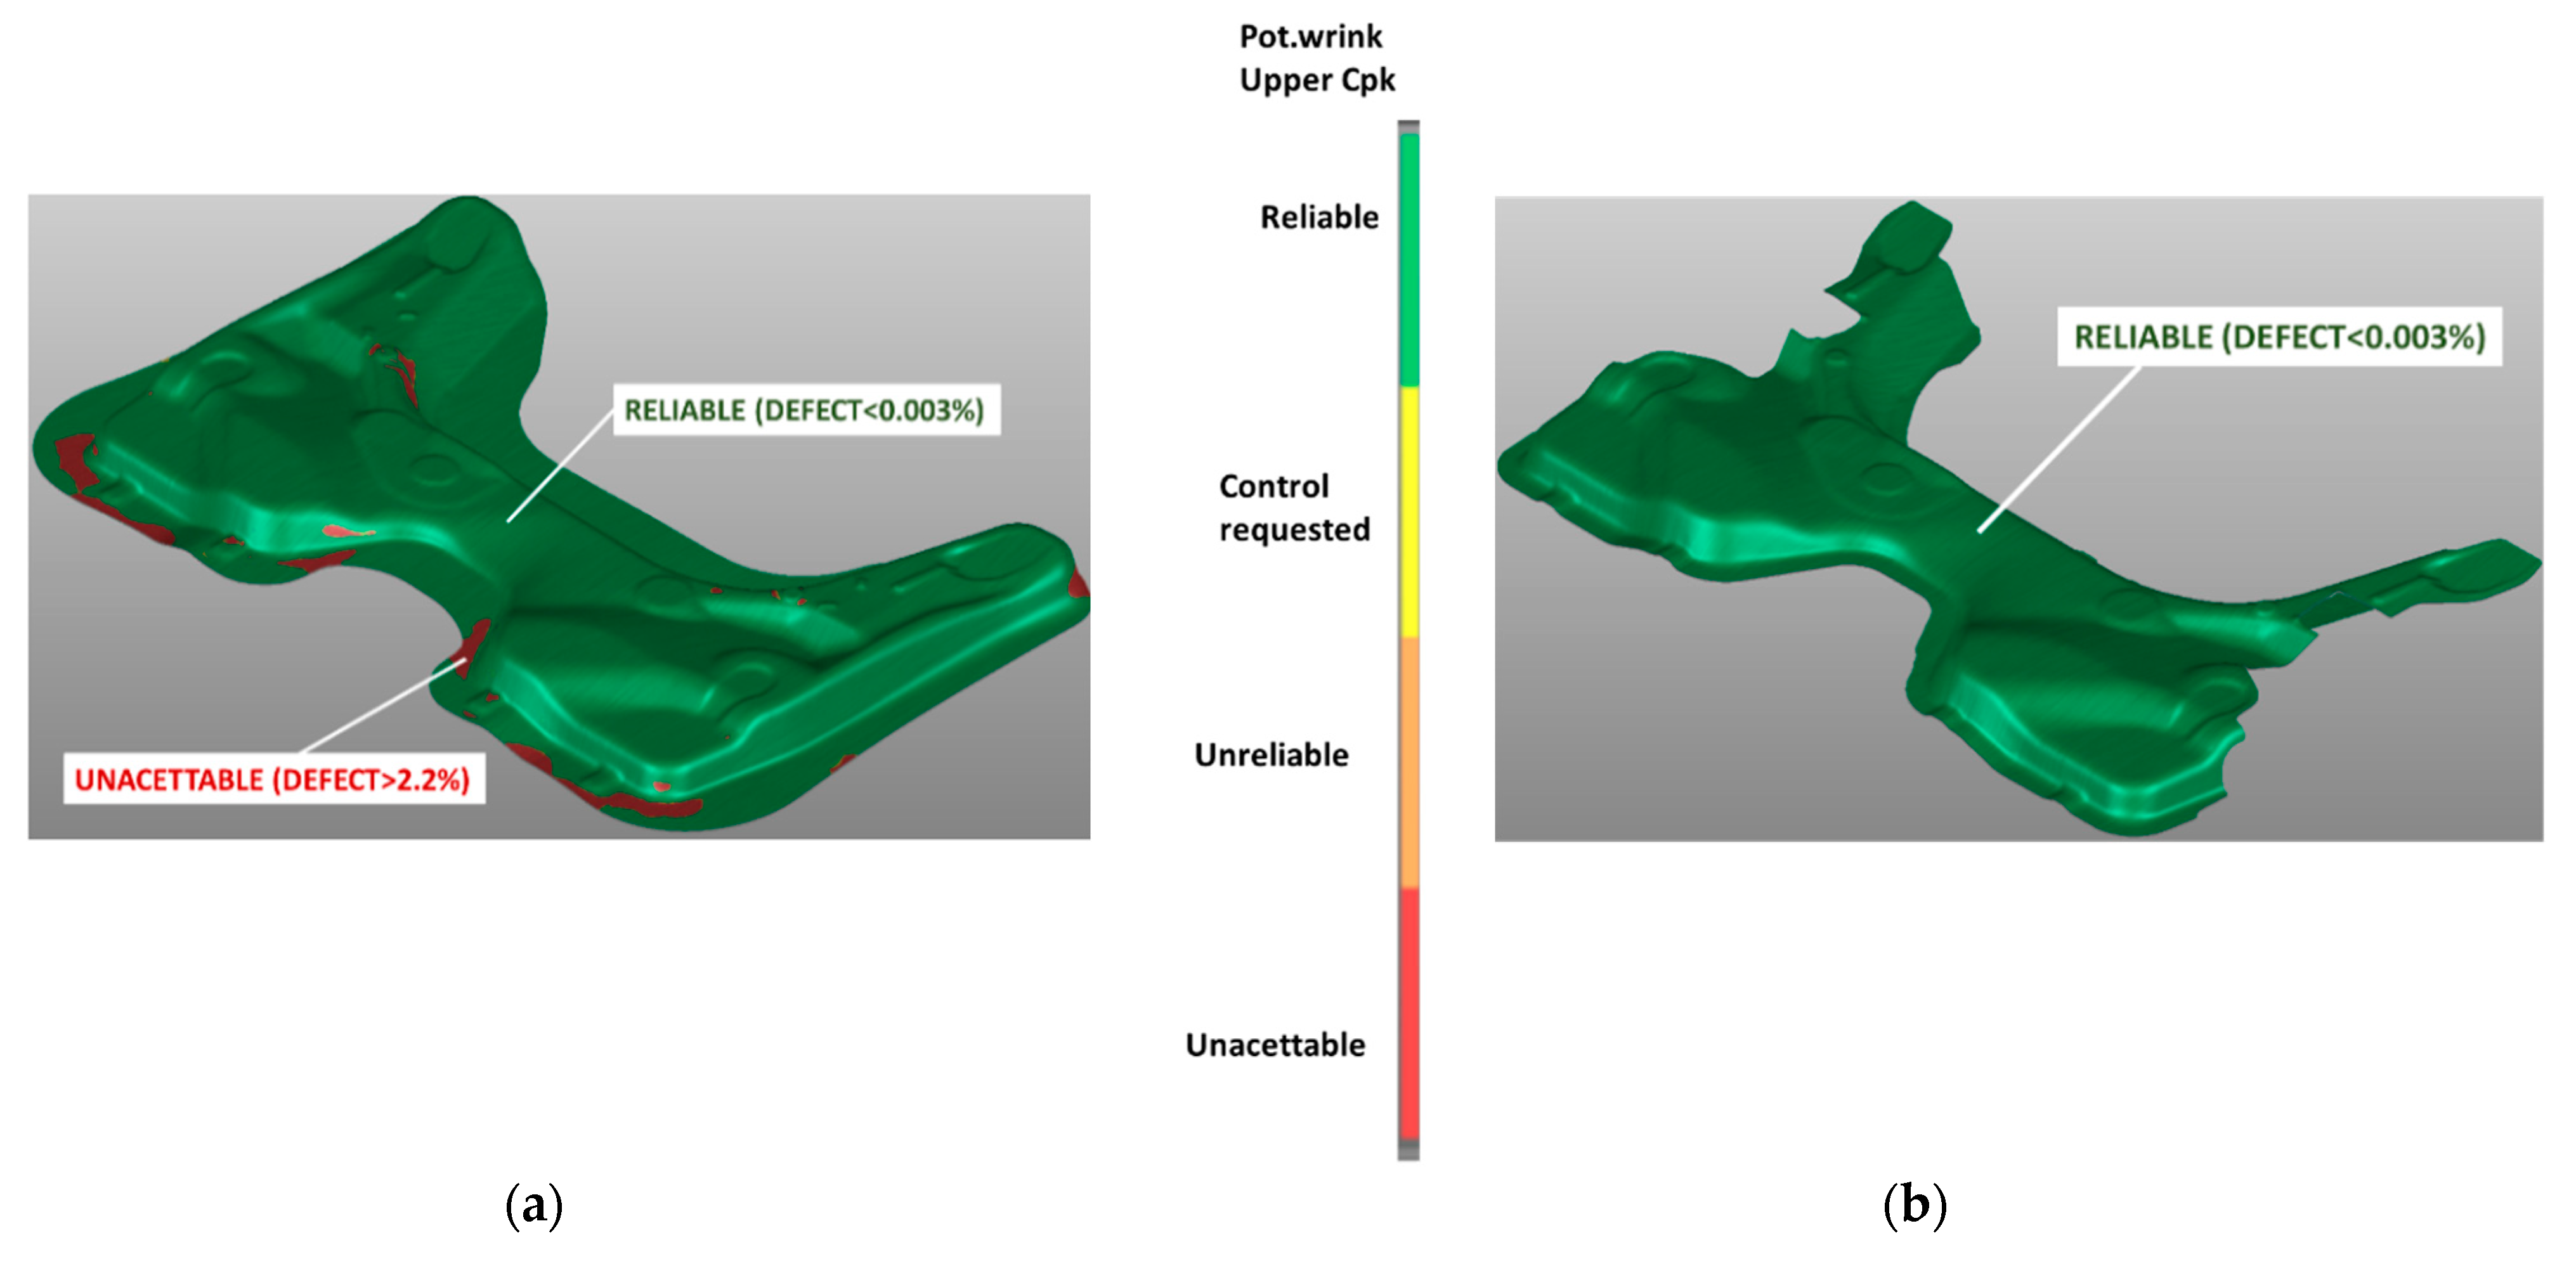
Figure 8.
(a) Upper for potential wrinkles after drawing phase; and (b) upper for potential wrinkles at the end of the process.
Figure 9.
Metamodel of the percentage of thickened zone as friction coefficient and yield stress vary.
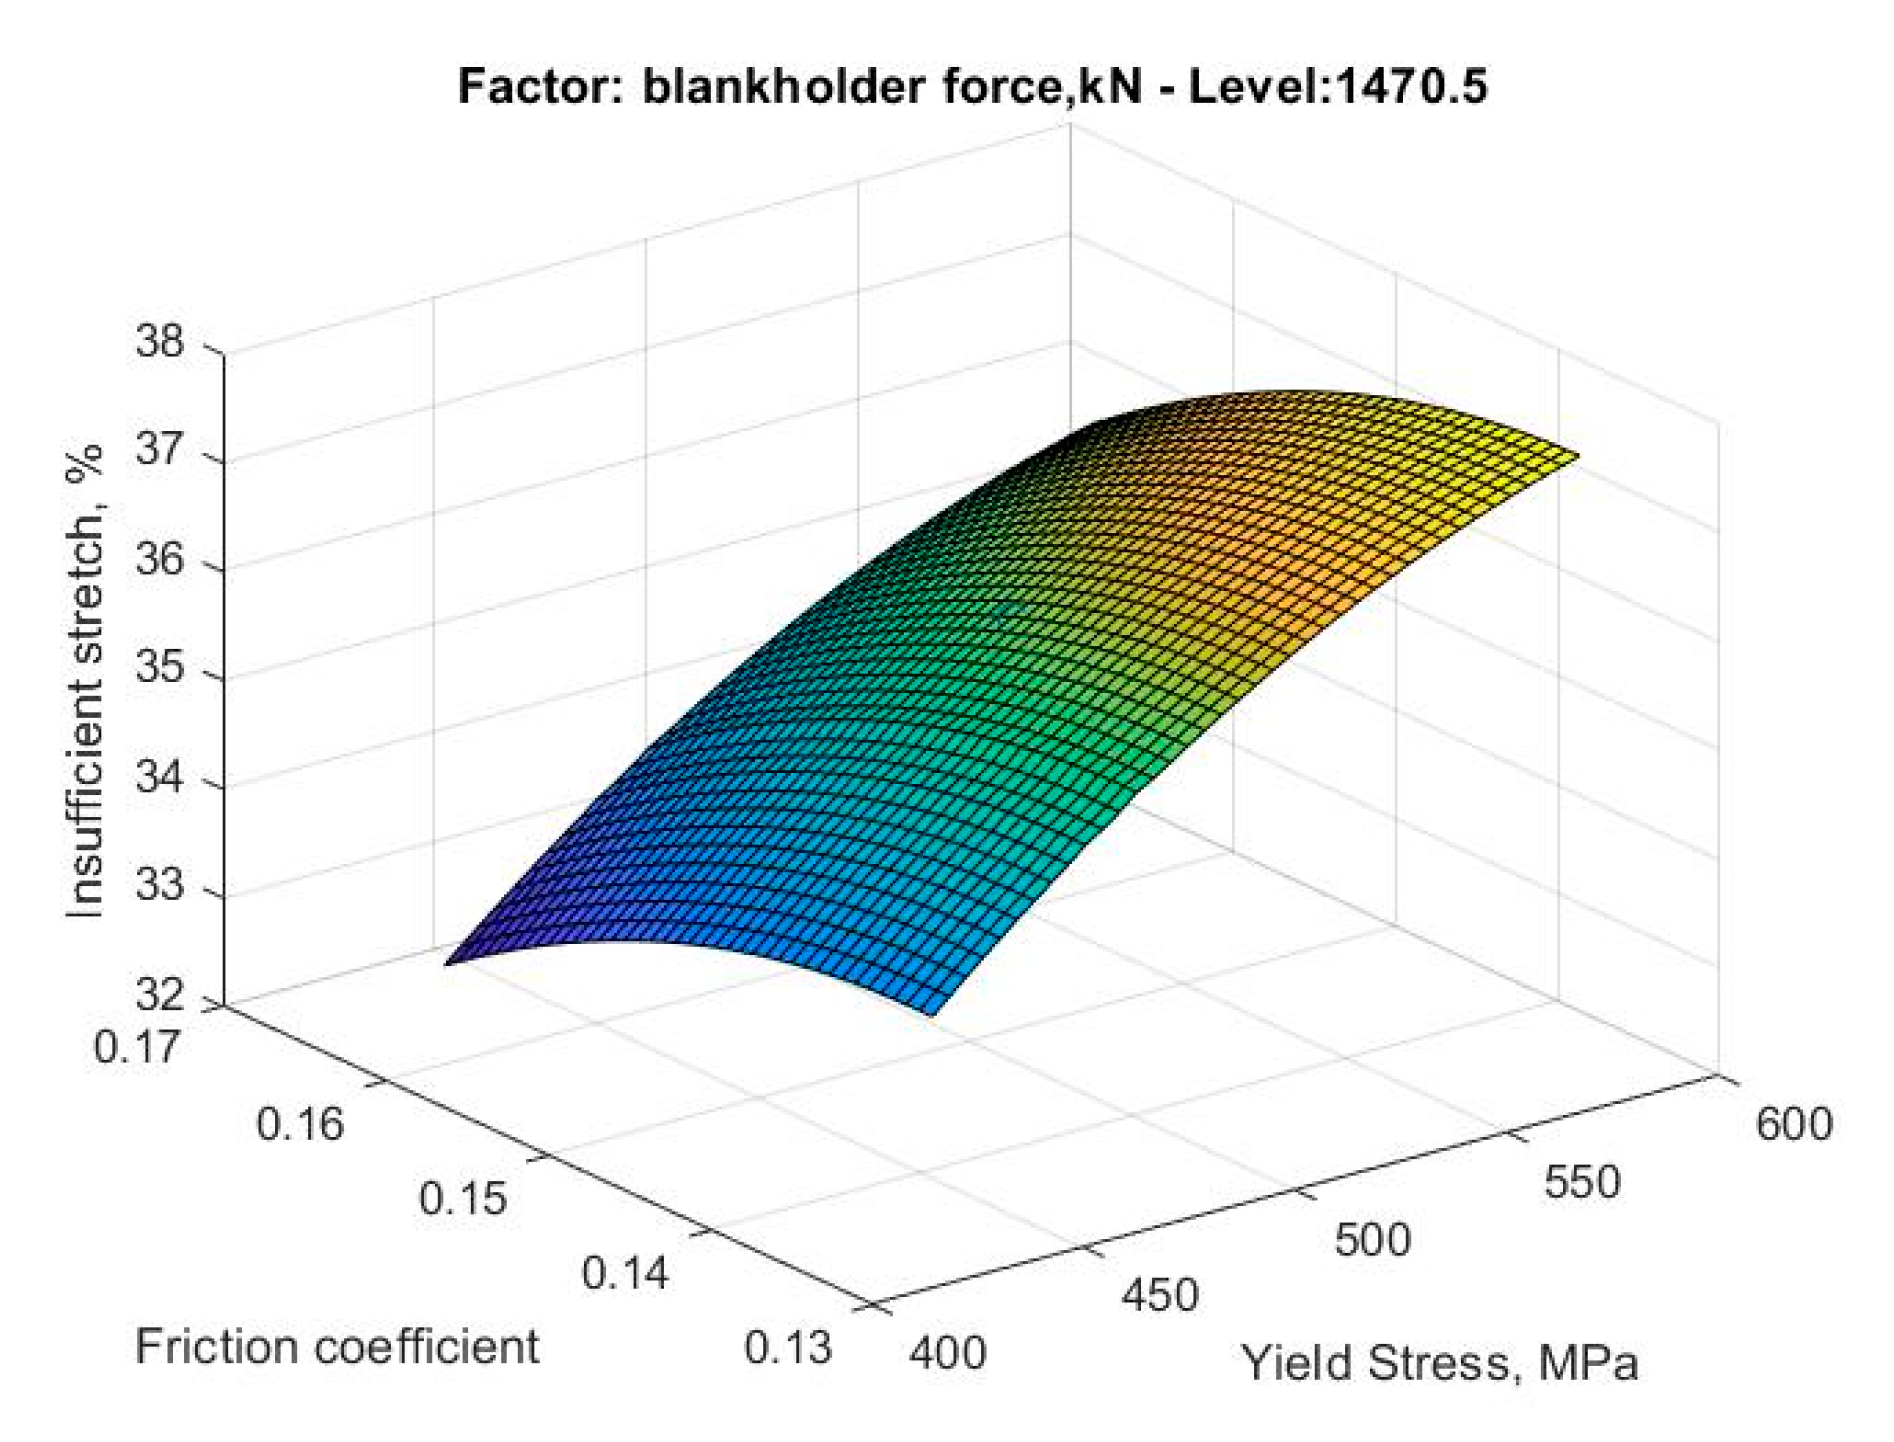
Figure 10.
Metamodel of the percentage of area with insufficient stretching as friction coefficient and yield stress vary.
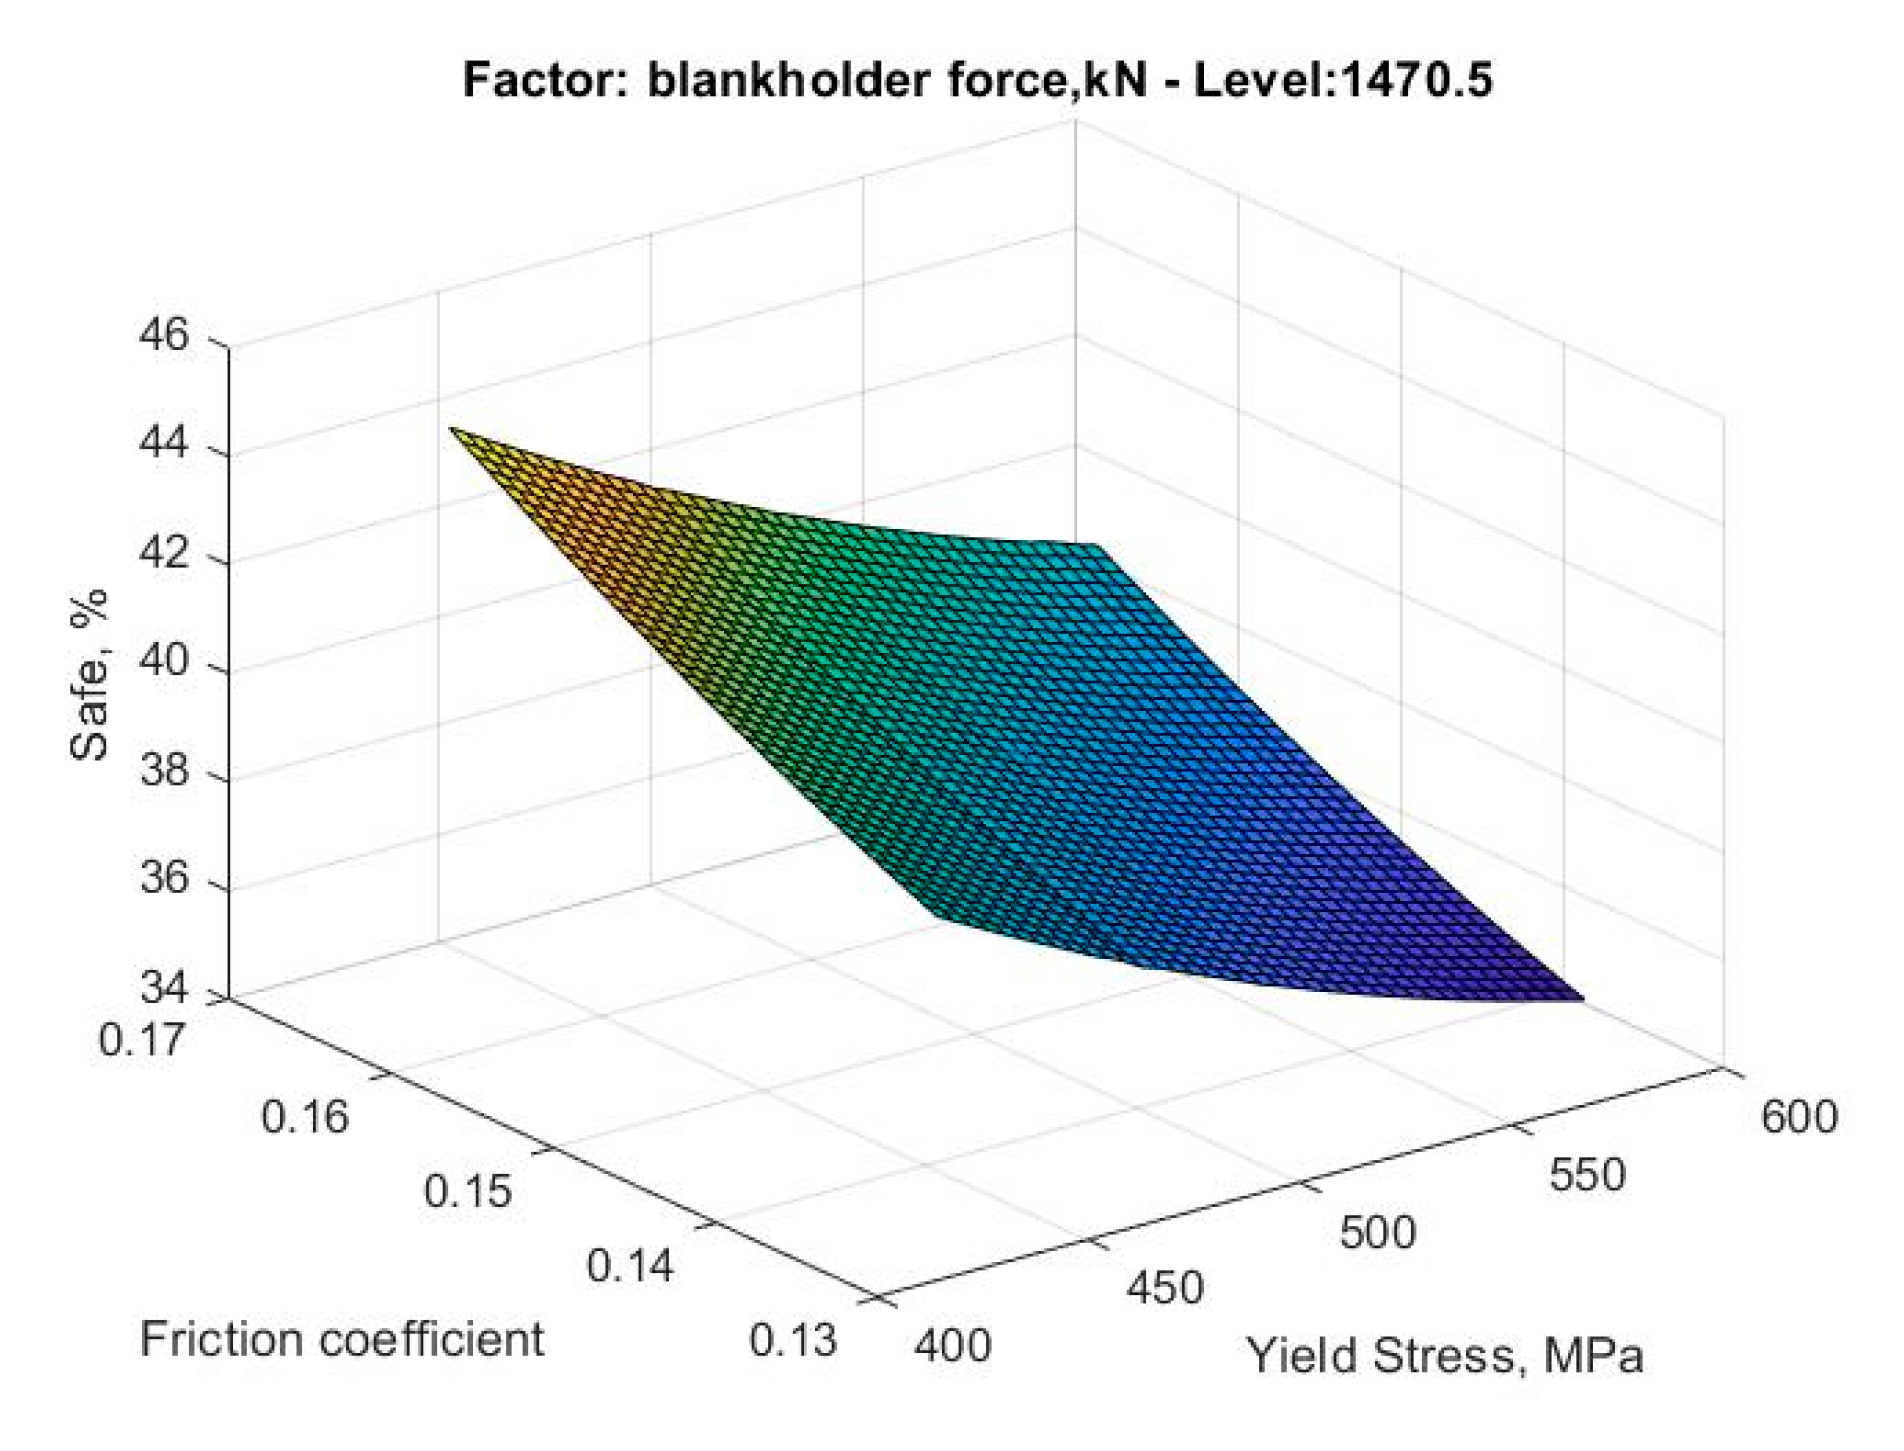
Figure 11.
Metamodel of the percentage of safe zone as friction coefficient and yield stress vary.
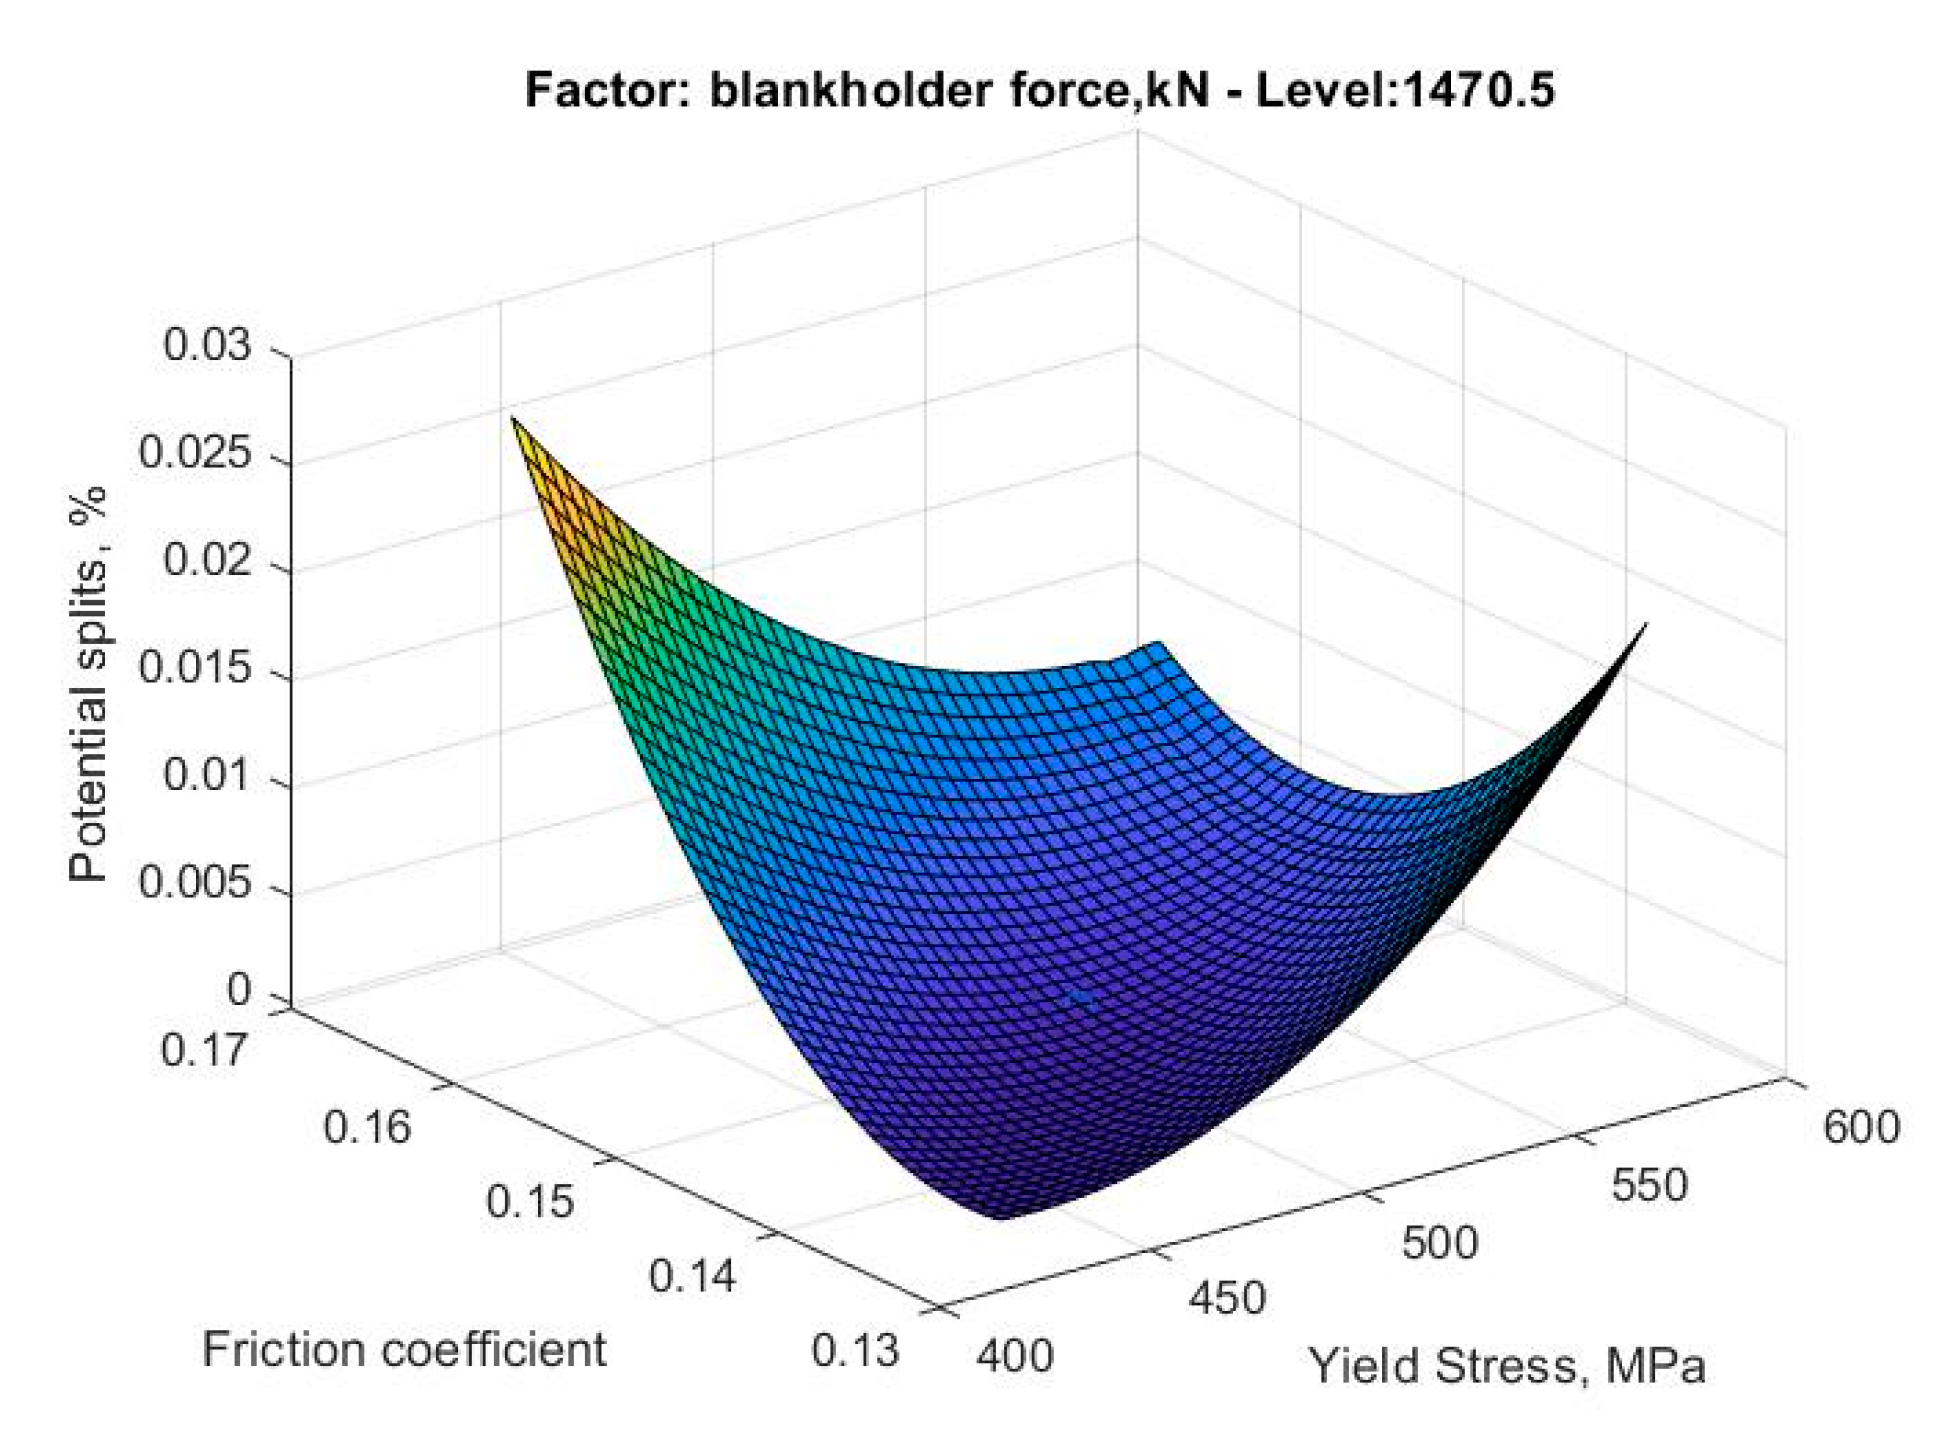
Figure 12.
Metamodel of the percentage of area with potential splits as friction coefficient and yield stress vary.
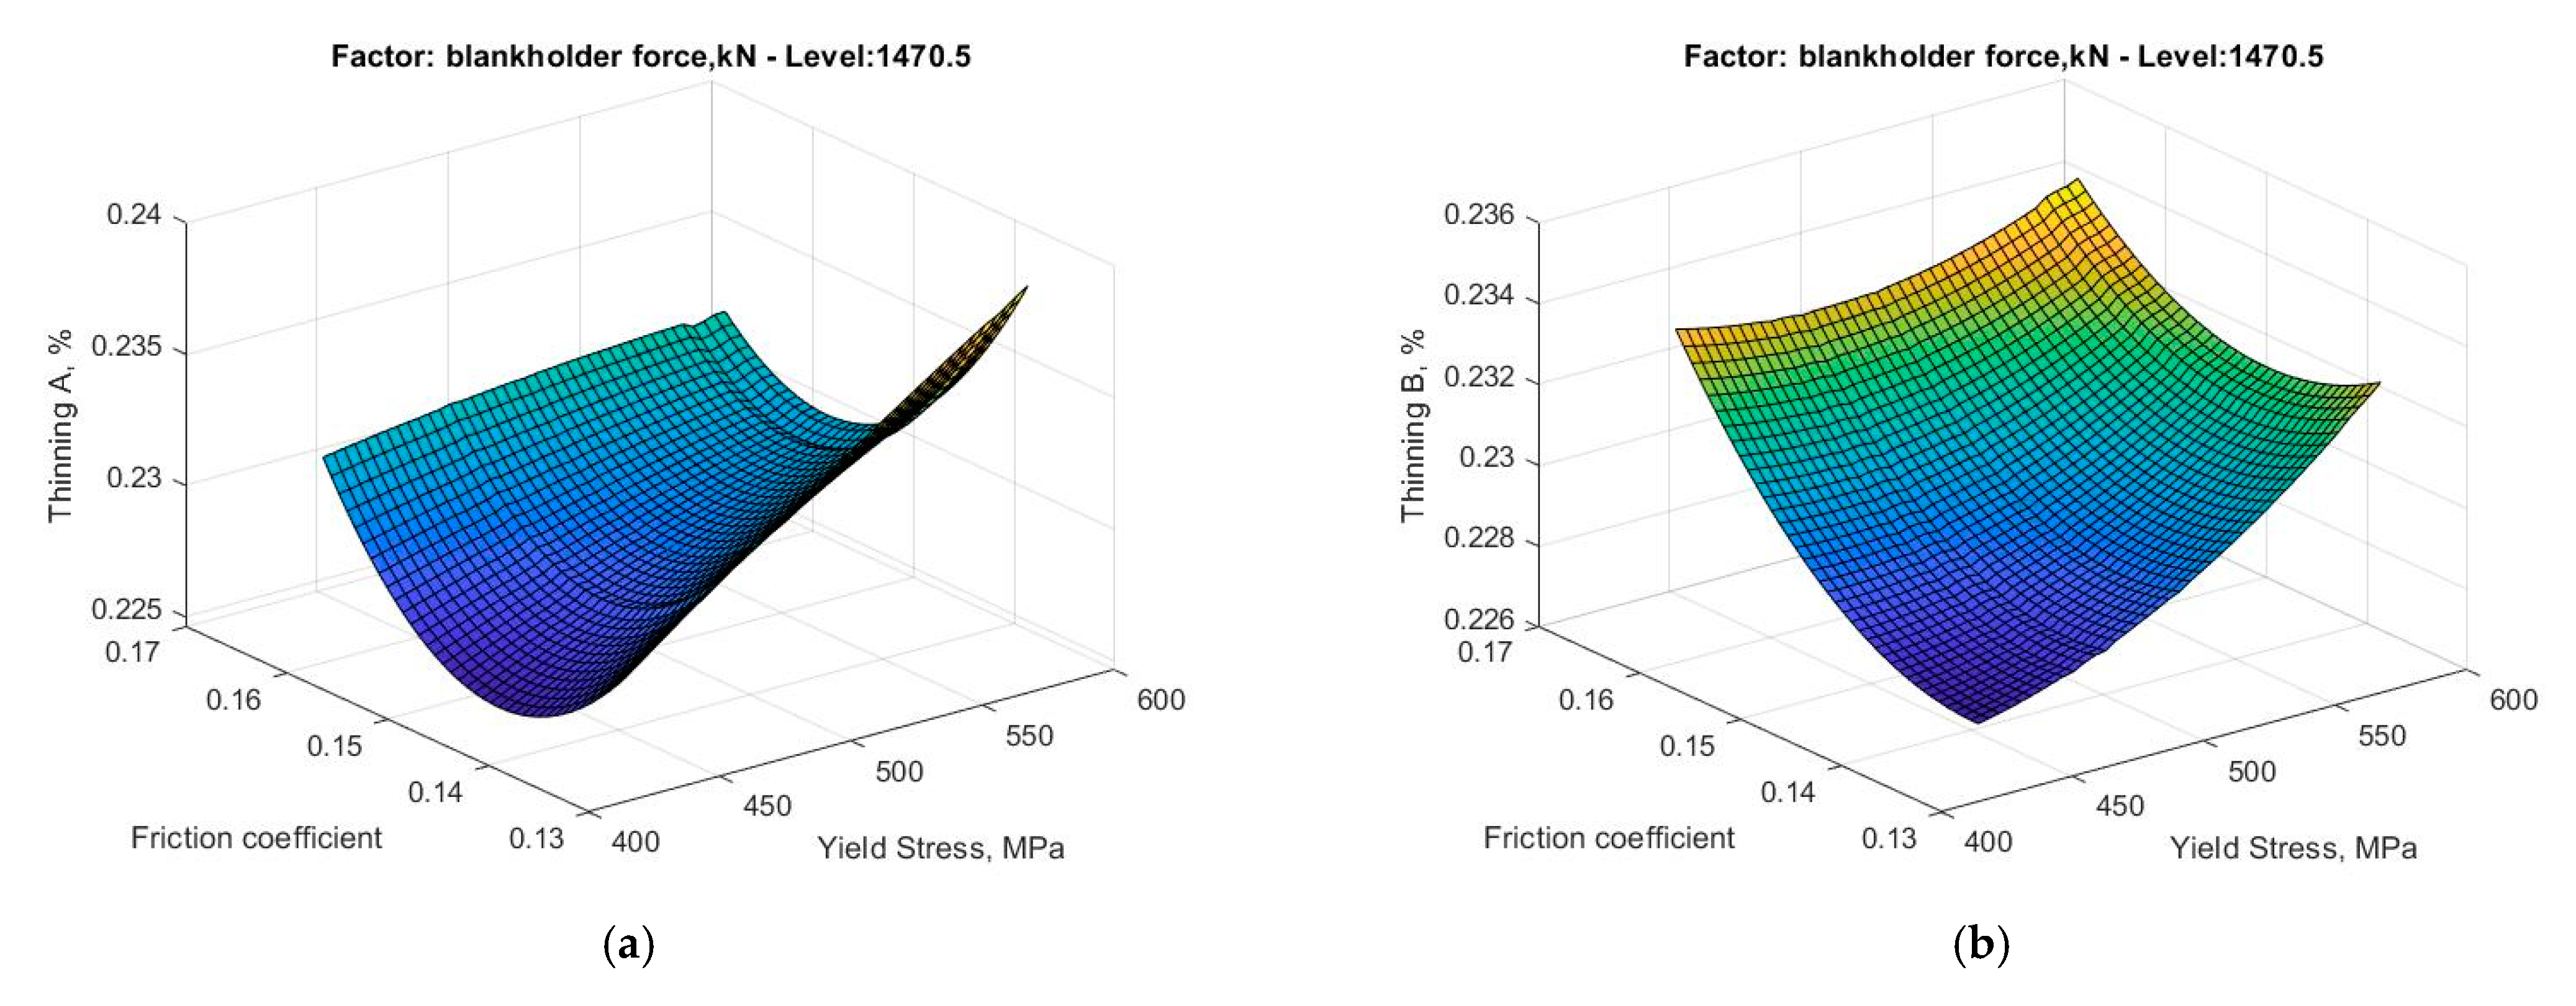
Figure 13.
(a) Metamodel of the percentage of thinning at Critical Point A as friction coefficient and yield stress vary; and (b) metamodel of the percentage of thinning at Critical Point B as friction coefficient and yield stress vary.
Figure 14.
Regulation and total desirability curves.
Figure 15.
Draw-in as a function of the punch stroke at Points D, F and I of the sheet in the optimized condition (safe) and in the non-optimal condition (cracks).
Table 1.
Chemical composition, heat analysis in mass%.
C
Max | Si
Max | Mn
Max | P
Max | S
Max | Al | Ti+Nb
Max | Cr+Mo
Max | B
Max | Cu
Max |
|---|
| 0.18 | 0.50 | 2 | 0.05 | 0.010 | 0.015–2 | 0.15 | 1 | 0.01 | 0.2 |
Table 2.
Notation for the definition of desirability functions.
| Symbol | Definition |
|---|
| ith response as a function of x parameter |
| ith desirability function correlated to the response parameter |
| Minimum ith value |
| Maximum ith value |
| Target ith value |
| s | Exponent that defines the shape of the function (s = 0.1 convex function) |
| D | Total desirability |
| k | Number of responses |
| Publisher’s Note: MDPI stays neutral with regard to jurisdictional claims in published maps and institutional affiliations. |
© 2021 by the authors. Licensee MDPI, Basel, Switzerland. This article is an open access article distributed under the terms and conditions of the Creative Commons Attribution (CC BY) license (http://creativecommons.org/licenses/by/4.0/).


