Article

A Study on Determining Weld Joint Hardening and a Quality Evaluation Algorithm for 9% Nickel Weld Joints Using the Dilution Ratio of the Base Material in Fiber Laser Welding

1
Southwestern Branch Institute, Research Institute of Medium & Small Shipbuilding, Yeongam 58457, Korea
2
Smart Manufacturing Process R&D Group, Korea Institute of Industrial Technology, Gwangju 61012, Korea
3
Industrial Application R&D Group, Welding Engineering R&D Department, Daewoo Shipbuilding & Marine Engineering Co., Ltd., Geoje-si 53302, Korea
*
Authors to whom correspondence should be addressed.
Submission received: 20 June 2021 / Revised: 3 August 2021 / Accepted: 16 August 2021 / Published: 18 August 2021
(This article belongs to the Special Issue Welding Metallurgy)

Abstract

:
The demand for LNG-powered ships and related equipment is rapidly increasing among major domestic and foreign carriers due to the strengthened IMO regulations on the sulfur content of ship fuel oil. LNG operation in a cryogenic environment requires a storage tank and fuel supply system that uses steel with excellent brittleness and fatigue strength. A ship using LNG is very sensitive to explosion and fire. For this reason, 9% Ni is often used, because ships require high quality products with special materials and structural technologies that ensure operability at cryogenic temperatures. However, research to derive uniform welding quality is urgent because the deterioration of weld quality in the 9% Ni steel welding process is caused by high process difficulty and differences in welding quality depending on a welder’s skill set. This study proposes a method to guarantee a uniform quality of 9% Ni steel in a fiber laser welding process by categorizing weld joint hardness according to the dilution ratio of a base material and establishing a standard for quantitative evaluation.

1. Introduction

The International Maritime Organization (IMO) has applied a high standard to the sulfur content of ship fuel oil since January 2020, and has finally confirmed a plan to reduce the sulfur content of ship fuel oil from its current level of 3.5% to 0.5% in 2020. The IMO 2020 standards are legislated in each country around the world and the regulations are voluntarily applied to designated emission control areas with more stringent standards than other sea waters. Major domestic and foreign carriers are complying with the IMO’s enhanced environmental regulations by considering the pros and cons of each alternative, such as installing a scrubber, using low-sulfur oil, or using LNG.
As eco-friendliness has become an international trend, a major energy transition is taking place around the world and the demand for liquefied natural gas (LNG) is increasing in the shipping sector as well. The bunkering industry, i.e., refueling LNG to LNG-powered ships, is also emerging worldwide. Equipment applied to an LNG propulsion ship can be broadly divided into the engine, fuel tank, fuel supply system, and fuel supply control system. A shipyard or a shipowner makes a packaged-type order, by which a tank or supply system can be directly installed onto a ship. However, a high-quality product with special materials and structural technologies for cryogenic operability is needed because operational disruption or anchoring due to equipment failure can cause serious economic damage [1,2,3,4].
An LNG storage tank is a cryogenic structure, and 9% Ni steel, which has excellent mechanical properties and fatigue strength at room temperature and in low temperature environments, is widely used as a material for the inner tank of an LNG storage tank. Nine percent Ni steel has excellent impact toughness and fatigue strength in a cryogenic environment, and it is used worldwide in the production of LNG storage tanks because of its low material price compared to steel density. When using 9% Ni steel, it is recommended that the absorption energy specified in domestic and foreign regulations should be 34 J or more at 196 °C, but there are slight differences depending on the standard applied. Although it was first developed in 1944 by INCO (International Nickel Co., Ltd.) in the United States, today Japan is leading the improvement of 9% Ni steel quality, developing welding technology and continuing research on safety as the trend moves towards larger-sized tanks [5,6].
The difficulty of the 9% Ni welding process is high and the welding quality differs depending on a welder’s skill set, because the welding wire has a lower melting point than the base material. Research is required to develop an advanced welding process technology and to derive uniform welding quality, because the more advanced countries that have already secured 9% Ni steel welding technology are keeping such technology confidential. Therefore, it is urgent to pursue basic research to analyze the deterioration of welding quality that may occur in the 9% Ni steel welding process and to derive uniform high-quality weld joints by identifying their root causes.
This study has focused on the specific welding method and a material, namely FLW and 9% nickel steel. For analyzing the welding quality, the hardness of upper welding part after welding which is known to be vulnerable to cracks because of weld joint hardening was defined for evaluation. The concept of weld joint hardening was used as an output variable for the determination of a formula for evaluating the welding quality and many parameters related to the welding process were used as input variables. By optimizing those input variables based on the determined formula and a multi-objective optimization algorithm, the improved welding qualities were obtained.
This study was related to previous research which evaluated weldability with solidification crack susceptibility [7] and used similar evaluation methods such as welding test optimization. However, this study focused differently on weld joint hardening as an evaluation method.
Naturally, our previous studies are similar to other past research [7]. Yun [8] performed an optimization of fillet laser welding for 9% Ni steel. Na [9] compared GTAW and FCAW for 9% Ni steel. Kim [10] designed an LNG-fueled ship with 9% Ni steel and evaluated welding performance. Watanabe [11] performed a double tension test of a surface notch of A553-1 steel. Liu et al. [12] performed a study to measure and analyze the fracture toughness of metals using machine learning models such as regression trees and neural networks.
In prior studies, the correlations between various variables and mechanical properties, as applied to the welding process of cryogenic steels such as the STS or Ni alloy series’, were reviewed, and the process issues and quality deterioration that occurred when thet were used in LNG-related equipment were also reviewed. However, research on the quality of the weld joints of cryogenic steel did not reflect the complex alternating effects, and most of the studies were about implementing automation, high melting, or high speed to compensate for the shortcomings of manual welding [13,14]. In addition, research on the correlation between bead shape and weldability was conducted in previous studies to improve welding quality by establishing key factors affecting the bead formation, but similar size areas and heat-affected zones were derived intermittently even from different welding process variables, so the applicability of the analysis and consideration as limited to bead shape is reduced in an actual site.
As such, an analysis with various perspectives is required to clearly distinguish the specific conditions that can produce a similar bead shape compared to the intermittent variables, and it is necessary to identify the phenomenon that causes the structure of a weld joint to be hardened by matching the characteristics generated from the correlation between the partially divided shapes within a weld joint to the dilution ratio of a weld joint.
In 9% Ni steel, a higher dilution ratio of the base material results in lower strength. Therefore, excessive dilution of the base material should be avoided in order to secure the required strength. Although prior studies on the relationship between the dilution ratio and strength have found that the tensile strength does not change significantly even when there is a 10–20% change in the dilution ratio, it was reported that it may be lower than the API standard of 363 MPa due to the hardening of a weld joint if it is 25% or more [15,16].
Therefore, in this study, the dilution ratio formed in a weld joint was calculated for the fiber laser welding process applied to 9% Ni, a cryogenic steel, and the phenomenon in which a hardened weld joint is created compared to the heat-affected zone was identified in a procedure based on the calculated dilution ratio. Accordingly, this study tried to suggest a method of quantitatively evaluating the quality of a weld joint.

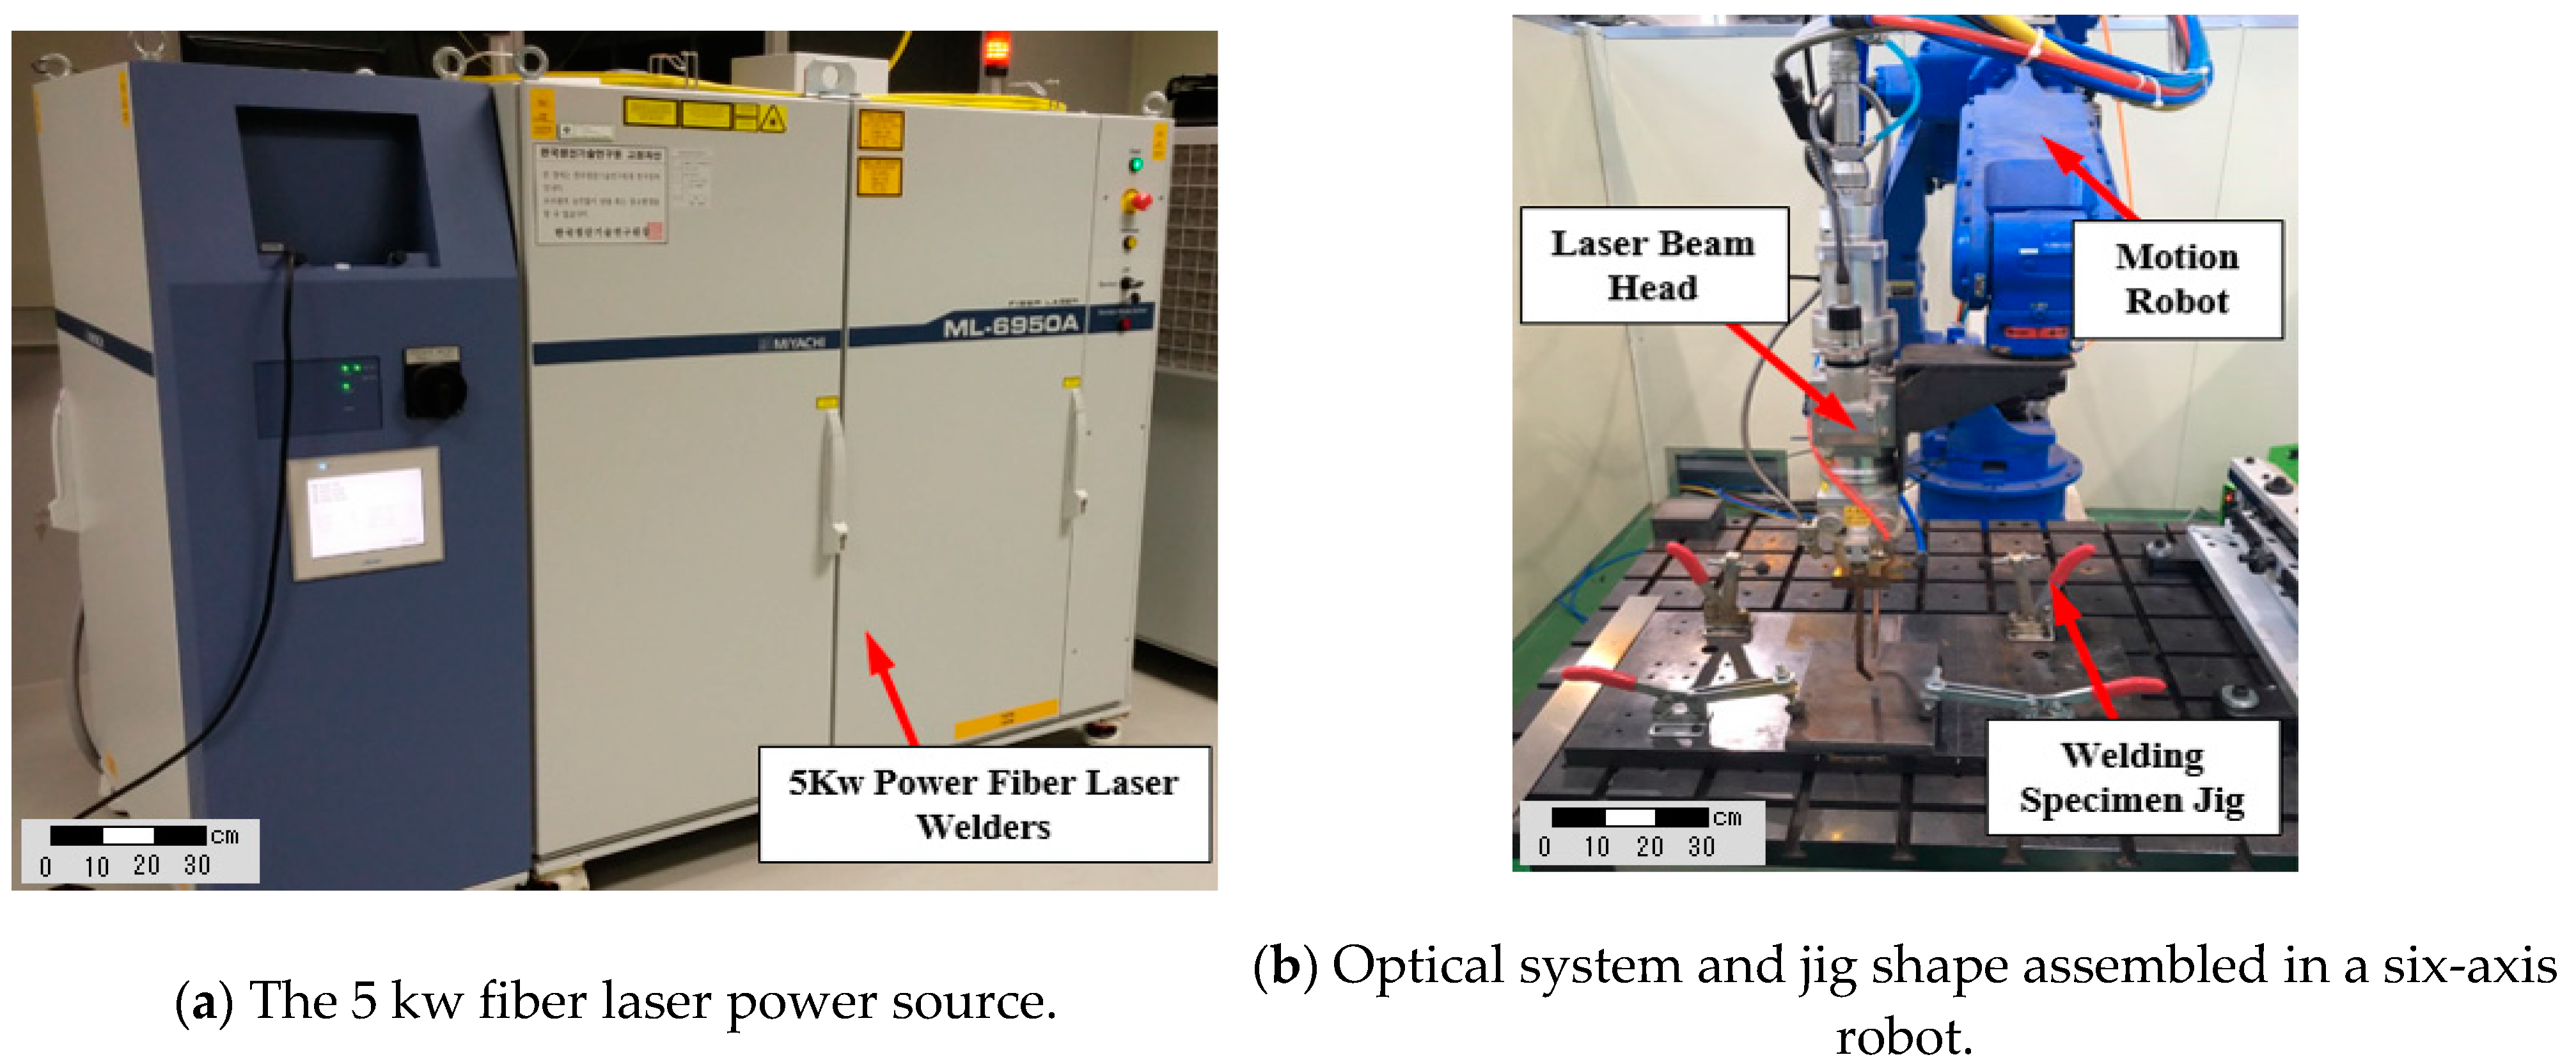
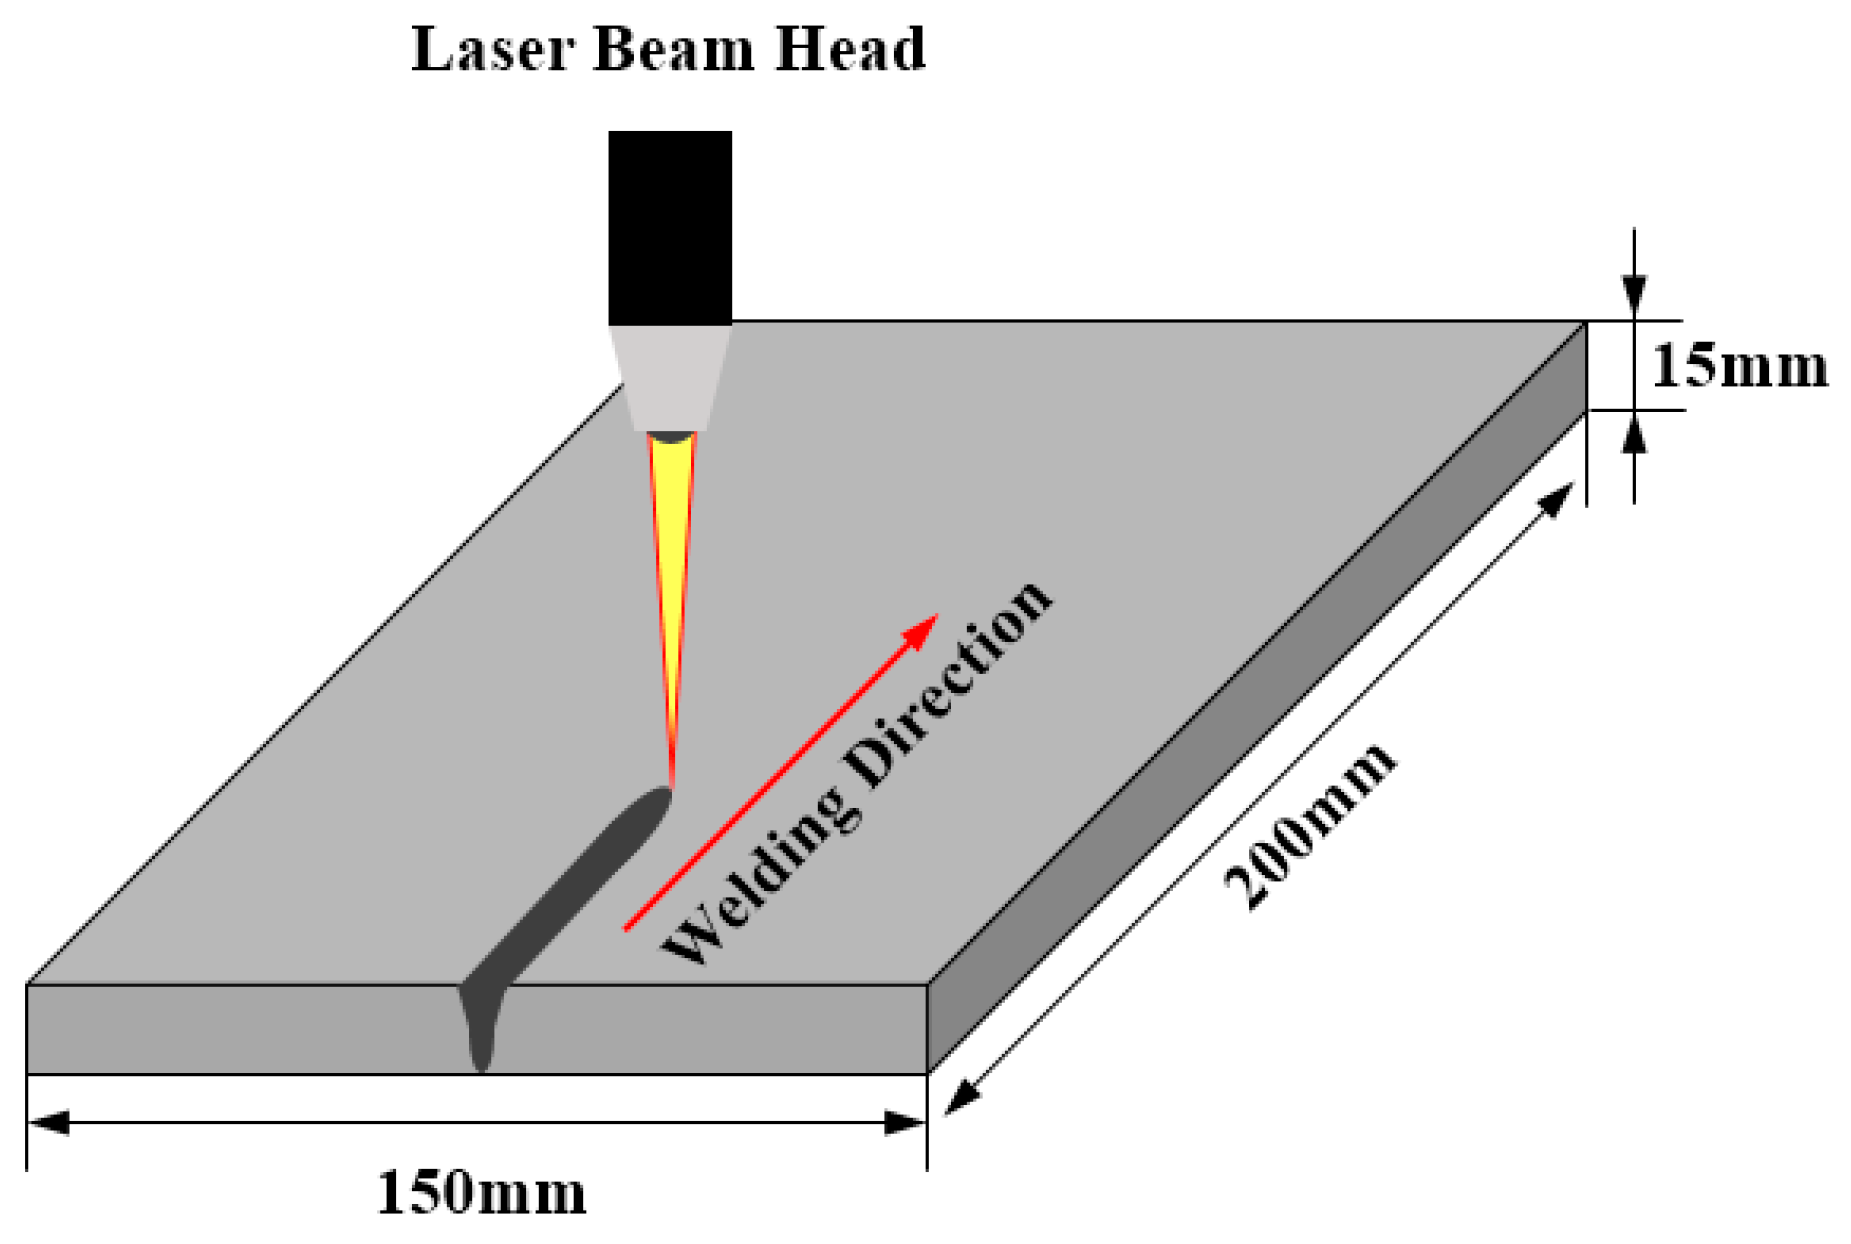
2. Experimental Works

The experiment was performed to determine the quality of a fiber laser weld joint of 9% Ni steel and to develop the optimal process parameters. A MIYACHI ML-6950A model (Amada Weld Tech Co. Ltd., Chiba, Japan) 5 kW fiber laser welding machine was used, and a YASKAWA’s DX100 model (Yaskawa Electric Co., Kitakyushu, Japan) MOTOMAN was used to configure the entire system, as shown in Figure 1.
The test piece used in the welding test was used in a size of 150 mm (W) × 200 mm (H) × 15 mm (H) of 9% Ni steel. The specimen was cleaned with ethyl alcohol and sandpaper to prevent foreign substances such as rust, scale, oxide, etc. from causing welding defects on the surface of a specimen to be welded. The schematic diagram of a fiber laser welding process is shown in Figure 2. The chemical composition and mechanical properties of 9% Ni steel are shown in Table 1 and Table 2, respectively.
Laser power, defocusing, and welding speed were selected as input variables because the fiber laser welding process applied in this experiment welds by generating a keyhole while delivering the high energy required for welding to the material surface. Weldability was analyzed by collecting mechanical properties such as the heat-affected zone and weld joint hardness [11]. Figure 3 shows a schematic diagram for the measurement of the penetration shape of the weld joint [17].
In this experiment, it is possible to estimate all the factor effects for the response of an output variable according to the change of an input variable, and the full factorial placement method (FFD) was applied to detect the correlation effect of higher orders. Full factorial design is a general Kn factorial design DOE with n factors and k levels, and experiments are designed at the combination of all factor levels. Therefore, Kn experiments should be performed even without repeated experiments. FFD forms a cube diagram of the experimental points in case of 3 factors and 2 levels, and the factor experiment by the factor arrangement method has the advantage that all factor effects can be estimated. The level and range of input variables (laser power, defocusing, welding speed) were chosen through preliminary experiments. A total of 18 experimental conditions were designed from 32 × 2 (3 laser powers, 3 defocusing and 2 welding speeds). Table 3 and Table 4 show the experimental variables, levels of the input variables, and the experimental conditions for a total of 18 trials, respectively.

3. Results

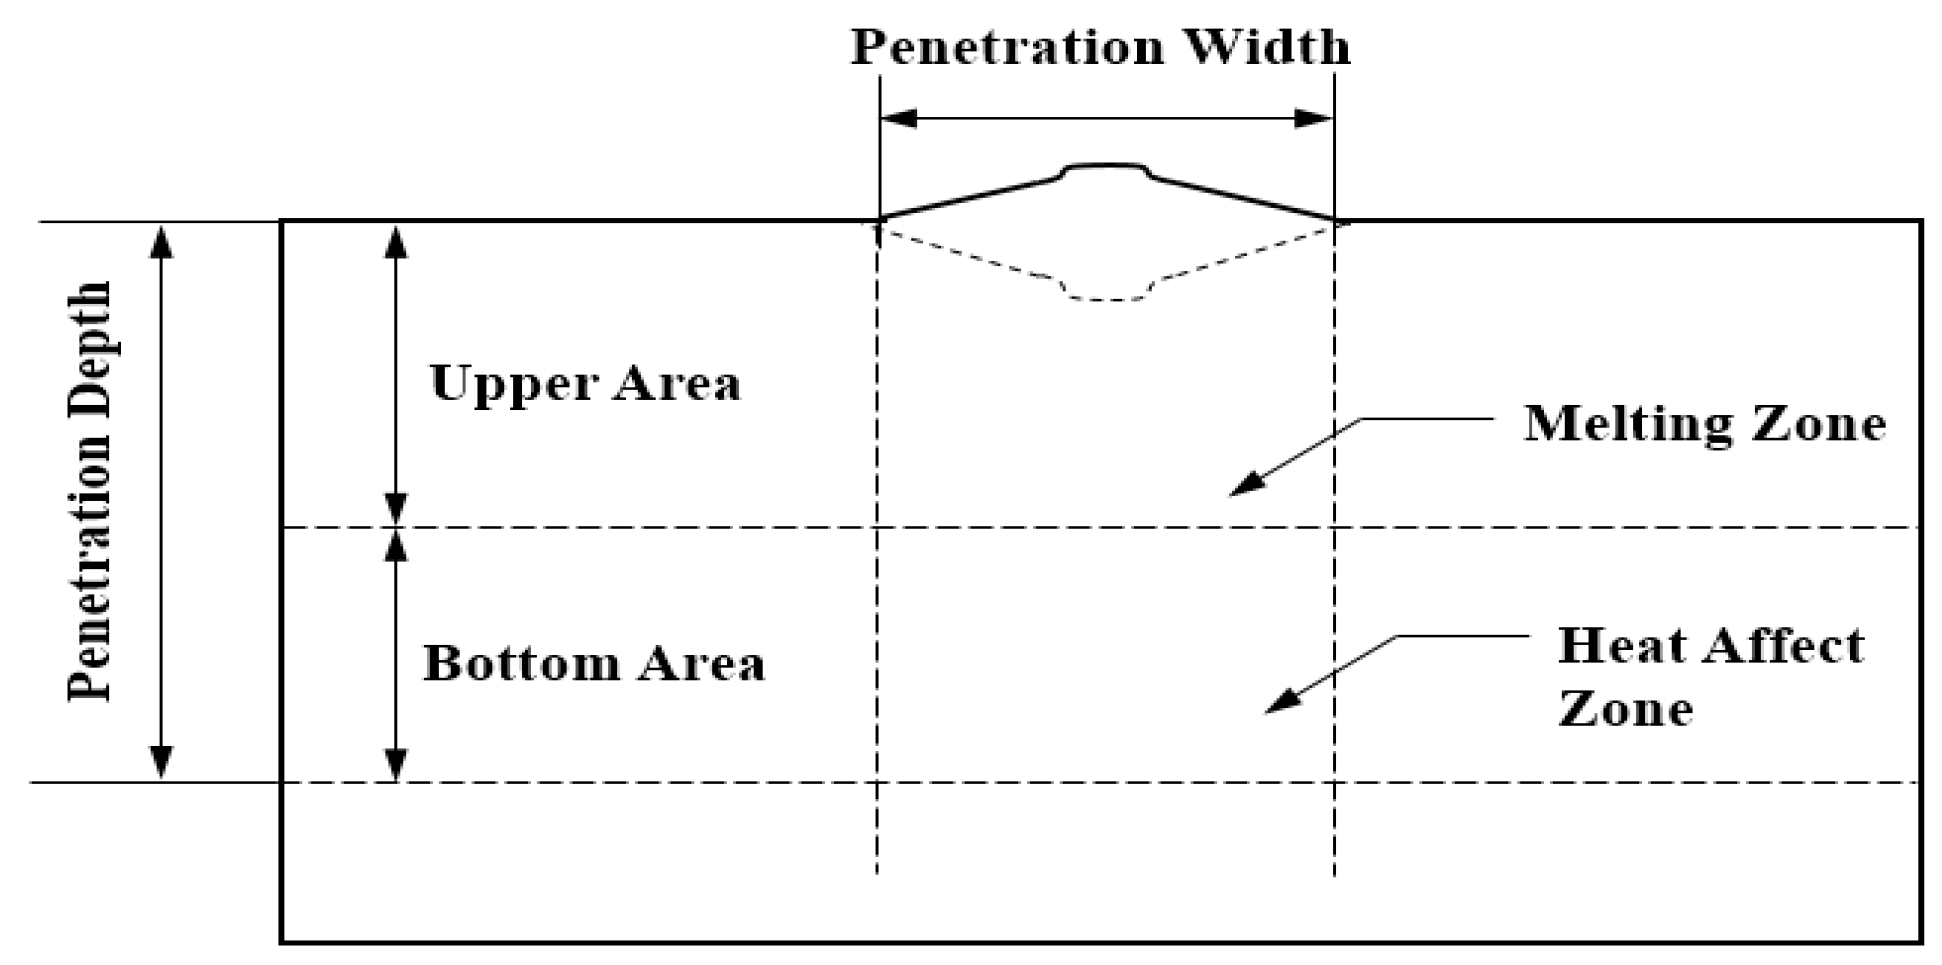
3.1. Penetration Geometry

The BOP fiber laser welding of 9% Ni steel, a cryogenic steel, was performed correctly according to the welding process parameters. Based on the result of the experiment, it was confirmed that good penetration was formed in general, and there were no pores or defects in appearance. To properly represent the cross-sectional appearance of a specimen, a 90% ethanol plus 10% nitric solution was mixed and used to etch the cross-section. An optical microscope system was used to measure the penetration shape accurately. Table 5 shows the welding cross-section and penetration measurement results taken with a 10× optical microscope.

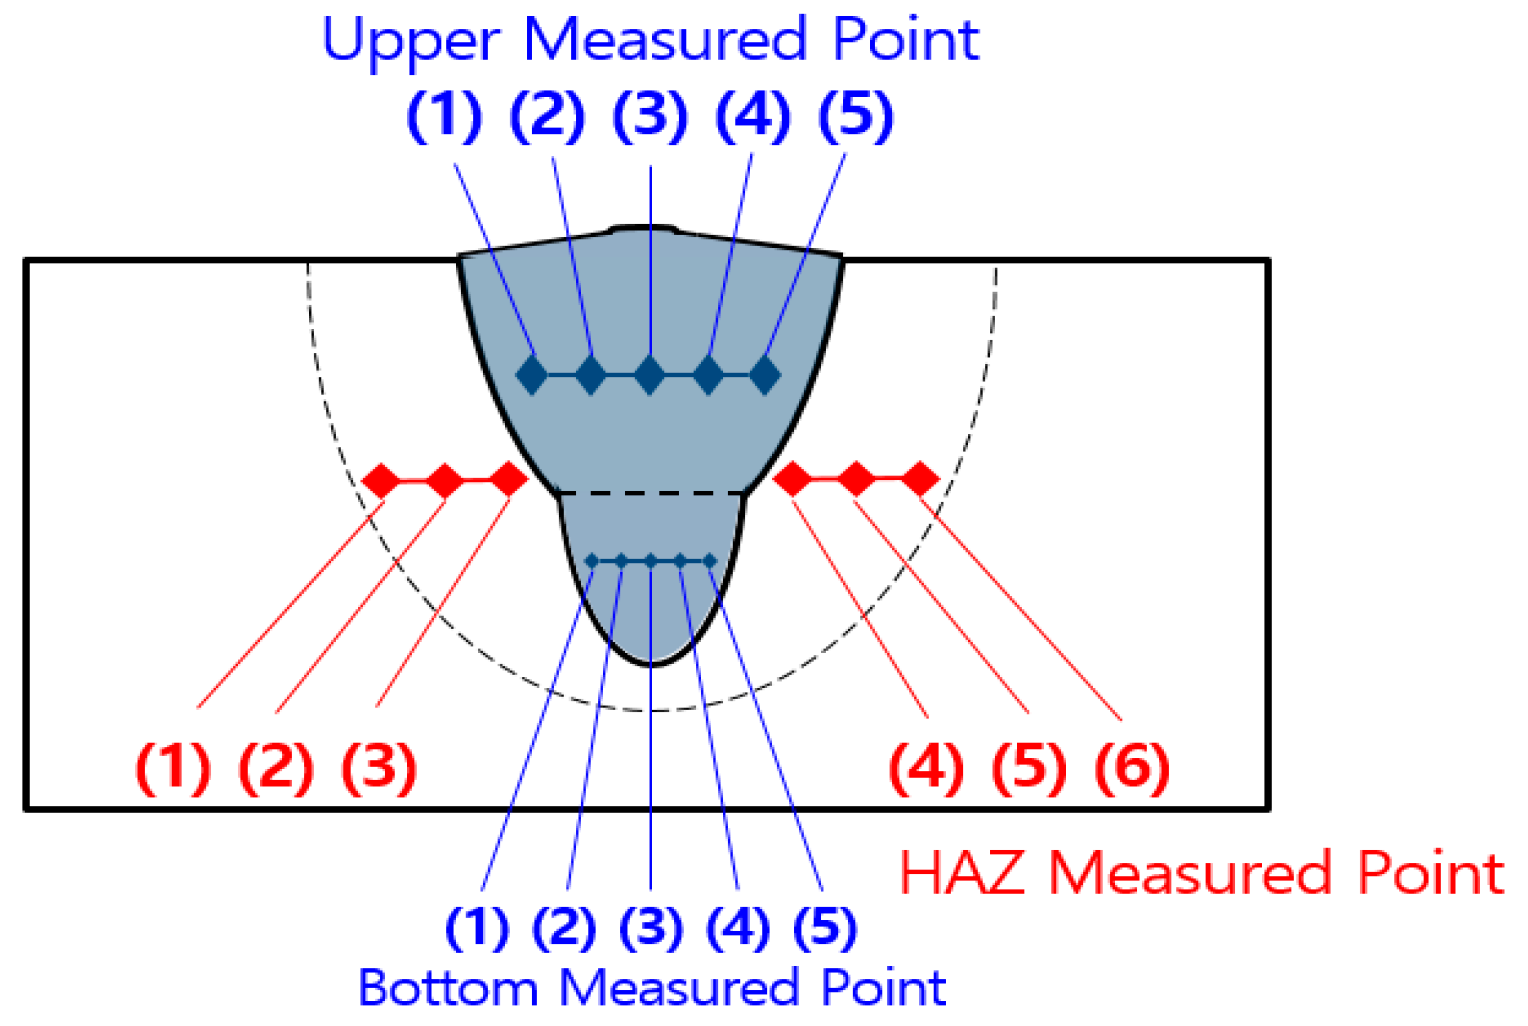
3.2. Weld Joint Hardness

A hardness test was performed to confirm the phenomenon of weld joint hardening caused by the change of internal strength and structure due to the difference in energy density of a laser keyhole when the fiber laser weld joint was solidified. For the hardness test, the Vickers hardness test was performed on the upper and lower parts and the heat-affected zone, where the change in internal strength occurs. The load used in the hardness test was 0.5 N and analysis was performed at 0.83 mm intervals so as not to affect the nearby hardness. The 6-point positions for measuring the hardness of the HAZ were used as the left and right positions divided into thirds between each boundary of the penetration, the HAZ, and the base material. The 243 HV value shown in Table 2 was used as the reference base material data to determine the hardness of the fiber laser welding. Figure 4 shows a schematic diagram of the hardness test for the weld joint of 9% Ni steel. Table 6 shows the results of the hardness test of the upper and lower parts of a weld joint and the heat-affected zone. The hardness test result means the average value measured at 5 points. The hardness (lower part) of a fiber laser weld joint has a value between 339.4 HV and 358.1 HV, which is higher than the 243 HV hardness that is standard for 9% Ni steel. Therefore, it is judged that sufficient weldability was obtained.

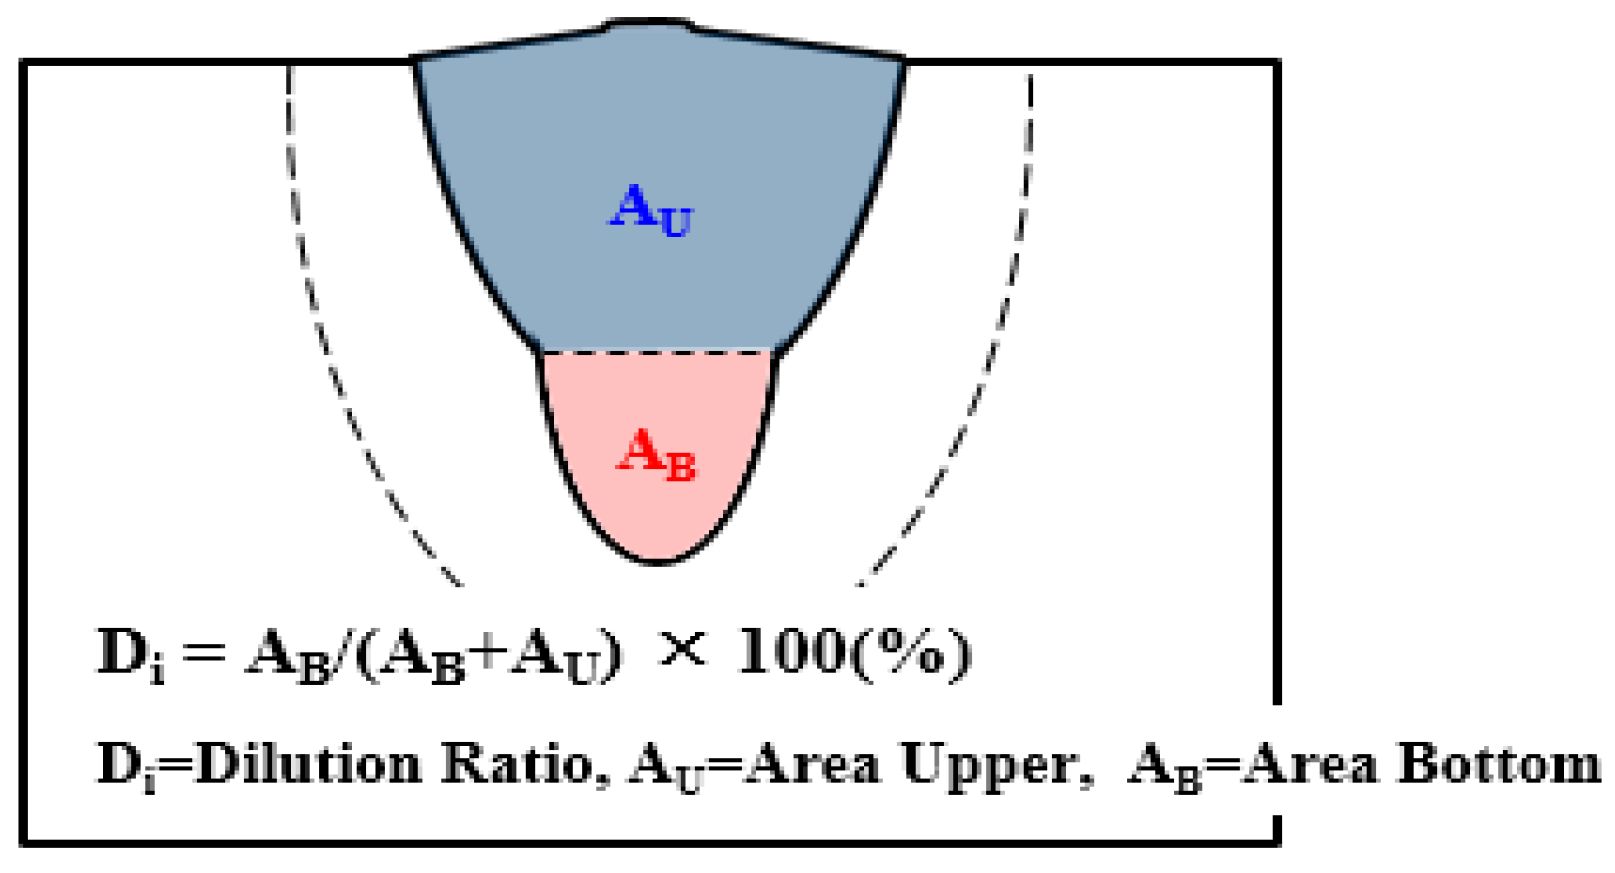
3.3. Measurement of Weld Joint Dilution Ratio

Since the shape of weld joint penetration in a fiber laser welding process differs according to beam shape and energy density due to the power and defocusing, there is a high possibility of hardening due to changes in the chemical composition and internal strength of the weld joint. In the fiber laser welding process, a special welding process in which a welding wire is not consumed, the dilution ratio can be defined as the area of the upper and lower parts divided by the keyhole and laser diameters. Figure 5 shows a schematic diagram of the method used to calculate the weld joint dilution ratio of a fiber laser welding process, and Figure 6 shows a picture of the calculation of a weld joint dilution ratio using the area analysis tool in a system using an optical microscope. Table 7 shows the dilution ratio of the weld joint area according to the fiber laser welding process parameters.

4. Discriminant of Quality Characteristics of 9% Ni Steel

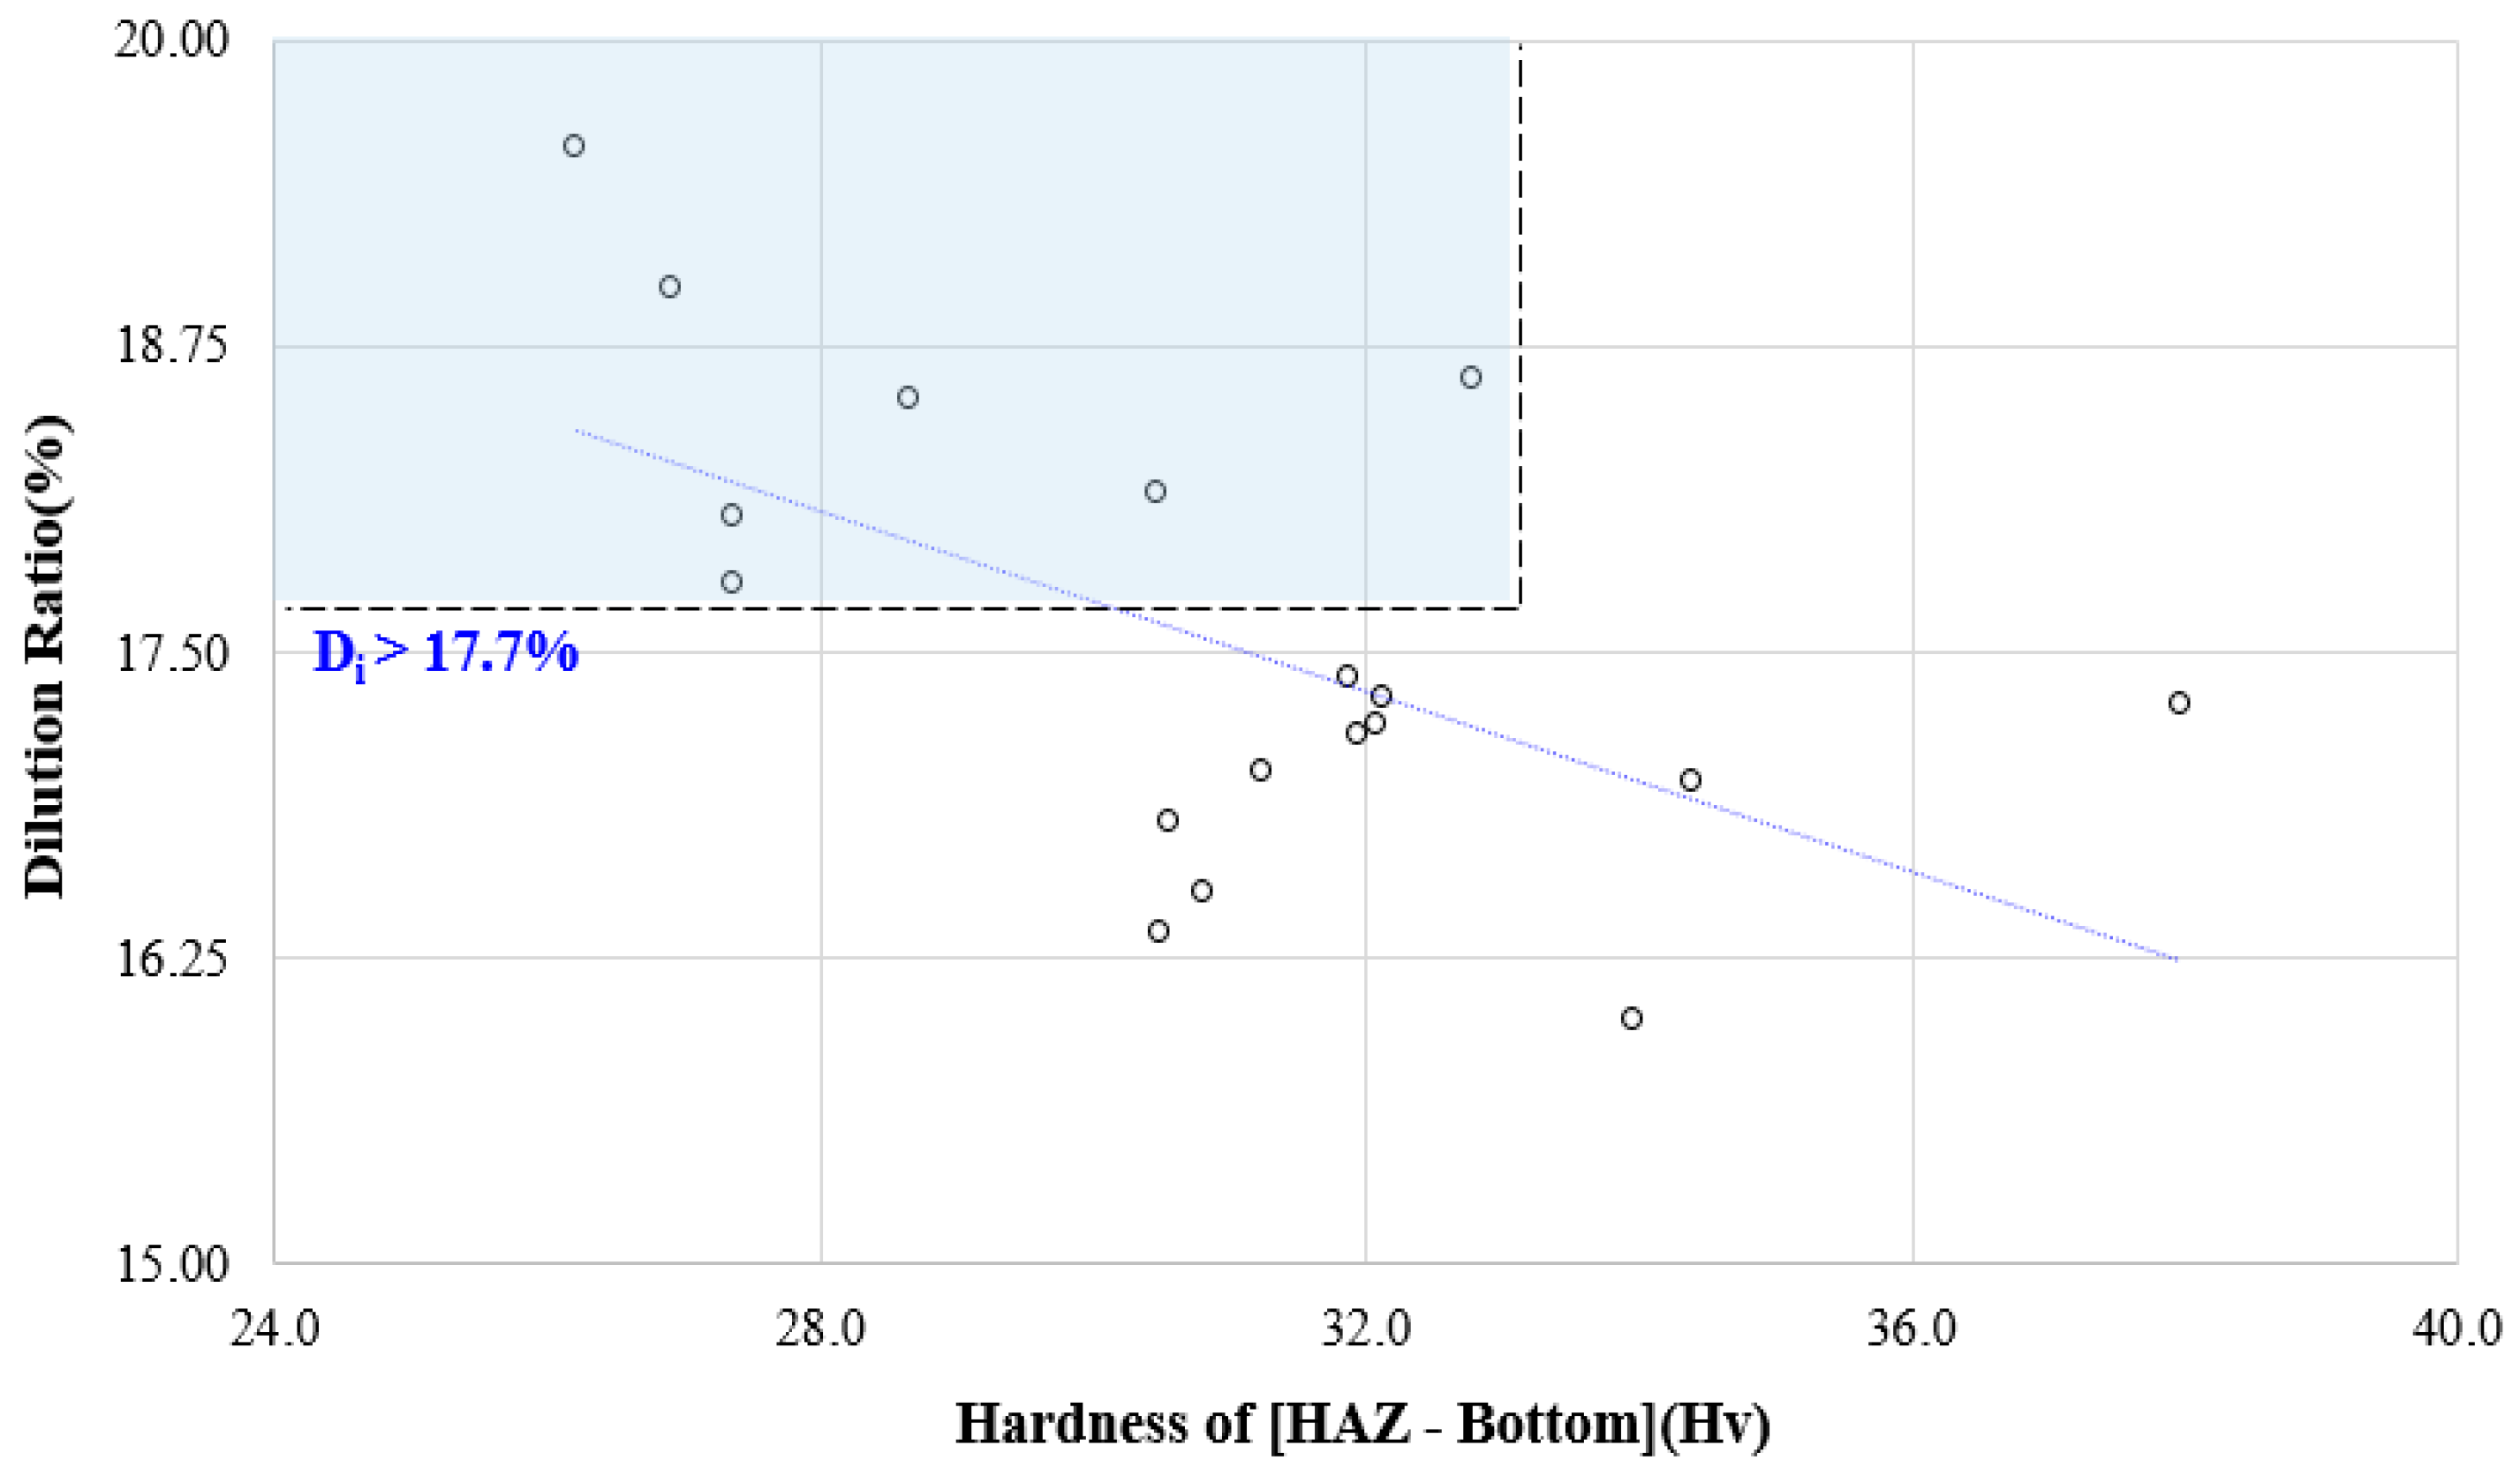
4.1. Weld Joint Hardening according to Dilution Ratio

In 9% Ni steel, a higher dilution ratio of the base material causes a lower strength. Therefore, excessive dilution of a base material should be avoided to secure the required strength. Although the prior studies on the relationship between dilution ratio and strength have found that the tensile strength does not change significantly even when there is a 10–20% change in dilution ratio, it was reported that it may be lower than the API standard of 363 MPa due to the hardening of the weld joint if the dilution ratio is 25% or more [15,16]. In addition, even under different welding conditions, the level of hardening of the heat-affected zones is similar when the amount of heat input is the same. However, the electromagnetic force and the energy density of the beam are different, so the effect on bead formation is different. This leads to the disadvantage of the increased hardness of a weld joint compared to the heat-affected zone. To address the shortcomings of prior studies that established the characteristics of a welding process limited to the bead shape as described above, the correlation between the concepts of dilution and the strength of the weld joint was established.
Since the shape of the weld penetration in the fiber laser welding process differs from the beam shape and energy density due to the laser power and defocusing, the possibility of hardening due to changes in the chemical composition and proof strength of the weld is very high. Therefore, although it is different from the method of calculating the area of the welded part analyzed in the general flux-cored arc welding process, the characteristics of the welded part that are changed by the welding current, arc voltage, welding wire, etc. are considered similarly to those of fiber laser welding. Therefore, in this study, the dilution rate was defined as the upper and lower division areas by the keyhole and the laser diameter by confirming that it is possible to analyze the strength reduction characteristics for the dilution rate even in fiber laser welding.
Therefore, in this section, the dilution ratio formed in a weld joint is calculated for each welding process and process variable and a standard for the generation of a weld joint hardness compared to the heat-affected zone is established. According to the calculated dilution ratio, to set up a stable weld joint dilution ratio standard.
To analyze the correlation of hardness based on a dilution ratio that changes according to the penetration shape, a standard for hardening or scattering of the lower weld joint compared to the heat-affected zone was established. The difference and trend between the measured hardness of the heat-affected zone and the hardness of the lower weld joint were used to establish a standard dilution ratio that can avoid the hardening of a weld joint, as shown in Figure 7. As a result, the degree of hardness (difference between the hardness of the heat-affected zone and the hardness of the lower weld joint) of a fiber laser weld joint was found to be between 26.2 HV and 38.0 HV, and the difference in hardness of a weld joint was confirmed to be 26.2 HV or lower compared to the heat-affected zone when the dilution ratio of penetration was determined to be 17.7% or more. It was confirmed that the difference in hardness compared to the heat affected zone did not rise as the dilution ratio was increased. It is judged that this kind of hardening of a weld joint will make it difficult to secure quality against the brittle effect and durability.
The standard 17.7% dilution ratio confirmed above is a standardized score, and can be used as an evaluation index for the process. When a high score is calculated, it means that a hardened structure of a weld joint was created. Therefore, the criteria for determining the hardening of a weld joint can be defined as shown in Table 8. These standardized scores can be later applied as learning data to determine the increase in weld joint hardness and brittleness according to the penetration shape and dilution ratio, in part to prevent the generation of a hardened structure and deterioration of weld joint strength due to energy density of a 9% Ni steel weld joint in which this welding process was applied.

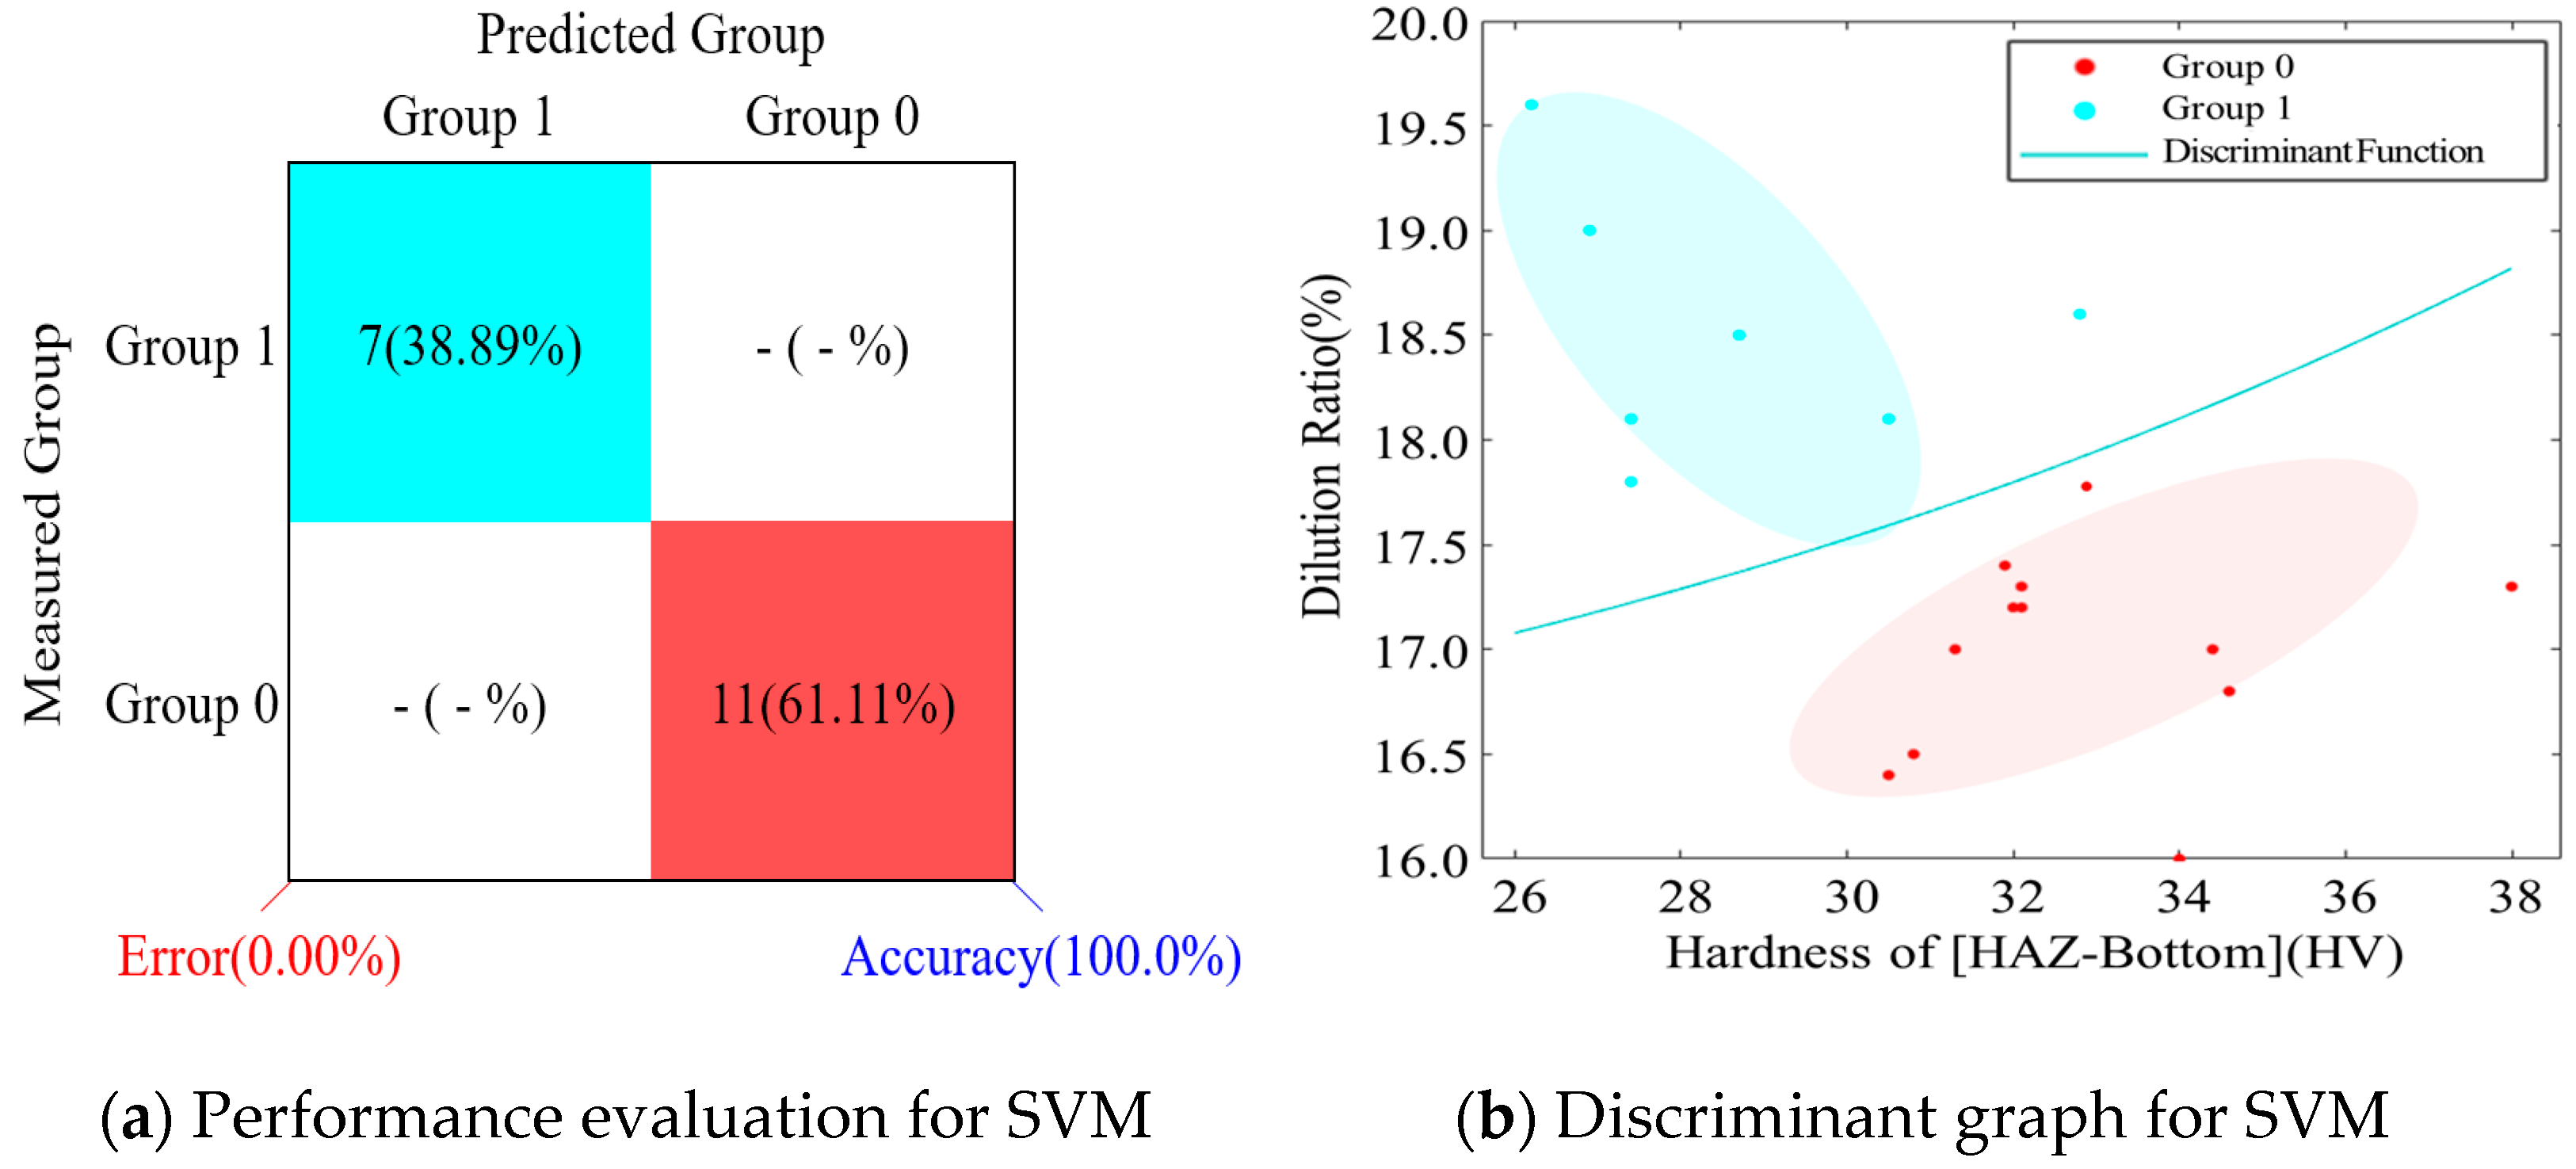
4.2. Discriminant Analysis

The system to determine the weld joint hardening in the fiber laser welding process of 9% Ni steel is a technique used to determine the affiliation of the input data by making a model using the collected data and entering it into developed group learning data [18,19,20].
For the weld joint hardening system developed in this study, a discriminant model was developed using the SVM (support vector machine) technique. Unlike neural networks, SVM is not a principle of minimizing the existing empirical risk, but an approximate implementation that minimizes the structural risk. It is difficult to generalize and it is easy to overfit the model to minimize the empirical risk used in the existing artificial neural network. On the other hand, SVM minimizes the upper limit of the expected risk by minimizing the structural risk, unlike minimizing the empirical risk that minimizes the error on the training data. In other words, the method of minimizing structural risk is based on a test error term whose range is determined by the sum of learning error ratios and a term dependent on the VC-dimension of the learning machine. By minimizing the sum of these two terms, it is possible to obtain better classification performance than the conventional pattern discriminant. In the problem of finding the hyperplane that maximizes margin in the two classes, where linear discrimination is possible based on the VC (Vapnik–Chervonenkis) theory and Equation (1), this study tried to determine the possibility of hardening of a weld joint in process [21].
w·x + b = 0
where w is the weight vector, x is the input vector, and b is the reference value, and the SVM technique described above sequentially performs minimization of complex calculations in the QP (quadratic programming) process. The variables for learning in the weld joint hardening discrimination model are welding process variables (laser power, defocusing, welding speed), penetration shape (penetration width, penetration depth), upper and bottom hardness, heat affected zone hardness (HAZ hardness) and the dilution ratio. One hundred and eighty data points were entered with 10 multiple variables. For the groups to determine the hardening of a weld joint, the Regard Group was defined as 1 and the Regardless Group was defined as 0, to confirm the discrimination performance predicted by the SVM technique.
Table 9 shows the learning data to discriminate the hardening of a weld joint and Table 10 and Figure 8 quantitatively show the group discrimination performance predicted by the data learned through the SVM technique.

5. Optimization of Fiber Laser Welding of 9% Ni Steel

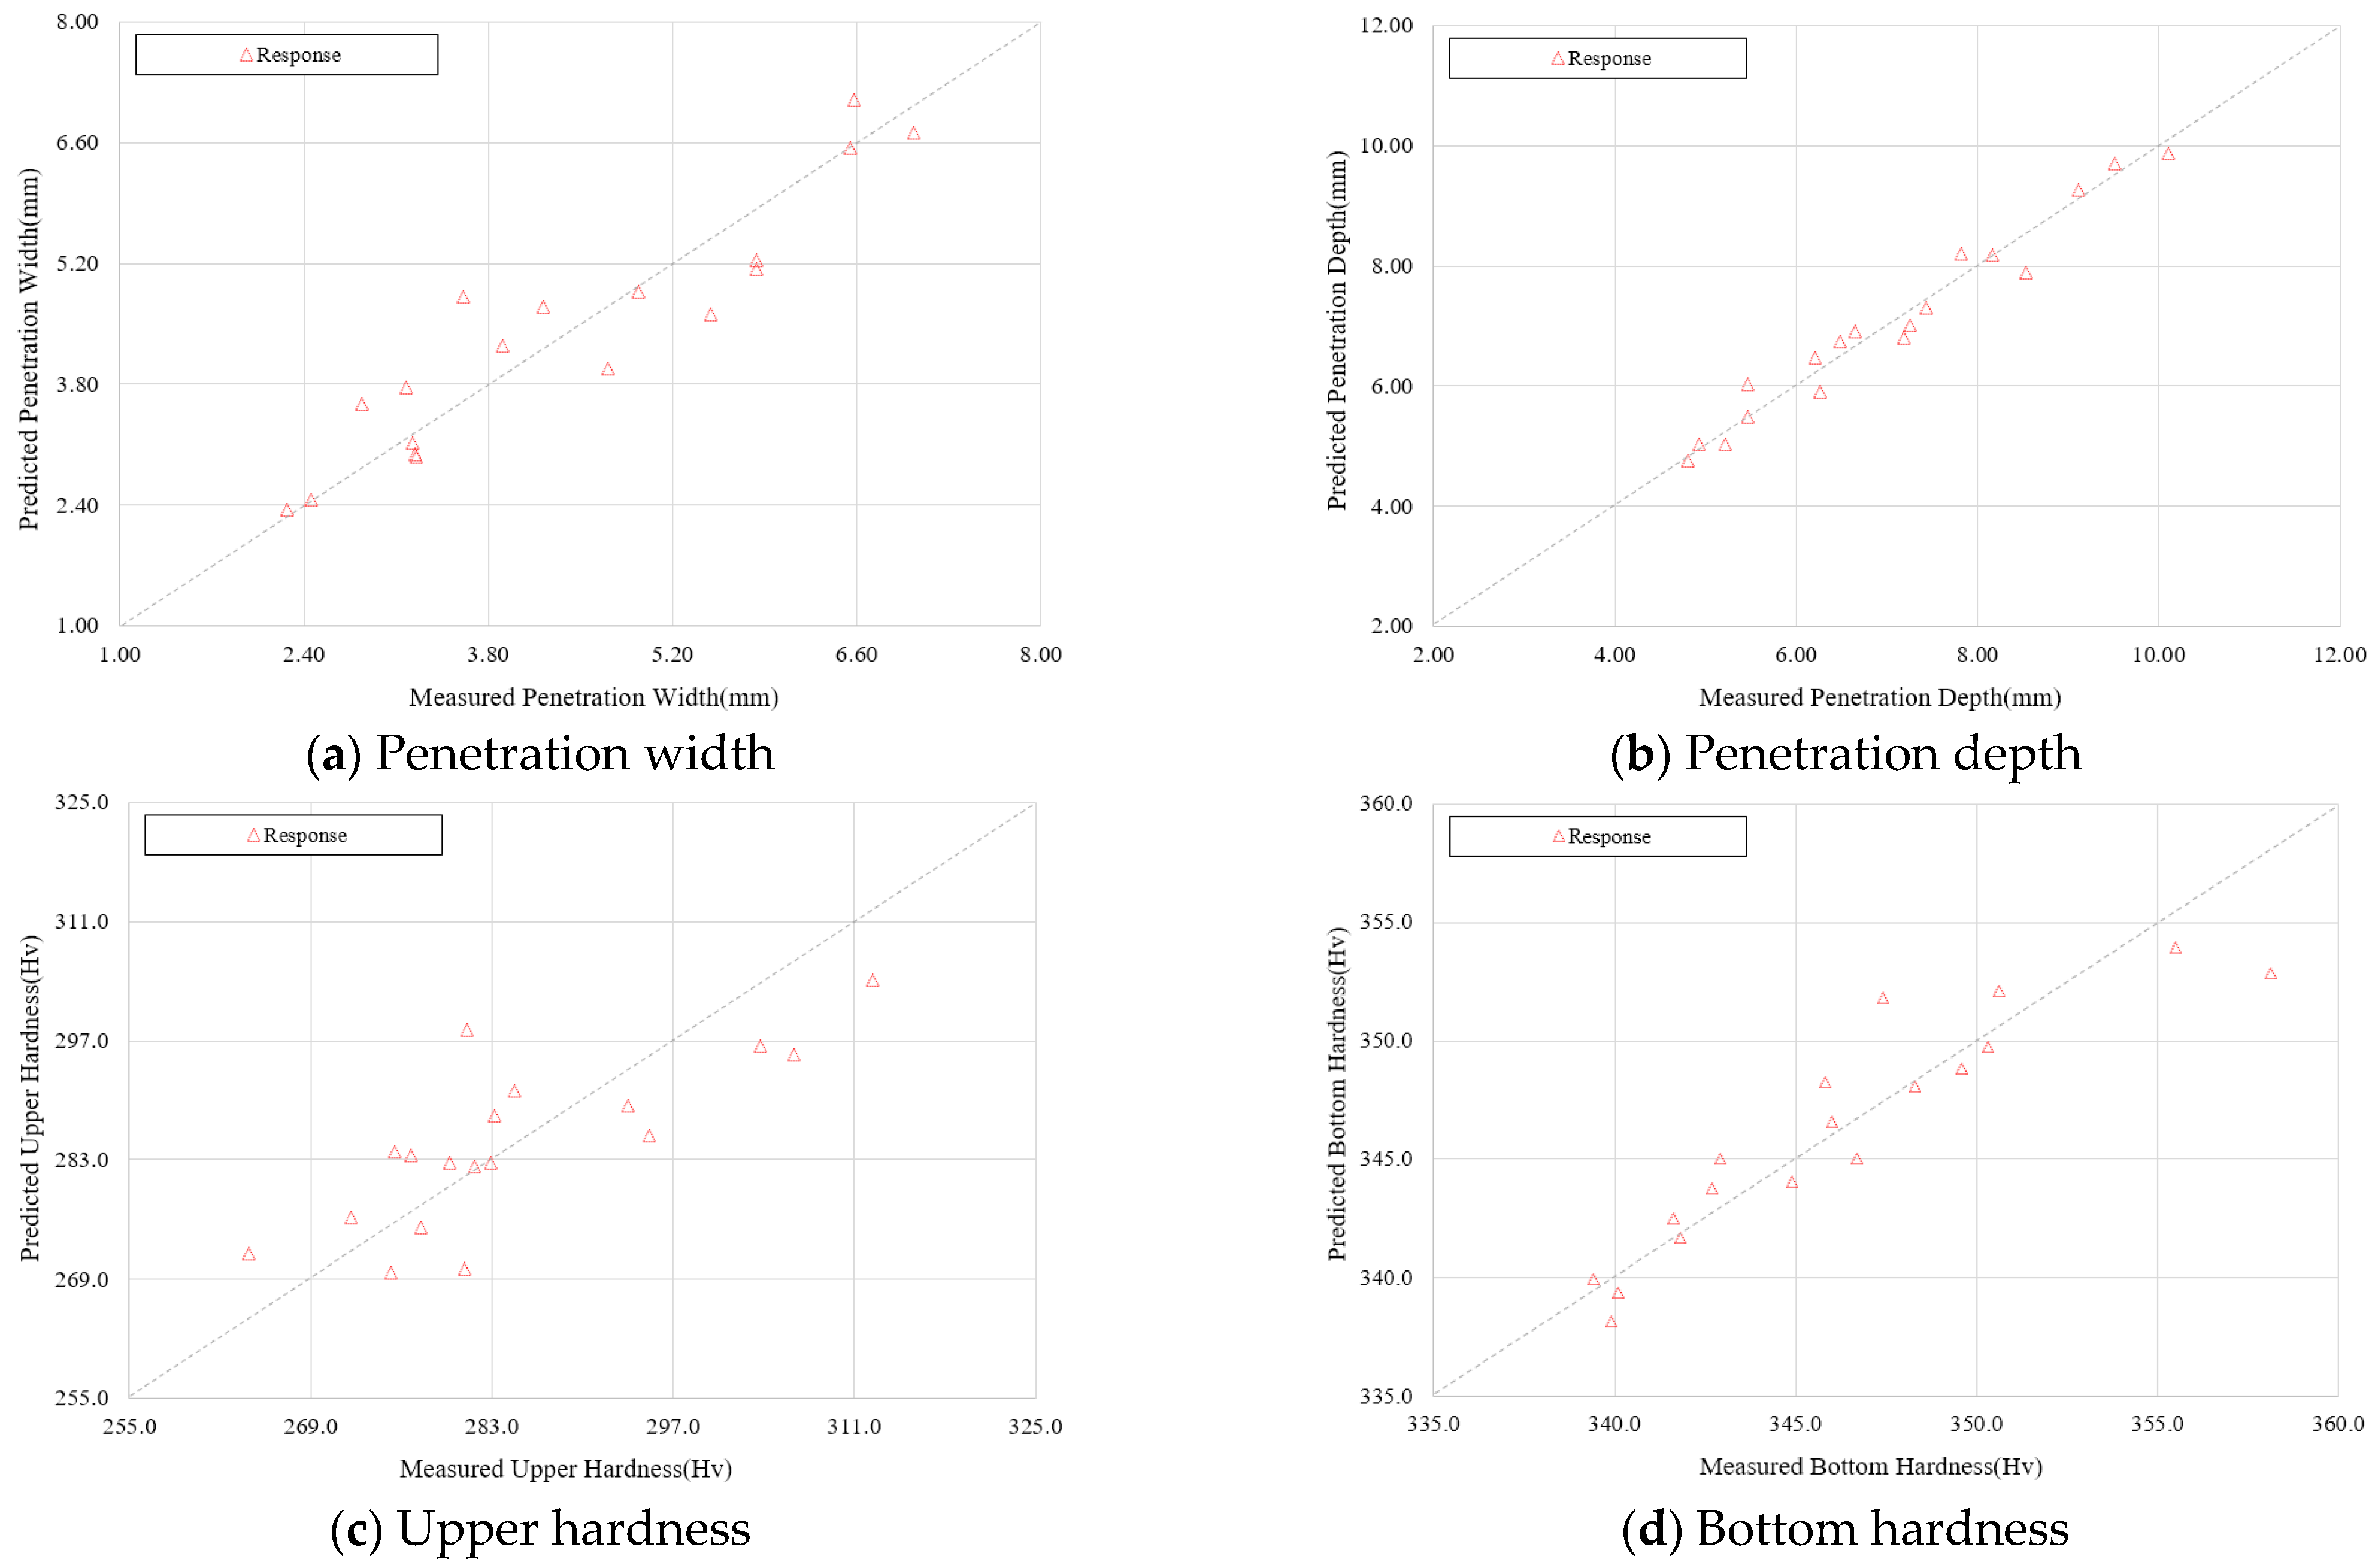
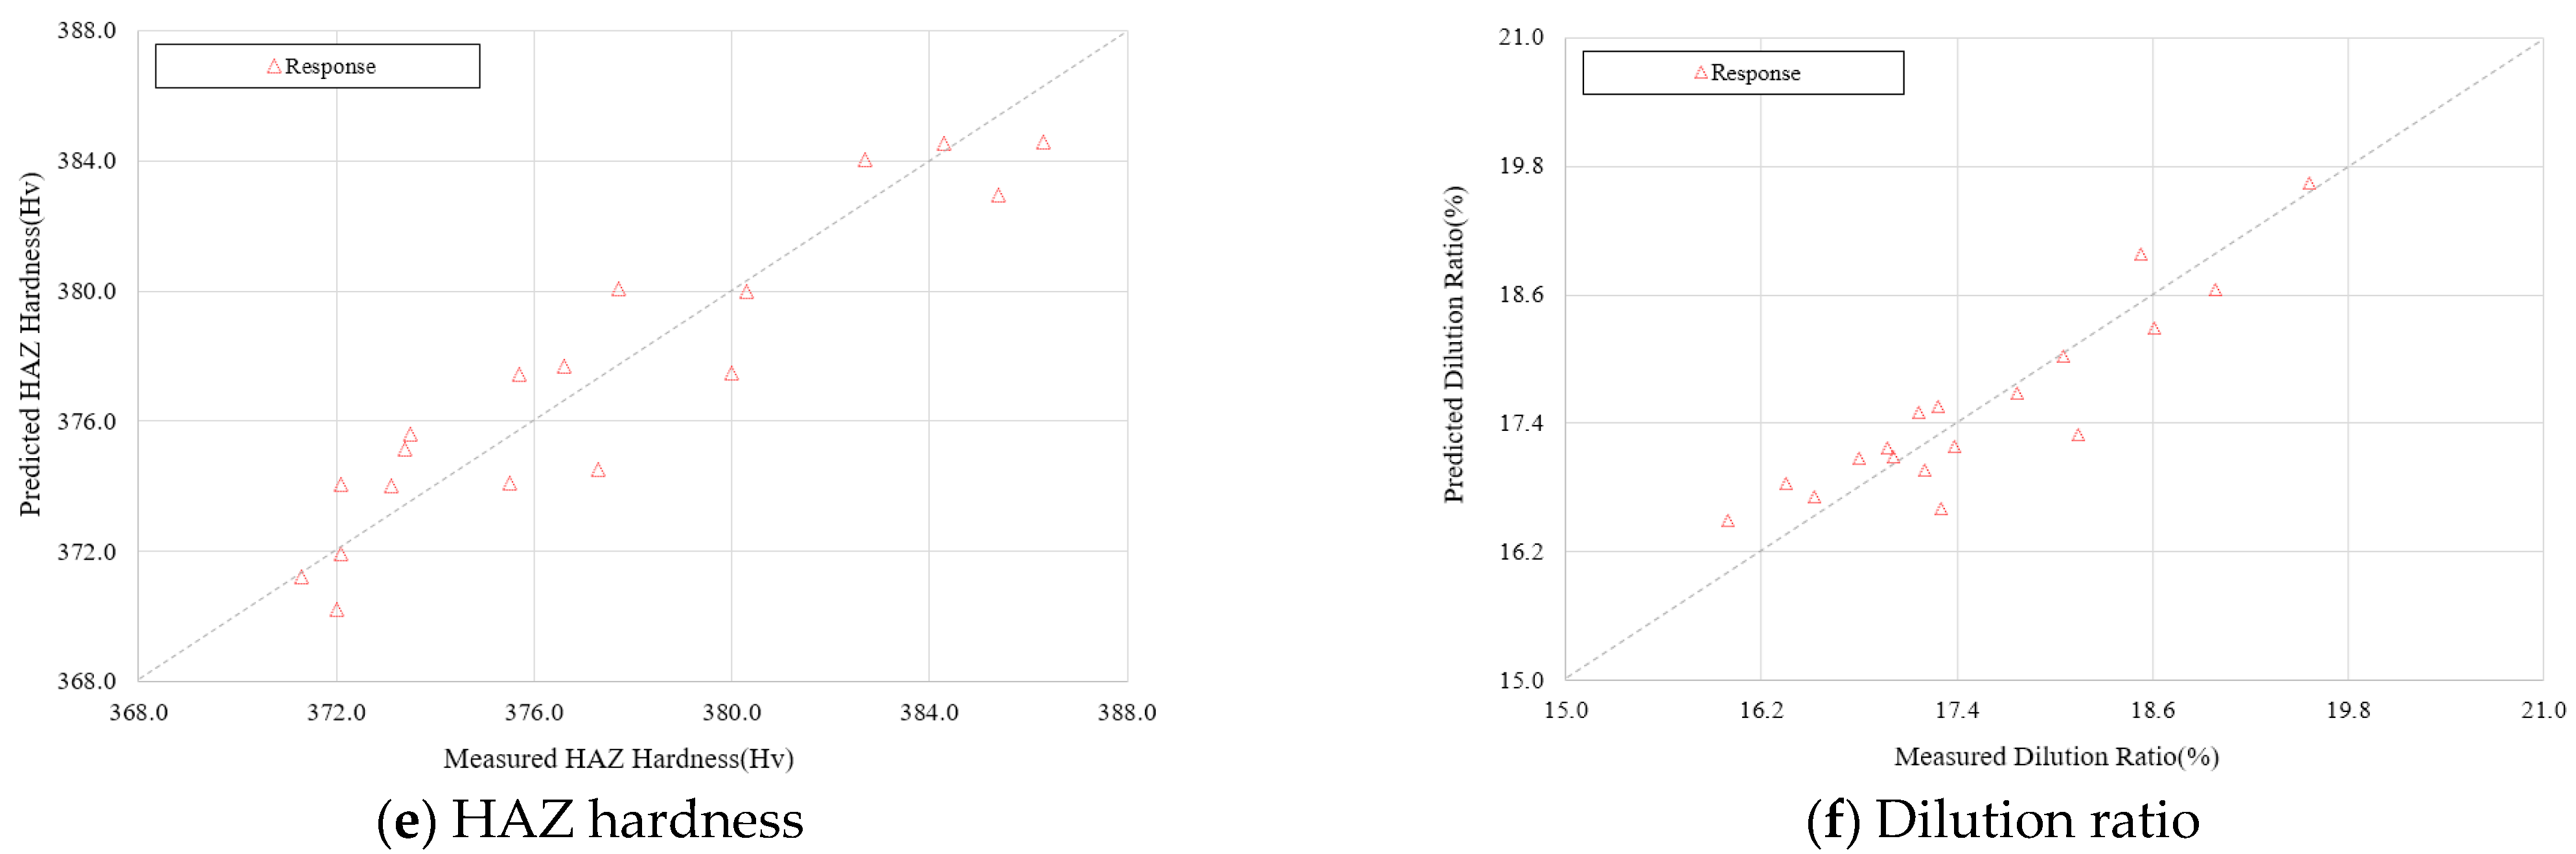
5.1. Development of Mathematical Model Welding Factors

The response surface analysis method was used for analysis, as in the previous research [7]. The functional relationship between the input variables x 1 ,   x 2 , x 3 ,   x k and the output variable y is expressed by Equation (2). Considering the predictive ability of linear and nonlinear models, Equation (3) is expressed as a second order regression model if it is assumed the predicted value of the output variable, i.e., the welding factor, has a linear relationship with an input variable.
Y i = f ( x 1 , x 2 , x 3 ) ,  
Y i = β 0 + i = 1 k β i x i + i j k β i j x i x j + ϵ .
Equation (3) can be arranged as Equation (4) by the least squares method:
Y i ^ = β i ^ + i = 1 k β i ^ x i + i j k β i j ^ x i x j + c
In this study, Equation (4) can be expanded as Equation (5) since the number of input variables is 3; that is, k = 3   .
Y i ^ = β 0 ^ + β 1 ^ x 1 + β 2 ^ x 2 + β 3 ^ x 3 + β 11 ^ x 1 2 + β 22 ^ x 2 2 + β 33 ^ x 3 2 + β 12 ^ x 1 x 2 + β 13 ^ x 1 x 3 + β 23 ^ x 2 x 3 ,
where, Y i ^ is the estimator of welding characteristics, x i is the code unit of the input variables (welding process variables and mechanical properties), β 0 ^ ,   β i ^ ,   β i j ^ are the min. square estimators of β 0 ,   β i ,   β i j ,   respectively, and ϵ represents an error. To develop Equation (5) from the above regression model, it is necessary to obtain relevant data through many experiments.
To obtain relevant data through experiments, numerous trials and errors and economic losses may occur. To reduce such losses, a full factorial design was applied among the response surface analysis methods of the DOE method that well reflects the second order regression model, and the coefficients of each term were calculated using MINITAB.
The mathematical prediction models of penetration width, penetration depth, upper and bottom hardness, HAZ hardness and the dilution ratio developed using regression coefficients and Equation (5), can be expressed using Equations (6)–(11):
P W = 8.871 2.537 L 1.354 D 2.463 S + 0.5375 L 2 + 1.440 D 2 0.06251 L D 0.7389 L S + 2.556 D S
P D = 5.651 + 1.089 L 1.154 D 2.174 S + 0.1233 L 2 0.5567 D 2 + 0.2800 L D 1.356 L S + 0.7222 D S
H U = 660.3 + 761.7 S 190.7 P W + 314.2 P D 7.524 P W 2 23.84 P D 2 + 78.21 S P W 158.6 S P D + 29.12 P W P D
H B = 123.1 + 144.7 S 24.54 P W + 63.30 P D 0.4559 P W 2 4.080 P D 2 + 9.244 S P W 27.10 S P D + 3.248 P W P D
H H = 97.64 + 202.1 S 38.62 P W + 83.79 P D 2.850 P W 2 6.157 P D 2 + 19.67 S P W 42.32 S P D + 7.325 P W P D
D i = 2690.2 + 35.34 P W 16.43 H B + 0.7608 H U + 0.1383 P W 2 + 0.02731 H B 2 + 0.00301 H U 2 0.1029 P W H B 0.0023 P W H U 0.0073 H B H U
To check the predictive ability of the developed mathematical prediction model, the graph showing the error range by comparing the average values of the measured welding factors for each experimental condition with the predicted welding factors, is shown in Figure 9. As shown in Table 11, the prediction model error range showed reliable results in general.
In addition, the ANOVA (analysis of variable) results of the predictive model confirmed a high coefficient of determination of 96.3% at the maximum penetration depth and a minimum coefficient of determination of 71.1% at the upper hardness of the weld joint. This means that it is possible to make predictions using the coefficient of determination for the entire variation of welding factors and the interaction, when the independent influence of input variables affecting the regression model are simultaneously considered.

5.2. Optimization for the Welding Process of 9% Ni Steel

The MOO (multi-objective optimization) algorithm that was used in this study is a technique used to search for non-dominant solutions by mimicking the evolutionary process of an organism in an optimization problem with multiple objectives. This algorithm was used as in the previous research [7].
First of all, based on the mathematical definition of Pareto Domination as in Equation (12), the Pareto optimal set P 0 , and a set of non-dominant solutions x i , were created in a destination space. Genes belonging to the Pareto optimal set P 0 —that is, decision vectors—are randomly generated in as large a quantity as the number of populations in the decision space. A cluster with a high degree of non-dominance and the best fit is generated to calculate the crowding distance and an optimal solution set with a high cluster distance is judged to have more variety of solutions, at which point a multi-purpose optimal solution is derived [22,23,24]:
i { 1 ,   2 ,   3 ,   ,   n } : f i ( a ) f i ( b ) j { 1 ,   2 ,   3 ,   ,   n } : f i ( a ) f i ( b ) .    
In general, the multipurpose optimization problem can be described as a vector function f ( x ) that maps m parameters to n objectives. Here, x is a decision vector, X is a parameter space,   y is an objective vector, and Y is an objective space. Decision vector a is said to dominate decision vector b . Also, it is written as a < b ( a dominates   b ). Also, for an arbitrary decision vector a , if no vector in the subset X of the decision vectors dominates a , it is said that the decision vector a is non-dominated by X . Based on the above theorem, the program schematic diagram of the MOO optimization method is shown in Figure 10 and MATLAB, a commercial numerical analysis program, was used to apply and modify the optimization method. To optimize the welding process variables when the hardening of a weld joint has occurred, the same 180 data in Table 9 and the variables and levels to drive the MOO optimization technique are shown in Table 12.
In the MOO technique, a range of fiber laser welding process parameters was chosen from the minimum [3 kW, −0.5 mm, 0.5 m/min] to the maximum [5 kW, +0.5 mm, 0.8 m/min]. The purpose of this study was to analyze a multi-purpose optimization problem that considers weld joint hardness as a criterion to evaluate the quality deterioration characteristics of a weld joint in 9% Ni steel. Therefore, Equations (13)–(15) represent the objective function f ( x )   of an arbitrary system having x   as a variable and the constraints and ranges required to optimize this function [25].
O p t i m i z e   f ( L ,   D ,   S )
g ( L ,   D ,   S )  
D i < 17.7  
Test numbers 4 and 14 were selected to follow the MOO algorithm and Table 13 shows the welding process variables, expected welding factors, and discrimination results that were modified to satisfy the constraints according to the optimization procedure.
The possibility of hardening of a weld joint and the effectiveness of optimizing the welding process for 9% Ni steel was confirmed by performing a comparative analysis with the hardening of a weld joint caused by the existing input variables, as seen in Figure 11. The X-axis represents the difference in hardness values between the HAZ and the bottom, and the Y-axis represents the dilution ratio. This graph was constructed to compare and examine whether the hardness of the bottom was close (ΔHV = HV HAZ − HV bottom) to the hardness of the HAZ with the dilution ratio. Finally, it was confirmed that the two raw data points selected in the fiber laser welding process, satisfied the dilution ratio of 17.7% or less, which is the limiting condition for the hardening of a weld joint, and the quality degradation characteristics appearing in the previous process variables were resolved by the modified process variables.

6. Conclusions

This study tried to optimize the welding process for 9% Ni steel, which is predominantly used in the LNG storage tank industry. After establishing the criteria for the hardening of a weld joint in the process, conducting learning in the discriminant function, and optimizing the process variables for hardening of a weld joint using the discriminant group, these conclusions were obtained:
(1)
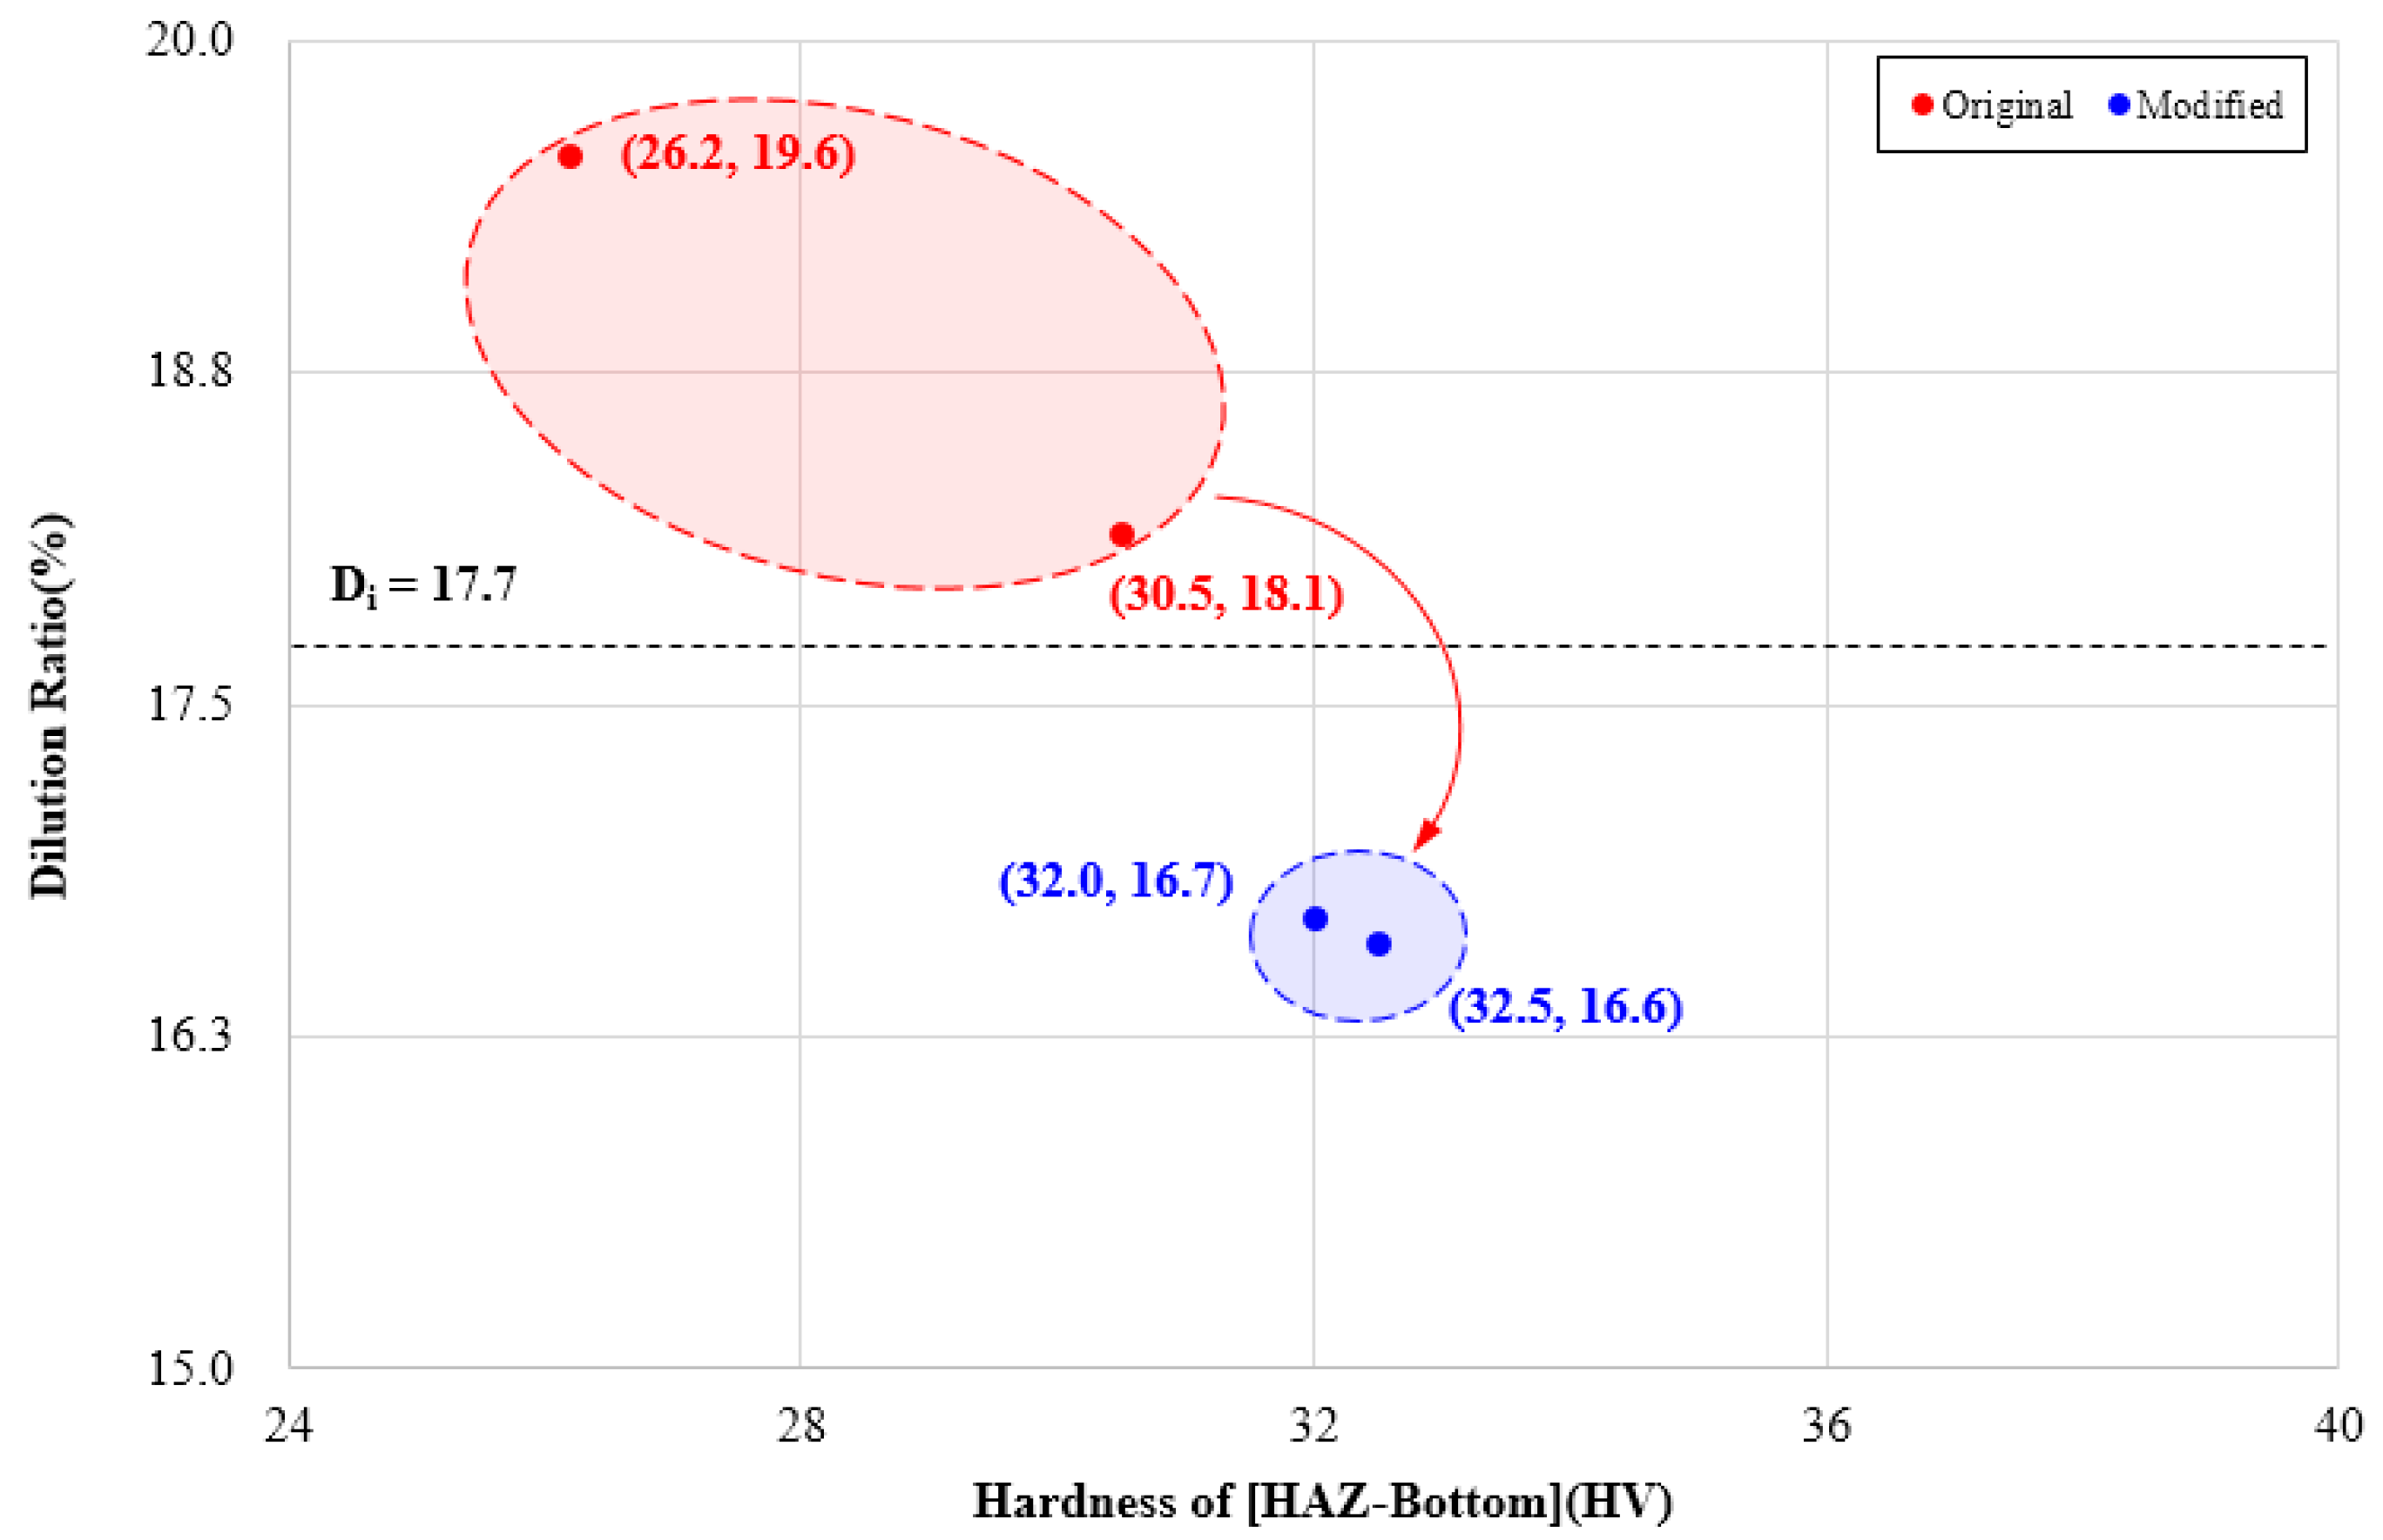
The appropriate weldability of a weld joint was confirmed by measuring the penetration shape, mechanical strength, penetration area, etc. of a weld joint derived from the fiber laser welding test. It was found that the hardening of a weld joint depends on the energy density applied to the weld joint and the ratio of an area mixed with foreign substances after melting. In addition, when the weld joint hardening index is 17.7% or more, the group that needs to consider quality deterioration for weld joint hardening is classified. Thus, quality deterioration characteristics, according to the dilution ratio, were established.
(2)
To determine the weld joint hardening phenomena of 9% Ni steel caused by welding process variables, the quality deterioration characteristics were learned in the SVM technique and it was determined whether the group with quality deterioration could be accurately identified. As a result, it was confirmed that a group with the hardening of a weld joint was predicted 100% repeatedly. This result was used as a procedure to determine the deterioration of weld joint quality.
(3)
A response surface method mathematical prediction model was developed to apply an objective function to optimize the welding process variables where quality deterioration occurs. By entering the raw data of weld joint hardening into the optimization algorithm created by the objective function and constraint conditions, the quality degradation characteristics contained in the process variables were supplemented.
(4)
The predicted welding factors were calculated by entering the input variables supplemented for their quality degradation characteristics into the response surface mathematical model. By re-entering the corresponding output variables into the discrimination system, all the raw data where the hardening of a weld joint was expected, showed no quality deterioration.

Author Contributions

Conceptualization, M.P. and K.C.; methodology, M.P.; software, C.P. and K.C.; validation, K.C., J.K. (Jisun Kim).; formal analysis, M.P.; investigation, M.P.; resources, J.K. (Jaewoong Kim); data curation, M.P.; writing—original draft preparation, M.P.; writing—review and editing, M.P., J.K. (Jisun Kim), C.P., J.K. (Jaewoong Kim), K.C.; visualization, C.P.; supervision, J.K. (Jaewoong Kim), K.C.; project administration, J.K. (Jaewoong Kim), K.C.; funding acquisition, J.K. (Jaewoong Kim); All authors have read and agreed to the published version of the manuscript.

Funding

This study was conducted with the support of the Korea Institute of Industrial Technology as “The dynamic parameter control based smart welding system module development for the complete joint penetration weld (KITECH EH-21-0003)”.

Institutional Review Board Statement

Not applicable.

Informed Consent Statement

Not applicable.

Data Availability Statement

The data presented in this study are available on request from the corresponding author.

Conflicts of Interest

The authors declare no conflict of interest.

References

  1. IMO. Regulations to Reduce Air Pollution from Ships and the Review of Fuel Oil Availability; IMO: London, UK, 2016. [Google Scholar]
  2. Kim, K.; Park, K.; Roh, G.; Ghun, K. Case Study on Boil-Off Gas (BOG) Minimization for LNG Bunkering Vessel Using Energy Storage System(ESS). J. Mar. Sci. Eng. 2019, 7, 130. [Google Scholar] [CrossRef] [Green Version]
  3. Lee, Y.H. Analysis of the Characteristics of Reformer for the Application of Hydrogen Fuel Cell Systems to LNG Fueled Ships. J. Korean Soc. Mar. Environ. Saf. 2021, 27, 135–144. [Google Scholar] [CrossRef]
  4. Peng, Y.; Zhao, X.; Zuo, T.; Wang, W.; Song, X. A systematic literature review on port LNG bunkering station. Transp. Res. Part D Transp. Environ. 2021, 91, 102704. [Google Scholar] [CrossRef]
  5. Chang, W.S.; Kim, K.C.; Kim, Y.C.; Kim, S.R.; Kim, W.S. Ni alloy welding consumables for 9% Nickel steel. Korean Weld. Join Soc. 1998, 16, 25–37. [Google Scholar]
  6. ASTM E23. Standard Test Methods for Notched Bar Impact Testing of Metallic Materials. Standard Test Methods for Notched Bar Impact Testing of Metallic Materials. Am. Soc. Test. Mater. 2007, 7a, 1–6. [Google Scholar]
  7. Park, M.; Kim, J.; Pyo, C.; Son, J.; Kim, J. A Study on the Algorithm of Quality Evaluation for Fiber Laser Welding Process of ASTM A553-1 (9% Nickel Steel) Using Determination of Solidification Crack Susceptibility. Materials 2020, 13, 5617. [Google Scholar] [CrossRef] [PubMed]
  8. Yun, T.; Oh, W.; Lee, B.; Lee, C.; Na, H.; Choi, J.; Kim, I. A Study on Optimization of Fillet in Laser Welding Process for 9% Ni Steel Using Gradient-Based Optimization Algorithm. J. Weld. Join. 2020, 38, 485–492. [Google Scholar] [CrossRef]
  9. Na, K.; Lee, C.; Park, J.; Cho, M. A Comparison of Hot Cracking in GTAW and FCAW by Applying Alloy 625 Filler Materials of 9% Ni Steel. J. Weld. Join. 2019, 37, 357–362. [Google Scholar] [CrossRef] [Green Version]
  10. Kim, B.; Park, J.; Lee, J.; Kim, M. Study on the Initial Design of an LNG Fuel Tank using 9 wt.% Nickel Steel for Ships and Performance Evaluation of the Welded Joint. J. Weld. Join. 2019, 37, 555–563. [Google Scholar] [CrossRef] [Green Version]
  11. Watanabe, I.; Suzuki, M.; Matsuda, Y.; Tagawa, H.; Matsui, K.; Shimada, S. Fracture toughness of 9% Ni steel and safety of LNG storage tank against brittle fracture. Nippon Kokan Tech. Rep. 1984, 42, 2–10. [Google Scholar]
  12. Liu, X.; Athanasiou, C.E.; Padture, N.P.; Sheldon, B.W.; Gao, H. A machine learning approach to fracture mechanics problems. J. Acta Mater. 2020, 190, 105–112. [Google Scholar] [CrossRef]
  13. Oh, D.J.; Lee, J.M.; Noh, B.J.; Kim, W.S.; Ando, R.; Matsumoto, T.; Kim, M.H. Investigation of fatigue performance of low temperature alloys for liquefied natural gas storage tanks. J. Mech. Eng. 2015, 229, 1–15. [Google Scholar] [CrossRef]
  14. Kourshid, A.F.M.; Ghanem, M. Using the welding parameters to improve the mechanical properties of Liquefied Natural Gas storage tank welded joint. IOSR J. Mech. Civ. Eng. 2012, 4, 32–39. [Google Scholar] [CrossRef]
  15. Technical Report 9% Nickel Steel: For Use at Cryogenic Temperatures; ArcelorMittal: East Chicago, IN, USA, 2010.
  16. Kobelco’s Welding Consumables for LNG Storage Tanks Made of 9% Ni Steel. Kobelco Weld. 2011, 14, 3–8.
  17. Paura, R. IPG Fiber lasers: What’s new in applications for fabricators. In Proceedings of the ALAW Laser Application Workshop, Plymouth, MI, USA, 13–14 May 2009. [Google Scholar]
  18. Kim, Z.H. A Comparative Study of Classification Techniques Using Forest Cover Type Data: Discriminant Analysis, Logistic Regression, Neural Network, Decision Tree. Unpublished Master’s Thesis, Chung-Ang University, Seoul, Korea, 2012. [Google Scholar]
  19. Amrine, D.E.; White, B.J.; Larson, R.L. Comparison of classification algorithms to predict outcomes of feedlot cattle identified and treated for bovine respiratory disease. Comput. Electron. Agric. 2014, 105, 9–19. [Google Scholar] [CrossRef] [Green Version]
  20. Knowles, J.D.; Corne, D.W. Approximating the nondominated front using the pareto archived evolution strategy. Evol. Comput. 2000, 8, 149–172. [Google Scholar] [CrossRef] [PubMed]
  21. Vapnik, V.N. The Nature of Statistical Learning Theory; Springer: Berlin/Heidelberg, Germany, 1999. [Google Scholar]
  22. Deb, K.; Agrawal, S.; Pratap, A.; Meyarivan, T. A fast elitist non-dominated sorting genetic algorithm for multi-objective optimization: NSGA-II. Lect. Notes Comput. Sci. 2000, 1917, 849–858. [Google Scholar]
  23. Zitzler, E.; Deb, K.; Thiele, L. Comparison of multiobjective evolutionary algorithms: Empirical results. Evol. Comput. 2000, 8, 173–195. [Google Scholar] [CrossRef] [PubMed] [Green Version]
  24. Veldjuizen, D.A.V.; Lamont, G.B. On measuring multiobjective evolutionary algorithm performance. Evol. Comput. 2000, 1, 204–211. [Google Scholar]
  25. Deb, K.; Pratap, A.; Agarwal, S.; Meyarivan, T.A. A fast and elitist multi objective genetic algorithm: NSGA-II. IEEE Trans. Evol. Comput. 2002, 6, 182–197. [Google Scholar] [CrossRef] [Green Version]
Figure 1. Equipment for fiber laser welding.
Metals 11 01308 g001
Figure 2. The fiber laser welding process.
Metals 11 01308 g002
Figure 3. Schematic diagram of penetration geometry.
Metals 11 01308 g003
Figure 4. Schematic diagram of the hardness test.
Metals 11 01308 g004
Figure 5. Schematic diagram of dilution ratio.
Metals 11 01308 g005
Figure 6. Optical microscope for dilution ratio measurement.
Metals 11 01308 g006
Figure 7. Weld joint hardening according to dilution ratio in fiber laser welding.
Metals 11 01308 g007
Figure 8. Weld joint hardening discriminant in fiber laser welding: (a) Performance evaluation for SVM and (b) Discriminant graph for SVM.
Metals 11 01308 g008
Figure 9. Comparison between measured and predicted welding factors according to the mathematical model: (a) penetration width, (b) penetration depth, (c) upper hardness, (d) bottom hardness, (e) HAZ hardness and (f) dilution ratio.
Metals 11 01308 g009aMetals 11 01308 g009b
Figure 10. Flow chart of the multi-objective optimization (MOO) method to predict the welding parameters.
Metals 11 01308 g010
Figure 11. Weld joint hardening distributions using modified input parameters.
Metals 11 01308 g011
Table 1. Chemical composition of base metal.
ComponentCSiMnSPNiFe
Percentage (wt.%)0.050.670.0040.0030.259.02Bal.
Table 2. Mechanical properties of base metal.
MaterialYield Strength (MPa)Tensile Strength (MPa)Elongation (%)Hardness (HV)
A553-1651.6701.126.6243
Table 3. Parameters and levels of fiber laser welding.
ParameterSymbol−101
Laser Power (kW) L 3.04.05.0
Defocusing (mm) D −0.50.00.5
Welding Speed (meter/minute, m/min) S 0.50.8
Fixed ParameterWavelength: 1070 nm
Optical Fiber Diameter: 200 µm
Shielding Gas Flow Rate: Ar 18 L/min, (L/min)
Table 4. Experimental conditions.
Case No.LDSCase No.LDS
13.0−0.50.5103.0−0.50.8
23.00.00.5113.00.00.8
33.00.50.5123.00.50.8
44.0−0.50.5134.0−0.50.8
54.00.00.5144.00.00.8
64.00.50.5154.00.50.8
75.0−0.50.5165.0−0.50.8
85.00.00.5175.00.00.8
95.00.50.5185.00.50.8
Table 5. Results and Penetration Data.
Test No.Penetration Width (mm)Penetration Depth (mm)Penetration Geometry
1st2nd3rdAverage1st2nd3rdAverage
13.933.903.903.916.496.476.516.49 Metals 11 01308 i001
23.193.183.173.186.646.666.646.65 Metals 11 01308 i002
34.734.724.694.717.217.227.157.19 Metals 11 01308 i003
45.825.865.845.848.528.518.558.53 Metals 11 01308 i004
55.485.495.495.498.178.158.158.16 Metals 11 01308 i005
63.613.713.53.617.847.827.797.82 Metals 11 01308 i006
76.596.586.586.589.119.129.119.11 Metals 11 01308 i007
86.546.556.556.559.499.519.539.51 Metals 11 01308 i008
97.017.037.047.0310.0910.0910.1110.1 Metals 11 01308 i009
102.512.472.372.454.864.784.794.81 Metals 11 01308 i010
112.212.282.322.274.954.894.954.93 Metals 11 01308 i011
123.263.273.223.255.195.235.215.21 Metals 11 01308 i012
133.253.233.173.225.495.485.445.47 Metals 11 01308 i013
143.223.303.203.246.256.246.296.26 Metals 11 01308 i014
152.822.842.862.845.435.445.545.47 Metals 11 01308 i015
164.944.974.914.946.186.246.216.21 Metals 11 01308 i016
174.254.194.214.227.267.247.247.25 Metals 11 01308 i017
185.845.835.855.847.477.417.447.44 Metals 11 01308 i018
Table 6. Results of hardness according to welding process and parameters.
Test No.123456789
Upper (HV)1st266.6296.4283.3277.4314.6270.7314.6308.3283.7
2nd262.1300.0279.0279.8305.9277.1312.7301.1287.5
3rd264.9294.6282.6276.1299.2274.2306.0303.3287.1
4th262.3293.6282.7287.3300.6269.5313.7302.8280.6
5th264.8291.1280.9284.7311.4269.0314.7302.8284.6
Avg.264.2295.2281.7281.1306.3272.1312.4303.7284.7
Bottom (HV)1st343.9345.7346.3358.0351.5349.8355.3346.6350.4
2nd344.9345.6344.9358.3350.6349.5356.2348.1350.0
3rd345.0346.5346.4358.1349.5350.5356.4347.4350.4
4th345.2346.4345.5359.1350.9348.7354.4348.1350.0
5th345.3345.9346.2356.7350.6349.7355.2346.5350.6
Avg.344.9346.0345.8358.1350.6349.6355.5347.4350.3
HAZ (HV)1st374.1379.6379.8384.1382.4376.1386.3385.4377.5
2nd373.4380.8379.9384.1382.8376.5386.3385.4377.4
3rd373.1379.8380.4384.4383.4376.5386.8385.0376.3
4th373.2380.0381.0384.0382.8376.3386.0385.6378.5
5th373.6380.0379.8384.7382.4377.2386.6385.0377.6
6th373.7379.6380.6384.3382.7376.8385.9385.8378.5
Avg.373.5380.0380.3384.3382.7376.6386.3385.4377.7
Test No.101112131415161718
Upper (HV)1st289.6295.3280.9279.2279.1278.2276.5280.3277.6
2nd284.2295.6278.1276.2276.1279.8275.7280.4280.9
3rd274.6293.0272.8282.4273.7291.8275.7285.7271.5
4th284.3289.3276.3277.4272.8282.1274.1279.6274.9
5th281.8294.2279.5283.2276.1284.0274.0278.3278.6
Avg.282.9293.5277.5279.7275.5283.2275.2280.9276.7
Bottom (HV)1st339.8340.1340.3342.2342.2341.6342.9346.8349.2
2nd340.0339.3339.7343.1342.7341.1343.3347.5348.5
3rd340.1339.5340.5341.2342.8341.6342.2345.9348.5
4th339.2339.1339.8341.1343.2342.0342.7347.1348.1
5th340.4339.1340.2341.5343.5341.7342.4346.4347.2
Avg.339.9339.4340.1341.8342.9341.6342.7346.7348.3
HAZ (HV)1st372.4371.4372.6373.0373.6371.9375.7381.4375.9
2nd371.9371.8371.8373.2373.4372.8375.5381.2376.3
3rd373.0370.8371.7372.6373.5371.6376.0381.9376.2
4th371.5371.3372.3373.0374.0371.8375.3373.0374.9
5th371.8371.3371.2373.6372.6372.5375.6373.8374.9
6th371.5371.2372.7372.8373.1372.0374.9372.4375.8
Avg.372.0371.3372.1373.1373.4372.1375.5377.3375.7
Table 7. Results of dilution ratio for fiber laser welding.
Test No.Avg. Area Upper (mm2)Avg. Area Bottom (mm2)Dilution Ratio (%)Test No.Avg. Area Upper (mm2)Avg. Area Bottom (mm2)Dilution Ratio (%)
16.381.4518.53103.000.6217.20
25.591.0615.99112.930.6217.38
38.851.8116.97124.370.9117.16
412.403.0119.56134.620.9517.01
511.492.4017.30145.121.1418.14
66.991.6418.98154.050.7916.35
715.633.0916.52167.671.7518.61
815.863.3117.28178.011.6216.80
918.193.9317.771811.172.4618.05
Table 8. Weld joint hardening data for discriminant analysis in fiber laser welding.
Test No.Hardness Difference (HV)Dilution Ratio (%)Weld Joint HardeningTest No.Hardness Difference (HV)Dilution Ratio (%)Weld Joint Hardening
128.718.53Regard1032.117.20Regardless
234.015.99Regardless1131.917.38Regardless
334.416.97Regardless1232.017.16Regardless
426.219.56Regard1331.317.01Regardless
532.117.30Regardless1430.518.14Regard
626.918.98Regard1530.516.35Regardless
730.816.52Regardless1632.818.61Regard
838.017.28Regardless1730.616.80Regardless
927.417.77Regard1827.418.05Regard
Table 9. Learning data for discriminants of fiber laser welding quality.
Test No.LDSPWPDHUHBHHDiGroup
13.0−0.50.53.916.49264.2344.9373.518.53Regard
23.00.00.53.186.65295.2346.0380.015.99Regardless
33.00.50.54.717.19281.7345.8380.316.97Regardless
44.0−0.50.55.848.53281.1358.1384.319.56Regard
54.00.00.55.498.16306.3350.6382.717.30Regardless
64.00.50.53.617.82272.1349.6376.618.98Regard
75.0−0.50.56.589.11312.4355.5386.316.52Regardless
85.00.00.56.559.51303.7347.4385.417.28Regardless
95.00.50.57.0310.1284.7350.3377.717.77Regard
103.0−0.50.82.454.81282.9339.9372.017.20Regardless
113.00.00.82.274.93293.5339.4371.317.38Regardless
123.00.50.83.255.21277.5340.1372.117.16Regardless
134.0−0.50.83.225.47279.7341.8373.117.01Regardless
144.00.00.83.246.26275.5342.9373.418.14Regard
154.00.50.82.845.47283.2341.6372.116.35Regardless
165.0−0.50.84.946.21275.2342.7375.518.61Regard
175.00.00.84.227.25280.9346.7377.316.80Regardless
185.00.50.85.847.44276.7348.3375.718.05Regard
L: laser power (kW); D: defocusing (mm); S: welding speed (m/min); PW: penetration width (mm); PD: penetration depth (mm); HU: upper hardness (HV); HB: bottom hardness (HV); HH: HAZ hardness (HV); Di: dilution ratio (%).
Table 10. Results of group discriminants for weld joint hardening according to SVM.
Test No.Measured GroupPredicted GroupTest No.Measured GroupPredicted Group
111(1.00)1000(0.00)
200(0.00)1100(0.00)
300(0.01)1200(0.01)
411(1.00)1300(0.01)
500(0.00)1411(0.95)
611(1.00)1500(0.00)
700(0.00)1611(1.00)
800(0.00)1700(0.01)
911(0.99)1811(0.96)
Table 11. Analysis variance tests for predicted model for welding factors.
Design ParameterSE (Standard Error)R2 (Coefficient of Determination, %)
PW0.76986.4
PD0.42396.3
HU10.8371.1
HB2.84784.4
HH2.54180.7
Di0.56883.2
Table 12. MOO algorithm parameters and their values.
Optimal MethodMOO (Multi-Objective Optimization)
Range of Local ParametersL (Laser Power)[−0.5 ≤ Input ≤ +0.5] kW
D (Defocusing)[−0.25 ≤ Input ≤ +0.25] mm
S (Welding Speed)[−0.15 ≤ Input ≤ +0.15] m/min
Range of ConstraintsDi (Dilution Ratio)Di ≤ 17.7%
Fitness FactorPopulation Size50, 60, 70, 80, 90, 100
SolverConstrained nonlinear minimization
AlgorithmTrust region reflective algorithm
DerivativesGradient supplied
Table 13. Results of welding parameters modified by optimization process.
Test No.OriginalModifiedWelding FactorsGroup
LDSLDSPWPDHUHBHHDi
44.0−5.00.53.91−0.510.515.07.7289.9350.4382.416.7Regardless
144.00.00.83.84-0.080.862.55.3298.0343.5376.016.6Regardless
Publisher’s Note: MDPI stays neutral with regard to jurisdictional claims in published maps and institutional affiliations.

