Article

Database Clustering after Automatic Feature Analysis of Nonmetallic Inclusions in Steel

Scientific and Technological Complex New Technologies and Materials, Peter the Great St. Petersburg Polytechnic University, 195251 St. Peterburg, Russia
*
Author to whom correspondence should be addressed.
Submission received: 30 September 2021 / Revised: 13 October 2021 / Accepted: 14 October 2021 / Published: 18 October 2021

Abstract

:
Non-metallic inclusions (NMIs) in steel have a negative impact on the properties of steel, so the problem of producing clean steels is actual. The existing metallographic methods for evaluating and analyzing nonmetallic inclusions make it possible to determine the composition and type of NMIs, but do not determine their real composition. The analysis of single NMIs using scanning electron microscope (SEM), fractional gas analysis (FGA), or electrolytic extraction (EE) of NMIs is too complicated. Therefore, in this work, a technique based on the automatic feature analysis (AFA) of a large number of particles by SEM was used. This method allows to obtain statistically reliable information about the amount, composition, and size of NMIs. To analyze the obtained databases of compositions and sizes of NMIs, clustering was carried out by the hierarchical method by constructing tree diagrams, as well as by the k-means method. This made it possible to identify the groups of NMIs of similar chemical composition (clusters) in the steel and to compare them with specific stages of the steelmaking process. Using this method, samples of steels produced at different steel plants and using different technologies were studied. The analysis of the features of melting of each steel is carried out and the features of the formation of NMIs in each considered case are revealed. It is shown that in all the studied samples of different steels, produced at different steel plants, similar clusters of NMIs were found. Due to this, the proposed method can become the basis for creating a modern universal classification of NMIs, which adequately describes the current state of steelmaking.

1. Introduction

Non-metallic inclusions (NMIs) have a negative effect on the casting of steel, leading to surface defects of continuously cast billets and sheets, and reduce the mechanical and corrosion properties of the final product [1,2,3,4,5]. Therefore, producing steels not contaminated with NMIs is one of the main tasks of metal products manufacturers.
The development of technological recommendations for obtaining clean steel is possible if information on the composition, size, and nature of inclusions is available; therefore, modern methods are required for their study and analysis. Existing metallographic methods for evaluating and analyzing make it possible to determine the composition and type of NMIs (ASTM E1245 and ASTM E45 [6,7]) but do not determine their real composition. Other methods, for example, analysis of single NMIs using a scanning electron microscope (SEM) [8], fractional gas analysis (FGA) [9], or electrolytic extraction (EE) [10] of NMIs are too complicated or unrepresentative for widespread use or do not provide statistically objective information.
For an objective statistical assessment of the amount, size, and composition of NMIs in industrial steels, it is possible to use databases obtained by the method of automatic particle analysis (AFA) [11,12,13,14,15] and containing information on a large amount of NMIs. For this study, a metallographic sample is placed in a scanning electron microscope chamber equipped with an energy-dispersive spectrometer and a motorized stage. After that, in a given area of the sample, the composition, size, and other parameters of all non-metallic inclusions are determined. Thus, a representative database of compositions and sizes of NMI is created. The number of analyzed particles in AFA is comparable to the metallographic research methods using light microscopes. However, the capabilities of this method are not fully exploited. For example, in [16,17], this method is used only as an illustration of a statistically reliable determination of the average composition of NMIs. It is more productive to define groups of inclusions within the database. For this, systems of rules are often used, according to which NMIs, depending on the content of the components, are assigned to different classes. This method is proposed by the manufacturers of such systems [18,19,20], or independently developed by researchers [13]. However, this approach is not universal and contains uncertainty in the choice of rules in each specific case. Therefore, earlier the authors of this paper [14,15] used the k-means algorithm to identify the clusters of NMIs. However, the use of this method is not always convenient, since it requires a priori knowledge on the database structure and assumptions about the number of existing clusters. The analysis of descriptive statistics to identify the reliability of clustering [21,22] is difficult to formalize and can lead to incorrect results. Therefore, it is advisable to investigate other possible clustering methods. On the other hand, at present, a fairly large number of databases for different steels have been accumulated and a generalization of the results obtained is required.
Therefore, the purpose of this work is to test the AFA method for steels produced by different technologies and to compare the different methods for classifying NMIs.

2. Materials and Methods

In this work, samples of steels produced at different plants in electric furnaces and by the oxygen-converter method have been studied. Steels of ordinary quality, high-quality medium-alloyed, high-strength low-alloyed steels, and high-carbon steel for transport purposes have been investigated. Most metal products are used in a deformed state. Moreover, when an accident occurs due to NMIs, it is necessary to determine from the state of NMIs in the deformed metal what deviations from the optimal technology was made. Thus, samples of sheet and coils, and samples from finished railway wheels were studied.
Steel 1 (9MnSi5) of ordinary quality (Table 1) was obtained in an electric arc furnace (EAF). After EAF, the steel was processed in a ladle, the chemical composition was corrected, the melt was desulfurized with high basicity slag and deoxidized with an aluminum wire, and modified with SiCa. Then the steel was cast on a single-strand continuous casting machine and rolled on a reversing mill. The final sheet thickness was 15 mm.
Steel 2 (grade B) was obtained in a basic-oxygen converter. The steel was processed in a ladle using non-aluminum technology [23]. It includes deoxidation with Si and Mn; further refining in ladle; modification with a minimum amount of SiCa at the end of treatment (consumption was 0.4–0.7 kg/ton of steel); processing in a RH-process and casting on a continuous casting machine into a round billet with a 430 mm in diameter, which were then rolled into wheels.
Steel 3 (grade X70) is high-strength low alloyed steel produced in a basic-oxygen converter. The steel was processed in a Ladle furnace, then treated in a chamber vacuum apparatus. At the end of the degassing, microalloying elements were added to the steel, finally deoxidized with an aluminum wire, and modified with Ca. The slabs were rolled on a hot strip mill to an 18 mm in thickness.
Steel 4 (30CrMnSi) was produced under the same conditions as Steel 1. However, during the ladle-treatment of this high-quality steel, a logistical error occurred, and the process was disrupted. The steel was desulfurized, adjusted to its chemical composition, and deoxidized with Al, and after that the ladle was sent to the waiting stand, where it waited for casting for 3 h. At the end of the wait, the aluminum concentration dropped significantly to 0.005% due to secondary oxidation. Before casting, the steel was modified with calcium. The thickness of the final rolled product was 25 mm.
To determine the chemical composition of the steels, the spark method was used, implemented in the Spectromax optical emission spectrometer.
For metallographic studies, samples were taken from coils, sheets, and wheels, which were then examined in the rolling direction. The samples were cut with abrasive discs on a cutting machine with a cooling emulsion supplied to the cutting zone, pressed into phenolic resin and grinded and polished to a state of “mirror shine”.
A technique based on the automatic analysis of a large number of particles on a scanning electron microscope (AFA) [13,14,15,16,17,18,19,20] was used to study the NMIs in this work. A Tescan electron microscope with an Inca Feature attachment was used for the study. The content of Al, Ca, Mg, Si, Mn, Si, Ti, Nb, V, N was analyzed. The content of light element O was not determined, but was calculated from the composition of oxides.
Database processing by different clustering methods was carried out using the Statistica software package.

3. Results and Discussion

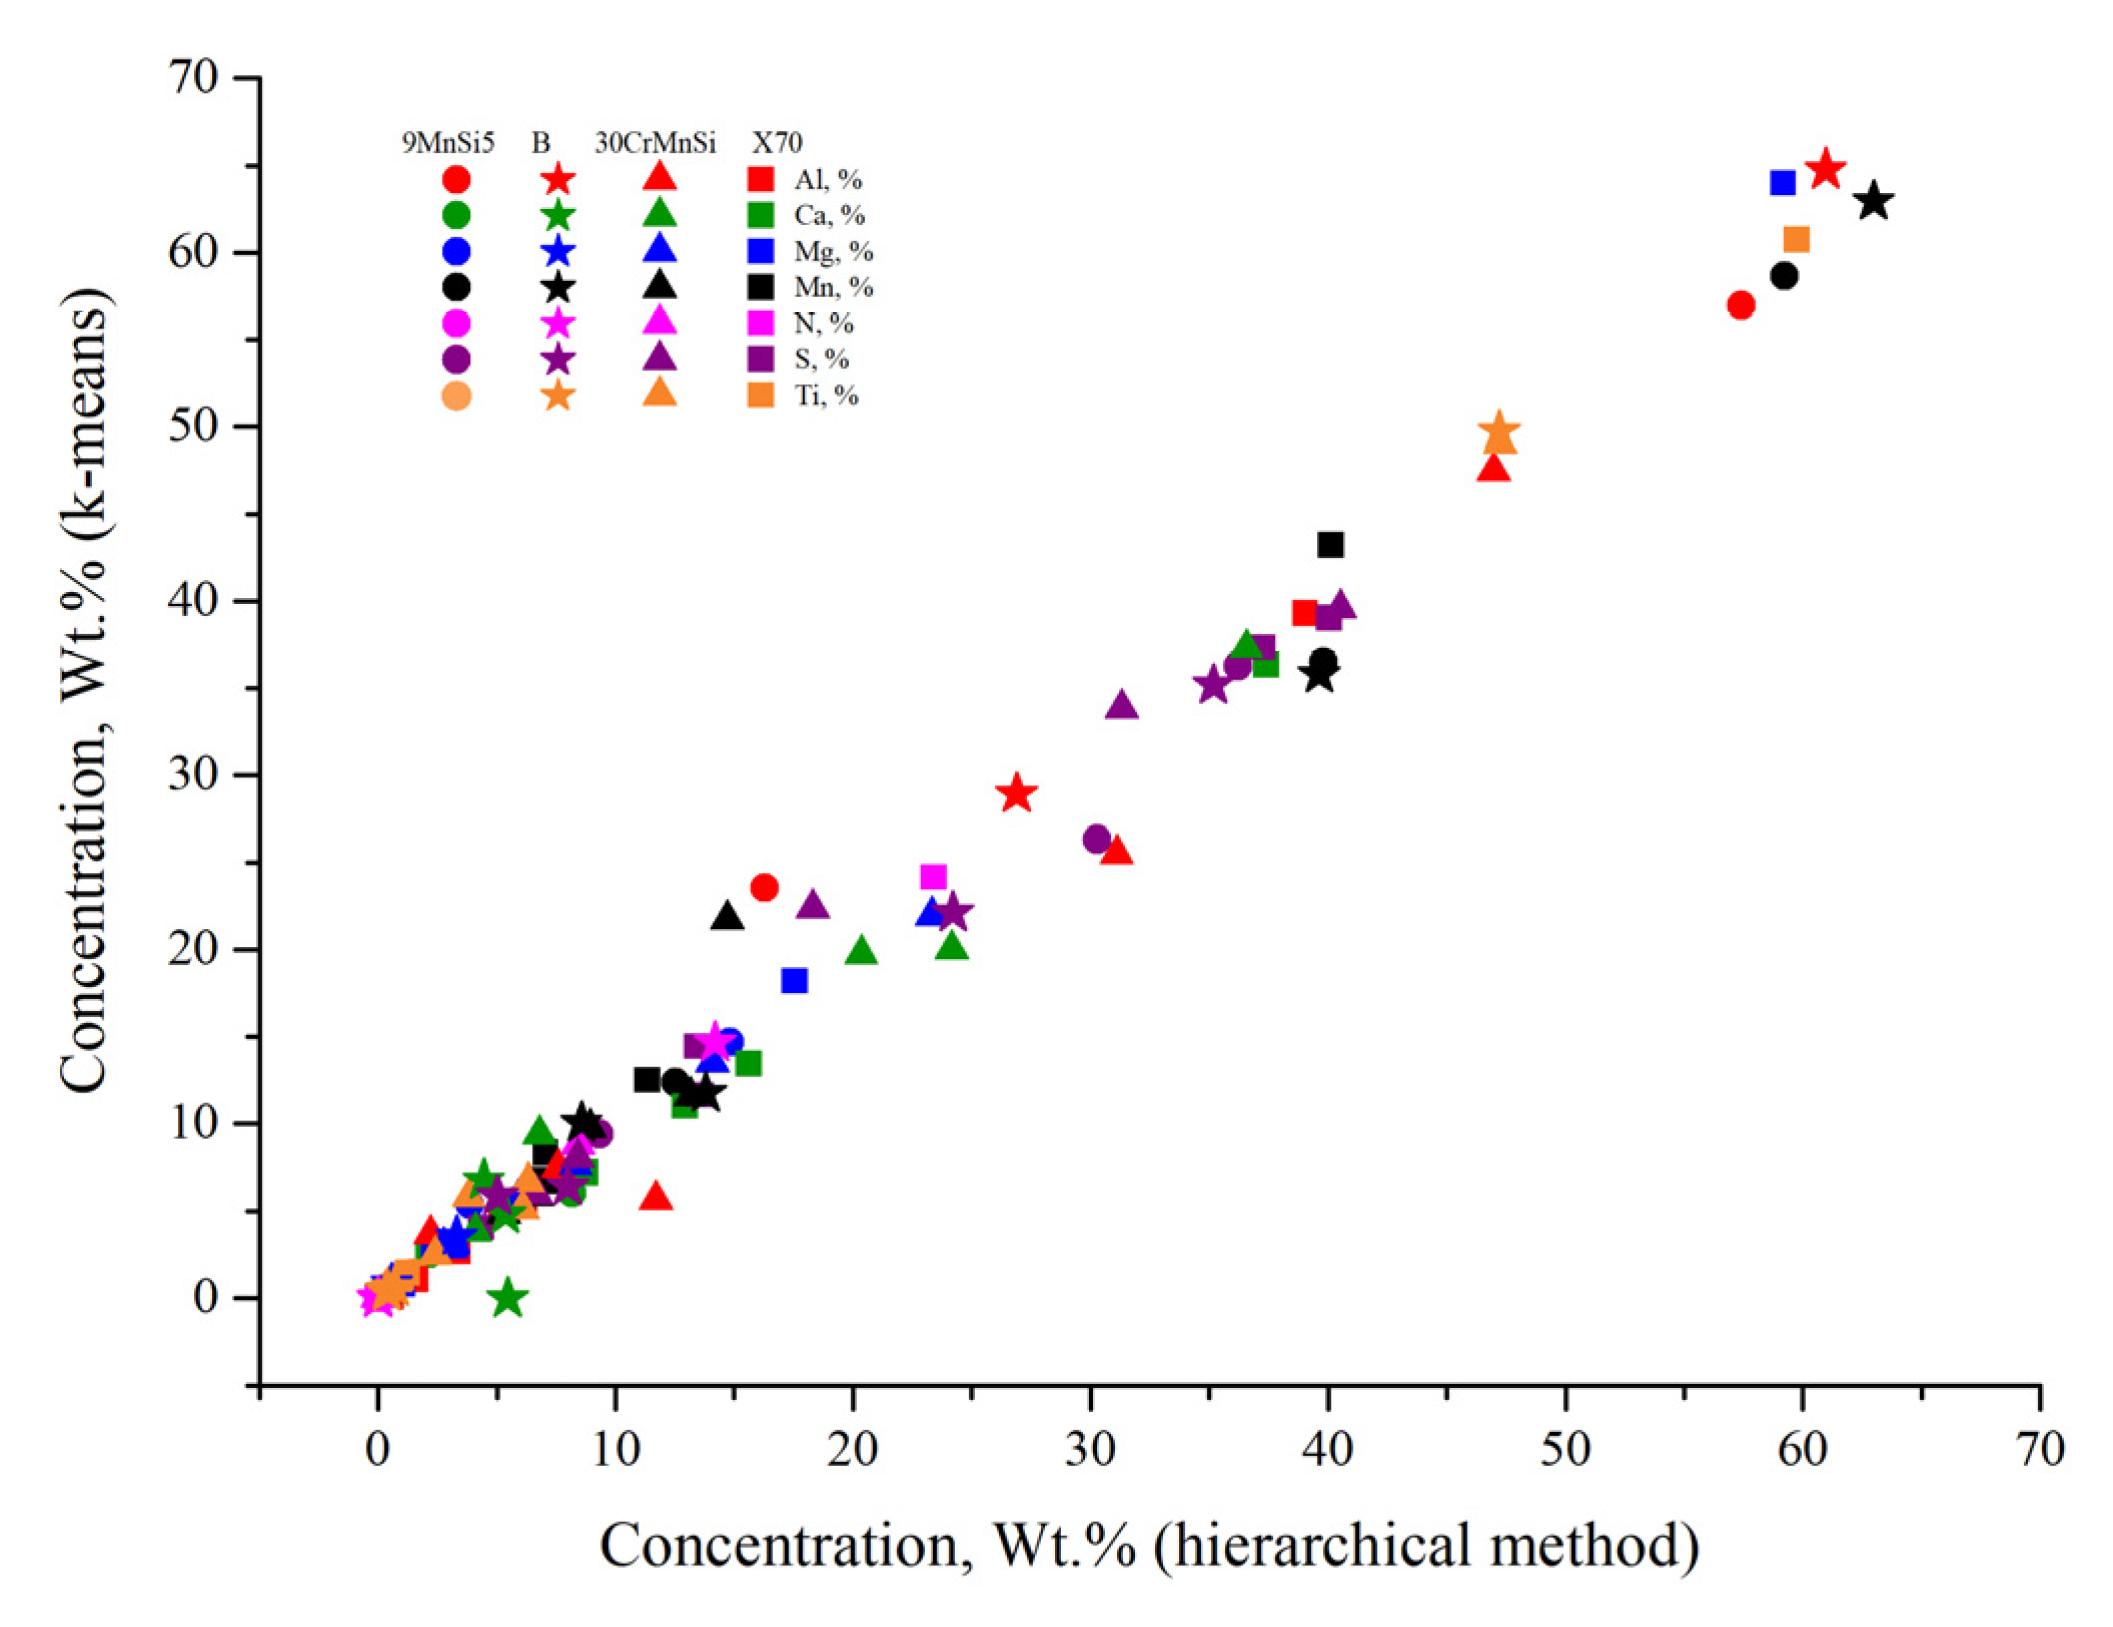
3.1. Comparison of Clustering Methods

After AFA, a database of compositions and sizes of NMIs was formed. However, in its original form, it is practically not suitable for analysis. First, the process of obtaining a database is associated with certain difficulties. The quality of preparation of specimens has a critical impact and there is a risk of obtaining a large number of analysis artifacts. For their automatic removal, a filter [14,15], which removes NMIs from the analysis, the total content of iron and oxygen in which is more than 95%, as well as particles with a high silicon content, introduced during grinding and polishing, has been developed. But even after filtering, the analysis of the database is difficult, since there is too much information. Therefore, it is necessary to separate the inclusions by composition into groups. In this work, cluster analysis was used. Cluster analysis is a group of techniques used to classify objects or events into relatively homogeneous groups called clusters [21,22]. Cluster analysis decomposes raw data into interpretable groups. Elements from one group should be as similar as possible, and elements from different groups should be as different as possible from each other.
Features of the cluster analysis methods [24]:
(1)
Absolutely all data cannot be used to select the groups (clusters). It is necessary to highlight only those signs that will help to effectively divide the objects into groups;
(2)
Different methods can show different results for the same data;
(3)
Cluster analysis can create artificial structures inside the database and highlight non-existent groups.
There are two well-known clustering methods. The first is hierarchical clustering [25], with the help of which it is proposed to carry out a preliminary analysis of databases in different areas of data processing. In this method, a tree of clusters is formed, and the presence of groups of inclusions of a similar chemical composition in a particular sample is preliminarily determined. During the analysis, all NMIs included in the database are compared with each other, the distance between them, expressed by the square of concentrations (Euclidean metric), is estimated, and NMIs clusters are formed. Gradually increasing the linkage distance, one can see both the smallest groups of NMIs, which differ in a unique chemical composition, size and morphology, and large groups of inclusions, which provides complete information on the types of nonmetallic inclusions in the sample. The results of such clustering are presented in the form of dendrograms [25,26], on which the values of the overeating threshold are plotted along the Y axis, and the formed groups are marked along the X axis. Then, depending on the need, the clusters are selected at the required linkage distance. Further, these results were used as initial approximations for further processing by the second popular k-means method [14,15,21,22,24]. When using the k-means method, the most important uncertainty arises when choosing the initial number of clusters [14,15], and the use of the tree clustering method for preliminary determination of the number and type of clusters allows it to be eliminated.
Table 2 contains information about the received databases (Table 2). For each sample, information of 1500 non-metallic inclusions was collected. Depending on their size and nature of their mutual distribution, different sections of the section are scanned in automatic mode. In 9MnSi5 steel, the total contamination Vtot is high and amounts to 0.06%. The total area of all investigated NMIs (ANMIs) was 0.007 mm2 with 11.16 mm2 of the entire scanned area of the specimen (A) and an average area of NMIs (Aaver) of 4.8 μm2. In steel B, 0.0049 mm2 of inclusions were viewed over an area of 8.28 mm2, with the same total contamination of 0.06%. The other two steels (X70 and 30CrMnSi) contain a significantly smaller number of inclusions, therefore, in order for the sample sizes to be the same, a much larger sectional area was examined in them. In steel X70, a total of 54.1 mm2 was scanned, in steel 30CrMnSi, 62.35 mm2.
For a preliminary analysis for each database its average chemical composition was calculated, and the name was taken out in descending order of elements with a concentration of more than 5%. The composition of the NMIs in steels modified by similar technologies or containing a lot of sulfur is practically the same. So, in steel 9MnSi5 with a sulfur content of 0.01% and in steel B with a sulfur content of 0.02%, the entire database consists of Mn, S, and Al with a close ratio of elements. There is much less sulfur in high-quality steels X70 and 30CrMnSi and the technology of calcium input is more optimal, therefore the effect of modification is higher and the inclusions consist of their similar elements, S-Ca-Al-Mn-Mg-Ti in steel X70 and S-Ca-Mn-Al-Mg in steel 30CrMnSi.
However, this analysis does not reveal the whole variety of inclusions that can be found in the studied steels. Therefore, it is impossible to study the influence of technological parameters on the change in the volume fraction of all inclusions or their types.
In order to identify the diversity of the types of NMIs, the clustering of the collected databases by different methods was performed. Using the database of compositions and sizes of NMIs in 9MnSi5 steel as an example, we investigated how both clustering methods work. Figure 1a shows a dendrogram of NMIs compositions in a sample of 9MnSi5 steel plate. Initially, the database is a cluster of Mn-S-Al (55-34-5) with a small concentration of other elements. With hierarchical clustering at a linkage distance of about 9300, two large branches are distinguished. The left branch in Figure 1a contains Mn-Al-S-Ca oxysulfides, which make up 35% of the volume fraction of all inclusions. As the linkage distance decreases to 3500, two more clusters Al-Mg-Mn-S (11.45%) and Mn-S-Al-Ca (23.99%) are revealed. The right large branch contains the main mass of Mn-S inclusions, and its further division is not necessary, since clusters of the same chemical composition begin to appear.
Thus, in this database, it was possible to identify three NMIs clusters. Next, we performed k-means clustering for three clusters. The results of clusterization by the two methods are shown in Table 3. The chemical composition and names of the clusters are practically the same. There is a slight difference, for example, for the second cluster in the content of Mg and other elements, the concentrations of which are low. This is quite natural, since there are few inclusions containing these elements in the original databases; therefore, even small changes in the composition of a cluster lead to changes in its average composition for these elements.
Another difference was found in the mean areas of inclusions in each cluster. The average size of inclusions in the clusters identified by the hierarchical method is slightly higher than the clusters identified by the k-means method. However, an analysis of the databases of NMI compositions obtained for other samples showed that this difference is not of a systemic nature (Appendix A) and is associated, first of all, with the redistribution of inclusions of different sizes with similar chemical compositions between different clusters. The confidence band for determining the average area is on average 5–15%, so this difference between the two methods is small.
Dendrograms for the databases of samples of steels B, X70, and 30CrMnSi in Figure 1b–d are shown. In high-carbon steel B with a sulfur content of 0.019%, the dendrogram has an identical form with the dendrogram for 9MnSi5 steel (Figure 1b). Primarily, the database has a single Mn-S-Al cluster, which splits into two large branches at a linkage distance 13,500. The left branch in Figure 1b contains Al-Mn-S-Ti-Si-Ca inclusions, which make up 25.4% of the total amount of NMI. Further, this branch at the level of association of about 3000 is divided into clusters Al-Mn-S-Si-Ca, which is independent, and a cluster Mn-Al-S-Ti-V, which in turn further decomposes into clusters Mn-Al-S and Ti-V-N-Mn-Ca-S. The second large branch consists almost entirely of Mn-S inclusions with insignificant amounts of other elements.
High-quality steels X70 and 30CrMnSi contain much less sulfur, so they are better modified [27], since calcium is consumed in them mainly for the modification of oxides. This is reflected in the appearance of the dendrograms. NMIs in microalloyed steel X70 (Figure 1c) primarily form a cluster S-Ca-Mn-Al-Mg-Ti (28-25-16-11-10-6). As the database decomposes at the linkage distance of about 19,000, two large branches are spun out. The left branch in Figure 1b contains Al-Mg-Ca-S-Mn-Ti inclusions and this is about 47% of the volume fraction of all inclusions in this sample. With further decomposition, the left branch is divided into clusters Al-Ca-S-Mg-Mn and Al-Mg-S-Ca-Ti-Mn. The right branch contains S-Ca-Mn-Ti-Al-Mg inclusions and at the linkage distance in 5500 decomposes into a S-Ca-Mn sulfide cluster and an S-Ca-Mn-Ti-Al-Mg cluster, which subsequently decomposes into a cluster Ti-Nb-N-Al-Mn-S-Mg and S-Ca-Mn-Al-Mg.
The dendrogram for the 30CrMnSi steel specimen is outwardly similar to the dendrogram of the X70 specimen. Primarily, the database is a cluster S-Ca-Mn-Al-Mg (31-22-20-11-9), which, at the level of association of about 17,000, splits into two large clusters. The left cluster includes S-Mn-Ca sulfides, accounting for about 61% of all inclusions. Further decomposition makes it possible to reveal a more complex S-Ca-Mn-Al cluster at the linkage distance of about 13,000, and to separate pure sulfides into a Mn-S-Ca cluster. The second large Al-Mg-Ca-S-Ti-Mn branch at the linkage distance of about 6000 is divided into a Ti-N-Mn cluster and an Al-Mg-Ca-S-Mn-Si cluster, which decomposes into clusters Mg-S-Ca-Mn-Al and Al-Mg-Ca-S-Mn-Si.
Further analysis of these databases by the k-means method (Appendix A) showed that both methods systematically give a similar result, and the compositions of the identified clusters are close. For clarity, the coordinates of the centroids were compared for all clusters of the four studied databases (Figure 2). It can be seen that the centroids of the clusters determined by the two methods are very similar.
Thus, the hierarchical method makes it possible to define the structure of the database and thus find natural clusters. The type of dendrograms for steels obtained using a similar technology is the same, and this can be used to compare them. Analysis by the k-means method requires additional procedures, for example, using the results of hierarchical clustering to determine the number of clusters. Therefore, further we used the method of hierarchical clustering, as completely suitable for independent use.

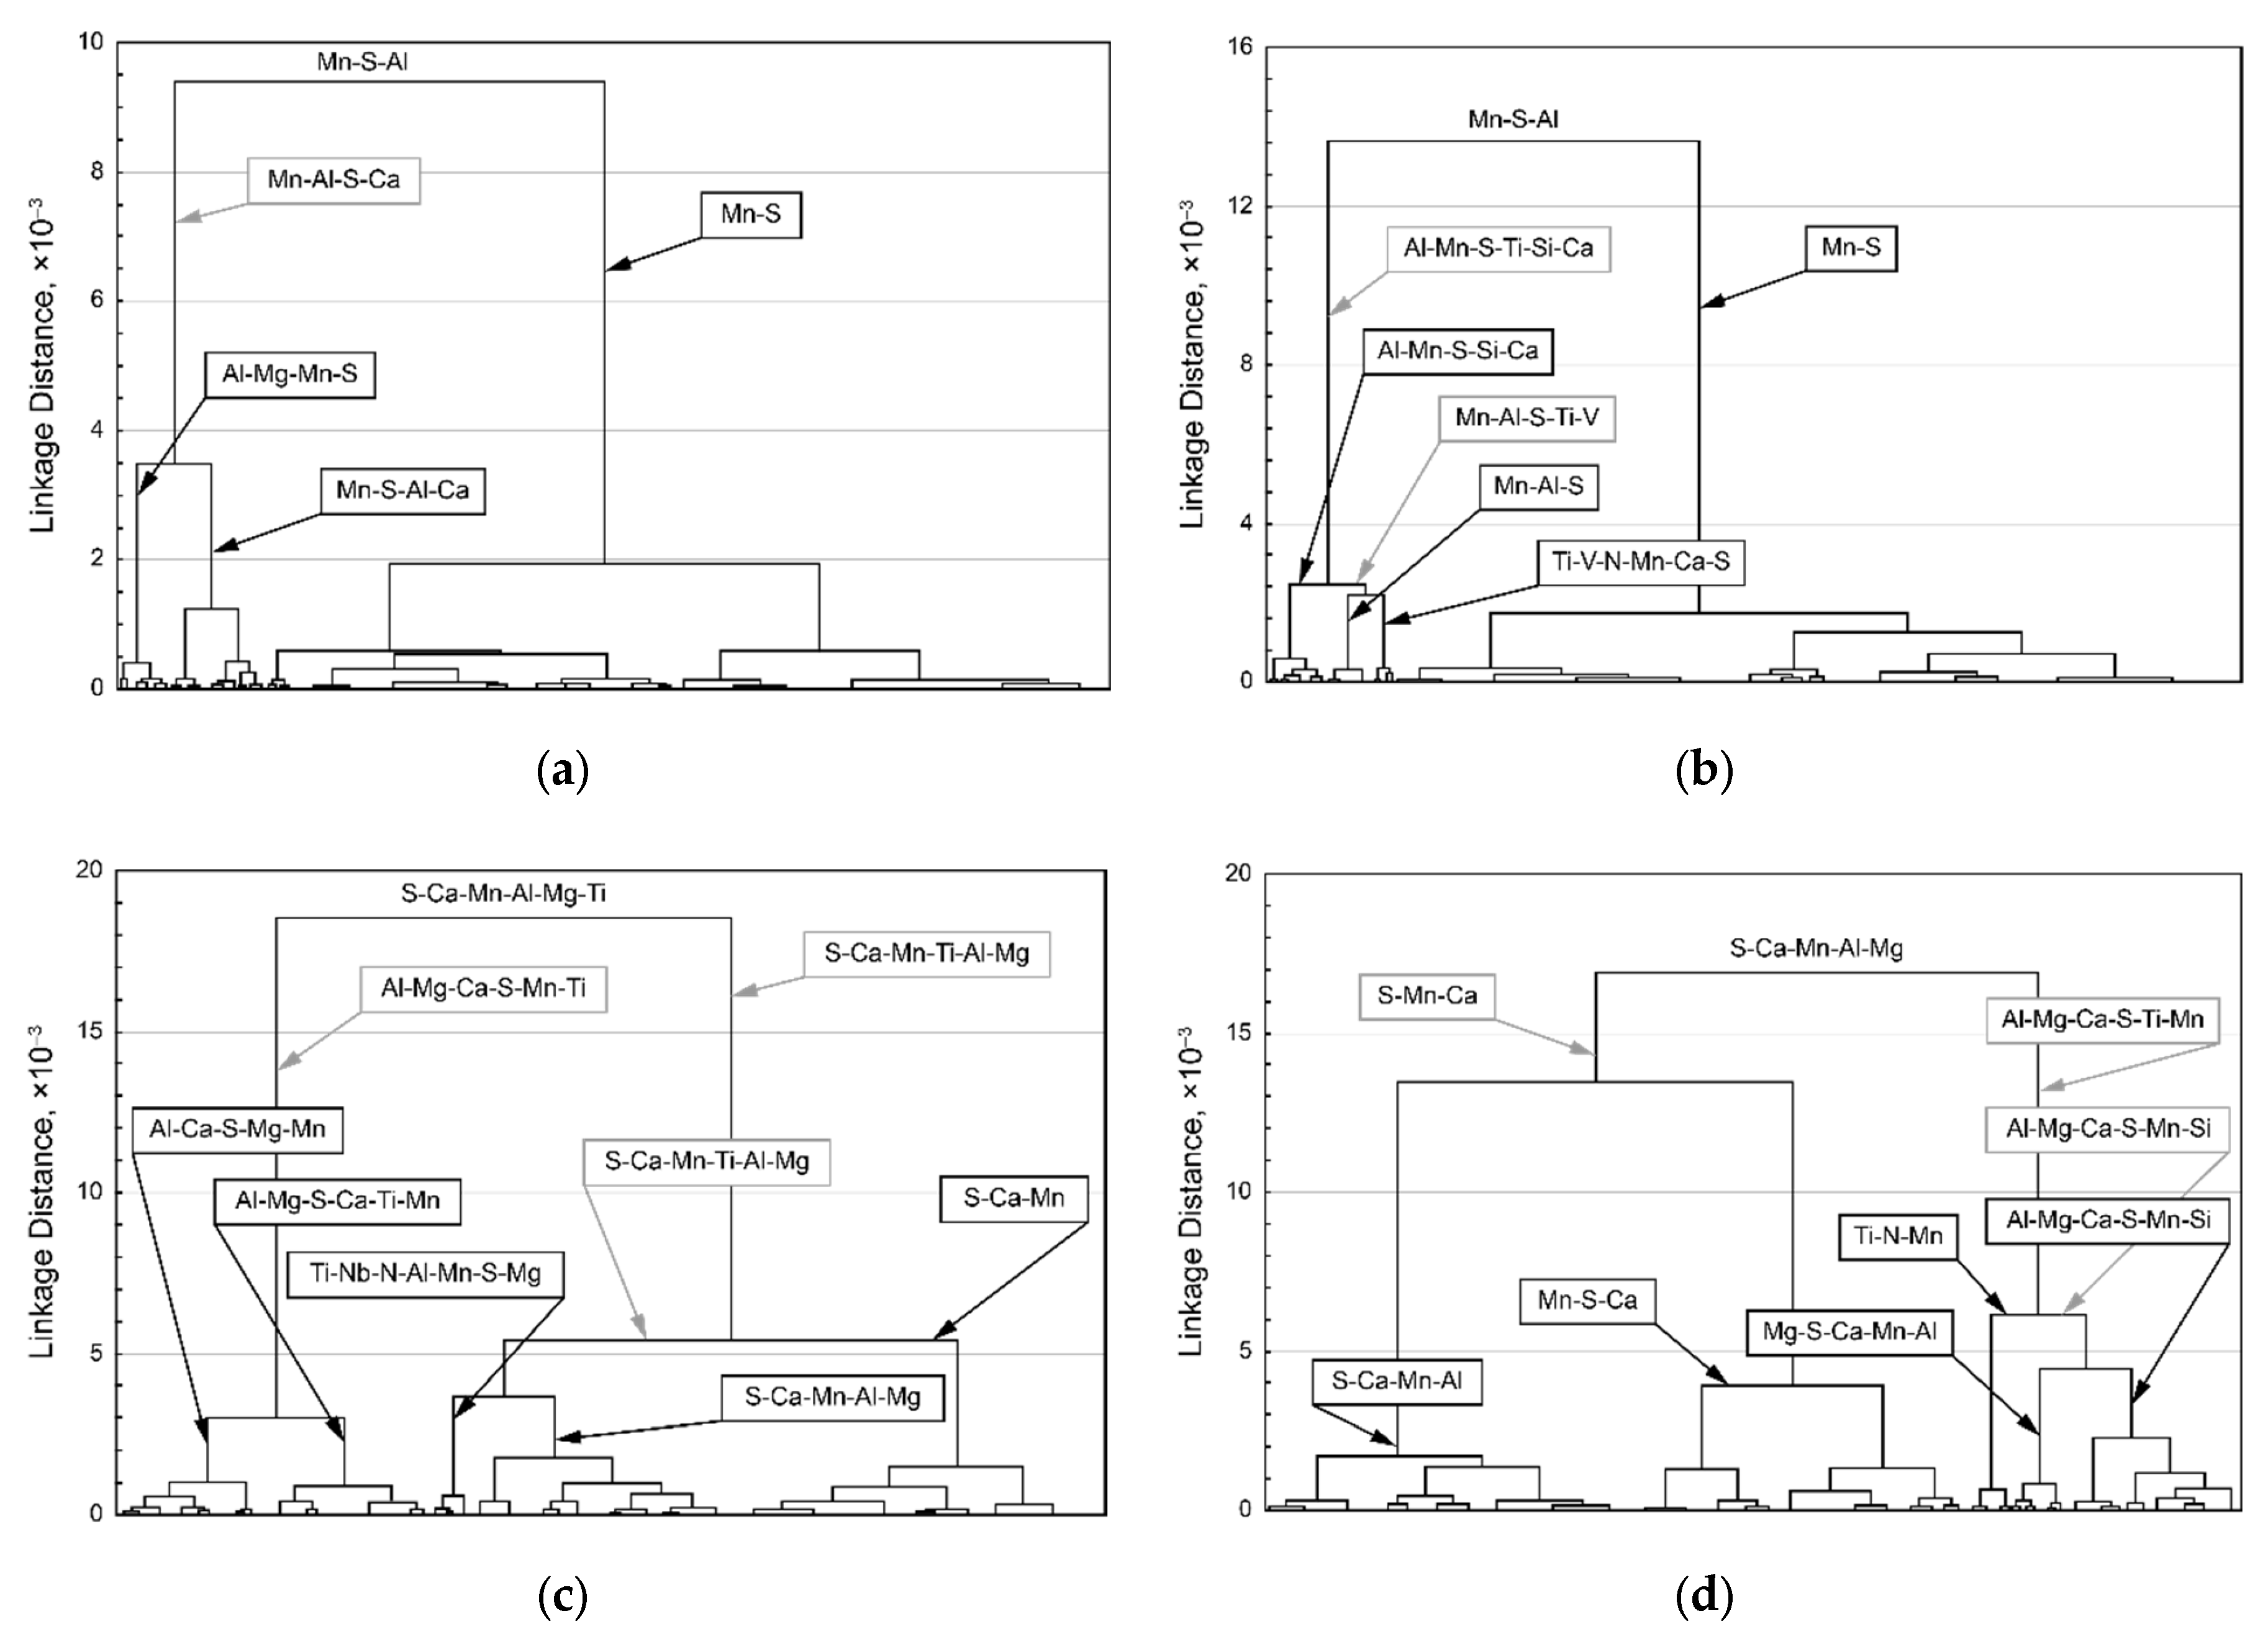
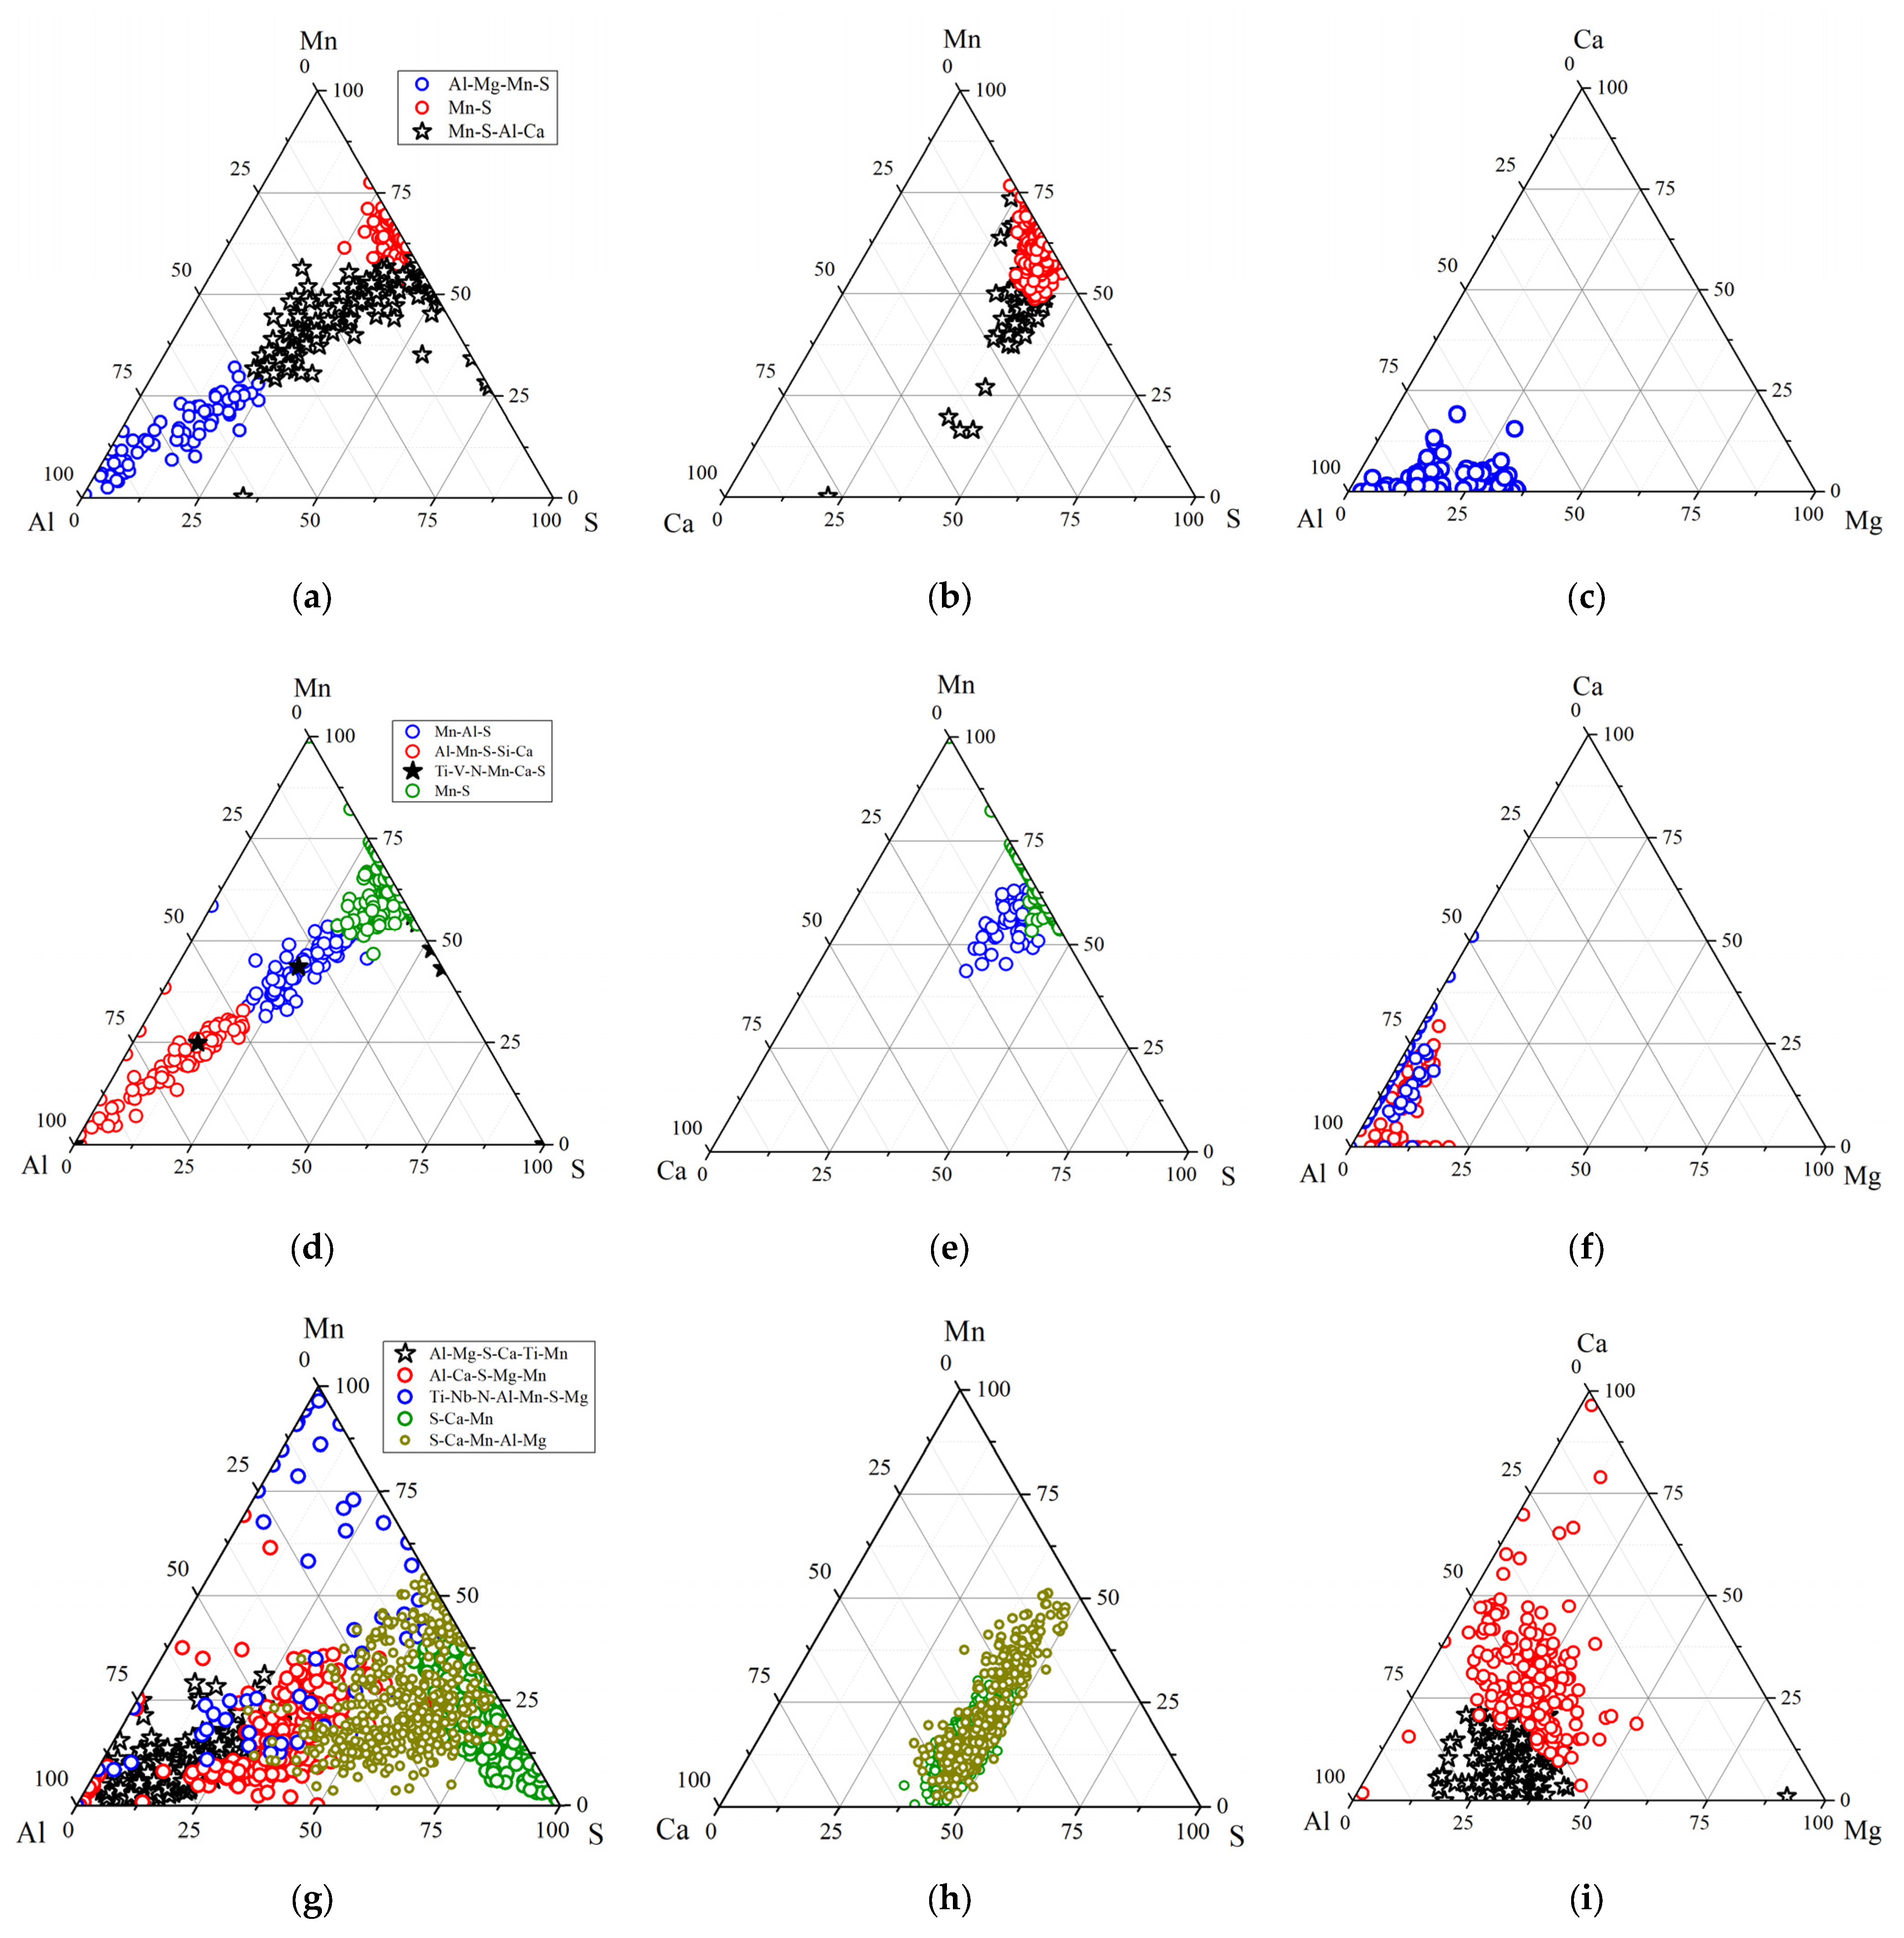
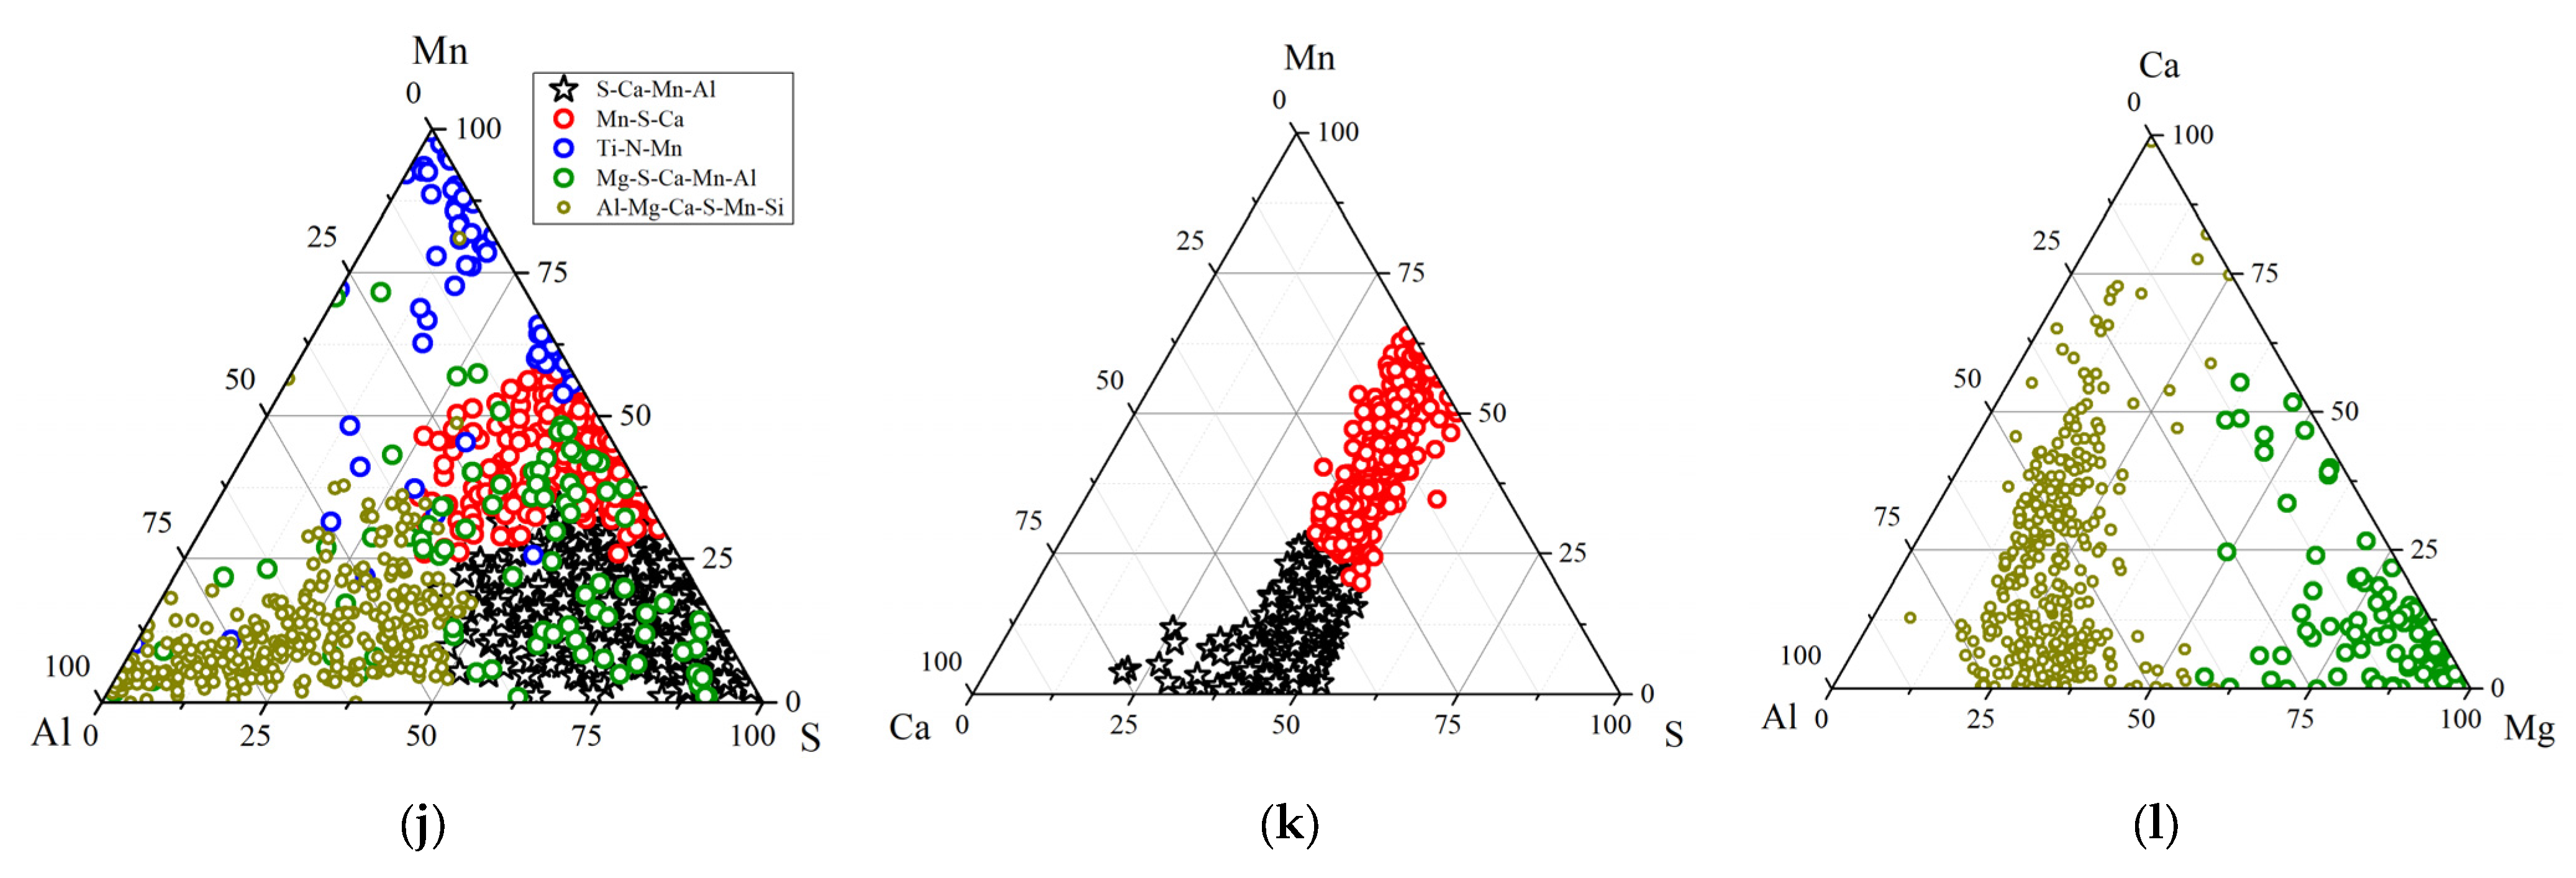
3.2. Study of NMIs Clusters in Different Steels

Let us further consider in detail the results of database clustering for the four studied steels. The results of clustering, as well as the results of recalculation of the compositions of cluster centroids into the phase composition by the method [8,14,15] are shown in Table 4. It was assumed that oxide-forming elements such as Al, Mg, Si form higher oxides in steel [28,29,30]. The calculation of sulfides was carried out taking into account the affinity of sulfide-forming elements for sulfur and oxygen [29]. So, if there is sulfur in the analysis, then the mass of calcium sulfide was determined, then the sulfur residue was converted into manganese sulfide. If there was an excess of calcium in the analysis, then it was converted into calcium oxide CaO. All nitride-forming elements, Ti, Nb, and V, were recalculated in TiN, NbN, and VN, respectively [31].
In ordinary steel 9MnSi5, the total volume fraction of non-metallic inclusions is 0.06%. The NMI themselves are represented by three types. The first type is inclusions with a high content of aluminum and magnesium oxides, containing a small amount of manganese and calcium sulfides, and their volume fraction is 0.0069%. The average area (Aaver) of these NMIs is 11 μm2, and their nature is associated with incomplete modification of deoxidation products—magnesium spinel and corundum [16,32]. The second cluster Mn-S-Al-Ca contains significantly more inclusions—0.0144%. When the liquid metal is cooled and solidified, manganese and calcium sulfides are formed on the corundum inclusions that have appeared earlier [33], forming a second cluster consisting of 45% manganese sulfides, 10% calcium and corundum sulfides with a small amount of magnesium spinel. At the end of solidification, there is an intense formation of manganese sulfides due to the segregation of sulfur; therefore, a third Mn-S cluster was found, consisting almost of pure manganese sulfide. Tertiary inclusions cannot be removed from the solidifying metal; therefore, this cluster makes the largest contribution to the overall high contamination of steel (V = 0.0388%).
In wheel steel B, which is also slightly modified long before casting, the contamination is high and amounts to 0.06%. The first cluster is based on aluminum (73%), silicon (11%), magnesium (3.5%) oxides, and a small amount of calcium and manganese sulfides, and this cluster has the lowest volume fraction, 0.0069%. The second cluster contains less aluminum oxide (39%) and much more manganese sulfides (43%), because it includes NMI formed not only in the liquid metal, but also during solidification. The high content of silicon oxides in clusters containing oxides is associated with the low concentration of aluminum in this steel [23]. The third cluster consists of practically pure tertiary manganese sulfides, the volume fraction of which reaches 0.042%. The last cluster is formed by tertiary titanium and vanadium carbonitrides of a liquation nature [34]. This steel has a higher content of carbon and sulfur, which reduce the activity of magnesium [35], making the steel melt less aggressively to the refractory lining of the ladle. Therefore, the oxide cluster contains significantly less magnesium oxides than steel 9MnSi5, and the inclusions themselves are represented not by magnesium spinel, but by almost pure corundum.
In optimally modified microalloyed steel X70, the total content of nonmetallic inclusions is much lower and amounts to 0.02%. This steel contains 4 oxysulfide clusters, Al-Mg-S-Ca-Mn (0.0026%), Al-Ca-S-Mg-Mn (0.0069%), S-Ca-Mn-Al-Mg-Ti (0.0039%), and S-Ca-Mn (0.0056%). Their nature is determined by the process of modification with calcium [12,13,14,15,16,17]. Initially, only corundum and magnesium spinel were present in liquid steel [12]. After the addition of calcium, modification began, and each cluster represents the products of this modification, and the higher the CaS content in the cluster, the more completely the inclusion is modified [12,34]. The last cluster of Ti-Nb-N-Al-Mn-Mg-Ca in this steel is dispersed titanium and niobium carbonitrides formed at the end of solidification. All clusters contain a certain amount of titanium and niobium nitrides, since this steel has high concentrations of carbonitride-forming elements.
In high-quality steel 30CrMnSi, the contamination with non-metallic inclusions is even lower, and amounts to 0.015%. The first cluster Al-Mg-Ca-S-Mn is a weakly modified magnesium spinel with a small amount of calcium and manganese sulfides. The volume fraction of this cluster is small and amounts to 0.0029%. Modified non-metallic inclusions with a large amount of calcium sulfide form an independent cluster S-Ca-Mn-Al, the volume fraction of which is higher and reaches 0.0043%. Tertiary inclusions of manganese sulfides, even at a low sulfur concentration, formed in solidifying steel due to liquation processes form an independent Mn-S-Ca cluster with a volume fraction of 0.0049%. Due to the titanium that is added to this steel, a Ti-N-Mn-S cluster was found containing titanium carbotitrides formed during solidification. This melt was carried out with a long downtime before casting. Because of this, there is practically no aluminum in this steel, which completely oxidized during the waiting time. Therefore, in this steel, the modification processes were most fully completed, since here as in wheel steel, an aluminum-free modification technology was implemented, which allows obtaining the largest amount of liquid non-metallic inclusions that are most efficiently removed from the ladle into the slag [23,27]. Therefore, this steel has the lowest NMI contamination. However, due to long-term interaction with the ladle lining, a big number of large single inclusions based on magnesium oxide were found in this steel, reaching an average area of 13.9 μm2 and forming an independent cluster Mg-S-Ca-Mn-Al with a volume fraction of 0.002%.
For clarity, the figurative points of the compositions of nonmetallic inclusions that make up the clusters on ternary diagrams in the coordinates of the elements of which these clusters are composed was placed. We looked at several diagrams for each database. First, the Al-Mn-S diagram, which is the starting point of the non-metallic inclusions before modification. Then, the Ca-S-Mn diagram, on which we will place only clusters with a large quantity of sulfides in order to evaluate the degree of their modification and the Al-Ca-Mg diagram to evaluate the efficiency of oxide modification (Figure 3).
In steels 9MnSi5 and B, equally not optimally modified with calcium, in the Al-Mn-S coordinates (Figure 3a,d), all NMIs line up along a line from the Al angle to a point on the Mn-S axis corresponding to pure manganese sulfide. This is a natural trajectory of movement of the figurative composition of the non-metallic inclusions from pure Al2O3, which forms in liquid steel deoxidized with aluminum in the absence of other strong deoxidizers, to pure manganese sulfide, which is formed during solidification [30]. In unmodified or weakly modified steels, deoxidized with aluminum, the NMI compositions will always be located exactly along this line. In the Ca-Mn-S coordinates (Figure 3b,e), the inclusions are located near the point corresponding to pure manganese sulfide, since there are no other sulfide-forming elements. Since steel 2 (B) was modified too early, it contains more manganese sulfides than steel 1, which also contains some calcium sulfides. In the Al-Mg-Ca coordinates (Figure 3c,f) in 9MnSi5 steel, inclusions are grouped in the region around the Al angle corresponding to pure corundum and the point corresponding to magnesian spinel. In steel B, which is practically free of magnesium spinel, the oxides are grouped around the corner Al.
In optimally modified steels X70 and 30CrMnSi in the Al-Mn-S coordinates (Figure 3g,j), NMIs are located in a triangle between the aluminum corner, the sulfur corner, as well as points on the Mn-S axis, corresponding to almost pure manganese sulfide. In steels treated with calcium with big consumption, in all clusters the number of Ca-S inclusions increases, and new clusters appear on their basis. Therefore, in the coordinates Al-Mn-S, a shift toward the angle S appears due to the appearance of other sulfide-forming elements except manganese. In the Ca-Mn-S coordinates (Figure 3h,k), for the same reason, inclusions are concentrated along the line from a point on the Mn-S axis, corresponding to pure manganese sulfide, to a point on the Ca-S axis, corresponding to calcium sulfide. It is along this line that the evolution of the composition of sulfides from MnS to CaS proceeds. The analysis of these diagrams shows that the modification of steel X70 (Figure 3h) was carried out more efficiently, since this steel does not contain pure manganese sulfides, in contrast to steel 30CrMnSi (Figure 3k). In the coordinates Al-Mg-Ca (Figure 3i,l), the oxide inclusions are located along the line from the calcium angle to the point corresponding to the spinel concentration. However, in steel 30CrMnSi, which had been waiting for casting for a long time, one of the clusters is displaced almost to the magnesium angle due to the large inclusion of refractory erosion products (Figure 3l).

4. Conclusions

Various methods of cluster analysis of databases of compositions and sizes of NMIs after automatic SEM analysis of particles were investigated. It is shown that clustering by the hierarchical method and the k-means method gives a similar result. However, with hierarchical clustering, the structure of the database is more clearly presented and natural clusters are identified, therefore this method is more promising for further use. On the basis of this method, statistically reliable assessment of the compositions, sizes, and quantities of all NMIs in steel and their types was developed.
The developed method of cluster analysis makes it possible to assess the content of different types of NMIs in the finished metal and to determine how a particular technological operation influenced the contamination with different types of NMIs. This method allows for a short period of time using standard metallographic samples to obtain information about NMIs and can be used in the analysis of samples taken from the ladle, and in the routine or unscheduled analysis of finished products. This method is universal and can be easily applied to cast and deformed steels of different compositions.
Using the developed technique in different steels, produced according to different technologies, NMIs were studied. It is shown that in non-optimally modified steels, clusters with non-metallic inclusions based on Al2O3 and Al2O3. MgO with a high content of manganese sulfides are presented. The total volume fraction of NMIs in these steels is at the level of 0.06%, and most of the inclusions are sulfides. In well-modified steels, the volume fraction of corundum and magnesium spinels is lower, while sulfides are mainly represented by CaS. In all steels, the volume fraction of calcium aluminates is low due to their removal from the ladle and transformation during solidification, therefore, one cannot find a separate cluster of calcium aluminates, because they are scattered over other clusters. Therefore, it is by the ratio of the amount of corundum and spinels and calcium sulfides that one can judge the degree of modification of the steel. In addition, the proposed method makes it possible to remove inclusions forming from the interaction of the refractory lining and the steel melt.
Each found cluster of NMIs is associated with a specific stage of ladle-treatment and casting. It is shown that they contain both common clusters associated with the similarity of deoxidation and modification schemes, and clusters that are unique for each sample, the type of which is determined by specific technological operations. The use of the developed method can help in the design of technology for obtaining clean steel with controlled modification of NMIs and obtain high-quality metal products and can become the basis for creating a modern classification of inclusions.

Author Contributions

Conceptualization, A.Z. and S.R.; methodology, A.Z., M.S. and A.S.; software, V.K.; review and editing, A.Z. All authors have read and agreed to the published version of the manuscript.

Funding

The research is partially funded by the Ministry of Science and Higher Education of the Russian Federation as part of World-class Research Center program: Advanced Digital Technologies (contract No. 075-15-2020-934 dated from 17 November 2020).

Conflicts of Interest

The authors declare no conflict of interest.

Appendix A

Table A1. Results of clustering by different methods in steel B.
ClusterElement, wt.%NMIs NumberAverage Area
AlCaMgMnNNbSSiTi + Vμm2
hierarchical clustering
Al-Mn-Si-S-Ca615.43.314 88 897.9
Mn-Al-S275140 24 774.9
Mn-S 63 35 13462.8
Ti-V-N-Mn-Ca-S 5 8.614 5 47 + 18325.7
k-means
Al-Mn-Si-S-Ca6553.512 6.58 747.8
Mn-Al-S-Ca-Si297136 2250.5925.0
Mn-S 63 3510.413472.8
Ti-V-N-Mn-S 1015 6 50 + 19315.7
Table A2. Results of clustering by different methods in steel X70.
ClusterElement, wt.%NMIs NumberAverage Area
AlCaMgMnNNbSSiTiμm2
hierarchical clustering
Al-Mg-S-Ca-Ti-Mn477250.01.3826.12834.9
Al-Ca-S-Mg-Mn31201490.00.81833.82238.1
S-Ca-Mn-Al-Mg12248150.01.93116.34235.1
Ti-Nb-N-Al-Mn-S-Mg84678.411.47247.2668.0
S-Ca-Mn2373130.014112.46125.1
k-means
Al-Mg-Ca-S-Ti4892250.01.0825.230912.2
Al-S-Ca-Mg-Mn-Ti262014100.01.42225.83145.9
S-Mn-Ca-Ti-Al6208220.02.33426.72554.1
Ti-Nb-N-Al-S-Mn-Mg64668.811.46249628.5
S-Ca-Mn4373120.00.94022.56675.6
Table A3. Results of clustering by different methods in steel 30CrMnSi.
ClusterElement, wt.%NMIs NumberAverage Area
μm2
AlCaMgMnNNbSSiTi
hierarchical clustering
Al-Mg-Ca-S-Mn-Si39161870.00.21351.33345.6
Mg-S-Ca-Mn-Al695980.00.214319113.9
S-Ca-Mn-Al5372110.00.54030.36154.5
Mn-S-Ca3133400.00.337215895.3
Ti-N-Mn211723.40.34160678.2
k-means
Al-Mg-S- Ca-Mn39131880.00.21451.43374.8
Mg-S-Ca-Mn-Al676470.00.212417814.7
S-Ca-Mn-Al5363130.00.53930.37214.9
Mn-S-Ca3114430.00.337114955.4
Ti-N-Mn1 1724.10.34161658.3

References

  1. Vinograd, M.I.; Gromova, G.P. Inclusions in Alloyed steels and Alloys; Metallurgiya: Moscow, Russia, 1972; p. 215. [Google Scholar]
  2. Kovačič, M.; Senčič, S. Critical inclusion size in spring steel and genetic programming RMZ. Mater. Geoenviron. 2010, 57, 17–23. [Google Scholar]
  3. Keskinkilic, E. Sulfide-type inclusion morphologies of a Ca-treated hot-rolled wheel steel. J. S. Afr. Inst. Min. Metall. 2011, 111, 417–422. [Google Scholar]
  4. Kazakov, A.; Kovalev, P.; Myasnikov, A.; Drobinin, A.; Zinchenko, S. Non-metallic inclusions and the nature of defects in cold-rolled sheet, Part 1. Defect of “Plena (Sliver)”. Ferr. Met. Vol. 2006, 2, 32–37. [Google Scholar]
  5. Hisser, H.; Tieknik, W.K. Solid inclusions in calcium treated aluminium-killed steel. Clean Steel 2007, 7, 45–51. [Google Scholar]
  6. ASTM E 1245-03. Standard Practice for Determining the Inclusion or Second-Phase Constituent Content of Metals by Automatic Image Analysis; ASTM: West Conshohocken, PA, USA, 2003; 8p. [Google Scholar]
  7. ASTM E 45-13. Standard Test Methods for Determining the Inclusion Content of Steel; ASTM: West Conshohocken, PA, USA, 2013; 19p. [Google Scholar]
  8. Kazakov, A.A.; Kovalev, P.V.; Ryaboshuk, S.V.; Mileikovsky, A.B.; Malakhov, N.V. Investigation of the thermal-temporary nature of non-metallic inclusions in order to improve the metallurgical quality of high-strength pipe steels. Ferr. Met. 2009, 12, 5–11. [Google Scholar]
  9. Tabakov, Y.I.; Grigorovich, K.V.; Rumyantsev, B.A. Application of the method of high-temperature extraction in a carrier gas for the quantitative determination of TiN in rail steel. Metally (Russ. J.) 2016, 6, 28–35. [Google Scholar]
  10. Janis, D.; Inoue, R.; Karasev, A.; Jönsson, P. Application of Different Extraction Methods for Investigation of Nonmetallic Inclusions and Clusters in Steels and Alloys. Adv. Mater. Sci. Eng. 2014, 2014, 210486. [Google Scholar] [CrossRef] [Green Version]
  11. Singh, V.; Lekakh, S.; Peaslee, K. Using Automated Inclusion Analysis for Casting Process improvements. In Proceedings of the Steel Founders’ Society of America 62, Annual Technical and Operating Conference, Chicago, IL, USA, 1 December 2008; pp. 1–7. [Google Scholar]
  12. Pretorious, E.B.; Oltmann, H.G.; Cash, T. The effective modification of magnesium spinel inclusions by Ca treatment in LCAK steel. Iron Steel Technol. 2010, 7, 31–44. [Google Scholar]
  13. Ren, Y.; Wang, Y.; Li, S.; Zhang, L.; Zuo, X.; Lekakh, S.N.; Peaslee, K. Detection of Non-metallic Inclusions in Steel Continuous Casting Billets. Metall. Mater. Trans. B 2014, 45B, 1291–1303. [Google Scholar] [CrossRef]
  14. Kazakov, A.A.; Zhitenev, A.; Ryaboshuk, S. Interpretation and Classification of Nonmetallic Inclusions. Mater. Perform. Charact. 2016, 5, 535–543. [Google Scholar]
  15. Kazakov, A.A.; Zhitenev, A.I. Assessment and interpretation of nonmetallic inclusions in steel. CIS Iron Steel Rev. 2018, 16, 33–38. [Google Scholar] [CrossRef]
  16. Yang, S.; Li, J.; Zhang, L.; Peaslee, K.; Wang, Z. Evolution of Mgo·Al2O3 Based Inclusions in Alloy Steel During the Refining Process. Metall. Min. Ind. 2010, 2, 87–92. [Google Scholar]
  17. Zhu, S. Low Cost Production of High Quality Clean Steel by the Implementation of Automated Inclusion Analysis Technology; FEI Company: Hillsboro, OR, USA, 2014. [Google Scholar]
  18. Verma, N.; Pistorius, P.C.; Fruehan, R.J.; Potter, M.; Lind, M.; Story, S. Transient Inclusion Evolution During Modification of Alumina Inclusions by Calcium in Liquid Steel: Part II. Results and Discussion. Metall. Mater. Trans. B 2011, 42, 711–719. [Google Scholar] [CrossRef]
  19. Schamber, F.H.; Van Beek, C.G. Understanding Particulate Contaminants via Automated Electron Beam Analysis; Aspex Corporation: Delmont, PA, USA, 2003. [Google Scholar]
  20. Lamb, D. Classification and Clustering; Mir: Moscow, Russia, 1980; 390p. [Google Scholar]
  21. Borovkov, A.A. Summary of Reports Presented at Sessions of the Seminar on Probability Theory and Mathematical Statistics at the Institute of Mathematics of the Siberian Section of the USSR Academy of Sciences, September–December 1984. Theor. Probab. Appl. 1987, 31, 160–165. [Google Scholar]
  22. Grigorovich, K.V.; Shibaeva, T.V.; Arsenkin, A.M. Effect of a pipesteel killing technology on the composition and number of nonmetallic inclusions. Russ. Metall. (Metally) 2011, 9, 929–933. [Google Scholar]
  23. Jain, A.K.; Murty, M.N.; Flynn, P.J. Data Clustering: A Review. ACM Comput. Surv. 1999, 31, 264–323. [Google Scholar] [CrossRef]
  24. Ward, J.H. Hierarchical grouping to optimize an objective function. J. Am. Stat. Assoc. 1963, 58, 236–244. [Google Scholar] [CrossRef]
  25. Zhambyu, M. Hierarchical Cluster Analysis and Correspondence; Finance and Statistics: Moscow, Russia, 1988; 345p. [Google Scholar]
  26. Khoroshilov, A.D.; Grigorovich, K.V. Thermodynamic features of the modification of non-metallic inclusions with calcium in low-carbon steels deoxidized with aluminum. Proceedings of higher educational institutions. Ferr. Metall. 2019, 62, 860–869. [Google Scholar]
  27. Knyupel, G. Deacidification and Vacuum Treatment of Steel. Per. with Him; Metallurgy: Moscow, Russia, 1984; 414p. [Google Scholar]
  28. Mchedlishvilli, V.A. Thermodynamics and Kinetics of Steel Deoxidation; Metallurgy: Moscow, Russia, 1978; 287p. [Google Scholar]
  29. Yavoiskii, V.I.; Rubenchik, Y.I.; Okenko, A.P. Nonmetallic inclusions and properties of steel. Mosc. Metall. 1980, 173, 169–172. [Google Scholar]
  30. Inoue, K.; Ishikawa, N.; Ohnuma, I.; Ohtani, H.; Ishida, K. Calculation of Phase Equilibria between Austenite and (Nb,Ti,V)(C,N) in Microalloyed Steels. ISIJ Int. 2001, 41, 175–182. [Google Scholar] [CrossRef] [Green Version]
  31. Kazakov, A.A.; Kovalev, P.V.; Ryaboshuk, S.V.; Zhironkin, M.V.; Krasnov, A.V. Management of the formation of non-metallic inclusions in the production of converter steel. Ferr. Met. 2014, C, 91–96. [Google Scholar]
  32. Imagumbai, M. Behaviors of Manganese-Sulfide in Aluminum-killed Steel Solidified Uni-directionally in Steady State Dendrite Structure and Inclusions. ISIJ Int. 1994, 34, 896–905. [Google Scholar] [CrossRef] [Green Version]
  33. Abraham, S.; Klein, R.; Bodnar, R.; Dremailova, O. Formation of Coarse Particles in Steel as Related to Ferroalloy Dissolution Thermodynamics Part II: Crystallographic Study of Ferroalloys and Coarse Particles. Mater. Sci. Technol.-Assoc. Iron Steel Technol. 2006, 2, 109. [Google Scholar]
  34. Buzek, Z. Zakladni termodynamicke udaje o metalurgických reakciah. Z. Buzek 1979, 20, 5–111. [Google Scholar]
  35. Guozhu, Y.E.; Jonnsson, P.; Lund, T. Thermodynamics and Kinetics of the Modification of Al2O3. ISIJ Int. 1996, 36, S105–S108. [Google Scholar]
Figure 1. Dendrograms of clusters of NMIs compositions in the studied steels. (a) 9MnSi5; (b) B; (c) X70; (d) 30CrMnSi.
Metals 11 01650 g001
Figure 2. Comparison of hierarchical clustering and k-means.
Metals 11 01650 g002
Figure 3. Chemical compositions of nonmetallic inclusions in the studied steels, presented on ternary diagrams in the coordinates of the elements most often found in NMi: (ac) 9MnSi5, (df) B; (gi) X70; (jl) 30CrMnSi.
Metals 11 01650 g003aMetals 11 01650 g003b
Table 1. Chemical composition of the studied steels.
No.SteelElement. wt.%
CSiMnSCrAlTiNbVCa
wt.%ppm
19MnSi50.070.51.30.0100.10.019-0.01-16
2B0.70.40.90.019-0.0040.01-0.045
3X700.090.21.50.002-0.0390.020.06-21
430CrMnSi0.300.90.80.0040.80.005-0.01-17
Table 2. Average chemical composition, the number of inclusions in the databases after AFA.
No.SteelElements
(C > 5%)
Concentration of Elements in NMI, without O (wt.%)NMIs NumberAaverANMIsAVtot
μm2mm2%
19MnSi5Mn-S-Al55-34-514664.80.007011.160.06
2BMn-S-Al58-32-515443.20.00498.280.06
3X70S-Ca-Al-Mn-Mg-Ti28-25-16-11-10-616076.80.011054.100.02
430CrMnSiS-Ca-Mn-Al-Mg31-22-20-11-916965.60.009562.350.015
Table 3. Results of cluster analysis of the database in sample 1, steel 9MnSi5.
ClusterElement, wt.%NAverage Area, μm2
AlCaMgMnNNbSSiTi
hierarchical clustering
Al-Mg-Mn-S57.3215130.000.2921.57310.98
Mn-S-Al-Ca16.284400.000.23010.414911.27
Mn-S0.320.359.50.000.3361.40.212443.63
k-means
Al-Mg-Mn-S57.3315120.000.2921.5748.09
Mn-S-Al-Ca-Mg2465.2370.000.22610.6937.84
Mn-S0.42.50.4590.000.3361.20.212993.81
Table 4. Results of cluster analysis in the studied steels.
ClusterChemical CompositionAaver, μm2Mass Fraction of Oxide or Sulfide in NMIs, wt.%ViVtot
Al2O3MgOSiO2MnSCaSMe * N%
9MnSi5
Al-Mg-Mn-S57-15-13-91166152.712.52.41.20.00690.06
Mn-S-Al-Ca40-30-16-811.321.64.61.445.310.4 0.0144
Mn-S59-363.60.40.5 954 0.0388
B
Al-Mn-Si-S-Ca61-14-8-8-57.9733.51176 0.00260.06
Mn-Al-S40-27-244.93916.6436 0.0069
Mn-S63-352.80.8 98.5 0.50.0418
Ti-V-N-Mn-Ca-S47-18-14-9-6-55.71 38890.0039
X70
Al-Mg-S-Ca-Mn47-23-8-7-54.95524.12.25.07.65.90.00260.02
Al-Ca-S-Mg-Mn31-20-18-14-98.043.317.344274.40.0069
S-Ca-Mn-Al-Mg-Ti31-24-15-12-8-65.117.6112.525.934.68.40.0039
S-Ca-Mn41-37-135.13.94.22.67107540.0056
Ti-Nb-N-Al-Mn-Mg-Ca42-11-8-8-7-6-5811.98.237.76.1630.001
30CrMnSi
Al-Mg-Ca-S-Mn39-18-16-14-75.650.119.98.11.819.11.10.00290.015
S-Ca-Mn-Al40-37-11-54.58.63.54.82458.8 0.0043
Mn-S-Ca40-37-135.35.74.82.96520.61.10.0049
Ti-N-Mn-S60-23-7-58.23.21.91.611.11.1810.0009
Mg-S-Ca-Mn-Al59-14-9-8-613.97.764.64.811.710.40.80.002
* Ti, Nb, V.
Publisher’s Note: MDPI stays neutral with regard to jurisdictional claims in published maps and institutional affiliations.

